research on carbon sinks in bamboo forest management
TRANSCRIPT

Research on Carbon Sinks inBamboo Forest Management
Prof. Guomo Zhou
Workshop on Harnessing the Potentials of Bamboo for Carbon Trading, Landscape Restoration and Job Creation, Yaoundé Cameroon,11-12 August 2016
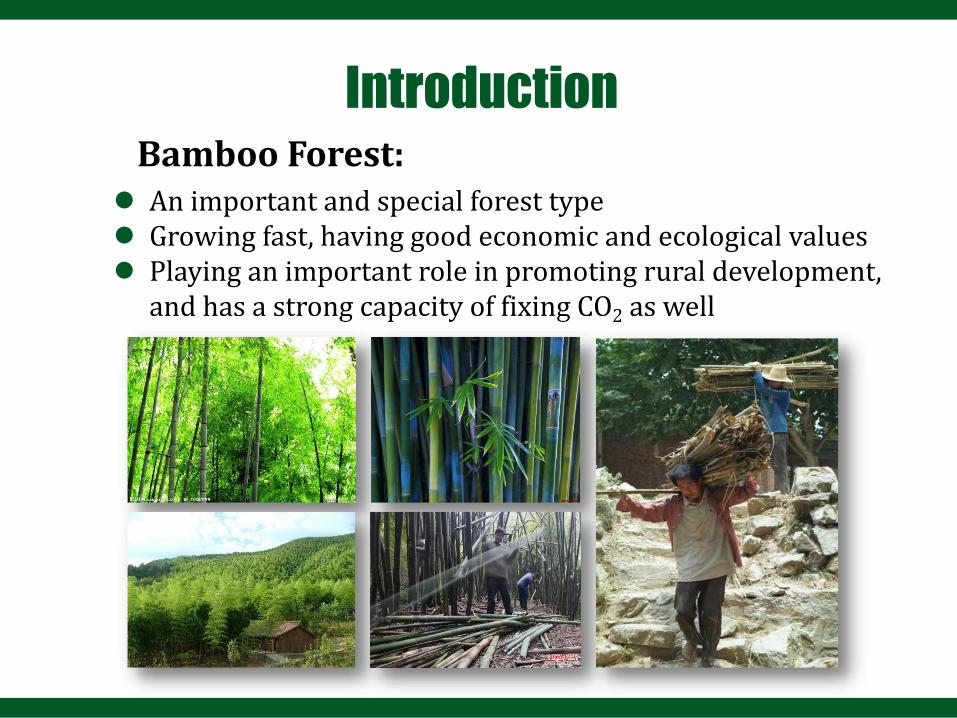
Bamboo Forest: Introduction
l An important and special forest typel Growing fast, having good economic and ecological valuesl Playing an important role in promoting rural development,
and has a strong capacity of fixing CO2 as well

l Since 2001, studies on bamboo forest carbon sequestration have been continually carried out by our research group.
The scenery of bamboo forest – bamboo sea (Anji county , Zhejiang province, China)

Main Contents
1 Bamboo forest resources distribution and utilization
2 Bamboo carbon dynamic and sequestration characteristics
3 Some techniques and methodology for Carbon sequestration of bamboo forest
4 Next step for research

1 Bamboo forest resources distribution and utilization

l 150 genus and more than 1,200 species worldwide , bamboo forests cover 20 million ha, accounting for 1% of total forest area in the world, called “the second largest forest resource” in the world.
l Three main bamboo forest areas :Asia-Pacific region, South America and Africa
1.1 Distribution of bamboo forest

Distribution of Bamboo forest in China
l In China: 34 genus, 534 species (40% of total bamboo species)
l Bamboo forest area: 6.01 million ha (30% of total bamboo forest in worldwide), including 4.32 million ha of Moso bamboo forest.
l Four main bamboo forest regions, including 15 provinces such as Zhejiang, Fujian, Sichuan etc.

l Bamboo is being widely used for: plywood, flooring, furniture, fibre ,arts and crafts, charcoal etc.
l More than 2,000 bamboo products were produced in China, total output value of bamboo industry: 167 billion in 2013
1. 2 Comprehensive Usage of bamboo products
Wood-bamboo laminated lumber Bamboo flooring veneer-faced decorative board
Bamboo Kitchen furniture Bamboo House Bamboo desk

Bamboo fibre
Bamboo craft
Bamboo charcoal

Bamboo indoor flooring
Bamboo fire-proof material
Bamboo outdoor material
Bamboo furniture Wind turbine blades made of bamboo
Bamboo indoor decorative material

Nike Sport Court - Bamboo sport flooringOffice Furniture of Microsoft (Shanghai)
Theatre decorated with bamboo( Wuxi, Jiangsu)

Bamboo Dashboard in X5, X6 Series of BMW Vehicles
Madrid Airport Decorated with Bamboo Material

l Since 1990, the bamboo forest has increased about 0.13 million ha every year in China ; in 2010, the output of bamboo wood increased 6 times more than that in 1990.
1.3 Rapid increase of bamboo wood
Output of Bamboo wood from 1950 to 2010
Output of timber from 1950 to 2010

2 Bamboo carbon dynamic and sequestration characteristics

l Our studies focus on:ü carbon accumulation characteristics/
ü carbon spatial distribution/
ü carbon forms/
ü carbon transfer of bamboo forest/
ü carbon sequestration capability/
l Botanically, bamboo is a grass, and not a treel bamboo grows comparably faster → one of the
fastest growing/most renewable forest resources/plants in the world
l bamboo: up to 13 m high, growth up to 0.3 meter/day and reaches final height/ within 2 months
n Different characteristics than trees
2.1 Carbon accumulation during growth process of moso bamboo

l Video 1 : Bamboo grows

l Video 2 : Bamboo forest grows

l New-shoot bamboo has a strong capability of carbon storage, the carbon fixed in the first 6 months accounts for 88.8% of total carbon that fixed in the first year.
Bamboo growth height curve Carbon accumulation curve
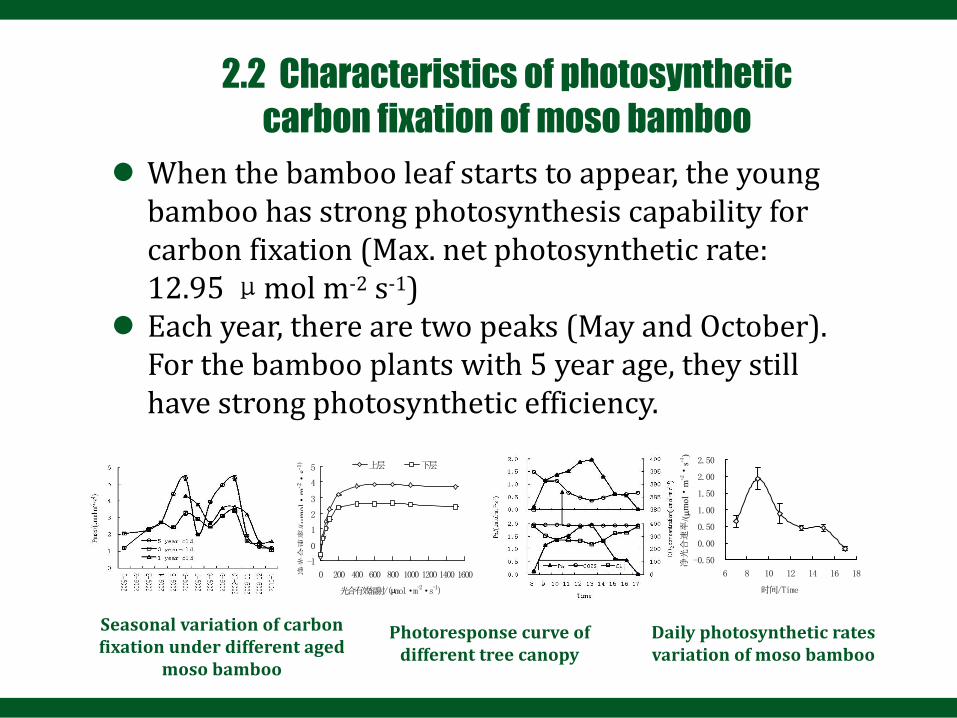
l When the bamboo leaf starts to appear, the young bamboo has strong photosynthesis capability for carbon fixation (Max. net photosynthetic rate: 12.95 μmol m-2 s-1)
l Each year, there are two peaks (May and October). For the bamboo plants with 5 year age, they still have strong photosynthetic efficiency.
2.2 Characteristics of photosynthetic carbon fixation of moso bamboo
-1
0
1
2
3
4
5
0 200 400 600 800 1000 1200 1400 1600
上层 下层
净光
合速
率/( μ
mol·
m-2·
s-1)
光合有效辐射/(μmol·m-2·s-1)
图6 林冠上下两个层次的光响应曲线
Fig. 6 Responses of photosynthesis to PAR onthe upper layer and the bottom layer
-0.50
0.00
0.50
1.00
1.50
2.00
2.50
6 8 10 12 14 16 18
时间/Time
净光
合速
率/( μ
mol·
m-2·
s-1)
图3 毛竹净光合速率日变化
Fig.3 Diurnal variation of net photosyntheticrate(Pn) of Phllostachy pubescens
Fig.4 Diurnal variation of stomatal conductance(Gs) andintercellular CO2 concentration(Ci)Seasonal variation of carbon
fixation under different aged moso bamboo
Photoresponse curve of different tree canopy
Daily photosynthetic rates variation of moso bamboo

l Four carbon forms were found in bamboo tissues: alkyl carbon, O-alkyl carbon, aromatic carbon, and carboxyl carbon
l The ratios of carbon forms were relatively stable with the carbon accumulation in young bamboo.
2.3 Carbon forms in the tissue of young bamboo (Using Nuclear Magnetic Resonance(NMR) technique)
4-22
5-2
5-10
O-alkyl C Alkyl CCarboxyl C
Aromatic C4-13
NMR spectra of carbon functional groups in bamboo tissue during four
different growth periods

l The carbon storage of moso bamboo forest ecosystem is 106.362 t hm-2: vegetation layer 32.18%, soil layer 67.20%, litter layer 0.62%.
l For a single moso bamboo tree, culm: 50.97%, leaf only: 4.87% of total carbon storage.
l Underground carbon accounts for 37.62% .
2.4 Carbon storage and distribution in bamboo forest ecosystem
Carbon storage in moso bamboo forest ecosystem
Carbon storage for a singal moso bamboo organs

l There are 4.32 million ha of Moso bamboo forest in China. The carbon storage in vegetation layer accounts for about 153 Tg C (unit:1Tg=10^9g).
l The carbon storages of the ten main bamboo species in China range from 86.30 to 181.81 t hm-2.
2.4 Carbon storage and distribution in bamboo forest ecosystem
The carbon storages of ten main bamboo species

l Comparing to convention management, the total organic carbon (TOC), microbial biomass carbon (MBC), water soluble carbon (WSOC) and mineralizable carbon (MC) in soil significantly (P<0.05) decrease after 5-year intensive management.
l The TOC in soil decreases by 34.70%, and the MBC carbon decreases by 49.35%.
2.5 Soil carbon content of bamboo forest under intensive management
Year TOC(g/kg) WSOC(mg/kg) MBC(mg/kg) MC(mg/kg)
0 25.9 a 65.2 a 490.9 a 24.5 a
5 22.8 b 41.7 b 387.2 b 13.5 b10 18.3 c 39.9 b 364.4 b 11.1 b15 16.1 d 38.4 b 330.5 bc 10.3 b
20 16.5 d 39.5 b 308.9 c 11.3 b30 16.9 d 40.1 b 289.4 c 10.5 b
Variation of soil carbon pool of different carbon forms under intensive management

l Fertilizer application could decrease (TOC )content in bamboo forest, and significantly increase soil greenhouse gases emission(CO2 and N2O).
l Mulch led to TOC content increase in lei bamboo forest, but meanwhile , it enhance soil respiratory rate.
2.6 The affects of fertilizer and mulch on greenhouse gas emission of bamboo forest
TOC and respiration of lei bamboo forest under mulch
Fertilizer application affect on TOC and CO2 emission
0
300
600
900
1200
1500
CO
2通量
CO
2 eff
lux
(mg
m-2
h-1
)
2008-06-28a a
b bbc
c
0 1 2 3 4 5 60
50
100
150
200
250
300
处理号Number of treatments
2008-11-28
e
ba
bc cdd

l Rhizome system → allows simultaneous biomass extraction (harvesting old bamboo) & carbon storage (growing new bamboo shoot)
l Ecosystem survives hundreds, but individual culms die after around 13 years
2.7 Carbon transfer of bamboo forest
Bamboo forest ecosystem Rhizome system

l The single bamboo grows in 6 year and was allowed to mature, and then be cut off .
l Bamboo forest is a uneven-aged forest. The harvest is taken every two years.
l In this way, carbon transfers form bamboo forest to bamboo board , to products.
Bamboo forestHarvested
bamboo timberBamboo semifinished
productBamboo
board

l Carbon transfer ration from bamboo stand to bamboo board:ü Traditional technique: 35.0—39.7%, with an average of 37.0%.ü Bamboo flatten technique: 61.2—73.5%, with an average of
67.6%l Carbon storage of bamboo products was estimated
about ten million ton every year in China , as the output of bamboo wood is 1,4 billion culm.
l Carbon storage in bamboo products can be kept for a long time.
Bamboo utilization process
30 35 40 45 50 55 600
0.02
0.04
0.06
0.08
0.1
0.12
0.14
0.16
0.18
碳 转 移 率 /%
概率
胸 径 7.5-8.5cm胸 径 8.5-9.5cm胸 径 9.5-10.5cm胸 径 10.5-11.5cm胸 径 11.5-12.5cm
Bamboo utilization process
Carbon transfer ration of different glued laminated bamboo
Carbon transfer ration of different DBH bamboo to reconstituted bamboo

l Bamboo containing abundant phytolith. Phytolith-occluded carbon (PhytOC) plays an important role in soil carbon sequestration, as it can be kept in soil for a long time (thousands years).
l PhytOC is mainly kept in leaves (approx. 60%). The average PhytOC storage in bamboo forest soil is 1 .56 t·hm-2 .
l Phytolith-occluded carbon accounts for about 30% from bamboo forest in China.
2.8 Phytolith-occluded carbon in bamboo forest
Annual carbon sequestration rate of China's bamboo forests and world's bamboo
Organic carbon in phytolith Formation and Accumulation mechanism of PhytOC

l The PhytOC accumulation rates of moso and lei bamboo forest soils were 0.06 t C ha-1 yr-1 and 0.079 t C ha-1 yr-1 , respectively, which were higher than the average accumulation rate of timber forest soils(0.024 t C ha-1 yr-1 ), indicating that PhytOC is the main way to sequester carbon in bamboo forest soils.
l The mulch can significantly improve PhytOC accumulation rate in soil. After 20 years, the PhytOC in soil increased by 1.58 t C ha-1.
PhytOC accumulation in the organ of moso bamboo
PhytOC in lei bamboo soil in different mulch history
Research results published in “Scientific Reports”:l Management can increase soil PhytOC storagel Provide new theoretical basis for bamboo forest soil carbon sequestration

l Two carbon-water flux observation towers in bamboo forest were built for continually carbon dynamic monitoring from 2010.1--2013.9.
l Based on eddy covariance technology, we analyzed the dynamic variation of carbon source and sink, and net carbon sequestration in Moso bamboo and Lei bamboo.
2.9 Carbon-water flux observation and Eddy covariance technology
Flux tower for Lei bamboo in Lin’an county
Flux tower for Moso bamboo in Anji county
Equipment on the flux tower

l Moso bamboo forest had a strong carbon sink capability based on a two-years study. the NEE peak values were found in March and July, the fixed net amount of CO2 was about 24.309 t hm-2yr-1.
l For Lei bamboo forest, net carbon emission was observed from December to February. The NEE peak values were in May and November. The fixed net amount of CO2 was 4.631 t hm-2yr-1 .
The monthly variation of GEE, RE, NEE in Lei bamboo forest, from
2010.10 to 2012.9
The monthly variation of GEE, RE, NEE in moso bamboo forest, from
2010.12 to 2012.6

l Base on the carbon-water flux observation , the fixed net amount of CO2 of moso bamboo forest in China is about 97 Tg CO2-e .
l The comparison of carbon sequestration capability between bamboo forest and other subtropical forest types is as follow( see table)。It shows the fixed net amount of CO2 of bamboo forest is larger than that of broad-leaf forest, as well as that of Chinese fir plantation.
Location Climate type Forest type Period t CO2 hm-2yr-1
Dinghushan,Guangdong south subtropical masson pine 2003-2005 6.23
Dinghushan,Guangdong south subtropical Theropencedry-mion 2003-2005 9.94
Changbai Mountain, Jilin north temperate Theropencedry-mion 2003-2005 6.49
Qianyanzhou, Jiangxi middle subtropical Theropencedry-mion 2003-2005 18.37
Yueyang, Hunan middle subtropical artificial poplar 2006 21.23
Huitong, Hunan middle subtropical Chinese fir 2008 11.48
Anji, Zhejiang subtropical Mso bamboo 2011 24.309
The fixed net amount of CO2 in different forest types in subtropical zone

Stand type
Age of Stand/year
Carbon storage in arbor layer
(t·hm-2)
Annual carbon storage in arbor
layer (t·hm-2)
Total carbon storage (t·hm-2)
Annual carbon storage(t·hm-2)
Moso bamboo 6 31.6 5.09 120.3 20.0
Chinese fir 10 35.1 3.51 118.9 11.9
Masson pine 14 38.1 2.72 203.0 8.59
l Based on the plot survey: the annual Carbon storage in arbor layer: moso bamboo is 1.45 and 1.87 times that of Chinese fir and Masson pine, respectively. (see table)
l Carbon storage capability of sympodial bamboo is equivalent to fast-growing Eucalyptus.(see fig.)
2.10 Comparison of carbon sequestration capability between bamboo forest and other forest types
Annual carbon storage variation of cluster hemp bamboo and fast-growing eucalyptus
Total carbon storage of sympodial bamboo and fast-growing eucalyptus in ten years

l After 10 years, the carbon storage in Moso bamboo forest will be very stable, and obviously lower than that in Chinese fir forest (Fig. 1).
l The annual net carbon storage of moso bamboo and Chinese fir stands were showed( Fig. 2)
l The total carbon accumulation of Moso bamboo forest is 1.34 times that of Chinese fir forest through harvest (Fig. 3).
2.11 Managed bamboo forest carbon sequestration
Fig. 1 Carbon storage of the existing moso bamboo and Chinese fir stands
from the first year to the 60th year
Fig 2. The annual net carbon storage of moso bamboo and Chinese fir stands from the
first year to the 60th year
Fig. 3 The carbon accumulation amount of moso bamboo and Chinese fir from the first year
to the 60th year
3 Some techniques and methodology for Carbon sequestration of bamboo forest

l Our studies focus on:ü carbon storage measuring techniques/
ü Management techniques to improve carbon
sequestration capability/
ü methodology for carbon accounting and monitoring /
ü Demonstration and promotion

l Under different fertilizer application, the net carbon sequestration capability in moso bamboo forests were significant different, ranging from 9.42 to 11.84 t CO2 hm-2 a-1.
l Through reasonable fertilizer application, the net carbon sequestration could increase by 27.6%;
l Reasonable fertilizer application:265kg ha-1,proportion: N:P:K=47:15:38).(Nitrogen: Phosphor: Kalium)
3.1 Nutrients control techniques for improving bamboo carbon sequestration capability
Levels
Factors
N- Akg hm-1
P -Bkg hm-1
K- Ckg hm-1
1 62.5 (A1) 20 (B1) 25 (C1)
2 125 (A2) 40 (B2) 50 (C2)
3 250 (A3) 80 (B3) 100 (C3)
Comparation of net carbon sequestration Under different fertilizer application
Testing program

l During bamboo shoot and young bamboo growing periods ( the first 4 to 6 months), abundant water for bamboo growth (3 times more than the normal requirement) is needed
l To move the winter-mulch of Lei bamboo forest at early March can decrease the CO2 emission by 62%.
3.2 Management techniques to improve carbon sequestration capability of bamboo forest
水平
因素
施氮量Akg hm-1
施磷量Bkg hm-1
施钾量Ckg hm-1
1 62.5 (A1) 20 (B1) 25 (C1)
2 125 (A2) 40 (B2) 50 (C2)
3 250 (A3) 80 (B3) 100 (C3)
Orthogonal experimental design of fertilizer application of bamboo forest
Soil respiratory rate under different exposure time

l The optimal stand structure of bamboo forest :Density: 4362 culm /ha, Average diameter: 12.2cm,Even proportion of different bamboo ages, Biomass carbons will be: 42.48 t/ha.
3.3 Optimized model of bamboo forest structure for improving carbon sequestration function
The trend figure for structure optimized model and carbon storage of moso bamboo stand
65)(max 44332211cc
gTotal NDxcxcxcxcM
Spatial structure index and carbon storage per unit

l Based on 395 moso bamboo plots and 76,630 moso bamboo trees, biomass model for single moso bamboo and binary Weibull distribution model were established.
l Using this two models, the carbon storage of aboveground moso bamboo biomass at different scales can be accurately estimated
3.4 Estimated model for measurement of carbon storage of bamboo forest
Biomass calculation model for single moso bamboo :
R2=0.937
Weibull distribution model image
R2=0.990

Biomass calculation model for single moso bamboo tree,
Binary weibull distribution model
Total carbon storage of moso bamboo forest : 10.35 Tg
Minimum dimension conversion method+
Probablity values of DBH and ages of moso bamboo
DBH
Age
1 2 3 4 ≥
Prob. Prob. Prob. Prob.
5 0.04382 0.03236 0.01510 0.00610
6 0.04890 0.04414 0.01931 0.00646
7 0.06715 0.06197 0.02710 0.00907
8 0.07502 0.07018 0.03071 0.01027
9 0.06843 0.06422 0.02808 0.00941
10 0.05043 0.04686 0.02050 0.00686
11 0.02954 0.02668 0.01167 0.00390
12 0.01344 0.01155 0.00505 0.00169
13 0.00463 0.00369 0.00162 0.00054
14 0.00117 0.00084 0.00037 0.00012
15 0.00021 0.00014 0.00005 0.00003
Total carbon storage of moso bamboo at different DHB and ages
DBHAge
1 2 3 4 ≥
5 23534.9215 17745.0930 8340.6315 3383.6829
6 30848.1238 28671.0887 12670.6101 4263.8421
7 50819.6837 48676.3216 21561.7349 7270.1964
8 68947.2686 67413.3199 29950.5336 10104.1918
9 76745.8954 75719.8808 33680.2951 11398.6204
10 68989.8370 67716.9532 30183.4444 10209.6657
11 49104.8783 47027.9138 20984.7382 7093.7674
12 26987.6844 24667.6354 11013.6562 3730.3640
13 11152.2359 9476.3269 4251.7504 1435.0435
14 3355.3908 2573.4447 1159.1743 380.8035
15 711.6791 507.6330 185.4914 112.7646
( Zhejiang province, 2009)

l Remote sensing information for moso bamboo were constructed using multi-resource remote images.
l Based on the nonparametric and nonlinear models, the remote sensing estimation of carbon storage for bamboo forest were obtained.
3.5 Remote sensing technique to estimate carbon storage in bamboo forest
Study area of moso bamboo forest in Anji Study area of Lei bamboo in
Lin’an

Remote InformationField data
GPSSpatial registration
Model Development

Spatial-temporal variation of carbon storage of moso bamboo forest in Anji County(1986~2008)
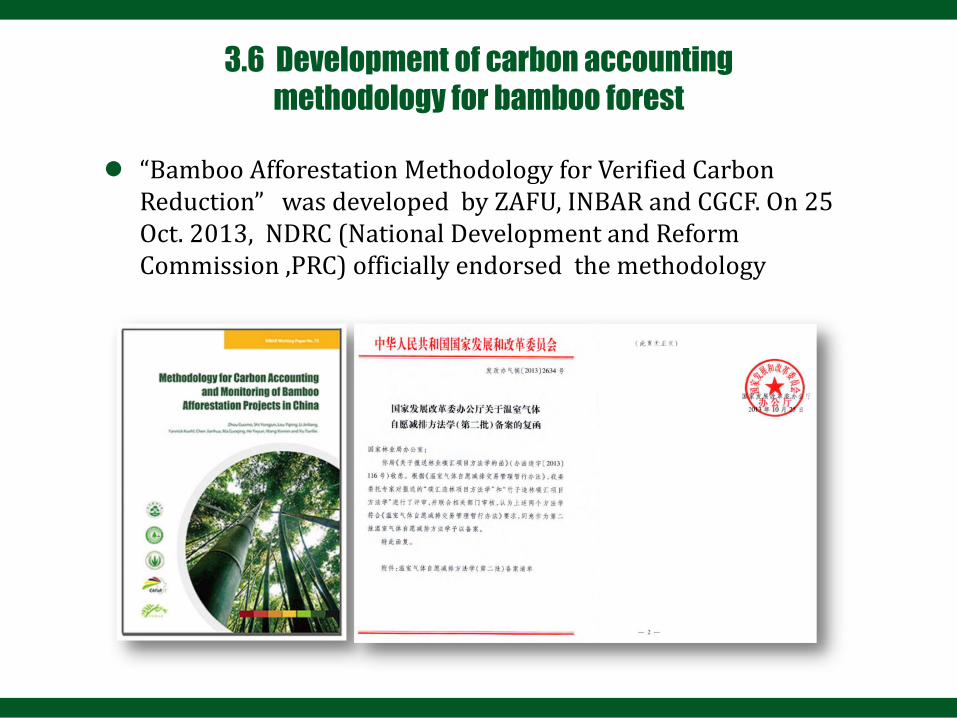
l “Bamboo Afforestation Methodology for Verified Carbon Reduction” was developed by ZAFU, INBAR and CGCF. On 25 Oct. 2013, NDRC (National Development and Reform Commission ,PRC) officially endorsed the methodology
3.6 Development of carbon accounting methodology for bamboo forest

l The development of this methodology was based on the above researches, and lessons learned from a CGCF-funded moso bamboo carbon afforestation pilot project in 2008 in Linan county, Zhejiang province, China.
l In addition, the methodology also draws on relevant international standards and regulations.
l The carbon credit produced by the pilot project was purchased by Alibaba Company in Nov. 2011.
Bamboo carbon afforestation pilot project and carbon credit trade

Formula to calculate net carbon sink amount of projects
The total amount of net carbon sink ,t CO2 a-1
The carbon storage change of project, t CO2 a-1
Greenhouse gas emission in the project area, t CO2 a-1
Carbon leakage caused by afforestation project,t CO2 a-1
Carbon storage change of baseline, t CO2 a-1
tBSLttEtojtoj CLKGHGCC ,,,Pr,Pr
tBSLC ,tLK
tEGHG ,
tojC ,Pr
tojC ,Pr

Year annual variationstCO2-e.a-1
cumulanttCO2
annual variationstCO2-e.a-1
cumulanttCO2
annual variationstCO2-e.a-1
cumulanttCO2
annual variations tCO2-e.a-1
cumulantt CO2
annual variations t
CO2-e.a-1
cumulanttCO2
1 -331.81 -331.81 6.33 6.33 5.79 5.79 34.52 34.52 -378.45 -378.45
2 0.00 -331.81 6.33 0 5.79 50.88 85.4 -50.88 -429.33
3 1042.25 710.44 6.33 12.66 1.24 7.03 69.54 154.94 965.14 535.81
4 0.00 710.44 12.66 0 7.03 89.7 244.65 -89.7 446.1
5 2246.64 2957.08 6.33 18.99 1.24 8.27 110.6 355.24 2128.47 2574.58
6 0.00 2957.08 18.99 1.09 9.36 131.56 486.8 -132.65 2441.93
7 4863.65 7820.73 6.33 25.32 3.42 12.78 152.05 638.86 4701.85 7143.77
8 1389.63 9210.36 25.32 2.18 14.96 171.67 810.52 1215.78 8359.56
9 1389.63 10599.99 25.32 2.18 17.14 190.11 1000.64 1197.34 9556.89
10 1389.63 11989.62 25.32 2.18 19.32 207.2 1207.83 1180.25 10737.15
11 1389.63 13379.25 25.32 2.18 21.5 222.82 1430.65 1164.63 11901.78
12 1389.63 14768.88 25.32 2.18 23.68 236.92 1667.57 1150.53 13052.31
13 1389.63 16158.51 25.32 2.18 25.86 249.51 1917.08 1137.94 14190.25
14 1389.63 17548.14 25.32 2.18 28.04 260.63 2177.71 1126.82 15317.07
15 1389.63 18937.77 25.32 2.18 30.22 270.34 2448.04 1117.11 16434.19
16 1389.63 20327.40 25.32 2.18 32.4 278.71 2726.75 1108.74 17542.93
17 1389.63 21717.03 25.32 2.18 34.58 285.83 3012.58 1101.62 18644.55
18 1389.63 23106.66 25.32 2.18 36.76 291.79 3304.38 1095.66 19740.2
19 1389.63 24496.29 25.32 2.18 38.94 296.69 3601.07 1090.76 20830.96
20 1389.63 25885.92 25.32 2.18 41.12 300.62 3901.69 1086.83 21917.79
Amount 25885.92 25.32 41.12 3901.69 21917.79
Results of net carbon sink accounting
tojC ,Pr tEGHG , tLK tBSLC , tojC ,Pr

l Lin’an County, Zhejiang province, China became the first forest carbon sequestration pilot area in China, in 2010.
l Anji County, Zhejiang province, China became the first bamboo carbon sequestration pilot area in 2012.
3.7 Pilot projectsIn China
Bamboo carbon sequestration pilot area—Anji county
Forest carbon sequestration pilot area-Lin’an(10/28/2010, reported by CCTV)

l Guide farmers to join in bamboo carbon actionl The farmers managed the bamboo forest in southern Chinese forest
region: small-scale, numerous l In 2013, 42 farmers were selected in the experimental project. Total
area:256.5hm2; 22,000 t CO2-e emission reduction by carbon sink forest in 20 years
l In 2014.10, farmers obtained additional benefit by trading carbon credit at a price of 30 RMB/T.
News release for carbon credit traded of farmers
In China

l Bamboo Afforestation Methodology for Verified Carbon Reduction ” was applied in Kenya and Ethiopia in July 2012
3.7 Pilot projects
Globally
Pilot work of bamboo carbon sequestration in Africa

l An appraisal project mission from INBAR, ZAFU and CGCF visited Kenya in June 2012. A MOU between ZAFU and Egerton University was developed for developing bamboo afforestation project for carbon credits
3.7 Pilot projects
Globally

Selected publicationsl Total papers: 118 l SCI papers : 56 (Forest Ecology and
Management、 IEEE T Geosci Remote、Journal of Soils and Sediments、Plant Ecology )
l Chinese papers: 62

1. Peikun Jiang,Qiufang Xu,ZhiHong Xu,et al. Seasonal changes in soil labile organic carbon pools within a Phyllostachys praecox stand under high rate fertilization and winter mulch in subtropical China [J]. Forest Ecology and Management,2006,236:30-36. (IF=1.995)
2. Juan Liu,Peikun Jiang,Hailong Wang,et al. Seasonal soil CO2 efflux dynamics after land use change from a natural forest to Moso bamboo plantations in subtropical China [J]. Forest Ecology and Management,2011,262:1131-1137. (IF=1.995)
3. Huaqiang Du,Weiliang Fan,Guomo Zhou,et al. Retrieval of the canopy closure and leaf area index of Moso bamboo forest using spectral mixture analysis based on the real scenario simulation [J]. IEEE Transactions on Geoscience and Remote Sensing,2011,49(11):4328-4340. (IF=2.47)
4. Peikun Jiang,Hailong Wang,Jiasen Wu,et al. Winter mulch increases soil CO2 efflux under Phyllostachys praecox stands [J]. Journal of Soils and Sediments,2009,9:511-514. (IF=2.573)
5. Yongfu Li,Peikun Jiang,Scott X Chang,et al. Organic mulch and fertilization affect soil carbon pools and forms under intensively managed bamboo (Phyllostachys praecox) forests in southeast China [J]. Journal of Soils and Sediments,2010,10:739-747. (IF=2.573)
6. Guomo Zhou,Cifu Meng, Peikun Jiang,et al. Review of Carbon Fixation in Bamboo Forests in China [J]. The Botanical Review,2011,77(3):262-270.(IF=2.66)
7. Guomo Zhou,JianMing Xu,Pei-Kun Jiang. Effect of management practices on seasonal dynamics of organic carbon in soils under bamboo plantations [J]. Pedosphere,2006,16(14):525-531. (IF=0.978)
8. Guomo Zhou,Peikun Jiang,LuFeng Mo. Bamboo: a possible approach to the control of global warming [J]. International Journal of Nonlinear Sciences & Numerical Simulation, 2009,10(5):547-550.
9. Guomo Zhou,Shunyao Zhuang,Pekun Jiang,et al. Soil organic carbon accumulation in intensively managed Phyllostachys praecox stands [J]. The Botanical Review,2011,77(3):296-303. (IF=2.66)
10. Guomo Zhou,Xiaojun Xu,Huaqiang Du,et al. Estimating Moso bamboo forest attributes using the k Nearest Neighbors technique and satellite imagery [J]. Photogrammetric Engineering & Remote Sensing,2011,77(11):1123-1131. (IF=0.926)
11. Guosheng Wen,Liyang Zhang,Ruming Zhang,et al. Temporal and spatial dynamics of carbon fixation by Moso bamboo (Phyllostachys pubescens) in subtropical China [J]. The Botanical Review,2011,77(3):271-277. (IF=2.66)
12. Hua Qin, Qiufang Xu, Zhihong Cao,et al. Population size and nitrification activity of soil ammonia-oxidizing bacteria in long-term intensive managed Phyllostachys praecox stands [J]. The Botanical Review,2011,77(3):313-319. (IF=2.66)13

13. Huaqiang Du,Guomo Zhou,Hongli Ge,et al. Satellite-based carbon stock estimation for bamboo forest with a nonlinear partial least square regression technique [J]. International Journal of Remote Sensing,2011 (online). (IF=1.182)
14. Huaqiang Du,Guomo Zhou,Wenyi Fan,et al. Spatial heterogeneity and carbon contribution of aboveground biomass of Moso bamboo by using geostatistical theory [J]. Plant Ecology,2010,207:131-139. (IF=1.88)
15. Jiasen Wu,Peikun Jiang,Scott X. Chang,et al. Dissolved soil organic carbon and nitrogen were affected by conversion of native forests to plantations in subtropical China [J]. Canadian Journal of Soil Science,2010,90:27-36. (IF=1.12)
16. Jiasen Wu,Qiufang Xu,Peikun Jiang,et al. Dynamics and distribution of nutrition elements in bamboos [J]. Journal of Plant Nutrition,2009,32:489-501. (IF=0.726)
17. Juan Liu,Peikun Jiang,Yongfu Li,et al. 2011. Responses of N2O flux from forest soils to land use change in subtropical China [J]. The Botanical Review,77(3):320-325. (IF=2.66)
18. Peikun Jiang, Qiufang Xu. Effect of mulching on soil chemical properties and enzyme activities in bamboo plantation of phyllostachy praecox [J]. Communications in Soil Science and Plant Analysis,2002,33(15-18): 3135-3145.(IF=0.43)
19. Peikun Jiang, Cifu Meng, Guomo Zhou,et al. Comparative study of carbon storage in different forest stands in subtropical China [J]. The Botanical Review,2011,77:242-251. (IF=2.66)
20. Peikun Jiang,Qiufang Xu. Abundance and dynamics of soil labile carbon pools under different types of forest vegetation [J]. Pedosphere,2006,16:505-511. (IF=0.978)
21. Qiufang Xu,JianMing Xu. Changes in soil carbon pools induced by substitution of plantation for native forest [J]. Pedosphere,2003,13(3):271-278. (IF=0.978)
22. Qiufang Xu,Peikun Jiang,Zhihong Xu. Soil microbial functional diversity under intensively managed bamboo plantations in southern China [J]. Journal of Soils and Sediments,2008,8: 177-183. (IF=2.573)
23. Qiufang Xu,Peikun Jiang. Functional diversity and size of soil microbial community induced by different land management system [J]. Communications in Soil Science and Plant Analysis,2006,37:2701-2712. (IF=0.43)
24. Qiufang Xu,Peikun Jiang. Microbial Development in soils under intensively managed bamboo (Phyllostachys praecox) stands [J]. Pedosphere,2005,15(1):33-40. (IF=0.978)

Selected publications
l Three books related to bamboo carbon sequestration were published

4 Next step for research

1) Research on climate change adaption for bamboo forest l Study for spatial variation of bamboo distribution
influenced by climate changeü With the temperature rising,the distribution of
bamboo will be toward the northern part of earth
l Study for carbon dynamics of bamboo ecosystem caused by climate change
Ice-storm(happen in 2008.1) Drought(happen in 2013.7)

2 ) Research for carbon sequestration promotion of bamboo ecosystem under management
l Spatial structure controlling and optimizing techniques for bamboo forest
l Carbon pool variation caused by the usage of biochar
3 ) Research on integrated measuring and monitoring method for carbon sequestration and emission in bamboo forest
l Study for carbon dynamic and cycling, combined with carbon-water flux tower and wireless sensor network
l Study for large-scale carbon storage using multi-resource remote sensing images

4) Development of new methodologies
l Methodology for sustainable managed bamboo for Verified Carbon Reduction(VCS version)
l Methodology for Harvested Bamboo Wood Products (HBWP) for carbon finance

WEBSITEwww.zafu.edu.cn
Tel/Fax0086 571 63740003
GUOMO ZHOUZhejiang A & F University
ADDRESSLin’ an, Hangzhou, China
POST CODE311300
