research on applicability of markowitz efficient set of ... · sberbank of russi a according to...
TRANSCRIPT
Research on Applicability ofResearch on Applicability ofMarkowitz efficient set ofMarkowitz efficient set of
portfolios to Russian Equityportfolios to Russian EquityMarketMarket
Savings Bank of the Russian Federation
Sorokoumov V.E.
Kulyshev V.Y.
Melnikov I.N.

Sberbank of Russia
The Savings Bank of Russia is thelargest financial organisation in the
country and is believed to be the largestretail bank in the world in terms of
number of customers (more than 86 mlnholding over 210 mln. accounts),
branches (12 000) and employees (morethan 200 000). It has a spread across the
entire Russian Federation fromVladivostok to Kaliningrad covering 8
time zones.
Savings Bank of the Russian Federation

Sberbank of Russia
Assets under the Treasury managementare more then 37 bln. US dollars.
The Treasury is the largest operator onthe Russian FX market, providing about
20% of the daily volume MoscowInterbank Currency Exchange (MICEX).
Savings Bank of the Russian Federation

Sberbank of Russia
The Savings Bank is one of the onlyRussian banks to have opened limitswith the major Western banks whichallows to carry out a full spectrum ofinternational FX operations and thus
serves as a gateway to the most Russianbanks FX trading.
Savings Bank of the Russian Federation

Sberbank of Russia
Savings Bank analysts have carried outan in-depth analysis of various aspects ofthe Russian corporate securities market.
The goal of this analysis was to evaluatethe markets prospects in term of
profitability, liquidity, risk reduction andinvestment strategy.
Savings Bank of the Russian Federation

Sberbank of Russia
Most liquid Russian stocks listed below have beenchosen by analysts as those that can be included in aninvestment portfolio:- Rostelecom (RKTM)- Norilsk Nickel (NKEL)- Mosenergo ((MSNG)- Lukoil (LUKOIL)- EUS (EESR)- Surgutneftegaz (SNGS)- Gazprom (GASP).
Savings Bank of the Russian Federation

Sberbank of Russia
To describe attractiveness of investments into a certainsecurity current yield notion calculated according to the
following formula was applied:
Yield=(y(t)-y(t-k))*365/(y(t)*k), (1)
where
y(t) - closing price of a stock on day t;k - time lag (in days);
Yield - current yield (in percent per annum).
Savings Bank of the Russian Federation

Sberbank of Russia
Calculated current yield of stocks (in per cent per annum)
Savings Bank of the Russian Federation

Sberbank of Russia
According to Markowitz theory there is no need foran investor to examine all possible portfolios, butonly the so called ‘efficient set of portfolios. Thenthe investor chooses its own optimal portfolio out ofthe efficient portfolios set each of providing:
- maximum expected return for a given level of risk,or- minimum risk for a certain expected return.
Markowitz Problem
Savings Bank of the Russian Federation

Sberbank of Russia
We provide the following algorithm:
1. Statistical data was used to calculate covariance matrix ofreturns Cij for all stock to be included in the model portfolio:
! " ! "
! " ! "2
1 1
2
1
# #
#
$ $
$
%%
%%$
T
t
T
tjtjiti
T
tjtjiti
ij
yyyy
yyyyC
where
yn - current yield of the i-th stock;
y - mean yield of the i-th stock
Savings Bank of the Russian Federation
Sberbank of Russia
2. The maximum and minimum mean currentyields (Ymin, Ymax) for all stock in the given time
interval is calculated.
Savings Bank of the Russian Federation

Sberbank of Russia
KYYYp minmax %$&
k - the number of partition points) the followingsteps are taken:
3. By specifying mean yields in the range betweenthe maximum and minimum possible yields thestructure of an optimal portfolio can be calculated toreduce risk. It means that for each given mean yieldwith increment lag of
Savings Bank of the Russian Federation

Sberbank of Russia
- Finding portfolio weights (xj) for each stock,in order to achieve minimum risk
21
1 1
min ''(
)**+
,##$ $
jjij
N
i
N
jii yxCyx
for a given mean yield of the portfolio
#$
$N
iiip yxY
1
and provided that the stock will not be sold while thetotal portfolio weights of the stock must be equal to 1
#$
$N
iix
11
Savings Bank of the Russian Federation
Sberbank of Russia
4. Risk calculation formula has aquadratic form, thus a problem of
achieving minimum risk for a givenyield is a problem of quadratic
programming.
Moreover, the problem may becomplicated by introducing additional
constraints
Savings Bank of the Russian Federation

Sberbank of Russia
Basic assumption of the model: each individualvalue of the resulting yields set for an individual
stock is a result of a sample of randomly distributedvariables.
The risk of a stock is considered as possible lossesdue to fluctuations of its market price and is defined
by the authors as a deviation of the stock’s price.Thus only market risk is taken into account in this
model.
More sophisticated models and specialized softwareproducts are needed to consider other risks (credit
risk, operational risk, etc.).
Savings Bank of the Russian Federation

Sberbank of Russia
Sample probability of distribution of density for Surgutneftegaz stock
Exhibit shows that the shapeof distribution is close tonormal Gauss distribution,but significant distributiontails can be identified. Theymay be caused by non-stationary return time seriesprior to and after the crisis ofAugust 17, 1998, in Russia.
Nevertheless the standarddeviation may serve as quiteadequate measure of risk.
Another additional constraint on application of this model is a ban on shortposition, i.e. all indices of all the portfolio weights of all the stocks are positive. Inother words we create a new portfolio and are not able to sell stocks, whichcomprise the existing portfolio
Savings Bank of the Russian Federation

Savings Bank of the Russian Federation
The problem solution and investigation of theresults
Effective portfolio frontier and the points corresponding to different stocks
Color points show differentstock on a phase diagram“risk -yield”. Blue colorpoints show the frontier ofthe set of acceptableportfolios. The exhibit canbe interpreted as follows:for a given yield there is noportfolio on the marketwith risk lower than that ofportfolios’ frontier, i.e.there is no point on themarket to the left of thefrontier, while points to theright of the frontier the riskfor a given yield is higherthan on the frontier.
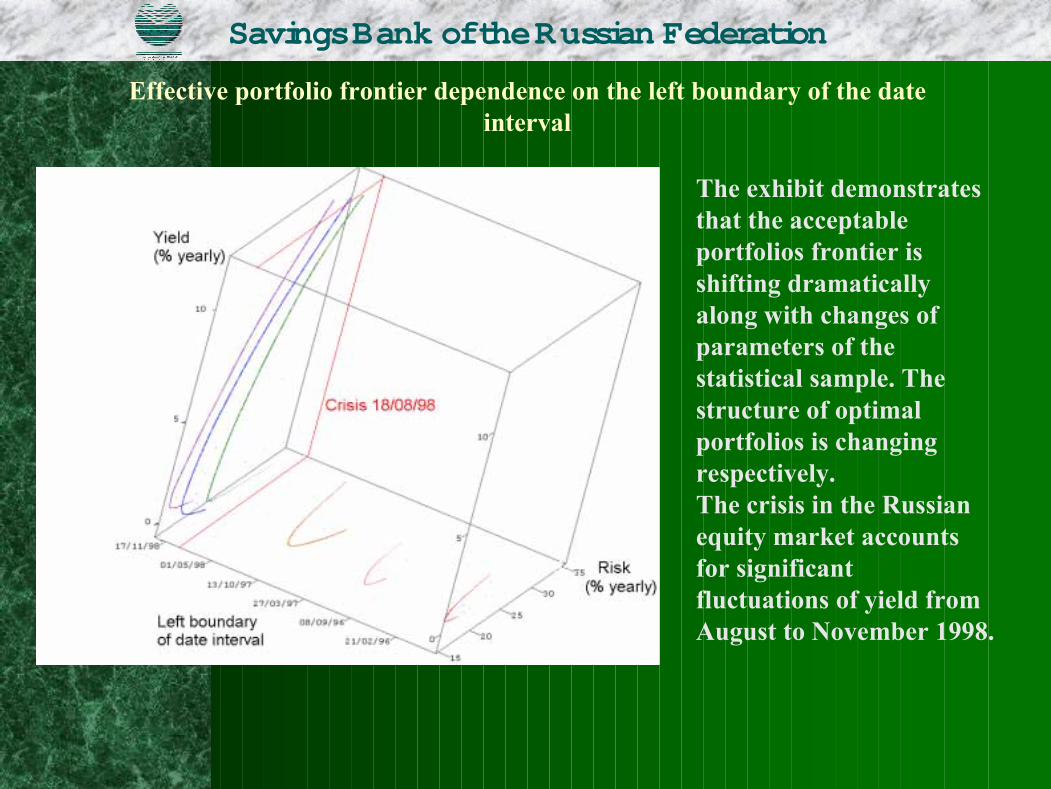
Effective portfolio frontier dependence on the left boundary of the dateinterval
The exhibit demonstratesthat the acceptableportfolios frontier isshifting dramaticallyalong with changes ofparameters of thestatistical sample. Thestructure of optimalportfolios is changingrespectively.The crisis in the Russianequity market accountsfor significantfluctuations of yield fromAugust to November 1998.
Savings Bank of the Russian Federation

Dependence of stocks’ yields and risks on the choice of left boundary of thedate interval of observation
The exhibit illustrates instabilityof statistics which reflectsdifferent positions of the pointscorresponding to single-stockportfolios calculated for differenttime intervals of subsamples ofthe data used in this study.
Risk levels (in per cent perannum) are plotted on thevertical axis. The points areconnected by lines whichcorrespond to different left-hand-side end dates ofsubsample given in chronologicalorder and to the planes on whichthe effective portfolios frontiersare plotted at the previousexhibit.
Savings Bank of the Russian Federation

Effective portfolio frontier dependence on the left boundary of the dateinterval
The exhibit demonstratesthat the acceptableportfolios frontier isshifting dramaticallyalong with changes ofparameters of thestatistical sample. Thestructure of optimalportfolios is changingrespectively.The crisis in the Russianequity market accountsfor significantfluctuations of yield fromAugust to November 1998.
Savings Bank of the Russian Federation
Possible ways of further increase of the solutionaccuracy
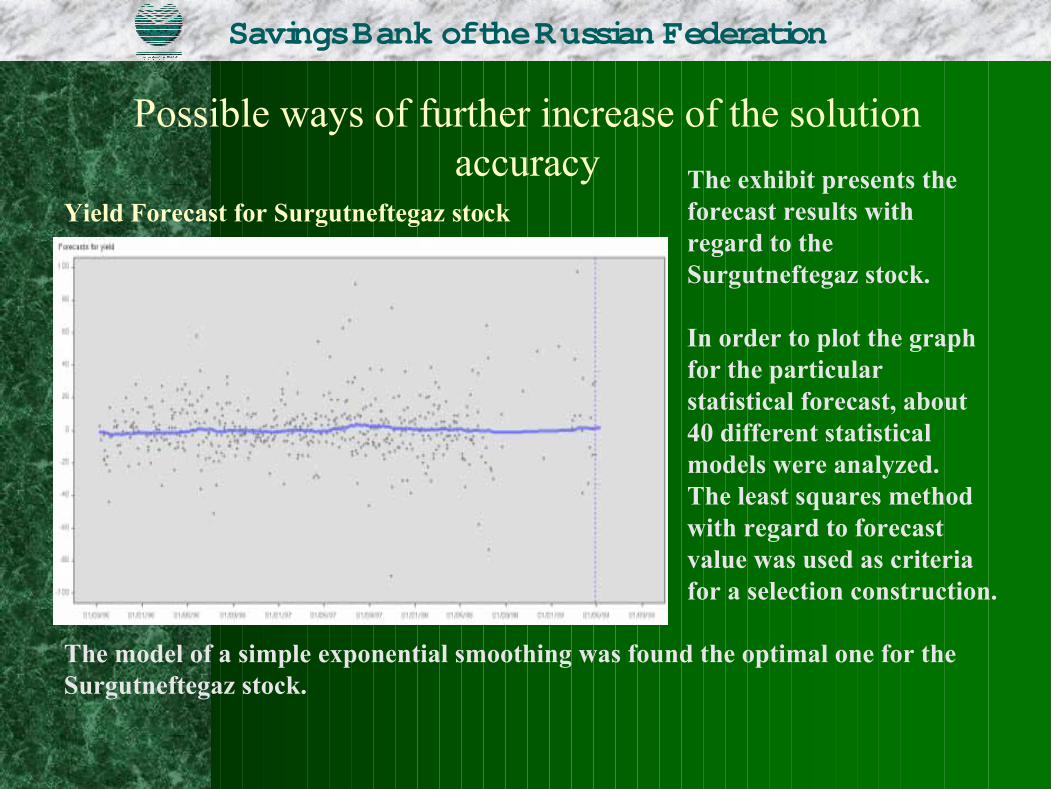
Yield Forecast for Surgutneftegaz stockThe exhibit presents theforecast results withregard to theSurgutneftegaz stock.
In order to plot the graphfor the particularstatistical forecast, about40 different statisticalmodels were analyzed.The least squares methodwith regard to forecastvalue was used as criteriafor a selection construction.
The model of a simple exponential smoothing was found the optimal one for theSurgutneftegaz stock.
Savings Bank of the Russian Federation
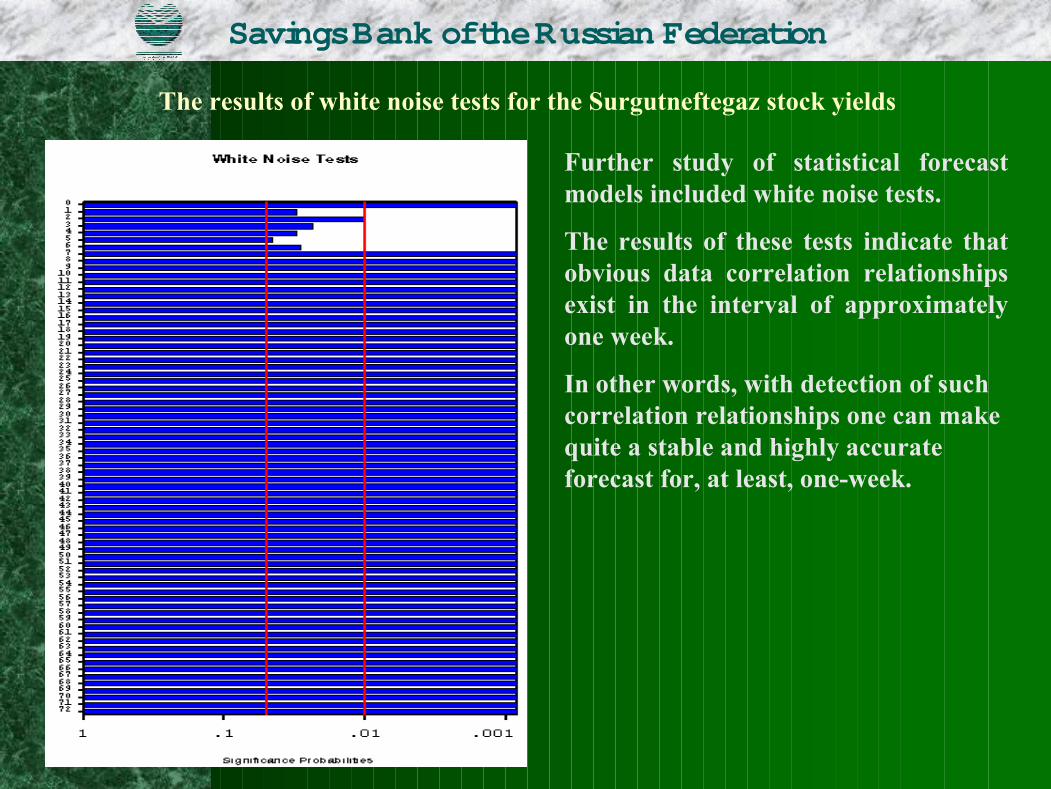
The results of white noise tests for the Surgutneftegaz stock yields
Further study of statistical forecastmodels included white noise tests.
The results of these tests indicate thatobvious data correlation relationshipsexist in the interval of approximatelyone week.
In other words, with detection of suchcorrelation relationships one can makequite a stable and highly accurateforecast for, at least, one-week.
Savings Bank of the Russian Federation

Autocorrelation function for Surgutneftegaz stock returns
Analysis of anti-correlation functions forreviewed time series shows existence ofstrong weekly and monthly periodcorrelations.
On the graph the time (shown in days) isdisplayed on the vertical axis whilecorrelation ratios - on the horizontal axis.
Periodicity in autocorrelations for the timeintervals of one week (5 business days) andone month (25 business days) is clearlyindicated.
Savings Bank of the Russian Federation
Sberbank of Russia
Markowitz Model Computer Application
Savings Bank of the Russian Federation
SAS institute software has been widely usedduring he development of the software.
In calculations NLP Procedure of SASSystem was used

Savings Bank of the Russian Federation
SAS Server v.6.12Windows NT
WorkstationMicrosoft Internet ExplorerWindows NT, Windows 95
Microsoft IIS ServerWindows NT,SAS IntrNet IntraBank LAN
WorkstationMicrosoft Internet ExplorerWindows NT, Windows 95
WorkstationMicrosoft Internet ExplorerWindows NT, Windows 95
WorkstationMicrosoft Internet ExplorerWindows NT, Windows 95
IntraBank LAN
The application’s architecture

Sberbank of RussiaSberbank of Russia
Input date view form
This window serves forchoosing the interval to be usedin a subsample of the statisticalmodel and for references to theproblem description and to abrief theoretical review.
Savings Bank of the Russian Federation

Sberbank of Russia
Viewing results. Efficient portfolio frontier.
Then the investment managermakes a decision on theparameters of a futureportfolio which shall be closeto the left-hand-side uppersegment of the acceptableportfolios frontier.
E.g. the most effectiveportfolios (from the ‘risk-to -yield’ point of view)apparently have the yieldwithin the following limits: 1.2- 1.6.
Savings Bank of the Russian Federation
Sberbank of Russia
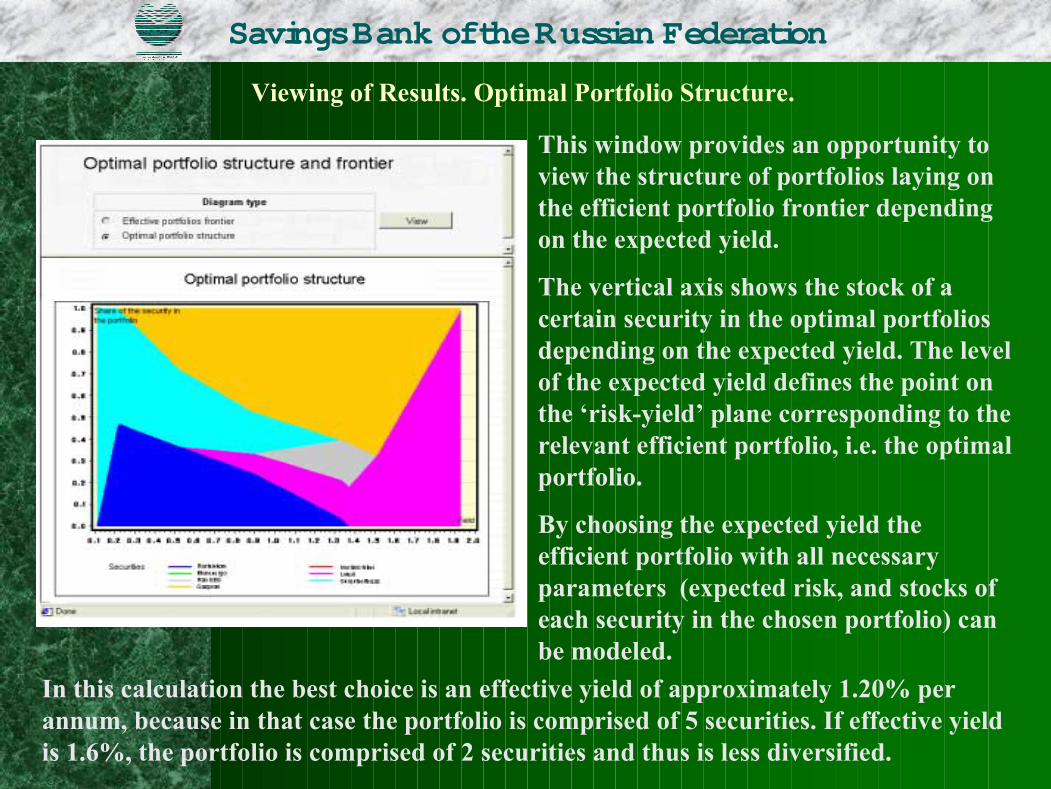
Viewing of Results. Optimal Portfolio Structure.
This window provides an opportunity toview the structure of portfolios laying onthe efficient portfolio frontier dependingon the expected yield.
The vertical axis shows the stock of acertain security in the optimal portfoliosdepending on the expected yield. The levelof the expected yield defines the point onthe ‘risk-yield’ plane corresponding to therelevant efficient portfolio, i.e. the optimalportfolio.
By choosing the expected yield theefficient portfolio with all necessaryparameters (expected risk, and stocks ofeach security in the chosen portfolio) canbe modeled.
In this calculation the best choice is an effective yield of approximately 1.20% perannum, because in that case the portfolio is comprised of 5 securities. If effective yieldis 1.6%, the portfolio is comprised of 2 securities and thus is less diversified.
Savings Bank of the Russian Federation
ConclusionsSberbank of Russia
• General theories developed for developed markets maybe applied to the Russian equity market provided themodels are adjusted to its conditions: increased volatilityand less stable prices.
• The theories assume that uncertainty is exogenous, i.e.originated from outside. These theories are applicable atstable periods of the market development and naturallydo not take into account political risks. To determine thefactors, which influence forecasts additional statisticaland fundamental studies are needed.
Savings Bank of the Russian Federation

Sberbank of Russia
3. The attempt to solve the Markowitz problem on theground of historical data showed that the solution to agreat extent depends on adjusting the statistical modeland subsample of the input data. To find stablepositions and shapes of the acceptable portfoliosfrontier the models have to be adjusted to the timeseries of prices under review. Such adjustments aremade for subsamples of the prices of Russian stocksfor the time interval from January 01, 1999 to May1999.
Savings Bank of the Russian Federation

Sberbank of Russia
• Significant positive correlation among the stocks’prices provides an opportunity to develop a syntheticaggregated index for the Russian equity market to beused in forecasts. Further research based on broaderinput data set including research with regard to thestructure of portfolio to be created is desirable todevelop that index.
Moreover, the fact that all cross-correlation ratios arepositive indicates that there is no possibility for directhedging of the stock portfolio.
Nevertheless, it is possible to lower the risk for aportfolio of a given yield by choosing effectiveportfolios located on the Markowitz efficient portfoliosfrontier.
Savings Bank of the Russian Federation

Sberbank of Russia
5. A multi-user application for stock market monitoringfor investment-manager has been developed within ashort period of time.
6. The results of the conducted research were used in building the optimal stock portfolio for Saving Bankin summer 1999.
Savings Bank of the Russian Federation

Research on Applicability of Markowitz efficient set ofportfolios to Russian Equity Market
Introduction
Sberbank analysts have carried out an in-depth analysis of various aspects of theRussian corporate securities market. The goal of this analysis was to evaluate themarkets prospects in term of profitability, liquidity, risk reduction and investmentstrategy.
It should be noted out that Russian legislation requires to some extent that Russianinvestors invest exclusively in domestic instruments. Thus, the restrictions on hedgingin the international markets stimulate detailed analysis of the Russian financialinstruments.
Relatively low liquidity and relatively high risk are the characteristics of the Russianmarket and should be taken into account while performing such analysis. The Russiansecurities market can be described as an emerging and is far from equilibrium.Therefore, the most important question is whether generally accepted investmentmodels and forecasting techniques can be applied.
The areas of this analysis were to find a forecasting technique and solve the problemof forming an optimal portfolio applying ‘return-to-risk’ criterion in terms ofdeveloping special mathematical models, such as (CAPM, Markowitz problem, etc.[1,2,3]).
This article offers the solution of Markowitz model for the most liquid Russian stocks.The solution was tested on stability and a SAS application is provided. Theapplication allows an investment manager to make analysis, forecast and to create aportfolio.
Input data
Most liquid Russian stocks listed below have been chosen by analysts as those thatcan be included in an investment portfolio:! Rostelecom (RKTM)*
! Norilsk Nickel (NKEL)! Mosenergo ((MSNG)! Lukoil (LUKOIL)! EUS (EESR)! Surgutneftegaz (SNGS)! Gazprom (GASP). * RTS (Russian Trading System) codes or RIC codes of the stocks are given in brackets.

2
The RTS (Russian Trading System) daily closing prices of the first six stocksmentioned above and the MICEX (the Moscow Interbank Currency Exchange) dailyclosing prices of Gazprom stocks for the period from October 1995 to May 1999 wereused as data for this analysis.
To describe attractiveness of investments into a certain security current yield notioncalculated according to the following formula was applied:
Yield=(y(t)-y(t-k))*365/(y(t)*k), (1)
where
y(t) - closing price of a stock on day t;k - time lag (in days);Yield- current yield (in percent per annum).
Exhibit 1 shows an example of yield calculation results (for k=1) for the selectedstocks.
Exhibit 1Calculated current yield of stocks (in per cent per annum)
Vertical axis shows current yield of stocks calculated in accordance with Formula 1,horizontal axis - the date.

3
Markowitz model description
Modern theory of portfolio structuring and investments in this segment of the marketis based on H. Markowitz’s ‘Portfolio Selection’ [2]. According to this theory there isno need for an investor to examine all possible portfolios, but only the so called‘efficient set of portfolios. Then the investor chooses its own optimal portfolio out ofthe efficient portfolios set each of which provides:! maximum expected return for a given level of risk, or! minimum risk for a certain expected return.
A set of portfolios meeting these two requirements is called an efficient set - or theMarkowitz efficient frontier. Markowitz demonstrated that the efficient set is ahyperbola.
We provide the following solution:
1. Statistical data was used to calculate covariance matrix of returns Cij for all stockto be included in the model portfolio:
" # " #
" # " #2
1 1
2
1
$ $
$
% %
%
&&
&&%
T
t
T
tjtjiti
T
tjtjiti
ij
yyyy
yyyyC
whereyn -current yield of the i-th stock;y - mean yield of the i-th stock.
2. The maximum and minimum mean current yields (Ymin, Ymax) for all stock in thegiven time interval is calculated.
3. By specifying mean yields in the range between the maximum and minimumpossible yields the structure of an optimal portfolio can be calculated to reducerisk. It means that for each given mean yield with increment lag of
KYYYp
minmax &%' , k - the number of partition points) the following steps are
taken:
Finding portfolio weights (xj) for each stock,
in order to achieve minimum risk (2
1
1 1min ((
)
*++,
-$$% %
jjij
N
i
N
jii yxCyx )
for a given mean yield of the portfolio ( $%
%N
iip yxY
1)
and provided that the stock will not be sold 0./ ixi ),

4
while the total portfolio weights of the stock must be equal to 1 ($%
%N
iix
11).
4. Risk calculation formula has a quadratic form, thus a problem of achievingminimum risk for a given yield is a problem of quadratic programming. Moreover,the problem may be complicated by introducing additional constraints.
Additional model assumptions and constraints on the model
The calculations are made on the basis of the following basic assumption: eachindividual value of the resulting yields set for an individual stock is a result of asample of randomly distributed variables. Moreover, it is assumed that a future yieldis also a random variable out of the same set. It should be noted that this kind ofstatistical models is based on the assumption that time series are expected to providesufficient and accurate statistical forecast.Such an approach provides an opportunity to analyze sets of yields by applying thestatistical method. For each stock a time series of current yield were calculated inaccordance with formula (1). Dividends on stocks over the period are not taken intoaccount in such calculations, because such a portfolio was regarded to as speculativerather than investment one. Mathematically, the risk of the i-th stock is calculated asthe mean quadratic (standard) deviation from its yield over the reviewed period.The risk of a stock is considered as possible losses due to fluctuations of its marketprice and is defined by the authors as a deviation of the stock’s price. Thus onlymarket risk is taken into account in this model. More sophisticated models andspecialized software products are needed to consider other risks (credit risk,operational risk, etc.).Additional calculations proved that distribution of yields for each of the stocksanalyzed is close to normal (see Exhibit 2 which shows yields of Surgutneftegazstocks).

5
Exhibit 2Sample probability of distribution of density for Surgutneftegaz stock
Exhibit 2 shows that the shape of distribution is close to normal Gauss distribution,but significant distribution tails can be identified. They may be caused by non-stationary return time series prior to and after the crisis of August 17, 1998, in Russia.Nevertheless the standard deviation may serve as quite adequate measure of risk.Moreover, simplicity of calculation of this measure of risk and relatively simpleportfolio optimization procedure is an important factor, which also should be takeninto account.Another additional constraint on application of this model is a ban on shortposition, i.e. all indices of all the portfolio weights of all the stocks are positive( 0./ ixi ). In other words we create a new portfolio and are not able to sellstocks, which comprise the existing portfolio. In the case of withdrawal of thisconstraint the optimization might result in negative portfolio weights of some stocks,i.e. it might require to sell a corresponding number of stocks from the existingportfolio.
The problem solution and investigation of the results
Exhibit 3 shows results of optimization problem solution.

6
Exhibit 3Effective portfolio frontier and the points corresponding to different stocks
Color points show different stock on a phase diagram “risk (RHS) -yield (PROF)”.Blue color shows the frontier of the set of acceptable portfolios. The Exhibit 3 can beinterpreted as follows: for a given yield there is no portfolio on the market with risklower than that of portfolios’ frontier, i.e. there is no point on the market to the left ofthe frontier, while points to the right of the frontier the risk for a given yield is higherthan on the frontier.The problem solution was then studied on statistical stability. The statistical stabilitystudy was undertaken in order to give an answer to whether this model can be appliedto Russian market.To study the problem’s solution stability time intervals and discreteness steps for theinput data were changed. The most interesting results were achieved by shifting theleft boundary of the time interval of the statistical sample, which determined the dataset for the subsample.
Exhibit 4 shows of the results of the study.

7
Exhibit 4.Effective portfolio frontier dependence on the left boundary of the date interval
Exhibit 4 demonstrates that the acceptable portfolios frontier is shifting dramaticallyalong with changes of parameters of the statistical sample. The structure of optimalportfolios is changing respectively. It is caused by a number of stable time processes,which are also reflected by Exhibit 1 devoted to the dependence of yield on time.The crisis in the Russian equity market accounts for significant fluctuations of yieldfrom August to November 1998. Instability of statistics is illustrated by Exhibit 5which reflects different positions of the points corresponding to single-stock portfolioscalculated for different time intervals of subsamples of the data used in this study.Risk levels (in per cent per annum) are plotted on the vertical axis (axis RHS). Thepoints are connected by lines which correspond to different left-hand-side end dates ofsubsample given in chronological order and to the planes on which the effectiveportfolios frontiers are plotted at Exhibit 4.
Numerical calculations have also been carried out by changing time lag in the yieldcalculation formula. It should noted that time increment used for yield calculationexerts a profound influence on relative positions of the points on such diagram.

8
Exhibit 5.Dependence of stocks’ yields and risks on the choice of left boundary of the dateinterval of observation
However, as time intervals of subsample of statistical parameters were reduced to thecurrent time process (approximately 2-3 months), the effective frontier (as well as ofthe structure of the optimal portfolio) becomes stable and decreases its dependence onthe statistical parameters (see Exhibit 4). That means that this model may be generallyapplied to the Russian market at short-term intervals.
Possible ways of further increase of the solution accuracy
As position the position of single-stock portfolios determines the position of theeffective frontier the research attempts to make a more accurate forecast of theexpected risk and yield values.
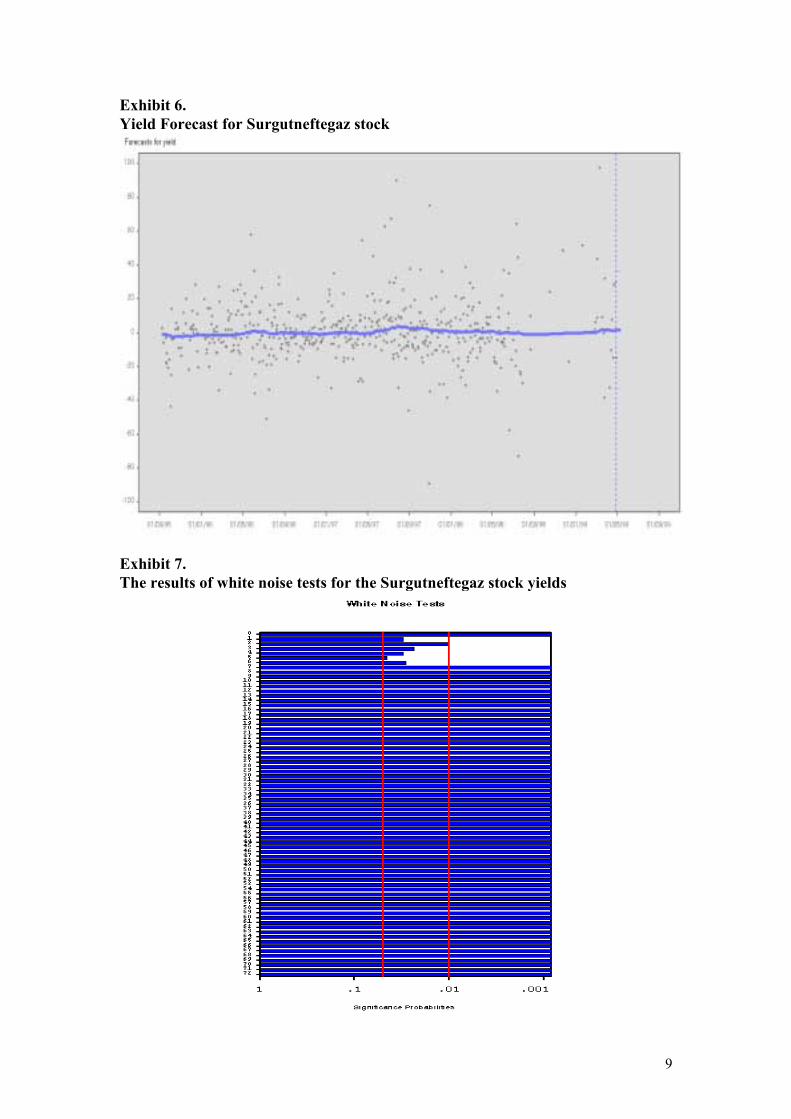
Exhibit 6 presents the forecast results with regard to the Surgutneftegaz stock. In orderto plot the graph for the particular statistical forecast, about 40 different statisticalmodels were analyzed. The least squares method with regard to forecast value wasused as criteria for a selection construction. The model of a simple exponentialsmoothing was found the optimal one for the Surgutneftegaz stock. It is worthmentioning, that for all time series of effective yields signal-to-noise ratios are low,e.g. for Surgutneftegaz this ratio is approximately 1/30.
9
Exhibit 6.Yield Forecast for Surgutneftegaz stock
Exhibit 7.The results of white noise tests for the Surgutneftegaz stock yields
10
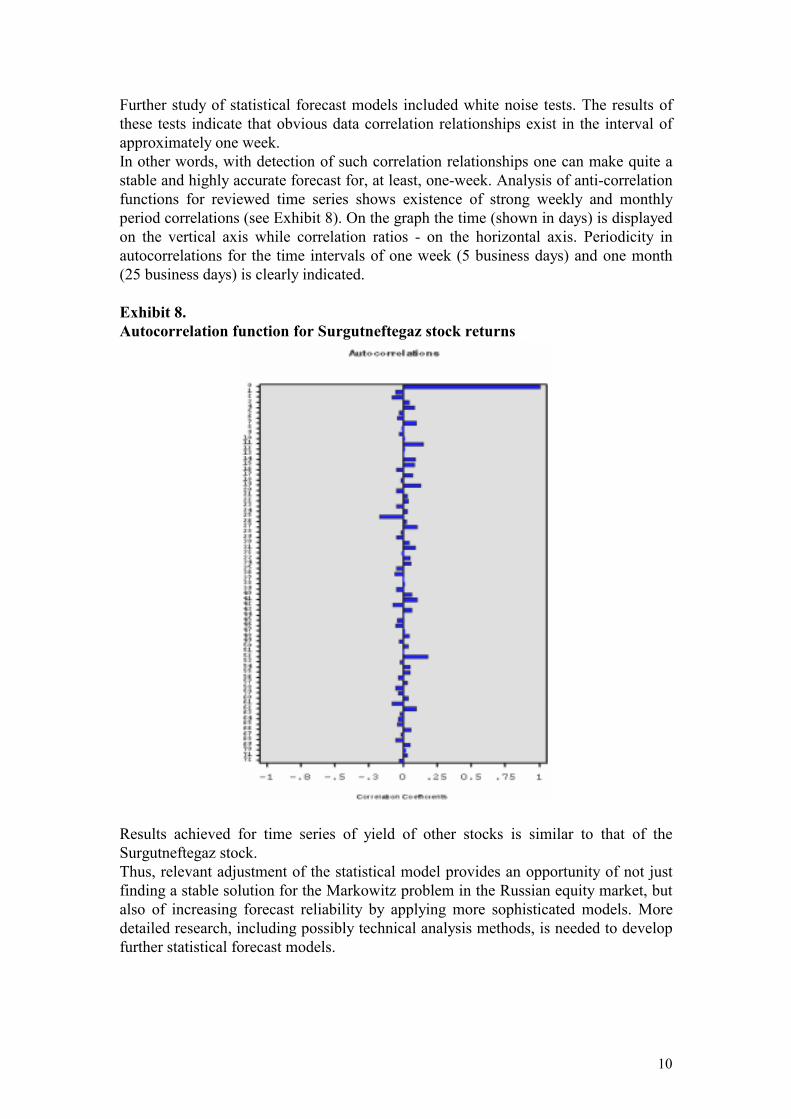
Further study of statistical forecast models included white noise tests. The results ofthese tests indicate that obvious data correlation relationships exist in the interval ofapproximately one week.In other words, with detection of such correlation relationships one can make quite astable and highly accurate forecast for, at least, one-week. Analysis of anti-correlationfunctions for reviewed time series shows existence of strong weekly and monthlyperiod correlations (see Exhibit 8). On the graph the time (shown in days) is displayedon the vertical axis while correlation ratios - on the horizontal axis. Periodicity inautocorrelations for the time intervals of one week (5 business days) and one month(25 business days) is clearly indicated.
Exhibit 8.Autocorrelation function for Surgutneftegaz stock returns
Results achieved for time series of yield of other stocks is similar to that of theSurgutneftegaz stock.Thus, relevant adjustment of the statistical model provides an opportunity of not justfinding a stable solution for the Markowitz problem in the Russian equity market, butalso of increasing forecast reliability by applying more sophisticated models. Moredetailed research, including possibly technical analysis methods, is needed to developfurther statistical forecast models.

11
Markowitz Model Computer Application
A special application was developed to provide support for the decision-makingprocess. The application gives an opportunity to amend statistical parameters of themodel and to find problem solutions in interactive mode. This application is supposedto be used by an analyst, familiar with the Markowitz model, but not necessarilyacquainted with all the details of calculation algorithms. SAS Institute system (SASBASE, SAS OR, SAS InterNet) based on WindowsNT 4.0 with a ‘thin client’(Microsoft Internet Explorer) was used for the application’s architecture. It is shownin the Exhibit 9. The system is easy to maintain due to its architecture specifications(applications server, Web-server, ‘thin client’). The input data is loaded from Reutersand Russian Trading System. Calculation algorithms are partially described in [5,4].
Exhibit 9.The application’s architecture
SAS Server v.6.12Windows NT
WorkstationMicrosoft Internet ExplorerWindows NT, Windows 95
Microsoft IIS ServerWindows NT,SAS IntrNet IntraBank LAN
WorkstationMicrosoft Internet ExplorerWindows NT, Windows 95
WorkstationMicrosoft Internet ExplorerWindows NT, Windows 95
WorkstationMicrosoft Internet ExplorerWindows NT, Windows 95
IntraBank LAN
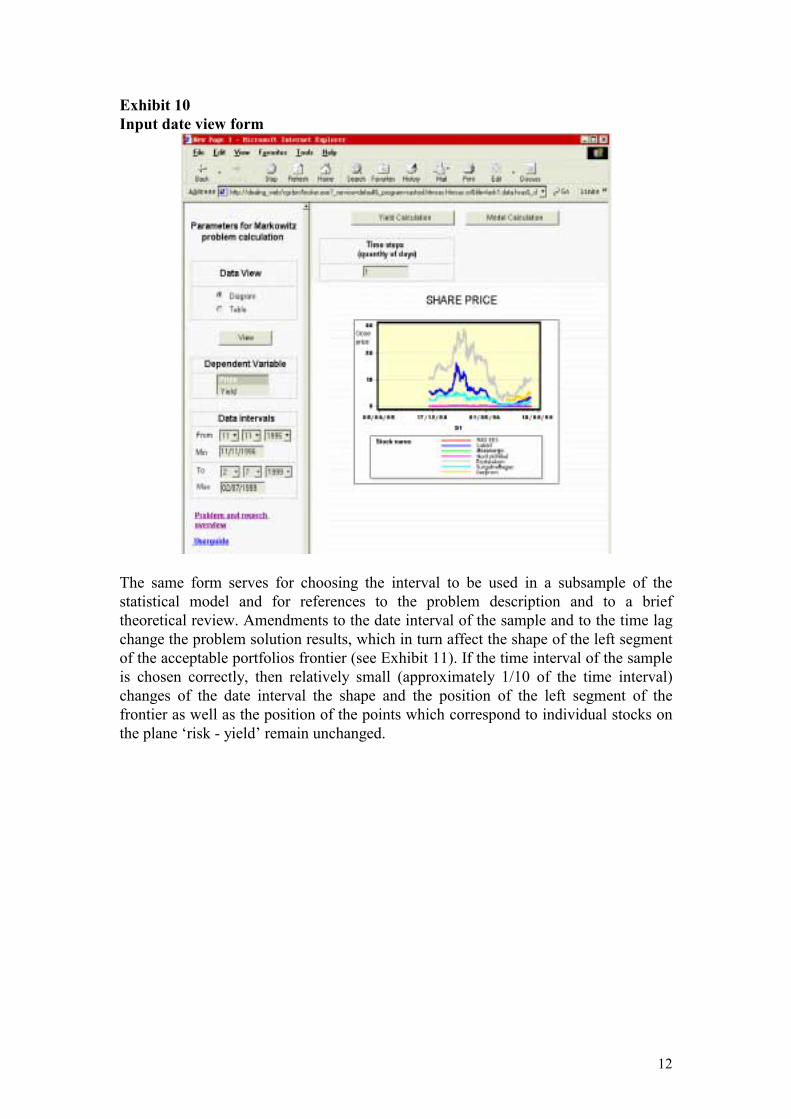
The user, first, views the input data (time series of yields or stock’s prices) in the formof table or graphs (See Exhibit 10).
12
Exhibit 10Input date view form
The same form serves for choosing the interval to be used in a subsample of thestatistical model and for references to the problem description and to a brieftheoretical review. Amendments to the date interval of the sample and to the time lagchange the problem solution results, which in turn affect the shape of the left segmentof the acceptable portfolios frontier (see Exhibit 11). If the time interval of the sampleis chosen correctly, then relatively small (approximately 1/10 of the time interval)changes of the date interval the shape and the position of the left segment of thefrontier as well as the position of the points which correspond to individual stocks onthe plane ‘risk - yield’ remain unchanged.

13
Exhibit 11.Viewing results. Efficient portfolio frontier.
Then the investment manager makes a decision on the parameters of a future portfoliowhich shall be close to the left-hand-side upper segment of the acceptable portfoliosfrontier. E.g. in the case shown in Exhibit 11 the most effective portfolios (from the‘risk-to -yield’ point of view) apparently have the yield within the following limits:1.2 - 1.6.
The next step is elaboration of the solution found and taking decision on the structureof the optimal portfolio. A form, shown at Exhibit 12, was worked out to provide anopportunity to view the structure of portfolios laying on the efficient portfolio frontierdepending on the expected yield. The vertical axis shows the stock of a certainsecurity in the optimal portfolios depending on the expected yield. The level of theexpected yield defines the point on the ‘risk-yield’ plane corresponding to the relevantefficient portfolio, i.e. the optimal portfolio.By choosing the expected yield the efficient portfolio with all necessary parameters(expected risk, and stocks of each security in the chosen portfolio) can be modeled. Inthis calculation (see Exhibit 12) the best choice, in our opinion, is an effective yield ofapproximately 1.20% per annum, because in that case the portfolio is comprised of 5securities (Gazprom, EUS, Rostelecom, Norilsk Nickel, Lukoil). If effective yield is1.6%, the portfolio is comprised of 2 securities and thus is less diversified.

14
Exhibit 12.Viewing of Results. Optimal Portfolio Structure.
The application described above is currently used by the Treasury of Sberbank ofRussia as one of the techniques used in the process of making investment decisions.The calculation algorithms used in this system are not unique. They have beenpublished [1-5] and exist in the form of subroutines of many mathematical librariesand packages. Nevertheless, the performance of the analysis presented in this work aswell as elaboration of a multi-user application with graphical interface for theinvestment managers within a short period of time (1.5 month) would be impossiblewithout software of the SAS Institute.Further development of the system depends on the development of the Russiansecurities market, introduction of more sophisticated forecast algorithms and is linkedto further complexity of the optimization problems, in particular, to the task of moreprecise definition of VaR by using more sophisticated mathematical models

15
(exponentially weighted covariations method Risk Metrics, GARCH models,semiparametrical models, Monte-Carlo historical simulation methods).
Conclusions
! General theories developed for developed markets may be applied to the Russianequity market provided the models are adjusted to its conditions: increasedvolatility and less stable prices. The theories assume that uncertainty is exogenous,i.e. originated from outside. These theories are applicable at stable periods of themarket development and naturally do not take into account political risks. Inparticular, the crisis of August 18, 1998, in Russia has significantly changed thestructure of the Russian securities market. To determine the factors, whichinfluence forecasts additional statistical and fundamental studies are needed.
! The attempt to solve the Markowitz problem on the ground of historical datashowed that the solution to a great extent depends on adjusting the statisticalmodel and subsample of the input data. To find stable positions and shapes of theacceptable portfolios frontier the models have to be adjusted to the time series ofprices under review. Such adjustments are made for subsamples of the prices ofRussian stocks for the time interval from January 01, 1999 to May 1999.
! Significant positive correlation among the stocks’ prices provides an opportunityto develop a synthetic aggregated index for the Russian equity market to be usedin forecasts. Further research based on broader input data set including researchwith regard to the structure of portfolio to be created is desirable to develop thatindex. Moreover, the fact that all cross-correlation ratios are positive indicates thatthere is no possibility for direct hedging of the stock portfolio. Nevertheless, it ispossible to lower the risk for a portfolio of a given yield by choosing effectiveportfolios located on the Markowitz efficient portfolios frontier.
! A multi-user application for investment-manager has been developed within ashort period of time.
In conclusion, the authors of the article express their gratitude to the SAS Institute. Itwould have been impossible to perform this work within 1.5 months without softwareand methodological assistance of that company.
Bibliography
1. Black, F.; Jensen, M.; and Scholes, M.(1972) "The Capital Asset Pricing Model: SomeEmpirical Tests" ed. Mishael Jensen, Studies in the Theory of Capital Markets, NewYork: Praeger, pp.79-121.
2. Markowitz, H.(1952) "Portfolio Selection", Journal of Finance, Vol.7 pp.77-91.3. Markowitz, H.(1991) Portfolio Selection: Efficient Diversification of Investments,
Second Edition, Cambridge, MA: Blackwell, Inc.4. Stock Market Analysis Using SAS® System #550435. SAS® ETS, SAS® OR User Guide