research methodology 1 - chiang mai university€¦ · · 2017-09-14research methodology 1 ......
TRANSCRIPT

Research Methodology 1Introduction to Community Health II
Kriengkrai Srithanaviboonchai MD, MPHDepartment of Community Medicine
15 Sep 2017

Research design
2
Basic AppliedBasic Research is driven by a scientist's curiosity or interest in a scientific question. The main motivation is to expand man's knowledge, not to create or invent something. There is no obvious commercial value to the discoveries that result from basic research.
Applied research is designed to solve practical problems of the modern world, rather than to acquire knowledge for knowledge's sake. One might say that the goal of the applied scientist is to improve the human condition.

Research design
3
Qualitative Quantitative

Research design
4
Qualitative QuantitativeTopic Human behavior Nature
Variable Reason, opinion Heart rate, cure/not cure
Data Text, story Number, count
Data collection Focus group, observation Measurement
Sample size Small Large

Research design
5
Qualitative Quantitative+
Mixed method

Quantitative research design
6
Alter the events under study?
yes no
Experiment Observational study
Make measurements on more than one occasion?
yes no
Longitudinal study Cross-sectional study

Observational research
The researcher does not interfere, just observes and measures what happens in the nature
Can be divided into descriptive and analytic (more details later)
7

Experimental research
Other names: intervention study, clinical trial The researcher gives intervention (exposure,
independent variable) Must have comparison(s) Always analytic
8

Observational research
9
Descriptive Analytic Describe distribution/rate of
diseases (or conditions) in terms of person, time, and place
No comparison or hypothesis
Compare data between variables Has hypothesis, comparison

Observational research
10
Descriptive Analytic
Incidence Prevalence Cross-sectional Case-control Cohort

Cross-sectional study
Other name: survey The researcher measures exposure and disease at
the particular point in time If prevalence of disease is higher in exposed
individuals then the exposure may be the cause of disease
Pros: quick, cheap, yields prevalence Cons: not good in explaining causation
11

Cross-sectional designThe present
Risk factor;
Disease
Risk factor;
No disease
No risk factor;
Disease
No risk factor;
No diseasePopulation
1. Select a sample from the population
2. Measure predictor and outcome variables at the same time
Sample

Contingency (2 by 2) Table
Disease No disease
Exposed a b a + b
Non-exposed
c d c + d
a + c b + d a+b+c+d

Relative risk (RR)
Other name: Risk ratio Relative measure of association Ratio of risk of having disease in exposed group
and risk of having disease in non-exposed group
14
RR = Risk of having disease in exposed
Risk of having disease in unexposed

Prevalence ratio (PR)
Special type of RR for cross-sectional study Ratio of prevalence of disease in exposed group
and prevalence of disease in non-exposed group
15
PR = Prevalence of disease in exposed
Prevalence of disease in unexposed

PR in cross-sectional study
Disease No disease
Exposed a b a + b
Non-exposed
c d c + d
a + c b + d a+b+c+d
=a / (a + b)
c / (c + d)
PR = Prevalence of disease in exposed
Prevalence of disease in non-exposed

Cohort design
17
Prospective Retrospective

Prospective cohort study
Other names: follow-up study, longitudinal study Observe healthy subjects for a period of time If incidence of disease is higher in exposed
individuals then the exposure may be the cause of disease
Pros: good in explaining the causation, yields incidence,
Cons: expensive, take long time, need large sample size
18

Prospective cohort design
1. Select a sample from the population
2. Measure predictor variables
3. Follow-up the cohort
4. Measure outcome variables
Population
Sample
DiseaseNo
disease
DiseaseNo
diseaseRisk factor present
Risk factor absent
The presentThe future

Retrospective cohort study
Other name: historical cohort Assemble of cohort and exposure measurements
were done in the past The researcher measures or acquires incidence
data at present time Pros: quick, cheap Cons: availability and quality of data depend on the
others
20

Retrospective cohort design
1. Identify a cohort that has been assembled in the past
2. Collect data on predictor variables (measured in the past)
3. Follow-up the cohort
4. Collect data on outcome variables (measured in present)
Population
Sample
DiseaseNo
disease
DiseaseNo
diseaseRisk factor present
Risk factor absent
The pastThe present

Incidence rate ratio (IRR)
Special type of RR for cohort study Ratio of incidence of disease in exposed group and
incidence of disease in non-exposed group
22
IRR = Incidence of disease in exposed
Incidence of disease in unexposed

IRR in cohort study
Disease No disease
Exposed a b a + b
Un-
exposedc d c + d
a + c b + d a+b+c+d
IRR =Incidence of having disease in exposed
Incidence of having disease in non-exposed
=a / (a + b)
c / (c + d)

Case-control study
Other name: retrospective study Start with a group of patient (case) and then find
another group who are not sick (control) Ask both group about exposure to potential risk
factor in the past If case exposed more than control then the potential
risk factor may be the cause of disease Pros: quick, efficient, good for rare diseases Cons: prone to bias, no prevalence and incidence
24

Case-control design
Population
with disease
(cases)
DiseaseSample
of cases
Much large
population
without
disease
(controls)
No disease
Sample
of controls
Risk
Factor
present
Risk
Factor
absent
Risk
Factor
present
Risk
Factor
absent
The presentThe past
1. Select a sample from a population of people with the disease (cases)
2. Select a sample from a population at risk that is free of the disease (controls)
3. Measure predictor variables

Probability and Odds
Probabilities: proportion of chance of having interesting events out of all possibilities
Odds: ratio of chance of having interesting events over chance of having non-interesting events
Throwing a dice:- Probability of getting 1 = 1/6 - Odds of getting 1 = (1/6) / (5/6)
= 1/5
26

Probabilities and odds
Odds1
OddsobabilityPr;
obabilityPr1
obabilityPrOdds
Probability Odds0.001 0.001
0.01 0.010
0.02 0.020
0.05 0.053
0.10 0.111
0.20 0.250
0.25 0.333
0.50 1.00
0.80 4.00
0.90 9.00
0.98 49.00
0.99 99.00
0
0.2
0.4
0.6
0.8
1
1.2
1.4
1.6
0 0.1 0.2 0.3 0.4 0.5
Probability
Od
ds

Odds ratio (OR)
Since there is no prevalence or incidence in case-control study.
It is not possible to calculate RR. OR is used instead in case-control study
28
OR =Odds of exposed in a case
Odds of exposed in a control

Odds Ratio (OR)
Case Control
Exposed a b a + b
Un-
exposedc d c + d
a + c b + d a+b+c+d
OR =Odds of exposed in a case
Odds of exposed in a control
= a/c b/d = (a)(d)
(b)(c)
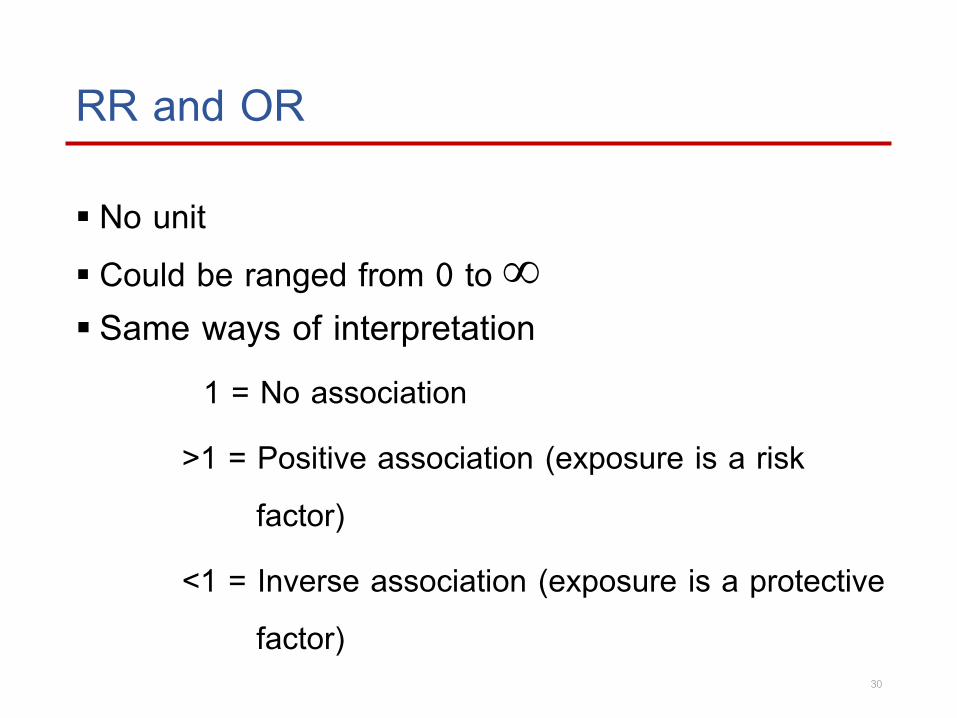
RR and OR
No unit Could be ranged from 0 to Same ways of interpretation
1 = No association>1 = Positive association (exposure is a risk
factor)<1 = Inverse association (exposure is a protective
factor)30

Quantitative research design
31
Observational Experimental

Experimental research (Clinical trial)
32
Prevention trial Therapeutic trial
Field trial Community

Prevention (primary prevention) trial
Experiment to find if an intervention helps risk of developing disease in healthy people
Field trial (Individual prevention trial): unit of measurement is individual
Community prevention trial: unit of measurement is group of people / community
33

Dr. Jonas Salk and Polio vaccine (1955)
Patients in iron lungs during 1952 epidemic

Therapeutic (Secondary prevention) trial
Experiment in patients who get sick with the disease of interest
Intervention could be new medication, surgery, etc. To see if the intervention help improve clinical course
or outcomes of treatment
35

Phases of clinical trial
animal/in vitro
14
Post marketing surveillance
2 3
Clinical study
Healthy volunteers10 -100
Pharmacokinetic/dynamic
Initial safety
Patients100-1,000
EfficacyFurther safety study
Patients1,000-10,000
Confirm efficacyRegister if success
RCT

Symbols use to explain the study designs
O Observation, Measure
X Intervention, Program
N No randomization
R Randomization

Studies without comparison
X O
•No control group
•Hard to conclude whether the improvement is the resultof the intervention
•Case study, case series

Studies with comparison: Historical Controls
X O
•Use patients and treatment in the past as control
•Differences may cause from better data collection, otherfactors that has changed through time
•Can be used in uniformly fatal disease (Rabies)
X O
TimelinePresentPast
InterventionControl

Studies with comparison: non-randomized design
•Simultaneous control group
•non-randomized, assignment system is predictable
•The results may be confound by other factors
N X ON O
Quasi experiment

Studies with comparison: Randomized controlled trial (RCT)
•Simultaneous control group
•Assignment system is unpredictable (randomized)
•No confounding by other factors if random properlyand sample size is large enough
R X OR O
•Current gold standard of clinical trial design

Randomized controlled trial (RCT)
Current gold standard of clinical study design Most phase III clinical trial are RCT Best design to explain cause and effect between
variables Characteristics
- Randomization- Control group comparison- Blinding
42

Randomized controlled trial (RCT)
Intervention
Control
Bad
Outc.
Bad
Outc.
Good
Outc.
Good
Outc.
Population
Sample
Randomize
The present The future
1. Select a sample from the population
2. Measure baseline variables
3. Randomize
4. Apply interventions (one should be a blinded placebo, if possible)
5. Follow up the cohorts
6. Measure outcome variables
Other clinical trial designs Run-in design Factorial design Crossover design Natural experiments

Run-in design Ask potential participants to take placebo for a period
of time (2-3 weeks) Invite only people who show are really commit, show
good compliance, and has discipline into the study Increase proportion of participants who complete the
study Improve efficiency of the study

Special designs: Factorial Study two treatments in
one study The mode of actions and
outcomes have to be independent
Effective and cost saving Burden of side effects in
‘cell a’
BothA and B
(cell a)
B only
(cell b)
A only
(cell c)
NeitherA nor B
(cell d)
+
+
-
-
Treatment A
TreatmentB

Special designs: Factorial
BothA and B
(cell a)
B only
(cell b)
A only
(cell c)
NeitherA nor B
(cell d)
+
+
-
-
Treatment A
TreatmentB
Hypothesis 1(compare cell a + bwith cell c + d)
Hypothesis 2(compare cell a + cwith cell b + d)

Special designs: Crossover
Participants serve as self-control Subjects are randomized to be in treatment or control
first After being observed for a certain period of time, the
patients are switched to the other therapy There must be enough of a washout period if there is a
carryover effect

Special designs: Natural experiment The researcher does not assign the exposure The intervention was done by the others Most textbooks don’t define this as real experiment
Clinical
studies of
atomic bomb victims

Limitations of Experimental studies
Expensive Take long time Ethical issues Not suitable for rare disease Difficulty in studying
- Rare events- Outcomes in distant future