research investment idea 06 may 2017 tata...
TRANSCRIPT

PCG RESEARCH INVESTMENT IDEA 06 May 2017
Tata Motors
Private Client Group - PCG RESEARCH P a g e | 1
Industry CMP Recommendation Buying Range Target Time Horizon
AUTO Rs. 420 BUY at CMP and add on
Declines Rs. 420-380 Rs. 498 12 Months
Updates Related to BS III Vehicles
HDFC Scrip Code TELLTD
BSE Code 500570
NSE Code TATAMOTORS
Bloomberg TTMT
CMP as on 05 May - 17
420
Equity Capital (Rs Cr) 679
Face Value (Rs) 2
Equity O/S (Cr) 289
Market Cap (Rs cr) 121200
Book Value (Rs) 269
Avg. 52 Week Volumes
8082270
52 Week High 599
52 Week Low 376
Shareholding Pattern (%)
Promoters 34.7
Institutions 56.9
Non Institutions 8.4
PCG Risk Rating* Yellow
* Refer to Rating explanation
Kushal Rughani [email protected]
Company Background
Tata Motors, a Tata Group enterprise is engaged in manufacturing of motor vehicles. The Company is
engaged mainly in the business of automobile products consisting of all types of commercial and passenger
vehicles, including financing of the vehicles sold by the Company. The Company's segments include
automotive operations and all other operations. The Company's automotive segment operations include all
activities relating to the development, design, manufacture, assembly and sale of vehicles, including vehicle
financing, as well as sale of related parts and accessories. In the automotive segment, the Company
manufactures and sells passenger cars, utility vehicles, light commercial vehicles, and medium and heavy
commercial vehicles. Company has its subsidiary Jaguar Land Rover (JLR) through which it sells Jaguar and
Land Rover cars across the world. The Company's all other operations segment mainly includes information
technology (IT) services, and machine tools and factory automation services. The Company operates in
over 160 countries across the world.
Investment Rationale
Tata Motors posted cumulative sales volumes of 5.43 lakhs in FY17
Cumulative sales (including exports) of the company for the fiscal was at 542,561 nos., higher by 6% over
511,705 vehicles, sold last year. Cumulative sales of commercial vehicles in the domestic market for the
fiscal was up by 1% at 385,373 nos. over last year. Passenger vehicles in the domestic market for the fiscal
were at 153,151, a growth of 22% compared to 125,946.
Aims Sales of 2.5 lakhs Passenger Vehicles in domestic market in FY18
Tata Motors has set an aggressive passenger vehicle sales target for 2017-18. The company aims to sell
250,000 units of cars and utility vehicles in the year FY18.
Tata Motors is hoping the domestic operations will be able to swing back to profitability by 2018-19. If the
company is able to meet the targets, the sales would be the highest in four years. The company had sold
3,71,350 passenger vehicle units in 2012-13.
In the year FY17, Tata Motors had sold 1,72,504 units, up 15% from a year ago, against 1,49,420 units a
year ago.
Investment Rationale:

PCG RESEARCH
Private Client Group - PCG RESEARCH P a g e | 2
Updates Related to BS III Vehicles
Tata Motors, the country’s largest commercial vehicle maker, said today that it has an unsold Bharat Stage
III (BS-3) stock of 15,000 trucks and buses which it intends to export, upgrade to BS-4 and dismantle for
other use.
Around 8,000-8,500 of the BS-3 lot will be exported to Nepal, Sri Lanka and Bangladesh on as-is-where-is-
basis, the shipments of which has already begun. About 90 percent of the remaining 6,500-7,000 will be
upgraded to BS-4, a senior company executive said today.
Of the 15,000 units about 4,000 are medium and heavy duty vehicles and the rest are small commercial
vehicles. Vehicles like Ace and Magic, which are SCVs, will be converted to BS IV.
Conference Call Updates
Management commented that the third quarter had been disappointing with both India business and
Jaguar Land Rover facing headwinds.
India business has gone deep into the red on account of lower M&HCV volumes and higher variable
marketing expenses.
India capex guidance has been increased to Rs 35bn-40bn for FY18/FY19.
Overall, 60% of the capex spend would be towards passenger vehicle segment while the balance
would be towards the commercial vehicle segment.
Free cash has been negative on a consolidated basis on account of weakness in the domestic
business.
Management continues to aspire to increase domestic business margins to higher levels in the coming
years.
Management has indicated that JLR related variable marketing expenses are expected to rise in CY17
vis-à-vis CY16 on account of increasing competitive intensity and moderating demand trends across
major markets like North America and China.

PCG RESEARCH
Private Client Group - PCG RESEARCH P a g e | 3
JLR sales volumes for Apr 2017
Jaguar Land Rover, the UK's leading manufacturer of premium luxury vehicles reported April sales of 40,385,
down 2.3% yoy. The company sold 219,891 vehicles in the first four months of 2017, up 9.9% compared to
the same period a year ago.
Retail sales for the month of April were up in North America (32.5%), China (10.1%) and Europe (2.7%), but
down in the UK (34.6%) and in other Overseas markets (19.7%) year-on-year.
JLR Numbers
Apr-17 Apr-16 YOY (%) Jan – Apr’17 YOY (%)
JLR 40385 41270 -2 219891 10
Jaguar 12310 7987 54 66279 75
Land Rover 28075 33283 16 153612 -5
Source: Company, HDFC sec Research
Highlights of the third quarter results
Domestic business recovery underway: The management indicated that the new launch of Hexa has received
good response, and has a waiting period of 2 months. The launch pipeline also looks strong with Tata Tigor
and Nexon. Overall growth momentum for tippers and buses is expected to continue in FY18. The
management targets to procure 60% market share (from ~55% currently) over the next 2 years, led by the
launch of the new Signa range of trucks.
JLR business setback: Management guided that the hedging losses of GBP 450mn could continue for the next
few quarters. Overall, the management has maintained its medium-term margin guidance of 14-15%.
However, in the short term, JLR will continue to face headwinds owing to currency hedges. Model mix is likely
to turn favourable as Discovery would be launched in Q4 FY17, thereby improving margins.
Tata Motors’ Q3 FY17 performance was disappointing due to weakness in both JLR as well as domestic
business. JLR’s EBITDA margin stood at 9.3%, down 500bps YoY impacted by an adverse product mix and
higher discounting (Discovery run-out in US). However, if revenue is adjusted to include forex hedging gains,
margins would be ~10.1%. The India business lost ground with an EBITDA margin of 1.5%, driven down by
a weak mix and higher discounts.
The management sounded confident of volume momentum sustaining in JLR/India, in the light of a strong
launch pipeline. However, in the near term, margins are likely to be under pressure. In India, the
management has taken steps to improve profitability and market share in the CV business.

PCG RESEARCH
Private Client Group - PCG RESEARCH P a g e | 4
Recommend BUY with TP of Rs 498
In FY17, Tata Motors has posted 6% volume growth in domestic market led by strong 22% rise from
passenger vehicles volumes while we expect the growth momentum to accelerate and see 11% cagr over
FY17-19E which would in turn drive profitability in the domestic business as well. We estimate 9% revenues
cagr led by healthy business growth from Domestic market and strong growth momentum from JLR sales
over FY16-19E.
JLR has young product portfolios especially in luxury SUV market. We expect recent launches and new
product pipeline from JLR to result in robust sales growth. Post its current capex cycle, we expect operating
leverage to kick-in from FY18. We expect 160bps expansion in operating margin led by operational efficiency
over the same period. We forecast 10% PAT cagr led by strong revenues and operating performance over
FY16-19E.
We recommend BUY on Tata Motors at CMP of Rs 420 and add on dips to Rs 380 with TP of Rs 498. The
stock trades at ~8.7x/~8x FY18E/19E EPS. Our SOTP-based valuation comes to Rs 498 (assigning 3.7x
FY19E EV/EBITDA to consolidated EBITDA; implied ~9.5x FY19E consol EPS). We are fairly confident on
strong domestic business turnaround and change in JLR growth fortune post SUV launches. Key risks to our
assumptions would be a) sharp slowdown in global and Chinese luxury car demand, b) lack of product
acceptability in domestic PV business and c) maintaining cost advantage in CV business post BS VI.

PCG RESEARCH
Private Client Group - PCG RESEARCH P a g e | 5
Quarterly Financials Snapshot (Consolidated)
Source: Company, HDFC sec Research
Margin Analysis (Consolidated)
3QFY17 3QFY16 YoY (bps) 2QFY17 QoQ (bps)
Material Expenses As % Of Net Sales 59.2 60.3 (108) 59.6 (35)
Employee Expenses As % Of Net Sales 10.4 10.3 14 10.3 12
Other Expenses As % Of Net Sales 21.5 15.2 626 19.4 204
EBITDA Margin (%) 8.8 14.2 (532) 10.7 (181)
Net Profit Margin (%) 380.3 15.8 36,454 43.2 33,712
Tax Rate (%) 0.2 4.9 (469) 1.3 (112) Source: Company, HDFC sec Research
Particulars 3QFY17 3QFY16 YoY (%) 2QFY17 QoQ (%)
Net Sales 675,313 722,564 (6.5) 659,004 2.5
Material Expenses 400,123 435,890 (8.2) 392,758 1.9
Employee Expenses 70,446 74,380 (5.3) 67,939 3.7
Other Operating Expenses 144,991 109,930 31.9 128,062 13.2
EBITDA 59,753 102,365 (41.6) 70,245 (14.9)
Depreciation 42,300 43,391 (2.5) 44,540 (5.0)
EBIT 17,454 58,974 (70.4) 25,705 (32.1)
Other Income 1,674 1,806 (7.3) 1,794 (6.7)
Interest Cost 8,707 10,915 (20.2) 10,249 (15.0)
Product Development Cost 8,141 8,565 (5.0) 7,420 9.7
PBT 2,280 41,300 (94.5) 9,831 (76.8)
Tax 8,670 6,513 33.1 4,246 104.2
RPAT (6,390) 34,787 (118.4) 5,585 (214.4)
Share of profits in associates/JVs 3,799 36 10,602.3 2,735 38.9
EO Items (Adj For Tax) (3,706) (457) 711.0 (162) 2,192.1
APAT 1,116 35,075 (96.8) 8,482 (86.8)
Adj EPS 0.3 10.3 (96.8) 2.5 (86.8)

PCG RESEARCH
Private Client Group - PCG RESEARCH P a g e | 6
Quarterly Financials Snapshot (Standalone)
(Rs mn) 3QFY17 3QFY16 YoY (%) 2QFY17 QoQ (%)
CV (Domestic, in units) 74,808 78,294 (4.5) 73,857 1.3
PV (Domestic, in units) 40,771 31,384 29.9 43,359 (6.0)
Exports (in units) 17,078 12,699 34.5 17,653 (3.3)
Total volumes (in units) 132,657 122,377 8.4 134,869 (1.6)
Net Sales 102,199 100,006 2.2 103,225 (1.0)
Material Expenses 74,791 71,596 4.5 74,225 0.8
Employee Expenses 8,454 7,811 8.2 8,817 (4.1)
Other Operating Expenses 17,420 14,913 16.8 16,422 6.1
EBITDA 1,534 5,686 (73.0) 3,761 (59.2)
Depreciation 7,290 6,054 20.4 7,186 1.4
EBIT (5,756) (368) 1,464.4 (3,425) 68.0
Other Income 940 4,733 (80.1) 1,460 (35.7)
Interest Cost 4,137 3,456 19.7 3,728 11.0
Product Development Cost 770 1,073 (28.3) 699 10.1
PBT (9,723) (164) 5,817.7 (6,391) 52.1
Tax 143 (24) (704.6) 218 (34.4)
RPAT (9,866) (141) 6,917.1 (6,610) 49.3
EO Items (Adj For Tax) 593 1,868 (68.3) (302) (296.3)
APAT (9,866) (141) 6,917.1 (6,610) 49.3
Adj EPS (3.1) (0.0) 6,917.1 (2.1) 49.3 Source: Company, HDFC sec Research

PCG RESEARCH
Private Client Group - PCG RESEARCH P a g e | 7
Quarterly Financials Snapshot (JLR - IFRS)
In GBP mn 3QFY17 3QFY16 YoY (%) 2QFY17 QoQ (%)
Retail Volumes (‘000 units) 901.4 137.7 554.9 142.5 532.8
Wholesale Volumes –Ex-CJLR (‘000 units) 129.8 137.6 (5.7) 124.2 4.5
Revenue 6,537 5,781 13.1 5,953 9.8
Material Expenses 3,869 3,496 10.7 3,527 9.7
Employee Expenses 648 582 11.3 585 10.8
Other Operating Expenses 1,788 1,192 50.0 1,597 12.0
Product Development Expense (379) (323) 17.3 (371) 2.2
EBITDA 611 834 (26.7) 615 (0.7)
Interest Cost 5 10 (50.0) 7 (28.6)
Depreciation 409 357 14.6 410 (0.2)
Debt/Unrealised MTM Loss/(Gain) (62) 20 (410.0) (50) 24.0
Share Of Profit/(Loss) From JV 35 22 59.1 33 6.1
PBT 294 469 (37.3) 281 4.6
Exceptional Item 85 30 183.3 (1) -
Tax 88 59 49.2 36 144.4
RPAT 206 410 (49.8) 245 (15.9)
APAT 291 440 (33.9) 244 19.3 Source: Company, HDFC sec Research

PCG RESEARCH
Private Client Group - PCG RESEARCH P a g e | 8
JLR: Key Financial Highlights / Model Assumptions in £Mn FY15 FY16 FY17E FY18E FY19E
Revenue 21,866 22,208 24,134 27,750 36,158 % YoY 12.8 1.6 8.7 15.0 30.3
Wholesales Volumes Incl CJLR (in '000) 471 544 532 586 655 % growth 9.5 15.6 (2.2) 10.2 11.6
Net ASP 46,875 43,602 46,057 46,805 55,240 % YoY 3.9 (7.0) 5.6 1.6 18.0 Expenditure
Material Cost 13,185 13,146 15,011 17,067 22,563 % Of Sales 60.3 59.2 62.2 61.5 62.4 Employee Cost 1,977 2,321 2,655 2,969 3,254 % Of Sales 9.0 10.5 11.0 10.7 9.0 Other Expenses 3,730 4,670 5,068 5,550 6,147 % Of Sales 17.1 21.0 21.0 20.0 17.0 Add back R&D Cost (1,411) (1,560) (1,750) (1,820) (1,500) % Of Sales (6.5) (7.0) (7.3) (6.6) (4.1) R&D Cost Expensed 253 318 350 364 270 Total 17,734 18,895 21,334 24,130 30,734 % Of Sales 81.1 85.1 88.4 87.0 85.0
EBITDA 4,132.0 3,313.0 2,799.8 3,620.5 5,424.3 EBITDA margin % 18.9 14.9 11.6 13.0 15.0
Other Income - - - - - Depreciation And Amortisation 1,051 1,403 1,655 1,834 2,153 Interest Expense 87 54 45 45 19 Forex gain/(loss) (373) (27) - - - Share Of Profit/(Loss) From Joint Venture (7) 66 111 170 - % Of Sales (0.0) 0.3 0.5 0.6 - PBT 2,614 1,895 1,211 1,911 3,253 % Of Sales 12.0 8.5 5.0 6.9 9.0 Tax 576 247 267 422 862
Tax rate % 22.0 13.0 22.0 22.1 26.5
APAT 2,038 1,649 944 1,489 2,391 % Of Sales 9.3 7.4 3.9 5.4 6.6 RPAT 2,038 1,326 944 1,489 2,391 % Of Sales 9.3 6.0 3.9 5.4 6.6 Source: Company, HDFC sec Research

PCG RESEARCH
Private Client Group - PCG RESEARCH P a g e | 9
Standalone: Key Financial Highlights/ Model Assumptions
Rs in Mn FY15 FY16 FY17E FY18E FY19E
Vehicle Sales (in units)
CV (Domestic) 329,943 327,730 330,211 360,783 408,961
PV (Domestic) 133,304 125,945 148,151 171,206 191,942
Exports 49,917 57,991 64,199 69,601 76,207
Total 513,164 511,666 542,561 601,590 677,111
% YoY (9.4) (0.3) 5.8 11.3 12.6
Net Sales 358,905 419,480 442,323 494,706 583,108
% YoY 5.8 16.9 5.4 11.8 17.9
Other Operating Income 4,042 4,218 4,640 5,104 5,614
Total Income From Operations 362,948 423,698 446,963 499,810 588,723
Expenditure
RM Cost 270,417 295,953 313,768 339,371 406,219
% Of Sales 75.3 70.6 70.9 68.6 69.7
Employee Cost 30,915 30,267 34,564 38,200 41,136
% Of Sales 8.6 7.2 7.8 7.7 7.1
Other 66,518 70,076 78,654 85,775 92,384
% Of Sales 18.5 16.7 17.8 17.3 15.8
Total Expenses 367,849 396,296 426,985 463,346 539,739
% Of Sales 94.0 85.7 87.5 84.9 83.8
EBITDA (4,901) 27,402 19,977 36,464 48,984
EBITDA Margin % (1.4) 6.5 4.5 7.4 8.4
Other Income 18,815 14,765 17,188 17,645 17,877
Product Development Expenses 4,375 4,246 4,500 5,000 5,600
Depreciation 26,032 24,538 27,492 29,960 29,920
Interest 16,117 14,811 13,196 12,889 9,966
PBT (Pre-exceptional Items) (32,610) (1,427) (8,023) 6,260 21,376
PBT (Pre-exceptional And JLR Dividend) (47,460) (15,745) (22,423) (8,140) 21,376 Source: Company, HDFC sec Research

PCG RESEARCH
Private Client Group - PCG RESEARCH P a g e | 10
SOTP Valuation
Valuation methodology Multiple Per share
Standalone EV / EBIDTA on Dec 18E 7.5 101
JLR EV / EBIDTA on Dec 18E 3.8 368
China JV EV / EBIDTA on Dec 18E 4.0 43
Other Subsidiaries P/E, P/BV on Dec 18E
28
Less: Net Automotive Debt
(42)
Target Price 498
Source: HDFC sec Research
Financial Summary
In Rs bn New
FY17E FY18E FY19E
JLR Volume(Units) 532,254 586,413 654,566
Standalone Volume(Units) 540,462 601,590 677,111
Net Sales 2,728 3,137 3,545
EBITDA 347 469 540
Adj PAT 117 168 184
Adj EPS 34.5 49.3 54.2
Source: HDFC sec Research
PCG RESEARCH
Private Client Group - PCG RESEARCH P a g e | 11
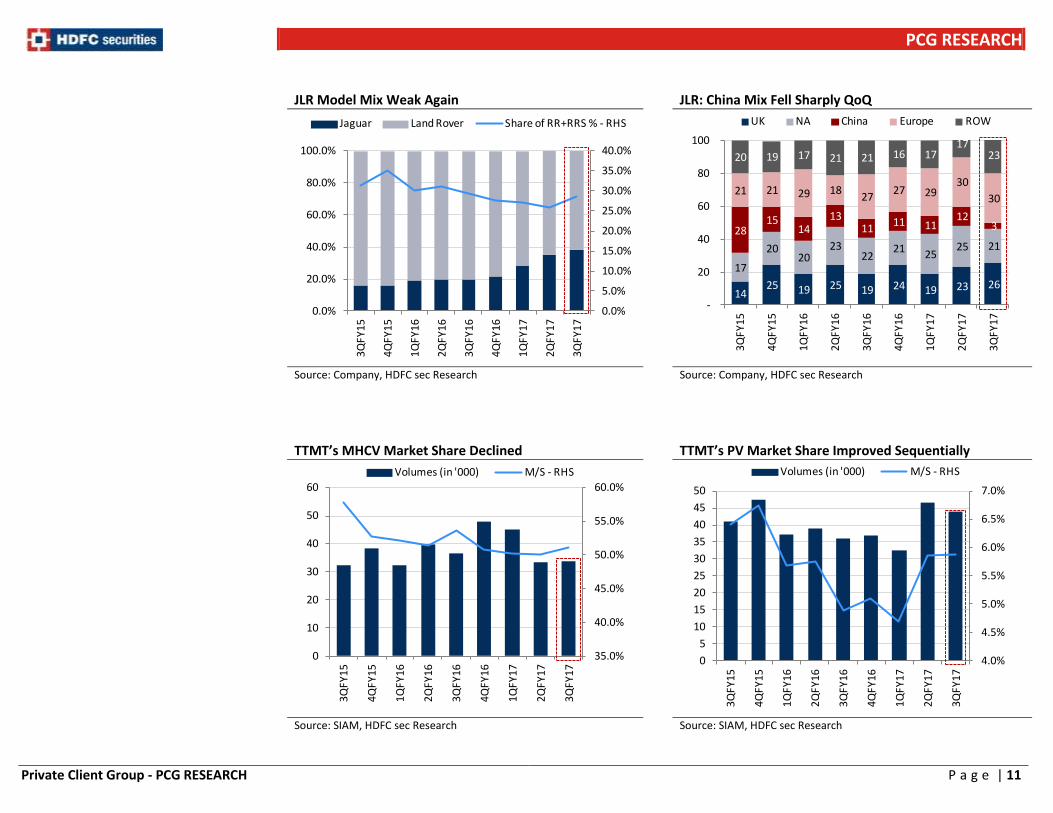
JLR Model Mix Weak Again JLR: China Mix Fell Sharply QoQ
Source: Company, HDFC sec Research Source: Company, HDFC sec Research
TTMT’s MHCV Market Share Declined
TTMT’s PV Market Share Improved Sequentially
Source: SIAM, HDFC sec Research Source: SIAM, HDFC sec Research
0.0%
5.0%
10.0%
15.0%
20.0%
25.0%
30.0%
35.0%
40.0%
0.0%
20.0%
40.0%
60.0%
80.0%
100.0%
3Q
FY1
5
4Q
FY1
5
1Q
FY1
6
2Q
FY1
6
3Q
FY1
6
4QFY
16
1Q
FY1
7
2Q
FY1
7
3Q
FY1
7
Jaguar Land Rover Share of RR+RRS % - RHS
14 25 19 25 19 24 19 23 26
17
20 20
23 22
21 25 25 21
28 15
14 13
11 11 11
12 3
21 21 29 18 27
27 29 30
30
20 19 17 21 21 16 17 17
23
-
20
40
60
80
100
3Q
FY1
5
4Q
FY1
5
1Q
FY1
6
2Q
FY1
6
3Q
FY1
6
4Q
FY1
6
1Q
FY1
7
2Q
FY1
7
3Q
FY1
7
UK NA China Europe ROW
35.0%
40.0%
45.0%
50.0%
55.0%
60.0%
0
10
20
30
40
50
60
3QFY
15
4QFY
15
1QFY
16
2QFY
16
3QFY
16
4QFY
16
1QFY
17
2QFY
17
3QFY
17
Volumes (in '000) M/S - RHS
4.0%
4.5%
5.0%
5.5%
6.0%
6.5%
7.0%
0
5
10
15
20
25
30
35
40
45
50
3QFY
15
4QFY
15
1QFY
16
2QFY
16
3QFY
16
4QFY
16
1QFY
17
2QFY
17
3QFY
17
Volumes (in '000) M/S - RHS

PCG RESEARCH
Private Client Group - PCG RESEARCH P a g e | 12
Income Statement (Consolidated) (Rs bn) FY15 FY16 FY17E FY18E FY19E
Net Revenues 2,628 2,756 2,728 3,137 3,545
Growth (%) 12.9 4.9 (1.0) 15.0 13.0
Material Expenses 1,599 1,624 1,618 1,829 2,081
Employee Expenses 255 292 295 329 362
Product Development Expenses
29 35 37 39 31
Other Operating Expenses 349 431 431 471 532
EBITDA 395 374 347 469 540
EBITDA Margin (%) 15.0 13.6 12.7 15.0 15.2
EBITDA Growth (%) 13.5 (5.4) (7.1) 35.1 15.1
Depreciation 134 170 182 204 241
EBIT 262 204 165 265 299
Other Income (Including EO Items)
9 10 9 10 11
Interest 49 46 39 41 43
PBT 222 167 136 234 267
Tax (Incl Deferred) 76 29 28 82 101
RPAT 146 140 98 137 147
EO (Loss) / Profit (Net Of Tax)
(5) (28) - - -
APAT 145 138 117 168 184
APAT Growth (%) (3.3) (4.8) (15.1) 43.1 10.0
Adjusted EPS (Rs) 45.0 40.6 34.5 49.3 54.2
EPS Growth (%) (3.3) (9.8) (15.1) 43.1 10.0
Source: Company, HDFC sec Research
Balance Sheet (Consolidated) (Rs bn) FY15 FY16 FY17E FY18E FY19E
SOURCES OF FUNDS
Share Capital – Equity 6 7 7 7 7
Reserves 556 801 908 1,064 1,236
Total Shareholders’ Funds 563 808 915 1,071 1,243
Minority Interest 4 9 10 10 12
Long-term Debt 736 705 735 752 722
Short-term Debt - - - - -
Total Debt 736 705 735 752 722
Net Deferred Taxes (14) 4 7 12 20
Long-term Provisions & Others 212 205 219 229 245
TOTAL SOURCES OF FUNDS 1,501 1,731 1,886 2,074 2,242
APPLICATION OF FUNDS
Net Block 838 1,003 1,193 1,358 1,455
CWIP 289 285 284 288 292
Goodwill 47 48 48 48 48
Investments 12 13 13 13 13
LT Loans & Advances 293 331 365 395 458
Total Non-current Assets 1,479 1,681 1,902 2,103 2,266
Inventories 293 334 379 424 496
Debtors 126 130 149 166 235
Cash & Equivalents 462 521 413 399 385
Total Current Assets 881 985 942 989 1,115
Creditors 858 935 958 1,018 1,140
Other Current Liabilities & Provns
Total Current Liabilities 858 935 958 1,018 1,140
Net Current Assets 22 50 (16) (29) (25)
TOTAL APPLICATION OF FUNDS 1,501 1,731 1,886 2,074 2,242
Source: Company, HDFC sec Research

PCG RESEARCH
Private Client Group - PCG RESEARCH P a g e | 13
Cash Flow Statement (Consolidated) (Rs bn) FY15 FY16 FY17E FY18E FY19E
Reported PBT 222 167 136 234 267
Non-operating & EO items (5) (28) - - -
Interest expenses 49 46 39 41 43
Depreciation 134 170 182 204 241
Working Capital Change 187 (14) (60) (22) (66)
Tax Paid (76) (29) (28) (82) (101)
OPERATING CASH FLOW ( a ) 510 313 268 375 384
Capex (281) (333) (370) (374) (342)
Free Cash Flow (FCF) 230 (20) (102) 1 42
Investments 1 0 - - -
Non-operating Income (7) 22 13 21 28
INVESTING CASH FLOW ( b ) (286) (311) (357) (353) (314)
Debt Issuance/(Repaid) 130 (31) 30 17 (30)
Interest Expenses (49) (46) (39) (41) (43)
FCFE 311 (98) (111) (23) (31)
Share Capital Issuance (233) 136 - - -
Dividend - (1) (10) (12) (12)
FINANCING CASH FLOW ( c ) (152) 57 (19) (36) (85)
NET CASH FLOW (a+b+c) 72 59 (107) (14) (14)
EO Items, Others (3) - - - -
Closing Cash & Equivalents 462 521 413 399 385
Source: Company, HDFC sec Research
Key Ratio (Consolidated) FY15 FY16 FY17E FY18E FY19E
PROFITABILITY (%)
GPM 39.1 41.1 40.7 41.7 41.3 EBITDA Margin 15.0 13.6 12.7 15.0 15.2 APAT Margin 5.5 5.0 4.3 5.3 5.2 RoE 23.8 20.1 13.6 16.9 15.9 RoIC (or Core RoCE) 17.0 14.9 9.5 11.0 10.7 RoCE 13.6 12.4 9.3 11.2 11.2 EFFICIENCY
Tax Rate (%) 34.4 17.2 20.9 35.0 37.9 Fixed Asset Turnover (x) 1.7 1.4 1.2 1.2 1.2 Inventory (days) 40.7 44.2 50.7 49.3 51.1 Debtors (days) 17.5 17.2 20.0 19.3 24.2 Payables (days) 119.2 123.8 128.2 118.4 117.4 Cash Conversion Cycle (days) (61.1) (62.4) (57.5) (49.8) (42.2) Debt/EBITDA (x) 1.9 1.9 2.1 1.6 1.3 Net D/E (x) 0.2 0.0 0.2 0.1 0.1 Interest Coverage (x) 5.4 4.4 4.3 6.5 7.0 PER SHARE DATA (Rs)
EPS 45.0 40.6 34.5 49.3 54.2 CEPS 78.8 75.0 80.0 100.4 114.6 Dividend - 0.2 2.5 3.0 3.0 Book Value 175 238 269 315 366 VALUATION
P/E (x) 9.5 10.7 12.5 8.7 7.9 P/BV (x) 2.5 1.8 1.6 1.4 1.2 EV/EBITDA (x) 4.6 4.9 6.1 4.2 3.1 EV/Revenues (x) 0.6 0.5 0.6 0.5 0.5 Source: Company, HDFC sec Research

PCG RESEARCH
Private Client Group - PCG RESEARCH P a g e | 14
Price Chart
100
200
300
400
500
600
700
Rating Definition:
Buy: Stock is expected to gain by 10% or more in the next 1 Year. Sell: Stock is expected to decline by 10% or more in the next 1 Year.

PCG RESEARCH
Private Client Group - PCG RESEARCH P a g e | 15
Rating Chart
R E T U R N
HIGH
MEDIUM
LOW
LOW MEDIUM HIGH
RISK
Ratings Explanation:
RATING Risk - Return BEAR CASE BASE CASE BULL CASE
BLUE LOW RISK - LOW RETURN STOCKS
IF RISKS MANIFEST PRICE CAN FALL 20% OR MORE
IF RISKS MANIFEST PRICE CAN FALL 15% & IF INVESTMENT RATIONALE FRUCTFIES PRICE CAN RISE BY 15%
IF INVESTMENT RATIONALE FRUCTFIES PRICE CAN RISE BY 20% OR MORE
YELLOW MEDIUM RISK - HIGH RETURN STOCKS
IF RISKS MANIFEST PRICE CAN FALL 35% OR MORE
IF RISKS MANIFEST PRICE CAN FALL 20% & IF INVESTMENT RATIONALE FRUCTFIES PRICE CAN RISE BY 30%
IF INVESTMENT RATIONALE FRUCTFIES PRICE CAN RISE BY 35% OR MORE
RED HIGH RISK - HIGH RETURN STOCKS
IF RISKS MANIFEST PRICE CAN FALL 50% OR MORE
IF RISKS MANIFEST PRICE CAN FALL 30% & IF INVESTMENT RATIONALE FRUCTFIES PRICE CAN RISE BY 30%
IF INVESTMENT RATIONALE FRUCTFIES PRICE CAN RISE BY 50% OR MORE

PCG RESEARCH
Private Client Group - PCG RESEARCH P a g e | 16
Disclosure: I, Kushal Rughani, MBA, author and the names subscribed to this report, hereby certify that all of the views expressed in this research report accurately reflect our views about the subject issuer(s) or securities. HSL has no material adverse disciplinary history as on the date of publication of this report. We also certify that no part of our compensation was, is, or will be directly or indirectly related to the specific recommendation(s) or view(s) in this report. Research Analyst or his/her relative or HDFC Securities Ltd. does not have any financial interest in the subject company. Also Research Analyst or his relative or HDFC Securities Ltd. or its Associate may have beneficial ownership of 1% or more in the subject company at the end of the month immediately preceding the date of publication of the Research Report. Further Research Analyst or his relative or HDFC Securities Ltd. or its associate does not have any material conflict of interest. Any holding in stock – No HDFC Securities Limited (HSL) is a SEBI Registered Research Analyst having registration no. INH000002475. Disclaimer: This report has been prepared by HDFC Securities Ltd and is meant for sole use by the recipient and not for circulation. The information and opinions contained herein have been compiled or arrived at, based upon information obtained in good faith from sources believed to be reliable. Such information has not been independently verified and no guaranty, representation of warranty, express or implied, is made as to its accuracy, completeness or correctness. All such information and opinions are subject to change without notice. This document is for information purposes only. Descriptions of any company or companies or their securities mentioned herein are not intended to be complete and this document is not, and should not be construed as an offer or solicitation of an offer, to buy or sell any securities or other financial instruments. This report is not directed to, or intended for display, downloading, printing, reproducing or for distribution to or use by, any person or entity who is a citizen or resident or located in any locality, state, country or other jurisdiction where such distribution, publication, reproduction, availability or use would be contrary to law or regulation or what would subject HSL or its affiliates to any registration or licensing requirement within such jurisdiction. If this report is inadvertently send or has reached any individual in such country, especially, USA, the same may be ignored and brought to the attention of the sender. This document may not be reproduced, distributed or published for any purposes without prior written approval of HSL. Foreign currencies denominated securities, wherever mentioned, are subject to exchange rate fluctuations, which could have an adverse effect on their value or price, or the income derived from them. In addition, investors in securities such as ADRs, the values of which are influenced by foreign currencies effectively assume currency risk. It should not be considered to be taken as an offer to sell or a solicitation to buy any security. HSL may from time to time solicit from, or perform broking, or other services for, any company mentioned in this mail and/or its attachments. HSL and its affiliated company(ies), their directors and employees may; (a) from time to time, have a long or short position in, and buy or sell the securities of the company(ies) mentioned herein or (b) be engaged in any other transaction involving such securities and earn brokerage or other compensation or act as a market maker in the financial instruments of the company(ies) discussed herein or act as an advisor or lender/borrower to such company(ies) or may have any other potential conflict of interests with respect to any recommendation and other related information and opinions. HSL, its directors, analysts or employees do not take any responsibility, financial or otherwise, of the losses or the damages sustained due to the investments made or any action taken on basis of this report, including but not restricted to, fluctuation in the prices of shares and bonds, changes in the currency rates, diminution in the NAVs, reduction in the dividend or income, etc. HSL and other group companies, its directors, associates, employees may have various positions in any of the stocks, securities and financial instruments dealt in the report, or may make sell or purchase or other deals in these securities from time to time or may deal in other securities of the companies / organizations described in this report. HSL or its associates might have managed or co-managed public offering of securities for the subject company or might have been mandated by the subject company for any other assignment in the past twelve months. HSL or its associates might have received any compensation from the companies mentioned in the report during the period preceding twelve months from t date of this report for services in respect of managing or co-managing public offerings, corporate finance, investment banking or merchant banking, brokerage services or other advisory service in a merger or specific transaction in the normal course of business. HSL or its analysts did not receive any compensation or other benefits from the companies mentioned in the report or third party in connection with preparation of the research report. Accordingly, neither HSL nor Research Analysts have any material conflict of interest at the time of publication of this report. Compensation of our Research Analysts is not based on any specific merchant banking, investment banking or brokerage service transactions. HSL may have issued other reports that are inconsistent with and reach different conclusion from the information presented in this report. Research entity has not been engaged in market making activity for the subject company. Research analyst has not served as an officer, director or employee of the subject company. We have not received any compensation/benefits from the subject company or third party in connection with the Research Report. HDFC Securities Limited, SEBI Reg. No.: NSE-INB/F/E 231109431, BSE-INB/F 011109437, AMFI Reg. No. ARN: 13549, PFRDA Reg. No. POP: 04102015, IRDA Corporate Agent License No.: HDF 2806925/HDF C000222657, SEBI Research Analyst Reg. No.: INH000002475, CIN - U67120MH2000PLC152193 Mutual Funds Investments are subject to market risk. Please read the offer and scheme related documents carefully before investing. HDFC securities Limited, I Think Techno Campus, Building - B, "Alpha", Office Floor 8, Near Kanjurmarg Station, Opp. Crompton Greaves, Kanjurmarg (East), Mumbai 400 042 Phone: (022) 3075 3400 Fax: (022) 2496 5066 Compliance Officer: Binkle R. Oza Email: [email protected] Phone: (022) 3045 3600