research institute for housing america special ... - mba…
TRANSCRIPT

housingamerica.org
ONE VOICE. ONE VISION. ONE RESOURCE.
RESEARCH INSTITUTE FOR HOUSING AMERICA SPECIAL REPORT
Housing-Related Financial Distress During the PandemicGary V. Engelhardt and Michael D. Eriksen
17775

RESEARCH INSTITUTE FOR HOUSING AMERICA SPECIAL REPORT
Housing-Related Financial Distress During the Pandemic
Gary V. Engelhardt and Michael D. Eriksen
Copyright © September 2020 by Mortgage Bankers Association. All Rights Reserved. Copying, selling or otherwise distributing copies and / or creating derivative works for commercial purposes is strictly prohibited. Although significant efforts have been used in preparing this report, MBA makes no representations or warranties with respect to the accuracy and completeness of the contents. If legal advice or other expert assistance is needed, competent professionals should be consulted.

RESEARCH INSTITUTE FOR HOUSING AMERICA
Board of TrusTees
Michael FratantoniMBA Senior Vice President and Chief Economist
Michael BriggsMBA General Counsel
Lisa HaynesMBA Chief Financial Officer
TrusT adminisTraTor
Michael FratantoniMBA Senior Vice President and Chief Economist
execuTive direcTor
Edward SeilerMBA Associate Vice President of Research and Economics
indusTry advisory Board
Cheryl FeltgenArch Mortgage Insurance Company
Hamilton FoutFannie Mae
Jonathan GlowackiMilliman
Jason HobermanCiti

HOUSING-RELATED FINANCIAL DISTRESS DURING THE PANDEMIC 1 © Mortgage Bankers Association September 2020. All rights reserved.
Executive Summary
The COVID-19 pandemic has had a profound impact on public health and the national economy. In the six-month span from January 2020 to the present, the country has gone from an historically low unemployment rate of 3.6% to an economy in freefall in the spring. With initial federal stimulus measures largely having run their course and a rising wave of COVID cases in June and July in the South and West, for many, hopes for a quick recovery have been dashed. Of concern for the housing and mortgage industries specifically and policy makers more generally is the ability of American families to sustain their monthly payment obligations were the recovery to be protracted.
Against this backdrop, this report provides evidence on the rent, mortgage, and student loan payment patterns from the second quarter of 2020, using innovative new household survey data from the Understanding America Survey (UAS), an internet panel survey of over 8,000 households fielded every two weeks and specially tailored to study the impact of the coronavirus. It provides close to real-time economic data on the rapidly evolving financial consequences of the pandemic.
Unlike other data sources often cited by the media and policy advocates, such as the Census Household Pulse Survey, which is a weekly cross-sectional snapshot of American households, our novel longitudinal data allow us to follow the same set of households from before the outbreak, all the way through the pandemic. We track changes in employment, working hours, and the receipt of stimulus and unemployment insurance benefits as the pandemic progresses, and then link those to changes in payment behavior for monthly rent, mortgages, and student loans. This gives a fuller picture of the financial impact of the early stages of the pandemic and complements studies based on administrative and proprietary data. Our findings will be of interest to those tracking trends in the housing and mort-gage industries, policy makers, advocates, and the media.
There are a number of principal findings.
FOR RENTERS:• The rate of job loss for renters was high at the beginning
of April, and then declined steeply. Since the end of April, the percentage reporting having lost a job in the past two weeks has held steady around 2.5%.
• The pattern of hours’ reductions for renters who remained employed followed that for job losses: a high incidence in early April, with a decline throughout the quarter. By the end of the quarter, about 9% of employed renters were working fewer hours than at the beginning of the pandemic.
• Renters receiving unemployment insurance (UI) benefits rose from 3% at the beginning of April to 12% by the end of June. Renters received the bulk of their federal stimulus payments from April 15–May 31.
• These changes in economic circumstances affected rental payment patterns over the quarter. We find that 10.5% of renters missed one payment over the quarter, 4.5% missed two payments and 2.7% missed all three payments. Taking these together, the percentage of renters reporting missed payments by week was pretty constant over the quarter at around 11%.

HOUSING-RELATED FINANCIAL DISTRESS DURING THE PANDEMIC 2 © Mortgage Bankers Association September 2020. All rights reserved.
• Property owners played a key role in helping renters to navigate payments during the quarter. Throughout the quarter, about 15% of renters received permission from their landlord to delay or reduce their monthly payment, and 37% of this subgroup of renters took up this offer and delayed or reduced a payment. Among those renters not receiving permission, only 6.7% missed a payment.
• By race and ethnicity, the percentage of renters report-ing missed payments was on average over the quarter 14.2% for Blacks, 10.2% of Asian/Hawaiian/Pacific Island-ers, 4.8% for Native Americans, 10% for Whites, 12.5% for those of mixed race, 9.1% for White Non-Latinx, and 13.9% for Latinx.
• Our findings on the timing of rental payments are largely consistent with those from the National Multifamily Hous-ing Council’s Rent Tracker, and both sources produce substantially smaller estimates of late rental payments than the Census Household Pulse Survey. One reason is that many renters in the UAS who miss a payment early in the month eventually pay by the end of the month, consistent with payment patterns in the Rent Tracker data. These effects cannot be measured in the House-hold Pulse Survey, each wave of which is an independent cross-sectional survey. Our results suggest distress in the rental housing market is less widespread than found in studies using those Census data.
• In aggregate, rental property owners lost as much as $9.1B in the second quarter revenue from missed rent payments.
FOR HOMEOWNERS WITH MORTGAGES (MORTGAGORS):• The rate of job loss for mortgagors was high at the
beginning of April, and then declined steeply. Since the end of April, the percentage reporting having lost a job in the past two weeks has held steady around 1.5%.
• The pattern of hours’ reductions for mortgagors who remained employed followed that for job losses: a high incidence in early April, with a decline throughout the quarter. By the end of the quarter, about 8% of employed mortgagors were working fewer hours than at the begin-ning of the pandemic.
• Mortgagors receiving unemployment insurance (UI) benefits rose from 3% at the beginning of April to 6% by the end of June, substantially lower than for renters. Mortgagors received the bulk of their federal stimulus payments from April 15–June 24.
• We find that 5% of mortgagors missed one payment over the quarter, 2.8% missed two payments and 3% missed all three payments. Taking these together, the percentage of mortgagors reporting missed payments by week was pretty constant over the quarter at around 8%, which was consistent with the MBA’s National Delin-quency Report data.
• Throughout the quarter, about 20% of mortgagors received permission from their lender to delay or reduce their monthly payment, and 31% of this subgroup of mortgagors took up this offer and delayed or reduced a payment. This is consistent with MBA’s Weekly Forbear-ance and Call Volume Survey data. Of those mortgagors not receiving permission, only 3.3% missed a payment.
• By race and ethnicity, the percentage of mortgagors reporting missed payments was on average over the quarter 14.7% for Blacks, 9.1% of Asian/Hawaiian/Pacific Islanders, 1.4% for Native Americans, 7.4% for Whites, 6.6% for those of mixed race, 6.3% for White Non-Latinx, and 12.5% for Latinx.
• In aggregate, total missed mortgage payments were as much as $16.3B in the quarter.
FOR STUDENT LOAN BORROWERS:• The rate of job loss for borrowers was high at the begin-
ning of April, and then declined steeply. Since the end of April, the percentage reporting having lost a job in the past two weeks has held steady around 2%. Borrowers appear to have had worse job-market outcomes during the pandemic: reported job losses were higher for bor-rowers than for renters and mortgagors.
• The pattern of hours’ reductions for borrowers who remained employed followed that for job losses: a high incidence in early April, with a gradual decline through-out the quarter. By the end of the quarter, about 10% of employed borrowers were working fewer hours than at the beginning of the pandemic.
• Borrowers receiving unemployment insurance (UI) ben-efits rose from 3% at the beginning of April to 15% by the end of June. Borrowers received the bulk of their federal stimulus payments from April 15–June 24.

HOUSING-RELATED FINANCIAL DISTRESS DURING THE PANDEMIC 3 © Mortgage Bankers Association September 2020. All rights reserved.
• These changes in economic circumstances affected student loan payment patterns over the quarter. We find that 19.3% of student loan borrowers missed one pay-ment over the quarter, 16.4% missed two payments and 12.9% missed all three payments. Taking these together, the percentage of borrowers reporting missed payments by week was pretty constant over the quarter at around 46%, a substantial drop-off in student loan payments.
• Throughout the quarter, about 65% of borrowers received permission from their lender to delay or reduce their monthly payment, and 57% of this subgroup of borrowers took up this offer and delayed or reduced a payment. Of those borrowers not receiving permission, 30.6% missed a payment.
• By race and ethnicity, the percentage of borrowers report-ing missed student loan payments was on average over the quarter 54.5% for Blacks, 45% of Asian/Hawaiian/Pacific Islanders, 37.1% for Native Americans, 44.4% for Whites, 53.8% for those of mixed race, 42.3% for White Non-Latinx, and 49.7% for Latinx.
• In aggregate, 30.2 million individuals missed at least one student loan payment since the beginning of the pandemic.

HOUSING-RELATED FINANCIAL DISTRESS DURING THE PANDEMIC 4 © Mortgage Bankers Association September 2020. All rights reserved.
Acknowledgements
The project described in this paper relies on data from survey(s) administered by the Understanding America Study, which is maintained by the Center for Economic and Social Research (CESR) at the University of Southern California. The content of this paper is solely the responsibility of the authors and does not necessarily represent the official views of USC or UAS. The collection of the UAS COVID-19 tracking data is supported in part by the Bill & Melinda Gates Foundation and by grant U01AG054580 from the National Institute on Aging.

HOUSING-RELATED FINANCIAL DISTRESS DURING THE PANDEMIC 5 © Mortgage Bankers Association September 2020. All rights reserved.
About the Authors
Gary V. Engelhardt is Professor of Economics in the Maxwell School of Citizenship and Public Affairs at Syracuse University, and a Faculty Associate in the Syracuse University Aging Studies Institute. He holds a B.A. in economics from Carleton College and a Ph.D. in economics from the Massachusetts Institute of Technology.
Dr. Engelhardt’s specialties are in the economics of aging, household saving, pensions, Social Security, taxation, and hous-ing markets. His current research focuses on three areas: the impact of Social Security on economic well-being in retire-ment; the impact of population aging on housing markets; and the evaluation of field experiments in household saving and financial behavior. He is an associate editor of the Journal of Pension Economics and Finance, and teaches graduate and undergraduate courses in public economics, applied econometrics, and program evaluation.
His work and commentary have been featured nationally, including in The Wall Street Journal, New York Times, Washington Post, Chicago Tribune, Los Angeles Times, Fox News, CNBC, MSNBC, C-SPAN, National Public Radio’s Morning Edition, and American Public Media’s Marketplace.
Michael D. Eriksen is Associate Professor of Real Estate at the University of Cincinnati. He holds a bachelor’s degree in economics and biology from Gonzaga University, and a Ph.D. in economics from Syracuse University. He was previously on the faculty at the University of Georgia and Texas Tech University.
Dr. Eriksen’s research focuses on low-income housing markets, and he has worked on projects concerning the Low-Income Housing Tax Credit program, housing vouchers, home safety modifications, and homeownership assistance grants. That research has appeared in the Journal of Public Economics, American Economic Journal: Economic Policy, Journal of Urban Economics, and Real Estate Economics. His work on fall prevention among the elderly won the 2014 best paper on senior housing award sponsored by the National Investment Center for Senior Housing.
Michael has received financial support for his research from the John D. and Catherine T. MacArthur Foundation, the National Institutes of Health, and the U.S. Department of Housing and Urban Development. His research has also been featured in the Wall Street Journal, Frontline, National Public Radio’s All Things Considered, Money Magazine, Atlanta Journal-Constitution, and Moneywatch. He has presented his research to policymakers, scholars, and advocates at the Congressional Budget Office, Department of Housing and Urban Development, Government Accountability Office, Urban Institute, American Enterprise Institute, AARP Foundation, and Fannie Mae.

HOUSING-RELATED FINANCIAL DISTRESS DURING THE PANDEMIC 6 © Mortgage Bankers Association September 2020. All rights reserved.
List of Figures
1.1 National 7-Day Moving Average of Confirmed COVID-19 Cases and Initial Unemployment Insurance Claims by Week
1.2 National 7-Day Moving Average of Confirmed COVID-19 Deaths and Continued Unemployment Insurance Claims by Week
1.3 7-Day Moving Average of Confirmed COVID-19 Deaths for Selected States by Week
1.4 Initial Unemployment Insurance Claims as a Percent of Covered Employment for Selected States by Week
2.1 Percent Receiving Permission from Landlord to Delay or Reduce Rent Payment by Week
2.2 Percent of Renters by Week Who Reported a Missed Rent Payment in the Last 30 Days
2.3 Percent of Renters with Recent Job Loss and Reduction in Working Hours by Week
2.4 Percent of Renters Receiving Unemployment Insurance and Stimulus Payments by Week
2.5 Cumulative Probability of Rent Payment by Month and Day
3.1 Percent Receiving Permission from Lender to Delay or Reduce Mortgage Payment by Week
3.2 Percent of Mortgagors by Week Who Reported a Missed Payment in the Last 30 Days
3.3 Percent of Mortgagors with Recent Job Loss and Reduction in Working Hours by Week
3.4 Percent of Mortgagors Receiving Unemployment Insurance and Stimulus Payments by Week
4.1 Percent with Student Loans Who Received Permission from Lender to Delay or Reduce Student Loan Payment by Week
4.2 Percent with Student Loans by Week Who Reported a Missed Payment in the Last 30 Days
4.3 Percent with Student Loans with Recent Job Loss and Reduction in Working Hours by Week
4.4 Percent with Student Loans Receiving Unemployment Insurance and Stimulus Payments by Week

HOUSING-RELATED FINANCIAL DISTRESS DURING THE PANDEMIC 7 © Mortgage Bankers Association September 2020. All rights reserved.
List of Tables
1.1 Date of Adoption of Selected Policies by State
1.2 Timing of the UAS Surveys Used in the Analysis
2.1 Selected Summary Statistics on Pre-Pandemic Demographic and Economic Characteristics for All Renters under Age 65 in Non-Subsidized Units
2.2 Cumulative Percentage of Rent Payments Made by Day of the Month from the National Multifamily Housing Council’s Rent Payment Tracker, by Month and Year
2.3 Proportion of Renters under Age 65 in Non-Subsidized Units Who Missed Rent Payments by Permission to Delay or Reduce Payment, for All Renters and by Selected Race and Ethnicity Group
2.4 Estimated Impacts of Selected Economic and Policy Variables on Rental Payment Time, All Renters under Age 65 in Non-Subsidized Units
2.5 Estimated Impacts of Selected Economic and Policy Variables on Rental Payment Time, Renters under Age 65 in Non-Subsidized Units Not Receiving Permission to Delay or Reduce Rent Payment
2.6 Summary of Missed Rent Payments in the Second Quarter, All Renters under Age 65 in Non-Subsidized Units
3.1 Selected Summary Statistics on Pre-Pandemic Demographic and Economic Characteristics for Mortgagors
3.2 Proportion of Mortgagors Who Missed Payments by Permission to Delay or Reduce Payment, for All Mortgagors and by Selected Race and Ethnicity Group
3.3 Summary of Missed Mortgage Payments in the Second Quarter
4.1 Selected Summary Statistics on Pre-Pandemic Demographic and Economic Characteristics for Student Loan Borrowers
4.2 Proportion of Student Loan Borrowers Who Missed Payments by Permission to Delay or Reduce Payment, for All Borrowers and by Selected Race and Ethnicity Group
4.3 Summary of Missed Student Loan Payments in the Second Quarter

HOUSING-RELATED FINANCIAL DISTRESS DURING THE PANDEMIC 8 © Mortgage Bankers Association September 2020. All rights reserved.
Introduction
The COVID-19 pandemic has had a profound impact on public health and the national economy. In the six-month span from January 2020 to the end of June, the country has gone from an historically low unemployment rate of 3.6% to an economy in freefall in the spring, with an unemployment rate of 14.7% in April and then a stubborn decline to 13.3% in May, 11.1% in June, and 10.2% in July. With federal stimulus measures largely having run their course and a rising wave of COVID cases in June and July in the South and West, for many, hopes for a quick recovery have been dashed.
Of concern for the housing and mortgage industries spe-cifically and policy makers more generally is the ability of American families to sustain their monthly payment obli-gations were the recovery to be protracted. The historical record from other recessions, though not fully comparable in all dimensions to the breathtaking speed and depth of this downturn, suggests cause for concern.
Against this backdrop, this report provides evidence on the rent, mortgage, and student loan payment patterns from the second quarter of 2020, using innovative household survey data from the Understanding America Survey (UAS), an internet panel survey of over 8,000 households fielded every two weeks and specially tailored to study the impact of the coronavirus. It provides close to real-time economic data on the rapidly evolving financial consequences of the pandemic.
Unlike other data sources often cited by the media and policy advocates, such as the Census Household Pulse Survey, which is a weekly cross-sectional snapshot of American households, our novel longitudinal data allow us to follow the same set of households from before the outbreak, all the way through the pandemic. We track changes in employment, working hours, and the receipt of stimulus and unemployment insurance benefits as the pandemic progresses, and then link those to changes in payment behavior for monthly rent, mortgages, and student loans. This gives a more robust picture of the financial impact of the early stages of the pandemic and complements studies based on administrative and proprietary data. Our findings will be of interest to those tracking trends in the housing and mortgage industries, policy makers, advocates, and the media.
There are a number of principal findings. There was signifi-cant deterioration of the job market for households who rent their primary residence. The rate of job loss for renters was high at the beginning of April, and then declined steeply. Since the end of April, the percentage reporting having lost a job in the past two weeks has held steady around 2.5%. The pattern of hours’ reductions for renters who remained employed has followed that for job losses. By the end of the quarter, about 9% of employed renters were working fewer hours than at the beginning of the pandemic. Renters receiv-ing unemployment insurance (UI) benefits rose from 3% at the beginning of April to 12% by the end of June. Renters received the bulk of their federal stimulus payments from April 15–May 31, so that relief already has run its course in the rental market.
These changes in economic circumstances affected rental payment patterns over the quarter. We find that 10.5% of renters missed one payment over the quarter, 4.5% missed two payments and 2.7% missed all three payments. Taking these together, the percentage of renters reporting missed payments by week was pretty constant over the quarter at around 11%. In aggregate, rental property owners lost as much as $9.1B in the second quarter revenue from missed rent payments. By race and ethnicity, the percentage of renters reporting missed payments was on average over the quarter 14.2% for Blacks, 10.2% of Asian/Hawaiian/Pacific Islanders, 4.8% for Native Americans, 10% for Whites, 12.5% for those of mixed race, 9.1% for White Non-Latinx, and 13.9% for Latinx.

HOUSING-RELATED FINANCIAL DISTRESS DURING THE PANDEMIC 9 © Mortgage Bankers Association September 2020. All rights reserved.
Our findings on the timing of rental payments are largely consistent with those from the National Multifamily Housing Council’s Rent Tracker, and both sources produce substan-tially smaller estimates of late rental payments than the Census Household Pulse Survey. One reason is that many renters in the UAS who miss a payment early in the month eventually pay by the end of the month, consistent with payment patterns in the Rent Tracker data. These effects cannot be measured in the Household Pulse Survey, each wave of which is an independent cross-sectional survey. Our results suggest distress in the rental housing market is less widespread than found in studies using those Census data.
Property owners played a key role in helping renters to navigate payments during the quarter. Throughout the quarter, about 15% of renters received permission from their landlord to delay or reduce their monthly payment, and 37% of this subgroup of renters took up this offer and delayed or reduced a payment. Among those renters not receiving permission, only 6.7% missed a payment. Overall, households with low pre-pandemic incomes, those with little access to cash reserves, and those permitted to delay or reduce pay-ments were the most likely to miss payments. Declines in employment from layoffs and reductions in working hours accounted for a small share of missed rent payments. Policies to stop evictions had little discernible impact on the timing and incidence of missed payments, once other factors like those listed above, were taken into account.
For homeowners with a mortgage (mortgagors), the labor-market decline, though substantial, was not as bad as for renters. The rate of job loss was high at the beginning of April, and then declined steeply. Since the end of April, the percentage reporting having lost a job in the past two weeks has held steady around 1.5%. By the end of the quar-ter, about 8% of employed mortgagors were working fewer hours than at the beginning of the pandemic. Mortgagors receiving unemployment insurance (UI) benefits rose from 3% at the beginning of April to 6% by the end of June, substantially lower than for renters. They received the bulk of their federal stimulus payments from April 15–June 24.
We find that 5% of mortgagors missed one payment over the quarter, 2.8% missed two payments and 3% missed all three payments. Taking these together, the percentage of mortgagors reporting missed payments by week was pretty constant over the quarter at around 8%, which was consistent with the MBA’s National Delinquency Report data. Throughout the quarter, about 20% of mortgagors received permission from their lender to delay or reduce their monthly payment, and 31% of this subgroup of mortgagors took up this offer and delayed or reduced a payment. This is consistent with MBA’s Weekly Forbearance and Call Volume Survey data. Of those mortgagors not receiving permission, only 3.3% missed a payment. By race and ethnicity, the percentage of mortgagors reporting missed payments was on average over the quarter 14.7% for Blacks, 9.1% of Asian/Hawaiian/
Pacific Islanders, 1.4% for Native Americans, 7.4% for Whites, 6.6% for those of mixed race, 6.3% for White Non-Latinx, and 12.5% for Latinx. In aggregate, total missed mortgage payments were as much as $16.3B in the quarter.
Of the three groups studied, student loan borrowers by far had the worst job-market outcomes during the pandemic. The rate of job loss for borrowers was high at the beginning of April, and then declined steeply. The pattern of hours’ reductions for borrowers who remained employed followed that for job losses: a high incidence in early April, with a gradual decline throughout the quarter. By the end of the quarter, about 10% of employed borrowers were working fewer hours than at the beginning of the pandemic. Bor-rowers receiving unemployment insurance (UI) benefits rose from 3% at the beginning of April to 15% by the end of June. Borrowers received the bulk of their federal stimulus payments from April 15–June 24.
These changes in economic circumstances affected student loan payment patterns over the quarter. We find that 19.3% of student loan borrowers missed one payment over the quarter, 16.4% missed two payments and 12.9% missed all three payments. Taking these together, the percentage of borrowers reporting missed payments by week was pretty constant over the quarter at around 46%, a substantial drop-off in student loan payments. Throughout the quarter, about 65% of borrowers received permission from their lender to delay or reduce their monthly payment, and 57% of this subgroup of borrowers took up this offer and delayed or reduced a payment. Of those borrowers not receiving permission, 30.6% missed a payment. By race and ethnicity, the percentage of borrowers reporting missed student loan payments was on average over the quarter 54.5% for Blacks, 45% of Asian/Hawaiian/Pacific Islanders, 37.1% for Native Americans, 44.4% for Whites, 53.8% for those of mixed race, 42.3% for White Non-Latinx, and 49.7% for Latinx. As a sign of the severity of the problems in the student debt market, in aggregate 30.2 million individuals missed at least one student loan payment since the beginning of the pandemic.
The report is organized as follows. The first section provides background on the evolution of outbreak across space and time in the United States and introduces the UAS surveys. The next three sections use the UAS data to analyze the timing and determinants of missed payments for renters, homeowners with mortgages, and student loan borrowers, respectively. There is a brief conclusion.

HOUSING-RELATED FINANCIAL DISTRESS DURING THE PANDEMIC 10 © Mortgage Bankers Association September 2020. All rights reserved.
Background
Figure 1.1 shows the national seven-day moving-average of confirmed COVID-19 cases per 100,000 population for each week from the onset of the outbreak in the United States through the middle of July (measured on the left-hand vertical axis). These data come from the Johns Hopkins University Coronavirus Resource Center. Confirmed cases are a widely used metric for the spread of the novel coronavirus. Also plotted are the national new unemployment insurance (UI) claims per capita by week (in millions, measured on the right-hand vertical axis). These are from the U.S. Department of Labor. Cases and claims take off starting March 11. Initial claims peak in the beginning of April as public health mitigation effects begin to take hold. Cases reach a spring peak at the same time, decline, then rise rapidly in the summer.
As COVID testing has not been uniform across space and time in the country, Figure 1.2 instead uses the confirmed death rate (measured as deaths per 100,000 residents), which is a more accurate indicator of the depth of the public health crisis. Deaths take off in mid-March and peak in mid-April, reflecting the widely publicized lag between initial infection and death. Deaths have been relatively stable across the summer, but given the large rise in summer cases in Figure 1.1 and the lag between initial infection and mortality, deaths would be expected to rise later in the summer.
Also plotted are national continued UI claims, which is a measure of the total number of workers receiving benefits. Continued claims track deaths closely and remain high through the summer, reflecting the slow recovery of the labor market in the face of rising rates of infection.
Figure 1.1. National 7-Day Moving Average of Confirmed COVID-19 Cases and Initial Unemployment Insurance Claims by Week
0
1
2
3
4
5
6
7
0
20
40
60
80
100
120
140
160
1/29
/20
2/29
/20
3/31
/20
4/30/2
0
5/31
/20
6/30
/20
UI C
laim
s in
Mill
ions
Co
nfirm
ed C
OV
ID C
ases
per
10
0,0
00
Per
sons
WeekCOVID-19 Cases Initial UI Claims
Figure 1.2. National 7-Day Moving Average of Confirmed COVID-19 Deaths and Continued Unemployment Insurance Claims by Week
0
5
10
15
20
25
0
1
2
3
4
5
1/29
/20
2/5/
20
2/12
/20
2/19
/20
2/26
/20
3/4/2
0
3/11/
20
3/18
/20
3/25
/20
4/1/20
4/8/2
0
4/15/2
0
4/22/
20
4/29/
20
5/6/2
0
5/13
/20
5/20
/20
5/27
/20
6/3/
20
6/10
/20
6/17
/20
6/24
/20
7/1/
20
7/8/
20
7/15
/20
UI C
on
tin
ued
Cla
ims
in M
illio
ns
Co
nfi
rmed
CO
VID
Dea
ths
per
10
0,0
00
Per
son
s
WeekCOVID-19 Deaths Continued UI Claims

HOUSING-RELATED FINANCIAL DISTRESS DURING THE PANDEMIC 11 © Mortgage Bankers Association September 2020. All rights reserved.
The national figures mask a defining feature of the pandemic: the tremendous variation in the depth of the outbreak across space and time, commencing in Washington, California, and New York, then spreading inward, until, at the present, it is highly active in the South, West, and Midwest. Figure 1.3 illustrates the differential timing of deaths for selected states. Deaths peak first in New York (measured on the left-hand axis), where the early outbreak was particularly severe, then Massachusetts. Mitigation efforts have brought the death rates in those states down significantly. Deaths in Florida, Texas, and California (measured on the right-hand axis), while low in April and May, are currently on the rise. The labor-market impacts mirror this, with significant variation across states and weeks in employment disruptions and new UI claims. Figure 1.4 illustrates this for new UI claims for the same set of states.
In response to widespread economic disruption, the U.S. Congress passed the Coronavirus Aid, Relief, and Economic Security (CARES) Act, which was signed into law on March 27th. The CARES Act addressed a number of concerns about the pandemic’s effect on housing and mortgage markets. First, in an attempt to offset some of the adverse conse-quences of layoffs and hours’ reductions and supplement household income in the short run, the Act provided for stimulus payments: up to $2,400 for a married couple filing federal income taxes jointly, $1,200 for single individuals, with a phase-out of the payment amount as adjusted gross income rises.1 In addition, there was an additional $500 pay-ment for each dependent under age 17. Second, UI benefits were enhanced by $600 per week above the qualifying state benefit, and the exhaustion date was extended an additional 13 weeks. In addition, eligibility for benefits was expanded to include self-employed, contract, and gig workers, under the Pandemic Unemployment Assistance program. Third, the Act established the Paycheck Protection Program, a short-run business loan and forgiveness program designed to keep workers on company payrolls during the crisis.
CARES also provides for specific protections for homeowners with mortgages and those with student loans outstanding. For borrowers of federally backed single-family loans (e.g., FHA), the Act allows the temporary suspension of payments if experiencing financial difficulty due to the coronavirus. The borrower has the right to request forbearance for 180 days, with the option of an additional 180 days. The Act also prohibits loan servicers and lenders from initiating and enforcing foreclosures for the period March 18–August 31 (at this point). The federal government gave relief to affected student debt holders as well by suspending student loan payments, interest accruing on federally-held loans, and limiting collections on defaulted federal loans. Finally, for both types of debt, the Act mandates no adverse credit reporting consequences for borrowers who request and receive an accommodation for meeting payment obliga-tions during the pandemic.
In contrast to this economic policy response, there has not been a coordinated federal response to the public health issues from the outbreak. Consequently, states have taken different approaches and adopted a wide array of policies to combat the public health risk. The policies most germane to this study are shown in Table 1.1, taken from the Boston University School of Public Health coronavirus policy data-base, complied by Julia Raifman, and supplemented by data from the Princeton University Eviction Lab, and the National Governor’s Association coronavirus policy center.
1. Technically, the payments were advance credits against the 2020 federal personal income tax. The phaseout occurs between $150,000 and $198,000 of AGI for a married couple, and $112,500 and $146,500 for a single individual.
Figure 1.3. 7-Day Moving Average of Confirmed COVID-19 Deaths per 100,000 Persons for Selected States by Week
0
0.1
0.2
0.3
0.4
0.5
0.6
0
1
2
3
4
5
6
1/29
/20
2/5/
20
2/12
/20
2/19
/20
2/26
/20
3/4/2
0
3/11/
20
3/18
/20
3/25
/20
4/1/20
4/8/2
0
4/15/2
0
4/22/
20
4/29/
20
5/6/2
0
5/13
/20
5/20
/20
5/27
/20
6/3/
20
6/10
/20
6/17
/20
6/24
/20
7/1/
20
7/8/
20
7/15
/20
Dea
ths
in O
ther
Sta
tes
Dea
ths
in N
Y a
nd M
A
WeekNew York MassachusettsOhio TexasFlorida California
Figure 1.4. Initial Unemployment Insurance Claims as a Percent of Covered Employment for Selected States by Week
0
1
2
3
4
5
6
7
1/29
/20
2/5/
20
2/12
/20
2/19
/20
2/26
/20
3/4/2
0
3/11/
20
3/18
/20
3/25
/20
4/1/20
4/8/2
0
4/15/2
0
4/22/
20
4/29/
20
5/6/2
0
5/13
/20
5/20
/20
5/27
/20
6/3/
20
6/10
/20
6/17
/20
6/24
/20
7/1/
20
7/8/
20
7/15
/20
% o
f C
ove
red
Em
plo
ymen
t
WeekNew York MassachusettsOhio TexasFlorida California

HOUSING-RELATED FINANCIAL DISTRESS DURING THE PANDEMIC 12 © Mortgage Bankers Association September 2020. All rights reserved.
Table 1.1 Date of Adoption of Selected Policies by State
(1) (2) (3) (4)
State Order to Freeze EvictionsOrder to Freeze Utility Shut-Offs
Closure of Non-Essential Businesses
Order to Stay at Home / Shelter
in Place
Alabama 4/3/2020 3/28/2020 4/4/2020
Alaska 4/9/2020 3/28/2020 3/28/2020
Arizona 3/24/2020 3/30/2020 3/31/2020
Arkansas 4/10/2020
California 4/2/2020 3/19/2020 3/19/2020
Colorado 3/20/2020 3/26/2020 3/26/2020
Connecticut 3/20/2020 3/12/2020 3/23/2020
Delaware 3/24/2020 3/24/2020 3/24/2020 3/24/2020
District of Columbia 3/15/2020 3/17/2020 3/25/2020 4/1/2020
Florida 4/2/2020 4/3/2020
Georgia 4/3/2020
Hawaii 3/17/2020 3/25/2020 3/25/2020
Idaho 3/25/2020 3/25/2020
Illinois 3/21/2020 3/18/2020 3/21/2020 3/21/2020
Indiana 3/19/2020 3/25/2020 3/25/2020
Iowa 3/19/2020 3/27/2020 3/26/2020
Kansas 3/16/2020 3/30/2020 3/30/2020
Kentucky 3/25/2020 3/16/2020 3/26/2020
Louisiana 3/13/2020 3/23/2020 3/23/2020
Maine 4/16/2020 3/16/2020 3/25/2020 4/1/2020
Maryland 3/16/2020 3/23/2020 3/30/2020
Massachusetts 4/20/2020 3/24/2020 3/24/2020 3/24/2020
Michigan 3/20/2020 3/28/2020 3/24/2020 3/24/2020
Minnesota 3/24/2020 3/28/2020 3/28/2020
Mississippi 4/1/2020 3/19/2020 4/3/2020 4/3/2020
Missouri 4/6/2020
Montana 3/30/2020 3/30/2020 3/28/2020 3/28/2020
Nebraska
Nevada 3/21/2020 3/31/2020
New Hampshire 3/17/2020 3/17/2020 3/28/2020 3/28/2020
New Jersey 3/19/2020 4/13/2020 3/21/2020 3/21/2020
New Mexico 3/24/2020 3/19/2020 3/24/2020 3/24/2020
New York 3/22/2020 3/13/2020 3/22/2020 3/22/2020
North Carolina 3/19/2020 3/30/2020 3/30/2020
North Dakota
Ohio 3/13/2020 3/24/2020 3/24/2020
Oklahoma 4/1/2020
Oregon 3/22/2020 3/23/2020
Pennsylvania 3/18/2020 3/13/2020 3/19/2020 4/1/2020
Rhode Island 3/16/2020 3/30/2020 3/28/2020
South Carolina 3/18/2020 4/1/2020 4/7/2020
South Dakota
Tennessee 3/31/2020 4/1/2020 4/2/2020
Texas 3/19/2020 3/26/2020 3/31/2020
Utah 4/1/2020
Vermont 3/27/2020 3/25/2020 3/25/2020
Virginia 3/16/2020 3/30/2020
Washington 3/18/2020 3/18/2020 3/25/2020 3/23/2020
West Virginia 3/24/2020 3/24/2020
Wisconsin 3/27/2020 3/22/2020 3/25/2020 3/25/2020
Wyoming
Source: Boston University School of Public Health Coronavirus Policy Database.
HOUSING-RELATED FINANCIAL DISTRESS DURING THE PANDEMIC 13 © Mortgage Bankers Association September 2020. All rights reserved.
The key general policies are states’ executive orders to close non-essential businesses (NEB) and either to stay at home, or shelter in place. States varied as to when they commenced such policies and whether they had them at all, as well as, in the case of business closures, the breadth of exceptions (e.g., what constitutes an essential business). There were additional specific state policies important in this study’s context, two of which are highlighted in the table. The first were state orders to freeze evictions. The second are orders to freeze utility shut-offs, which may free up income to cover rent or mortgage payments for families with limited resources. Both have potentially important consequences for how households manage their finances and decide what shelter and debt payments to make when budgets are tight.
We provide a detailed analysis of payment patterns for rent, mortgages, and student loans. Our focus is on the second quarter of 2020, during the initial spread of the virus. In particular, the analysis uses detailed data on households and individuals drawn from the Understanding America Survey, referred to throughout the remainder of the report as the UAS. The UAS is a national longitudinal survey of over 8,000 American adults of all ages, combined with an oversample of individuals from California, and is hosted and administered by the Center for Economic and Social Research at the University of Southern California (https://uasdata.usc.edu). UAS participants are recruited through address-based sampling with a two-stage design. In the first stage, zip codes are drawn; in the second-stage, households are randomly drawn from the sample zip codes. The UAS is an Internet panel survey, so there are no in-person or tele-phone interviews. If a selected panel member does not have an Internet connection or hardware, the UAS provides it.
UAS surveys are of three types. The first are the My House-hold surveys, which are basic quarterly survey given to all individuals on employment, income, demographics, and household composition (akin to the monthly Current Popu-lation Surveys).2 The second are periodic topical surveys administered to subsets of UAS respondents.3 The third are periodic topical surveys asked of all UAS respondents. The analysis data used for this study come from the first and third types and cover all UAS respondents.4 Kapteyn et al. (2020) explains the structure of the UAS in more detail.
2. There are also regular monthly surveys for individuals 50 and older that go into more detail.
3. For example, the Social Security Administration has funded a series of surveys of older respondents on awareness of Social Security benefit and claiming rules. The Federal Reserve and the Consumer Financial Protection Bureau have also funded surveys on financial literacy and consumer behavior.
4. The response rates on UAS surveys in Table 1.2 are very high, and particularly high during the pandemic under shelter-in-place orders, ranging from 81-91%. In comparison, some of the Census Household Pulse Household Surveys have response rates less than 5%, even though their sample sizes are much larger.
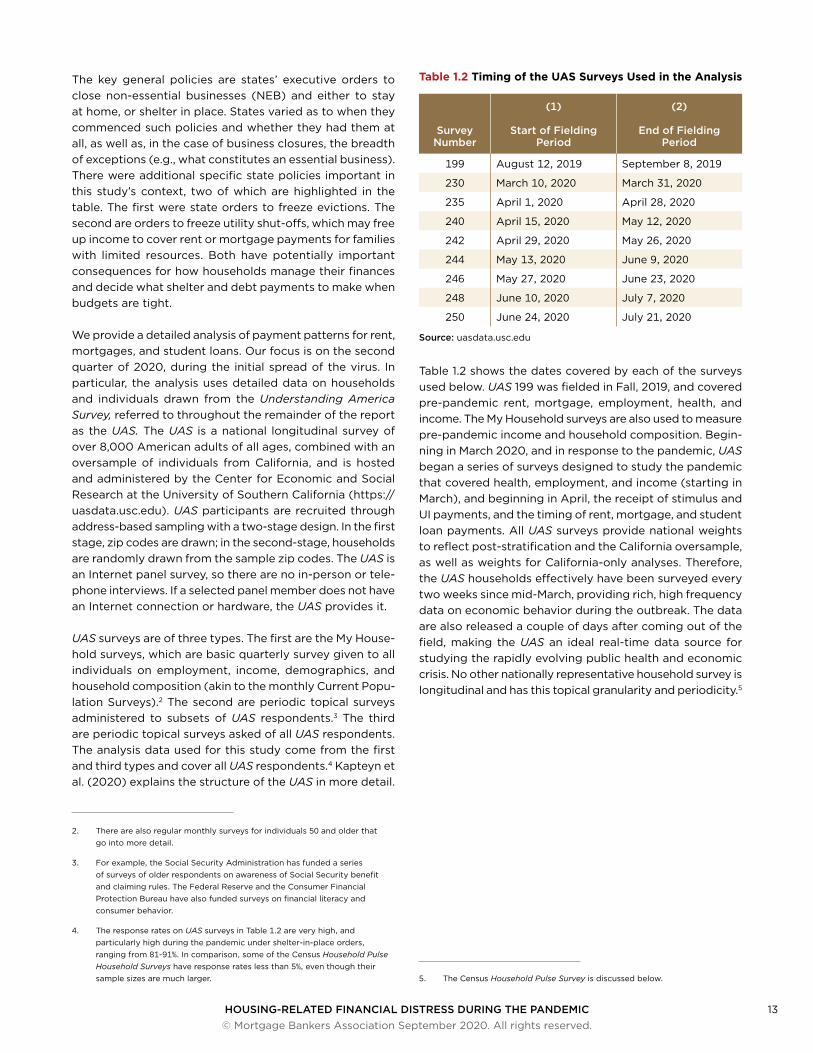
Table 1.2 Timing of the UAS Surveys Used in the Analysis
(1) (2)
Survey Number
Start of Fielding Period
End of Fielding Period
199 August 12, 2019 September 8, 2019
230 March 10, 2020 March 31, 2020
235 April 1, 2020 April 28, 2020
240 April 15, 2020 May 12, 2020
242 April 29, 2020 May 26, 2020
244 May 13, 2020 June 9, 2020
246 May 27, 2020 June 23, 2020
248 June 10, 2020 July 7, 2020
250 June 24, 2020 July 21, 2020
Source: uasdata.usc.edu
Table 1.2 shows the dates covered by each of the surveys used below. UAS 199 was fielded in Fall, 2019, and covered pre-pandemic rent, mortgage, employment, health, and income. The My Household surveys are also used to measure pre-pandemic income and household composition. Begin-ning in March 2020, and in response to the pandemic, UAS began a series of surveys designed to study the pandemic that covered health, employment, and income (starting in March), and beginning in April, the receipt of stimulus and UI payments, and the timing of rent, mortgage, and student loan payments. All UAS surveys provide national weights to reflect post-stratification and the California oversample, as well as weights for California-only analyses. Therefore, the UAS households effectively have been surveyed every two weeks since mid-March, providing rich, high frequency data on economic behavior during the outbreak. The data are also released a couple of days after coming out of the field, making the UAS an ideal real-time data source for studying the rapidly evolving public health and economic crisis. No other nationally representative household survey is longitudinal and has this topical granularity and periodicity.5
5. The Census Household Pulse Survey is discussed below.

HOUSING-RELATED FINANCIAL DISTRESS DURING THE PANDEMIC 14 © Mortgage Bankers Association September 2020. All rights reserved.
Rental Payments
Outside of residents in nursing homes and long-term care facilities, households in the rental market have been especially hard hit by the pandemic. Many are young or lower-skilled workers who were disproportionately in jobs for which they cannot work from home or require substantial face-to-face contact (e.g., retail and personal services). Therefore, as a point of departure, the empirical analysis begins with renters.
The majority of individuals 65 and older are out of the labor force and rely primarily on Social Security for income. As such, these households were buffered from much of the labor-market fallout from the pandemic. For renters in some subsidized units, rent is a direct function of income, and mechanically will decrease as income falls in the pan-demic. Because the UAS does not have enough detail to determine the exact type of subsidized unit, we limit our sample of renters to those who are under age 65 and reside in non-subsidized units.
We first provide a statistical profile of renters prior to the pandemic, then outline broad trends throughout the second quarter. We focus on the impact of economic factors and public policies on the timing of rent payments both within and across the months.
A SNAPSHOT OF RENTERSColumn 1 of Table 2.1 shows summary statistics on demo-graphic and economic characteristics of households that rented their primary residence in Spring, 2020. In total, there are 2,042 renters in this sample. The UAS final population weights were used to make the statistics representative for the U.S. population of adults. Rental payment status is measured as of the beginning of April; the demographic, income, and labor-market characteristics are as of February, and are pre-pandemic.6 Columns 2 and 3 first split all rent-ers into two groups based on the response to the following question in the UAS:
6. Specifically, the rental payment questions did not begin until UAS 235 at the beginning of April. The demographic, income, and employment characteristics are drawn from a combination of the most recent pre-pandemic My Household Survey and retrospective questions on employment in February that were asked later in the Spring, starting with UAS 240.
“ Have you received permission from your landlord to delay or reduce payment of your rent?”7
Columns 4 and 5 feature a different split of all renters, based on the response to the following question:
“ In the past month, did you miss or delay payment of your rent, or did you pay less than the full amount?”
This is the focal measure of distress for renters. Again, this question was first asked at the beginning of April (in UAS 235). In column 4, 11% of renters had paid only a portion or none of their rent in the previous 30 days. They were more likely to be black, Hispanic, lesser educated, younger, and had substantially lower pre-pandemic income, relative to all renters (column 1) and renters who did not miss a pay-ment (column 5).
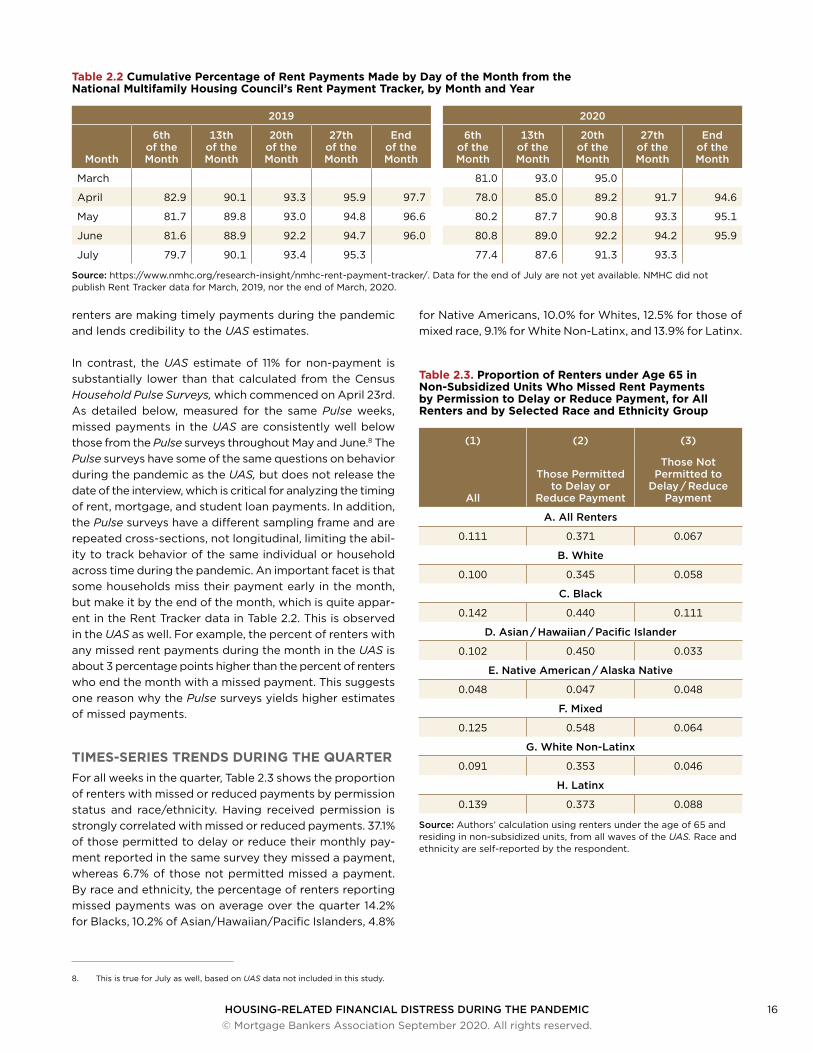
COMPARISON WITH OTHER SOURCESThis figure of 11% for non-payment is broadly consistent with national payment figures for the first half of April from the NHMC Rent Payment Tracker, shown in Table 2.2. The NMHC Rent Tracker is based on payment data from approximately 11.5 million rental units nationwide, which is roughly 25% of the rental housing stock. While we do not know how closely the NMHC data are to a random sample of rental units, the sheer size of the sample indicates that a large fraction of
7. This question was initially asked at the beginning of April in UAS 235 and then repeated in subsequent waves through UAS 248, then is asked every other wave thereafter. We do not know how this maps precisely into the legal definition of payment deferral or forbearance and recognize that “permission” can be interpreted in multiple ways, not necessarily mutually exclusive. For example, it could signal financial fragility if the tenant sought out the option of a missed or reduced payment. Alternatively, it could reflect a property manager’s response to state and federal policies or a calculated loss-mitigation strategy. We are not able to distinguish these or other explanations and present the responses to this question as is.

HOUSING-RELATED FINANCIAL DISTRESS DURING THE PANDEMIC 15 © Mortgage Bankers Association September 2020. All rights reserved.
Table 2.1 Selected Summary Statistics on Pre-Pandemic Demographic and Economic Characteristics for All Renters under Age 65 in Non-Subsidized Units
(1) (2) (3) (4) (5)
Subsample of Renters
Proportion who are or Sample mean of All Renters
Permitted to Delay / Reduce
Payment
Not Permitted to
Delay / Reduce Payment
Missed a Payment / Paid Less than Full
AmountDid Not Miss a Payment
A. Demographic Characteristics
White 0.72 0.76 0.71 0.66 0.73
Black 0.23 0.19 0.24 0.31 0.22
Asian/Hawaiian/Pacific Islander 0.07 0.09 0.07 0.06 0.07
Native American/Alaska Native 0.01 0.01 0.01 0.01 0.01
Mixed Race 0.06 0.06 0.06 0.07 0.06
White Non-Latinx 0.49 0.52 0.49 0.42 0.50
Latinx 0.22 0.27 0.21 0.26 0.21
Married/Partnered 0.52 0.53 0.52 0.54 0.52
High School Dropout 0.10 0.12 0.10 0.19 0.09
High School Degree 0.31 0.31 0.31 0.33 0.31
Some College 0.29 0.30 0.29 0.28 0.30
College Graduate 0.17 0.14 0.18 0.12 0.18
Advanced Degree 0.12 0.14 0.12 0.09 0.13
Male 0.42 0.43 0.42 0.39 0.42
Age 39.5 38.9 39.6 40.3 39.4
Family Size 2.7 2.8 2.7 2.8 2.7
B. Pre-Pandemic Economic Characteristics
Employed 0.73 0.75 0.73 0.68 0.74
Income 53,729 54,738 53,559 45,010 54,863
C. Proportion of All Renters
1.00 0.17 0.83 0.11 0.89
Notes: Authors’ calculations from the UAS from a sample of 2,042 renters under the age of 65 residing in non-subsidized units, with the permission and payment status based in the earliest wave of entry into the analysis sample, typically UAS 235 at the beginning of April. All other variables are measured pre-pandemic. For the indicator variables (all demographic characteristics except age and family size, and employment), proportions are given. For continuous variables (age, family size, and income), the sample means are given. Subcategories may not add to one due to rounding error.
HOUSING-RELATED FINANCIAL DISTRESS DURING THE PANDEMIC 16 © Mortgage Bankers Association September 2020. All rights reserved.
renters are making timely payments during the pandemic and lends credibility to the UAS estimates.
In contrast, the UAS estimate of 11% for non-payment is substantially lower than that calculated from the Census Household Pulse Surveys, which commenced on April 23rd. As detailed below, measured for the same Pulse weeks, missed payments in the UAS are consistently well below those from the Pulse surveys throughout May and June.8 The Pulse surveys have some of the same questions on behavior during the pandemic as the UAS, but does not release the date of the interview, which is critical for analyzing the timing of rent, mortgage, and student loan payments. In addition, the Pulse surveys have a different sampling frame and are repeated cross-sections, not longitudinal, limiting the abil-ity to track behavior of the same individual or household across time during the pandemic. An important facet is that some households miss their payment early in the month, but make it by the end of the month, which is quite appar-ent in the Rent Tracker data in Table 2.2. This is observed in the UAS as well. For example, the percent of renters with any missed rent payments during the month in the UAS is about 3 percentage points higher than the percent of renters who end the month with a missed payment. This suggests one reason why the Pulse surveys yields higher estimates of missed payments.
TIMES-SERIES TRENDS DURING THE QUARTERFor all weeks in the quarter, Table 2.3 shows the proportion of renters with missed or reduced payments by permission status and race/ethnicity. Having received permission is strongly correlated with missed or reduced payments. 37.1% of those permitted to delay or reduce their monthly pay-ment reported in the same survey they missed a payment, whereas 6.7% of those not permitted missed a payment. By race and ethnicity, the percentage of renters reporting missed payments was on average over the quarter 14.2% for Blacks, 10.2% of Asian/Hawaiian/Pacific Islanders, 4.8%
8. This is true for July as well, based on UAS data not included in this study.
for Native Americans, 10.0% for Whites, 12.5% for those of mixed race, 9.1% for White Non-Latinx, and 13.9% for Latinx.
Table 2.3. Proportion of Renters under Age 65 in Non-Subsidized Units Who Missed Rent Payments by Permission to Delay or Reduce Payment, for All Renters and by Selected Race and Ethnicity Group
(1) (2) (3)
All
Those Permitted to Delay or
Reduce Payment
Those Not Permitted to
Delay / Reduce Payment
A. All Renters
0.111 0.371 0.067
B. White
0.100 0.345 0.058
C. Black
0.142 0.440 0.111
D. Asian / Hawaiian / Pacific Islander
0.102 0.450 0.033
E. Native American / Alaska Native
0.048 0.047 0.048
F. Mixed
0.125 0.548 0.064
G. White Non-Latinx
0.091 0.353 0.046
H. Latinx
0.139 0.373 0.088
Source: Authors’ calculation using renters under the age of 65 and residing in non-subsidized units, from all waves of the UAS. Race and ethnicity are self-reported by the respondent.
Table 2.2 Cumulative Percentage of Rent Payments Made by Day of the Month from the National Multifamily Housing Council’s Rent Payment Tracker, by Month and Year
2019 2020
Month
6th of the Month
13th of the Month
20th of the Month
27th of the Month
End of the Month
6th of the Month
13th of the Month
20th of the Month
27th of the Month
End of the Month
March 81.0 93.0 95.0
April 82.9 90.1 93.3 95.9 97.7 78.0 85.0 89.2 91.7 94.6
May 81.7 89.8 93.0 94.8 96.6 80.2 87.7 90.8 93.3 95.1
June 81.6 88.9 92.2 94.7 96.0 80.8 89.0 92.2 94.2 95.9
July 79.7 90.1 93.4 95.3 77.4 87.6 91.3 93.3
Source: https://www.nmhc.org/research-insight/nmhc-rent-payment-tracker/. Data for the end of July are not yet available. NMHC did not publish Rent Tracker data for March, 2019, nor the end of March, 2020.

HOUSING-RELATED FINANCIAL DISTRESS DURING THE PANDEMIC 17 © Mortgage Bankers Association September 2020. All rights reserved.
Figures 2.1 and 2.2 illustrate this at the weekly frequency. In particular, Figure 2.1 plots the percent of renters receiv-ing permission to delay or reduce a rent payment by week for the April 1–July 8 period.9 It shows in a roughly steady fashion that 12-16% of renters received permission in this period. Figure 2.2 plots the percentage of renters reporting missed or reduced payments by week, which is constant around 11%, as well as the percentage with missed pay-ments by permission status. For those with permission, frequency of missed payments fell from April to May, then rose again in June.
To align the timing of payments with economic conditions, Figure 2.3 plots by week the percent of renters who lost their job in the previous two weeks and the percent of rent-ers who kept their job, but had a reduction in hours. Both
9. The fielding period for UAS 250, the last survey in Table 1.2, ended in July, which is why the horizontal axis in the figure runs through the week of July 8th.
measures fell throughout the quarter. A decline in the frac-tion reporting a job loss in this context means a reduction in layoffs, but not necessarily an increase in employment. A decline in the fraction reporting lost hours means an increase in hours on the job. Therefore, the figure shows initial high layoffs and hours’ reductions. For those who continued to be employed, hours increased during the quarter. Figure 2.4 plots by week the percent of renters who reported receiving UI benefits (on the left-hand axis) and stimulus payments (on the right-hand axis). UI receipt rose over the quarter to above 12% in June. The bulk of stimulus payments were received April 15–May 31 and have by now run their course through the rental market.
Figure 2.1. Percent Receiving Permission from Landlord to Delay or Reduce Rent Payment by Week
0
5
10
15
20
4/1/20
4/8/2
0
4/15/2
0
4/22/
20
4/29/
20
5/6/2
0
5/13
/20
5/20
/20
5/27
/20
6/3/
20
6/10
/20
6/17
/20
6/24
/20
7/1/
20
7/8/
20
% w
ith
Per
mis
sio
n
Week
Figure 2.2. Percent of Renters by Week Who Reported a Missed Rent Payment in the Last 30 Days
0
5
10
15
20
25
30
35
40
45
50
55
4/1/20
4/8/2
0
4/15/2
0
4/22/
20
4/29/
20
5/6/2
0
5/13
/20
5/20
/20
5/27
/20
6/3/
20
6/10
/20
6/17
/20
6/24
/20
7/1/
20
7/8/
20
% M
isse
d
WeekAllNot Permitted to Delay/Reduce PaymentPermitted to Delay/Reduce Payment
Figure 2.3. Percent of Renters with Recent Job Loss and Reduction in Working Hours by Week
0
3
6
9
12
15
18
4/1/20
4/8/2
0
4/15/2
0
4/22/
20
4/29/
20
5/6/2
0
5/13
/20
5/20
/20
5/27
/20
6/3/
20
6/10
/20
6/17
/20
6/24
/20
7/1/
20
7/8/
20
Per
cent
of
Ren
ters
WeekJob Loss Reduction in Hours
Figure 2.4. Percent of Renters Receiving Unemployment Insurance and Stimulus Payments by Week
0
10
20
30
40
50
60
70
0
3
6
9
12
15
18
4/1/20
4/8/2
0
4/15/2
0
4/22/
20
4/29/
20
5/6/2
0
5/13
/20
5/20
/20
5/27
/20
6/3/
20
6/10
/20
6/17
/20
6/24
/20
7/1/
20
7/8/
20
% R
ecei
ving
Sti
mul
us
% R
ecei
ving
UI
WeekUnemployment Insurance Stimulus

HOUSING-RELATED FINANCIAL DISTRESS DURING THE PANDEMIC 18 © Mortgage Bankers Association September 2020. All rights reserved.
WHAT DRIVES THE TIMING OF PAYMENTS WITHIN THE MONTH?The information on missed payments, the exact date of the UAS interview, and the fact that rent is due on the first of the month can be used to construct the timing of rent payments within the month for April, May, and June. Figure 2.5 shows the cumulative probability that a rent payment occurred by day of the month for each month.10 The verti-cal dashed line indicates the 6th of the month, the National Multifamily Housing Council’s definition of a late payment. On-time payment was essentially the same across months. End-of-month payment was slightly higher in April and May, than June.
10. Technically, the curves in the figure are non-parametric estimates of the cumulative hazard function for payment. A hazard function in this context defines the likelihood of making a rent payment for any particular day of the month. All renters start the month as non-payers, and then the “exit” non-payment status by making a payment. The hazard function is defined for each day of the month and gives the likelihood of making a payment, given that a payment has not yet been made. So, for example, the hazard function on the 8th of the month gives the likelihood that a renter pays their rent on the 8th of the month, conditional on have not paid up through the end of the 7th of the month. For the last day of the month, the vertical distance from the curve to 1 (on the vertical axis) is the likelihood that the renter ends the month not having paid rent. In Figure 2.5, this is about 11% (roughly speaking) for the months in Q2. The curves in Figure 2.5 were estimated using the method of Turnbull (1974) and Singh and Totawattage (2013).
Table 2.4 shows estimated impacts of selected economic and state policy variables on the timing of rent payments within the month on the sample of all renters.11 For example, the estimated impact shown in the first row of column 1 indicates that a renter who recently lost a job, all else equal, was half a percentage point less likely to have an on-time payment in April (i.e., by the 6th of the month). The single asterisk indicates that this effect is statistically significantly different from zero at the ten-percent level of significance. Likewise, in the second row of column 1, a renter who remained employed but experienced a reduction in hours, all else equal, was sixth-tenths of a percentage point less likely to have an on-time payment in April. The double
11. Technically, the effects are calculated based on the estimation of a hazard function. In this context, a hazard function defines the likelihood of making a rent payment for any particular day of the month. All renters start the month as non-payers, and then the “exit” non-payment status by making a payment. The hazard function is defined for each day of the month and gives the likelihood of making a payment, given that a payment has not yet been made. The estimates in the table are the marginal impact of each economic and policy variable on the timing of payments within the month, holding other factors that affect timing constant. The set of all factors affecting the timing of payments includes whether the household was permitted to miss or reduce a payment, pre-pandemic demographic and economic characteristics shown in Table 2.1, plus indicators of job loss and hours’ reduction, whether the household has access to cash reserves, state of residence, UI and stimulus receipt, the state COVID-19 death rate, and state policies in Table 1.1 (freezes of evictions and utility shut-offs, stay-at-home, and non-essential business closure). The estimated effects in the table are based on maximum likelihood parameter estimates of an interval-censored accelerated failure time model of rent payment on the sample of pooled observations from all three months, assuming a generalized gamma distribution. The standard errors are clustered at the state-level. The estimated marginal effects shown in the table are based on the same set of parameter estimates for all three months, but differ because the COVID death rate, policy variables, and household employment and financial conditions are changing across months during the pandemic.
Table 2.4 Estimated Impacts of Selected Economic and Policy Variables on Rental Payment Time, All Renters under Age 65 in Non-Subsidized Units
(1) (2) (3) (4) (5) (6)
April May June
Change in the Probability of Paying by the
Month6th of the
MonthEnd of the
Month6th of the
MonthEnd of the
Month6th of the
MonthEnd of the
Month
Job Loss -0.005* -0.005* -0.003* -0.001* -0.001* -0.002*
Hours’ Reduced -0.006*** -0.006*** -0.008*** -0.006*** -0.007*** -0.002***
Pre-Pandemic Income 0.022** 0.018** 0.019** 0.019** 0.015** 0.012**
Stimulus Receipt -0.001 -0.002 -0.010 -0.007 -0.001 -0.004
UI Receipt 0.000 0.000 0.000 0.000 0.000 -0.001
No Access to Cash Reserves -0.055*** -0.044*** -0.057*** -0.049*** -0.036*** -0.026***
Permission to Delay or Reduce Payment -0.132*** -0.114*** -0.132*** -0.107*** -0.057*** -0.034***
Eviction Freeze 0.014 0.011 0.009 0.014 0.012 0.010
Utility Shut-Off Freeze 0.024** 0.018** 0.040** 0.045** 0.035** 0.017**
Closure of Non-Essential Businesses -0.087*** -0.067*** -0.094*** -0.063*** 0.000 0.000
Note: Estimated marginal effects based on maximum likelihood parameter estimates of an interval-censored accelerated failure time model of rent payment that pools observations across all three months, assuming a generalized gamma distribution. *** indicates statistical significance at the 1% level, ** at the 5% level; * at the 10% level, based on standard errors clustered at the state-level.

HOUSING-RELATED FINANCIAL DISTRESS DURING THE PANDEMIC 19 © Mortgage Bankers Association September 2020. All rights reserved.
asterisks in the table indicate that this effect was statisti-cally different than zero at the five-percent level. These adverse labor-market outcomes are statistically significant, but economically small, given that in Figure 2.5, on-time payment was roughly 80% in April (i.e., a roughly one-half percentage point bump on an 80% base).
The reason for this is that the primary drivers of late pay-ments in April are whether the household had received permission to delay or reduce their rent payment, the level of pre-pandemic household income, whether the household had access to cash reserves, based on the following UAS question:
“ How confident are you that you could come up with $2,000 if an unexpected need arose within the next month?”
The average monthly rent in the sample is around $1,000, so that the ability to come up with $2,000 is the equivalent of two months’ rent. Renters who responded they could probably or certainly not come up with $2,000 were defined as not having access to cash reserves. So, for example, in column 1, not having access to cash reserves reduced the likelihood of an on-time payment in April by 5.5 percentage points. This impact is statistically significant (at the 1% level) and roughly ten times larger than the impacts for job loss and hours’ reductions.
Column 2 of the table repeats the calculations in column 1 but focuses on likelihood of a rent payment being made by the end of April. The same factors drive the end-of-the-month payments. Columns 3-6 repeat this exercise for May and June, respectively. The impacts of job loss, the bulk of which occurred in April, pre-pandemic income, and access to cash reserves on the likelihood of payment declines as the pandemic continues. Table 2.5 shows similar results when the sample is restricted to renters not receiving permission to delay or reduce payment.
Table 2.5 Estimated Impacts of Selected Economic and Policy Variables on Rental Payment Time, All Renters Under Age 65 in Non-Subsidized Units Not Receiving Permission to Delay or Reduce Rent Payment
(1) (2) (3) (4) (5) (6)
April May June
Change in the Probability of Paying by the
Month6th of the
MonthEnd of the
Month6th of the
MonthEnd of the
Month6th of the
MonthEnd of the
Month
Job Loss -0.006 -0.001 -0.0007* 0.000 0.000 0.000
Hours’ Reduced -0.018** -0.009** -0.008** -0.004** -0.002** 0.000
Pre-Pandemic Income 0.079** 0.059** 0.056** 0.030** 0.014** 0.006**
Stimulus Receipt 0.004 0.006 0.014 0.008 0.004 0.000
UI Receipt 0.000 0.000 0.001 0.001 0.000 0.000
No Access to Cash Reserves -0.180*** -0.089*** -0.110*** -0.056*** -0.035*** -0.018***
Eviction Freeze 0.024 0.019 0.026 0.009 0.011 0.001
Utility Shut-Off Freeze 0.026 0.026 0.058 0.041 0.019 0.005
Closure of Non-Essential Businesses -0.180*** -0.092*** -0.102*** -0.051*** -0.002*** -0.001***
Note: Estimated effects based on maximum likelihood parameter estimates of an interval-censored accelerated failure time model of rent payment on a sample of observations pooled across all three months, assuming a generalized gamma distribution. *** indicates statistical significance at the 1% level, ** at the 5% level; * at the 10% level, based on standard errors clustered at the state-level.
Figure 2.5. Cumulative Probability of Rent Payments by Month and Day
0
0.1
0.2
0.3
0.4
0.5
0.6
0.7
0.8
0.9
1
1 2 3 4 5 6 7 8 9 10 11 12 13 14 15 16 17 18 19 20 21 22 23 24 25 26 27 28 29 30
Pro
bab
ility
Day of the Month
April May June

HOUSING-RELATED FINANCIAL DISTRESS DURING THE PANDEMIC 20 © Mortgage Bankers Association September 2020. All rights reserved.
CUMULATIVE MISSED PAYMENTS OVER THE QUARTERThese tables are informative as to what drives the timing of payments within the month, but do not shed light on cumulative missed payments over the quarter. Using all data spanning the second quarter and the UAS sampling weights, column 1 of Table 2.6 shows estimates of the aggregate share of renters that missed or had a reduced payment at least once in the quarter, defined as having ended the month not paying. Specifically, 10.5% missed in one, 4.5% missed in two, and 2.7% of renters missed in all three months of the quarter, respectively. Column 2 shows the average monthly rent for households that missed payments (grouped by number of payments missed). The average rent was around $1,000 per month. Column 3 uses the percentages from column 1 and a tally of the comparable aggregate number of renter households from the 2018 American Community Survey to estimate that 5.88 million renters missed at least one payment in the quarter. Finally, column 4 uses the average monthly rent from column 2 and the aggregate number of renters affected from column 3 to calculate the aggregate dollar value of lost rental payments in the quarter. Overall, property owners lost as much as $9.1B in revenue in the second quarter.12
12. Specifically, this can be interpreted as an upper bound on the aggregate missed or delayed payments under the assumption that all affected renters missed or delayed, and none reduced payment.
Table 2.6. Summary of Missed Rent Payments in the Second Quarter, All Renters under Age 65 in Non-Subsidized Units
(1) (2) (3) (4)
Number of Missed or Reduced Monthly
Payments in Q2
Percent of Renters
Average Monthly Rent
(in $)
Aggregate Number
of Renter Households with Missed
Payments (in Millions)
Aggregate Missed Rental
Payments in Q2 (in $Billions)
None 82.3 1,021
One 10.5 904 3.49 3.15
Two 4.5 1,158 1.49 3.46
Three 2.7 925 0.90 2.49
Total: 5.88M $9.1B
Source: Authors’ calculation using renters under the age of 65 in non-subsidized units from all waves of the UAS. Average rent in column (2) represents pre-pandemic rent and was calculated based on reported rent paid in UAS 199 in Fall, 2019. The aggregate figures in column (3) are the product of column (1) and the aggregate number of rental units of 33,216,551, calculated as the number of rental units occupied by those under age 65 from the 2018 American Community Survey 1-year estimates less HUD estimates of the fraction of subsidized units occupied by those under 65. The aggregate figures in column (4) are the product of columns (2) and (3), multiplied the number of months missed in the left-most column.
SUMMARYSeveral important themes emerge for renters. First, adverse employment outcomes play a statistically important but economically modest role in driving the magnitude and timing of late rent payments. Far more important than any other factor for timely payments for households was pre-pandemic income and access to cash reserves to bridge the financial gap from reductions in employment. Second, the most important factor in driving payments was permission to delay or reduce a payment. Landlords’ efforts to mitigate the short-run financial stress were a critical rental market response to the pandemic.

HOUSING-RELATED FINANCIAL DISTRESS DURING THE PANDEMIC 21 © Mortgage Bankers Association September 2020. All rights reserved.
Mortgage Payments
Homeowners with mortgages also have been hit by the pandemic, even though they tend to be more highly educated, have the types of job more conducive to working from home, and have larger residences from which to work than renters. One key distinction with renters is that the CARES Act, signed into law on March 27th, provides for specific protections for mortgagors. For borrowers of federally backed single-family loans, the Act allows the temporary suspension of payments if experiencing financial difficulty due to the coronavirus.
Loan servicers may also have deferment or forbearance options for borrowers of non-federally backed loans. For federally backed loans, the borrower has the right to request forbearance for 180 days, with the option of an additional 180 days. In addition, the CARES Act prohibits loan servicers and lenders from initiating and enforcing foreclosures for the period March 18 until at least August 31. One key limitation of the UAS in this regard is that the type of mortgage the homeowner has is not known, so that we cannot determine eligibility for deferment and forbearance in a manner as cleanly as for renters.
This section analyzes trends in and the timing of mortgage payments during the pandemic. Its structure is isomorphic to that for renters. We first provide a statistical profile of homeowners with mortgages (mortgagors) prior to the pandemic, outline broad trends throughout the second quarter, then focus on the impact of changing household economic circumstances on mortgage payments.
A SNAPSHOT OF MORTGAGORSColumn 1 of Table 3.1 shows summary statistics on pre-pandemic demographic and economic characteristics for homeowners with a mortgage as well as payment status at the beginning of April. In total, there are 2,965 mortgagors in this sample.
Columns 2 and 3 split all mortgagors into two groups based on whether or not they received permission to delay or make a reduced mortgage payment. This is based on the question:
“ Have you received permission from your lender to delay or reduce payment of your mortgage?”13
In column 2, 16% had received such permission. They were more likely to be Hispanic, less educated, younger, had lower pre-pandemic income, but more likely to be employed before the outbreak relative to all mortgagors (column 1) and mortgagors not receiving permission (column 3).
Columns 4 and 5 feature a different split, based on whether or not they missed, delayed, or had a reduced payment:
“ In the past month, did you miss or delay payment on your mortgage, or did you pay less than the full amount?”
In column 4, 8% missed, delayed, or reduced payment in the previous 30 days. They were more likely to be Hispanic, lesser educated, younger, had substantially lower pre-pandemic income, relative to all mortgagors (column 1) and mortgagors who did not miss a payment (column 5).
TIME-SERIES TRENDS DURING THE QUARTERColumns 1 and 2 of Table 3.2 show the proportion of mort-gagors with missed payments by permission status for mortgagors in all waves of the UAS spanning the quarter. We find that 8% of mortgagors reporting missed, delayed, or reduced payments. This is consistent with two additional sources: The Mortgage Bankers Association’s National Delinquency Survey rate of 8.22% for 1-4 unit residencies at the end of the second quarter of 2020, and the Black
13. This question was initially asked at the beginning of April in UAS 235 and then repeated in subsequent waves through UAS 248, then is asked every other wave thereafter.

HOUSING-RELATED FINANCIAL DISTRESS DURING THE PANDEMIC 22 © Mortgage Bankers Association September 2020. All rights reserved.
Table 3.1. Selected Summary Statistics on Pre-Pandemic Demographic and Economic Characteristics for Mortgagors
(1) (2) (3) (4) (5)
Subsample of Mortgagors
Proportion who are or Sample mean of All Mortgagors
Permitted to Delay / Reduce
Payment
Not Permitted to
Delay / Reduce Payment
Missed a Payment / Paid Less than Full
AmountDid Not Miss a Payment
A. Demographic Characteristics
White 0.86 0.80 0.87 0.80 0.87
Black 0.09 0.14 0.08 0.15 0.09
Asian/Hawaiian/Pacific Islander 0.05 0.07 0.05 0.06 0.05
Native American/Alaska Native 0.004 0.002 0.004 0.001 0.004
Mixed Race 0.03 0.03 0.04 0.03 0.03
White Non-Latinx 0.69 0.56 0.71 0.53 0.70
Latinx 0.16 0.22 0.15 0.25 0.15
Married/Partnered 0.81 0.81 0.81 0.77 0.81
High School Dropout 0.04 0.03 0.04 0.04 0.04
High School Degree 0.23 0.23 0.23 0.30 0.22
Some College 0.27 0.30 0.27 0.36 0.26
College Graduate 0.25 0.27 0.24 0.18 0.25
Advanced Degree 0.21 0.16 0.22 0.12 0.22
Male 0.51 0.47 0.52 0.49 0.51
Age 49.3 47.2 49.7 46.7 49.5
Family Size 3.1 3.3 3.0 3.5 3.0
B. Pre-Pandemic Economic Characteristics
Employed 0.75 0.83 0.74 0.83 0.75
Income 100,853 98,146 101,418 76,644 102,974
C. Proportion of All Mortgagors
1.00 0.17 0.83 0.11 0.89
Notes: Authors’ calculations from the UAS from a sample of 2,965 mortgagors, with permission and payment status based in their earliest wave of entry into the analysis sample, typically UAS 235 at the beginning of April. All other variables are measured pre-pandemic. For the indicator variables (all demographic characteristics except age and family size, and employment), proportions are given. For continuous variables (age, family size, and income), the sample means are given. Subcategories may not add to one due to rounding error.

HOUSING-RELATED FINANCIAL DISTRESS DURING THE PANDEMIC 23 © Mortgage Bankers Association September 2020. All rights reserved.
Knight Inc. Mortgage Monitor national delinquency rate of 7.59% for June. Throughout the quarter, in the UAS data about 20% of mortgagors received permission from their lender to delay or reduce their monthly payment, and 31% of this subgroup of mortgagors took up this offer and delayed or reduced a payment. This is consistent with MBA’s Weekly Forbearance and Call Volume Survey data. For example, in June, MBA’s Weekly Forbearance and Call Volume Survey recorded its highest value at 8.55% (for the week of June 7). Of those mortgagors not receiving permission, only 3.3% missed a payment. By race and ethnicity, the percentage of mortgagors reporting missed payments was on average over the quarter 14.7% for Blacks, 9.1% of Asian/Hawaiian/Pacific Islanders, 1.4% for Native Americans, 7.4% for Whites, 6.6% for those of mixed race, 6.3% for White Non-Latinx, and 12.5% for Latinx.
Table 3.2. Proportion of Mortgagors Who Missed Payments by Permission to Delay or Reduce Payment, for All Mortgagors and by Selected Race and Ethnicity Group
(1) (2) (3)
All
Those Permitted to Delay or
Reduce Payment
Those Not Permitted to
Delay / Reduce Payment
A. All Mortgagors
0.080 0.307 0.033
B. White
0.074 0.304 0.030
C. Black
0.147 0.379 0.068
D. Asian / Hawaiian / Pacific Islander
0.091 0.280 0.032
E. Native American / Alaska Native
0.014 0.111 0.002
F. Mixed
0.066 0.378 0.012
G. White Non-Latinx
0.063 0.290 0.025
H. Latinx
0.125 0.315 0.059
Source: Authors’ calculation using mortgagors from all waves of the UAS. Race and ethnicity are self-reported by the respondent.
Figures 3.1 and 3.2 illustrate this at the weekly frequency. In particular, Figure 3.1 plots the percent of mortgagors receiving permission to delay or reduce a payment by week for the quarter. This rose from just over 10% in April and peaked above 20% in June. Figure 3.2 plots the percent-age of mortgagors reporting having had a missed, delayed
or reduced payment by week, which doubled from 6.2% at the beginning of April to 12.5% by mid-June. For those with permission, frequency of missed, delayed, or reduced payments rose to 50% in June.
To align the timing of events in these figures with economic conditions, Figure 3.3 plots by week the percent of mort-gagors who lost their job in the previous two weeks and the percent who kept their job, but had a reduction in hours. Both measures are substantially lower than those for rent-ers (in Figure 2.3) and fell throughout the quarter. Figure 3.4 plots by week the percent of mortgagors who reported receiving unemployment insurance (UI) benefits (on the left-hand axis) and stimulus payments (on the right-hand axis). UI receipt rose over the quarter to 6% in June. The bulk of stimulus payments were received April 15–June 24.
Figure 3.1. Percent Receiving Permission from Lender to Delay or Reduce Mortgage Payment by Week
0
5
10
15
20
25
4/1/20
4/8/2
0
4/15/2
0
4/22/
20
4/29/
20
5/6/2
0
5/13
/20
5/20
/20
5/27
/20
6/3/
20
6/10
/20
6/17
/20
6/24
/20
7/1/
20
7/8/
20
% w
ith
Per
mis
sio
n
Week
Figure 3.2. Percent of Mortgagors by Week Who Reported a Missed Loan Payment in the Last 30 Days
0
10
20
30
40
50
60
4/1/20
4/8/2
0
4/15/2
0
4/22/
20
4/29/
20
5/6/2
0
5/13
/20
5/20
/20
5/27
/20
6/3/
20
6/10
/20
6/17
/20
6/24
/20
7/1/
20
7/8/
20
% M
isse
d
WeekAllNot Permitted to Delay/Reduce PaymentPermitted to Delay/Reduce Payment

HOUSING-RELATED FINANCIAL DISTRESS DURING THE PANDEMIC 24 © Mortgage Bankers Association September 2020. All rights reserved.
CUMULATIVE MISSED PAYMENTS OVER THE QUARTERUnlike rent, mortgage payments are not necessarily due at the beginning of the month. The UAS did not ask when during the month mortgage payments were due, so that the precise timing of payments cannot be studied. Instead, in this section, we use all UAS data spanning the second quarter to examine cumulative missed payments. Column 1 of Table 3.3 shows that 5% either missed, delayed, or had a reduced payment in one month, 2.8% in two months, and 3% in all three months. Using these percentages and the average monthly mortgage payments shown in column 2, columns 3 and 4 calculate the aggregate number of homeowners affected and missed payments. We estimate that 5.14 million homeowners missed, delayed, or reduced at least one payment since the pandemic began, totaling as much as $16.27B in payments.14
SUMMARYTo this point, the pandemic has had a moderate impact on mortgage payments. Homeowners have fared better than renters in the labor market, with greater household resources to buffer through the first stage of the outbreak. Nevertheless, 8% of mortgagors missed, delayed, or remit-ted a reduced payment in the second quarter. Any upward trend in this during Q3 should be closely monitored.
14. Again, this can be interpreted as an upper bound on the aggregate missed or delayed payments under the assumption that all affected mortgagors missed or delayed, and none reduced payment.
Table 3.3. Summary of Missed Mortgage Payments in the Second Quarter
(1) (2) (3) (4)
Number of Missed or Reduced Monthly
Payments in Q2 Percent of Mortgagors
Average Monthly Mortgage
Payment (in $)
Aggregate Number of Households with Missed Mortgage
Payments (in Millions)
Aggregate Missed Mortgage Payments in
Q2 (in $Billions)
None 89.2 2,533
One 5.0 2,448 2.38 5.83
Two 2.8 2,107 1.33 5.60
Three 3.0 1,129 1.43 4.84
Total: 5.14M $16.27B
Source: Authors’ calculation using mortgagors from all waves of the UAS. Average rent in column (2) represents pre-pandemic mortgage payment and was calculated based on report mortgage payment paid in UAS 199 in Fall, 2019. The aggregate figures in column (3) are the product of column (1), the aggregate number of homeowner households with a mortgage of 47,506,500 taken from the 2018 American Community Survey 1-year estimates. The aggregate figures in column (4) are the product of columns (2) and (3), multiplied the number of months missed in the left-most column.
Figure 3.3. Percent of Mortgagors with Recent Job Loss and Reduction in Working Hours by Week
0
3
6
9
12
15
18
4/1/20
4/8/2
0
4/15/2
0
4/22/
20
4/29/
20
5/6/2
0
5/13
/20
5/20
/20
5/27
/20
6/3/
20
6/10
/20
6/17
/20
6/24
/20
7/1/
20
7/8/
20
Per
cen
t o
f M
ort
gag
ors
WeekJob Loss Reduction in Hours
Figure 3.4. Percent of Mortgagors Receiving Unemployment Insurance and Stimulus Payments by Week
0
10
20
30
40
50
60
0
3
6
9
12
4/1/20
4/8/2
0
4/15/2
0
4/22/
20
4/29/
20
5/6/2
0
5/13
/20
5/20
/20
5/27
/20
6/3/
20
6/10
/20
6/17
/20
6/24
/20
7/1/
20
7/8/
20
% R
ecei
vin
g S
tim
ulu
s
% R
ecei
vin
g U
I
WeekUnemployment Insurance Stimulus

HOUSING-RELATED FINANCIAL DISTRESS DURING THE PANDEMIC 25 © Mortgage Bankers Association September 2020. All rights reserved.
Student Loan Payments
The analysis ends with an examination of student loan payments. While not a housing outcome per se, there is, in general, interest in the extent to which student debt affects housing-market behavior, and, in particular, how rising student debt burdens may have crowded out first-time home purchases among millennials (e.g., Brown, Caldwell, and Sutherland, 2013). In particular, Mezza, Ringo, Sherlund, and Sommer (2020) examined the effect of student loan debt on homeownership. They found that an additional $1,000 of student debt lowers the homeownership rate by about 2 percentage points, a sizeable effect. In the pandemic, missed student loan payments or deferrals could adversely affect the ability in the future for younger households to enter the housing market or slow the climb of the housing ladder.
The CARES Act gives relief to student debt holders: it suspends student loan payments and interest accrual on federally-held loans and halts collections on defaulted federal loans. However, just as for mortgages, the relief is not comprehensive, as private and commercially-backed federally-guaranteed loans are not covered. In response, there have been some private and state-level efforts to provide pandemic relief, but those have not been uniform.15
Because the UAS does not have information on the type of student loan, we cannot determine eligibility for defer-ment and forbearance in a manner as cleanly as for renters. Instead, this section provides a statistical profile of student loan borrowers in the UAS prior to the pandemic and outlines broad trends throughout the second quarter.
A SNAPSHOT OF STUDENT LOAN BORROWERSColumn 1 of Table 4.1 shows summary statistics on pre-pandemic demographic and economic characteristics and payment status at the beginning of April. In total, there are 1,542 borrowers in this sample. They are of all ages, reflect-ing the fact, for example, that some parents may take out loans for their children or may return to school at older ages. In addition, they refer to borrowers in the household,
15. For example, nine states (California, Colorado, Connecticut, Illinois, Massachusetts, New Jersey, Vermont, Virginia, and Washington) have combined to persuade a large group of private lenders and servicers to provide relief during the pandemic: borrowers can suspend payments for up to 90 days; waiver of late fees; suspension of adverse reporting to credit bureaus and new debt-collection lawsuits.
whereas the educational attainment reported in the table is for the UAS respondent. This explains why there are a very small fraction of households with student debt, for which the respondent is a high school dropout. Overall, borrowers were predominantly married, white, and an average annual household income of $82,000.
Columns 2 and 3 split all borrowers into two groups based on whether or not they received permission to delay or reduce a student loan payment:
“ Have you received permission from your lender to delay or reduce payment on your student loans?”
In column 2, 59% reported they had received such permission. Their characteristics were almost identical to all borrowers. Columns 4 and 5 split the sample based on whether or not they missed, delayed, or had a reduced payment:
“ In the past month, did you miss or delay payment on your student loans, or did you pay less than the full amount?”
In column 4, 46% had paid only a portion or none of their payment in the previous 30 days. They were more likely to be black, Hispanic, with less than a college degree, and had substantially lower pre-pandemic income.

HOUSING-RELATED FINANCIAL DISTRESS DURING THE PANDEMIC 26 © Mortgage Bankers Association September 2020. All rights reserved.
Table 4.1. Selected Summary Statistics on Pre-Pandemic Demographic and Economic Characteristics for Student Loan Borrowers
(1) (2) (3) (4) (5)
Subsample of Borrowers
Proportion who are or Sample mean of All Borrowers
Permitted to Delay / Reduce
Payment
NotPermitted to
Delay / Reduce Payment
Missed a Payment / Paid Less than Full
AmountDid Not Miss a Payment
A. Demographic Characteristics
White 0.74 0.75 0.74 0.71 0.77
Black 0.23 0.24 0.21 0.27 0.19
Asian/Hawaiian/Pacific Islander 0.05 0.04 0.06 0.05 0.05
Native American/Alaska Native 0.005 0.003 0.01 0.004 0.006
Mixed Race 0.06 0.06 0.06 0.07 0.05
White Non-Latinx 0.51 0.51 0.52 0.46 0.56
Latinx 0.21 0.21 0.21 0.23 0.20
Married/Partnered 0.63 0.63 0.63 0.61 0.64
High School Dropout 0.01 0.009 0.02 0.01 0.01
High School Degree 0.10 0.08 0.13 0.09 0.10
Some College 0.36 0.33 0.39 0.38 0.34
College Graduate 0.29 0.29 0.28 0.26 0.31
Advanced Degree 0.25 0.29 0.18 0.25 0.24
Male 0.37 0.37 0.39 0.35 0.40
Age 39.1 39.1 39.1 39.6 38.7
Family Size 3.2 3.1 3.3 3.1 3.3
B. Pre-Pandemic Economic Characteristics
Employed 3.2 3.1 3.3 3.1 3.3
Income 82,038 81,788 84,432 73,634 89,282
C. Proportion of All Renters
1.00 0.59 0.41 0.46 0.54
Notes: Authors’ calculations from the UAS from a sample of 1,542 borrowers. Borrowers, in this context, could be students or others who took on student debt (for example, parents). Permission and payment status based in their earliest wave of entry into the analysis sample, typically UAS 235 at the beginning of April. All other variables are measured pre-pandemic. For the indicator variables (all demographic characteristics except age and family size, and employment), proportions are given. For continuous variables (age, family size, and income), the sample means are given. Subcategories may not add to one due to rounding error.
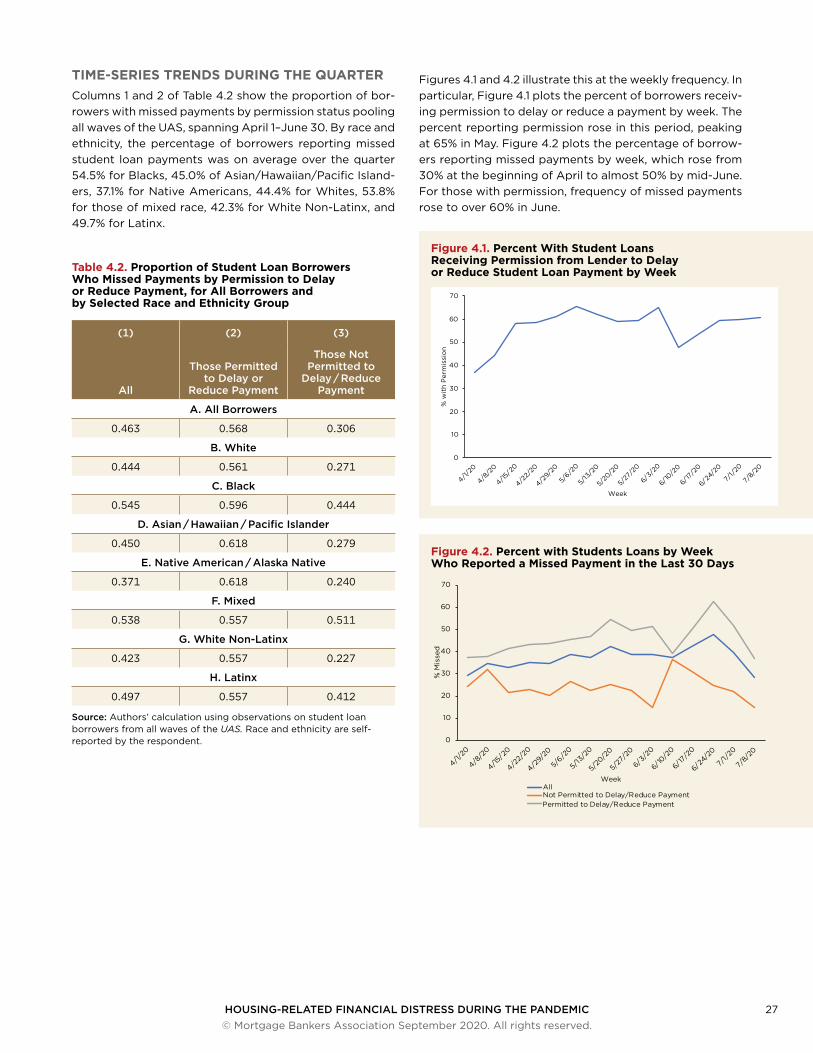
HOUSING-RELATED FINANCIAL DISTRESS DURING THE PANDEMIC 27 © Mortgage Bankers Association September 2020. All rights reserved.
TIME-SERIES TRENDS DURING THE QUARTERColumns 1 and 2 of Table 4.2 show the proportion of bor-rowers with missed payments by permission status pooling all waves of the UAS, spanning April 1–June 30. By race and ethnicity, the percentage of borrowers reporting missed student loan payments was on average over the quarter 54.5% for Blacks, 45.0% of Asian/Hawaiian/Pacific Island-ers, 37.1% for Native Americans, 44.4% for Whites, 53.8% for those of mixed race, 42.3% for White Non-Latinx, and 49.7% for Latinx.
Table 4.2. Proportion of Student Loan Borrowers Who Missed Payments by Permission to Delay or Reduce Payment, for All Borrowers and by Selected Race and Ethnicity Group
(1) (2) (3)
All
Those Permitted to Delay or
Reduce Payment
Those NotPermitted to
Delay / Reduce Payment
A. All Borrowers
0.463 0.568 0.306
B. White
0.444 0.561 0.271
C. Black
0.545 0.596 0.444
D. Asian / Hawaiian / Pacific Islander
0.450 0.618 0.279
E. Native American / Alaska Native
0.371 0.618 0.240
F. Mixed
0.538 0.557 0.511
G. White Non-Latinx
0.423 0.557 0.227
H. Latinx
0.497 0.557 0.412
Source: Authors’ calculation using observations on student loan borrowers from all waves of the UAS. Race and ethnicity are self-reported by the respondent.
Figures 4.1 and 4.2 illustrate this at the weekly frequency. In particular, Figure 4.1 plots the percent of borrowers receiv-ing permission to delay or reduce a payment by week. The percent reporting permission rose in this period, peaking at 65% in May. Figure 4.2 plots the percentage of borrow-ers reporting missed payments by week, which rose from 30% at the beginning of April to almost 50% by mid-June. For those with permission, frequency of missed payments rose to over 60% in June.
Figure 4.1. Percent With Student Loans Receiving Permission from Lender to Delay or Reduce Student Loan Payment by Week
0
10
20
30
40
50
60
70
4/1/20
4/8/2
0
4/15/2
0
4/22/
20
4/29/
20
5/6/2
0
5/13
/20
5/20
/20
5/27
/20
6/3/
20
6/10
/20
6/17
/20
6/24
/20
7/1/
20
7/8/
20
% w
ith
Per
mis
sio
n
Week
Figure 4.2. Percent with Students Loans by Week Who Reported a Missed Payment in the Last 30 Days
0
10
20
30
40
50
60
70
4/1/20
4/8/2
0
4/15/2
0
4/22/
20
4/29/
20
5/6/2
0
5/13
/20
5/20
/20
5/27
/20
6/3/
20
6/10
/20
6/17
/20
6/24
/20
7/1/
20
7/8/
20
% M
isse
d
WeekAllNot Permitted to Delay/Reduce PaymentPermitted to Delay/Reduce Payment

HOUSING-RELATED FINANCIAL DISTRESS DURING THE PANDEMIC 28 © Mortgage Bankers Association September 2020. All rights reserved.
To align the timing of events in these figures with economic conditions, Figure 4.3 plots by week the percent of borrow-ers who lost their job in the previous two weeks and the percent who kept their job, but had a reduction in hours. Job losses were heavy for those with student debt in early April and fell throughout the quarter. In addition, many had reduced hours. The employment declines were substantially larger than for renters and mortgagors. Figure 4.4 plots by week the percent of borrowers who reported receiving unemployment insurance (UI) benefits (on the left-hand axis) and stimulus payments (on the right-hand axis). UI receipt rose substantially over the quarter, peaking at 15% in June. The bulk of stimulus payments were received April 15–June 24.
CUMULATIVE MISSED PAYMENTS OVER THE QUARTERThe UAS did not ask when during the month student loan payments were due, so the precise timing of payments can-not be studied. Instead, in this section, we use all UAS data spanning the second quarter to examine cumulative missed payments in Table 4.3. Missed payments were extensive. Only about half of borrowers paid in full every loan payment during the quarter. 19.3% either missed or had a reduced payment in one month, another 16.4% in two months, and 12.9% of borrowers missed or had a reduced payment in all three months. In aggregate, over 30 million individuals missed at least one payment in the second quarter, a sub-stantial drop-off in payments due to the pandemic.
Table 4.3 Summary of Missed Student Loan Payments in the Second Quarter
(1) (2)
Number of Missed or
Reduced Monthly Payments in Q2
Percent of Borrowers
Aggregate Number of
Individuals with Missed Student Loan Payments
(in Millions)
None 51.4
One 19.3 12.1
Two 16.4 10.0
Three 12.9 8.1
30.2M
Source: Authors’ calculation using borrowers from all waves of the UAS. Aggregate figures based on Federal Reserve estimates of the number of U.S. adults with student debt.
SUMMARYLike renters, those with student loans fared comparatively poorly in the labor-market. They had high rates of unem-ployment and take-up of unemployment insurance benefits. Those who kept their jobs had a high incidence of hours’ reductions. This found its way into payments. Almost two-thirds of borrowers had received permission to miss, delay or reduce payment. Over half missed at least one payment in the second quarter; one out of every eight missed all three payments. Although the exact mix of federally-held loans is not known, the federal student loan moratorium in the CARES Act almost surely played an important role in the emergence of these trends.
Figure 4.3. Percent with Student Loans with Recent Job Loss and Reduction in Working Hours by Week
0
3
6
9
12
15
18
4/1/20
4/8/2
0
4/15/2
0
4/22/
20
4/29/
20
5/6/2
0
5/13
/20
5/20
/20
5/27
/20
6/3/
20
6/10
/20
6/17
/20
6/24
/20
7/1/
20
7/8/
20
Per
cen
t o
f S
tud
ent
Lo
an B
orr
ow
ers
WeekJob Loss Reduction in Hours
Figure 4.4. Percent with Student Loans Receiving Unemployment Insurance and Stimulus Payments by Week
0
10
20
30
40
50
60
70
0
3
6
9
12
15
4/1/20
4/8/2
0
4/15/2
0
4/22/
20
4/29/
20
5/6/2
0
5/13
/20
5/20
/20
5/27
/20
6/3/
20
6/10
/20
6/17
/20
6/24
/20
7/1/
20
7/8/
20
% R
ecei
vin
g S
tim
ulu
s
% R
ecei
vin
g U
I
WeekUnemployment Insurance Stimulus
HOUSING-RELATED FINANCIAL DISTRESS DURING THE PANDEMIC 29 © Mortgage Bankers Association September 2020. All rights reserved.
Conclusion
This report provides evidence on the rent, mortgage, and student loan payment patterns from the second quarter of 2020, using innovative household survey data from the Understanding America Survey (UAS), an internet panel survey of over 8,000 households specially tailored to study the impact of the coronavirus and fielded every two weeks. It provides close to real-time data on the rapidly evolving economic consequences of the pandemic. Indeed, this report uses data through the end of June, just released.
There are a number of key findings. First, 11% renters reported having missed, delayed, or reduced a rent payment in the second quarter of 2020. In aggregate, 5.88 million renters fell behind on their rent. These figures are substantially smaller than those calculated in the Census Household Pulse Survey, suggesting the distress in the rental housing market is less widespread than found in studies using those Census data. In aggregate, rental property owners lost as much as $9.1B in the second quarter revenue from missed rent payments. Second, 8% of homeowners with a mort-gage missed or deferred at least one mortgage payment in the second quarter. In aggregate, 5.14 million owners fell behind on payments. Total missed payments were as much as $16.27B in the quarter. Finally, almost half of those with student debt missed at least one payment, representing in aggregate 30 million individuals.
The key factors in determining the timing of payments were the level of pre-pandemic household income, access to cash reserves, and whether permission was received to delay or reduce payments. Declines in employment from layoffs and reductions in working hours accounted for a small share of missed payments, once other factors were taken into account.
Giving households permission to miss, delay, or reduce pay-ments during the pandemic has been relatively widespread and likely has allowed households to weather some of the short-run financial difficulties presented by the economic downturn. However, for renters, the combination of house-holds who missed at least one payment in the quarter and those offered the option to miss, delay or reduce payment, but did not take it, is substantive enough to suggest real risk to future payments, should the economic downturn be protracted. In addition, missed, delayed, and reduced payments imply accumulated a backlog of past-due pay-ments that eventually will need to be paid. This overhang, particularly for renters and especially for student loan bor-rowers, adds some additional risk to future payments. Better understanding the nature and magnitude of this risk and latent financial fragility is an important next step.
These conclusions are tempered by the following caveats. The pandemic is still evolving. Already by the end of July there has been a major surge in cases and deaths in the South and West and an uptick in the Midwest that risk a halt to reopening toward pre-pandemic social and economic activity. Until a vaccine, herd immunity, and/or proven phar-maceutical therapies are brought to scale, the road is long, and there will be some uncertainty surrounding the future impacts on housing and mortgage markets.

HOUSING-RELATED FINANCIAL DISTRESS DURING THE PANDEMIC 30 © Mortgage Bankers Association September 2020. All rights reserved.
References
Mezza, Alvaro, Daniel Ringo, Shane Sherlund, Kamila Sommer. 2020. “Student Loans and Homeownership.” Journal of Labor Economics 38(1): 215-260.
Black Knight Inc. 2020. Mortgage Monitor June 2020 Report. https://cdn.blackknightinc.com/wp-content/uploads/2020/07/BKI_MM_Jun2020_Report.pdf
Brown, Meta, Sydnee Caldwell, Sarah Sutherland. 2013. “Young student loan borrowers remained on the sidelines of the housing market in 2013.” Federal Reserve Bank of New York. (http://libertystreeteconomics.newyorkfed.org/2014/05/just-released-young-student-loan-borrowers -remained-on-the-sidelines-of-the-housing-market-in-2013.html).
Entrata. 2020. “COVID-19 Rental Housing Trends: Mid-Month Report.” (published online April 22, 2020; downloaded June 13, 2020) (http://info.entrata.com/newsletters/documents/2020/trends/conventional/04222020.pdf
Kapteyn, Arie, Marco Angrisani, Daniel Bennett, Wandi de Bruin, Jill Darling, Tania Gutsche, Ying Liu, Erik Meijer, Francisco Perez-Arce, Simone Schane. 2020. “Tracking the Effect of the COVID-19 Pandemic on the Lives of American Households” Survey Research Methods 14(2): 179-186.
MRI Real Estate Software. 2020. “MRI Software Market Insights: The Impact of COVID-19 on Multifamily in North America.” (published online May, 2020; downloaded June 13, 2020).
National Multifamily Housing Council. 2020. “More Apartment Operators Move to Flex Payment Models.” (published online on March 30, 2020; downloaded June 13, 2020) (https://www.nmhc.org/news/nmhc-news/2020/more-apartment-operators-move-to-flex-payment-models/).
National Multifamily Housing Council. 2020. “NMHC Rent Payment Tracker Finds 12 Percentage Point Decrease in Share of Apartment Households that Paid Rent by April 5.” (published online on April 8, 2020; downloaded June 13, 2020) (https://www.nmhc.org/news/press-release/2020/nmhc-rent-payment-tracker-finds-12-percentage-point-decrease-in-share-of-apartment-households-that-paid-rent-by-april-5/)
Ruggles, Steven, Sarah Flood, Ronald Goeken, Josiah Grover, Erin Meyer, Jose Pacas and Matthew Sobek. IPUMS USA: Version 10.0 [dataset]. Minneapolis, MN: IPUMS, 2020. https://doi.org/10.18128/D010.V10.0
Singh, Radhey S., Dishna P. Totawattage. 2013. “The Statistical Analysis of Interval-Censored Failure Time Data with Applications.” Open Journal of Statistics 3: 155–166.
Turnbull, Bruce W. 1974. “Nonparametric Estimation of a Survivorship Function with Doubly Censored Data.” Journal of the American Statistical Association 69(345): 169–173.
