research informing practice for healthy
TRANSCRIPT
ImpacTeen:A Policy Research Partnership
to Reduce Youth Substance Use
Component Part of “Bridging the Gap:
Research Informing Practice for Healthy
Youth Behavior”
Related support provided
by NIDA, NCI, and CDC
www.impacteen.org

Purposes of the
Bridging the Gap Initiative:
• To evaluate the impact on youth of:
Policies, Programs, and Practices
• Simultaneously addressing various substances:
Alcohol, Illicit Drugs, and Tobacco
• At different levels of social organization:
State, Community, School, and Individual

Unique Aspects of
Bridging the Gap
• It integrates across:
> Multiple substances
> Multiple disciplines
> Multiple centers and collaborators
> Multiple levels of social organization
> Multiple data sources

University of Michigan
Institute for Social Research
University of Illinois at Chicago
Health Research and Policy Centers
Youth, Education and
Society (YES!)
Monitoring the Future
(MTF)
ImpacTeen
Illicit Drug Policy Research
Team
Andrews U and RAND
Tobacco Policy Research
Team
Roswell Park
Coordinating Center,
Community Data CollectionsPolysubstance Use Research
Alcohol Policy Research
Healthy Eating/Physical
Activity and Youth ObesityUIC
Yvonne Terry-McElrath
Sherry Emery
John Tauras
Hana Ross
Lan Liang
Bradley Gray
Lisa Powell
Jenny Williams
Anna Sandoval
Ryoko Yamaguchi
And many others
Tobacco Research
Frank Chaloupka
Brian Flay
Lloyd Johnston
Patrick O’Malley
Gary Giovino
Mike Cummings
Andy Hyland
Melanie Wakefield
Sandy Slater
Dianne Barker
Erin Ruel

BTG Data Collections• Half-sample of MTF schools cycling out of the
national sample> c.215 schools per year> National replicate sample
• Administrators in those schools surveyed
• Community data collected from their catchment areas> Observational studies of retail outlets, communities> Key informant interviews in the community
• Other existing archival data
• State level data on laws, etc.

The Effects of Price onYouth/Young Adult
SmokingBTG Tobacco Research Team
The Association Between thePoint-of-Purchase Environment
And Youth Smoking Slater, Ruel, Chaloupka, Johnston,
O’Malley, Terry-McElrath, Giovino

Tax rates in effect, late 2002
Cigarette Taxes
$0.98 to $1.50 (9)
$0.64 to $0.98 (11)
$0.35 to $0.64 (10)
$0.20 to $0.35 (10)
$0.025 to $0.20 (11)
State Cigarette Excise Taxes
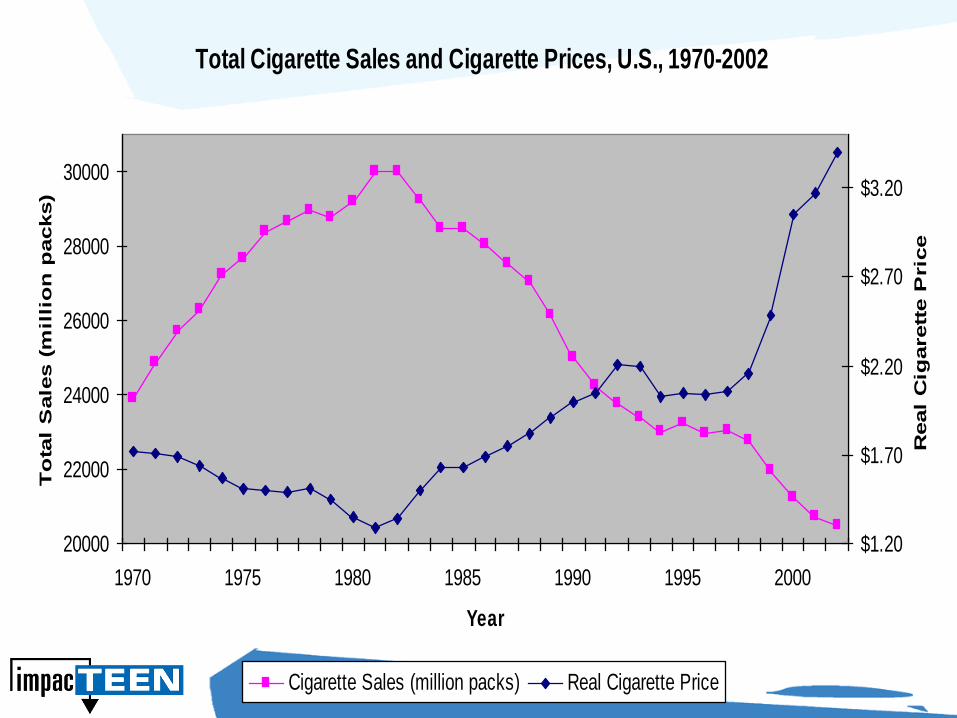
Total Cigarette Sales and Cigarette Prices, U.S., 1970-2002
20000
22000
24000
26000
28000
30000
1970 1975 1980 1985 1990 1995 2000
Year
To
tal
Sale
s (
mil
lio
n p
acks)
$1.20
$1.70
$2.20
$2.70
$3.20
Real
Cig
arett
e P
ric
e
Cigarette Sales (million packs) Real Cigarette Price

Tobacco Taxes and Tobacco Use
• Higher taxes induce quitting, prevent relapse,
and reduce consumption among adults.
• Estimates from high-income countries
indicate that 10% rise in price reduces overall
cigarette consumption by about 4%
• About half of impact of price increases is on
smoking prevalence; remainder is on average
cigarette consumption among smokers
• Long run response larger given
impact of addiction
Source: Chaloupka et al., 2000

YOUNG PEOPLE MORE RESPONSIVE
TO PRICE INCREASES
Proportion of disposable income youth spends on
cigarettes likely to exceed that for adults
Peer influences much more important for young
smokers than for adult smokers
Young smokers less addicted than adult smokers
Young people tend to discount the future more
heavily than adults
Because kids are highly sensitive to price, and
given that 90 percent of smokers start when they
are 18 or younger, an increase in excise taxes
is one of the best ways to achieve long run
reductions in overall smoking

US Cigarette Advertising and
Promotional Expenditures, 20012%
0%
3%
40%
3%3%5%
42%
2%
Outdoor/Transit
Point-of-Sale
Promotional Allowances
Specialty Item Distribution
Public Entertainment
Coupons
Retail Value Added
Other
Source: Federal Trade Commission (2003), Report to Congress Pursuant to the Federal Cigarette Label and Advertising Act, 2001

Cigarette Advertising and
Promotion, 1978-2001(millions of 2001 dollars)
$0
$1,000
$2,000
$3,000
$4,000
$5,000
$6,000
Point-of-Sale Other
Advertising
Promotional
Allowances
Coupons/Retail
Value Added
Other
Promotion
Source: Federal Trade Commission (2003), Report to Congress Pursuant to the Federal Cigarette Label
and Advertising Act, 2001, and author’s calculations


Advertising and Tobacco Use
• Econometric studies find either no impact
or small positive impact of advertising on
Overall cigarette use
• Typically based on highly aggregated data
• Econometric methods poorly suited toexamining this issue
• Non-econometric studies find more evidence for
Positive impact of advertising on smoking
•High recall, strength of interest related to use
•Youth brand choice more responsive to advertising
Than adult brand choice
•Ownership of promotional items related to smoking
uptake
Source: Chaloupka and Warner, 2001; Saffer 2001

Advertising and Tobacco Use
• Econometric evidence on advertising bans
supports positive effect of advertising on
tobacco use
• Comprehensive bans significantly reducesmoking
•6-7% reduction in consumption under relativelycomprehensive restrictions on advertising/promotion
•Partial bans have little to no impact on
smoking
•Shift spending to other non-restricted marketing efforts
Source: Saffer and Chaloupka, 2001; Saffer 2001

1999 Cigarette Billboard Ban
• ImpacTeen in field as cigarette billboards
came down under Master Settlement
Agreement– multipack discounts, gifts with purchase, cents off
coupons more likely after billboard ban
– exterior and interior store advertising more pervasive
after billboard ban
– functional objects more frequent after billboard ban
Source: Wakefield, et al., AJPH, 2001

Tobacco Use Data
• Monitoring the Future Surveys
> nationally representative, cross-sectional
~ 430 schools/year; ~ 50,000 youth/year
- aggregated school-level data
> measures of smoking prevalence, cigarette
consumption by smokers, cessation, more
> variety of indicators of attitudes towards
tobacco, perceptions of risk from tobacco use,
and much more
> longitudinal data for subset of cross-
sectional survey samples

Tobacco Use Data
• RWJF/Audits & Surveys Worldwide
> nationally representative, cross-sectional
survey of high school students, 1996
~ 200 schools; ~17,000 students
> extensive data on tobacco use, attitudes, peer
use, and much more
> self-reported price, expected response to price changes
• Harvard College Alcohol Surveys
> nationally representative, cross-sectional surveys of
college students, 1993, 1997, 1999, 2001
~ 120-140 schools; ~15-18,000 students
> basic measures of tobacco use

Price Data
• Tobacco Institute/Orzechowski and Walker> State level average price per pack, including state
excise taxes
> With and without discount (generic) brands
• American Chamber of Commerce Researchers
Association (ACCRA)> City-specific price for carton of Winston king-size
• Nielsen/IRI Scanner-based prices
• Self-reported prices
• ImpacTeen retail-store observations

Store Observations
• Aim is to capture the marketing and countermarketing environment youth face fortobacco and alcohol at the point-of-purchase
> Tobacco/alcohol pricing and promotions> Product placement> Functional objects> Interior/exterior/parking lot advertising> Access/health-relate signage> Basic store characteristics
• Store Sample> Potential outlets selected based on SIC codes> Screening calls to determine if tobacco sold> Random sample of up to 30 stores per site
- about 4,500 per year or 17 per site

Cigarette Pricing
1999 2000 2001
Marlboro $2.95 $3.31 $3.54
Newport $2.89 $3.25 $3.63

Cigarette Promotion
1999 2000 2001
Marlboro
45%
46% 44%
Newport 26% 39%
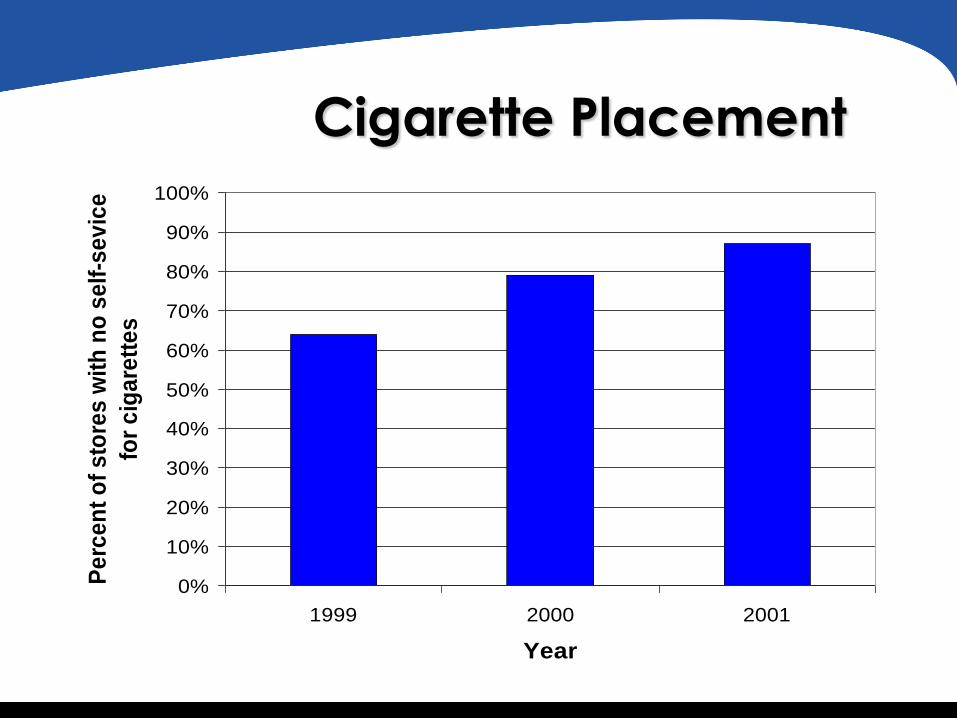
Cigarette Placement
0%
10%
20%
30%
40%
50%
60%
70%
80%
90%
100%
1999 2000 2001
Year
Pe
rce
nt
of
sto
res
wit
h n
o s
elf
-se
vic
e
for
cig
are
tte
s

Cigarette Advertising
1999 2000 2001
Interior –
4 pt. scale
2.0 2.4 2.1
Exterior
% w. any
58% 58% 53%
Functional
Objects – any
70% 70% 62%
Low-Height –
any
56% 38% 39%

• Individual Characteristics> gender, race/ethnicity, grade, etc.> family structure, employment status, income> community/school environment
• Other Tobacco Control Policies
> Smoke-free air laws, ordinances
> School and home smoking policies> Limits on youth access
> Purchase, possession and/or use> State tobacco control programs
> others
Key Control Variables

• Logit/Probit methods> smoking prevalence, cessation
• Least Squares Regression> cigarette consumption (conditional demand)
• Generalized logistic regression > smoking uptake, consumption
• Hazard/duration methods> initiation, cessation in longitudinal
analyses
• Multi-level Methods
Statistical Methods
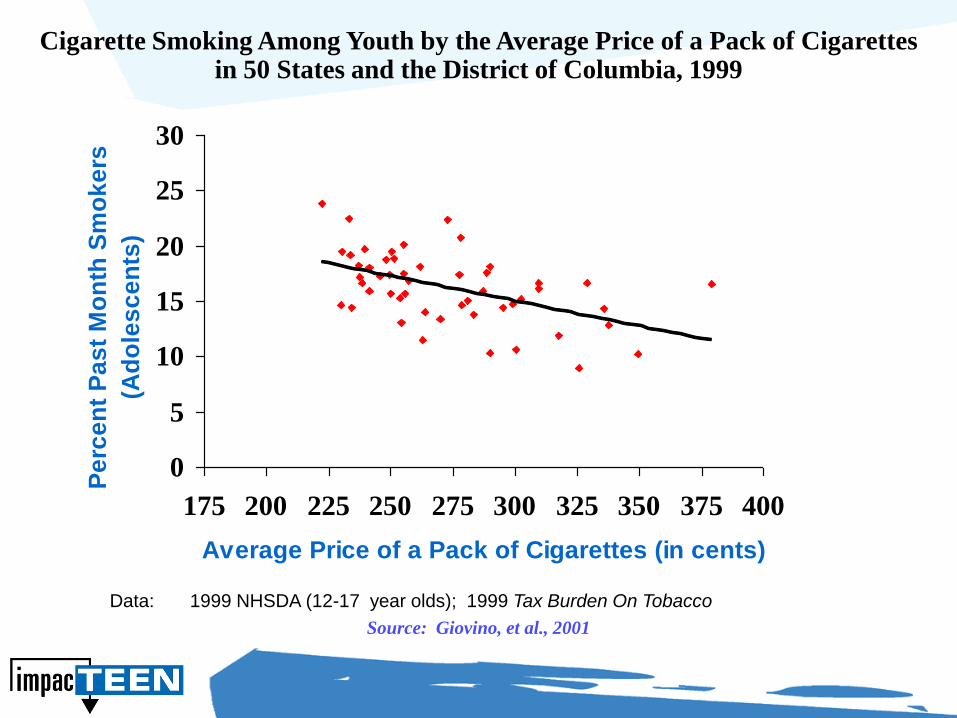
Data: 1999 NHSDA (12-17 year olds); 1999 Tax Burden On Tobacco
Source: Giovino, et al., 2001
0
5
10
15
20
25
30
175 200 225 250 275 300 325 350 375 400
Average Price of a Pack of Cigarettes (in cents)
Pe
rce
nt
Pa
st
Mo
nth
Sm
ok
ers
(Ad
ole
sc
en
ts)
Cigarette Smoking Among Youth by the Average Price of a Pack of Cigarettesin 50 States and the District of Columbia, 1999

12th Grade 30 Day Smoking Prevalence and Price, 1975-2002
$1.25
$1.50
$1.75
$2.00
$2.25
$2.50
$2.75
$3.00
$3.25
$3.50
1975 1980 1985 1990 1995 2000
Year
Real P
rice P
er P
ack
26
28
30
32
34
36
38
40
Sm
okin
g P
revalen
ce
Cigarette Price 30 Day Smoking Prevalence

Price and Youth/Young Adult Smoking
• Consistently find that youth/young adult smoking is highly responsive to cigarette price
> Youth generally 2-3 times more price sensitivethan adults
> Young adults typically about 2 times more responsive than adults
> Estimates based on self-reported pricemeasures suggest youth even more price sensitive
> Similar evidence for impact of price on other tobacco use

Direct vs. Indirect Effects of Price
• Price likely to impact youth smoking directly, but also indirectly
> through peers
> through parents
> through availability/accessibility
> and other mechanisms
• Estimates imply peer effects account for about one-third of overall price effect
> see similar patterns (somewhat smaller magnitude)with respect to parental influences

• Evidence of differential effect of price based on intensity of smoking and stage of smoking uptake
> Impact of price larger as intensity of smokingincreases
> Price has larger impact on later stages of smoking uptake
Implies price particularly importantin preventing transitions to regular,addicted smoking
Price, Intensity and Uptake
• Tauras, et al. (2001)
> uses longitudinal data from 8th/10th grade MTF cohorts in 1990s
- significant improvement over other studies based on single
cohort from late 1980s
> Alternative measures of smoking initiation
- any smoking
- daily smoking
- heavy daily smoking
> Find small negative impact of price on initiation
of any smoking, but much larger impact on
initiation of daily and heavy daily smoking
Price and Smoking Initiation

• Cessation among young adult smokers> Increased prices lead to significant increase in quit
attempts and successful long term cessation amongyoung adults
• Youth cessation
> Potential increases in price lead to significant reductions in likelihood of futuresmoking> Interest in cessation and cessation
attempts higher when prices are higher
Price and Smoking Cessation

POP Marketing and Youth SmokingLimited Models
Smoking
Prevalence Average use/smoker
Heavy Smoking Prevalence
Intercept .336* (.040)
7.04* (1.364)
.110* (.023)
Advertising -.012 (.011)
.150 (.256)
.002 (.006)
Promotions .042**
(.020) .323 (.481)
.022**
(.011) Placement .099*
(.023)
1.44**
(.564)
.046*
(.013) Premium Price
-.045*
(.017)
-.737**
(.291)
-.019**
(.007) Year 2 .0009
(.013) -.089 (.318)
-.001 (.007)
Year 3 -.006 (.014)
.542 (.337)
.001 (.008)
* p<.001; **p<.05; + p<.10. Standard errors in parentheses
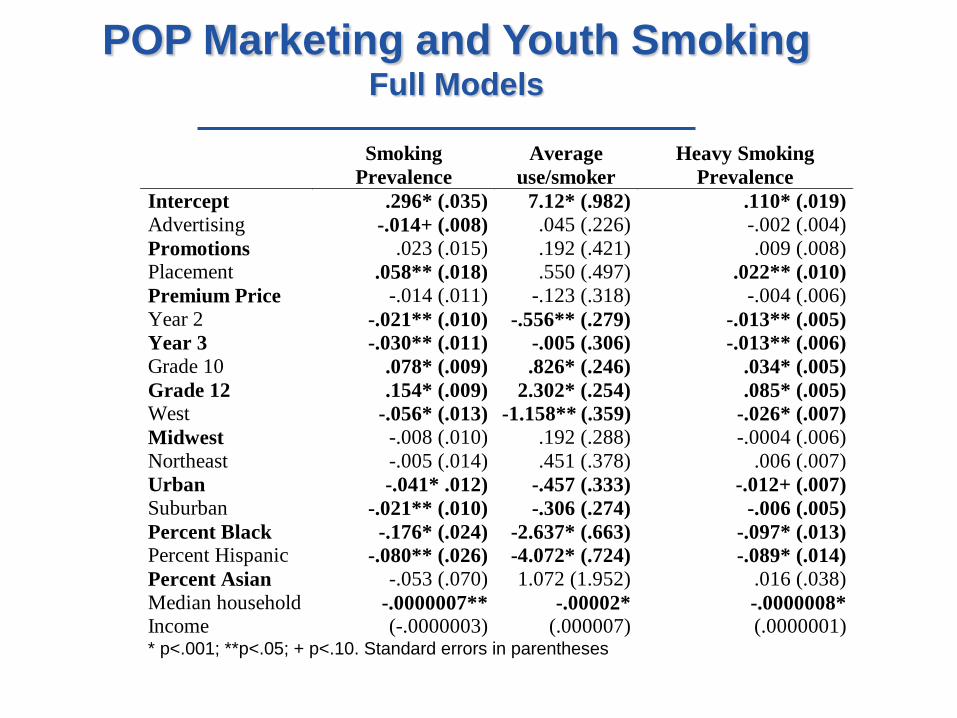
POP Marketing and Youth SmokingFull Models
Smoking
Prevalence
Average
use/smoker
Heavy Smoking
Prevalence
Intercept .296* (.035) 7.12* (.982) .110* (.019)
Advertising -.014+ (.008) .045 (.226) -.002 (.004)
Promotions .023 (.015) .192 (.421) .009 (.008) Placement .058** (.018) .550 (.497) .022** (.010)
Premium Price -.014 (.011) -.123 (.318) -.004 (.006)
Year 2 -.021** (.010) -.556** (.279) -.013** (.005)
Year 3 -.030** (.011) -.005 (.306) -.013** (.006)
Grade 10 .078* (.009) .826* (.246) .034* (.005)
Grade 12 .154* (.009) 2.302* (.254) .085* (.005)
West -.056* (.013) -1.158** (.359) -.026* (.007)
Midwest -.008 (.010) .192 (.288) -.0004 (.006)
Northeast -.005 (.014) .451 (.378) .006 (.007)
Urban -.041* .012) -.457 (.333) -.012+ (.007)
Suburban -.021** (.010) -.306 (.274) -.006 (.005)
Percent Black -.176* (.024) -2.637* (.663) -.097* (.013)
Percent Hispanic -.080** (.026) -4.072* (.724) -.089* (.014)
Percent Asian -.053 (.070) 1.072 (1.952) .016 (.038)
Median household Income
-.0000007**
(-.0000003) -.00002*
(.000007) -.0000008*
(.0000001) * p<.001; **p<.05; + p<.10. Standard errors in parentheses

• Strong and consistent evidence that higher cigarette and other tobacco product prices:
> Significantly reduce prevalence of youth and youngadult tobacco use> Significantly reduce cigarette and other tobacco
consumption among youths/young adults > Significantly reduces youth smoking initiation
> Significantly reduces smoking uptake andtransitions to heavier smoking> Significantly increases interest in quitting,
cessation attempts, and successfulcessation among youths/young adults
Conclusions, Limitations,
and Next Steps
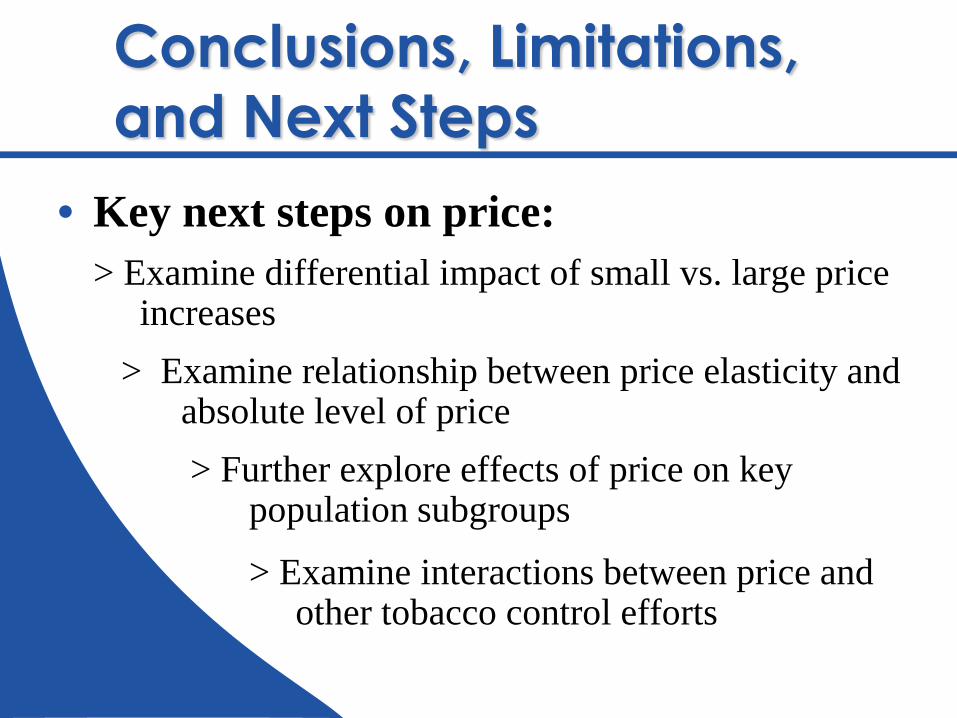
• Key next steps on price:
> Examine differential impact of small vs. large priceincreases
> Examine relationship between price elasticity andabsolute level of price
> Further explore effects of price on key population subgroups
> Examine interactions between price and other tobacco control efforts
Conclusions, Limitations,
and Next Steps

• Point-of-purchase tobacco marketing appears to have positive and significantimpact on youth smoking prevalence and consumption
> Placement and promotions appear particularlyimportant
> Much work remains to be done- additional years of data
- more complete measures of localtobacco-related environment
- application to individual-level data
Conclusions, Limitations,
and Next Steps

Bridging the Gap
Research Informing Practice for
Healthy Youth Behavior
Supported by
the Robert Wood Johnson Foundation and
administered by the University of Illinois at Chicago
www.impacteen.org