research in support of the draft guidelines on food data...
TRANSCRIPT
John GibsonUniversity of Waikato
United Nations Statistical Commission: March 7, 2017
Research in support of the draft guidelines on food data collection in household surveys for low- and middle-income countries
Why are new guidelines needed?
2
} Informed by recent evidence over the last decade from survey experiments in low-income countries
} previous recommendations often based on evidence from rich countries whose findings did not necessarily apply¨ E.g. diary surveys work poorly when under-resourced
} Rising affluence in low- and middle-income countries creates new challenges for surveying food consumption
} Designs appropriate for “common pot” meals prepared mostly from self-produced or bought ingredients are poorly suited to rapidly urbanizing settings with individualized eating by people who know nothing of the ingredients
} Good statistical systems find a way to deal with the tension of adapting to what now works best while not sacrificing comparability with what was done in the past
Summary of the main draft guidelines
3
} In low-income countries a food recall with 7-day period best balances cost and accuracy
} Uncertainty about whether recall should be bounded
} Either stagger sample over 12 months or have multiple visits per household, rather than field in only few months
} Both can deal with seasonality but revisits also allow for a possible method of controlling for excess variability
} All modes of food acquisition should be covered} Focus on food intended for consumption
If survey is not for a CPI or NAS, a food list of ca. 100 items may suffice
False economy from shorter lists which often save little time
Summary continued
4
} Consider including a meal participation roster} Little is known about competing options here} Interacts with recommendations on Food Away From Home
since a meal roster not only gets incoming guests, but also the meals that residents eat elsewhere
} Food Away From Home needs much more attention} A single question at the household-level is insufficient} Distinguish food prepared at home and consumed outside
from food prepared outside and consumed at home} Unit for FAFH data collection should be individuals not
households since household respondent often unaware of how “walking around money” is spent by their co-residents

Very important initiative
5
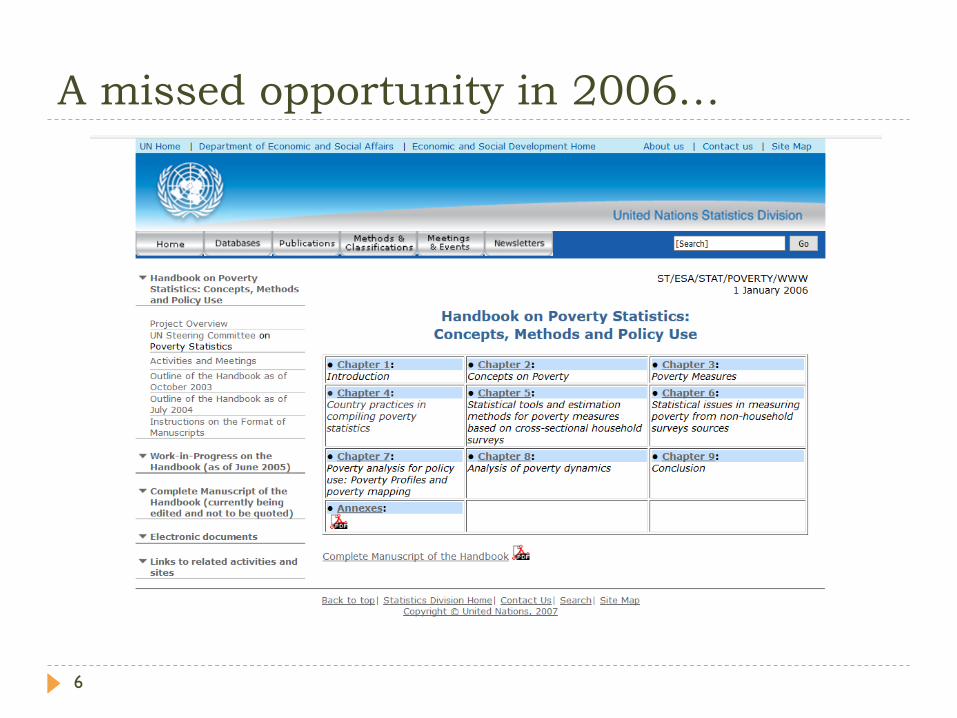
} Missed a chance in 2006 to harmonize/improve survey practice because UN Handbook on Poverty Statistics which included metadata survey of statistics offices stalled
} Much of the discrepancy in poverty measurement over time and space is based on gaps in the surveys
} Arguably missed chances with earlier LSMS to learn more about survey methods
} E.g. bounded recall talked about for decades but still little firm evidence for whether it is worth it
} Lots of what we now know for low-income countries is from a few experiments in Tanzania, Bangladesh etc so the widening of the evidence base may be one of the most valuable outcomes of this initiative
A missed opportunity in 2006…
6
An opportune time to revise survey practices…
7
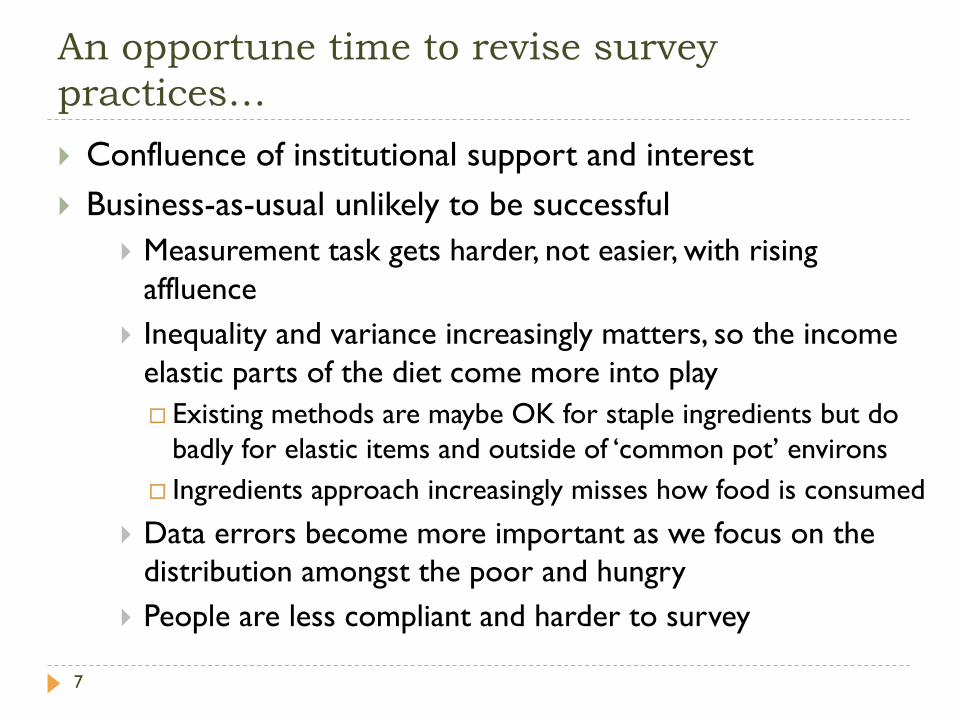
} Confluence of institutional support and interest} Business-as-usual unlikely to be successful
} Measurement task gets harder, not easier, with rising affluence
} Inequality and variance increasingly matters, so the income elastic parts of the diet come more into play¨ Existing methods are maybe OK for staple ingredients but do
badly for elastic items and outside of ‘common pot’ environs¨ Ingredients approach increasingly misses how food is consumed
} Data errors become more important as we focus on the distribution amongst the poor and hungry
} People are less compliant and harder to survey
Surveys Less Informative About Poverty and Hunger Than is Often Realized
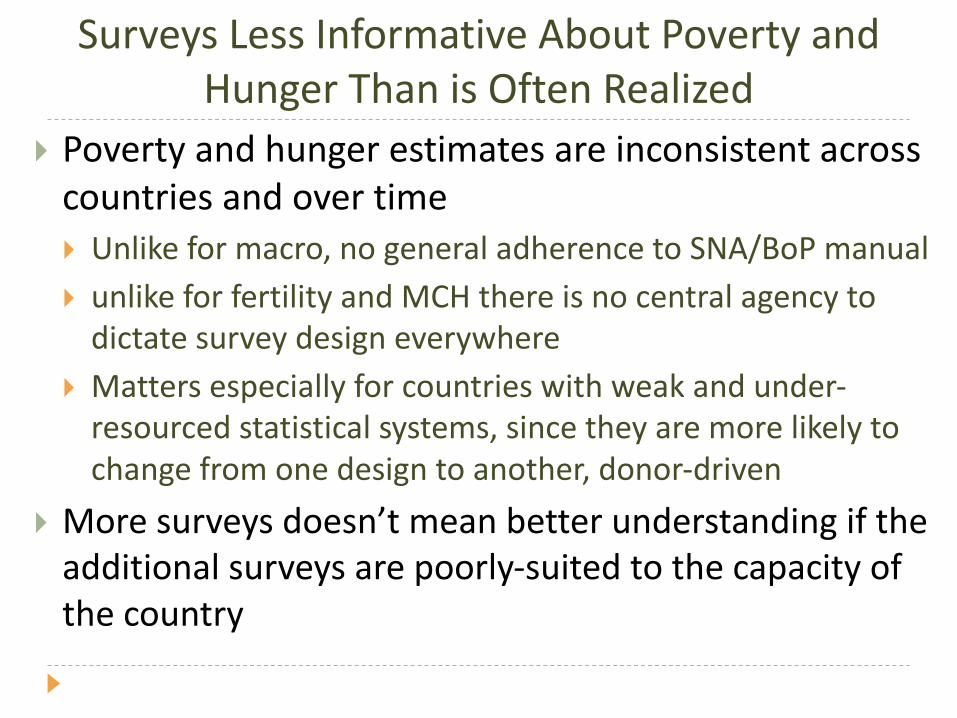
} Poverty and hunger estimates are inconsistent across countries and over time} Unlike for macro, no general adherence to SNA/BoP manual} unlike for fertility and MCH there is no central agency to dictate survey design everywhere
} Matters especially for countries with weak and under-‐resourced statistical systems, since they are more likely to change from one design to another, donor-‐driven
} More surveys doesn’t mean better understanding if the additional surveys are poorly-‐suited to the capacity of the country
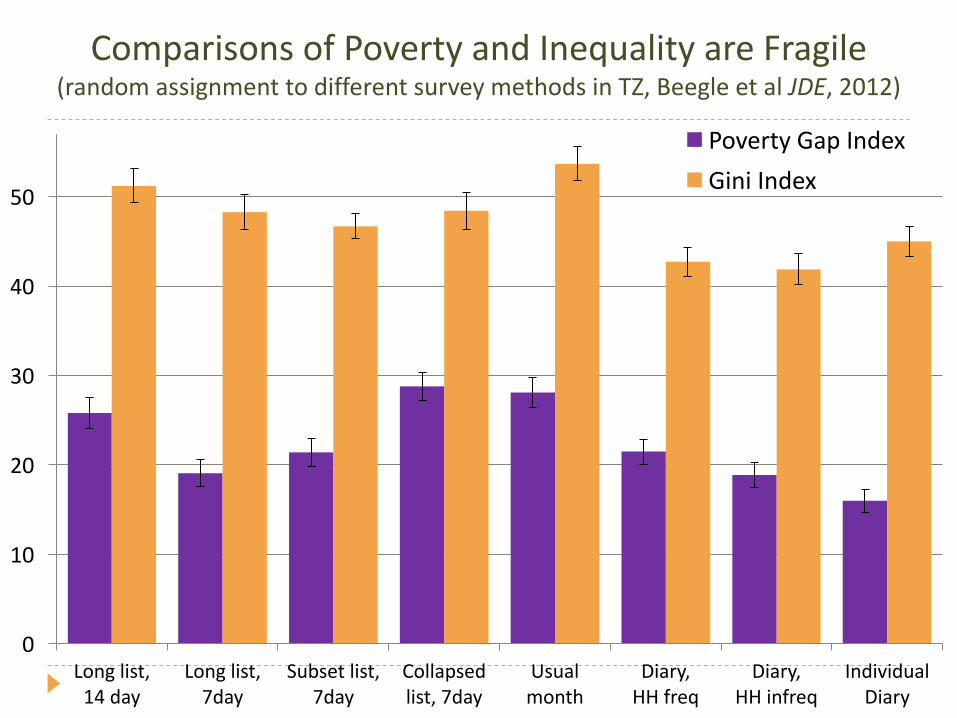
Comparisons of Poverty and Inequality are Fragile(random assignment to different survey methods in TZ, Beegle et al JDE, 2012)
0
10
20
30
40
50
Long list, 14 day
Long list, 7day
Subset list, 7day
Collapsed list, 7day
Usual month
Diary, HH freq
Diary, HH infreq
Individual Diary
Poverty Gap IndexGini Index
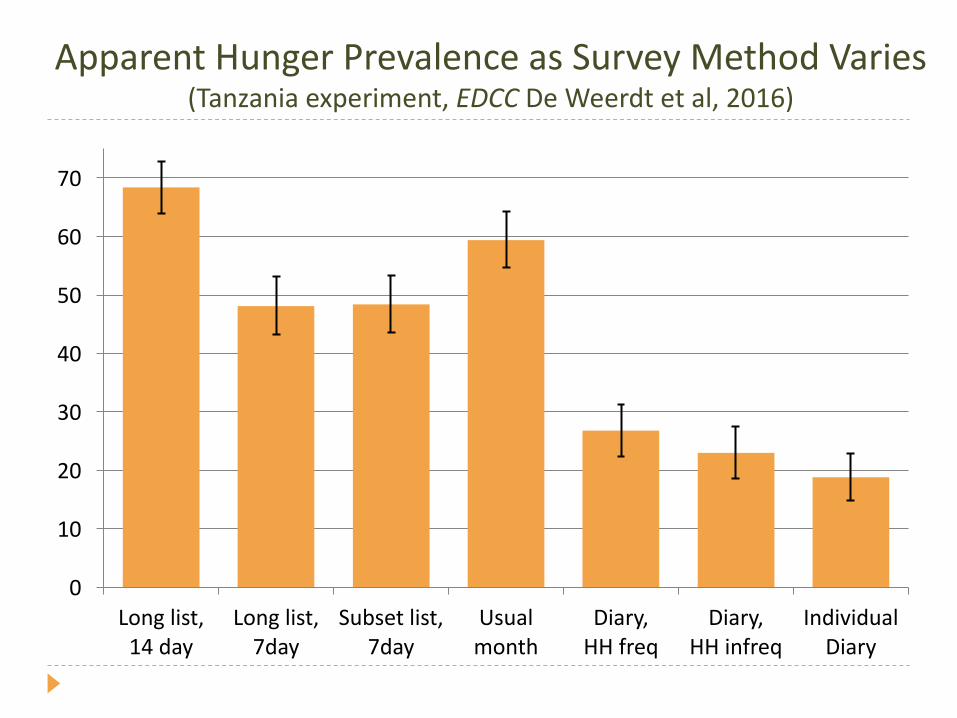
Apparent Hunger Prevalence as Survey Method Varies(Tanzania experiment, EDCC De Weerdt et al, 2016)
0
10
20
30
40
50
60
70
Long list, 14 day
Long list, 7day
Subset list, 7day
Usual month
Diary, HH freq
Diary, HH infreq
Individual Diary

Our Traditional Food Survey Emphasis is Misplaced
0.05
0.10
0.15
0.20
0.25
1996 1998 2000 2002 2004 2006 2008 2010 2012
Share of To
tal Foo
d Expe
nditu
re
Urban China
Eating Out/Total Food
Grain/Total Food
Feature of the new evidence is that it provides evidence on resource implications
} Survey experiments are always limited since we do not know the true consumption level} Plausible benchmarks can be provided by intensive
monitoring that is impractical in typical settings} Also from statistical frameworks, such as Benford’s Law
} Exercises using both types of framework suggest that some survey resources are misallocated} Revisiting every 2-3 days over a month, or using a
diary, doesn’t necessarily give more accurate data but costs much more
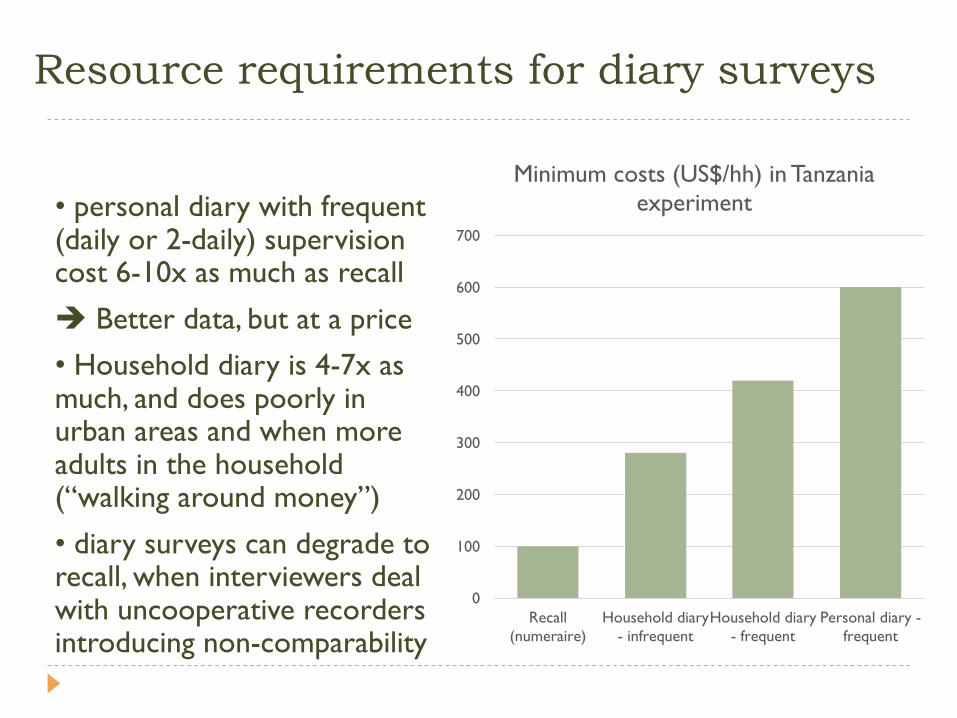
Resource requirements for diary surveys
• personal diary with frequent (daily or 2-daily) supervision cost 6-10x as much as recall
è Better data, but at a price
• Household diary is 4-7x as much, and does poorly in urban areas and when more adults in the household (“walking around money”)
• diary surveys can degrade to recall, when interviewers deal with uncooperative recorders introducing non-comparability
0
100
200
300
400
500
600
700
Recall (numeraire)
Household diary - infrequent
Household diary - frequent
Personal diary -frequent
Minimum costs (US$/hh) in Tanzania experiment

Diary fatigue leads to wasted surveys
} Example from Papua New Guinea diary-keeping HIES that cost $15m, with live-in enumerators 3 weeks per village} The PNG CPI is only priced in, and applies to, a handful of urban
areas but the survey was carried out nationally
} Number of transactions in diaries declined by 3.4% per day} Total value of consumption transactions declined by 4.4% per day
of diary keeping periodè can’t distinguish the poor from those who got fed up
Fed up respondents mattered elsewhere too} Less cooperation measuring ending food stocks than starting ones,
with (apparent) destocking cutting 4%age points off poverty rateèHard to use this expensive survey to measure poverty14

Diary Fatigue: PNG HIES 2009-10
15
3
4
5
6
7
8
9
10
5
10
15
20
25
30
35
40
1 2 3 4 5 6 7 8 9 10 11 12 13 14
Average value pe
r transactio
n (Kina)
Num
ber ('000
s), Sum
of log value
(K'000
s)
Diary-‐Keeping Day
Number (LHS) Value (LHS) Average Value (RHS)

Seasonality, revisits, and reference periods
16
} Many surveys will want longer reference periods than just one week (a ‘snapshot’ of usual diets)} At extreme, FAO PoU refers to one-year so some way of
extrapolating from one-week to one-year is needed that does not create excess variability in long-run welfare estimates
} The key is how highly correlated is the consumption of the same people in different periods of the year
} Limited evidence on this suggests that the correlations are quite low, » 0.5, and so revisiting the same household is informative
} è the consumption of the household is a moving target and going to great expense to capture it exactly in one snapshot is mistaken
} The burden on households and on budgets could be reduced by reallocating some adjacent interviews (e.g. with a diary survey) to, say, six months later
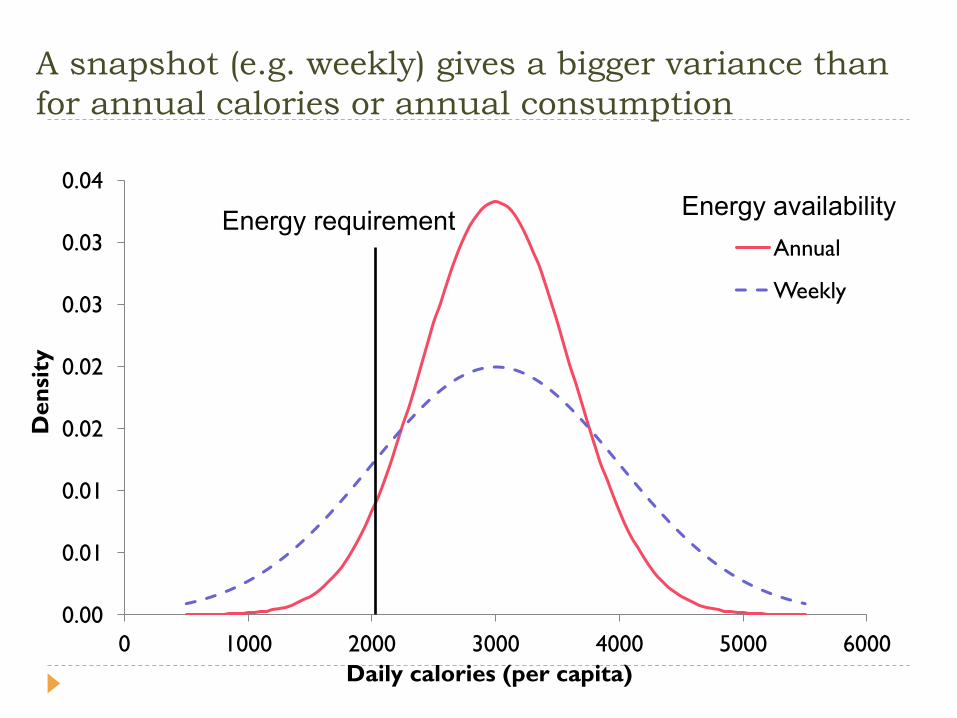
A snapshot (e.g. weekly) gives a bigger variance than for annual calories or annual consumption
0.00
0.01
0.01
0.02
0.02
0.03
0.03
0.04
0 1000 2000 3000 4000 5000 6000
Den
sity
Daily calories (per capita)
Annual
Weekly
Energy availabilityEnergy requirement
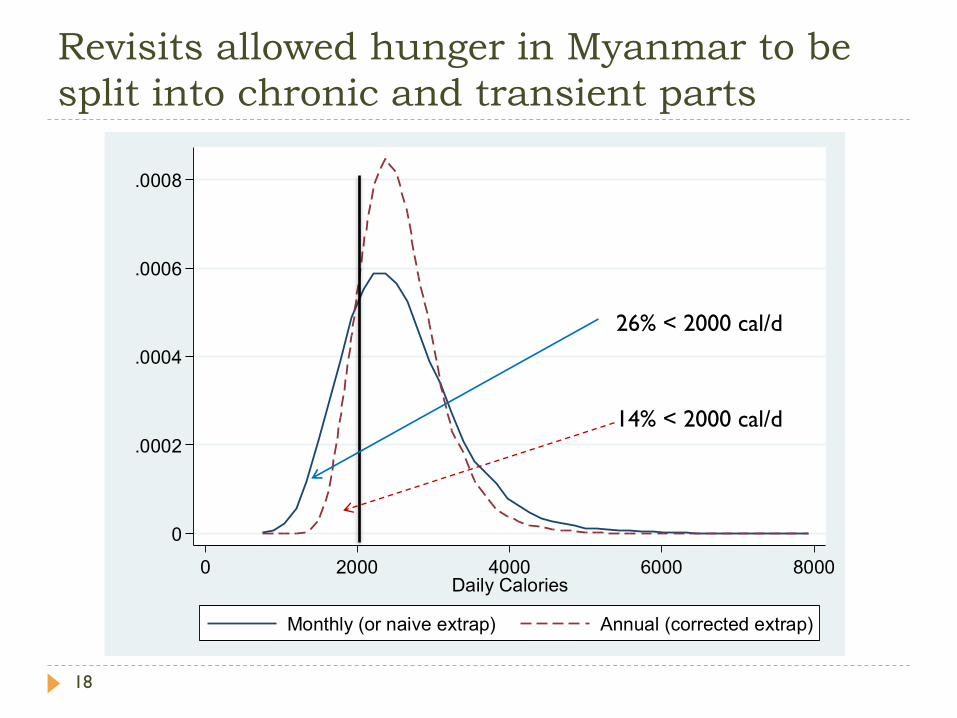
Revisits allowed hunger in Myanmar to be split into chronic and transient parts
18
0
.0002
.0004
.0006
.0008
0 2000 4000 6000 8000Daily Calories
Monthly (or naive extrap) Annual (corrected extrap)
26% < 2000 cal/d
14% < 2000 cal/d
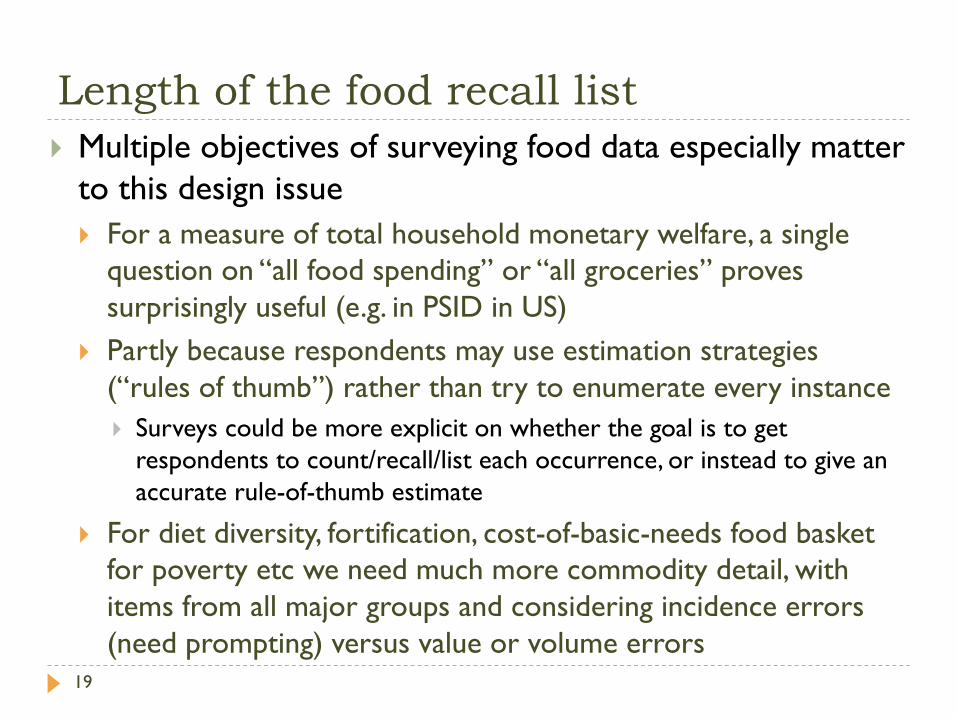
Length of the food recall list
19
} Multiple objectives of surveying food data especially matter to this design issue} For a measure of total household monetary welfare, a single
question on “all food spending” or “all groceries” proves surprisingly useful (e.g. in PSID in US)
} Partly because respondents may use estimation strategies (“rules of thumb”) rather than try to enumerate every instance} Surveys could be more explicit on whether the goal is to get
respondents to count/recall/list each occurrence, or instead to give an accurate rule-of-thumb estimate
} For diet diversity, fortification, cost-of-basic-needs food basket for poverty etc we need much more commodity detail, with items from all major groups and considering incidence errors (need prompting) versus value or volume errors
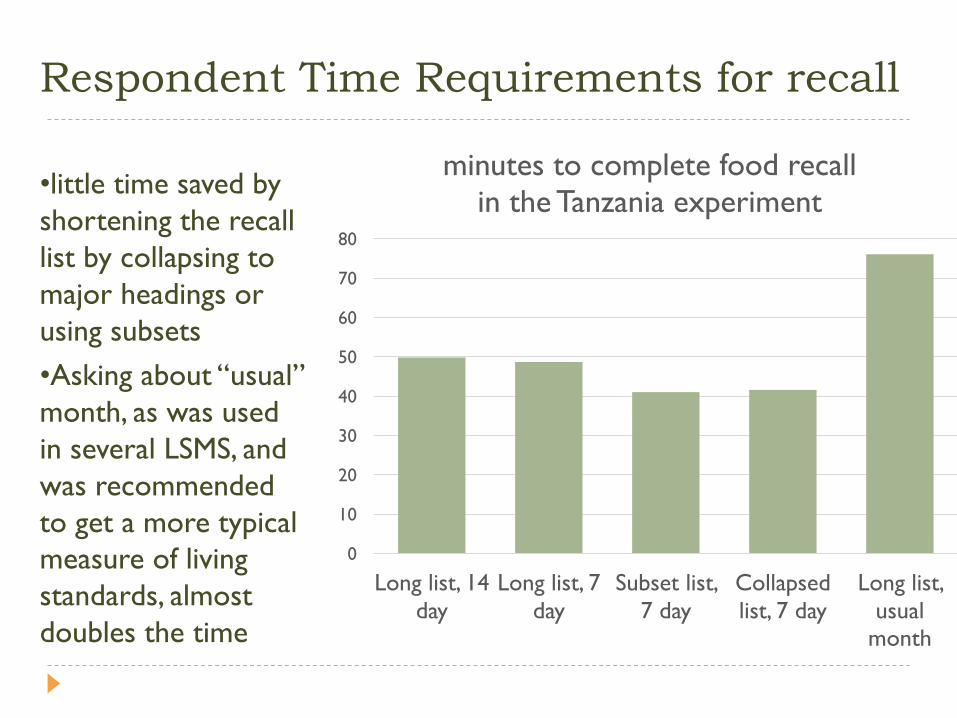
Respondent Time Requirements for recall
•little time saved by shortening the recall list by collapsing to major headings or using subsets•Asking about “usual” month, as was used in several LSMS, and was recommended to get a more typical measure of living standards, almost doubles the time
0
10
20
30
40
50
60
70
80
Long list, 14 day
Long list, 7 day
Subset list, 7 day
Collapsed list, 7 day
Long list, usual
month
minutes to complete food recallin the Tanzania experiment
Draft guidelines are ambivalent on prices
21
} Treating prices as separate from household surveys is awkward as need them to properly measure food } Derive quantity from expenditure for non-quantified items} Cross-checking plausibility of reported values/quantities} Unit values are not prices but also have their own use
} As a measure of quality, where they matter to debates about how pricing policy can influence consumer behavior
} E.g. effect of the soda tax on soda demand in Mexico (and thus on possible future obesity) seems four-times larger if quality responses are ignored and unit values are used as a proxy for prices
} Prices become more important as consumers transition from own-production to market purchases} Without price data, quality of life (buying premium varieties) gets
confused with the cost of living and biases poverty profiles
Where to from here?
22
} The evidence base to support the guidelines can usefully grow further, particularly in low-income countries} Good collaboration of donors, researchers and statistics
offices is essential for improving this evidence} At the country level, if some of the guidelines are adopted it
may entail changes in survey design} Any change in method should have a controlled comparison
to ‘bridge’ old/new} Support for these bridging exercises might usefully come
from donors, since ‘old’ and ‘new’ surveys may not have the same funders supporting them and the bridging exercise may not fall into either survey’s budget frame

Thank You