research findings for future computer energy efficiency ... · research findings for future...
TRANSCRIPT

Research Findings for Future Computer Energy Efficiency Specifications
Chris Calwell, Director of Policy and ResearchSuzanne Foster, Senior Research Analyst
Ecos Consulting March 15, 2005

Why go beyond Tier 1?
• Tier 1 does not address networking issues with sleep enabling (LBNL)
• Components other than power supply are not specifically considered in Tier 1
• Capture further energy savings with processors and video cards that scale energy consumption to load profile
• Idle mode currently being considered for Tier 1, but active mode energy use still unchecked
• 2 research avenues: component efficiency and system efficiency

United States Refrigerator Use v. Time
0
200
400
600
800
1,000
1,200
1,400
1,600
1,800
2,000
1947 1952 1957 1962 1967 1972 1977 1982 1987 1992 1997 2002
Ave
rage
Ene
rgy
Use
or P
rice
0
5
10
15
20
25
Ref
riger
ator
vol
ume
(cub
ic fe
et)
Energy Use per Unit(KWH/Year)
Refrigerator Size (cubic ft)
Refrigerator Price in 1983 $
$ 1,270
$ 462
Computer KWH/Year

Peak Power of Desktop Computers RisingProjected Change in Peak Power Consumption of Desktop Computers
0
50
100
150
200
250
300
350
400
450
500
2002 2004 2005
Wat
ts
Power SupplyOtherVRMsGraphics CardCPU
57% 70% 80% typical power supply efficiency
10%
23%
41%
43%
30%
20%
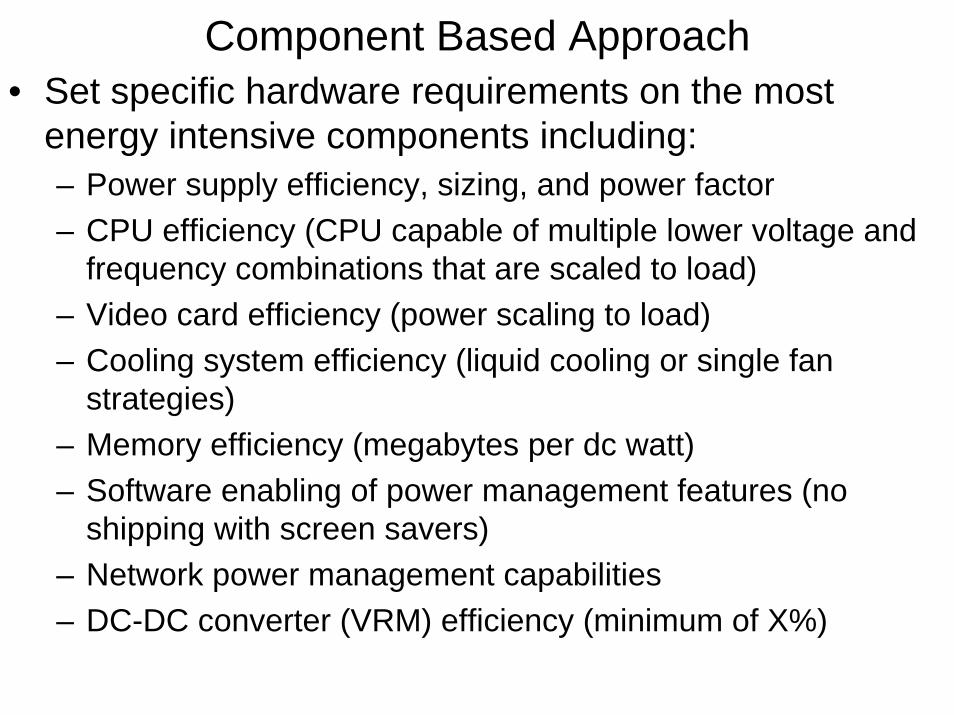
Component Based Approach• Set specific hardware requirements on the most
energy intensive components including:– Power supply efficiency, sizing, and power factor– CPU efficiency (CPU capable of multiple lower voltage and
frequency combinations that are scaled to load)– Video card efficiency (power scaling to load)– Cooling system efficiency (liquid cooling or single fan
strategies)– Memory efficiency (megabytes per dc watt)– Software enabling of power management features (no
shipping with screen savers)– Network power management capabilities– DC-DC converter (VRM) efficiency (minimum of X%)

More Efficient Power Supplies Can Be Simpler and More Reliable than Traditional Designs

Power Supply Efficiency is a Market Opportunity for Innovative Component
Manufacturers

Effect of PSU Efficiency & Sizingon Idle State Power, Intel-based system
65%
70%
75%
80%
85%
90%
0 100 200 300 400 500 600
Nameplate DC Power Rating (watts)
Ave
rage
Eff
icie
ncy
80.7 W
59.3 W
50.1 W
62.6 W
Impact of Power Supply Size on Ac
Power Use of Desktops and
Servers

Excerpts from 2005
Tom’s Hardware review of various desktop power
supplies for efficiency
and performance

Processor Throttling: Comparable Performance, Reduced Energy Use
• More than one CPU manufacturer has created processors that scale CPU power requirements to load
• Processor throttling can cut processor power use by roughly 25 to 70% during periods of inactivity (idle)
• Processor throttling can cut system power use by roughly 12 to 24%, depending on system configuration and duty cycle

Another Example of Processor Throttling
7 1 % 5 9 % 5 7 % 7 2 % 7 1 % 4 6 % 7 1 % 5 2 % 7 3 %
0
2
4
6
8
1 0
1 2
1 4
1 6
1 8
2 0
W in d o w s Id le W o rd E xc e l P o w e rP o in t D VDP la yb a c k
MP E G 4P la yb a c k
MP 3P la yb a c k
F la s hP la yb a c k
MP 3E n c o d in g
Ave
rage
CPU
Pow
er (W
att)
3 5 W M o b i le A thlo n X P 1 6 0 0 + , P o w e rN o w ! d is a b le d 3 5 W M o b i le A thlo n X P 1 6 0 0 + , P o w e rN o w ! e na b le d% P o w e r S a ving s w i th P o w e rN o w !
Processor throttling also from Sun, Apple and Transmeta

Ecos Lab Measurements of Processor Throttling in Idle State
Effects of CPU Power Scaling on Idle State Power
50
55
60
65
70
75
Elapsed Time (minutes)
Idle
Sta
te P
ower
(wat
ts)
CPU Power Scaling DisabledCPU Power Scaling Enabled
Approximately 14% idle state power reductiondue to CPU power scaling technology

Big Energy Savings Potential Using Latest Generation Mobile Processors in Desktop Applications

Efficient Power Supply Combined with Processor Throttling in Server

Other Indications of Potential for
Reducing Processor Power
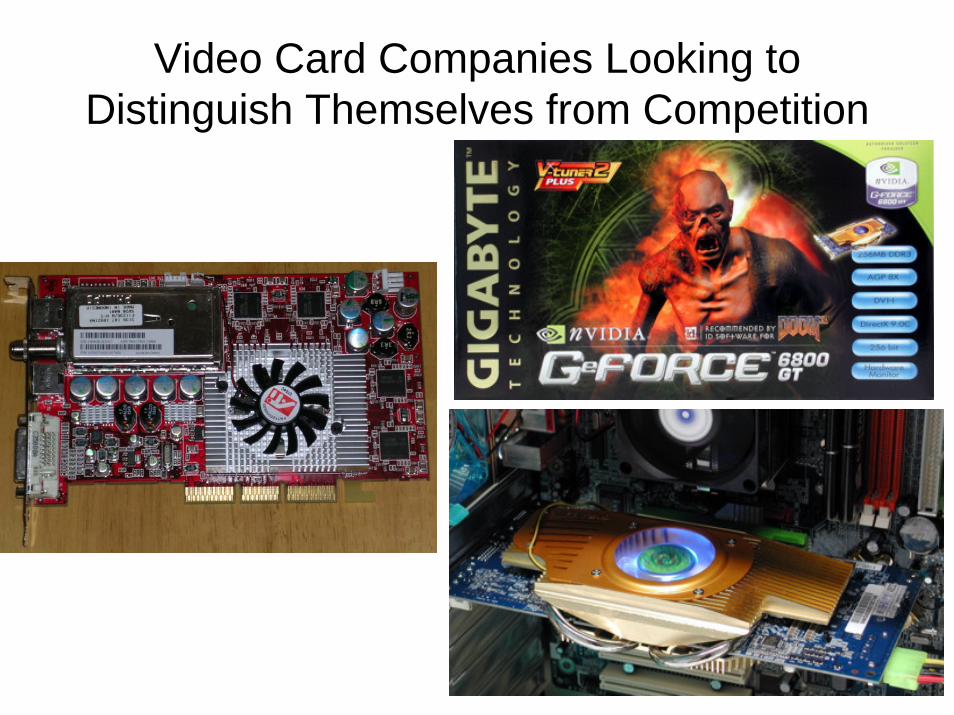
Video Card Companies Looking to Distinguish Themselves from Competition

Energy Use of Video Cards is Increasing
Effect of High Performance Video Card on Idle State Power
60
70
80
90
100
110
120
0 30 60 90
Elapsed Time (seconds)
Idle
Sta
te P
ower
(wat
ts)
High-performance video cardStock Media Center video card
High-performance video card increasesidle state power by 40 W

10 Fans in a Desktop PC?1 side case fan 2 power supply fans 1 video card fan
2 motherboard fans 2 rear case fans 2 front case fans

Ecos Measurements: Effects of Fan Configuration on Ac Power in Idle
60
65
70
75
80
85
90
Time (seconds)
Idle
Sta
te P
ower
(wat
ts)
5 system fans
3 system fans
1 system fan6 W (AC) difference between oversizedand right-sized fan configuration

Quickly Growing is Market Share of Small Form Factors with the Most Efficient Thermal Solutions

Set Top Boxes, PCs & Home Audio/Video are Converging

Advantages of Holistic System Design
• Cleaner, simpler installation of components
• Minimal need for long runs of loose cabling
• Better control of thermal performance in individual zones
• Allows more optimal sizing of power supply

Opportunities to Cut Memory Energy Use
• DDR2 is in the process of supplanting DDR memory – savings of about 20 to 25% by moving to a faster, lower voltage technology
• Infineon claims even lower energy use for its DDR2 modules than its competitors


User Intuitive Software that Enables Hardware Solutions Important to Ensure Energy Savings

System Efficiency Approach• Treat computer system as a black box and measure the
system efficiency• Use a software benchmark to simultaneously measure
the energy use of computer and the performance over a set of established tasks
• Tasks performed by the computer over the course of the benchmark should be based on the way a computer is actually used in home and office environments
• One metric created for the efficiency of the computer; options include: Performance score per annual kWh, performance score per Wh
• Measure the efficiency of the interaction of all the components inside the housing of the computer and leave the power engineering to the OEMs and component manufacturers

Benchmarking Already Routinely Used in Computer Industry Marketing Campaigns and Buyers’ Guides

Energy Efficiency Benchmark• Ideal benchmark
– Characterize the typical duty cycle of computer in home/office/data center
– Developed independent of one specific hardware technology or software platform (enable fair comparison of Apple/Linux/Unix/ Windows machines and Apple/AMD/Intel/Transmeta based machines)
– Relatively easy to use for quick turn-around measurement in laboratory• Benchmark that incorporates all of these characteristics does
not exist in market today, elements are found scattered in different solutions
• Server software benchmark examplesBenchmark Name Representative of
Typical Client LoadRepresentative of Maximum Client Load
WebStone XNetBench X
Webserver Stress Tool X X

Examples of Desktop Benchmark SoftwareBenchmark Name Representative of
Normal ProcessingRepresentative of
Maximum ProcessingPC WorldBench XPCMark XSysMark XPerformance Test XFresh Diagnose XBusiness Winstone XWinBench XSpeedMark (Apple) XSANDRA XAlterion Acceptable Level of Performance X
XBench (Apple) X

Benchmark Concept: Windows Based Systems
40
60
80
100
120
140
160
0 1 2 3 4
Time (minutes)
AC
Wal
l Plu
g Po
wer
(wat
ts)
PC WorldBench4 Score: 215 Energy Consumed over benchmark (Wh): 7.6 Efficiency Metric (performance/ Wh): 28(Effi i f t ith ffi i t l d

Benchmark Concept: Apple Based Systems
AC Power ConsumptioniMac G5 Running XBench Tests
0
20
40
60
80
100
120
0 20 40 60 80 100 120
Elapsed Time (secs)
Pow
er (w
atts
)
XBench score: 152Energy consumed over benchmark (Wh): 2.5 Performance metric (performance/Wh): 61

System ConfigurationPCMark 2004 Score
Energy Consumed Over Benchmark (Wh)
Efficiency Metric (performance/Wh)
AMD based with high efficiency (85%), right-sized PS (250W) 3595 17.1 211AMD-based with high efficiency (79%), oversized PS (450W) 3574 20 178AMD-based with stock configuration 3603 20.5 176AMD-based with CPU power scaling technology enabled 3571 20.5 174Intel-based with high efficiency (85%), appropriately-sized PS (250W) 3642 21.6 169AMD-based with low efficiency (70%), oversized PS (480W) 3580 24.3 147Intel-based with high efficiency (79%), oversized PS (450W) 3654 26.6 137Intel-based with stock configuration 3583 28 128AMD-based with high performance video card 3963 32 124Intel-based with low efficiency (70%), oversized PS (480W) 3576 31.4 114Intel-based with nigh performance video card 4043 38.7 104

Range of System Configurations
High-power• 5 system fans• High-end video
card• Power scaling
disabled • Oversized,
inefficient power supply
Standard• 1 system fan• Stock video card• Power scaling
disabled• Right-sized,
inefficient power supply
Efficient• 1 system fan• Stock video card• Power scaling
CPU enabled• Right-sized,
efficient power supply
AMD Athlon 64 2800+ based desktop system

Energy Use and Benchmark Score of 3 Desktop PC Configurations
Overall System Configuration and Idle State Power
0
20
40
60
80
100
120
140
160
0 30 60 90 120
Elapsed Time (seconds)
Idle
Sta
te P
ower
(wat
ts)
High power configuration
Base configuration
High efficiency configuration
~100% increase in idle state power for high-power configuration
~20% reduction in idle state powerfor high efficiency configuration
PCMark Score: 4220
PCMark Score: 3603
PCMark Score: 3588

How Many Software Benchmarks?
• Single benchmark that measures desktops, laptops, workstations, and servers
• Different benchmarks for different applications – One for desktops and laptops, one for servers and
workstations• One benchmarks enables comparisons across
different form factors• Multiple benchmarks enables tests to more
closely match actual user behavior
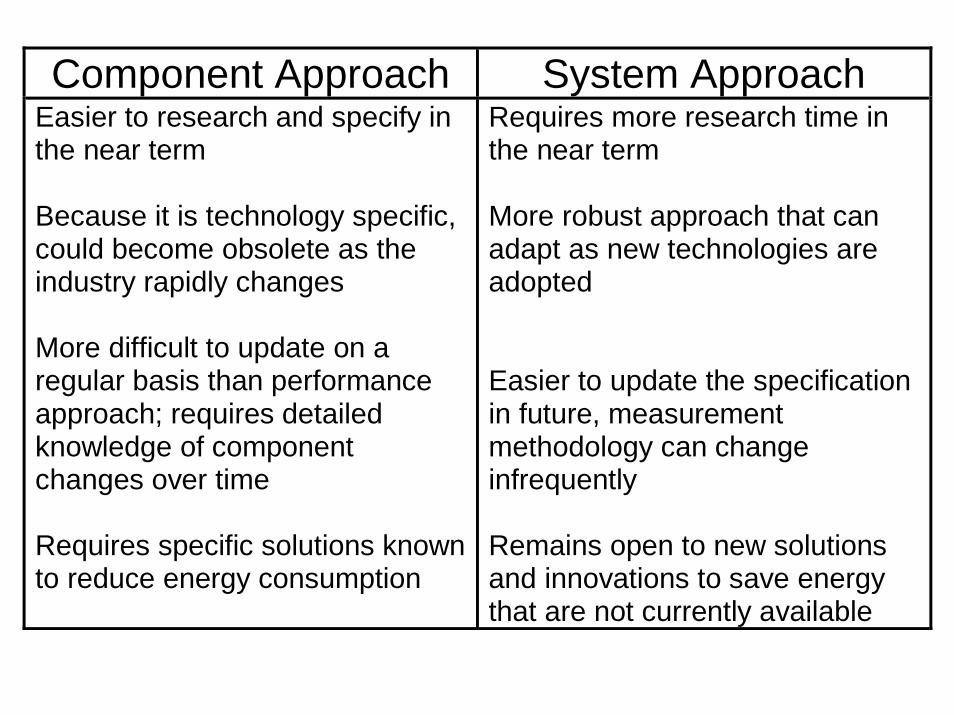
Component Approach System Approach Easier to research and specify in the near term Because it is technology specific, could become obsolete as the industry rapidly changes More difficult to update on a regular basis than performance approach; requires detailed knowledge of component changes over time Requires specific solutions known to reduce energy consumption
Requires more research time in the near term More robust approach that can adapt as new technologies are adopted Easier to update the specification in future, measurement methodology can change infrequently Remains open to new solutions and innovations to save energy that are not currently available

Timeline for Tier 2
• Further research to be conducted in 2005– Measuring and evaluating components – Evaluating benchmarks and working with
benchmarking companies to get feedback on energy efficiency benchmark
• Update at next stakeholder workshop