research design - weeblyibave.weebly.com/uploads/1/0/7/4/10741354/research_design.pdf · research...
TRANSCRIPT

90
Introduction
Three Purposes of ResearchExplorationDescriptionExplanation
The Logic of Nomothetic Explanation
Criteria for Nomothetic CausalityNomothetic Causal Analysis and Hypothesis TestingFalse Criteria for Nomothetic Causality
Necessary and Sufficient Causes
Units of AnalysisIndividualsGroupsOrganizationsSocial InteractionsSocial ArtifactsUnits of Analysis in ReviewFaulty Reasoning about Units of Analysis: The Ecological Fallacy and Reductionism
The Time DimensionCross-Sectional StudiesLongitudinal StudiesApproximating Longitudinal StudiesExamples of Research Strategies
How to Design a Research ProjectGetting StartedConceptualizationChoice of Research MethodOperationalizationPopulation and SamplingObservationsData ProcessingAnalysisApplicationResearch Design in Review
The Research ProposalElements of a Research Proposal
The Ethics of Research Design
C H A P T E R F O U R
Research Design
C H A P T E R O V E R V I E W
Here you’ll see the wide variety of
research designs available to social
researchers as well as how to design
a study—that is, specifying exactly
who or what is to be studied when,
how, and for what purpose.
CengageNOW for Sociology
Use this online tool to help you make the grade on your next exam. After reading this chapter, go to “Online Study Resources” at the end of the chapter for instructions on how to benefit from CengageNOW.
Introduction ■ 91
IntroductionScience is an enterprise dedicated to “finding out.” No matter what you want to find out, though, there will likely be a great many ways of doing it. That’s true in life generally. Suppose, for example, that you want to find out whether a particular au-tomobile—say, the new Burpo-Blasto—would be a good car for you. You could, of course, buy one and find out that way. Or you could talk to a lot of B-B owners or to people who considered buying one but didn’t. You might check the classified ads to see if there are a lot of B-Bs being sold cheap. You could read a consumer magazine evaluation of Burpo-Blastos. A similar situation occurs in scientific inquiry.
Ultimately, scientific inquiry comes down to making observations and interpreting what you’ve observed, the subjects of Parts 3 and 4 of this book. Before you can observe and analyze, however, you need a plan. You need to determine what you’re going to observe and analyze: why and how. That’s what research design is all about.
Although the details vary according to what you wish to study, you face two major tasks in any research design. First, you must specify as clearly as possible what you want to find out. Second, you must determine the best way to do it. Interestingly, if you can handle the first consideration fully, you’ll probably handle the second in the same process. As mathematicians say, a properly framed question contains the answer.
Let’s say you’re interested in conducting social research on terrorism. When Jeffrey Ross (2004) addressed this issue, he found the existing studies used a variety of qualitative and quantitative approaches. Qualitative researchers, for example, generated original data through
Autobiographies
Incident Reports and Accounts
Hostages’ Experiences with Terrorists
Firsthand Accounts of Implementing Policies
Ross goes on to discuss some of the secondary materials used by qualitative researchers: “bi-
ographies of terrorists, case studies of terrorist organizations, case studies on types of terrorism, case studies on particular terrorist incidents, and case studies of terrorism in selected regions and countries” (2004: 27). Quantitative researchers, on the other hand, have addressed terrorism in a variety of ways, including analyses of media cover-age, statistical modeling of terrorist events, and the use of various databases relevant to the topic. As you’ll see in this chapter, any research topic can be approached from many different directions. Each of the topics we’ll examine is relevant to both qualita-tive and quantitative studies, though some topics may be more relevant to one than to the other approach.
This chapter provides a general introduction to research design, whereas the other chapters in Part 2 elaborate on specific aspects of it. In prac-tice, all aspects of research design are interrelated. As you read through Part 2, the interrelationships among parts will become clearer.
We’ll start by briefly examining the main pur-poses of social research. Then, we’ll consider units of analysis—the what or whom you want to study. Next we’ll consider ways of handling time in social research, or how to study a moving target that changes over time.
With these ideas in hand, we’ll turn to how to design a research project. This overview of the research process serves two purposes: Besides de-scribing how you might go about designing a study, it provides a map of the remainder of this book.
Next, we’ll look at the elements of research proposals. Often, you’ll need to detail your inten-tions before you actually conduct your research; this might be required in order to obtain funding for a major project or perhaps to get your instruc-tor’s approval for a class project. You’ll see that the research proposal provides an excellent opportu-nity for you to consider all aspects of your research in advance. Also, this section should help you with the end-of-chapter exercise concerning the research proposal, if you are doing that. Finally, the last section of this chapter focuses on the ethical dimension of research design.
92 ■ Chapter 4: Research Design
group discussions. This technique is frequently used in market research; we’ll examine it further in Chapter 10.
Exploratory studies are most typically done for three purposes: (1) to satisfy the researcher’s curiosity and desire for better understanding, (2) to test the feasibility of undertaking a more extensive study, and (3) to develop the methods to be em-ployed in any subsequent study.
A while back, for example, I became aware of the growing popularity of something called “chan-neling,” in which a person known as a channel or medium enters a trance state and begins speaking with a voice that claims it originates outside the channel. Some of the voices say they come from a spirit world of the dead, some say they are from other planets, and still others say they exist in dimensions of reality difficult to explain in ordinary human terms.
The channeled voices, often referred to as enti-ties, sometimes use the metaphor of radio or televi-sion for the phenomenon they represent. “When you watch the news,” one told me in the course of an interview, “you don’t believe Dan Rather is really inside the television set. The same is true of me. I use this medium’s body the way Dan Rather uses your television set.”
The idea of channeling interested me from several perspectives, not the least of which was the methodological question of how to study scientifically something that violates so much of what we take for granted, including scientific staples such as space, time, causation, and individuality.
Lacking any rigorous theory or precise expecta-tions, I merely set out to learn more. Using some of the techniques of qualitative field research dis-cussed in Chapter 10, I began amassing information and forming categories for making sense of what I observed. I read books and articles about the phe-nomenon and talked to people who had attended channeling sessions. I then attended channeling sessions myself, observing those who attended as well as the channel and entity. Next, I conducted personal interviews with numerous channels and entities.
Three Purposes of ResearchSocial research can serve many purposes. Three of the most common and useful purposes are ex-ploration, description, and explanation. Although a given study can have more than one of these pur-poses—and most do—examining them separately is useful because each has different implications for other aspects of research design.
ExplorationMuch of social research is conducted to explore a topic, that is, to start to familiarize a researcher with that topic. This approach typically occurs when a researcher examines a new interest or when the subject of study itself is relatively new.
As an example, let’s suppose that widespread taxpayer dissatisfaction with the government erupts into a taxpayers’ revolt. People begin refusing to pay their taxes, and they organize themselves around that issue. You might like to learn more about the movement: How widespread is it? What levels and degrees of support are there within the community? How is the movement organized? What kinds of people are active in it? An explor-atory study could help you find at least approxi-mate answers to some of these questions. You might check figures with tax-collecting officials, collect and study the literature of the movement, attend meetings, and interview leaders.
Exploratory studies are also appropriate for more persistent phenomena. Suppose you’re un-happy with your college’s graduation requirements and want to help change them. You might study the history of such requirements at the college and meet with college officials to learn the reasons for the current standards. You could talk to several students to get a rough idea of their sentiments on the subject. Though this last activity would not necessarily yield an accurate picture of student opinion, it could suggest what the results of a more extensive study might be.
Sometimes exploratory research is pursued through the use of focus groups, or guided small-

Three Purposes of Research ■ 93
Exploratory studies are quite valuable in social science research. They’re essential whenever a re-searcher is breaking new ground, and they almost always yield new insights into a topic for research. Exploratory studies are also a source of grounded theory, as discussed in Chapter 2.
The chief shortcoming of exploratory studies is that they seldom provide satisfactory answers to research questions, though they can hint at the answers and can suggest which research methods could provide definitive ones. The reason explor-atory studies are seldom definitive in themselves has to do with representativeness; that is, the people you study in your exploratory research may not be typical of the larger population that inter-ests you. Once you understand representativeness, you’ll be able to know whether a given exploratory study actually answered its research problem or only pointed the way toward an answer. (Repre-sentativeness is discussed at length in Chapter 7.)
DescriptionA major purpose of many social science studies is to describe situations and events. The researcher observes and then describes what was observed. Because scientific observation is careful and delib-erate, however, scientific descriptions are typically more accurate and precise than casual ones are.
The U.S. Census is an excellent example of descriptive social research. The goal of the cen-sus is to describe accurately and precisely a wide variety of characteristics of the U.S. population, as well as the populations of smaller areas such as states and counties. Other examples of descrip-tive studies are the computation of age-gender profiles of populations done by demographers, the computation of crime rates for different cities, and a product- marketing survey that describes the people who use, or would use, a particular product. A researcher who carefully chronicles the events that take place on a labor union picket line has, or at least serves, a descriptive purpose. A researcher who computes and reports the number of times individual legislators voted for or against organized labor also fulfills a descriptive purpose.
In most interviews, I began by asking the human channels questions about how they first began channeling, what it was like, and why they continued, as well as standard biographical ques-tions. The channel would then go into a trance, whereby the interview continued with the entity speaking. “Who are you?” I might ask. “Where do you come from?” “Why are you doing this?” “How can I tell if you are real or a fake?” Although I went into these interview sessions with several questions prepared in advance, each of the interviews fol-lowed whatever course seemed appropriate in light of the answers given.
This example of exploration illustrates where social research often begins. Whereas research-ers working from deductive theories have the key variables laid out in advance, one of my first tasks was to identify some of the possibly relevant vari-ables. For example, I noted a channel’s gender, age, education, religious background, regional origins, and previous participation in things metaphysical. I chose most of these variables because they com-monly affect behavior.
I also noted differences in the circumstances of channeling sessions. Some channels said they must go into deep trances, some use light trances, and others remain conscious. Most sit down while channeling, but others stand and walk about. Some channels operate under pretty ordinary conditions; others seem to require props such as dim lights, incense, and chanting. Many of these differences became apparent to me only in the course of my initial observations.
Regarding the entities, I have been interested in classifying where they say they come from. Over the course of my interviews, I’ve developed a set of questions about specific aspects of “reality,” attempting to classify the answers they give. Similarly, I ask each to speak about future events.
Over the course of this research, my exami-nation of specific topics has become increasingly focused as I’ve identified variables that seem worth pursuing: gender, education, and religion, for ex-ample. Note, however, that I began with a reason-ably blank slate.

94 ■ Chapter 4: Research Design
Many qualitative studies aim primarily at description. An anthropological ethnography, for example, may try to detail the particular culture of some preliterate society. At the same time, such studies are seldom limited to a merely descriptive purpose. Researchers usually go on to examine why the observed patterns exist and what they imply.
ExplanationThe third general purpose of social science re-search is to explain things. Descriptive studies answer questions of what, where, when, and how; explanatory questions, of why. So when William Sanders (1994) set about describing the varieties of gang violence, he also wanted to reconstruct the process that brought about violent episodes among the gangs of different ethnic groups.
Reporting the voting intentions of an electorate is descriptive, but reporting why some people plan to vote for Candidate A and others for Candidate B is explanatory. Identifying variables that explain why some cities have higher crime rates than oth-ers involves explanation. A researcher who sets out to know why an antiabortion demonstration ended in a violent confrontation with police, as op-posed to simply describing what happened, has an explanatory purpose.
Let’s look at a specific case. What factors do you suppose might shape people’s attitudes toward the legalization of marijuana? To answer this, you might first consider whether men and women dif-fer in their opinions. An explanatory analysis of the 2002 General Social Survey (GSS) data indicates that 38 percent of men and 30 percent of women said marijuana should be legalized.
What about political orientation? The GSS data show that 55 percent of liberals said marijuana should be legalized, compared with 29 percent of moderates and 27 percent of conservatives. Fur-ther, 41 percent of Democrats, compared with 34 percent of Independents and 28 percent of Re-publicans, supported legalization.
Given these statistics, you might begin to de-velop an explanation for attitudes toward mari-
juana legalization. Further study of gender and political orientation might then lead to a deeper explanation of these attitudes.
The Logic of Nomothetic ExplanationThe preceding examination of what factors might cause attitudes about legalizing marijuana il-lustrates nomothetic explanation, as discussed in Chapter 1. Recall that in this model, we try to find a few factors (independent variables) that can account for many of the variations in a given phenomenon. This explanatory model stands in contrast to the idiographic model, in which we seek a complete, in-depth understanding of a single case.
In our example, an idiographic approach would suggest all the reasons that one person was op-posed to legalization—involving what her parents, teachers, and clergy told her about it; any bad experiences experimenting with it; and so forth. When we understand something idiographically, we feel we really understand it. When we know all the reasons why someone opposed legalizing marijuana, we couldn’t imagine that person having any other attitude.
In contrast, a nomothetic approach might sug-gest that overall political orientations account for much of the difference of opinion about legalizing marijuana. Because this model is inherently proba-bilistic, it is more open than the idiographic model to misunderstanding and misinterpretation. Let’s examine what social researchers mean when they say one variable (nomothetically) causes another. Then, we’ll look at what they don’t mean.
Criteria for Nomothetic CausalityThere are three main criteria for nomothetic causal relationships in social research: (1) the variables must be correlated, (2) the cause takes place before the effect, and (3) the variables are nonspurious.

The Logic of Nomothetic Explanation ■ 95
CorrelationUnless some actual relationship—or correla-tion—is found between two variables, we can’t say that a causal relationship exists. Our analysis of GSS data suggested that political orientation was a cause of attitudes about legalizing marijuana. Had the same percentage of liberals and conservatives supported legalization, we could hardly say that political orientations caused the attitude. Though this criterion is obvious, it emphasizes the need to base social research assertions on actual observa-tions rather than assumptions.
Time OrderNext, we can’t say a causal relationship exists unless the cause precedes the effect in time. Notice that it makes more sense to say that most children’s reli-gious affiliations are caused by those of their par-ents than to say that parents’ affiliations are caused by those of their children—even though it would be possible for you to change your religion and for your parents to follow suit. Remember, nomothetic explanation deals with “most cases” but not all.
In our marijuana example, it would make sense to say that gender causes, to some extent, at-titudes toward legalization, whereas it would make no sense to say that opinions about marijuana determine a person’s gender. Notice, however, that the time order connecting political orientations and attitudes about legalization is less clear, though we sometimes reason that general orientations cause specific opinions. And sometimes our analyses involve two or more independent variables that were established at the same time: looking at the effects of gender and race on voting behavior, for example. As we’ll see in the next chapter, the issue of time order can be a complex matter.
NonspuriousnessThe third requirement for a causal relationship is that the effect cannot be explained in terms of some third variable. For example, there is a cor-relation between ice-cream sales and deaths due to drowning: the more ice cream sold, the more drownings, and vice versa. There is, however, no direct link between ice cream and drowning.
The third variable at work here is season or tempera-ture. Most drowning deaths occur during sum-mer—the peak period for ice-cream sales.
Here are a couple of other examples of spuri-ous relationships, or ones that aren’t genuine. There is a negative relationship between the num-ber of mules and the number of Ph.D.’s in towns and cities: the more mules, the fewer Ph.D.’s and vice versa. Perhaps you can think of another vari-able that would explain this apparent relationship. The answer is rural versus urban settings. There are more mules (and fewer Ph.D.’s) in rural areas, whereas the opposite is true in cities.
Or, consider the positive correlation between shoe size and math ability among schoolchildren. Here, the third variable that explains the puzzling relationship is age. Older children have bigger feet and more highly developed math skills, on average, than younger children do. See Figure 4-1 for an illustration of this spurious relationship. Notice that observed associations go in both directions. That is, as one variable occurs or changes, so does the other.
The list goes on. Areas with many storks have high birthrates. Those with few storks have low birthrates. Do storks really deliver babies? Birth-rates are higher in the country than in the city; more storks live in the country than the city. The third variable here is urban/rural areas.
Finally, the more fire trucks that put out a fire, the more damage to the structure. Can you guess what the third variable is? In this case, it’s the size of the fire.
Thus, when social researchers say there is a causal relationship between, say, education and racial tolerance, they mean (1) there is a statistical
correlation An empirical relationship between two variables such that (1) changes in one are associated with changes in the other or (2) particular attributes of one variable are associated with particular attri-butes of the other. Correlation in and of itself does not constitute a causal relationship between the two variables, but it is one criterion of causality.
spurious relationship A coincidental statistical correlation between two variables, shown to be caused by some third variable.

96 ■ Chapter 4: Research Design
correlation between the two variables, (2) a per-son’s educational level occurred before their current level of tolerance or prejudice, and (3) there is no third variable that can explain away the observed correlation as spurious.
Nomothetic Causal Analysis and Hypothesis-TestingThe nomothetic model of causal analysis lends itself to hypothesis-testing (see Chapter 1), though hy-potheses are not required in nomothetical research. To test a hypothesis, you would carefully specify the variables you think are causally related, as well as specifying the manner in which you will mea-sure them. (These steps will be discussed in detail in the following chapter under the terms conceptual-ization and operationalization.)
In addition to hypothesizing that two vari-ables will be correlated with each other, you may specify the strength of the relationship you expect
within the study design you are using. Often this specifi cation will take the form of a level of statisti-cal signifi cance: the chance you are willing to take that a given relationship might have been caused by chance in the selection of subjects for study. (This will be discussed further in Chapter 7, on sampling.)
Finally, you may specify the tests for spurious-ness that any observed relationship must survive. Not only will you hypothesize, for example, that increased education will reduce levels of prejudice, but you will specify further that the hypothesized relationship will not be the product of, say, political orientations.
False Criteria for Nomothetic CausalityBecause notions of cause and effect are well entrenched in everyday language and logic, it’s important to specify some of the things social
FIGURE 4-1
An Example of a Spurious Causal Relationship. Finding an empirical correlation between two variables does not necessarily estab-lish a causal relationship. Sometimes the observed correlation is the incidental result of other causal relationships, involving other variables.

Necessary and Sufficient Causes ■ 97
researchers do not mean when they speak of causal relationships. When they say that one variable causes another, they do not necessarily mean to suggest complete causation, to account for excep-tional cases, or to claim that the causation exists in a majority of cases.
Complete CausationWhereas an idiographic explanation of causation is relatively complete, a nomothetic explanation is probabilistic and usually incomplete. As we’ve seen, social researchers may say that political ori-entations cause attitudes toward legalizing mari-juana even though not all liberals approve nor all conservatives disapprove. Thus, we say that political orientation is one of the causes of the attitude, but not the only one.
Exceptional CasesIn nomothetic explanations, exceptions do not dis-prove a causal relationship. For example, it is con-sistently found that women are more religious than men in the United States. Thus, gender may be a cause of religiosity, even if your uncle is a religious zealot or you know a woman who is an avowed atheist. Those exceptional cases do not disprove the overall, causal pattern.
Majority of CasesCausal relationships can be true even if they don’t apply in a majority of cases. For example, we say that children who are not supervised after school are more likely to become delinquent than those who are supervised are; hence, lack of supervision is a cause of delinquency. This causal relationship holds true even if only a small percentage of those not supervised become delinquent. As long as they are more likely than those who are supervised to be delinquent, we say there is a causal relationship.
The social science view of causation may vary from what you are accustomed to, because people commonly use the term cause to mean something that completely causes another thing. The some-what different standard used by social researchers can be seen more clearly in terms of necessary and sufficient causes.
Necessary and Sufficient CausesA necessary cause represents a condition that must be present for the effect to follow. For example, it is necessary for you to take college courses in order to get a degree. Take away the courses, and the degree never follows. However, simply taking the courses is not a sufficient cause of getting a degree. You need to take the right ones and pass them. Similarly, being female is a necessary condition of becoming pregnant, but it is not a sufficient cause. Other-wise, all women would get pregnant. Figure 4-2 illustrates this relationship between the variables of gender and pregnancy as a matrix showing the pos-sible outcomes of combining these variables.
A sufficient cause, on the other hand, represents a condition that, if it is present, guarantees the effect in question. This is not to say that a sufficient cause is the only possible cause of a particular effect. For example, skipping an exam in this course would be a sufficient cause for failing it, though students could fail it other ways as well. Thus, a cause can be sufficient, but not necessary. Figure 4-3 illustrates the relationship between taking or not taking the exam and either passing or failing it.
The discovery of a cause that is both neces-sary and sufficient is, of course, the most satisfying outcome in research. If juvenile delinquency were the effect under examination, it would be nice to discover a single condition that (1) must be present for delinquency to develop and (2) always results in delinquency. In such a case, you would surely feel that you knew precisely what caused juvenile delinquency.
Unfortunately, we never discover single causes that are absolutely necessary and absolutely sufficient when analyzing the nomothetic re-lationships among variables. It is not uncommon, however, to find causal factors that are either 100 percent necessary (you must be female to be-come pregnant) or 100 percent sufficient (skipping an exam will inevitably cause you to fail it).
In the idiographic analysis of single cases, you may reach a depth of explanation from which it is reasonable to assume that things could not

98 ■ Chapter 4: Research Design
experiences would have ended up going to col-lege.) At the same time, there could always be other causal paths to the same result. Thus, the idiographic causes are sufficient but not necessary.
Units of AnalysisIn social research, there is virtually no limit to what or whom can be studied, or the units of analysis.This topic is relevant to all forms of social research, although its implications are clearest in the case of nomothetic, quantitative studies.
The idea for units of analysis may seem slippery at first, because research—especially nomothetic research—often studies large collections of people or things, or aggregates. It’s important to distinguish between the unit of analysis and the aggregates that we generalize about. For instance, a researcher may study a class of people, such as Democrats, college undergraduates, African American women under 30, or some other collection. But if the researcher is interested in exploring, describing, or explaining how different groups of individuals behave as individuals, the unit of analysis is the indi-vidual, not the group. This is true even though the researcher uses the information about individuals
have turned out differently, suggesting you have determined the sufficient causes for a particular result. (Anyone with all the same details of your genetic inheritance, upbringing, and subsequent
FIGURE 4-2
Necessary Cause. Being female is a necessary cause of pregnancy; that is, you can’t get pregnant unless you are female.
units of analysis The what or whom being stud-ied. In social science research, the most typical units of analysis are individual people.
FIGURE 4-3
Suffi cient Cause. Not taking the exam is a suffi cient cause of failing it, even though there are other ways of failing (such as answering randomly).

Units of Analysis ■ 99
Political Science 110 than students with poor study habits did. You would operationalize the variable study habits and measure this variable, perhaps in terms of hours of study per week. You might then aggregate students with good study habits and those with poor study habits and see which group received the best grades in the course. The purpose of the study would be to explain why some groups of students do better in the course than others do, but the unit of analysis is still individual students.
Units of analysis in a study are usually also the units of observation. Thus, to study success in a po-litical science course, we would observe individual students. Sometimes, however, we “observe” our units of analysis indirectly. For example, suppose we want to find out whether disagreements about the death penalty tend to cause divorce. In this case, we might “observe” individual husbands and wives by asking them about their attitudes about capital punishment, in order to distinguish couples who agree and disagree on this issue. In this case, our units of observation are individual wives and husbands, but our units of analysis (the things we want to study) are couples.
Units of analysis, then, are those things we examine in order to create summary descriptions of all such units and to explain differences among them. In most research projects, the unit of analysis will probably be clear to you. When the unit of analysis is not clear, however, it’s essential to deter-mine what it is; otherwise, you cannot determine what observations are to be made about whom or what.
Some studies try to describe or explain more than one unit of analysis. In these cases, the researcher must anticipate what conclusions she or he wishes to draw with regard to which units of analysis. For example, we may want to discover what kinds of college students (individuals) are most successful in their careers; we may also want to learn what kinds of colleges (organizations) pro-duce the most-successful graduates.
Here’s an example that illustrates the complex-ity of units of analysis. Murder is a fairly personal matter: One individual kills another individual. However, when Charis Kubrin and Ronald Weitzer (2003: 157) ask, “Why do these neighborhoods
to generalize about aggregates of individuals, as in saying that more Democrats than Republicans favor legalizing marijuana. Think of it this way: Having an attitude about marijuana is something that can only be an attribute of an individual, not a group; that is, there is no one group “mind” that can have an attitude. So even when we generalize about Democrats, we’re generalizing about an attribute they possess as individuals.
In contrast, we may sometimes want to study groups, considered as individual “actors” or entities that have attributes as groups. For instance, we might want to compare the characteristics of dif-ferent types of street gangs. In that case our unit of analysis would be gangs (not members of gangs), and we might proceed to make generalizations about different types of gangs. For example, we might conclude that male gangs are more violent than female gangs. Each gang (unit of analysis) would be described in terms of two variables: (1) What sex are the members? and (2) How violent are its activities? So we might study 52 gangs, reporting that 40 were male and 12 were female, and so forth. The “gang” would be the unit of analysis, even though some of the characteristics were drawn from the components (members) of the gangs.
Social researchers tend to choose individual people as their units of analysis. You may note the characteristics of individual people—gender, age, region of birth, attitudes, and so forth. You can then combine these descriptions to provide a composite picture of the group the individuals represent, whether a street-corner gang or a whole society.
For example, you may note the age and gender of each student enrolled in Political Science 110 and then characterize the group of students as being 53 percent men and 47 percent women and as having a mean age of 18.6 years. Although the final description would be of the class as a whole, the description is based on characteristics that members of the class have as individuals.
The same distinction between units of analy-sis and aggregates occurs in explanatory studies. Suppose you wished to discover whether students with good study habits received better grades in

100 ■ Chapter 4: Research Design
aggregating and manipulating the descriptions of individuals.
Any type of individual may be the unit of analysis for social research. This point is more important than it may seem at first. The norm of generalized understanding in social research should suggest that scientific findings are most valuable when they apply to all kinds of people. In practice, however, social researchers seldom study all kinds of people. At the very least, their studies are typi-cally limited to the people living in a single country, though some comparative studies stretch across national boundaries. Often, though, studies are quite circumscribed.
Examples of classes of individuals that might be chosen for study include students, gays and lesbians, auto workers, voters, single parents, and faculty members. Note that each of these terms implies some population of individuals. Descriptive studies with individuals as their units of analy-sis typically aim to describe the population that comprises those individuals, whereas explanatory studies aim to discover the social dynamics operat-ing within that population.
As the units of analysis, individuals may be characterized in terms of their membership in social groupings. Thus, an individual may be described as belonging to a rich family or to a poor one, or a person may be described as having a college-educated mother or not. We might examine in a research project whether people with college-educated mothers are more likely to attend college than are those with non-college-educated mothers or whether high school graduates in rich families are more likely than those in poor families to at-tend college. In each case, the unit of analysis—the “thing” whose characteristics we are seeking to describe or explain—is the individual. We then ag-gregate these individuals and make generalizations about the population they belong to.
GroupsSocial groups can also be units of analysis in social research. That is, we may be interested in charac-teristics that belong to one group, considered as
generate high homicide rates?” the unit of analysis in that phrase is neighborhood. You can probably imagine some kinds of neighborhoods (e.g., poor, urban) that would have high homicide rates and some (e.g., wealthy, suburban) that would have low rates. In this particular conversation, the unit of analysis (neighborhood) would be categorized in terms of variables such as economic level, locale, and homicide rate.
In their analysis, however, Kubrin and Weitzer were also interested in different types of homicide: in particular, those that occurred in retaliation for some earlier event, such as an assault or insult. Can you identify the unit of analysis common to all of the following excerpts?
1. The sample of killings . . .
2. The coding instrument includes over 80 items related to the homicide.
3. Of the 2,161 homicides that occurred from 1985 [to] 1995 . . .
4. Of those with an identified motive, 19.5 percent (n � 337) are retaliatory.
(Kubrin and Weitzer 2003: 163)
In each of these excerpts, the unit of analysis is homicide (also called killing or murder). Some-times you can identify the unit of analysis in the description of the sampling methods, as in the first excerpt. A discussion of classification methods might also identify the unit of analysis, as in the second excerpt (80 ways to code the homicides). Often, numerical summaries point the way: 2,161 homicides; 19.5 percent (of the homicides). With a little practice you’ll be able to identify the units of analysis in most social research reports, even when more than one is used in a given analysis.
To explore this topic in more depth, let’s con-sider several common units of analysis in social research.
IndividualsAs mentioned, individual human beings are perhaps the most typical units of analysis for social research. Social researchers tend to describe and explain social groups and interactions by

Units of Analysis ■ 101
a single entity. If you were to study the members of a criminal gang to learn about criminals, the individual (criminal) would be the unit of analysis; but if you studied all the gangs in a city to learn the differences, say, between big gangs and small ones, between “uptown” and “downtown” gangs, and so forth, you would be interested in gangs rather than their individual members. In this case, the unit of analysis would be the gang, a social group.
Here’s another example. Suppose you were interested in the question of access to computers in different segments of society. You might describe families in terms of total annual income and ac-cording to whether or not they had computers. You could then aggregate families and describe the mean income of families and the percentage with computers. You would then be in a position to determine whether families with higher incomes were more likely to have computers than were those with lower incomes. In this case, the unit of analysis would be families.
As with other units of analysis, we can derive the characteristics of social groups from those of their individual members. Thus, we might describe a family in terms of the age, race, or education of its head. In a descriptive study, we might find the percentage of all families that have a college-educated head of family. In an explanatory study, we might determine whether such families have, on average, more or fewer children than do fami-lies headed by people who have not graduated from college. In each of these examples, the family is the unit of analysis. In contrast, had we asked whether college-educated individuals have more or fewer children than do their less-educated counter-parts, then the individual would have been the unit of analysis.
Other units of analysis at the group level could be friendship cliques, married couples, census blocks, cities, or geographic regions. As with indi-viduals, each of these terms implies some popula-tion. Street gangs implies some population that in-cludes all street gangs, perhaps in a given city. You might then describe this population by generalizing from your findings about individual gangs. For in-stance, you might describe the geographic distribu-tion of gangs throughout a city. In an explanatory
study of street gangs, you might discover whether large gangs are more likely than small ones to en-gage in intergang warfare. Thus, you would arrive at conclusions about the population of gangs by using individual groups as your unit of analysis.
OrganizationsFormal social organizations may also be the units of analysis in social research. For example, a researcher might study corporations, by which he or she implies a population of all corporations. Individual corporations might be characterized in terms of their number of employees, net annual profits, gross assets, number of defense contracts, percentage of employees from racial or ethnic minority groups, and so forth. We might determine whether large corporations hire a larger or smaller percentage of minority group employees than small corporations do. Other examples of formal social organizations suitable as units of analysis include church congregations, colleges, army divisions, academic departments, and supermarkets.
Figure 4-4 provides a graphic illustration of some different units of analysis and the statements that might be made about them.
Social InteractionsSometimes social interactions are the relevant units of analysis. Instead of individual humans, you can study what goes on between them: tele-phone calls, kisses, dancing, arguments, fistfights, e-mail exchanges, chat-room discussions, and so forth. As you saw in Chapter 2, social interac-tion is the basis for one of the primary theoretical paradigms in the social sciences, and the number of units of analysis that social interactions provide is nearly infinite.
Even though individuals are usually the actors in social interactions, there is a difference between (1) comparing the kinds of people who subscribe to different Internet service providers (individuals being the units of analysis) and (2) comparing the length of chat-room interactions on those same ISPs (interactions being the units of analysis).

FIGURE 4-4
Illustrations of Units of Analysis. Units of analysis in social research can be individuals, groups, or even nonhuman entities.

Units of Analysis ■ 103
consciousness, taking paintings as the units of anal-ysis and describing each, in part, by the nationality of its creator. Or you might examine a newspaper’s editorials regarding a local university, for the pur-pose of describing, or perhaps explaining, changes in the newspaper’s editorial position on the univer-sity over time. In this example, individual editorials would be the units of analysis. See “How to Do It: Identifying the Unit of Analysis” for more.
Units of Analysis in ReviewThe examples in this section should suggest the nearly infinite variety of possible units of analysis in social research. Although individual human beings are typical objects of study, many research questions can be answered more appropriately through the examination of other units of analy-sis. Indeed, social researchers can study just about anything that bears on social life.
Moreover, the types of units of analysis named in this section do not begin to exhaust the possi-bilities. Morris Rosenberg (1968: 234–48), for ex-ample, speaks of individual, group, organizational, institutional, spatial, cultural, and societal units of analysis. John Lofland and his associates (2006: 122–32) speak of practices, episodes, encounters, roles and social types, social and personal relation-ships, groups and cliques, organizations, settle-ments and habitats, subcultures, and lifestyles as suitable units of study. The important thing here is to grasp the logic of units of analysis. Once you do, the possibilities for fruitful research are limited only by your imagination.
Categorizing possible units of analysis might make the concept seem more complicated than it needs to be. What you call a given unit of anal-ysis—a group, a formal organization, or a social artifact—is irrelevant. The key is to be clear about what your unit of analysis is. When you embark on a research project, you must decide whether you’re studying marriages or marriage partners, crimes or criminals, corporations or corporate executives.
Social ArtifactsAnother unit of analysis is the social artifact, or any product of social beings or their behavior. One class of artifacts includes concrete objects such as books, poems, paintings, automobiles, buildings, songs, pottery, jokes, student excuses for missing exams, and scientific discoveries.
For example, Lenore Weitzman and her associ-ates (1972) were interested in learning how gender roles are taught. They chose children’s picture books as their unit of analysis. Specifically, they examined books that had received the Caldecott Medal. Their results were as follows:
We found that females were underrepre-sented in the titles, central roles, pictures, and stories of every sample of books we examined. Most children’s books are about boys, men, male animals, and deal exclusively with male adventures. Most pictures show men singly or in groups. Even when women can be found in the books, they often play insignificant roles, remaining both inconspicuous and nameless.
(Weitzman et al. 1972: 1128)
In a more recent study, Roger Clark, Rachel Lennon, and Leana Morris (1993) concluded that male and female characters at that time were por-trayed less stereotypically than before, observing a clear progress toward portraying men and women in nontraditional roles. However, they did not find total equality between the sexes.
As this example suggests, just as people or social groups imply populations, each social object implies a set of all objects of the same class: all books, all novels, all biographies, all introductory sociology textbooks, all cookbooks, all press confer-ences. In a study using books as the units of analy-sis, an individual book might be characterized by its size, weight, length, price, content, number of pictures, number sold, or description of the author. Then the population of all books or of a particular kind of book could be analyzed for the purpose of description or explanation: What kinds of books sell best and why, for example.
Similarly, a social researcher could analyze whether paintings by Russian, Chinese, or U.S. artists showed the greatest degree of working-class
social artifact Any product of social beings or their behavior. Can be a unit of analysis.

104 ■ Chapter 4: Research Design
Otherwise, you run the risk of drawing invalid conclusions because your assertions about one unit of analysis are actually based on the examination of another. We’ll see an example of this issue in the next section as we look at the ecological fallacy.
Faulty Reasoning about Units of Analysis: The Ecological Fallacy and ReductionismAt this point, it’s appropriate to introduce two types of faulty reasoning that you should be aware of: the ecological fallacy and reductionism. Each repre-sents a potential pitfall regarding units of analysis, and either can occur in doing research and drawing conclusions from the results.
The Ecological FallacyIn this context, “ecological” refers to groups or sets or systems: something larger than individu-als. The ecological fallacy is the assumption that
something learned about an ecological unit says something about the individuals making up that unit. Let’s consider a hypothetical illustration of this fallacy.
Suppose we’re interested in learning something about the nature of electoral support received by a female political candidate in a recent citywide elec-tion. Let’s assume we have the vote tally for each precinct so we can tell which precincts gave her the greatest support and which the least. Assume also that we have census data describing some charac-teristics of these precincts. Our analysis of such data might show that precincts with relatively young voters gave the female candidate a greater propor-tion of their votes than precincts with older voters did. We might be tempted to conclude from these findings that younger voters are more likely to vote for female candidates than older voters are—in other words, that age affects support for the woman. In reaching such a conclusion, we run the risk of committing the ecological fallacy, because it may have been the older voters in those “young” precincts who voted for the woman. Our problem is that we have examined precincts as our units of analysis but wish to draw conclusions about voters.
The same problem would arise if we discov-ered that crime rates were higher in cities having large African American populations than in those
How to Do It: Identifying the Unit of Analysis
The unit of analysis is an important element in research design and
later in data analysis. However, students sometimes fi nd identifying
it elusive. The easiest way to identify the unit of analysis is to examine a
statement regarding the variables under study.
Consider the following: “The average household income was
$40,000.” Income is the variable of interest, but who or what has
income? Households, in this instance. We would arrive at the given
statement by examining the incomes of several households. To calculate
the mean (average) income, we would add up all the household incomes
and divide by the number of households. Household is the unit of analy-
sis. It is the unit being analyzed in terms of the variable, income.
Consider another statement: “Italian movies show more nudity
than do American movies.” The variable here is the extent to which
nudity is shown, but who or what shows nudity? Movies. Movies are the
units of analysis.
Finally, how about this statement: “Twenty-four percent of the
families have more than one adult earning $30,000 or more.” To be sure,
adults are earning the income, but the statement is about whether fami-
lies have such adults. To make this statement, we would study several
families. For each, we would ask whether they had more than one adult
earning in excess of $30,000; each family would be scored as “yes” or
“no” in that respect. Finally, we would calculate the percentage of families
scored as “yes.” The family, therefore, is the unit of analysis.
ecological fallacy Erroneously drawing conclu-sions about individuals solely from the observation of groups.

Units of Analysis ■ 105
terms of limited and/or lower-order concepts. The reductionist explanation is not altogether wrong; it is simply too limited. Thus, you might attempt to predict this year’s winners and losers in the National Basketball Association by focusing on the abilities of the individual players on each team. This is certainly not stupid or irrelevant, but the suc-cess or failure of teams involves more than just the individuals in them; it involves coaching, team-work, strategies, finances, facilities, fan loyalty, and so forth. To understand why some teams do better than others, you would make team the unit of anal-ysis, and the quality of players would be one variable you would probably want to use in describing and classifying the teams.
Further, different academic disciplines ap-proach the same phenomenon quite differently. Sociologists tend to consider sociological variables (such as values, norms, and roles), economists ponder economic variables (such as supply and demandand marginal value), and psychologists examine psychological variables (such as personality types and traumas). Explaining all or most human behavior in terms of economic factors is called economic re-ductionism, explaining it in terms of psychological factors is called psychological reductionism, and so forth. Notice how this issue relates to the discussion of theoretical paradigms in Chapter 2.
For many social scientists, the field of socio-biology is a prime example of reductionism, sug-gesting that all social phenomena can be explained in terms of biological factors. Thus, for example, Edward O. Wilson (1975) sought to explain altru-istic behavior in human beings in terms of genetic makeup. In his neo-Darwinian view, Wilson sug-gests that humans have evolved in such a way that individuals sometimes need to sacrifice themselves for the benefit of the whole species. Some people
with few African Americans. We would not know if the crimes were actually committed by African Americans. Or if we found suicide rates higher in Protestant countries than in Catholic ones, we still could not know for sure that more Protestants than Catholics committed suicide.
In spite of these hazards, social researchers often have little choice but to address a particular research question through an ecological analysis. Perhaps the most appropriate data are simply not available. For example, the precinct vote tallies and the precinct characteristics mentioned in our initial example may be easy to obtain, but we may not have the resources to conduct a postelection survey of individual voters. In such cases, we may reach a tentative conclusion, recognizing and noting the risk of an ecological fallacy.
Although you should be careful not to com-mit the ecological fallacy, don’t let these warnings lead you into committing what we might call the individualistic fallacy. Some people who approach social research for the first time have trouble rec-onciling general patterns of attitudes and actions with individual exceptions. But generalizations and probabilistic statements are not invalidated by individual exceptions. Your knowing a rich Demo-crat, for example, doesn’t deny the fact that most rich people vote Republican—as a general pattern. Similarly, if you know someone who has gotten rich without any formal education, that doesn’t deny the general pattern of higher education relat-ing to higher income.
The ecological fallacy deals with something else altogether—confusing units of analysis in such a way that we draw conclusions about individuals solely from the observation of groups. Although the patterns observed between variables at the level of groups may be genuine, the danger lies in reasoning from the observed attributes of groups to the attributes of the individuals who made up those groups, even though we have not actually observed individuals.
ReductionismA second type of faulty reasoning related to units of analysis is reductionism. Reductionism involves attempts to explain a particular phenomenon in
reductionism A fault of some researchers: a strict limitation (reduction) of the kinds of concepts to be considered relevant to the phenomenon under study.
sociobiology A paradigm based in the view that social behavior can be explained solely in terms of genetic characteristics and behavior.

106 ■ Chapter 4: Research Design
Time plays many roles in the design and execution of research, quite aside from the time it takes to do research. Earlier we noted that the time sequence of events and situations is critical to deter mining causation (a point we’ll return to in Part 4). Time also affects the generalizability of research findings. Do the descriptions and explana-tions resulting from a particular study accurately represent the situation of ten years ago, ten years from now, or only the present? Researchers have two principal options available to deal with the issue of time in the design of their research: cross-sectional studies and longitudinal studies.
Cross-Sectional StudiesA cross-sectional study involves observations of a sample, or cross section, of a population or phenomenon that are made at one point in time. Exploratory and descriptive studies are often cross-sectional. A single U.S. Census, for instance, is a study aimed at describing the U.S. population at a given time.
Many explanatory studies are also cross-sectional. A researcher conducting a large-scale national survey to examine the sources of racial and religious prejudice would, in all likelihood, be dealing with a single time frame—taking a snap-shot, so to speak, of the sources of prejudice at a particular point in history.
Explanatory cross-sectional studies have an inherent problem. Although their conclusions are based on observations made at only one time, typi-cally they aim at understanding causal processes that occur over time. This problem is somewhat akin to that of determining the speed of a moving object on the basis of a high-speed, still photograph that freezes the movement of the object.
Yanjie Bian, for example, conducted a survey of workers in Tianjin, China, for the purpose of study-ing stratification in contemporary, urban Chinese society. In undertaking the survey in 1988, how-ever, he was conscious of the important changes brought about by a series of national campaigns, such as the Great Proletarian Cultural Revolution, dating from the Chinese Revolution in 1949 (which
might explain such sacrifice in terms of ideals or warm feelings between humans. However, genes are the essential unit in Wilson’s paradigm, produc-ing his famous dictum that human beings are “only DNA’s way of making more DNA.”
Reductionism of any type tends to suggest that particular units of analysis or variables are more relevant than others. Suppose we ask what caused the American Revolution. Was it a shared commit-ment to the value of individual liberty? The eco-nomic plight of the colonies in relation to Britain? The megalomania of the founders? As soon as we inquire about the single cause, we run the risk of reductionism. If we were to regard shared values as the cause of the American Revolution, our unit of analysis would be the individual colonist. An economist, though, might choose the 13 colonies as units of analysis and examine the economic organizations and conditions of each. A psycholo-gist might choose individual leaders as the units of analysis for purposes of examining their personali-ties. Of course, there’s nothing wrong in choosing these units of analysis as part of an explanation of the American Revolution, but I think you can see how each alone would not produce a complete answer.
Like the ecological fallacy, reductionism can occur when we use inappropriate units of analy-sis. The appropriate unit of analysis for a given research question, however, is not always clear. Social researchers, especially across disciplinary boundaries, often debate this issue.
The Time DimensionSo far in this chapter, we’ve regarded research design as a process for deciding what aspects we’ll observe, of whom, and for what purpose. Now we must consider a set of time-related options that cuts across each of these earlier considerations. We can choose to make observations more or less at one time or over a long period.
cross-sectional study A study based on observa-tions representing a single point in time.

The Time Dimension ■ 107
Schachter were specifically interested in learning what happened to a flying saucer cult when their predictions of an alien encounter failed to come true. Would the cult members close down the group, or would they become all the more com-mitted to their beliefs? A longitudinal study was required to provide an answer. (They redoubled their efforts to get new members.)
Longitudinal studies can be more difficult for quantitative studies such as large-scale surveys. Nonetheless, they are often the best way to study changes over time. There are three special types of longitudinal studies that you should know about: trend studies, cohort studies, and panel studies.
Trend StudiesA trend study is a type of longitudinal study that examines changes within a population over time. A simple example is a comparison of U.S. Censuses over a period of decades, showing shifts in the makeup of the national population. A similar use of archival data was made by Michael Carpini and Scott Keeter (1991), who wanted to know whether contemporary U.S. citizens were better or more poorly informed about politics than citizens of an earlier generation were. To find out, they compared the results of several Gallup Polls conducted during the 1940s and 1950s with a 1989 survey that asked several of the same questions tapping political knowledge.
Overall, the analysis suggested that contem-porary citizens were slightly better informed than earlier generations were. In 1989, 74 percent of the sample could name the vice president of the United States, compared with 67 percent in 1952. Substantially higher percentages of people in 1989
brought the Chinese Communists into power) and continuing into the present.
These campaigns altered political atmospheres and affected people’s work and nonwork activi-ties. Because of these campaigns, it is difficult to draw conclusions from a cross-sectional social survey, such as the one presented in this book, about general patterns of Chinese workplaces and their effects on workers. Such conclusions may be limited to one period of time and are subject to further tests based on data collected at other times.
(1994: 19)
The problem of generalizations about social life from a “snapshot” is one this book repeatedly addresses. One solution is suggested by Bian’s final comment—about data collected “at other times”: Social research often involves revisiting phenom-ena and building on the results of earlier research.
Longitudinal StudiesIn contrast to cross-sectional studies, a longitudi-nal study is designed to permit observations of the same phenomenon over an extended period. For example, a researcher can participate in and ob-serve the activities of a UFO cult from its inception to its demise. Other longitudinal studies use records or artifacts to study changes over time. In analyses of newspaper editorials or Supreme Court decisions over time, for example, the studies are longitudinal whether the researcher’s actual observations and analyses were made at one time or over the course of the actual events under study.
Many field research projects, involving direct observation and perhaps in-depth interviews, are naturally longitudinal. Thus, for example, when Ramona Asher and Gary Fine (1991) studied the life experiences of the wives of alcoholic men, they were in a position to examine the evolution of troubled marital relationships over time, sometimes even including the reactions of the subjects to the research itself.
In the classic study When Prophecy Fails (1956), Leon Festinger, Henry Reicker, and Stanley
longitudinal study A study design involving the collection of data at different points in time.
trend study A type of longitudinal study in which a given characteristic of some population is moni-tored over time. An example would be the series of Gallup Polls showing the electorate’s preferences for political candidates over the course of a campaign, even though different samples were interviewed at each point.

108 ■ Chapter 4: Research Design
married in 1994, and so forth. An example of a cohort study would be a series of national surveys, conducted perhaps every 20 years, to study the attitudes of the cohort born during World War II toward U.S. involvement in global affairs. A sample of people 15–20 years old might be surveyed in 1960, another sample of those 35–40 years old in 1980, and another sample of those 55–60 years old in 2000. Although the specific set of people studied in each survey would differ, each sample would represent the cohort born between 1940 and 1945.
Figure 4-5 offers a graphic illustration of a co-hort design. In the example, three studies are being compared: one was conducted in 1980, another in 1990, and the third in 2000. Those who were 20 years old in the 1980 study are compared with those who were 30 in the 1990 study and those who were 40 in the 2000 study. Although the sub-jects being described in each of the three groups are different, each set of subjects represents the same cohort: those who were born in 1960.
James Davis (1992) turned to a cohort analysis in an attempt to understand shifting political orien-tations during the 1970s and 1980s in the United States. Overall, he found a liberal trend on issues such as race, gender, religion, politics, crime, and free speech. But did this trend represent people in general getting a bit more liberal, or did it merely reflect liberal younger generations replacing the conservative older ones?
than in 1947 could explain presidential vetoes and congressional overrides of vetoes. On the other hand, more of the 1947 sample could identify their U.S. representative (38 percent) than the 1989 sample (29 percent) could.
An in-depth analysis, however, indicates that the slight increase in political knowledge resulted from the fact that the people in the 1989 sample were more highly educated than those from earlier samples were. When educational levels were taken into account, the researchers concluded that politi-cal knowledge has actually declined within specific educational groups.
Cohort StudiesIn a cohort study, a researcher examines specific subpopulations, or cohorts, as they change over time. Typically, a cohort is an age group, such as people born during the 1950s, but it can also be some other time grouping, such as people born during the Vietnam War, people who got
40
1980 1990 2000
Age
Year
20
30
0
FIGURE 4-5
A Cohort Study Design. Each of the three groups shown here is a sample representing people who were born in 1960.
cohort study A study in which some specific sub-population, or cohort, is studied over time, although data may be collected from different members in each set of observations. For example, a study of the occupational history of the class of 1970 in which questionnaires were sent every five years would be a cohort study.
The Time Dimension ■ 109
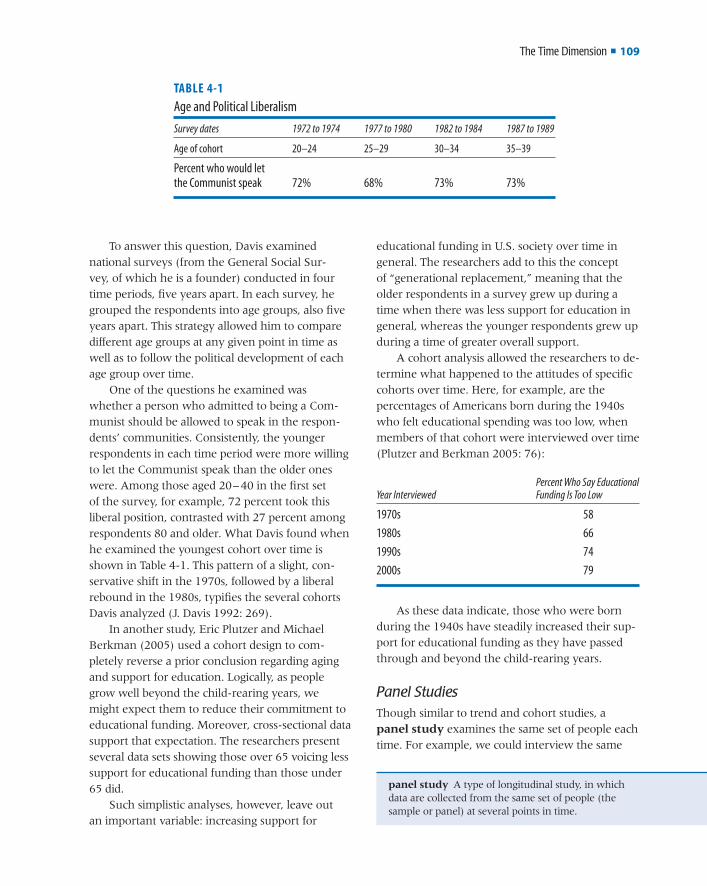
educational funding in U.S. society over time in general. The researchers add to this the concept of “generational replacement,” meaning that the older respondents in a survey grew up during a time when there was less support for education in general, whereas the younger respondents grew up during a time of greater overall support.
A cohort analysis allowed the researchers to de-termine what happened to the attitudes of specific cohorts over time. Here, for example, are the percentages of Americans born during the 1940s who felt educational spending was too low, when members of that cohort were interviewed over time (Plutzer and Berkman 2005: 76):
Percent Who Say Educational Year Interviewed Funding Is Too Low
1970s 58
1980s 66
1990s 74
2000s 79
As these data indicate, those who were born during the 1940s have steadily increased their sup-port for educational funding as they have passed through and beyond the child-rearing years.
Panel StudiesThough similar to trend and cohort studies, a panel study examines the same set of people each time. For example, we could interview the same
To answer this question, Davis examined national surveys (from the General Social Sur-vey, of which he is a founder) conducted in four time periods, five years apart. In each survey, he grouped the respondents into age groups, also five years apart. This strategy allowed him to compare different age groups at any given point in time as well as to follow the political development of each age group over time.
One of the questions he examined was whether a person who admitted to being a Com-munist should be allowed to speak in the respon-dents’ communities. Consistently, the younger respondents in each time period were more willing to let the Communist speak than the older ones were. Among those aged 20–40 in the first set of the survey, for example, 72 percent took this liberal position, contrasted with 27 percent among respondents 80 and older. What Davis found when he examined the youngest cohort over time is shown in Table 4-1. This pattern of a slight, con-servative shift in the 1970s, followed by a liberal rebound in the 1980s, typifies the several cohorts Davis analyzed (J. Davis 1992: 269).
In another study, Eric Plutzer and Michael Berkman (2005) used a cohort design to com-pletely reverse a prior conclusion regarding aging and support for education. Logically, as people grow well beyond the child-rearing years, we might expect them to reduce their commitment to educational funding. Moreover, cross-sectional data support that expectation. The researchers present several data sets showing those over 65 voicing less support for educational funding than those under 65 did.
Such simplistic analyses, however, leave out an important variable: increasing support for
TABLE 4-1
Age and Political Liberalism
Survey dates 1972 to 1974 1977 to 1980 1982 to 1984 1987 to 1989
Age of cohort 20–24 25–29 30–34 35–39
Percent who would letthe Communist speak 72% 68% 73% 73%
panel study A type of longitudinal study, in which data are collected from the same set of people (the sample or panel) at several points in time.

110 ■ Chapter 4: Research Design
affiliation. A trend study might look at shifts in U.S. religious affiliations over time, as the Gallup Poll does on a regular basis. A cohort study might follow shifts in religious affiliations among “the De-pression generation,” specifically, say, people who were 20 to 30 years old in 1932. We could study a sample of people 30–40 years old in 1942, a new sample of people aged 40–50 in 1952, and so forth throughout their lifespan. A panel study could start with a sample of the whole population or of some special subset and study those specific individuals over time. Notice that only the panel study would give a full picture of the shifts among the various categories of affiliations, including “none.” Cohort and trend studies would uncover only net changes.
Longitudinal studies have an obvious advan-tage over cross-sectional ones in providing infor-mation describing processes over time. But this advantage often comes at a heavy cost in both time and money, especially in a large-scale survey. Ob-servations may have to be made at the time events are occurring, and the method of observation may require many research workers.
Panel studies, which offer the most compre-hensive data on changes over time, face a special problem: panel attrition. Some of the respondents studied in the first wave of the survey might not participate in later waves. (This is comparable to the problem of experimental mortality discussed in Chapter 8.) The danger is that those who drop out of the study may be atypical, thereby distorting the results of the study. Thus, when Carol Aneshensel and her colleagues conducted a panel study of ado-lescent girls (comparing Latinas and non-Latinas), they looked for and found differences in character-istics of survey dropouts among Latinas born in the United States and those born in Mexico. These dif-ferences needed to be taken into account to avoid misleading conclusions about differences between Latinas and non-Latinas (Aneshensel et al. 1989).
Approximating Longitudinal StudiesLongitudinal studies do not always provide a fea-sible or practical means of studying processes that take place over time. Fortunately, researchers often
sample of voters every month during an election campaign, asking for whom they intended to vote. Though such a study would allow us to analyze overall trends in voter preferences for different can-didates, it would also show the precise patterns of persistence and change in intentions. For example, a trend study that showed that Candidates A and B each had exactly half of the voters on September 1 and on October 1 as well could indicate that none of the electorate had changed voting plans, that all of the voters had changed their intentions, or something in-between. A panel study would elimi-nate this confusion by showing what kinds of vot-ers switched from A to B and what kinds switched from B to A, as well as other facts.
Joseph Veroff, Shirley Hatchett, and Elizabeth Douvan (1992) wanted to learn about marital ad-justment among newlyweds, specifically regarding differences between white and African American couples. To get subjects for study, they selected a sample of couples who applied for marriage licenses in Wayne County, Michigan, April through June 1986.
Concerned about the possible impact their research might have on the couples’ marital ad-justment, the researchers divided their sample in half at random: an experimental group and a controlgroup (concepts we’ll explore further in Chapter 8). Couples in the former group were intensively inter-viewed over a four-year period, whereas the latter group was contacted only briefly each year.
By studying the same couples over time, the researchers could follow the specific problems that arose and the way the couples dealt with them. As a by-product of their research, they found that those studied the most intensely seemed to achieve a somewhat better marital adjustment. The researchers felt that the interviews could have forced couples to discuss matters they might have otherwise buried.
Comparing the Three Types of Longitudinal StudiesTo reinforce the distinctions among trend, cohort, and panel studies, let’s contrast the three study designs in terms of the same variable: religious
The Time Dimension ■ 111
pressure, and so forth. By reading across the age-group ratings for each health condition, you would have something approximating the health history of individuals. Thus, you might conclude that the average person develops vision problems before hearing problems. You would need to be cautious in this assumption, however, because the differ-ences might reflect societywide trends. Perhaps improved hearing examinations instituted in the schools had affected only the young people in your study.
Asking people to recall their pasts is another common way of approximating observations over time. Researchers use that method when they ask people where they were born or when they graduated from high school or whom they voted for in 1988. Qualitative researchers often conduct in-depth “life history” interviews. For example, C. Lynn Carr (1998) used this technique in a study of “tomboyism.” Her respondents, aged 25–40, were asked to reconstruct aspects of their lives from childhood on, including experiences of identifying themselves as tomboys.
The danger in this technique is evident. Some-times people have faulty memories; sometimes they lie. When people are asked in postelection polls whom they voted for, the results inevitably show more people voting for the winner than actually did so on election day. As part of a series of in-depth interviews, such a report can be validated in the context of other reported details; however, results based on a single question in a survey must be regarded with caution.
Cohorts can also be used to infer processes over time from cross-sectional data. For example, when Prem Saxena and his colleagues (2004) wanted to examine whether wartime conditions would affect the age at which people married, he used cross-sectional data from a survey of Lebanese women. During the Lebanese Civil War from 1975 to 1990, many young men migrated to other countries. By noting the year in which the survey respondents fi rst married, he could determine that the average age-at-fi rst-marriage increased with the onset of the war.
This discussion of the ways that time figures into social research suggests several questions you
can draw approximate conclusions about such processes even when only cross-sectional data are available. Here are some ways to do that.
Sometimes cross-sectional data imply processes over time on the basis of simple logic. For example, in the study of student drug use conducted at the University of Hawaii (Chapter 2), students were asked to report whether they had ever tried each of several illegal drugs. The study found that some students had tried both marijuana and LSD, some had tried only one, and others had tried neither. Because these data were collected at one time, and because some students presumably would experi-ment with drugs later on, it would appear that such a study could not tell whether students were more likely to try marijuana or LSD first.
A closer examination of the data showed, how-ever, that although some students reported having tried marijuana but not LSD, there were no stu-dents in the study who had tried only LSD. From this finding it was inferred—as common sense suggested—that marijuana use preceded LSD use. If the process of drug experimentation occurred in the opposite time order, then a study at a given time should have found some students who had tried LSD but not marijuana, and it should have found no students who had tried only marijuana.
Researchers can also make logical inferences whenever the time order of variables is clear. If we discovered in a cross-sectional study of college students that those educated in private high schools received better college grades than those educated in public high schools did, we would conclude that the type of high school attended affected college grades, not the other way around. Thus, even though we made our observations at only one time, we would feel justified in drawing conclusions about processes taking place across time.
Very often, age differences discovered in a cross-sectional study form the basis for inferring processes across time. Suppose you’re interested in the pattern of worsening health over the course of the typical life cycle. You might study the results of annual checkups in a large hospital. You could group health records according to the ages of those examined and rate each age group in terms of several health conditions—sight, hearing, blood

112 ■ Chapter 4: Research Design
nation of participant observation, interviews with participants, and review of organizational records. (Kilburn 1998: 89)
• Using interviews obtained during fieldwork in Palestine in 1992, 1993, and 1994, and employing historical and archival records, I argue that Palestinian feminist discourses were shaped and influenced by the sociopolitical context in which Palestinian women acted and with which they interacted. (Abdulhadi 1998: 649)
• This article reports on women’s experiences of breastfeeding in public as revealed through in-depth interviews with 51 women. (Stearns 1999: 308)
• Using interview and observational field data, I demonstrate how a system of temporary employment in a participative workplace both exploited and shaped entry-level workers’ aspirations and occupational goals. (V. Smith 1998: 411)
• I collected data [on White Separatist rhetoric] from several media of public discourse, includ-ing periodicals, books, pamphlets, transcripts from radio and television talk shows, and newspaper and magazine accounts. (Berbrier 1998: 435)
• In the analysis that follows, racial and gender inequality in employment and retirement will be analyzed, using a national sample of persons who began receiving Social Security Old Age benefits in 1980–81. (Hogan and Perrucci 1998: 528)
• Drawing from interviews with female crack dealers, this paper explores the techniques they use to avoid arrest. (Jacobs and Miller 1998: 550)
How to Design a Research ProjectYou’ve now seen some of the options available to social researchers in designing projects. I know there are a lot of components, and the relationships
should confront in your own research projects. In designing any study, be sure to look at both the ex-plicit and implicit assumptions you’re making about time. Are you interested in describing some process that occurs over time, or are you simply going to describe what exists now? If you want to describe a process occurring over time, will you be able to make observations at different points in the process, or will you have to approximate such observations by drawing logical inferences from what you can observe now? If you opt for a longitudinal design, which method best serves your research purposes?
Examples of Research StrategiesAs the preceding discussions have implied, social research follows many paths. The following short excerpts further illustrate this point. As you read each excerpt, note both the content of each study and the method used to study the chosen topic. Does the study seem to be exploring, describing, or explaining (or some combination of these)? What are the sources of data in each study? Can you identify the unit of analysis? Is the dimension of time relevant? If so, how will it be handled?
• This case study of unobtrusive mobilizing by Southern California Rape Crisis Center uses archival, observational, and interview data to explore how a feminist organization worked to change police, schools, prosecutors, and some state and national organizations from 1974 to 1994. (Schmitt and Martin 1999: 364)
• Using life history narratives, the present study investigates processes of agency and conscious-ness among 14 women who identified them-selves as tomboys. (Carr 1998: 528)
• By drawing on interviews with activists in the former Estonian Soviet Socialist Republic, we specify the conditions by which accommoda-tive and oppositional subcultures exist and are successfully transformed into social move-ments. (Johnston and Snow 1998: 473)
• This paper presents the results of an ethno-graphic study of an AIDS service organization located in a small city. It is based on a combi-
How to Design a Research Project ■ 113
purpose, the researcher needs to make a variety of decisions, as indicated in the remainder of the diagram.
To make this discussion more concrete, let’s take a specific research example. Suppose you’re concerned with the issue of abortion and have a special interest in learning why some college students support abortion rights and others oppose them. Going a step further, let’s say you’ve formed the impression that students in the humanities and social sciences seem generally more inclined to support the idea of abortion rights than those in the natural sciences do. (That kind of thinking often leads people to design and conduct social research.)
So, where do you start? You have an idea you want to pursue, one that involves abortion attitudes and choice of college major. In terms of the options we’ve discussed in this chapter, you probably have both descriptive and explanatory interests, but you might decide you only want to explore the issue. You might wonder what sorts of attitudes students with different majors have about abortion (ex-ploratory), what percentage of the student body supports a woman’s right to an abortion (descrip-tive), or what causes some to support it and others to oppose it (explanation). The units of analysis in this case would be individuals: college students. But we’re jumping the gun. As you can see, even be-fore we’ve “started,” we’ve started. The reciprocal processes described in Figure 4-6 begin even before you’ve made a commitment to a project. Let’s look more formally at the various steps, then, keeping this reciprocal motion in mind.
Getting StartedAt the outset of your project, your aim would prob-ably be exploratory. At this point, you might choose among several possible activities in pursuing your interest in student attitudes about abortion rights. To begin with, you might want to read something about the issue. If you have a hunch that attitudes are somehow related to college major, you might find out what other researchers may have written about that. Appendix A of this book will help you make use of your college library. In addition, you
among them may not be totally clear, so here’s a way of pulling them together. Let’s assume you were to undertake research. Where would you start? Then, where would you go?
Although research design occurs at the begin-ning of a research project, it involves all the steps of the subsequent project. This discussion, then, provides both guidance on how to start a research project and an overview of the topics that follow in later chapters of this book.
Figure 4-6 presents a schematic view of the traditional image of research design. I present this view reluctantly, because it may suggest more of a step-by-step order to research than actual practice bears out. Nonetheless, this idealized overview of the process provides a context for the specific details of particular components of social research. Essentially, it is another and more detailed picture of the scientific process presented in Chapter 2.
At the top of the diagram are interests, ideas, and theories, the possible beginning points for a line of research. The letters (A, B, X, Y, and so forth) represent variables or concepts such as prejudice or alienation. Thus, you might have a general interest in finding out what causes some people to be more prejudiced than others, or you might want to know some of the consequences of alienation. Alternatively, your inquiry might begin with a specific idea about the way things are. For example, you might have the idea that working on an assembly line causes alienation. The question marks in the diagram indicate that you aren’t sure things are the way you suspect they are—that’s why you’re doing the research. Notice that a theory is represented as a set of complex relationships among several variables.
The double arrows between “interest,” “idea,” and “theory” suggest that a movement back and forth across these several possible beginnings often takes place. An initial interest may lead to the for-mulation of an idea, which may be fit into a larger theory, and the theory may produce new ideas and create new interests.
Any or all of these three may suggest the need for empirical research. The purpose of such research can be to explore an interest, test a specific idea, or validate a complex theory. Whatever the

FIGURE 4-6
Traditional Image of Research Design.
How to Design a Research Project ■ 115
process of conceptualization in depth. For now, let’s see what it might involve in the case of our hypo-thetical example.
If you’re going to study how college students feel about abortion and why, the first thing you’ll have to specify is what you mean by “the right to an abortion.” Because support for abortion prob-ably varies according to the circumstances, you’ll want to pay attention to the different conditions under which people might approve or disapprove of abortion: for example, when the woman’s life is in danger, in the case of rape or incest, or simply as a matter of personal choice.
Similarly, you’ll need to specify exact mean-ings for all the other concepts you plan to study. If you want to study the relationship of opinion about abortion to college major, you’ll have to decide whether you want to consider only officially declared majors or to include students’ intentions as well. What will you do with those who have no major?
In surveys and experiments, you need to specify such concepts in advance. In less tightly structured research, such as open-ended inter-views, an important part of the research may in-volve the discovery of different dimensions, aspects, or nuances of concepts. In such cases, the research itself may uncover and report aspects of social life that were not evident at the outset of the project.
Choice of Research MethodAs we’ll discuss in Part 3, each research method has its strengths and weaknesses, and certain concepts are more appropriately studied through some methods than through others. In our study of attitudes toward abortion rights, a survey might be the most appropriate method: either interviewing students or asking them to fill out a questionnaire. Surveys are particularly well suited to the study of public opinion. This is not to say that you couldn’t make good use of the other methods presented in Part 3. For example, you might use the method of content analysis to examine letters to the editor and analyze the different images of abortion that letter writers have. Field research would provide an avenue to understanding how people interact with
would probably talk to some people who support abortion rights and some who don’t. You might attend meetings of abortion-related groups. All these activities could help prepare you to handle the various decisions of research design we’re about to examine.
Before designing your study, you must define the purpose of your project. What kind of study will you undertake—exploratory, descriptive, explanatory? Do you plan to write a research paper to satisfy a course or thesis requirement? Is your purpose to gain information that will support you in arguing for or against abortion rights? Do you want to write an article for the campus newspaper or an academic journal? In reviewing the previous research literature regarding abortion rights, you should note the design decisions other researchers have made, always asking whether the same deci-sions would satisfy your purpose.
Usually, your purpose for undertaking research can be expressed as a report. A good first step in designing your project is to outline such a report (see Chapter 17 for help on this). Although your final report may not look much like your ini-tial image of it, this exercise will help you figure out which research designs are most appropri-ate. During this step, clearly describe the kinds of statements you want to make when the research is complete. Here are some examples of such state-ments: “Students frequently mentioned abortion rights in the context of discussing social issues that concerned them personally.” “X percent of State U. students favor a woman’s right to choose an abortion.” “Engineers are (more/less) likely than sociologists to favor abortion rights.”
ConceptualizationOnce you have a well-defined purpose and a clear description of the kinds of outcomes you want to achieve, you can proceed to the next step in the design of your study—conceptualization. We often talk pretty casually about social science concepts such as prejudice, alienation, religiosity, and liberal-ism, but it’s necessary to clarify what we mean by these concepts, in order to draw meaningful conclusions about them. Chapter 5 examines this
116 ■ Chapter 4: Research Design
In every case, then, we select a sample from among the data that might be collected and studied. The sampling of information, of course, occurs in ev-eryday life and often produces biased observations. (Recall the discussion of “selective observation” in Chapter 1.) Social researchers are more deliberate in their sampling of what will be observed.
Chapter 7 describes methods for selecting samples that adequately reflect the whole popula-tion that interests us. Notice in Figure 4-6 that deci-sions about population and sampling are related to decisions about the research method to be used. Whereas probability sampling techniques would be relevant to a large-scale survey or a content analy-sis, a field researcher might need to select only those informants who will yield a balanced picture of the situation under study, and an experimenter might assign subjects to experimental and control groups in a manner that creates comparability.
In your hypothetical study of abortion at-titudes, the relevant population would be the student population of your college. As you’ll discover in Chapter 7, however, selecting a sample will require you to get more specific than that. Will you include part-time as well as full-time students? Only degree candidates or everyone? International students as well as U.S. citizens? Undergraduates, graduate students, or both? There are many such questions—each of which must be answered in terms of your research purpose. If your purpose is to predict how students would vote in a local referendum on abortion, you might want to limit your population to those eligible and likely to vote.
ObservationsHaving decided what to study among whom by what method, you’re now ready to make obser-vations—to collect empirical data. The chapters of Part 3, which describe the various research methods, give the different observation techniques appropriate to each.
To conduct a survey on abortion, you might want to print questionnaires and mail them to a sample selected from the student body. Alterna-tively, you could arrange to have a team of inter-
one another regarding the issue of abortion, how they discuss it, and how they change their minds. Other research methods introduced in Part 3 could also be used in studying this topic. Usually, the best study design uses more than one research method, taking advantage of their different strengths. If you look back at the brief examples of actual studies at the end of the preceding section, you’ll see several instances where the researchers used many meth-ods in a single study.
OperationalizationOnce you’ve specified the concepts to be studied and chosen a research method, the next step is op-erationalization, or deciding on your measurement techniques (discussed further in Chapters 5 and 6). The meaning of variables in a study is determined in part by how they are measured. Part of the task here is deciding how the desired data will be col-lected: direct observation, review of official docu-ments, a questionnaire, or some other technique.
If you decided to use a survey to study attitudes toward abortion rights, part of operationalization is determining the wording of questionnaire items. For example, you might operationalize your main variable by asking respondents whether they would approve of a woman’s right to have an abortion under each of the conditions you’ve conceptual-ized: in the case of rape or incest, if her life were threatened by the pregnancy, and so forth. You’d design the questionnaire so that it asked respon-dents to express approval or disapproval for each situation. Similarly, you would specify exactly how respondents would indicate their college major, as well as what choices to provide those who have not declared a major.
Population and SamplingIn addition to refining concepts and measurements, you must decide whom or what to study. The popu-lation for a study is that group (usually of people) about whom we want to draw conclusions. We’re almost never able to study all the members of the population that interests us, however, and we can never make every possible observation of them.
How to Design a Research Project ■ 117
Moving beyond simple description, you might describe the opinions of subsets of the student body, such as different college majors. Provided that your design called for trapping other informa-tion about respondents, you could also look at men versus women; freshmen, sophomores, juniors, seniors, and graduate students; or other categories that you’ve included. The description of subgroups could then lead you into an explanatory analysis.
ApplicationThe final stage of the research process involves the uses made of the research you’ve conducted and the conclusions you’ve reached. To start, you’ll probably want to communicate your findings so that others will know what you’ve learned. It may be appropriate to prepare—and even publish—a written report. Perhaps you’ll make oral presenta-tions, such as papers delivered to professional and scientific meetings. Other students would also be interested in hearing what you’ve learned about them.
You may want to go beyond simply reporting what you’ve learned to discussing the implica-tions of your findings. Do they say anything about actions that might be taken in support of policy goals? Both the proponents and the opponents of abortion rights would be interested.
Finally, be sure to consider what your research suggests in regard to further research on your sub-ject. What mistakes should be corrected in future studies? What avenues—opened up slightly in your study—should be pursued further?
Research Design in ReviewAs this overview shows, research design involves a set of decisions regarding what topic is to be stud-ied among what population with what research methods for what purpose. Although you’ll want to consider many ways of studying a subject—and use your imagination as well as your knowledge of a variety of methods—research design is the pro-cess of focusing your perspective for the purposes of a particular study.
viewers conduct the survey over the telephone. The relative advantages and disadvantages of these and other possibilities are discussed in Chapter 9.
Data ProcessingDepending on the research method chosen, you’ll have amassed a volume of observations in a form that probably isn’t immediately interpretable. If you’ve spent a month observing a street-corner gang firsthand, you’ll now have enough field notes to fill a book. In a historical study of ethnic diversity at your school, you may have amassed volumes of official documents, interviews with administra-tors and others, and so forth. Chapters 13 and 14 describe some of the ways social science data are processed or transformed for qualitative or quanti-tative analysis.
In the case of a survey, the “raw” observations are typically in the form of questionnaires with boxes checked, answers written in spaces, and the like. The data-processing phase of a survey typically involves the classification (coding) of written-in answers and the transfer of all information to a computer.
AnalysisOnce the collected data are in a suitable form, you’re ready to interpret them for the purpose of drawing conclusions that reflect the interests, ideas, and theories that initiated the inquiry. Chapters 13 and 14 describe a few of the many options avail-able to you in analyzing data. In Figure 4-6, notice that the results of your analyses feed back into your initial interests, ideas, and theories. Often this feedback represents the beginning of another cycle of inquiry.
In the survey of student attitudes about abor-tion rights, the analysis phase would pursue both descriptive and explanatory aims. You might begin by calculating the percentages of students who favored or opposed each of the several different versions of abortion rights. Taken together, these several percentages would provide a good picture of student opinion on the issue.

118 ■ Chapter 4: Research Design
by attending meetings of certain groups? Could you glean the data you need from books in the library?
As you answer these questions, you’ll find yourself well into the process of research design. Keep in mind your own research abilities and the resources available to you. There’s little point in designing a perfect study that you can’t actually carry out. You may want to try a research method you haven’t used before so you can learn from it, but be careful not to put yourself at too great a disadvantage.
Once you have a general idea of what you want to study and how, carefully review previous research in journals and books to see how other researchers have addressed the topic and what they have learned about it. Your review of the litera-ture may lead you to revise your research design: Perhaps you’ll decide to use a previous researcher’s method or even replicate an earlier study. A standard procedure in the physical sciences, the independent replication of research projects is just as important in the social sciences, although social researchers tend to overlook that. Or, you might want to go beyond replication and study some as-pect of the topic that you feel previous researchers have overlooked.
Here’s another approach you might take. Suppose a topic has been studied previously using field research methods. Can you design an experi-ment that would test the findings those earlier researchers produced? Or, can you think of existing statistics that could be used to test their conclu-sions? Did a mass survey yield results that you’d like to explore in greater detail through on-the-spot observations and in-depth interviews? The use of several different research methods to test the same finding is sometimes called triangulation, and you should always keep it in mind as a valuable research strategy. Because each research method has particular strengths and weaknesses, there is always a danger that research findings will reflect, at least in part, the method of inquiry. In the best of all worlds, your own research design should bring more than one research method to bear on the topic.
If you’re doing a research project for one of your courses, many aspects of research design may be specified for you in advance, including the method (such as an experiment) or the topic (as in a course on a particular subject, such as prejudice). The following summary assumes that you’re free to choose both your topic and your research strategy.
In designing a research project, you’ll find it useful to begin by assessing three things: your interests, your abilities, and the available resources. Each of these considerations will suggest a large number of possible studies.
Simulate the beginning of a somewhat con-ventional research project: Ask yourself what you’re interested in understanding. Surely you have several questions about social behavior and attitudes. Why are some people politically liberal and others politically conservative? Why are some people more religious than others? Why do people join militia groups? Do colleges and universities still discriminate against minority faculty members? Why would a woman stay in an abusive relation-ship? Spend some time thinking about the kinds of questions that interest and concern you.
Once you have a few questions you’d be in-terested in answering for yourself, think about the kind of information needed to answer them. What research units of analysis would provide the most relevant information: college students, corpora-tions, voters, cities, or corporations? This question will probably be inseparable in your thoughts from the question of research topics. Then ask which aspects of the units of analysis would provide the information you need in order to answer your research question.
Once you have some ideas about the kind of information relevant to your purpose, ask yourself how you might go about getting that information. Are the relevant data likely to be already available somewhere (say, in a government publication), or would you have to collect them yourself? If you think you would have to collect them, how would you go about doing it? Would you need to survey a large number of people, or interview a few people in depth? Could you learn what you need to know

The Research Proposal ■ 119
in your course, you may want to skip ahead to Chapter 17. It will familiarize you with the differ-ent types of research literature, how to find what you want, and how to read it. There is a special discussion of how to use online resources and how to avoid being misled by information on the Internet.
In part, your review of the literature will be shaped by the data-collection method(s) you intend to use in your study. Reviewing the designs of previous studies using that same technique can give you a head start in planning your own study. At the same time, you should focus your search on your research topic, regardless of the methods other researchers have used. So, if you’re planning field research on, say, interracial marriages, you might gain some useful insights from the findings of surveys on the topic; further, past field research on interracial marriages could be invaluable in your designing a survey on the topic.
Because the literature review will appear early in your research proposal, you should write it with an eye to introducing the reader to the topic you will address, laying out in a logical manner what has already been learned on the topic by past researchers, then leading up to the holes or loose ends in our knowledge of the topic, which you propose to remedy. Or, a little differently, your review of the literature may point to inconsisten-cies or disagreements to be found among the exist-ing research findings. In that case, your proposed research will aim to resolve the ambiguities that plague us. I don’t know about you, but I’m already excited about the research you’re proposing to undertake.
Subjects for StudyWhom or what will you study in order to collect data? Identify the subjects in general, theoretical terms; then, in specific, more concrete terms, iden-tify who is available for study and how you’ll reach them. Will it be appropriate to select a sample? If so, how will you do that? If there is any possibility that your research will affect those you study, how will you insure that the research does not harm them?
The Research ProposalQuite often, in the design of a research project, you’ll have to lay out the details of your plan for someone else’s review and/or approval. In the case of a course project, for example, your instructor might very well want to see a “proposal” before you set off to work. Later in your career, if you wanted to undertake a major project, you might need to obtain funding from a foundation or gov-ernment agency, who would most definitely want a detailed proposal that describes how you would spend their money. You might respond to a Request for Proposals (RFP), which both public and private agencies often circulate in search of someone to do research for them.
This chapter continues with a brief discussion of how you might prepare a research proposal. This will give you one more overview of the whole research process that the rest of this book details.
Elements of a Research ProposalAlthough some funding agencies (or your instruc-tor, for that matter) may have specific requirements for the elements or structure of a research proposal, here are some basic elements you should include.
Problem or ObjectiveWhat exactly do you want to study? Why is it worth studying? Does the proposed study have practical significance? Does it contribute to the construction of social theories?
Literature ReviewWhat have others said about this topic? What theo-ries address it and what do they say? What previ-ous research exists? Are there consistent findings, or do past studies disagree? Are there flaws in the body of existing research that you think you can remedy?
Chapter 17 has a lengthier discussion of this topic. You’ll find that reading social science re-search reports requires special skills. If you need to undertake a review of the literature at this point

120 ■ Chapter 4: Research Design
BudgetWhen you ask someone to cover the costs of your research, you need to provide a budget that specifies where the money will go. Large, expensive projects include budgetary categories such as personnel, equipment, supplies, tele-phones, and postage. Even for a project you’ll pay for yourself, it’s a good idea to spend some time anticipating expenses: office supplies, photocopy-ing, CD-ROMs, telephone calls, transportation, and so on.
As you can see, if you’re interested in conduct-ing a social research project, it’s a good idea to prepare a research proposal for your own pur-poses, even if you aren’t required to do so by your instructor or a funding agency. If you’re going to invest your time and energy in such a project, you should do what you can to insure a return on that investment.
Now that you’ve had a broad overview of social research, you can move on to the remaining chap-ters in this book and learn exactly how to design and execute each specific step. If you’ve found a research topic that really interests you, you’ll want to keep it in mind as you see how you might go about studying it. As always, however, you should keep the ethical dimension of research design in mind as you explore your options.
The Ethics of Research DesignDesigning a research project must include serious consideration of the ethical dimension of social science research. To begin, if your study requires the participation of human subjects, you must determine whether the likely benefi ts of the re-search will justify the time and effort you’ll ask of them.
Then you’ll want to design the study in con-currence with the ethical concerns discussed in Chapter 3. For example, you’ll want to insure that the subjects’ privacy and well-being is protected. As I’ve indicated earlier, it may be appropriate for your research design to be reviewed by an Institutional Review Board.
Beyond these general questions, the specific research method you’ll use will further specify the matter. If you’re planning to undertake an experi-ment, a survey, or field research, for example, the techniques for subject selection will vary quite a bit. Happily, Chapter 7 of this book discusses sam-pling techniques for both qualitative and quantita-tive studies.
MeasurementWhat are the key variables in your study? How will you define and measure them? Do your definitions and measurement methods duplicate or differ from those of previous research on this topic? If you have already developed your measurement device (a questionnaire, for example) or will be using something previously developed by others, it might be appropriate to include a copy in an appendix to your proposal.
Data-Collection MethodsHow will you actually collect the data for your study? Will you conduct an experiment or a survey? Will you undertake field research or will you focus on the reanalysis of statistics already cre-ated by others? Perhaps you’ll use more than one method.
AnalysisIndicate the kind of analysis you plan to conduct. Spell out the purpose and logic of your analysis. Are you interested in precise description? Do you intend to explain why things are the way they are? Do you plan to account for variations in some quality: for example, why some students are more liberal than others? What possible explanatory vari-ables will your analysis consider, and how will you know if you’ve explained variations adequately?
ScheduleIt’s often appropriate to provide a schedule for the various stages of research. Even if you don’t do this for the proposal, do it for yourself. Unless you have a timeline for accomplishing the several stages of research and keeping track of how you’re doing, you may end up in trouble.

Main Points ■ 121
research is the individual person, but it may also be a social group, a formal organization, a social interaction, a social artifact, or some other phe-nomenon such as a lifestyle.
• The ecological fallacy involves taking conclusions drawn solely from the analysis of groups (e.g., corporations) and applying them to individuals (e.g., the employees of corporations).
• Reductionism is the attempt to understand a complex phenomenon in terms of a narrow set of concepts, such as attempting to explain the American Revolution solely in terms of economics (or political idealism or psychology).
The Time Dimension
• Research into processes that occur over time presents social challenges that can be addressed through cross-sectional studies or longitudinal studies.
• Cross-sectional studies are based on observations made at one time. Although this characteristic limits such studies, researchers can sometimes use them to make inferences about processes that oc-cur over time.
• In longitudinal studies, observations are made at many times. Such observations may be made of samples drawn from general populations (trend studies), samples drawn from more specific subpopulations (cohort studies), or the same sample of people each time (panel studies).
How to Design a Research Project
• Research design starts with an initial interest, idea, or theoretical expectation and proceeds through a series of interrelated steps to narrow the focus of the study so that concepts, methods, and procedures are well defined. A good research plan accounts for all these steps in advance.
• At the outset, a researcher specifies the meaning of the concepts or variables to be studied (con-ceptualization), chooses a research method or methods (e.g., experiments versus surveys), and specifies the population to be studied and, if ap-plicable, how it will be sampled.
• To operationalize the concepts to be studied, the researcher states precisely how variables in the study will be measured. Research then proceeds through observation, data processing, analysis, and application, such as reporting the results and assessing their implications.
M A I N P O I N TS
Introduction
• Any research design requires researchers to specify as clearly as possible what they want to find out and then determine the best way to do it.
Three Purposes of Research
• The principal purposes of social research in-clude exploration, description, and explanation. Research studies often combine more than one purpose.
• Exploration is the attempt to develop an initial, rough understanding of some phenomenon.
• Description is the precise measurement and reporting of the characteristics of some population or phenomenon under study.
• Explanation is the discovery and reporting of relationships among different aspects of the phe-nomenon under study. Whereas descriptive stud-ies answer the question “What’s so?” explanatory ones tend to answer the question “Why?”
The Logic of Nomothetic Explanation
• Both idiographic and nomothetic models of explanation rest on the idea of causation. The idiographic model aims at a complete under-standing of a particular phenomenon, using all relevant causal factors. The nomothetic model aims at a general understanding—not necessarily complete—of a class of phenomena, using a small number of relevant causal factors.
• There are three basic criteria for establishing cau-sation in nomothetic analyses: (1) The variables must be empirically associated, or correlated, (2) the causal variable must occur earlier in time than the variable it is said to affect, and (3) the observed effect cannot be explained as the effect of a different variable.
Necessary and Sufficient Causes
• Mere association, or correlation, does not in itself establish causation. A spurious causal relationship is an association that in reality is caused by one or more other variables.
Units of Analysis
• Units of analysis are the people or things whose characteristics social researchers observe, describe, and explain. Typically, the unit of analysis in social
122 ■ Chapter 4: Research Design
the time order is just the opposite of what was assumed?
2. Here are some examples of real research topics. For each one, can you name the unit of analysis? (The answers are at the end of this chapter.)
a. Women watch TV more than men because they are likely to work fewer hours outside the home than men. . . . Black people watch an average of approximately three-quarters of an hour more television per day than white people. (Hughes 1980: 290)
b. Of the 130 incorporated U.S. cities with more than 100,000 inhabitants in 1960, 126 had at least two short-term nonproprietary general hospitals accredited by the American Hospital Association. (Turk 1980: 317)
c. The early TM [transcendental meditation] organizations were small and informal. The Los Angeles group, begun in June 1959, met at a member’s house where, incidentally, Maharishi was living. (Johnston 1980: 337)
d. However, it appears that the nursing staffs exercise strong influence over . . . a decision to change the nursing care system. . . . Con-versely, among those decisions dominated by the administration and the medical staffs . . . (Comstock 1980: 77)
e. Though 667,000 out of 2 million farmers in the United States are women, women histori-cally have not been viewed as farmers, but rather, as the farmer’s wife. (Votaw 1979: 8)
f. The analysis of community opposition to group homes for the mentally handicapped . . . indicates that deteriorating neighborhoods are most likely to organize in opposition, but that upper-middle class neighborhoods are most likely to enjoy private access to local officials. (Graham and Hogan 1990: 513)
g. Some analysts during the 1960s predicted that the rise of economic ambition and political militancy among blacks would foster discon-tent with the “otherworldly” black mainline churches. (Ellison and Sherkat 1990: 551)
h. This analysis explores whether propositions and empirical findings of contemporary theories of organizations directly apply to both private product producing organizations (PPOs) and public human service organiza-tions (PSOs). (Schiflett and Zey 1990: 569)
i. This paper examines variations in job title structures across work roles. Analyzing 3,173
The Research Proposal
• A research proposal provides a preview of why a study will be undertaken and how it will be conducted. A research proposal is often required to get permission or necessary resources. Even when not required, a proposal is a useful device for planning.
The Ethics of Research Design
• Your research design should indicate how your study will abide by the ethical requirements of social research.
• It may be appropriate for your research proposal to be reviewed by an Institutional Review Board.
K E Y T E R M S
The following terms are defined in context in the chapter and at the bottom of the page where the term is introduced, as well as in the comprehensive glossary at the back of the book.
cohort study reductionism
correlation social artifact
cross-sectional study sociobiology
ecological fallacy spurious relationship
longitudinal study trend study
panel study units of analysis
P R O P O S I N G S O C I A L R E S E A R C H : D E S I G N
This chapter has laid out many different ways social research can be structured. In designing your research project, you will need to specify which among these you will use. Is your purpose that of exploring a topic, providing a detailed description, or explaining the social differences and processes you may observe? If you are planning a causal analysis, you should say something about how you will organize and pursue that goal.
Further, will your project collect data at one point in time or compare data across time? What data col-lection technique(s) will you employ? You will revisit these and similar questions as you delve into your project.
R E V I E W Q U E S T I O N S A N D E X E R C I S E S
1. One example in this chapter suggested that politi-cal orientations cause attitudes toward legalizing marijuana. Can you make an argument that
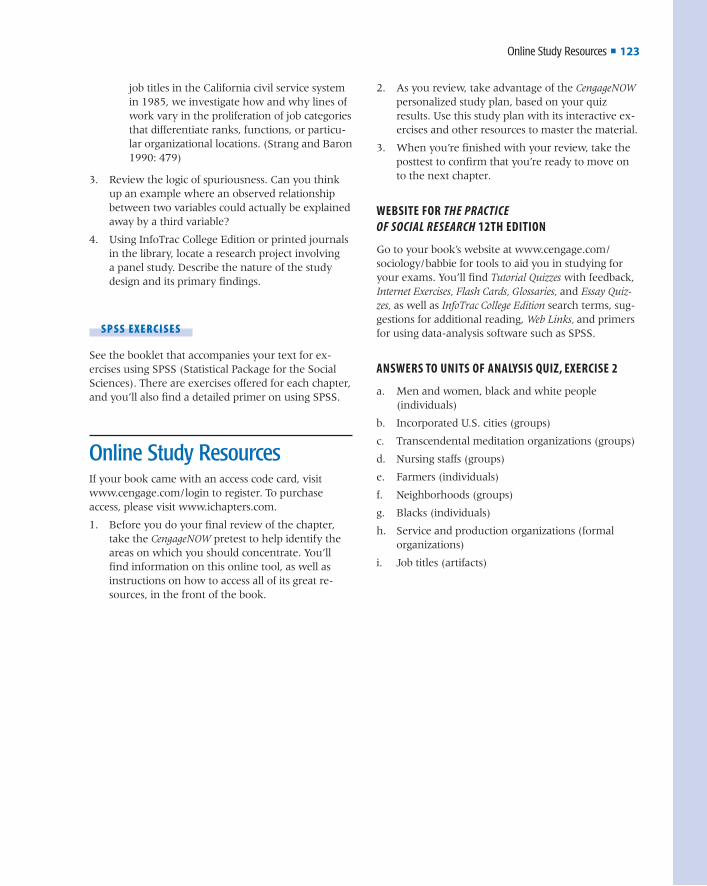
Online Study Resources ■ 123
2. As you review, take advantage of the CengageNOWpersonalized study plan, based on your quiz results. Use this study plan with its interactive ex-ercises and other resources to master the material.
3. When you’re finished with your review, take the posttest to confirm that you’re ready to move on to the next chapter.
WEBSITE FOR THE PRACTICE OF SOCIAL RESEARCH 12TH EDITION
Go to your book’s website at www.cengage.com/sociology/babbie for tools to aid you in studying for your exams. You’ll find Tutorial Quizzes with feedback, Internet Exercises, Flash Cards, Glossaries, and Essay Quiz-zes, as well as InfoTrac College Edition search terms, sug-gestions for additional reading, Web Links, and primers for using data-analysis software such as SPSS.
ANSWERS TO UNITS OF ANALYSIS QUIZ, EXERCISE 2
a. Men and women, black and white people (individuals)
b. Incorporated U.S. cities (groups)
c. Transcendental meditation organizations (groups)
d. Nursing staffs (groups)
e. Farmers (individuals)
f. Neighborhoods (groups)
g. Blacks (individuals)
h. Service and production organizations (formal organizations)
i. Job titles (artifacts)
job titles in the California civil service system in 1985, we investigate how and why lines of work vary in the proliferation of job categories that differentiate ranks, functions, or particu-lar organizational locations. (Strang and Baron 1990: 479)
3. Review the logic of spuriousness. Can you think up an example where an observed relationship between two variables could actually be explained away by a third variable?
4. Using InfoTrac College Edition or printed journals in the library, locate a research project involving a panel study. Describe the nature of the study design and its primary findings.
S P S S E X E R C I S E S
See the booklet that accompanies your text for ex-ercises using SPSS (Statistical Package for the Social Sciences). There are exercises offered for each chapter, and you’ll also find a detailed primer on using SPSS.
Online Study ResourcesIf your book came with an access code card, visit www.cengage.com/login to register. To purchase access, please visit www.ichapters.com.
1. Before you do your final review of the chapter, take the CengageNOW pretest to help identify the areas on which you should concentrate. You’ll find information on this online tool, as well as instructions on how to access all of its great re-sources, in the front of the book.