research contributions to the future now: collaboration...
TRANSCRIPT

© MIT 2002 [email protected]
Research Contributions to the Future Now:
Collaboration, Design, Internal Markets and
Supply Chain VisualizationB2B in Supply Chain Management
Center for eBusiness Annual ConferenceApril 17, 2002
James B. Rice, Jr. Director – Integrated Supply Chain Management Program
MIT
© MIT 2002 [email protected]
Agenda
• Introduction: SCM & Logistics at MIT• Recent and Current Relevant Research
• SC vs. SC?• Collaboration, Alliances and Collaboration • Wise Abuse of Supply Chain Power
• Supply Chain Visualization • Research Implications

© MIT 2002 [email protected]
Agenda (Cliff’s Notes)
• Overview SCM at MIT• We’re doing a lot of SC research here
• Recent and Current Relevant Research • SC vs. SC?
• Companies will compete on ability to integrate capabilities of suppliers & customers: so coordination & collaboration are critical
• Coordination, Alliances and Collaboration• Collaborate on LIKE or LINKED activities
• Wise Abuse of Supply Chain Power• If companies can collaborate, they can use power to advantage the
entire chain but this requires a system mindset and ability to vision• Supply Chain Visualization
• A new way to understand and redesign supply chains
• Research Implications
© MIT 2002 [email protected]
Center for Transportation & Logistics
• Education • Master of Science in Transportation (MST, 2 years)• Master of Engineering in Logistics (MLog, 1 year)• Ph.D. in Transportation & Logistics• Executive Courses
• Research• Over 60 faculty and research staff• About $6 Million per year• Many sponsors, diverse topics
• External Interaction• Integrated Supply Chain Management Program (ISCM)• Affiliates Program in Logistics (APIL)• Government, Industry

© MIT 2002 [email protected]
SCM & Logistics at MIT
• Center for Transportation and Logistics (CTL) – Home for SCM outreach & SCM research, broad research agenda
• Integrated Supply Chain Management (ISCM) Program• Affiliates Program In Logistics (APIL)
• Leaders for Manufacturing Program (LFM) – Grad. dual-degree program (Engineering and Business) focusing on operations
• Center for Coordination Science (CCS) – Center studying coordination across orgs with focus on SCM and eBusiness
• System Dynamics Group (SDG) – SD research spans into SCM• Engineering Systems Division – Group of Centers with cross-
functional aspects to their research (includes SCM-related work) • Center for eBusiness (CeB) – eBusiness research spans into SCM• Operations Research Center – Research center studying the use of
operations research methodologies with SCM applications

© MIT 2002 [email protected]
SCM & Logistics Across MIT
Seventy+ Interdisciplinary Centers & Programs• Center for Transportation and Logistics (CTL) – Home for SCM
outreach & SCM research, broad research agenda (logistics to aging)• Integrated Supply Chain Management (ISCM) Program• Affiliates Program In Logistics (APIL)
• Leaders for Manufacturing Program (LFM) – Dual-degree (graduate) program (Engineering and Business) focusing on operations
• Center for Coordination Science (CCS) – Research center studying coordination across businesses with focus on SCM and eBusiness
• System Dynamics Group (SDG) – SD research spans into SCM• Engineering Systems Division – Group of Centers with cross-
functional aspects to their research (includes SCM-related work) • Center for eBusiness (CeB) – eBusiness research spans into SCM• Operations Research Center – Research center studying the use of
operations research methodologies with many applications on SCM


© MIT 2002 [email protected]
Popular ‘Wisdom’ About the Future….
* Academic Alliance Forum** Rob Rodin, CEO of electronics distributor Marshall Industries
“Business competition is moving away from the traditional company vs. company model in favor of a system that pits supply chain against supply chain.”*
“It’s a supply chain vs. supply chain world today. Companies don’t only compete with each other but
with an extended web of suppliers.”**

© MIT 2002 [email protected]
The Evidence
• SCs compete against SCs• From the farm
• Tyson & Perdue (chickens), Smithfield & IBP (beef) compete as nearly vertically-integrated competitors
• Fashion Industry• The Limited competing against Levis, Zara competes against all others
• Wool vs. Wool• Aussie ‘Tasmanian wool’ producers dedicated SC thru to retailer Brax
• SCs don’t compete against SCs• US Automotive Industry & US Aerospace/Airframe Industry
• GM’s SC can’t literally ‘compete’ against Daimler-Chrysler’s SC because they share the same suppliers
• Airbus vs. Boeing companies rely on the same suppliers for avionics, engines, tires, seats, and multiple other components
• Dell, Compaq & other PC manufacturers• Modularity of PC components makes PC SCs overlap at multiple tiers
• Suppliers that are simultaneously competitors• Common to find suppliers competing with their customers

© MIT 2002 [email protected]%
10%
20%
30%
40%
50%
60%
70%
80%Re
spon
se R
ate
Academia Industry Consulting All
YesNo
Delphi Study SC vs. SC Data
• ‘Will SC compete against SCs?’• 70% agreed
• ‘Describe nature of competition’• 41% described competing SC vs. SC• 23% described most dominant party drives competition• 37% described competing on capabilities & design
From Network Master Working PaperRice and Hoppe, August, 2001

© MIT 2002 [email protected]
So will the future be SC vs. SC?• SC vs. SC not likely
• Limited validity• Most SCs are not able to truly compete as a unique group as many
supply chains share common suppliers • Suppliers compete with their customers
• Limited utility• Benefits are not clear• Difficult to use data beyond one tier except in fixed BOM
products
• Cases where SC vs. SC holds• Fragmented industries• Vertically integrated companies• Sole source relationships throughout the supply network

© MIT 2002 [email protected]
SC vs. SC Sum
• SC vs. SC not valid or practical for broad application• In the future…..
• Chains of companies will not compete against other chains of companies (except in rare situations)
• Companies will compete against other companies based on their respective supply network capabilities
• Capabilities will include capabilities ‘integrated’ from suppliers and customers
• Meaningful benefits will come from working with immediate customers and suppliers rather than distant upstream or downstream parties
• Coordination between parties required!

© MIT 2002 [email protected]
Competing on Supply Network Capability
“A company is its chain of continually evolving capabilities – that is,
its own capabilities plus the capabilities of everyone it does business with.”
Professor Charlie Fine of MIT“Clockspeed” (1998)


© MIT 2002 [email protected]
What is Collaboration?• Defining Collaboration
• Collaboration is an abused term: although it is in vogue, its not understood, with many uses & definitions
• Per Merriam Webster, collaboration definition is• ‘to work jointly with others’ and ‘to cooperate with’
• But there are different ways ‘to work jointly with others’ • Alliances, ad-hoc initiatives, short-term projects
• We use it to mean when firms actively work together
• Specifically, there are different dimensions of Collaboration• Type: Which processes are involved?• Level: How deep is the collaboration, how much is being shared?• Scale, Scope: How many entities, how broad is the process?• Time Frame: How long is the collaborative work expected? Is it a
project-oriented or limited-term activity, or part of a long-term plan?
© J. Rice & The Concours Group - based on workwork by J. Rice & The Concours Group, 2002

© MIT 2002 [email protected]
Types of Collaboration• Type of Collaboration – Which processes are involved?
• Like Processes: When organizations with the same or LIKE processes work together, often to eliminate redundant resources and attain economies of scale.
• Linked Processes: When organizations with processes that are LINKED (a supply chain) work together, often to improve the flows through the organizations and to attain economies of scope.
• Most recently conducted a study of among LINKED parties (P&G, Intel)• Recognize that these different types of collaboration entail a different
relationship as the objectives, skill sets and measurements • Underscored the importance of developing collaborative
relationships and the methods for improving long-term benefits in dyadic (two-party, customer-supplier relationships)
© J. Rice & The Concours Group - based on workwork by J. Rice & The Concours Group, 2002

© MIT 2002 [email protected]
Why Collaborate?• Because there are benefits one entity cannot create without the help of
another • Modifying a product specification slightly to allow a supplier to use standard
materials and therefore reduce material cost, inventory and complexity• Because benefits can be created when two or more entities coordinate
• Consolidating purchases volume for greater leverage and economies of scale• Coordinating transportation and logistics for higher utilization of transportation
vehicles and reducing use of high-cost (LTL) transportation• Improved service to a common customer through connected processes
• Because risk can be reduced or eliminated in the system • Relocating inventories in best location for the system rather than where the most
powerful party instructs• Risk pooling by consolidating demand and having single inventories serve
multiple risks• Because working together helps uncover and eliminate redundancies
• Internally using shared services for economies of scale through use of shared resources (Warehouses, Transportation, Finance, Human Resources, etc.)
• Leverage common assets© J. Rice & The Concours Group - based on workwork by J. Rice & The Concours Group, 2002

© MIT 2002 [email protected]
Benefits by Type
• LIKE• Economies of Scale
• Consolidating volume for discounts, longer production runs• Networks easier to optimize with more transportation legs
• Consistency• LINKED
• Economies of Scope• Faster cycle times• Risk balancing• Reduced risk, increased flexibility
• Risk pooling as described by David Simchi-Levi
© J. Rice & The Concours Group - based on workwork by J. Rice & The Concours Group, 2002

© MIT 2002 [email protected]
Examples – Linked (SC) CollaborationCompany Industry Collaboration
Dell Computer Computer With vendors for high service, SLAs and nearby supply facilities
Calyx & Corolla Flower Retailing With growers to pack & ship direct, with shipper (FedEx) for support
Monorail Computer With FedEx on PC design
Pentacon Fastener Distribution
With Cummins on parts needs & consolidation
Sara Lee, Nike Food, Shoes, Autos
With mfrs to make products they market
Zara Fashion clothing Within to respond to demand in 3 wks


© MIT 2002 [email protected]
Pop Quiz!
• Does a dominant firm (almost) always benefit from exercising its power?
• To combat the negatives of chain power, should we try to make the powerful firm behave more competitively?
• Is the use of chain power basically about squeezing people upstream and downstream?
• Does it matter whether a dominant firm pushes its inventory on its suppliers vs. its customers?
• Does all the inventory risk shift to supplier when the dominant firm pushes inventory to supplier?
Research by Hines, Rice, Goncalves 2002

© MIT 2002 [email protected]
Issues and the Wise-Abuse View
Maybe not: The slice vs. pie size problem
Does dominant firm always benefit from power use?
Only where dominant firm is located near supplier
Does all inventory risk shift to suppliers?
Pushing to customers adds risk, pushing to suppliers may benefit whole chain
Pushing inventory to customers vs. suppliers?
There are many ways of using power
Is use of chain power about squeezing costs?
Dominant firm is a leverage point to improve chain perf.
Make dominant firm behave “competitively”?
Issue Wise-Abuse View
Research by Hines, Rice, Goncalves 2002

© MIT 2002 [email protected]
Problem Statement
• A chain with a dominant firm could perform better than a chain without one.
• But, chains with dominant firms currently perform no better than chains without one.
Time
Chain Wide ProfitabilityWise use of power
Usual use of power
Supply chain with no dominant firm?
Research by Hines, Rice, Goncalves 2002

© MIT 2002 [email protected]
Problem Statement
We suspect that most dominant firms don’t use their chain power to their best advantage, although they may abuse their power to
provide some advantage.
They don’t understand the chain dynamics, and so they **can’t** exercise their power
wisely.
Research by Hines, Rice, Goncalves 2002

© MIT 2002 [email protected]
Wise and Unwise Abuse
• Unwise Abuse of Dominant Firm Chain Power• Use dominant firm power to exact short-term gains for the
dominant firm at the expense of the chain• Zero-sum game
• Wise Abuse of Dominant Firm Chain Power• Use dominant firm power to so that the whole chain
benefits & so the dominant firm benefits more than unwise use of power
• Not zero-sum game, potential for growth
Research by Hines, Rice, Goncalves 2002

© MIT 2002 [email protected]
Understanding Abuses of Chain Power
• Multiple uses of dominant chain power• Beyond traditional ‘cost’ squeezing
• From abstraction to concrete: Categories of abuse• 1: Shift inventory costs along supply chain• 2: Constrain or direct supply and demand• 3: Set standards and technology• 4: Maintain standards and technology• 5: Force others to improve our process• 6: Take greater share of industry profit• 7: Extend power outside core domain• 8: Create demand
Research by Hines, Rice, Goncalves 2002

© MIT 2002 [email protected]
Analyzing One Category of Abuse
• Shift inventory costs along supply chain• Dominant firm operates as
• a ‘pull’ customer – requiring supplier to hold invty• a ‘push’ supplier – requiring customer to hold invty
• Dominant firm demands that local inventory be owned by others in the supply chain
• Dominant firm • Demands immediate payment from customers • Delays payments to suppliers
• Impact• Pushing inventory to suppliers increases risk, obsolescence
and transportation costs
Research by Hines, Rice, Goncalves 2002
© MIT 2002 [email protected]
Some General Insights• Most people’s “solutions” involve reducing power of
the dominant firm (DF)• There are both positive and negative impacts from
any action for both the power and non-power party, the net effect usually detrimental to the non-power party
• The wise-abuse solution is to figure how to best use the opportunity implicit when exercising power
Research by Hines, Rice, Goncalves 2002

© MIT 2002 [email protected]
Some “Shifting Inventory” Insights• Dominant firm shifting inventory costs to others:
• Helps the system if the dominant firm is the customer• Hurts the system if the dominant firm is the supplier
• Shifting inventory to supplier may reduce• Obsolescence by enabling postponement of customization• Risk by enabling risk pooling
• Shifting inventory to customer can • Can shift boundary of push – pull system• Turn the system into a push system• Increase supply chain instability
• Use e-tools to minimize cost of monitoring supplier• Increase negative correlation between mfg & demand risk
Research by Hines, Rice, Goncalves 2002

© MIT 2002 [email protected]
So …..• Companies will compete based on internal capabilities
• And not as a supply chain• Capabilities will include those ‘integrated’ from
customers and suppliers• Hence importance of developing collaborative relationships,
recognizing the need for a common collaborative objective• Use of dominant power in the supply network can
improve with an understanding of the entire system• So for best SC performance, it is important to:
• Coordinate with other parties in the entire chain• Develop ways to understand the entire chain as a system and
the complexity of the supply chain in simple ways • But how?


© MIT 2002 [email protected]
Common Problems with Supply Chains
• Hard to explain “intangible” supply chains
• Hard to understand and manage supply chain dynamics• Within one company, across companies, and over time• With rapid response to changing needs
• Hard to rapidly invent, redesign, and reconfigure supply chains or networks
• We need to change the nature of the conversations
• Requirement for Supply Network Collaboration high

© MIT 2002 [email protected]
System Dynamics
The Problem with Supply Networks (SN)• Intangible: Hard to quickly grasp underlying dynamics• High complexity: Hard to manage across entire network• Change: Hard to rapidly invent, redesign, and reconfigure
Vision• 3D manipulation of SN process models by multiple usersInterdisciplinary: Integrating 3 Components• Tangible User Interface (TUI)• Systems Dynamics models and simulations• Process Handbook Knowledge RepositoryValueSolve SN collaboration issues (product mix, demand variability)Tangibly illustrate dynamics of SN & enable rapid analysis/redesign
Supply Chain Visualization
TUI: SensetableProf. Hiroshi Ishii•Modeling with “Molecules”
•Simulation for relationships & interactions•Analytical Approach – Loop Advisor•Working with real world data
FabricationInventory
Finished GoodsInventoryProduction
Start RateNet
ProductionRate
Sales toChannel
Desired FinishedGoods Inventory
ExpectedChannel
Demand forIntel Chips
DesiredFabricationInventory
Desired FinishedGoods Inventory
Coverage
Finished GoodsInventory
Adjustment
FabricationInventory
Adjustment
DesiredProductionStart Rate
ManufacturingCycle Time
FabricationAdjustment
Time
DesiredAssembly
StartsTime to UpdateChannel Orders
-
-
+
++
+
-
Time to AdjustFinished Goods
Inventory
+ +
-
+
+
-+
-
+
+
+
AssemblyInventory Net
AssemblyCompletion
+
Time to CompleteAssembly
Desired NetAssembly
Completion
DesiredAssemblyInventory
AssemblyInventory
Adjustment
Time to AdjustAssemblyInventory
+
+
+
+
-
-
InitialAssemblyInventory
InitialFabricationInventory
AssemblyStart Rate
Line Yield
Die PerWafer
Die PerWafer Yield
Unit to DieYield
ProductionRejects
<ChannelDemand forIntel Chips>
+
+
-+
+
++
AssemblyRejects
GrossAssembly
Completion
++
+-
Desired NetProduction
Rate
--+<Line
Yield>
<BacklogAdjustment>
+
BacklogSwitch
DesiredGross
AssemblyCompletion +
+ +
-
Desired GrossProduction
Rate
+
Max GrossProduction Rate
MaximumGross
AssemblyCompletion
+
-
+
MaximumShipment
Rate
Minimum OrderProcessing Time Table for Orde
r Fulfillment
OrderFulfillment
Ratio
Safety Stock Coverage
+
Intels MarketShare
Perceived IntelFraction Orders
Filled
Time toPerceive
Fraction OrdersFilled
+
ChannelDemand
+
Table forAttractiveness
ReferenceFraction
Orders Filled
CompetitorsAttractiveness
TotalAttractiveness
Intels Attractivenes
s+
+
+
+
-
-
Initial FractionOrder FilledChannel Order
BacklogChannelDemand forIntel Chips
OrderFulfillment
Rate
DesiredShipment
Rate
Target DeliveryDelay
AcceptableBacklog Backlog
Adjustment
Time to Adjust Backlog
+
-
InventoryCoverage+
<Target DeliveryDelay>Perceived
PresentDemand
Change inPerceived Present
Demand -
HistoricalDemand
Change inHistorical Demand
-
Time to PerceivePresent Demand
Time Horizon forHistoricalDemand
-
-
+Indicated
Trend
-
+-
+ForecastDemand
+
+
ForecastHorizon
+
AvailableCapacity
CapacityAcquisition Delay
Average Life ofCapacity
IndicatedCapacity
+
-
+
<Die PerWafer>
-
+
CapacityAcquisition
CapacityObsolescence
CapacityReplacing
CapacityAdjustment
AnticipatedTotal Yield
<Unit to DieYield>
<Die Per WaferYield>
Forecast WaferDemand
Brown - don't know much aboutBlack - Sure Equations
Blue - Guess
Pink- Parameters
<Desired ProductionStart Rate>
<AvailableCapacity>
Surprising power of applying Process Handbook specialization concepts to systems dynamics models
Dr. Jim Hines
Process Knowledge Repository
Prof. Thomas Malone
• Software: repository engine, web server, editing tools• Business Content:
• Over 5000 processes & activities• Generic business models• Taxonomy of generic activity types• Case examples• Structured model taxonomy (substitutions)
Extending the semantic network of entities and relations with the Process Handbook to capturethe semantics of SD and support SN modeling
! TUI platform to track multiple SupplyChain objects and their states on a tablewith video projection.
! Using GUI to map tangible objects tothe things they represent
! WIP: tracking large # of smaller objects to support rearrangement &construction of Supply Chain models
Surprising power of tangibility and the power of using “multi-handed” simultaneous manipulation of controls.Broader value of interacting with “intangible” systems via tangible interfaces

© MIT 2002 [email protected]
Supply Chain Visualization (SCV)
• SCV Project Background• Multiple research groups at MIT working together
• Center for Coordination Science, Media Lab, System Dynamics Group, Center for Transportation & Logistics
• Project objective • To create a tool enabling hands-on design & redesign of supply
chains by multiple people at one time• Integrate new technology to solve emerging business integration
issues. Emerging technologies include: Knowledge management, System dynamics, Business process modeling, and Tangible user interfaces (TUI)
• Funding from a high-tech company with support from• Integrated Supply Chain Management (ISCM) Program• Center for eBusiness

© MIT 2002 [email protected]
SCV – System & Project Elements
• As a system, this integrated group of technologies permit a group of individuals to design/redesign their supply chain
• Without a prerequisite deep knowledge of supply chain management• New conversations possible among upstream and downstream
parties in the supply chain • Tangible User Interface (TUI) – MIT Media Lab
• Physical objects instead of a CRT and mouse • Allows users to interact and change variables, design elements• Give physical form to digital information
• System Dynamics Model – System Dynamics Group (Sloan)• Characterizes and models long-term relationships, processes and
policies of the supply chain • Process Handbook – Center for Coordination Science (CCS)
• Serves serves as a knowledge repository, a library of processes for the user to select from when designing and redesigning
• Over 5000 processes and the associated types of dependencies

© MIT 2002 [email protected]
SCV – TUI is a “Sensetable”
• Give physical forms to digital information, connecting bits and atoms
• Wireless tracking multiple objects and their states on a table with video projection• Object identity, position, orientation,
movement, states of objects• 8-12 objects on table at a time, 2-3
objects moving simultaneously
• Binding of digital contents & physical objects• Visual feedback onto the table surface
Adopted from Prof. H. Ishii, ML - TMG


© MIT 2002 [email protected]
System Dynamics• System Dynamics
• Field of study started at MIT (Sloan School) in early 1960’s• Ongoing research, teaching, application and idea generation
• System Dynamics’ Big Ideas:• Dynamic complexity is caused by feedback• People are not well equiped biologically or educationally to
understand feedback• Existing SD Process and tools help people understand implications of
feedback structure " organizations that perform better
• Progress has been made over the years (i.e. prior to thisproject). Still …• Four+ years to create a solid practitioner (rather than a lifetime)• Can transfer some benefit to non-expert (rather than none)
• We think we can do even better!Adopted from Dr. Jim Hines, SDG &SCV Team

© MIT 2002 [email protected]
Feedback is Fundamental
Research anddevelopment
Productattractiveness
Productfunctionality
Revenues
Orders
On timedelivery
Adopted from Dr. Jim Hines, SDG &SCV Team

© MIT 2002 [email protected]
Intel Products
CompetitorProducts
+
PotentialApplications+
Market Demandfor Chips
+
Intel Demand
+
Intel Share
+
+-
IntelRevenues
+
Investment inR&D
+
+
OEMManufacturers
+
+
OEMCompetition
+
ComputerPrices
-
Desire for Low-costOnly Chips (i.e. No
Waterfalling)
+
Intel Brand+
ProductionCapacity
+
CapacityFlexibility
+Inventories
Shipments +
+
-
Orders Filled -
+
+
Intel's Ability toRespond to Demand
Change
+
Product InventoryObsolescence -
-
Pressure toReduce Costs
+
Pressure to MaintainProfit Margins
+
-
+
Material InventoryObsolescence
-
Write-offs+
-
PriceDiscounts+
-
+
Pressure to ReduceOEM Costs
OEM Desire toHold Inventories
Time to CancelOrders
+
-
+
+
+
Intel Profits
+
+
MarketSegmentation
-
+
+
UsefulInventories
Intel Costs
-
+
++
+
+
+
Product LifeCycle
--
Feedback is Complicated
Adopted from Dr. Jim Hines, SDG &SCV Team

© MIT 2002 [email protected]
Build model from molecules in Process Handbook
FabricationWIP
FinishedGoods
Inventory
ProductionStart Rate
NetProduction
Rate
Shipments toChannel
DesiredFinishedGoods
Inventory
ExpectedLSMC
DemandDesired
Fabrication WIP
DesiredInventoryCoverage
Finished GoodsInventory
Adjustment
Fabrication WIPAdjustment
DesiredProductionStart Rate
ManufacturingCycle Time
FabricationAdjustment
Time
DesiredAssembly
StartsTime to UpdateChannel Orders
-
-
+
++
+
-
Time to AdjustFG Inventory
++
-
+
+
-
+
-
+
AssemblyWIP Net Assembly
Completion
Time toCompleteAssembly
Desired NetAssembly
Completion
DesiredAssembly WIP
Assembly WIPAdjustment
Time to AdjustAssembly WIP
+
+
+
+
-
-
AssemblyStart RateLine Yield
Die PerWafer
Unit toDie Yield
ProductionRejects
<LSMCDemand>
+
+
-+
AssemblyRejects
GrossAssembly
Completion
++
+-
Desired NetProduction
Rate+
<LineYield>
<BacklogAdjustment>
+Desired Gross
AssemblyCompletion
+
+ +
-
Desired GrossProduction
Rate
+
GrossProduction Rate
MaximumShipment
Rate
Minimum OrderProcessing
Time
Table for OrderFulfillment
OrderFulfillment
Ratio
Safety StockCoverage
+
LSMC'sMarketShare
PerceivedFraction of
Orders Filled
Time toPerceiveFraction
Table forAttractiveness
ReferenceFraction of
Orders Filled
CompetitorsAttractiveness
TotalAttractiveness
LSMC'sAttractiveness
+
+
+
+
-
-
InitialFraction of
OrdersFilled
DesiredShipment
RateTarget
DeliveryDelay
PerceivedPresentDemandChange in
PerceivedPresentDemand -
HistoricalDemandChange in
HistoricalDemand -
Time toPerceivePresentDemand
Time Horizonfor Historical
Demand
-
-
+ Indicated Trend
-
+-
+ForecastDemand
+
+
ForecastHorizon
+
AvailableCapacity
CapacityAcquisition
Delay
Average Lifeof Capacity
IndicatedCapacity
+
-
+
<Die PerWafer>
-
+
CapacityAcquisition
CapacityObsolescence
CapacityReplacing
CapacityAdjustment
AnticipatedTotal Yield
<Unit toDie Yield>
ForecastWafer
Demand
<AvailableCapacity>
Demand>
Time to
<Channel
+ LSMCOrder
BacklogLSMCDemand
OrderFulfillment
Rate
Acceptable Backlog BacklogAdjustment
AdjustBacklog
+
-
<TargetDeliveryDelay>
+
+
+
CapacityUtilization
Table forCapacity
Utilization
Potential GrossProduction Rate
+
+
-
AssemblyInventory
AssemblyInflow
++
-
PotentialAssembly
Starts
+ +++
NormalAssemblyProcessingTme
-
DesiredAssembly
Inflow
DesiredAssemblyInventory
AssemblyInventory
Adjustment
Time toAdjust
AssemblyInventory
-
+
+
+
+
Initial AssemblyInventory
<Initial FabricationInventory>
<InitialAssembly WIP>
Adopted from Dr. Jim Hines, SDG &SCV Team

© MIT 2002 [email protected]
SCV – Process Handbook• On-line repository for managing business process knowledge
using two conceptual foundations:• Specialization of processes• Coordination of dependencies
• Tools for editing, searching, reusing, and viewing knowledge• 5000+ business activities & processes represented• Systems Dynamics content and simulation capability added.
• Capability to alternate between “activity” view and “system dynamics stocks and flows” view of a process
• Capability of exporting model structure and parameters from PH to commercial simulators (e.g. Vensim)
• Organize/Use System Dynamics ‘Molecules’ as palette of building blocks• Organize classic Reference Models (e.g. generic supply chains)• ‘Evolve’ Reference Models and/or ‘Build’ models from scratch
Developed by J. Quimby, CCS &SCV Team
© MIT 2002 [email protected]
Value of Integration• A previously constructed library of model elements makes it
easier to:• Construct simulation models, in general• Construct models using a tangible interface
• A systems dynamics simulation engine makes it easier to:• Compute real, non-intuitive, quantitative analyses of supply chain
processes • A tangible user interface makes it easier to:
• Understand, manipulate, and communicate about abstract models ofsupply chain processes
• Each discipline has benefited from the context of business issues• As well as the theory and application of each other discipline
• Integration has created new ways to represent & manipulate business models
• With potentially significant benefits and computationally intensive innovation

© MIT 2002 [email protected]
SC Visualization Project Summary• To-date
• Delivered proof-of-concept implementation:• A Tangible User Interface (TUI) for manipulating & simulating
supply chain models with linkages to other major components:• Process Handbook (PH)• Systems Dynamics Model (SD)
• Ongoing Research• Scaling and robustness improvements• New Capabilities to create and change the model structures• Apply to empirical supply chain research• Usability testing• System & Component Development (TUI, SDM, PH)
• Progress versus the Potential Promise of the Work• Interactive multi-user (i.e. team) tool for process design, redesign,
education and integrated business problem analysis

© MIT 2002 [email protected]
SCV Research Implications & Aha’s…• Commercial System Dynamics Tools available are “Good”
• Made ‘Better’ with now published System Dynamics ‘Molecules’ by lowering the costs of Learning System Dynamics
• System Dynamics ‘Molecules’ reduce model construction costs
• SCV Demonstrations in the research labs:• “Evolving reference models” vs “build from scratch” dramatically lowers
costs• “Evolving reference models” makes costs and benefits incremental - model
grows in power while users grow in understanding• Integrated Knowledge Repositories dramatically increases potential for
adaptive reuse of earlier captured knowledge.
• Multi-User Interfaces to Computing can redefine how users interact with systems• Interactive multi-user (i.e. team) tool for process design, redesign, education
and integrated business problem analysis• Surprising power of tangibility for users to directly grab and manipulate
information

© MIT 2002 [email protected]
SCV Research Implications & Aha’s…(continued)
• New customer value from future modeling tools• Simulation of SC for training management groups
• Considers policy as well as physical structure of SC in design• Likely to permit controlling multiple points in real time
• Provides a “What IF” disaster simulation workbench• Post Sept 11th awareness of the need to understand and manage sudden
dramatic changes in the SC
• Integrated Knowledge Repositories can support building and learning from many variations of ‘reference models’
• System Framework for Organizational Learning: Connects business knowledge repositories with hands-on modeling workshop
• Powerful New Relationship between the Business Manager and the Process Modeler

© MIT 2002 [email protected]
SCV Questions?
• Please contact Jim Rice, Tom Malone, Jim Hines or Hiroshi Ishii if you have any questions or comments.• Prof. Thomas Malone – [email protected]• Prof. Hiroshi Ishii – [email protected]• Dr. Jim Hines [email protected]• Jim Rice - [email protected] and 617.258.8584
• We welcome your input as well.• Thanks!
© MIT 2002 [email protected]
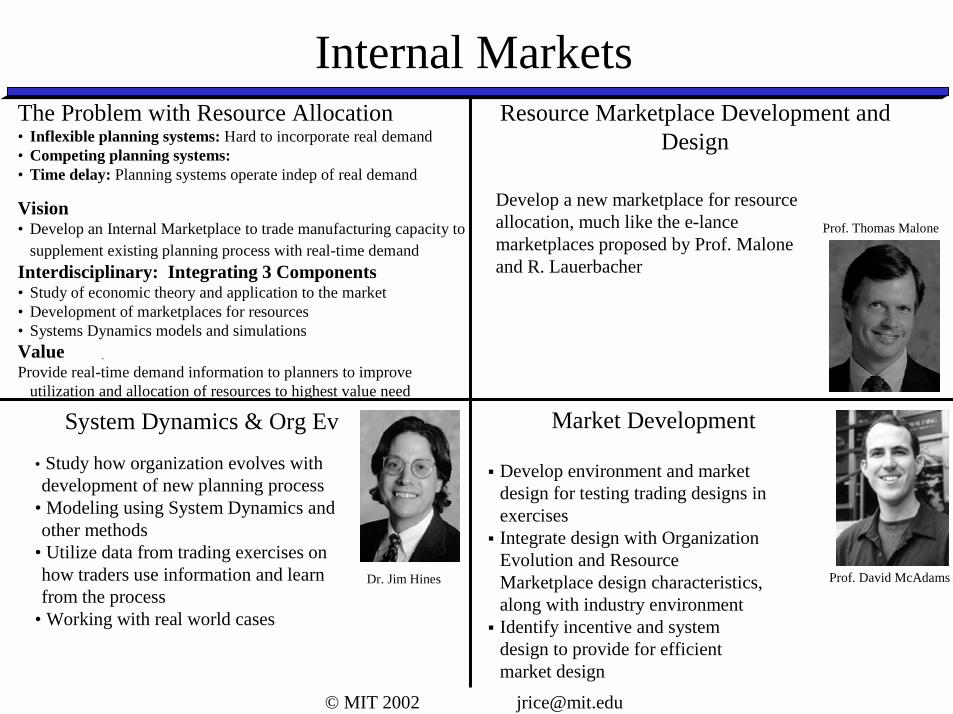
System Dynamics & Org Ev
The Problem with Resource Allocation• Inflexible planning systems: Hard to incorporate real demand• Competing planning systems:• Time delay: Planning systems operate indep of real demand
Vision• Develop an Internal Marketplace to trade manufacturing capacity to
supplement existing planning process with real-time demandInterdisciplinary: Integrating 3 Components• Study of economic theory and application to the market• Development of marketplaces for resources• Systems Dynamics models and simulationsValueProvide real-time demand information to planners to improve
utilization and allocation of resources to highest value need
Internal Markets
Market Development
Prof. David McAdams
• Study how organization evolves with development of new planning process
• Modeling using System Dynamics and other methods
• Utilize data from trading exercises on how traders use information and learn from the process
• Working with real world cases
Dr. Jim Hines
Resource Marketplace Development and Design
Prof. Thomas Malone
Develop a new marketplace for resource allocation, much like the e-lance marketplaces proposed by Prof. Malone and R. Lauerbacher
! Develop environment and market design for testing trading designs in exercises
! Integrate design with Organization Evolution and Resource Marketplace design characteristics, along with industry environment
! Identify incentive and system design to provide for efficient market design

© MIT 2002 [email protected]
Internal Markets:A ScenarioInternal Markets could help to simultaneously:
(a) allocate manufacturing capacity, and (b) determine the prices, delivery dates, and product mix
of the products being sold to customers.
The key idea here is that a set of much more decentralized, market-like processes could be used to make these same decisions.
What differentiates an Internal Market is access to more information, increased interaction, and incentives that enable individual and overall market performance
Continuing reductions in the costs of information technology now make it feasible to implement such market-like processes in many situations where it would have previously been prohibitively complex or costly to do so.
Our hypothesis is that such market-based processes, if implemented well, could result in much more profitable and timely decisions at much lower cost.

© MIT 2002 [email protected]
Internal Markets Questions?
• Please contact Tom Malone or Jim Rice if you have any questions or comments.• John Quimby - [email protected] and
617.258.7376• Jim Rice - [email protected] and 617.258.8584
• We welcome your input as well.• Thanks!