research commons at the university of waikato copyright ... · the empirical data collected from...
TRANSCRIPT
http://researchcommons.waikato.ac.nz/
Research Commons at the University of Waikato Copyright Statement:
The digital copy of this thesis is protected by the Copyright Act 1994 (New Zealand).
The thesis may be consulted by you, provided you comply with the provisions of the
Act and the following conditions of use:
Any use you make of these documents or images must be for research or private
study purposes only, and you may not make them available to any other person.
Authors control the copyright of their thesis. You will recognise the author’s right
to be identified as the author of the thesis, and due acknowledgement will be
made to the author where appropriate.
You will obtain the author’s permission before publishing any material from the thesis.

i
Pyrolysis of Sawdust
A thesis submitted in fulfilment
of the requirements for the degree
of
Masters of Engineering
in Materials and Processing Engineering
at
The University of Waikato
by
Kavwa Sichone
_________
The University of Waikato
2013

ii
Abstract
Lakeland Steel Limited developed a pilot plant for biomass pyrolysis based on
sawdust. The pilot plant was based on an auger screw design which was indirectly
heated using a double pipe heat exchange configuration to prevent oxidation
(combustion) of the feedstock. This thesis covers the preliminary assessment of
sawdust pyrolysis for R.H Tregoweth sawmills on behalf of Lakeland Steel
Limited.
Proximate and ultimate analyses were deployed on the sawdust to determine its
composition. Proximate analysis results gave a moisture content of 60%. The dry
solids had an organic matter content of 99.22% with ash making the balance.
Ultimate analysis was used to determine content levels of elemental carbon,
hydrogen, nitrogen sulphur and oxygen. The results on a dry basis were 47.2%,
6.5%, 0.3%, 0.3%, and 44.9 % respectively.
Drying models were also used to analyse the sawdust drying characteristics.
Drying curves were obtained experimentally and four models: Newton; Page;
Henderson and Pabis; and Simpson and Tschernitz, were fitted to the data and
their accuracy of fit was determined using residual squared sum of errors. Page’s
model was used to describe the sawdust behaviour in the dryer design as it had the
highest accuracy.
The sawdust reaction kinetics were determined using data from thermogravimetric
analysis (TGA) and analysed using distributed action energy model. The kinetics
were observed at three heating rates of 10, 20 and 30 °C/min with a maximum
temperature of 900°C under an argon atmosphere. Sawdust was modelled as a
mixture of water, hemicellulose, cellulose and lignin. Good agreement between
Gaussian distribution functions for each component and experimental data were
observed.
Pilot plant trials were performed using a three factor-three level design of
experiment. The factors under investigation were; feedstock moisture content with
levels at 15, 30 and 60; reaction temperature with levels at 400, 450 and 500°C;

iii
and reactor auger speed with levels at 15, 20 and 25 rpm. Experiments at 60%
moisture could not be performed to completion as the auger blocked repeatedly.
The other two moisture contents showed that moisture content enhanced heat
exchange properties of the feedstock and this generally increased the amount of
volatile organic matter released. It was observed that for 15% moisture sawdust
increase of temperature did not consistently exhibit an increase in degree of
devolatilisation of organic matter. However, the 30% moisture sawdust showed an
increase in devolatilisation with increase in temperature. The effects of increasing
reactor auger speed had the most consistent trend with which an increase in speed
showed a decrease in degree of devolatilisation thus increasing char yield.
The empirical data collected from lab scale and pilot plant experiments were used
to create mass and energy balances. These were the basis of the large scale mobile
pyrolysis plant which was designed to process 3.45 tonnes per hour. Due to size
restrictions the large scale dryer was not fitted in the container. It was then
determined that the feedstock would either be dried using an onsite kiln or the
reactor would process green sawdust.
A preliminary economic feasibility assessment was performed for the base case
scenario which processed pre-dried sawdust of 15% moisture content at 400°C
and a retention time of 45 minutes. A sensitivity analysis based on predicted
optimistic and pessimistic conditions showed that automation of the plant had the
potential to increase the economic viability of the large scale process.

iv
Acknowledgements
Firstly, I would like to thank God, without Him, none of this would be possible.
I would like to thank my supervisor Dr. Mark Lay for his guidance and
encouragement, Cory Leatherland from Lakeland Steel Limited for providing the
project, MSI for agreeing to fund the project, John MacDonald-Wharry for
helping with the Raman, Lisa Li for the GC, Yuanji Zhang for the TGA, furnace
and ovens, Indar Singh for finding bits of equipment for me, Janis Swan and Mary
Dalbeth for their peptalks, Stewart Findley for his encyclopaedic knowledge on
health and safety, Cheryl Ward for helping with the literature and patent searching,
and all the other students and staff who helped out in various ways.
I would like to thank my Dad, Mom, brother and sisters for their support over the
years, and friends for entertaining me.

v
Table of Contents
Abstract ................................................................................................................... i
Acknowledgements ............................................................................................... iv
List of Figures ....................................................................................................... ix
List of Tables ...................................................................................................... xiii
Chapter 1. Introduction ..................................................................................... 1
1.1 Background .............................................................................................. 2
1.2 Project Brief ............................................................................................. 2
1.3 Research Objectives ................................................................................. 3
Chapter 2. Literature Review............................................................................ 4
2.1 Introduction .............................................................................................. 5
2.1.1 Products ............................................................................................. 6
2.1.2 Modes of Pyrolysis .......................................................................... 20
2.1.3 Related Technologies ...................................................................... 21
2.1.4 Effects of Processing Parameters on Pyrolysis ............................... 23
2.1.5 Feedstock Considerations ............................................................... 24
2.1.6 Reaction Catalysts ........................................................................... 27
2.2 Modelling of Pyrolysis Reactions .......................................................... 28
2.2.1 Reaction Kinetics ............................................................................ 30
2.2.2 Lab-Scale Thermal Analysis Techniques ....................................... 35
2.2.3 Conclusions ..................................................................................... 38

vi
2.3 Pyrolysis Process Design ........................................................................ 39
2.3.1 Dryer Technologies ......................................................................... 39
2.3.2 Pyrolysis Reactor Technologies ...................................................... 48
2.3.3 Heat Exchanging Technology ......................................................... 60
2.3.4 Syngas Recovery System ................................................................ 68
2.3.5 Hazard Management ....................................................................... 76
2.4 Process Economics ................................................................................. 77
2.4.1 Current Market Scan ....................................................................... 79
2.4.2 Pyrolysis Technology Patent Citation Report ................................. 82
2.5 Summary ................................................................................................ 85
Chapter 3. Methodology .................................................................................. 87
3.1 Introduction ............................................................................................ 88
3.2 Reagents ................................................................................................. 88
3.3 Equipment .............................................................................................. 88
3.4 Feedstock Characterisation Experiments ............................................... 89
3.4.1 Proximate Analysis ......................................................................... 89
3.4.2 Ultimate Elemental Analysis .......................................................... 90
3.4.3 Sawdust Drying Curves .................................................................. 90
3.4.4 Thermogravimetric Analysis ........................................................... 90
3.5 Pilot Plant Trials ..................................................................................... 91
3.5.1 Design of Experiments .................................................................... 91
3.5.2 Variables for Pilot Plant Trials ........................................................ 91
vii
3.5.3 Experimental Setup and Procedure ................................................. 93
3.6 Product Characterisation ........................................................................ 93
3.6.1 Syngas Gas Chromatography Analysis ........................................... 93
3.6.2 Raman Spectroscopy ....................................................................... 93
Chapter 4. Results and Discussion .................................................................. 95
4.1 Introduction ............................................................................................ 96
4.2 Feedstock Characterisation ..................................................................... 96
4.2.1 Introduction ..................................................................................... 96
4.2.2 Composition Analysis ..................................................................... 96
4.2.3 Drying Characteristics ..................................................................... 97
4.2.4 Reaction Kinetics Model Development ........................................ 107
4.2.5 Modelling Overview ..................................................................... 120
4.3 Pilot Plant Trials ................................................................................... 121
4.3.1 Experimental Data ......................................................................... 121
4.3.2 Pilot Plant Pyrolysis Process Description ..................................... 121
4.3.3 Feedstock Performance ................................................................. 122
4.3.4 Effects of Processing Parameters on Product Yields .................... 126
4.4 Product Characterisation ...................................................................... 129
4.4.1 Char Characterisation .................................................................... 129
4.4.2 Syngas Characterisation ................................................................ 138
4.4.3 Bio-Oil Characterisation ............................................................... 138
Chapter 5. Large Scale Plant Design Concept ............................................. 140

viii
5.1 Introduction .......................................................................................... 141
5.1.1 Process Description ....................................................................... 141
5.1.2 General Assumptions for Large Scale Plant Design ..................... 144
5.2 Large Scale Plant Design ..................................................................... 144
5.2.1 Feed Preparation............................................................................ 144
5.2.2 Reaction stage ............................................................................... 149
5.2.3 Reactor Design .............................................................................. 154
5.2.4 Separation Phase ........................................................................... 155
5.2.5 Product Handling .......................................................................... 158
Chapter 6. Process Economics Modelling .................................................... 160
6.1 Introduction .......................................................................................... 161
6.1.1 Assumptions for Base Case Economic model .............................. 161
6.1.2 Base Case Economic model .......................................................... 161
Chapter 7. Conclusion and Recommendations ............................................ 167
7.1 General Findings .................................................................................. 168
7.2 Recommendations for Future Work ..................................................... 169
References .......................................................................................................... 171

ix
List of Figures
Figure 1. Biomass pyrolysis schematic diagram. .................................................... 5
Figure 2. Char produced from Pinus Radiatta sawdust using Lakeland Steel Ltd.'s
pilot plant. ........................................................................................................... 6
Figure 3. Bio-oil made from pyrolysis of wood. ................................................... 11
Figure 4. Syngas flare from Lakeland Steel's pilot plant processing green
sawdust. ............................................................................................................ 18
Figure5. A two-step global reaction map for biomass pyrolysis. ......................... 29
Figure 6. Schematic diagram showing the stages involved in relation to
temperatures (Basu 2010). ................................................................................ 29
Figure 7. Constant heating rate model. T2 is the indirect heating temperature and
T1 is the temperature inside the kiln. ............................................................... 37
Figure 8. Dynamic heating rate model. T2 is the indirect heating temperature and
T1 is the temperature inside the kiln. ............................................................... 38
Figure 9. Large Scale plant concept for organic waste sludge pyrolysis (Sichone
2012). ................................................................................................................ 39
Figure 10. Screw conveyor dryer (Made-in-China.com 2011). ............................ 42
Figure 11. Drum dryer (Fabrication 2011). ........................................................... 43
Figure 12. Tunnel/ continuous tray dryer (AG 2011). .......................................... 43
Figure 13. Continuous through-circulation (non-agitated) dryer (co.Ltd 2011). .. 44
Figure 14. Continuous through circulation (agitation/ rotary) dryer
(Pharmainfo.net 2007). ..................................................................................... 44
Figure 15. Direct rotary dryer (Made-in-China.com 2008). ................................. 45
Figure 16. Multiple-Effect Evaporator (Exports 2011)......................................... 46
Figure 17. Lakeland Steel Limited's pilot plant. ................................................... 59
Figure 18. Double pipe heat exchanger in counter-current flow. ......................... 61
Figure 19. Typical shell and tube heat exchanger (ACUSIM).............................. 62
Figure 20. Air cooled (fin-fan). ............................................................................. 63
Figure 21. Plate and frame heat exchanger. .......................................................... 64
Figure 22. Spiral tube heat exchanger cross section4. ........................................... 65
Figure 23. Plate-fin heat exchanger. ..................................................................... 65

x
Figure 24. Heat cross exchange schematic. .......................................................... 68
Figure 25. Separation efficiency with respect to particle grain size for a variety of
equipment (Anis and Zainal 2011). .................................................................. 71
Figure 26. Directional schematic of cash-flow streams that can be associated with
economics of pyrolysis (Sichone 2012). .......................................................... 78
Figure 27. Biomass pyrolysis patent yearly application count (a) to the left
English patents only (b) to the right all patent search results no language
limiters. ............................................................................................................. 83
Figure 28. Biomass gasification patent yearly application count (a) to the left
English patents only (b) to the right all patent search results no language
limiters. ............................................................................................................. 84
Figure 29. Biomass torrefaction patent yearly application count (a) to the left
English patents only (b) to the right all patent search results no language
limiters. ............................................................................................................ 84
Figure 30. Biomass conversion patent yearly application count (a) to the left
English patents only (b) to the right all patent search results no language
limiters. ............................................................................................................ 84
Figure 31. Drying rate vs time. .......................................................................... 100
Figure 32. Mass vs. time for sawdust drying at 80, 90 and 100°C. .................... 101
Figure 33. Mass fraction vs. time for sawdust drying at 80, 90 and 100°C. ....... 102
Figure 34. Mass loss flux vs. time for sawdust drying at 80, 90 and 100°C. ...... 103
Figure 35. Newton model. ................................................................................... 104
Figure 36. Page model......................................................................................... 105
Figure 37. Henderson and Pabis model. ............................................................. 105
Figure 38. Simpson and Tschernitz model. ......................................................... 106
Figure 39. Normalised mass loss curves mass % vs temperature. ...................... 109
Figure 40. Mass loss rate vs temperature curves................................................. 111
Figure 41. Derivative thermogravimetric (DTG) analysis curve for sawdust at
10°K/min. ....................................................................................................... 112
Figure 42. First attempt at pseudo component mapping for sawdust at 10°K/min.
........................................................................................................................ 113
Figure 43. Gaussian distribution fitting for sawdust mass loss rate curve for
sample heated at 10°K/ min............................................................................ 113

xi
Figure 44. Gaussian distribution fitting for sawdust mass loss rate curve for
sample heated at 20°K/ min............................................................................ 114
Figure 45. Gaussian distribution fitting for sawdust mass loss rate curve for
sample heated at 30°K/ min............................................................................ 115
Figure 46. Reaction rate vs. temperature. ........................................................... 116
Figure 47. Rate constant k vs. Temperature (°K). .............................................. 117
Figure 48. Activation energy vs temperature for sawdust at 10°K/min. ............. 118
Figure 49. Loose sawdust being fed through bulk density 280 kg/m3. ............... 122
Figure 50. Dry compacted sawdust prior to decomposition, bulk density 1,202
kg/m3. ............................................................................................................. 123
Figure 51. Product yields with respect to change in temperature. ...................... 127
Figure 52. Product yields with respect to change in moisture. ........................... 128
Figure 53. Product yield with respect to change in auger speed. ........................ 129
Figure 54. Plot of G band position as a function of heat treatment temperature for
chars.Broad horizontal guide lines represent approximate G band positions
measured for glassy carbon and graphite samples. Linear trend line and
correlation based on mean data points (from chars derived from all three
precursors) between HTT ≈ 420 °C and HTT ≈ 700 °C (John McDonald-
Wharry 2012). ................................................................................................ 136
Figure 55. G band position for different pine char samples (sample number along
the x axis refers to the sample ordered vertically on the right end). .............. 137
Figure 56. Schematic for large scale pyrolysis process. ..................................... 142
Figure 57. Arrangement of equipment in shipping container showing no space for
dryer. ............................................................................................................... 143
Figure 58. Generic Anatomy of Chemical Processes.......................................... 144
Figure 59. Mass and energy balance for sawdust drying. ................................... 148
Figure 60. Schematic of heat transfer to feedstock. ............................................ 151
Figure 61. Indirect-fired small Rotary kiln reactor (Courtesy of Harper
International, Lancaster, NY.). ....................................................................... 153
Figure 62. Reactor mass and energy balance. ..................................................... 154
Figure 63. Large scale pyrolysis reactor. ............................................................ 155
Figure 64. Gas cyclone design commonly used in industry. .............................. 155
Figure 65. Mass and energy balance for flash tank. ............................................ 156

xii
Figure 66. Mass and energy balance for condensing drum. ................................ 157
Figure 67. Main plant equipment cost distribution for mobile large scale
design. ............................................................................................................ 162

xiii
List of Tables
Table 1. Test category A: basic biochar utility properties - required for all
biochars (IBI 2011). ........................................................................................... 7
Table 2. Test category B: biochar toxicant report required for all feedstocks (IBI
2011). .................................................................................................................. 8
Table 3. Test category C: biochar advanced analysis and soil enhancement
properties - optional for all biochars ((IBI) 2011). ............................................. 9
Table 4. Distribution of functional groups in bio-oil from switch grass(Imam and
Capareda 2012). ................................................................................................ 12
Table 5. Various compounds identified in bio-oil characterisation. ..................... 14
Table 6. Physico-chemical properties of different pyrolysis oils (Sipilä, Kuoppala
et al. 1998). ....................................................................................................... 16
Table 7. Reported Syngas Composition (Apt, Newcomer et al. 2008). ................ 19
Table 8. Comparison of Pyrolysis modes (Zhang 2010 )...................................... 22
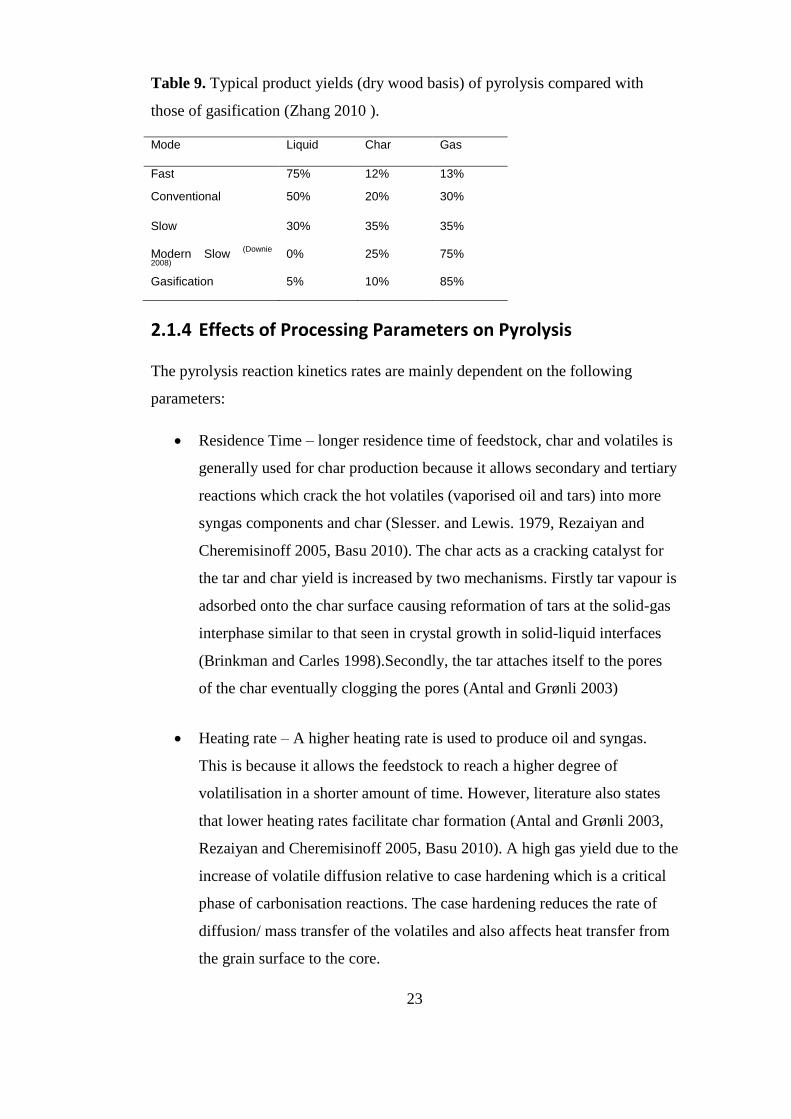
Table 9. Typical product yields (dry wood basis) of pyrolysis compared with
those of gasification (Zhang 2010 ). ................................................................. 23
Table 10. Expressions for the most common reaction mechanisms in solid state
reactions. ........................................................................................................... 31
Table 11. Kinetic Caapabilities of Hi-ResTM
TGA methods (Sauerbrunn and Gill).
.......................................................................................................................... 38
Table 12. Warm-Air Direct- Heat Co-current Rotary Dryers: Typical Performance
Data*(Moyers. and Baldwin 1999). ................................................................. 47
Table 13. Pyrolysis reactors and heating methodsa (Bridgwater 1999). ............... 51
Table 14. Research on pyrolysis reactors (Crocker 2010). ................................... 52
Table 15 Commercial carbonizers (Dutta 2007). .................................................. 55
Table 16. Reactor types and heat transfer (Bridgwater 1999). ............................. 58
Table 17. Common materials used in heat exchangers (Intelligence 2012). ........ 67
Table 18. Tar classification system defined by the Energy Research Centre of the
Netherlands (ECN). .......................................................................................... 69
Table 19. Comparison of particle limit specifications (Anis and Zainal 2011). ... 70
Table 20. Physical/mechanical scrubbers. ............................................................ 71

xiv
Table 21. Catalytic cracking equipment (Anis and Zainal 2011). ........................ 75
Table 22. Current commercial pyrolysis ventures. ............................................... 80
Table 23. Patent search hits for a combination of keywords. ............................... 82
Table 24. Three factor-three level range assignment. ........................................... 92
Table 25. Three factor-three level combination setup. ......................................... 92
Table 26. Proximate analysis composition for pine sawdust. .............................. 97
Table 27. Comparative ultimate analysis of pinus radiatta sawdust and other
organic feedstock. ............................................................................................. 97
Table 28. Drying models. .................................................................................... 104
Table 29. Quality of fit assessment for drying curves. ....................................... 104
Table 30. Mass loss rate prediction using Gaussian prediction. ......................... 120
Table 31. Global kinetic parameters. .................................................................. 120
Table 32. Processing parameter level assignment............................................... 121
Table 33. Raw data collected from pilot plant. ................................................... 125
Table 34. Pilot plant trial product distribution. .................................................. 126
Table 35. Proximate analysis of biochars. .......................................................... 130
Table 36. Ultimate elemental analysis for biochar.............................................. 131
Table 37. Summarised spectra analysis results. .................................................. 136
Table 38. Syngas characterisation for pilot plant trial samples. ......................... 139
Table 39. Bio oil ultimate analysis. ..................................................................... 139
Table 40. : Prospective dryer ratings................................................................... 147
Table 41. Rotary dryer specifications. ................................................................ 149
Table 42. Reactor design morphology overview. ............................................... 150
Table 43. Reactor options ranking. ..................................................................... 153
Table 44. Reactor specifications. ........................................................................ 154
Table 45. Flash tank specification sheet. ............................................................ 156
Table 46. Condensing drum specifications sheet. ............................................... 157
Table 47. Total capital investment breakdown. .................................................. 162
Table 48. Operating cost breakdown for mobile pyrolysis plant base case. ....... 163
Table 49. Sensitivity analysis for capital costs. .................................................. 165
Table 50. Sensitivity analysis for operating costs. .............................................. 166

1
Chapter 1.
Introduction

2
1.1 Background
An awareness of the effects of emissions on global warming has increased the
focus on waste minimisation. Industries are also now looking to ways in which
they can lower their dependence on fossil fuel derived energy. Biofuels have been
recognised as an alternative to fossil derived energy. These fuels have been
perceived to be more environmentally friendly and are of interest as they have the
potential to be used as a tool against climate change. From a financial point of
view, this shift in paradigm (eco-friendly/ going green) can only be justified if the
biofuels offers benefits of equal or extra value to their fossil-derived counterparts
in terms of cost and performance.
As the world aims for a more environmentally approach to attaining its energy
demands, a number of processes and technologies have been considered. Concepts
such as waste minimisation, waste to energy, waste recycling are the basis of the
efforts being made to drive the biofuel initiative. Pyrolysis has been identified as
a potential means of meeting these demands.
With this in mind, Lakeland Steel Limited (Rotorua, New Zealand) has a
prototype slow-pyrolysis unit that was developed for sawdust. However this pilot
plant has also shown promising trials on other feedstock such as sewage sludge,
dissolved air flotation sludge from chicken processing facilities, and paunch grass.
The company is currently interested in optimising the plants performance.
Optimisation of this technology will enable them to reduce their net energy
consumption which will reduce their carbon footprint and improve returns.
1.2 Project Brief
Lakeland Steel limited has been approached by R.H Tregoweth sawmill which
currently processes 252,000 tonnes of timber per year. About 45% of the wood
ends up as sawmill waste such as bark, sawdust, woodchip and chip fines.
Lakeland Steel had been given the task of designing a pyrolysis unit that can
process 3.45 tonnes per hour of sawdust which accounts for 11.5% of the wood
handled by a client. The sawdust has been identified as a low price commodity
which only has a value of $4 per tonne. The main aim of the project is to increase

3
the revenue from the sawdust stream from $4 per tonne using pyrolysis
technology. Lakeland Steel Ltd. already has a pyrolysis pilot plant patented within
New Zealand. This will be used to assess the performance of the Pinus Radiatta
sawdust as a feedstock for the process.
1.3 Research Objectives
Based on the areas identified in the project brief, the objectives of this thesis
include:
1. Perform pilot plant trials to obtain processing data that will be used to
build empirical process models for Lakeland Steel’s patented pilot
pyrolysis plant.
2. Design a mobile large scale plant for sawdust pyrolysis using the empirical
data from the pilot plant trials.
3. Performing an economic feasibility assessment of the large scale plant.

4
Chapter 2.
Literature Review

5
2.1 Introduction
Pyrolysis can be described as the thermal decomposition of organic materials in
the absence of oxygen at temperatures ranging from 400 to 900°C (Lédé 1994,
Rezaiyan and Cheremisinoff 2005, Basu 2010). The thermal modification
involves two transforming and concurrent reactions: pyrolysis and carbonisation.
In pyrolysis, gases are liberated. In carbonisation, carbon atoms are changed into
the solid graphite structures that give char its long-term durability (Taylor 2010).
The products of the thermal decomposition are gaseous syngas, solid char and
liquid bio-oils.
Figure 1. Biomass pyrolysis schematic diagram.
The main process parameters used to control the pyrolytic process are the
temperature, pressure, reaction time, and internal heat transfer rates. By
manipulating these parameters different modes of pyrolysis can be setup (Slesser.
and Lewis. 1979, Rezaiyan and Cheremisinoff 2005, Basu 2010, Crocker 2010,
Taylor 2010, Zhang 2010 ). The most common modes are fast which is typically
used for liquid products, slow and conventional which are used predominantly for
carbonisation/ char production. These modes are further explained in section 2.1.2

6
2.1.1 Products
This section provides literature on the products of biomass pyrolysis. It gives a
description of the product, its potential applications, its marketability and
concerns associated with it.
Char 2.1.1.1
Figure 2. Char produced from Pinus Radiatta sawdust using Lakeland Steel Ltd.'s
pilot plant.
Char is the solid product from the pyrolysis process. Biochar is a carbon-rich
material that is virtually non-biodegradable and thus stable in soils (Taylor 2010).
It is a type of charcoal, however, biochar is the term used for charcoal produced
solely for land application to increase agricultural performance (Taylor 2010).
Char comes in different forms such as granules, powder, flakes, and briquettes
depending on the method of production and the end use. The desired properties of
the char will also vary depending on the end use. This thesis focuses on the use of
char for bioremediation. Therefore, going by the International Biochar Initiative
(IBI’s), proposed classification systems for biochar are shown in Table 1 to Table
3. The tests are used to categorize biochar for; basic biochar utility properties;
toxicant concentrations; and advanced utility properties associated with soil
performance enhancement. These requirements have raised mixed reactions as
some in the field as accepting researchers suggest the standards will provide a
reliable basis of pricing biochar. Others view them as being detrimental to the
development of the biochar market because it only allows big firms to produce
biochar due to smaller businesses not being able to afford the cost of testing chars.

7
As a result the easiest marketing approach for char remains to be in the form or
charcoal.
Table 1. Test category A: basic biochar utility properties - required for all
biochars (IBI 2011).
Requirement Criteria1 Unit Test Method
Moisture Declaration % of total mass, dry basis
ASTM D1762-84 (specify measurement date with respect to time from production)
Organic Carbon Class 1: ≥60% Class 2: ≥30% and<60% Class 3: ≥10%and <30%
% of total mass, dry basis
C, H, N analysis by dry combustion (Dumasmethod), before (total C) and after (organic C) HCl addition
H:Corg 0.7
(Maximum)
Molar Ratio
Total Ash Declaration % of total mass, dry basis
ASTM D1762-84
Total Nitrogen Declaration % of total mass, dry basis
Dry combustion (Dumas method) and gas chromatography, following same procedure as for C, H, N analysis above, without HCl addition.
pH Declaration pH pH analysis procedures as outlined in section 04.11 of US Composting Council and US Department of Agriculture (2001), following dilution and sample equilibration methods from Rajkovich et al. (2011)
Electrical
Conductivity
Declaration dS/m EC analysis procedures as outlined in section 04.10 of US Composting Council and US Department of Agriculture (2001), following dilution and sample equilibration methods from Rajkovich et al.
Liming (if pH is
above 7)
Declaration % CaCO3 Rayment & Higginson (1992)
Particle size
distribution
Declaration %<420μm; Progressivedrysievingwith4760μm,2380μm and420μmsieves,asoutlinedinASTM D2862- 10 Method for activated carbon.
% 420-2,380
μm;
% 2,380-4,760
μm;
% >4,760 μm;
1 All values will be reported to one decimal place significant digit (0.1), unless otherwise indicated
within the criteria for any reporting requirement. (e.g., if the analysis is 0.73, it can be reported as 0.7)
The second test is aimed at regulating the allowable amount of toxins.

8
Table 2. Test category B: biochar toxicant report required for all feedstocks (IBI
2011).
Requirement Range of Maximum
Allowed thresholds
Test method
Earthworm Avoidance Test
Pass/Fail ISO 17512-1:2008 methodology and OECD methodology (1984a) as described by Van Zwieten et al. (2010)
Germination Inhibition Assay
Pass/Fail OECD methodology (1984b) 3 test species, as described by Van Zwieten et al. (2010)
Polycyclic Aromatic Hydrocarbons (PAH)
6 – 20 mg /kg TM Method following US Environmental Protection Agency (1996)
Dioxin/Furan
(PCCD/F)
9 ng/kg ITEQ Method following US Environmental Protection Agency (2007)
Polychlorinated
Biphenyls
0.2 – 0.5 mg/kg ITEQ
Method following US Environmental Protection Agency (1996)
Arsenic 12 –100 mg/kg dry wt
US Composting Council and US Department of dry wt Agriculture (2001)
Cadmium 1.4 – 39 mg/kg dry wt
US Composting Council and US Department of dry wt Agriculture (2001)
Chromium 64 – 100 mg/kg dry wt
US Composting Council and US Department of dry wt Agriculture (2001)
Cobalt 100 – 150 mg/kg dry wt
US Composting Council and US Department of dry wt Agriculture (2001)
Copper 63 – 1500 mg/kg dry wt
US Composting Council and US Department of dry wt Agriculture (2001)
Lead 70 – 500 mg/kg dry wt
US Composting Council and US Department of dry wt Agriculture (2001)
Molybednum 5 –-75 mg/kg dry wt
US Composting Council and US Department of dry wt Agriculture (2001)
Mercury 1 – 17 mg/kg dry wt
US Composting Council and US Department of dry wt Agriculture (2001)
Nickel 47 – 600 mg/kg dry wt
US Composting Council and US Department of dry wt Agriculture (2001)
Selenium 1 – 100 mg/kg dry wt
US Composting Council and US Department of dry wt Agriculture (2001)
Zinc 200 – 2800 mg/kg dry wt
US Composting Council and US Department of dry wt Agriculture (2001)
Boron Declaration mg/kg dry wt
US Composting Council and US Department of dry wt Agriculture (2001)
Chlorine Declaration mg/kg dry wt
US Composting Council and US Department of dry wt Agriculture (2001)
Sodium Declaration mg/kg dry wt
US Composting Council and US Department of dry wt Agriculture (2001)
The third test is specifically for the high end biochar which would be expected to
cost more than that of the preceding classes.

9
Table 3. Test category C: biochar advanced analysis and soil enhancement
properties - optional for all biochars ((IBI) 2011).
Requirement Criteria Unit Test Method
Mineral N (ammonium and nitrate)
Declaration mg/kg 2M KCl extraction, followed by spectrophotometry (Rayment and Higginson 1992)
Total Phosphorus & Potassium (P&K)*
Declaration % of total mass, dry basis
Modified dry ashing followed by ICP (Enders and Lehmann 2012)
Available P Declaration mg/kg 2% formic acid followed by spectrophotometry (modified from Rajan et al 1992, Nutrient Cycl in Agroecosystems 32:291-302 and AOAC 2005, as used by Wang et al 2011)
Volatile Matter Declaration % of total mass, dry basis
ASTM D1762-84
Total Surface Area Declaration m2/g ASTM D 6556-10 Standard Test Method for Carbon Black – Total and External Surface Area by Nitrogen Adsorption
External Surface Area
Declaration m2/g
* Total K is sufficiently equivalent to available K for the purpose of this characterization
2.1.1.1.1 Applications
Applications of biochar include:
• Fuel source – this is the oldest known use of char. It was used for
cooking due to its low smoke production attributes.
• Filter medium – char has a large surface area/ volume ratio, this is
because of its mesoporous structure. This structure allows it to be used
as a filter medium for water and air purification.
• Catalyst support – the mesoporous structure also allows char to have a
favourable surface for reactions and nucleation especially when
housing catalysts.
• Bio remediation – biochar has been credited for improving cation
exchange capacity of soils. This means it can be used improving
nutrient transfer mechanisms in soil.
• Reducing agent – char is a very powerful reducing agent due to its
carbon content. Carbon rich char products such as coke are used in the
smelting industry to reduce ores into higher purity metals, as is the
case in iron and aluminium smelting processes.

10
2.1.1.1.2 Marketability
Despite the wide range of potential applications, there still appears to be no
established market for biochar. This is because the benefits have not been proven
over the long term. For example one of the claims being made is that biochar will
enhance the soil’s ability to retain nutrients. This claim has been made in response
to analysis of terra preta soils of the amazon which contain high amounts of
carbon compared to surrounding areas. The high carbon content has been credited
to the agricultural practices of the ancient South Americans that involved burning
organic matter and burying the residue (Taylor 2010, Barrow 2012). Terra preta
typically has three- or more times the total soil organic carbon than soils it lies on
(a 14% organic matter content is common) and it usually contains far more P, Ca
and humus than surrounding soils (Barrow 2012).
2.1.1.1.3 Concerns
Field trials using char have been done in recent years at char application levels of
2.5 kg per 100 m2. Achieving high concentrations of char in the soil on a large
scale seems less favourable compared to conventional fertiliser application
operations. The reason behind this is the low density of the biochar 0.3 – 0.43
kg/m3 (Lehmann and Joseph 2012) which means larger volumes need to be
applied to the soil. It has been proposed that the char is too light to apply on top of
the soil so a layer of heavier medium (topsoil) needs to be used to prevent it from
blowing off in the wind. Another concern is the hydrophobic nature of the char
which hinders it from intimately mixing with top soils leaving it to wash off in
wet conditions.
Different soils will have different requirements. Biochar has been credited for
improving the aeration properties of high density, waterlogged soils whilst
improving the aggregation potential of sandy soil (Taylor 2010, Verheijen, Jeffery
et al. 2010, Lehmann, Rillig et al. 2011, Barrow 2012, Lehmann and Joseph 2012).
However, the interaction of the biochar with various sorts of soil needs to be
determined individually. The differences in physical structure between biochar
and soils lead to altered soil tensile strength, hydrodynamics, and gas transport in

11
a soil biochar mixture; all of which can be expected to have major impacts on soil
biota (Lehmann, Rillig et al. 2011).
Bio-Oil 2.1.1.2
Figure 3. Bio-oil made from pyrolysis of wood.
Bio-oil is the liquid product from pyrolysis. It is generally acidic in nature (pH~
2.5) (PYNE 2006, Oasmaa and Peacocke 2010) and is comprised of a number of
organic compounds such as acetaldehyde, acetone, formic acid, acetic acid,
methanol, formaldehyde and furfuryl alcohol. Bio-oil produced from woody
biomass is normally a dark brown, viscous liquid with a strong characteristic,
smoky smell. Bio-oil produced via pyrolysis has been known to age rapidly due to
its high tendency to be oxidised. For more information regarding the properties of
the bio-oil refer to Appendix “Bio-oil MSDS”. Bio-oil has been identified to
contain a number of organic derivatives and precursors which are formed as by-
products. These by-products serve as niche markets which offer alternative
pathways for marketing bio oil. An extensive characterisation of bio-oil produced
from switch grass is presented by Imam and Capreda,(Imam and Capareda 2012),
where the following organic function groups are identified (Table 4).
Lu and Li et al concluded that bio-oil properties are generally affected by its water
content (Lu, Li et al. 2009) . This statement has been supported by works from
other sources, (Sipilä, Kuoppala et al. 1998, Mohan, Pittman et al. 2006, Imam

12
and Capareda 2012) who attribute bio-oil’s relatively poor performance as a fuel
in comparison to petroleum based oils to its water content.
Table 4. Distribution of functional groups in bio-oil from switch grass(Imam and
Capareda 2012).
Functional Group Total%
Alkanes 36.2
Phenolic compounds 20.5
Aromatics 8.8
Napthalene 1.7
Toluene 1.4
Benzene 2.2
Furans 4.2
Ketones 5.1
Fame/acids 8.7
Alcohols 7.4
Esters 2.4
Amides 1.5

13
Table 5 shows various compounds that have been identified using mass
spectrometry on bio oil from a range of feedstocks.

14
Table 5. Various compounds identified in bio-oil characterisation.
Compound Name Feedstock Reference
Acids and Esters
Methanoic (formic) Straw, pine,
Hardwood
(Sipilä, Kuoppala et al.
1998) Ethanoic (acetic)
Propanoic(propionic)
2-Methylpropanoic (isobutyric
Hydroxyethanoic (glycolic)
Butanoic(butyric)
Hydroxypropanoic (lactic)
Allyl acetic
Pentanoic acid (valeric acid)
Hexanoic (caproic)
Benzoic acid, 4-isopropenylcyclohexenylmethyl ester switchgrass (Imam and Capareda
2012) 9-Hexadecenoic acid, methyl ester, (z)-
Pentadecanoic acid, 14-methyl-, methyl ester
Pentadecanoic acid
Oxalic acid, 2-isopropylphenyl pentyl ester
Oxalic acid, isobutyl 2-isopropylphenyl ester
Oxalic acid, 6-ethyloct-3-yl ethyl ester
Dodecanoic acid, methyl ester
Acetic acid, trichloro-, nonyl ester
Alkanes
Dodecane switchgrass (Imam and Capareda
2012) Undecane, 2,6-dimethyl-
Octane, 3,6-dimethyl-
Tridecane
Dodecane, 2,5-dimethyl-
Hexadecane, 1-bromo-
Tridecane, 4-methyl-
Decane, 3,8-dimethyl-
Dodecane, 2,6,10-trimethyl-
Cyclotetradecane
Cyclododecane
Dodecane, 4,6-dimethyl-
Tridecane, 2-methyl-
Decane, 1-bromo-2-methyl-
Hexane, 2-phenyl-3-propyl-
Hexadecane
Octadecane
Heptadecane
Alcohol
Methanol Straw, pine,
Hardwood
(Sipilä, Kuoppala et al.
1998)
Thymol switchgrass
Benzenepropanol, 2-methoxy-
1-Dodecanol, 3,7,11-trimethyl-
1h-Benzimidazole, 5,6-dimethyl-

15
Table 5. Various compounds identified in bio-oil characterisation
3,7,11,15-Tetramethyl-2-hexadecen-1-ol
Benzeneethanol, -methyl-
3-buten-2-ol, 4-phenyl-
Isodecyl methacrylate
Methyl n-isopropyl-3-phenylpropanimidate
Cyclohexanone, 4-(benzoyloxy)-
2-Tridecanone
2-Pentadecanone, 6,10,14-trimethyl-
Cyclopentanone, 2-ethyl-
Phenols
Phenol, 2-ethyl- switchgrass (Imam and Capareda
2012) Phenol, 4-ethyl-
Phenol, 3,5-dimethyl-
2-methoxy-5-methylphenol
Phenol, 2-1-methylethyl-acetate
Phenol, 2,4,5-trimethyl-
Phenol, 4-propyl-
Phenol, 4-ethyl-2-methoxy-
Phenol, 5-methyl-2-acetate
Phenol, 2,6-dimethoxy-
Phenol, 2-methoxy-4-methyl-
Aromatics
1h-Indene, 2,3-dihydro-4,7-dimethyl- switchgrass (Imam and Capareda
2012) 1h-Indene, 2,3-dihydro-1,1,5,6-tetramethyl-
1-Tetradecene
3-Octadecene, (e)-
1-Heptadecene
9-Eicosene, (e)-
2-Hexadecene, 3,7,11,15-tetramethyl
1-Decene, 3,3,4-trimethyl-
2,4-Diphenyl-4-methyl-1-pentene
5,8-Dimethylenebicyclo[2.2.2]oct-2-ene
1,4-Dihydronaphthalene
5-Octadecene,€
Napthalene, Toluene, Benzene, Amides
Acetamide, 2-(1-naphthyl)-n-(3,4-
methylendioxybenzyl)-
switchgrass (Imam and Capareda
2012)
Naphthalene, 2-methyl-
Naphthalene, 1,2,3,4-tetrahydro-5,6,7,8-tetramethyl-
Naphthalene, 1,5-dimethyl-
Toluene, 4-(1,1-dimethyl-2-propynyloxy)- Toluene
1,1-Bicyclohexyl
Fluorene, 2,4a-dihydro-
Benzene, 1-ethyl-3-methyl-
Benzene, 1,1-[3-(3-cyclopentylpropyl)-1,5-
pentanediyl]bis-
Benzene, nonyl-
Benzene, 1,2,3-trimethyl-

16
Table 6. Physico-chemical properties of different pyrolysis oils (Sipilä, Kuoppala
et al. 1998).
Analysis Straw
oil
Pine oil Ensyn oil
(hardwood)
pH 3.7 2.6 2.8
Water (wt%) 19.9 11.1 23.3
Solids, (wt%) 0.35 0.18 0.30 Density (kg/dm3) 1.186 1.266 1.233 Viscosity, cSt, at 508C 11 46 50 LHV (MJ/kg) 16.9 19.2 16.6 LHV (MJ/kg)a 21.1 21.6 21.6 C (wt%)a 55.3 56.4 58.4 H (wt%)a 6.6 6.3 6.0 N (wt%)a 0.4 0.1 0.1 O (wt%)a 37.7 37.2 35.5 Ash (wt%) 0.14 0.07 0.09 CCR (wt%) 18 18 23 Flash point (8C) 56 76 >106 Pour point (8C) ÿ36 ÿ18 ÿ9 Sulfur (wt%) 0.05 0.006 0.02 Chlorine (wt%) 0.033 0.008 <0.001 Water-insolubles (wt%) 23 28 40 LHV (MJ/kg) 27.1 27.7 25.9 C (wt%) 68.6 69.3 65.8 H (wt%) 6.6 6.4 6.2 N (wt%) 0.7 0.2 0.2 O (wt%) 24.1 24.1 27.8 Water-solubles/ether-insol. (wt%) 28 41 25 C (wt%) 47.2 45.7 44.7 H (wt%) 6.5 6.3 6.4 N (wt%) 0.6 0.2 0.1 O (wt%) 45.7 47.8 48.8
2.1.1.2.1 Applications
Applications of bio-oil include:
• Organic molecule derivatives – bio-oil can be used as a precursor for
the production of chemicals adhesives and resins.
• Fuel – it can be combusted and used for heat or power generation
(LHV of 14-18 MJ/kg (Lu, Li et al. 2009)).

17
• Biodiesel feedstock – bio oil can also be used as a feedstock for the
production of biodiesel. This is more carbon neutral than diesel
obtained from fossil derived oil because it is derived from sustainable
carbon source.
2.1.1.2.2 Marketability
Pyrolysis oil from woody biomass is an ideal clean fuel because it is CO2 neutral
and usually produces approximately half the NOx (nitrogen oxide) emissions in
comparison with fossil fuels (Bradley 2006).
There is currently no market for bio-oil prior to upgrading. Upgrading improves
compatibility with conventional engines as raw pyrolysis oil which is highly
oxygenated normally hardens with time (Slesser. and Lewis. 1979,
A.V.Bridgewater. 2004, Rezaiyan and Cheremisinoff 2005, Strezov, Evans et al.
2008, Smith., M.Garcia-Perez. et al. 2009, Crocker 2010, French and Czernik
2010, Oasmaa and Peacocke 2010, Anis and Zainal 2011, Bulushev and Ross
2011, Vamvuka 2011). The main property that affects its marketability is its high
corrosion potential because it has a low pH ~ 2-4(D.Zhang. and S.Lilly. 2005,
Bradley 2006, Mohan, Pittman et al. 2006, Lu, Li et al. 2009, Vamvuka 2011)
which makes it hard to be handled or transported cheaply (Oziemen. and
Karaosmanoglu. 2004, Dominguez., Menendez et al. 2006, Anis and Zainal 2011,
Vamvuka 2011, White, Catallo et al. 2011). Another property that affects its
marketability is its inconsistent flash point 40 to 100oC because it cannot be
handled by conventional engines or equipment. The high moisture content of 14-
20% reduces the lower heating value (LHV) of the oil to about 14 MJ/kg.
2.1.1.2.3 Concerns
Bio oil has been associated with acute dermal toxicity due to its corrosive nature
(PYNE 2006). Inhalation of fumes may also pose human risk as it could contain
toxic compounds polyaromatic hydrocarbons, depending on the production
methods and feedstock used. It has a high rate of biodegradation under aerobic
conditions. This biodegradation via oxidation causes the bio-oil to form a waxy
substance.

18
Syngas 2.1.1.3
Figure 4. Syngas flare from Lakeland Steel's pilot plant processing green sawdust.
Syngas, also known as synthesis gas is mainly composed of hydrogen, carbon
monoxide, methane, carbon dioxide and small hydrocarbons. It is primarily the
incondensable gas product of pyrolysis left over once the oil is condensed out.
Table 7 shows reported properties of syngas from various sources.

19
Table 7. Reported Syngas Composition (Apt, Newcomer et al. 2008).
Composition % volume
CO H2 CO2 CH4 Ar N2 S
(ppmv)
H20 HHV
(Btu)
LHV
(Btu)
Coal, E- Gas gasifier, Wabash (Lynch 1998) 45.3 34.4 15.8 1.9 0.6 1.9 68 277
Petcoke, E- Gas gasifier, Wabash (Lynch 1998) 48.6 33.2 15.4 0.5 0.6 1.9 69 268
Coal, Dow gasifier, Dow plasquemine (Hannemann,
Koestlin, Zimmerman and Haupt 2005)
38.5 41.4 18.5 0.1 -- 1.5 n/r n/r n/r
Coal/Petcoke, Shell gasifier, Elcogas Puetrollano
(Hannemann, Koestlin et al. 2005)
29.2 10.7 1.9 0.01 0.6 5.31 n/r 4.2 n/r n/r
Coal/Biomass, Shell gasifier,Nuon Power (Hannemann,
Koestlin et al. 2005)
24.8 12.3 0.8 -- 0.6 42.0 n/r 19.1 n/r n/r
Coal, GE/Texaco gasifier, Polk (Todd and Battista undated) 46.6 37.2 13.3 0.1 2.5 2.5 n/r 0.3 253
Petcoke, GE/Texaco gasifier, El Dorado (Todd and Battista
undated)
45.0 35.4 17.1 0.0 2.1 2.1 n/r 0.4 242
Lignite/Waste, BG/ Lurgi gasifier, Schwarze Pumpe (Todd
and Battista undated)
26.2 61.9 2.8 6.9 1.8 1.8 n/r -- 317
Fuel oil, GE/Taxaco, (Todd and Battista undated) 35.4 44.5 17.9 0.5 1.4 1.4 n/r 0.44 241
Coal, ErgoExergy, Eskom (Walker, Blinderman and Brun
2001: Blinderman and Anderson 2003)
8.3 6.7 9.5 1.0 n/r n/r n/r 17.0 150
Note: Natural gas and LPG have typical calorific values of 48.8 and 46.3 MJ/kg respectively
HHV = High heating value;
LHV = Low heating value;
n/r = not reported

20
2.1.1.3.1 Applications
Syngas can be used as a:
• Fuel 5.59 – 12.63 MJ/m3 (Apt, Newcomer et al. 2008) for electricity
generation, heating, gas cells.
• Biodiesel feedstock in the Fischer-Tropsch process.
2.1.1.3.2 Marketability
Unlike gasification, pyrolysis is highly endothermic. The syngas is usually
recycled and burned to cater for some of the process heating requirements to
improve the process autogenesis. Autogenesis is the ability for a process to be
self-sustainable. This means the amount of syngas being burned can be used to
lower external fuel inputs that drive the process. This approach is generally
favoured over selling the syngas because of the issues highlighted in the next
subsection.
2.1.1.3.3 Concerns
Syngas production has been associated with the production of eco-toxic
compounds such as hydrogen sulphide, dioxins, polychlorinated biphenyls (PCB)
and poly-aromatic hydrocarbons (PAHs). Some of these compounds are also toxic
to human and can pose a health risk. These toxins can be extracted using
scrubbers. Hydrogen sulphide is very acidic so it can cause corrosion issues when
handling.
Syngas homogeneity is also an issue because its calorific value can vary
depending on the properties of the feedstock and the processing parameters such
as reaction temperature, reaction order and catalyst contact time (char has been
identified as a syngas cracking catalyst therefore contact time needs to be
monitored).
2.1.2 Modes of Pyrolysis
A wide range of designs, temperatures, and pressures are used for pyrolysis
systems. Typically, for a simple batch type reactor, a drum or kiln-shaped

21
structure for continuous type is heated externally by recycled syngas or another
fuel. Regardless of whether they are batch or continuous, pyrolysis systems can be
categorised as follows:
• Slow/conventional pyrolysis: Used to maximise the production of char .
The steady heating rate settings (varying from ~5-20 °C/ min to isothermal
temperatures at around 400°C in batch systems) favour the production of bio char
and syngas. Modern systems designed for commercial bio char production, such
as that operated by Pacific Pyrolysis Pty Ltd, the bio-oil produced is cracked to
syngas to avoid marketing or disposal of bio-oil (A.V.Bridgewater. 2004,
Rezaiyan and Cheremisinoff 2005, Dominguez., Menendez et al. 2006, Downie
2008, Balat, Balat et al. 2009, Papadikis, Gu et al. 2009, Smith., M.Garcia-Perez.
et al. 2009, Basu 2010, Crocker 2010, Elliott 2010, Jones 2010, Downie 2010-
2011, Berg., Sichone. et al. 2011, Bridle 2011, Mcbirdle 2011, Vamvuka 2011,
Choi, Choi et al. 2012).
• Fast pyrolysis: Fast Pyrolysis is optimised to produce bio-oil, which
requires fast heating rates. Fast pyrolysis is currently the most studied pyrolysis
system in conjunction with woody biomass. This is because most ventures focus
on using bio-oil as a biodiesel precursor (A.V.Bridgewater. 2004, Rezaiyan and
Cheremisinoff 2005, Dominguez., Menendez et al. 2006, Downie 2008, Balat,
Balat et al. 2009, Papadikis, Gu et al. 2009, Smith., M.Garcia-Perez. et al. 2009,
Basu 2010, Crocker 2010, Elliott 2010, Jones 2010, Downie 2010-2011, Berg.,
Sichone. et al. 2011, Bridle 2011, Mcbirdle 2011, Vamvuka 2011, Choi, Choi et al.
2012).
2.1.3 Related Technologies
This section covers alternative processes to pyrolysis that have similar end
products. These include gasification, Fischer Tropsch, and torrefaction. These
processes are quite similar to pyrolysis since they are based on thermochemical
decomposition of carbonaceous matter (Slesser. and Lewis. 1979, Rezaiyan and
Cheremisinoff 2005, Basu 2010). However, there are some differences in
operating parameters such as the maximum temperature used and amount of air
added. These differences are quite significant and alter the reaction mechanisms

22
and end products (Slesser. and Lewis. 1979, Rezaiyan and Cheremisinoff 2005,
Basu 2010).
Gasification – This is the process by which organic matter is heated to 1200-1500
oC in the presence of oxygen, but using less oxygen than stoichiometric ratios to
prevent complete feedstock combustion (Slesser. and Lewis. 1979, Rezaiyan and
Cheremisinoff 2005, Basu 2010). Combustion is highly exothermic and provides
energy for gasification of the feedstock. This process is often used on pyrolysis
by-products to produce syngas for electricity and heat generation, but is also be
used on raw feedstock.
Fischer Tropsch – This process is used to convert natural gas and syngas into
liquid alkane fuels. The process normally uses pyrolysis or gasification or a
combination of both to produce the syngas which is then converted into the liquid
fuels via catalytic cracking and reformation of gases.
Torrefaction – this is a mild form of pyrolysis where the biomass is heated to
temperatures ranging from 230- 300°C in the absence of oxygen (Basu 2010). It is
usually used as an intermediate process in most cases with the exception of coffee
bean roasting. As the biomass is heated, it is dried and some volatile matter is
driven off. This leaves a brittle material with low oxygen and water content which
can make a better feedstock for gasification or combustion (Basu 2010).
Table 8. Comparison of Pyrolysis modes (Zhang 2010 ).
Pyrolysis Process Residence Time
Heating Rate Final Temperature (°C)
Desired Products
Carbonisation Days Very low 400 Charcoal Conventional 5- 30 min Low 600 Char,bio-oil, gas Fast <2 s Very high ~500 Bio oil Flash <1 s High <650 Bio-oil chemicals,
gas Ultra-rapid <0.5 s Very High ~1000 Chemical, gas Vacuum 2 – 30 s Medium 400 Bio-oil Hydropyrolysis < 10 s High < 500 Bio-oil Methanol-pyrolysis <10s High >700 Chemicals
23
Table 9. Typical product yields (dry wood basis) of pyrolysis compared with
those of gasification (Zhang 2010 ).
Mode Liquid Char Gas
Fast 75% 12% 13%
Conventional 50% 20% 30%
Slow 30% 35% 35%
Modern Slow (Downie
2008)
0% 25% 75%
Gasification 5% 10% 85%
2.1.4 Effects of Processing Parameters on Pyrolysis
The pyrolysis reaction kinetics rates are mainly dependent on the following
parameters:
Residence Time – longer residence time of feedstock, char and volatiles is
generally used for char production because it allows secondary and tertiary
reactions which crack the hot volatiles (vaporised oil and tars) into more
syngas components and char (Slesser. and Lewis. 1979, Rezaiyan and
Cheremisinoff 2005, Basu 2010). The char acts as a cracking catalyst for
the tar and char yield is increased by two mechanisms. Firstly tar vapour is
adsorbed onto the char surface causing reformation of tars at the solid-gas
interphase similar to that seen in crystal growth in solid-liquid interfaces
(Brinkman and Carles 1998).Secondly, the tar attaches itself to the pores
of the char eventually clogging the pores (Antal and Grønli 2003)
Heating rate – A higher heating rate is used to produce oil and syngas.
This is because it allows the feedstock to reach a higher degree of
volatilisation in a shorter amount of time. However, literature also states
that lower heating rates facilitate char formation (Antal and Grønli 2003,
Rezaiyan and Cheremisinoff 2005, Basu 2010). A high gas yield due to the
increase of volatile diffusion relative to case hardening which is a critical
phase of carbonisation reactions. The case hardening reduces the rate of
diffusion/ mass transfer of the volatiles and also affects heat transfer from
the grain surface to the core.

24
Reaction temperature - this determines the extent of volatilisation
exhibited by the feedstock. High reaction temperatures promote gas
production while lower reaction temperatures promote char and tar
formation (Rezaiyan and Cheremisinoff 2005). Hydrogen fraction and
calorific value of the syngas also increases with increase in reaction
temperature.
Operating pressure – this affects the equilibrium temperature for
volatilisation. A lower pressure reduces the required reaction temperature.
This concept is normally used in flash pyrolysis to reduce the amount of
heat required to drive the process (FAO and Department unknown)
In pyrolitic reactions, volatile matter is liberated from its solid/liquid state and
vaporised. The main competing process for pyrolysis of solids is carbonisation.
This process involves realignment of carbon atoms into graphite like structure.
The extent of other reactions such as methanation, steam reformation, solid
melting and interactions between the products of the two main reactions are
variables that will affect the selectivity of the product yields or product
composition. This is covered in more detail in the section on Modelling of
Pyrolysis Reactions.
2.1.5 Feedstock Considerations
Prospective biomass feedstocks include but are not limited to
Animal wastes such as carcases, paunch grass and litter.
Waste water effluent such as activated sludge or poultry dissolved air
floatation (DAF) sludge.
Agricultural wastes such as corn stover, sugarcane bagasse
Energy crops
Food wastes
Forestry and timber wastes
Alternatives to biomass feedstock for pyrolysis include plastics and coals
(basically all carbonaceous mater).

25
A feedstock’s composition can affect the by-product quality and cost of operating
a pyrolysis system. The feedstock composition will vary depending on origin,
however it can be noted that most of the solid matter will be organic.
The properties of the feedstock that will be of relevance include:
• Moisture content – This is important as it can affect the quality of
products. The water content has been known to inhibit volatilisation of organic
matter during the decomposition process. The high moisture content can also
interfere with carbon fixing reactions effectively reducing the carbon content in
the char product and the extent of pyrolysis (Boyles 1984). Feedstock is generally
required to have a moisture content less than 20% (Elliott 2010, Downie 2010-
2011).
• Product calorific value/ starting calorific value – This property is used
to assess which feedstock is more compatible to fuel production processing, the
higher the ratio, the higher the probability of having an energy self-sufficient
process.
• Final carbon content – The degree of carbon enrichment in the char is of
major concern as it can be used to assess carbon sequestration. It also moderates
what type of applications the product can be used for (Elliott 2010, Downie 2010-
2011). For example high carbon char could be used for catalysts or analytical
applications or even cathodes whilst low grade can be burned as a fuel.
• Reproducibility of yields – The ability for a feedstock to give products
with consistent properties is desired because it reduces product rejects and cost of
monitoring. Wood has been identified to have the highest reproducibility within
the biomass feedstock (Slesser. and Lewis. 1979, Boyles 1984).
• Trace element contaminants –Some metallic contaminants reduce char
performance, for example adsorption properties and health and safety rating, and
evolution of toxic compounds. These contaminants are normally produced as char
ash. Arsenic and mercury are two examples of contaminants (Purchas., Tammik.
et al. 2009).

26
• Fibre content – The fibre content of the feedstock generally ensures a
network structure. Fibrous feedstock has been reported to have good mechanical
abilities and porosity after pyrolysis. Plant based biomass is generally preferred
due to its ability to retain its fibrous structure (Slesser. and Lewis. 1979). A good
example of this is activated carbon obtained from coconut shells or other nut
species.
• Transportation – The transportation of the feedstock can add to the cost
of the venture therefore, factors like resource location, density will have to be
taken in consideration (Boyles 1984).
Of the specified parameters, the one with the highest impact on the economic
feasibility of the process is the feedstock moisture content. In order for pyrolysis
to take place the feedstock needs to have a maximum moisture content of 20%
(Elliott 2010, Downie 2010-2011). Lower moisture content will also mean lower
transportation costs for the same amount of product.
Bio-char and syngas products are considered most valuable for carbon
sequestration and energy generation via electricity and process heat. Bio-oil is
mainly considered as a bio-fuel precursor; however it needs to undergo further
processing before it reaches stability that will render it a convenient liquid fuel.
Heavy metal contamination of feedstock can pose environmental concerns (Elliott
2010, Jones 2010, Downie 2010-2011). Therefore, sawdust from treated woods
(e.g copper oxide- chromic acid- arsenic acid, (CCA)) are normally not used
because they release toxic and/or carcinogenic compounds. IARC has classified
untreated hardwood and hardwood/softwood mix wood dust as a Group I human
carcinogen ((USA) 2013).
Sawdust 2.1.5.1
Sawdust, being a ligno-cellulosic biomass has a heterogeneous composition
comprising of three components which have different temperature ranges for the
initiation of pyrolysis (Basu 2010):
Hemicellulose: 150-350 °C

27
Cellulose: 275-350 °C
Lignin: 250-500 °C
These components exhibit different properties when they experience pyrolysis due
to the difference in structure. Cellulose and hemicellulose have a higher tendency
to form volatiles with cellulose being the main contributor to the condensable
vapour fraction (Rezaiyan and Cheremisinoff 2005, Basu 2010, rhegyi ob ly
et al. 2010, Aboyade, Hugo et al. 2011, White, Catallo et al. 2011).
2.1.6 Reaction Catalysts
The use of catalysts to increase desired yields and reduce energy requirements is a
crucial step in process optimisation. Pyrolysis being a highly endothermic process
by nature has driven researchers to study means by which catalysis can be used to
optimise the process conditions to improve the economic favourability of
prospective commercial scale operations (Alden, Humerick et al. 2009). To
perform an extensive review on catalysts used for biomass pyrolysis is beyond the
scope of this thesis, however, this section provides a brief overview in regards to
how catalysis is applicable to biomass pyrolysis.
The main benefits of catalysis for pyrolysis include:
Increased yield of desired product
Lower heating costs
Product conditioning
Based on these benefits, catalysts can be placed into two categories; primary and
secondary catalysts.
Primary catalysts refer to catalysts that are involved in the reaction. They are
either mixed with the feedstock prior to the reaction or placed in the reactor where
they can come in contact with the feedstock as it is processed (Anis and Zainal
2011). They can be used for one, two or all three of the listed benefits. Müller-
Hagedorn et al. (2003) found that alkaline metal chlorides can lower the pyrolysis
temperature of biomass. This can prove beneficial in reducing heating costs and
thus lowering operating costs.

28
Secondary catalysts are normally used for product conditioning. This includes
processes such as catalytic cracking of tars (Anis and Zainal 2011) and char
conditioning by thermal activation or introduction of soil nutrients in the case of
biochar (Antal and Grønli 2003). This topic is discussed in more detail in
section 2.3.4.2 Catalytic Cracking”.
2.2 Modelling of Pyrolysis Reactions
The pyrolysis process involves many reactions that occur in series and also
parallel. These reactions can be grouped into different classes based on the
reagents and the products.
Primary reactions – These are naturally considered as decomposition
reactions because they refer to the direct conversion of the organic matter
into char, and volatile gas. Oil, tars and syngas are produced as the hot
volatile gas. The oil and tar products are formed from the condensable
fractions of the hot volatiles.
Secondary reactions can be considered as synthesis reactions. They refer
to reactions of the products to produce more char and syngas (Antal and
Varhegyi 1995, Fake, Nigam et al. 1997, Demirbaş 2000, Rezaiyan and
Cheremisinoff 2005, Kovács, Zsély et al. 2007, Strezov, Evans et al. 2008,
Basu 2010, Bulushev and Ross 2011, Butler, Devlin et al. 2011, White,
Catallo et al. 2011, Mehrabian, Scharler et al. 2012). The diagram below
shows a proposed breakdown of a two-step global reaction map.

29
Figure5. A two-step global reaction map for biomass pyrolysis.
Pyrolysis can be broken into four separate stages. These can be divided based on
temperature ranges. These stages do not happen at one specific temperature so in
reality they will happen simultaneously. Figure 6 shows the stages involved in
relation to temperatures (Basu 2010).
Figure 6. Schematic diagram showing the stages involved in relation to
temperatures (Basu 2010).
Secondary Reactions
Primary Reactions
Feedstock
Biomass
Volatilisation
Catalytic Cracking
Steam Reformation
Carbonisation
Methanation
Secondary Char
Drying -(~100 °C)
• loss of free water via evaporation
Initial stage -
(100 - 300 °C) exothermic dehydration and release of low molecular weight gases like CO and CO2
Intermediate Stage(>200 °C)
•primary pyrolysis, production of vapour and primary char.
Final stage (~300-900 °C)
• secondary reactions involving catalytic cracking, hydrogen favouring reactions etc.
30
2.2.1 Reaction Kinetics
Biomass pyrolysis reactions are considered to be heterogeneous solid state
reactions. There are many models for solid state reactions most of which can be
classified by the following mechanisms (Behrens 2013):
Reaction order – uses the rate law based on homogeneous kinetics.
Diffusion – the reaction rate is limited by the diffusion of the reactant or
product.
Nucleation – the favourability of nuclei formation and growth define the
reaction rates simultaneously.
Geometrical contraction – a reduction in active reactive surface area are
definitive of the reaction rates.
A simple heterogeneous solid state reaction of biomass pyrolysis is represented by
the following reaction:
(1)
Volatiles comprise of condensable vapours from large hydrocarbon and non-
condensable gases like CO, CO2 CH4, and H2.
Heterogeneous reactions usually involve a superposition of several elementary
processes such as nucleation, adsorption, desorption, interfacial reaction, and
surface/bulk diffusion, each of which may become rate-limiting depending on the
experimental conditions (White, Catallo et al. 2011).

31
Table 10. Expressions for the most common reaction mechanisms in solid state
reactions.
Reaction model Differential Form Integral form
f(α)=(1/k)(dα/dt) g(α)=kt
Reaction order
Zero order (1- α)n α
First order (1- α)n -ln(1 - α)
nth order (1- α)n (n - 1)
-1 (1 - α)
(1-n)
Nucleation
Power law n(α)(1-’1/n)
; n = 2/3, 1, 2, 3, 4 α n
; n = 3/2, 1, ½, 1/3, 1/4
Exponential law ln α α
Avrami - Erofeev (AE) n(1 - α) [-ln(1 - α)](1 -1/n)
; n = 1, 2, 3, 4 [-ln(1 -α)]1/n
; n = 1, 2, 3, 4
Prout - Tompkins (PT) α(1- α) ln[α(1- α)-1
] +C
Diffusional
1-D 1/2 α α2
2-D [-ln(1 - α)]-1
(1 - α).ln(1- α)+α
3-D (Jander) 3/2(1 - α)2/3
[1 - (1 - α)1/3
] -1
[ 1 –(1 - α)1/3
]2
3-D (Ginstling-Brounshtein) 3/2[(1 - α)-1/3
-1]-1
1 – 2/3α-(1 - α)2/3
Contracting geometry
Contracting area (1 - α)(1 -1/n)
; n = 2 1-(1 - α)(1/n)
; n = 2
Contracting volume (1 - α)(1 -1/n)
; n = 3 1-(1 - α)(1/n)
; n = 3
Ultimately, regardless of reaction mechanisms, all pyrolysis kinetic models can be
divided into three principal categories: single-step global reaction models,
multiple-step models, and semi-global models (White, Catallo et al. 2011).
Single-Step Global Reaction Kinetics 2.2.1.1
Single step reactions are based on equation (1) where the biomass is converted
into char and volatiles.
The global kinetics of single step biomass pyrolysis reactions can be described as:
(2)
Where αistheamountofmassconvertedintogasatagiventime,
(3)

32
Where w is the mass of substrate present at any time t, w0 is the initial substrate
mass, wf is the final mass of solids (i.e., residue and unreacted substrate)
remaining after the reaction. The combination of A, Eα, and f(α˛) is often
designated as the kinetic triplet, which is used to characterize biomass pyrolysis
reactions (Dupont, Chen et al. 2009, Van de Velden, Baeyens et al. 2010, White,
Catallo et al. 2011).
Most cited kinetic models proposed a rate law that obeys the l Arrhenius rate
expression:
(
) (4)
where T is the absolute temperature in ° K, R is the universal gas constant 8.314
J/mol, k is the temperature-dependent reaction rate constant, A is the frequency
factor, or pre-exponential, and Ea is the activation energy of the reaction (J/mol).
Putting equation (4) into equation (2) gives the expression for single step
isothermal reaction
(
) (5)
Isothermal methods have been widely criticised for not being able to accurately
simulate the conditions in reactors due to errors that cannot be accounted for
during the pre-heating phase (Müller-Hagedorn, Bockhorn et al. 2003, Branca,
Albano et al. 2005, White, Catallo et al. 2011). To account for the non-isothermal
nature of pyrolysis, the following relationship is used:
(6)
where, dα/dT is the nonisothermal reaction rate, dα/dt is the isothermal reaction
rate, and dt/dT is the reciprocal of the heating rate (1/β). Substituting eq (6) into
eq (5) gives the differential form of the non-isothermal rate law,
(
) (
) (7)

33
The term β applies to linear heating rate
which is constant. Separating
variables and integrating equations (5) and (7) give the integral forms of the
isothermal rate law:
(
) (8)
and nonisothermal rate law:
(
) ∫
(
) (9)
Where g(α) is the integral reaction model defined by:
∫
(10)
Multiple-Step Models 2.2.1.2
These models involve rigorous kinetic treatment of pyrolysis data to account for
the formation rates of all the individual product species, along with any potential
heat and mass transfer limitations (White, Catallo et al. 2011). Some researchers
have been able to define the kinetics of biomass pyrolysis using up to seven steps
(Diebold 1994).
Although useful in some applications, multi-step reaction models are limited by
their incorporation of several interdependent serial reactions, wherein subtle
inaccuracies in the kinetic parameters obtained for the first rate equation can be
greatly magnified in successive reactions (White, Catallo et al. 2011).. These
models are seldom used as they involve tedious modelling operations and are
limited in cases of accounting for unidentified products especially from the tar
mixtures.
Semi-Global Reaction Kinetics Models 2.2.1.3
This type of kinetics model attempts to compensate for the heterogeneous
composition of biomass whilst keeping calculations as simple as possible. They
assume the production of three products: char, tars and syngas (White, Catallo et
al. 2011). The models have gained a common acceptance as they allow for a

34
lumped kinetic analysis which makes them relatively easier than the multiple step
model analysis and more accurate than single step reaction kinetics. Examples
include, model free analysis and distributed activation energy models.
2.2.1.3.1 Iso-Conversional Analysis
Iso-conversional kinetic analysis, also commonly called ‘Model free analysis’
(Sewry and Brown 2002) has gained popularity due to its ability to calculate the
three kinetic parameters without deploying the assumptions used by reaction
mechanism models (White, Catallo et al. 2011). It is proposed that the kinetic
parameters can be derived from analysing repeated thermal analysis of the sample
at a number of heating rates. The data can be converted to differential
thermogravimetric (DTG) curves and with a specific conversion fraction
selected using equation (9) the parameters can be obtained simultaneously.
2.2.1.3.2 Distribution of Activation Energy Model (DAEM)
This approach is based on a model of parallel reactions with Gaussian activation
energy distribution as shown in the work produced by Sonobe et al (2008). They
chose Gaussian distribution because of the favourable experience with this type of
modelling on similarly complex materials. According to this model, the sample is
regarded as a sum of M pseudo-components, where M is between 2 and 4. Here a
pseudo-component is the totality of those decomposing species that can be
described by the same reaction kinetic parameters in the given model. On a
molecular level, each constituent in the pseudo-component is assumed to undergo
a first-order decay.
2.2.1.3.3 Biomass Deactivation model
An interesting deactivation theory was proposed by Balci et al. (1993) that is
based on kinetic models typically applied toward catalyst deactivation. In the
biomass deactivation model (DM) the biomass surface area reduces with time as
the residual matter at the surface is normally rendered inert once it undergoes
decomposition (White, Catallo et al. 2011). This model is worth noting because
the pyrolysis of most biomass is associated with a high degree of volume

35
reduction. Volume reductions of up to 70% were observed in previous research
(Sichone 2012).
2.2.2 Lab-Scale Thermal Analysis Techniques
Lab scale pyrolysis experiments can be analysed using thermal analysis methods
such as:
Differential thermal analysis (DTA)
Thermo gravimetric analysis (TGA)
Differential scanning calorimetry (DSC)
Simultaneous DSC and TGA (SDT)
The data from these experimental methods are plotted and the shape of the graph
will determine which reaction mechanism best suits the reaction kinetics of the
process.
There are various techniques devised to model the reaction kinetics for the
pyrolysis process. They use TG-MS analysis and usually provide a pseudo-
reaction kinetics model. This section is explained well by the TA Decomposition
techniques using TGA report (Sauerbrunn and Gill). These are:
The constant heating rate TGA
The constant reaction rate TGA
The dynamic heating rate TGA
These techniques can be used to predict the decomposition rates of homogeneous
organic matter. However, most biomass does not have a homogeneous structure.
For example pine sawdust is mainly comprised of lignin, cellulose and
hemicellulose. Decomposition kinetics can be obtained from TGA tests performed
in inert atmosphere to prevent combustion or addition of oxygen. In this model,
the reaction order is normally assumed to be 1. This means the model can be
described using the Arrhenius equation for decomposition.
(
) (4)

36
This is because the reaction order is set to 1 for
.
The constants relating to the activation energy and frequency factor can be
calculated using empirical data whilst the reaction rate constant will normally be
calculated using the change in mass.
Constant Heating Rate TGA 2.2.2.1
This model is simple and assumes the reactor has a constant heating rate. This
makes it easier to approximate the thermal properties of the sawdust as it is
conveyed through the reactor. This means the temperature profile of the feedstock
and the heating medium will be linear assuming no heat losses.
The approach assumes the basic Arrhenius equation.
⁄ (11)
where:
α = fraction of decomposition
t = time (seconds)
A = pre-exponential factor (1/seconds)
Ea = activation energy (J/mole)
R = gas constant (8.314 J/mole K)
n = reaction order (dimensionless)
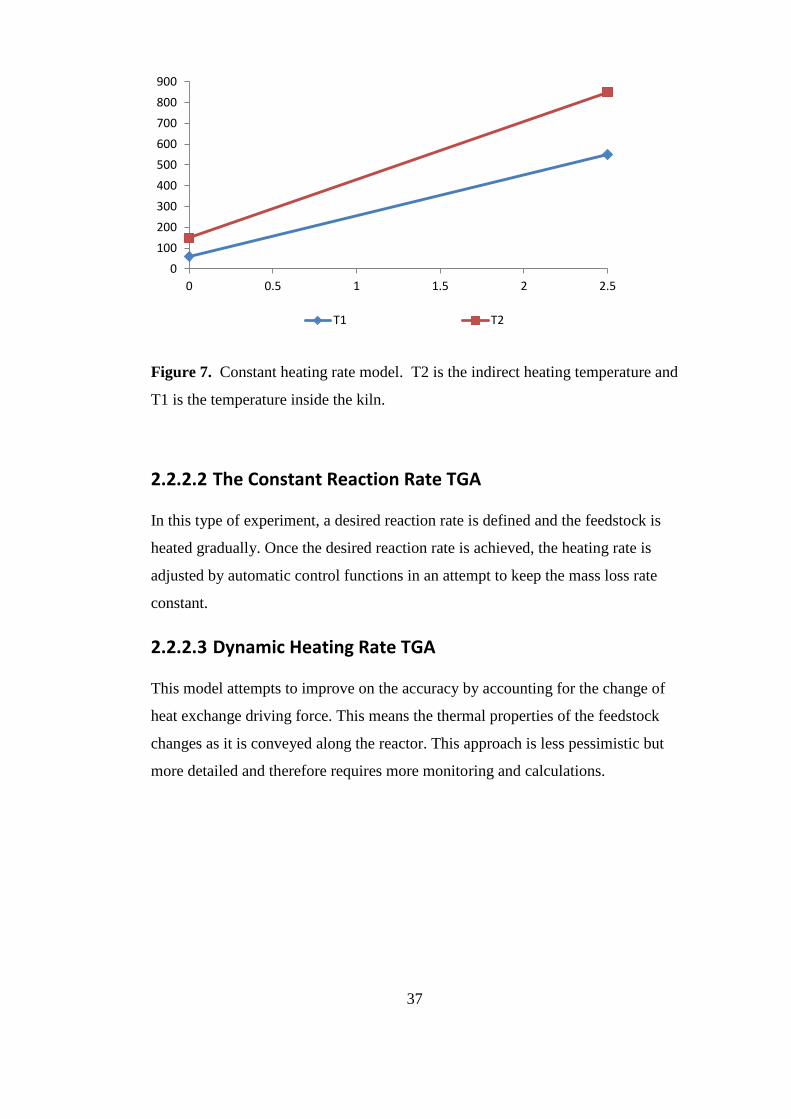
37
Figure 7. Constant heating rate model. T2 is the indirect heating temperature and
T1 is the temperature inside the kiln.
The Constant Reaction Rate TGA 2.2.2.2
In this type of experiment, a desired reaction rate is defined and the feedstock is
heated gradually. Once the desired reaction rate is achieved, the heating rate is
adjusted by automatic control functions in an attempt to keep the mass loss rate
constant.
Dynamic Heating Rate TGA 2.2.2.3
This model attempts to improve on the accuracy by accounting for the change of
heat exchange driving force. This means the thermal properties of the feedstock
changes as it is conveyed along the reactor. This approach is less pessimistic but
more detailed and therefore requires more monitoring and calculations.
0
100
200
300
400
500
600
700
800
900
0 0.5 1 1.5 2 2.5
T1 T2

38
Figure 8. Dynamic heating rate model. T2 is the indirect heating temperature
and T1 is the temperature inside the kiln.
Table 11 shows the recommended methods for high-resolution TGA analysis
Table 11. Kinetic Caapabilities of Hi-ResTM
TGA methods(Sauerbrunn and Gill).
TGA Method Scans Order Components
Constant Heating Rate more than 2 Fixed at 1 Single
Constant Reaction Rate 1 Fixed at 1 Multiple
Dynamic Heating Rate more than 2 Independent Multiple
Stepwise Isothermal 1 Determined Multiple
2.2.3 Conclusions
Empirical models are generally suited to experimental conditions thus the derived
constants will vary for each type of model. Empirical models can be built using
the following steps.
1. Perform thermal analysis experiments.
2. Define the nature of the reaction mechanisms. This is the most important
step as it sets basis of the reaction rate prediction
3. Define the modelling approach – picking from multiple step models vs.
Isoconversional techniques this will typically control the flexibility and
accuracy of the model.
0
100
200
300
400
500
600
700
800
900
0 0.5 1 1.5 2 2.5
T1 T2

39
2.3 Pyrolysis Process Design
This section reviews literature on various aspects involved in the design of a
pyrolysis plant. It gives an insight on the equipment currently being used in
industry for pyrolysis and related technologies.
A good understanding of pyrolysis theory in regards to governing mechanisms
and practical limitations in regards to processing conditions is needed to design
sustainable processing equipment. Figure 9 gives an example of a large scale
pyrolysis plant process flow diagram that was developed for an organic waste
pyrolysis project assessment (Sichone 2012).
Figure 9. Large Scale plant concept for organic waste sludge pyrolysis (Sichone
2012).
2.3.1 Dryer Technologies
Water in the feedstock reduces the efficiency of pyrolysis as it requires energy to
evaporate the water before pyrolysis can begin. Removing some of this water
improves the efficiency of the pyrolysis process making it an attractive option.
There is a wide variety of drying methods available, not all of them suited to

40
sawdust. Selection of the drying method relies heavily on the mechanical
properties of the feed stock (Peters 1991, Moyers. and Baldwin 1999,
Cheremisinoff 2000, Branan 2005, Exports 2011) such as particle size,
consistency and stickiness. Without knowledge and experience of these properties,
it will be more difficult to predict the suitability of some methods but some
available options will be presented here.
Some important criteria in the selection of drying method include the properties of
the material and dried product, the drying characteristics, flow of material and
facilities available. More detailed sub-criteria are:
• Physical characteristics when wet
• Physical characteristics when dry
• Toxicity
• Particle size
• Thermal stability
• Available space
• Available heat/electricity
• Initial and final moisture content
• Quantity dried per hour
As already stated the physical characteristics of the feed and output are very
important. The feed needs to be compatible with the type of dryer. For example,
drying sludge with a spray dryer would cause pumping and clogging problems so
the two are incompatible. One must also consider what final moisture content is
best with regard to both safety considerations and requirements of downstream
processes. Feeds dried to 100% solids can create dust clouds if particulates are
small enough. These can be toxic or cause explosions (Peters 1991, Moyers. and
Baldwin 1999, Cheremisinoff 2000, Branan 2005, Rezaiyan and Cheremisinoff
2005, Basu 2010). In addition, volatile components will become more prone to
evaporation as water is removed, polluting the air.

41
With these considerations in mind, a dryer can be selected based on the following
process outlined in Perry’s (Moyers. and Baldwin 1999) initial selection,
comparison, drying tests and finally selection based on results. From the initial
selection stage, the following drying techniques for sawdust showed potential: pan
drying, fluid beds, batch through-circulation, tray drying, direct rotary and
vacuum shelf. Some combination of these methods is also possible to recycle heat
and maximise efficiency. One such combination is multiple effect evaporation
where the vapour of one process is used as the heating medium for another (Peters
1991, Moyers. and Baldwin 1999, Branan 2005).
High temperatures increase the drying rate but can also be more demanding as
they might require more sophisticated means of heating. Another disadvantage is
case hardening. High temperatures can cause a crust to form on the surface of the
material. This crust has shrunken pores for the passage of water to the surface,
causing a reduction in drying rate (Moyers. and Baldwin 1999).
Based on energy balances performed in previous studies (Sichone 2012) the
dehydration phase will be responsible for most of the energy demands.
Drying is a very common operation in the processing industry. However, each
case depends on the material being handled. Different drying technology options
were considered and rated for suitability. After elimination, the top two options
being considered wee rotary dryers and multiple effect evaporators. This section
gives a basic description of the dryers and compares them using criteria shown in
the ratings table.
Prospective Dryer Types 2.3.1.1
Dryer type: Screw conveyor and indirect rotary
Operation mode: Indirect type, continuous operation includes paddle, horizontal
agitated and steam tube dryers, rotary kilns
Performance description: This type operates by conveying the feedstock
through a screw/auger in a trough configuration as shown in Figure 10. The
trough is normally heated using hot air or steam although sometime electrical
heating can also be applied. The configuration generally requires recirculation of

42
dry product to minimise product sticking. There is usually only little dusting
occurs compared to direct rotary systems due to plug flow and the lack of
agitation/fluidisation of the feed.
Figure 10. Screw conveyor dryer (Made-in-China.com 2011).
Dryer type: Drum
Operation mode: Indirect type, continuous operation
Performance description: This type can only be used when the feed paste or
sludge can be made to flow. This is because it works on the principle of a rotating
a heated drum in the feed so that only a small segment is immersed. As the drum
contacts the feed, the paste wets the contact surface and gets dried as the drum
rotates on the spindle. The dry feed gets scraped off before the point on the drum
gets immersed again. Possible configurations include single, double or twin drums
under atmospheric or vacuum pressure. The product is flaky and usually dusty due
to the scraping. Maintenance costs may be high due to the abrasions inflicted by
the scraping.

43
Figure 11. Drum dryer (Fabrication 2011).
Dryer type: Tunnel/ Continuous Tray
Operation mode: Direct type continuous operation. Includes tunnel turbo-tray
Performance description: Suitable for small scale and large-scale production.
Feed is normally placed on an apron conveyor that is supported to keep it
horizontal. The air is then blown through the tunnel using either alongside or
countering the feed flow.
Figure 12. Tunnel/ continuous tray dryer (AG 2011).
Dryer type: Continuous through- circulation (non-agitated).
Operation mode: Direct type, continuous operation (Includes perforated band,
moving bed, centrifuge–dryer).

44
Performance description: This dryer is suitable for materials that will be pre-
formed. This is because the airflow can be controlled quite easily due to the
closed but simple geometry. It has the potential to handle large capacities. It
works on a similar principle as the tunnel dryer except that there is no agitation,
therefore airflow is kept laminar.
Figure 13. Continuous through-circulation (non-agitated) dryer (co.Ltd 2011).
Dryer type: Continuous through circulation (agitation/ rotary).
Operation mode: Direct heating, continuous operation (Includes high speed
convective paddle, rotary louvre).
Performance Description: Suitable for materials that are pre-formed. This dryer
is capable of handling large capacities. The rotary –louvre type requires dry-
product recirculation.
Figure 14. Continuous through circulation (agitation/ rotary) dryer
(Pharmainfo.net 2007).
Dryer type: Direct rotary type
Operation mode: Continuous operation

45
Performance Description: Suitable only if product does not dry to walls and
does not dust. Recirculation of product may prevent sticking. The rotary dryer is a
long cylindrical vessel positioned on an incline/decline. Hot air is blown through
it as the feedstock is conveyed and the cylinder normally has internal attachments
such as flights to aid in agitating the feed.
Figure 15. Direct rotary dryer (Made-in-China.com 2008).
Dryer type: Multiple effect evaporation
Operation mode: Continuous
Performance description: This is suitable for large scale applications. Only
requires enough energy for the first batch at the highest pressure to be dried. The
multiple effect evaporation (MEE) design is based on calculating the amount of
feedstock that can be readily dried by the available energy. Then the vapour
produced from the drying can be used to dry another fraction of the feedstock.
This can be repeated until the whole throughput has been dried [13]. However, it
should be noted that each effect adds more capital cost because of extra
components needed and utility costs via the cost of pressure manipulation. A
schematic diagram of the dryer is shown in Figure 16 . Multiple effect evaporators
are designed for liquids or thin pasty films so the technology will not directly be
applicable with sawdust. However the concept of recycling heat will be coupled
with the appropriate drying technique. Multiple dyers can be used similar to
cascade dryers
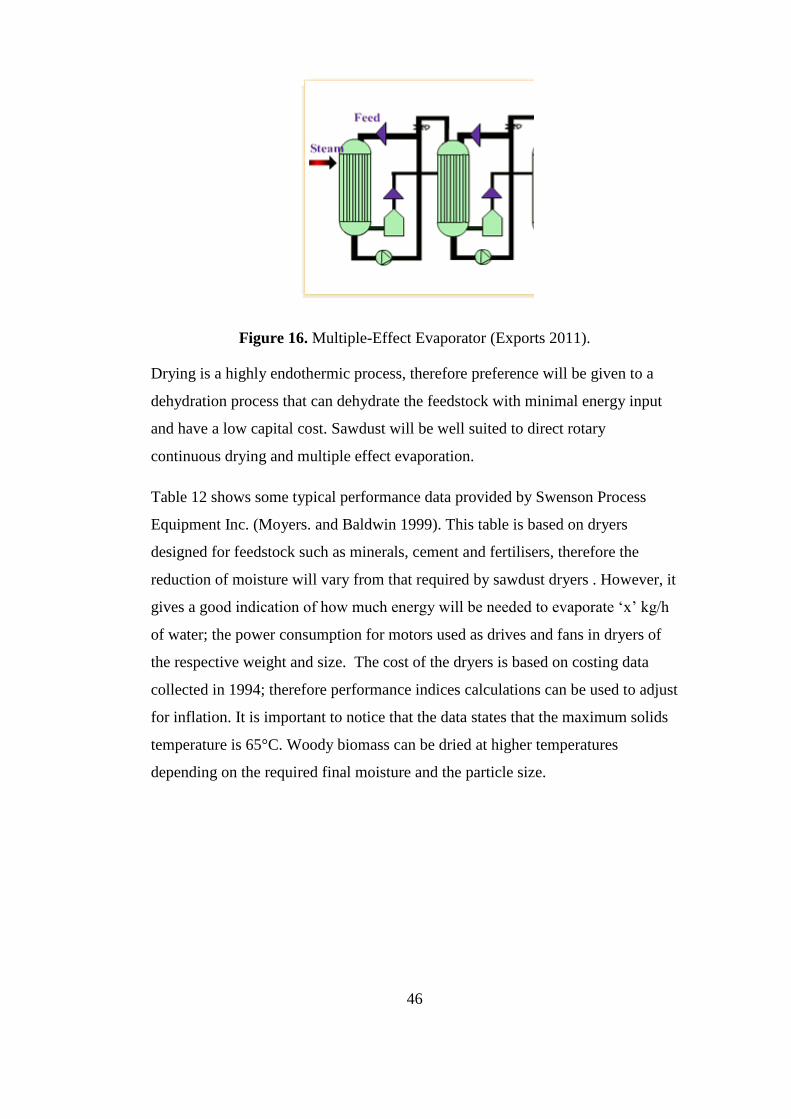
46
Figure 16. Multiple-Effect Evaporator (Exports 2011).
Drying is a highly endothermic process, therefore preference will be given to a
dehydration process that can dehydrate the feedstock with minimal energy input
and have a low capital cost. Sawdust will be well suited to direct rotary
continuous drying and multiple effect evaporation.
Table 12 shows some typical performance data provided by Swenson Process
Equipment Inc. (Moyers. and Baldwin 1999). This table is based on dryers
designed for feedstock such as minerals, cement and fertilisers, therefore the
reduction of moisture will vary from that required by sawdust dryers . However, it
gives a good indication of how much energy will be needed to evaporate ‘x’ kg/h
of water; the power consumption for motors used as drives and fans in dryers of
the respective weight and size. The cost of the dryers is based on costing data
collected in 1994; therefore performance indices calculations can be used to adjust
for inflation. It is important to notice that the data states that the maximum solids
temperature is 65°C. Woody biomass can be dried at higher temperatures
depending on the required final moisture and the particle size.

47
Table 12. Warm-Air Direct- Heat Co-current Rotary Dryers: Typical Performance
Data*(Moyers. and Baldwin 1999).
Dryer Size m x m
1.219 × 7.62
1.372 × 9.144
1.524 × 9.144
1.839 × 10.668
2.134 × 12.192
2.438 × 13.716
3.048 × 16.767
Evaporation kg/h
136.1 181.4 226.8 317.5 408.2 544.3 861.8
Work, 108
J/h 3.61 4.60 5.70 8.23 1.12 1.46 2.28
Steam kg/h at kg/m
2
gauge
317.5 408.2 521.6 725.7 997.9 131.5 2041
Discharge, kg/hr.
408 522 685 953 1270 1633 2586
Exhaust velocity m/min
70 70 70 70 70 70 70
Exhaust volume m
3/min
63.7 80.7 100.5 144.4 196.8 257.7 399.3
Exhaust Fan, kW
3.7 3.7 5.6 7.5 11.2 18.6 22.4
Dryer drive, kW
2.2 5.6 5.6 7.5 14.9 18.6 37.3
Shipping weight, kg
7,700 10,900 14,500 19,100 35,800 39,900 59,900
Price FOB, Chicago
$158,000 $168,466 $173,066 $204,400 $241,066 $298,933 $393,333
*Courtesy of Swenson Process Equipment Inc.
NOTE:
Material: heat-sensitive solid
Maximum solids temperature: 65°C
Feed conditions: 25 percent moisture, 27°C
Product conditions: 0.5 percent moisture, 65°C
Inlet-air temperature: 165°C
Exit-air temperature: 71°C
Assumed pressure drop in system: 200 mm.
System includes finned air heaters, transition piece, dryer, drive, product
collector, duct, and fan.
Prices are for carbon steel construction and include entire dryer system
(November, 1994).
For 304 stainless-steel fabrication, multiply the prices given by 1.5.
Mass and energy balances performed in the earlier stages of the project suggest
that the drying phase is the major contributor to pyrolysis plant energy costs. This
normally requires additional gas to be added to the system, nullifying the
autogenesis state of the process. To achieve a state of autogenesis, the energy
48
demands can be met using either multiple effect evaporation (MEE) or a heat-
pump driven direct-heating rotary kiln. This is because these units allow for
optimised heating with lower input requirements.
2.3.2 Pyrolysis Reactor Technologies
The pyrolysis process is highly endothermic due to the lack of oxygen input into
the process. This makes efficient heating of the process slightly more challenging
as conventional methods which involve contact between the heating medium and
the reagents is not appropriate. Various methods can be deployed to counter this
and they will differ for batch and continuous operations. Heating jackets are
probably the most affordable.
Factors that will determine the type of reactor used include:
Feeding mechanisms/ feed transportation mechanisms
Heating method
The choice of continuous versus batch will be decided by scale of operation and
the design specification. This choice will usually affect the flexibility in design for
the feeding/ heating methodology e.g. batch normally eliminates the feeding/
transportation issues especially when considering oxygen elimination however it
can take up too much space at large scales.
Reactor Classification 2.3.2.1
There is very little information on the classification of pyrolysis reactors due to
the limited number of proven ventures. However Dutta’s criteria for pyrolysis
technology classification based on feeding mechanisms of biomass are as follows
(Dutta 2007):
Type A: No solid movement through the reactor during pyrolysis (batch
reactors)
Type B: Moving bed (shaft furnaces)
Type C: Movement caused by mechanical forces (e.g., rotary kiln, rotating
screw etc.)

49
Type D: Movement caused by fluid flow (e.g., fluidized bed, spouted bed,
entrained bed etc.)
2.3.2.1.1 Type A - Batch
Most batch pyrolysis operations will use an airtight vessel that can be placed in an
oven or furnace. This makes it a lot easier to stop oxygen from entering the
system.
Batch pyrolysis is commonly used for carbonisation where the desired product is
charcoal, therefore the residence time can be very long (weeks). A common
design is a rotary drum which is sealed and placed into the heating medium. The
drum can be rotated to enhance heat exchange when it is not fully immersed in
the heating medium. This type of reactor is normally used for carbonisation and
some examples can be seen in Table 15.
Separation of products is normally done at high temperatures where the oil and
tars are still in their vapour phase. The hot volatiles gas can be vented out prior to
the char being cooled.
2.3.2.1.2 Types B-D -Continuous
Continuous pyrolysis operations are slightly more complex as a lot of effort is
focused on restricting introduction of oxygen into the system whilst conveying the
feedstock. The heating methods also need to be more sophisticated as the
residence time of the feedstock in the reactor can be crucial to setting up the
preferred mode of pyrolysis.
Dutta also classified pyrolysis reactors depending on the way heat is supplied to
biomass as follows:
Type 1: Part of the raw material burns inside the reactor to provide heat
needed to carbonize the remainder.
Type 2: Direct heat transfer from hot gases produced by combustion of
one or more of the pyrolysis products or any other fuel outside the reactor.
Type 3: Direct heat transfer from inert hot material (hot gases or sand
introduced into the reactor.

50
Type 4: Indirect heat transfer through the reactor walls (i.e. external heat
source due to combustion of one of or more pyrolysis products or any
other fuel)
2.3.2.1.3 Type 1 and 2
Type 1 typically defines the generic gasifier. The partial combustion of the feed
provides sufficient heat for the pyrolysis of the remainder thus a limited amount
of oxygen will be needed. As a result, a higher content of soot can be expected.
Type 2 on the other hand, proposes the combustion of the product gas within the
reactor. This concept, sounds straight forward and easy, however, the combustion
will require oxygen and this means oxygen/air will be fed directly into the reactor.
It is impractical to totally assume that none (absolutely 0%) of the oxygen will
come in contact with the feedstock as it is being heated. This also sets up a
gasification reaction.
2.3.2.1.4 Types 3 and 4
Theoretically, these ensure that there is no addition of oxygen to feedstock as it
decomposes under the heat. Traditionally, they work by the addition of heat
indirectly to avoid combustion in the reactor. This can be achieved by:
Heat exchange through the reactor walls via a heating jacket or double
pipe configuration
The use of hot shots. Hot shots are inert medium such as stainless steel
that are pre-heated and mixed in with the feedstock as they are fed into the
reactor.
Dielectric heating of feedstock.
Types 3 and 4 accurately represent the definition of pyrolysis which states that
carbonaceous matter decomposes under heat in the absence of oxygen.
2.3.2.1.5 Commercial Reactors
It is very hard to find many proven cases for biomass pyrolysis on a commercial
scale. Most biomass pyrolysis reactors used on an industrial scale are

51
predominantly used for carbonisation to produce charcoal. This means they will
most likely use slow pyrolysis. Bridgewater performed an excellent review of
pyrolysis reactor technology (Bridgwater 1999) In this paper Bridgewater
presented a summative table listing the types of reactors available as shown in
Table 13. An extensive list was presented recently by Crocker (2010) in Table 14
and a table of commercial carbonizers is presented in Table 15 as reported by
Dutta (2007).
Table 13. Pyrolysis reactors and heating methodsa (Bridgwater 1999).
Reactor Type Method of heating Organisation
Ablative coil Wall heating BBC [4]Castle Capitalc now Enervision [5]
Ablative mill Wall (disc) heating Colorado School Mines [6]
Ablative plate Wall heating U. Aston [7], CNRS—Nancy [8]
Ablativevortex Wall heating Interchem [9], NREL [10]
Auger kiln Wall heating U. Tubingen [11], WTC [12]
Circulating fluid bed In-bed gasification of char
to heat sand
CRESAgric. U. Athens [13]
Cyclone or vortex Wall heating CNRS-Nancy, See also Ablati6e 6ortex
Entrained flow Combustion products
Hot sand
Egemin (14), GTRI (15) U.Western Ontarioc
[16]
Fixed bed Combustion products
Partial gasification
Overfired gas
Bio-Alternative [17], Chemviron [18]
Alten [19], Italenergied
U. Cardiff [20]
Fluid bed Heated recycle gas
Hot inert gas
Partial gasification
Fire tubes
Dynamotive [21], INETI [22], IWC [23]
RTI [24], Union Fenosa [8], U. Hamburg [25]
U. Waterloo [26], Wellman, Worthing [27]
CPERI [28], NREL, U. Aston [29]
U. Leeds [30], U. Sassari [31], U. Stuttgart [32]
Alten [19], Italenergiec
MTCIc[33] AEIb, Pyrosolb [34], Wastechb
Horizontal bed Fire tubes U. Laval [35]
Multiple hearth Hearth heating Deutsche Babcockb, PKA b [36], Stenaub [37]
Rotary kiln Wall heating SiemensKWUb [38], Waste Gasb
Rotating cone Wall and sand heating U. TwenteBTGKARA [39]
Stirred bed Partial gasification Alten d [19]
Transported bed Recirculated hot sand Ensyn [40]
(& at ENEL, VTT [41], Red Arrow [42]
Vacuum moving
bed
Direct contact with hot
surface
U.LavalPyrovac [43]
a Organisations underlined are believed to be active in 1998. Except where indicated, all processes
gives liquids. A representative reference is provided.
b Used for solid waste processing, not liquids production.
c Used for gas production.
d Operational mode unclear.

52
Table 14. Research on pyrolysis reactors (Crocker 2010).
Reactor Type Industrial Units built Max size
kg/hr.
Research Max size
kg/hr.
Fluid Bed Agritherm, Canada
Biomass Engineering Ltd, UK
Dynamotive, Canada
RTI, Canada
2
1
4
5
200
200
8,000
20
Adelaide U ., Australia
Aston U., UK
Cirad, France
Curtin U., Australia
ECN, NL
East China U. Science and Technology, Shanghai, China
Gent U., Belgium
Guangzhou Inst. Energy Conversion, China
Harbin Institute of Technology
Iowa State U., USA
Monash U., Australia
NREL, USA
PNNL, USA
Shandong U., Technology
Shanghai Jiao Tong U.,
Shenyang ., U China
South East U., China
Texas A &M U., USA
TNO, Netherlands
U.Basque Country, Spain
U. Campinas, Brazil
U.Maine, USA
U.Melbourne, Australia
U.Naples, Italy
U.Science and Technology of China
U.Seoul, Korea
1
5
2
2
1
nk
0.3
10
nk
6
1
10
1
nk
1
1
1
42
10
nk
100
0.1
0.1
1
650

53
Table 15 Continued. Research on pyrolysis reactors (Crocker 2010).
Reactor Type Industrial Units built Max size
kg/hr.
Research Max size
kg/hr.
Fluid Bed U. Twente, Netherlands
U. Western Ontario, Canada
U. Zaragoza, Spain
USDA, ARS, ERRC, USa Virginia Tech. U., USA
Virginia Tech. U., USA
VTT, Finland
vTI, Germany
Zhejiang U., China
Zhengzhou U., China
nk
1
nk
nk
1
0.1
1
6
3
2
Ceramic ball downflow
Unspecified
U. Kentucky, USA
U. Texas, USA
Technical U. Compiegne, France
nk
nk
nk
Rotating cone Integral
catalytic pyrolysis
BTG, Netherlands
BioEcon, Netherlands + Kior USA
4
nk
2000 BTG, Netherlands
Battelle Columbus, USA
PNNL, USA
Technical U. of Munich
U. Massachusetts – Amhurst, USA
Virginia Tech. U., USA
TNO, Netherlands
Technical U. Denmark
10
1
1
nk
nk
3?
30
nk
Augur or screw Abritech, Canada
Lurgi LR, Germany
Renewable Oil Intl, USA
4
1
4
2083
500
200
Auburn U. USA
KIT (FZK), Germany
Mississippi State U., USA
Michigan State U. USA
Texas A&M U., USA
1.0
500
2
0.5
30
Vacuum Pyrovac, Canada 1 3500 None known

54
Table 15 Continued. Research on pyrolysis reactors (Crocker 2010).
Reactor Type Industrial Units built Max size
kg/hr.
Research Max size
kg/hr.
Vortex centrifuge
reactor Ablative
PyTec, Germany 2 250 Aston U., UK
Institute of Engineering Thermophysics, Ukraine
Latvian State Institute, Lativia
Technical U., Denmark
20
15
0.15
1.5
Microwave Carbonscape New Zealand & UK
Bioenergy 2020 + gmbh, Austria
nk
1
nk
nk
National Inst. Advanced Industrial Sci. & Technolo., Japan
Shandong U., China
Technical U., Vienna, Austria
U. Malaysia Sarawak
U. Minnesota, USA
U. Mississippi
U. Notingham, UK and China
U. York, UK
Washington State U.-Tricities, USA
<0.1
<0.1
nk
<0.1
10
nk
nk
nk
<1
Spouted fluid bed Ikerlan, Spain 1 10 Anhui U. Of Science & Technology, China
U.Basque Country, Spain
5
nk
Transported bed and
Circulated fluidised bed
Ensyn, Canada
Metso/UPM, Finland
8
1
4000
400
CPERI, Greece
Guangzhou Inst. Energy Conversion, China
U. Birmingham, UK
U. Nottingham, UK
VTT, Finland
1
nk
nk
nk
20
Radiative convective
entrained flow
CNRS – Nancy U., France
Dalian U., of Technology, China
Institute for Wood Chemistry, Latvia
Shandong U. of Technology, China
Chinese Academy of Science, Dalian, China
nk
nk
nk
0.05
nk
Moving bed and fixed
bed
3 600 U.Autonoma de Barcelona, Spain
U. Science & Technology of China
Shandong University of Technology, China
nk
~0.5
110

55
Table 15 Commercial carbonizers (Dutta 2007).
Reactor Type Description Diagram
Hereshoff Carbonizer Consists of four to six circular hearths stacked one
above the other inside a cylindrical refractory lined
shell. The raw material is fed to the uppermost hearth
and falls from one hearth to the lower under the
action of a rotating shaft which is fitted with rabble
arm at each hearth level. The normal operating
temperature of the hearth is 900 – 1000° C, and air
introduced for partial combustion passes upwards
through the furnace. Charcoal produced leaves the
furnace at the bottom and is cooled before storage.
The capacity of this type of carbonizer is in the range
of 4 – 10 tons of wood or other residues per hour.

56
Pillard Rotary Carbonizer The converter consists of an inclined rotary furnace.
A part of the pyrolytic gas is recycled and burned to
provide heat necessary for carbonization. The hot flue
gas comes in direct contact with the raw material
slowly moving down the inclined furnace.
Keil-Pfaulder Converter Normally used for batch carbonization of waste wood
with a cycle time of 6 –8 hours. The blower extracts
volatile products from the bottom of the converter.
The tar is separated from the gas by condensation
after which the gas is burned to provide heat for
carbonization. Oil is burned mostly during start-up

57
Cornell Retort Normally used for carbonising coarse residues.
Operation of the oil burner is thermostatically
controlled. Once carbonisation is well underway, the
volatile gases are burned and recycled.
Thompson Converter One of the oldest indirectly heated screw-fed
converters. It consists of a number of metal tubes
heated externally. The raw material is conveyed
through the heated tubes by means of screws and
gets carbonized in the process. The volatile gases
are fed into the burner so that the whole operation
becomes self-sustaining.

58
From a design point of view, each type of reactor has its limitations in regards to
applicable heating methods. Bridgewater further went on to classify the typical
form of heat transfer exhibited by the main reactor types as shown in Table 16
Table 16. Reactor types and heat transfer (Bridgwater 1999).
Reactor type
Mode of heat transfer Advantages/disadvantages/features
Ablative 95% conduction 4% convection 1% radiation
Accepts large size feedstocks Very high mechanical char abrasion from biomass Compact design Heat supply problematical Heat transfer gas not required Particulate transport gas not always required
Circulating fluid bed 80% conduction 19% convection 1% radiation
High heat transfer rates High char abrasion from biomass and char erosion leading to high char in product; char/Solid heat carrier separation required Solids recycle required Increased complexity of system Maximum particle sizes up to 6 mm Possible liquids cracking by hot solids Possible catalytic activity from hot char Greater reactor wear possible
Fluid bed
90% conduction 9% convection 1% radiation
High heat transfer rates Heat supply to fluidising gas or to bed directly Limited char abrasion Very good solids mixing Particle size <2 mm Simple reactor configuration
Entrained flow
4% conduction 95% convection 1% radiation
Low heat transfer rates Particle size <2 mm Limited gas/solid mixing
Lakeland Steel’s patented pilot plant 2.3.2.2
Lakeland has developed a screw type reactor for sawdust pyrolysis Figure 17. The
feedstock is force fed into an auger kiln which serves as the reactor using two
augers from the hopper. The kiln is indirectly heated to ~600°C using a shell and
tube arrangement and the products leave as hot volatiles and char. The char goes
down a small funnel (cyclone like) whilst the hot volatiles are passed through a
flash tank, which separates the heavy oils and tars. The vapour then flows through
a condenser where the remaining water vapour and oil condenses allowing the
syngas to go through. These auger reactors have the tendency of getting blocked
when the feedstock flow properties are not appropriate. For example, if the

59
feedstock has a high moisture content it will normally cake and compress in the
auger. Ways around this problem include increasing the force being applied by the
auger or by pre-drying the feedstock. Another concern with the plant is the lack
of syngas recycling. The current setup only allows for the syngas product to be
flared off.
Figure 17. Lakeland Steel Limited's pilot plant.

60
2.3.3 Heat Exchanging Technology
Pyrolysis is a highly endothermic process. A vast amount of energy is used to heat
up the feedstock to the reaction temperature and the decomposition and
carbonisation processes also require energy inputs.272 kJ/kg for drying and 148
kJ/kg for pyrolysis based on the initial feedstock mass prior to drying to 15%
moisture (Sichone 2012).However, a significant amount of this heat can be
recovered from the products via heat exchange. The recovery of this heat not only
increases the energy efficiency of the process, it also reduces the potential for
risks or hazards such as fires and explosions.
In most cases, the products (bio-oil, syngas, char) are being cooled. The biggest
barrier to efficient cooling of these products is ensuring that there is no mass
exchange between the heat exchange medium and the product. This is because
introduction of air or water might allow for oxygen to enter the process, resulting
in oxidation of the products, and in the case of char, potential fire.
Based on the process flow diagram in Figure 9 heat exchangers will be required
for the following:
Pre-drying of the feedstock
Indirect heat application in the reactor
Heavy volatile condensation
Light volatile condensation
Char cooling
Char cooling loop recovery
These operations are not all identical as they have different limiting factors such
as:
Operating temperature ranges – This is one of the most crucial variables as
it determines which heating methods or medium apply. For example steam
can be used for heating process temperatures up to approximately 100 °C
under atmospheric pressure. High pressure steam is more expensive due to
the increased pressure. Failure to sustain dry steam at high pressure can
cause corrosion problems.

61
Physical properties of the mediums involved - generally, the heat
exchanging medium phase change points (e.g boiling point, dew point)
will have to be verified to ensure there is no phase change. Some machines
such as pumps will become less efficient if a two-phase medium is used.
For the pyrolysis plant, heating is used to evaporate the water from the
feedstock, and melt, sublime or evaporate various components in the
feedstock during pyrolysis. Cooling is needed to condense the heavy and
light volatiles after the pyrolysis reaction, as well as to recover heat from
the char.
Prospective Heat exchangers 2.3.3.1
This section briefly describes the prospective heat exchanger types that might be
considered in a pyrolysis plant.
Heat Exchanger Type: Double pipe
Figure 18. Double pipe heat exchanger in counter-current flow1.
1 Viewed fron http://www.mapleprimes.com/view.aspx?sf=100529/317244/figure1_Double_Pipe_.png

62
Performance Description:
This is the simplest form of shell and tube heat exchanger, it is easy to maintain
and analyse. However, it requires large flow rates of heat exchange medium in
cases of high heat transfer. This is because it does not possess the same amount of
heat-transfer area per unit volume as a shell and tube heat exchanger of the same
shell dimensions.
This can be used to heat reactor walls because it allows for simple indirect heat
transfer. It can also be used for cooling jackets for the char and flash tank using
either water or air depending on the required amount of heat transfer. Water can
be used for higher heat fluxes.
The main limitation of using this heat exchanger is associated with not having
sufficient contact time for short length pipes. This can be countered by having a
helical path for the fluid in the shell.
Heat Exchanger Type: Shell and tube
Figure 19. Typical shell and tube heat exchanger (ACUSIM).
Performance Description:
The shell and tube design is commonly used because of its high heat-transfer area
per unit volume. This is achieved by placing a large number of small diameter
tubes inside a shell that doubles as a pressure vessel. The design of this heat

63
exchanger has been standardised by the Tubular Exchanger Manufacturers
Association (TEMA).
The shell and tube heat exchanger would have a low score in regards to
practicality for this process. The heat exchange is being used for phase change of
volatile products. Condensable volatiles such as bio oil and tars have high fouling
tendencies which will reduce heat exchange efficiencies and increase maintenance
costs associated with cleaning.
Ideally, since the condensate will be fouling, it could be passed through the shell
side, in accordance with design heuristics however this does not address the
corrosion issues associated with the bio-oil.
Heat Exchanger Type: Air cooled (fin-fan)
Figure 20. Air cooled (fin-fan)2.
Performance Description:
This type of heat exchanger is normally used in scenarios where water is scarce
and costly. The conventional design is made of pipes or tubes with fins attached to
increase the surface area available for heat transfer. This in turn lowers the outside
2 Viewed from http://images.books24x7.com/bookimages/id_26162/f0194-01_thm.jpg

64
thermal resistance so that it approaches the thermal resistance inside the tube. The
fluid passes through the tubes and the air blows across the tubes and fins.
This can be used for preheating of air intake in heat recovery operations from the
char or the oil product line. The product would pass through the pipe or tube.
Heat Exchanger Type: Compact
a) Plate-and-frame
Figure 21. Plate and frame heat exchanger3.
b) Spiral-plate
4
3 Viewed from http://2.bp.blogspot.com/_l-
cNNS3j7UU/S52ZVudIeTI/AAAAAAAAAOw/HSTL3RBoLfM/s400/movingheatexchanger.gif

65
c) Spiral-tube
Figure 22. Spiral tube heat exchanger cross section4.
A spiral tube heat exchanger uses multiple parallel tubes connected to pipe-like
manifolds to create a tube-side flow path.
d) Plate-fin
Figure 23. Plate-fin heat exchanger5.
4 Viewed from http://4.bp.blogspot.com/_l-
cNNS3j7UU/S52WIjiynjI/AAAAAAAAAOo/1radEZhTums/s200/Picture1.jpg
5Viewed from http://www.mxmach.com/wp-content/uploads/2011/06/plate-fin-2.gif

66
Performance Description:
As the name suggests, these heat exchangers are compact and occupy a small
space. They are normally used when the fluids exchanging heat need to be kept
clean. They have high heat transfer coefficients due to the corrugated plates on the
heat exchanger surfaces. The compact heat exchanger is used in applications
where a high heating flux is required without increasing thickness of the heat
exchange medium. By having a coil as the path or corrugated surfaces, the
residence time of the heat exchange medium is increased thus increasing the
amount of heat exchange for a fixed volume.
Design considerations 2.3.3.2
The heat exchangers described in the preceding section will have different levels
of appropriateness based on compatibility with the fluids exchanging heat. The
main fluids of concern will be the bio-oil (both light fraction and heavy fraction),
hot volatiles stream, syngas and water or air. The bio-oil is a very dirty, acidic
fluid. Other products from pyrolysis with the exception of the char can be treated
similarly. The air is the cleanest heat exchange fluid being used while water is
clean it still has the potential to foul and scale materials at elevated temperatures.
But water has high heat transfer capability. Consideration will be needed to
account for equipment corrosion, temperature crossover and fouling.
2.3.3.2.1 Corrosion
The bio-oil has been identified to be corrosive due to its acidic pH ranging from
~2-4. Basu (2010) offers the following solutions:
Contact avoidance
Corrosion-resistant barriers
Process adjustments
Corrosion resistant materials
The most practical solution in this case appears to be material selection. It should
be noted that there will be a trade-off between heat exchange performance due to
conductivity potential and corrosion resistance.

67
Materials used in heat exchangers will depend on the type of heat exchanger being
deployed and the materials being processed. For example, in cases where biomass
is being processed, it is advised that the material being used does not promote the
formation of biofilms as these generally increase the potential for fouling to occur.
Table 17. Common materials used in heat exchangers (Intelligence 2012).
Material Comment
High conductivity coppers Best heat exchange, but poor corrosion resistance.
Brasses Poor corrosion resistance
Wrought martensitic stainless
steel
Good performance but heavier than copper
Aluminium bronzes An economical and practical choice
Basu (2010) presented a list of materials in order of least-to-most corrosion
resistance:
Stainless steel
Nickel-based alloys
Titanium
Tantalum
Niobium
Ceramics
Traditional ceramics cannot be considered due to their poor thermal properties
which might lead to difficulties such as thermal shock. Thermal shock is the
fracture mechanism experienced by traditional ceramics due to rapid uneven
heating or cooling.
2.3.3.2.2 Temperature Crossover
The biggest barrier to be faced in recovering heat in the process is upgrading low
grade heat. It is not possible to use heat from a low temperature to heat a process
at a higher temperature without the use of a heat pump. Industrial heat pumps can
be used for temperatures of up to ~ 240°C

68
Figure 24. Heat cross exchange schematic.
The temperature vs position graph (Figure 24) shows an extreme case of
temperature cross-over where the cold stream is heated past the initial temperature
of the hot stream. This is not practically feasible without the aid of the heat pump.
Further on, heat exchange is more efficient when the temperature difference
between the target temperatures of the two streams is above the minimum
approach temperature threshold. The value of the minimum approach temperature
will depend on properties of the two substances exchanging heat but is typically
around 10 to 20°C for liquids and can be higher for gases due to the lower heat
capacities (Peters 1991, Moyers. and Baldwin 1999, Branan 2005). Having a high
approach temperature will facilitate faster heat exchange due to a higher
temperature driving force.
2.3.4 Syngas Recovery System
Similar to coal, biomass pyrolysis is associated with the liberation of many
unwanted gases. These unwanted gases may include hydrogen sulphide (H2S),
nitrous oxides (NOxs), polycarbonate aromatics poly aromatic carbons (PAH), etc.
Classification of compounds developed by the Energy Research Centre of the
Netherlands is presented in Table 18.
40
100
80
25
0
20
40
60
80
100
120
0 2 4 6 8 10
Tem
pe
ratu
re (
°C)
Distance along heat exchanger (m)
C
H

69
Table 18. Tar classification system defined by the Energy Research Centre of the
Netherlands (ECN).
Class Type Examples
1 GC undetectable tars. Biomass fragments, heaviest tars (pitch)
2 Heterocyclic compounds. These are components that generally exhibit high water solubility.
Phenol, cresol, quinoline, pyridine
3 Aromatic components. Light hydrocarbons, which are important from the point view of tar reaction pathways, but not in particular towards condensation and solubility.
Toluene, xylenes, ethylbenzene (excluding benzene)
4 Light poly aromatic hydrocarbons (2‐3 rings PAHs). These components condense at relatively high concentrations and intermediate temperatures.
Naphthalene, indene, biphenyl, antracene
5 Heavypolyaromatichydrocarbons(≥4‐rings PAHs). These components condense at relatively high temperature at low concentrations.
Fluoranthene, pyrene, crysene
6 GC detectable, not identified compounds. Unknowns
These gases will need to be extracted before the syngas can be used in most
applications with the exception of direct combustion (Rezaiyan and Cheremisinoff
2005, Sharma, Dolan et al. 2008, Könemann 2009, Anis and Zainal 2011). This
involves macroscopic techniques such as dust removal, dehumidification and
scrubbing. Scrubbing is the extraction of unwanted compounds from the raw gas
in an attempt to obtain a gas of higher quality. Compared to raw gas, higher
quality gas has a higher specific heating value; produces cleaner combustion
emissions and fewer issues with handling in regards to human health, corrosion
and fouling of equipment. It is for these reasons that the presence of tars and
particulates in syngas are seen as the biggest barrier faced by bio-syngas in its
acceptance as a reliable fuel (Rezaiyan and Cheremisinoff 2005, Sharma, Dolan et
al. 2008, Könemann 2009, Anis and Zainal 2011).
Gas cleaning technologies can be split into three groups depending on the
principles or separation.
Physical/ mechanical separation
Catalytic cracking
Thermal cracking
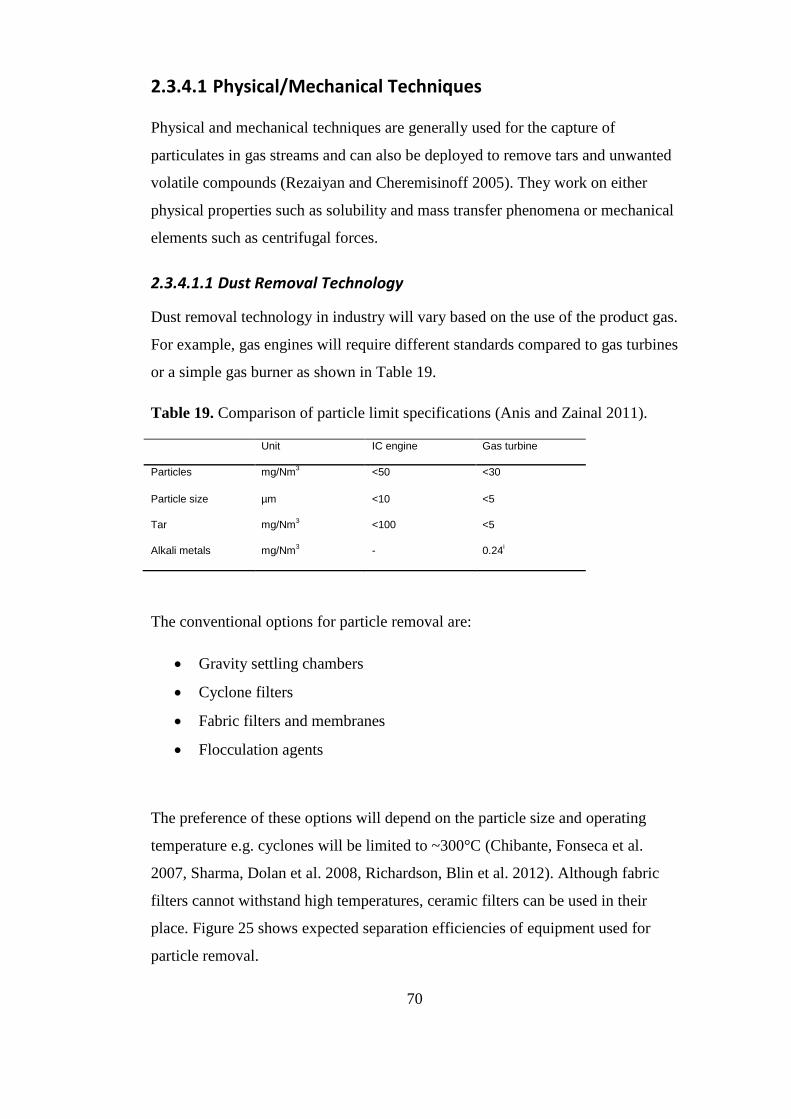
70
Physical/Mechanical Techniques 2.3.4.1
Physical and mechanical techniques are generally used for the capture of
particulates in gas streams and can also be deployed to remove tars and unwanted
volatile compounds (Rezaiyan and Cheremisinoff 2005). They work on either
physical properties such as solubility and mass transfer phenomena or mechanical
elements such as centrifugal forces.
2.3.4.1.1 Dust Removal Technology
Dust removal technology in industry will vary based on the use of the product gas.
For example, gas engines will require different standards compared to gas turbines
or a simple gas burner as shown in Table 19.
Table 19. Comparison of particle limit specifications (Anis and Zainal 2011).
Unit IC engine Gas turbine
Particles mg/Nm3 <50 <30
Particle size µm <10 <5
Tar mg/Nm3 <100 <5
Alkali metals mg/Nm3 - 0.24
i
The conventional options for particle removal are:
Gravity settling chambers
Cyclone filters
Fabric filters and membranes
Flocculation agents
The preference of these options will depend on the particle size and operating
temperature e.g. cyclones will be limited to ~300°C (Chibante, Fonseca et al.
2007, Sharma, Dolan et al. 2008, Richardson, Blin et al. 2012). Although fabric
filters cannot withstand high temperatures, ceramic filters can be used in their
place. Figure 25 shows expected separation efficiencies of equipment used for
particle removal.
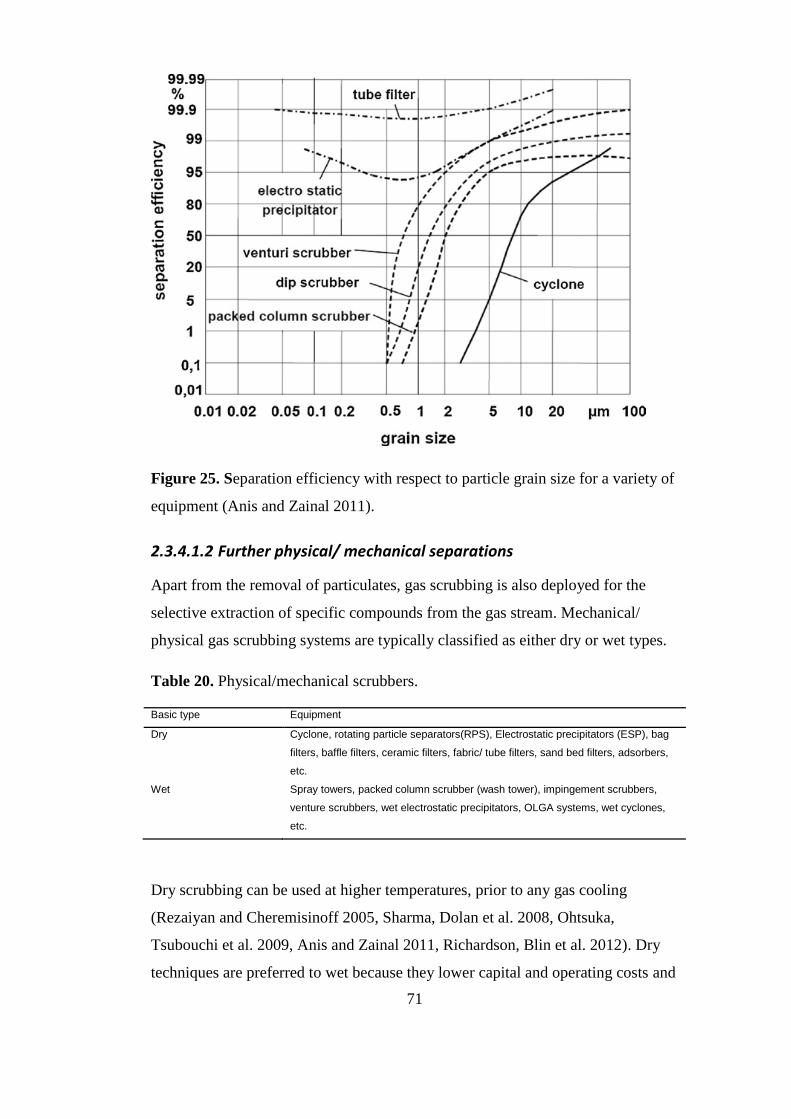
71
Figure 25. Separation efficiency with respect to particle grain size for a variety of
equipment (Anis and Zainal 2011).
2.3.4.1.2 Further physical/ mechanical separations
Apart from the removal of particulates, gas scrubbing is also deployed for the
selective extraction of specific compounds from the gas stream. Mechanical/
physical gas scrubbing systems are typically classified as either dry or wet types.
Table 20. Physical/mechanical scrubbers.
Basic type Equipment
Dry Cyclone, rotating particle separators(RPS), Electrostatic precipitators (ESP), bag
filters, baffle filters, ceramic filters, fabric/ tube filters, sand bed filters, adsorbers,
etc.
Wet Spray towers, packed column scrubber (wash tower), impingement scrubbers,
venture scrubbers, wet electrostatic precipitators, OLGA systems, wet cyclones,
etc.
Dry scrubbing can be used at higher temperatures, prior to any gas cooling
(Rezaiyan and Cheremisinoff 2005, Sharma, Dolan et al. 2008, Ohtsuka,
Tsubouchi et al. 2009, Anis and Zainal 2011, Richardson, Blin et al. 2012). Dry
techniques are preferred to wet because they lower capital and operating costs and

72
requiring less space , with acid removal efficiencies higher than 90% (Chibante,
Fonseca et al. 2007) For example fine dispersed powder is fed into the gas stream
in one end of the vessel and specific compounds including tars in the gas react and
adsorb onto the particle surface. The high temperature promotes reactivity of the
powder and compounds and the products are removed via a cyclone at the exit.
Alternatively, through task integration, the cyclone can be used as a reactor. Liu et
al (2002) provides a list of reactions that can be used to describe dry scrubbing of
acid gasses using Ca(OH)2.
(12)
(13)
(14)
(15)
(16)
(17)
(18)
(19)
(20)
Wet scrubbing is generally more effective at particle and tar removal due to the
higher rates of mass transfer associated with a liquid medium compared to a solid.
They work using the principle of solubility (Sharma, Dolan et al. 2008). Water,
being relatively cheap is the generic scrubbing fluid used, however, this is
normally associated with poor performance due to saponification, poor
regeneration efficiency, low solubility of hydrocarbon compounds, clogging of
apparatus and high expense of wastewater treatment of the sludge product. These
can usually be countered by using an organic fluid as the scrubbing medium.
Emulsions containing cooking oil or diesel oil are good alternatives as the oil
additives support the solvent’s tar cleaning properties and reduce fouling (Sharma,
Dolan et al. 2008, Anis and Zainal 2011).

73
Wet scrubbing can also use aqueous solutions which may contain alkaline salts or
amino-based compounds (Kapdi, Vijay et al. 2005). The ions in these solutions
react with impurities and the products are precipitated and separated from the
liquid phase. As in the case with flue gas desulphurisation (FGD) systems,
Ca(OH)2 (lime) slurry, the reaction also produces CaSO3 (calcium sulfite) and can
be expressed as:
(21)
In the case where a Mg(OH)2 (magnesium hydroxide) slurry is used, the reaction
produces MgSO3 (magnesium sulfite) and can be expressed as:
(22)
Prospective mediums for extaction of contaminants include:
Water
Oil water emulsions
Monoethanolamine (MEA)
Diethanolamine (DEA)
Digylcolamine (DGA)
Methyldiethanolamine (MDEA)
Sodium hydroxide
Potassium hydroxide
Calcium hydroxide
Magnesium hydroxide
Catalytic Cracking 2.3.4.2
Cracking is the process by which tars are broken down from heavier organic
molecules into lighter ones. Catalytic cracking works on the principle of
introducing another chemical either during the bio-syngas production stage or
after to facilitate the formation of smaller molecules from heavier ones. When
present in the production stage a catalyst might also inhibit the formation of tars to
an extent and promote the selectivity of syngas components.

74
Sutton et al (2001) provides the following specifications for catalysts:
1. The catalysts must be effective for removing tar
2. If the desired product is syngas, the catalysts must be capable of reforming
methane
3. The catalysts should provide a suitable syngas ratio for the intended
process
4. The catalysts should be resistant to deactivation as a result of carbon
fouling and sintering
5. The catalysts should be easily regenerated
6. The catalysts should be strong
7. The catalysts should be inexpensive
There has been a lot of research on potential catalysts for tar removal from syngas.
Anis and Zainal (2011) have done a very good review on the use of catalytic
cracking and has classified them into six groups
1. Nickel-based catalysts
2. Non-nickel metal catalysts
3. Alkali metal catalysts
4. Basic catalysts
5. Acid catalysts
6. Activated carbon catalysts
The last category should be noted because the production of char. Char is
predominantly made of carbon; therefore it will have similar properties. However,
activated carbon has a higher pore density compared to normal char.
Anis and Zainal (2011) go further and lists some equipment used for catalytic
cracking of tar, highlighting the normal operating conditions and performance
(Table 21).

75
Table 21. Catalytic cracking equipment (Anis and Zainal 2011).
Temperature
(°C)
Particle reduction
(%)
Tar reduction
(%)
Sand bed filter 10 – 20 70 – 99 50 – 97
Wash tower 50 – 60 60 – 98 10 – 25
Venturi scrubber 50 – 90
Rotational atomizer <100 95 ± 99
Wet electrostatic precipitator 40 – 50 >99 0 – 60
Fabric filter 130 70 – 95 0 – 50
Rotational particle separator 130 85 - 90 30 – 70
Fixed bed tar adsorber 80 50
Catalytic tar cracker 900 >95
Thermal Treatment 2.3.4.3
2.3.4.3.1 Thermal Cracking
Thermal cracking involves holding the tars at high temperatures of 700 – 1250°C
for a specified residence time. The high temperature excites the tar molecules
reducing the stability of the molecules, favouring the formation of the smaller
compounds (Ohtsuka, Tsubouchi et al. 2009, Anis and Zainal 2011). It is fairly
obvious to see why this technique is seldom used because it will require the
product gas to be held at temperatures much higher than those used in the
pyrolysis reactor for long periods of time. With increased residence time the
volume of the reactor will need to increase..
Other Syngas Recovery Design Concerns 2.3.4.4
This section considers other aspects related to syngas recovery past the need to
keep it clean and reliable.these include; processing characteristics such as pressure
and flow regulation; and hazard management of fires, explosions, toxic gas
emissions and material handling concerns. Pressure and Flow Regulation
The decomposition rate of the feedstock varies based on the residence time and its
instantaneous temperature. This means that the production of volatiles will vary,
therefore post processing of the syngas will need to account for this. A buffer
system, such as a pressurised holding tank, can be used to minimise the effects of
fluctuating production rates, and release the gas at a controlled flow rate (Apt,
Newcomer et al. 2008).

76
2.3.5 Hazard Management
The pyrolysis process, by definition should be designed to ensure that no air
enters the system. Having an air-tight system will ensure there are only minute
product losses. However, achieving this may not be feasible, therefore the plant
should be designed to cater for any spillage or escape of materials in a safe
manner (Peters 1991, Moyers. and Baldwin 1999, Branan 2005, Rezaiyan and
Cheremisinoff 2005). The main hazards associated with the process in order of
likelihood are; fires, explosions and toxic release. They are ordered in this way
because even though toxic release is potentially more dangerous to life than an
explosion which in turn might injure more people more severely than a fire, fire is
the most frequently occurring hazard and that explosion certainly and toxic release
possibly are usually consequences of serious fires (Thompson 1995).
Fires 2.3.5.1
The pyrolysis system will operate under anaerobic conditions. This means there is
a higher risk of fires being caused by extreme temperatures and flammable gas
escape from the reactor. Pipeline pressures can be monitored continuously to
assess for any leaks.
Explosions 2.3.5.2
Other than fires, there are two main contributors to explosions in pyrolysis units
are dust and syngas instability. Fine particles from the char dust can
spontaneously combust and explode. Gas clean-up technologies such as cyclonic
filters can be installed to minimise this risk.
Toxic Gas Emissions 2.3.5.3
Pyrolysis of biomass at temperatures below 600°C has been known to produce
PAHs, PCBs, dioxins and other toxic compounds that will pose a threat to human
health and can also be classified as greenhouse gases. These can be directly
oxidised via combustion in the burner or extracted using a scrubber.
77
Material Handling Issues 2.3.5.4
Traditionally most of the required hazard management systems are integrated into
the system design. This makes the system slightly more complex but also cheaper
to run in the long run. The aim of the integration is to allow as much automation
of the process as practically feasible so that the plant operators are not put in a
scenario where they have to come in contact with toxic compounds. E.g. gas
recovery systems are designed to be airtight. Any pressure vessels used for
storage will have pressure release valves and also be designed to leak before
explosion. More details of material handling practices can be found in the
Appendix under MSDS for fine sawdust.
2.4 Process Economics
Pyrolysis has been the focus of many ventures in industry; however, many plants
usually end up unsuccessful due to the endothermic demands overwhelming the
economic feasibility of the process.
Capital costs will mainly comprise of equipment used to set up the plant. Other
costs will include resource consents, working capital that will be used to
commission the plant and technology licenses.
The economic model for the pyrolysis process is based the cash-flow streams
shown in Figure 26.
The effects of the specified cash-flow streams will be dependent on the feedstock
type being considered. This is because the independent variables have different
boundary conditions for each feedstock (Sichone 2012). Charts can be plotted for
a number of cases which will include sensitivity analyses of variables that affect
the highlighted cash-flow streams to determine the conditions needed to achieve
an economically viable pyrolysis process.
A flexible economic model will provide information on the fixed and independent
variables. This will allow for easy adjustment of the variables to determine which
variables can be manipulated in order to achieve economic feasibility. Following

78
list shows the main variables that affect the pyrolysis process cash-flow streams as
identified in the author’s previous studies (Sichone 2012).
Figure 26. Directional schematic of cash-flow streams that can be associated with
economics of pyrolysis (Sichone 2012).
Independent Variables
Initial moisture content – This will determine whether the feedstock needs
to go through any dehydration processes prior to being fed into the reactor.
Drying is an expensive process therefore it would be preferred
Pre-dried moisture content – in combination with the initial moisture
content this will determine the amount of energy used to pre-dry the
feedstock and also determines how much moisture is allowed into the
reactor.
Annual feedstock consumption – This will determine the scale of
operation. Previous studies such as the Waikato Regional Council and
partners’ pyrolysis project have shown that the scale of operation will
Pyrolysis
ETS Carbon Credits
Other Operating Costs
Energy Requirements Capital Costs
Transportation to pyrolysis plant
Product Sales e.g char, energy,
oil etc.

79
affect the profitability of the process. The larger the plant capacity, the
more likely it is to be economically viable.
Reactor operating temperature – This will affect the quality of the products,
the yields and costs incurred in terms of heat demand. The options for heat
delivery can also be affected by the reactor operating temperature.
Process efficiencies – Process efficiencies are generally limited by
technology and processing parameters. The economic model will be
designed to use a range of process efficiencies reported by literature and
compare them to those of the pilot plant. This way the feasibility
assessment will provide results for the pilot plant setup and show the
maximum and minimum predicted by literature values.
Biochar price – the biochar selling price is still unknown but a market scan
focussing on biochar produced from woody biomass will be conducted to
show the potential revenue that could be generated.
Energy pricing rates – these rates will be based on current energy rates but
can be adjusted for future calculations using the marketing trends.
Procurement costs – The sawdust currently has a value of $4 per tonne.
This procurement cost will be weighed up against the revenue potential of
the pyrolysis products. To assess the profitability of pyrolysis as a means
of maximising the value of the sawdust. This cost does not consider the
cost of transportation.
Effluent Disposal costs – The process will deploy recycling as much as
possible to reduce the amount of waste produced. However in the case
where waste such as processing water needs to be disposed. Disposal costs
such as material handling and resource consents will be incurred.
2.4.1 Current Market Scan
There has been little evidence of commercial biomass pyrolysis ventures. The few
ventures cited typically give little information. However, based on the literature
viewed a number of active pyrolysis projects that have been started or are in the
start-up process are listed in Table 22.

80
Table 22. Current commercial pyrolysis ventures.
Company Technology Market Cap Description
Best Energies Inc Pyrolysis/
Gasification
Wide range of domestic, industrial and agricultural residues/wastes for
Char and Syngas, (no oil) Demonstration 300kg/hour
International Environmental
Solutions Corp
n/r All types of biomass, Electricity and other saleable by-
products,Demonstration 50 tonne/day
Taylor Biomass Energy
Recycling
Gasification n/r Construction and demolition debris, waste wood, MSW for Syngas
product, Unknown scale
Pacific Pyrolysis n/r Industrial/Agricultural residues and wastes by Agrichar Syngas for
electricity and heat , Demonstration at Somersby, NSW
Renewable Oil Corporation Pty
Ltd
Pyrolysis/
Gasification
n/r Woody biomass to BioOil 70%, Electricity, heat, char, value added
chemicals for Dynamotive
Crucible Carbon n/r Lignocellulosic feedstocks (Agri and forestry residues) Energy (Syngas)
and char for Demonstration 100-400 kg/hr
KIOR BFCC ~$1 billion “BiomassFluidCatalyticCracking”is2stepcontinuousprocess.
Pilot unit – 9000 hours, .025 BDT/day, 250 catalyst systems tested .
Demo unit – 3000 hours, 10 BDT/day, produced 32k g (762 bbl) RCO.
First Commercial Unit – 500 BDT/day, $222MM (including hydrotreater).
- Originally targeted at $190MM and delayed from early 2011 to mid 2012
Ensyn Pyrolysis Private PatentedRapidThermalProcessing(RTP™)Technology. Renfrew,
Ontario Plant - 100 TPD Capacity. Upgrading UOP partnership called
Envergent
Rentech Gasification/Fischer-
Tropsch
$450 million Patented Technology To Produce Synthetic Fuels (Primarily Petcoke
Feedstock But Can Use Biomass).
Sand Creek, Colorado - Demonstration Plant In Operation .
Natchez, Mississippi - Announced Plans In June 2008 To Build 1,600 BPD
in 2011
to date there is no update on progress

81
Table 22. Current commercial pyrolysis ventures.
Company Technology Market Cap Description
Dynamotive Pyrolysis $45 million Patented Technology Proven With 4 Plants (2 Pilot & 2 Commercial).
West Lorne, ON – 130 TPD / Guelph, ON– 200 TPD Capacity. Upgrading
IFPen / Axens Partnership! Most advanced value chain / market reach
through AXENS worldwide with oil refiners.
Choren Gasification/Fischer -
Tropsch
Private 3.9 Million Gallons / Year Synthetic Diesel Plant Commissioned in Dec
2009. Feedstock Is Forest Residue And Wood Wastes

82
2.4.2 Pyrolysis Technology Patent Citation Report
In addition to the market scan, a patent search will also provide a good
understanding of progressive trends in the field of biomass pyrolysis development.
The patent search was conducted using the American Chemical Society (ACS)
database.
Initially, English and patents options were used as limiters, the following key-
word phrases were used:
‘biomass pyrolysis’
‘biomass gasification’
‘biomass torrefaction’
‘biomass conversion’
The search results were categorized yearly to give a general indication of the trend
of interest in biomass conversion technology. Language limiters were removed to
give a broad global understanding of the development of the technology.
The patent search showed that biomass gasification has twice the number of
patents as biomass pyrolysis despite the former being noted as less
environmentally friendly (Table 23). Biomass gasification has proven to have
higher economic favourability as the products are normally gas and electricity
which are easily marketable. Biomass pyrolysis has been noted to provide
environmental benefits via carbon sequestration and other soul related
bioremediation approaches and alternative liquid fuels such as biodiesel. However,
the market for these products has not been established and as a result cannot
compete with gasification products market.
Table 23. Patent search hits for a combination of keywords.
Keyword References containing keyword as
entered
References containing the concept
of the keyword
1 1,2 1, 1,2
Biomass pyrolysis 170 494 434 1,439
Biomass gasification 217 1,248 599 2,801
Biomass torrefacation 63 83 63 83
Biomass conversion 214 157 822 459
1: Only English text
2: No Language limiters

83
Biomass torrefaction recieved the least number of patent applications. This is
because torrefaction is a very simple process. It is commonly used for coffee
roasting and wood processing for furniture. In the case of coffee roasting the
coffee beans are dried and lightly roasted to enhance their flavour and brittleness
for easier grinding. In the case of furniture wood processing, torrefaction is used
to realign the fibrous structure as it dries. This allows for manipulation of shape/
warping for aesthetic and more importantly mechanical benefits. Other
applications for torrefaction include pellet production and manufacturing or wood
based composite materials such as medium-density fibreboard (MDF).
Biomass conversion showed the least promising results despite having more than
that of the preceding search. This is because a large majority of the patents cited
see biomass conversion subject as a chemical/bio-chemical process where
digesters and chemical solutions are used to break down the biomass. The patents
were not necessarily relevant to the scope of the thesis. However, they add
another dimension to alternative pathways for biomass conversion.
The overall trend showed an increase in the development of these technologies
(Figures 27 to 30). The earliest relevant patent on record according to the ACS
database was given in 1982, following the oil crisis of 1970s (Slesser. and Lewis.
1979, Boyles 1984). There seemed to be little interest in biomass pyrolysis
technology up to the late 2000’s.
Figure 27. Biomass pyrolysis patent yearly application count (a) to the left
English patents only (b) to the right all patent search results no language limiters.
0
10
20
30
40
50
20
12
20
09
20
06
20
03
20
00
19
96
19
91
19
87
19
82 0
50
100
150
200
250
300
350
20
12
20
09
20
06
20
04
20
02
19
86
19
96
19
89
19
94
19
87
19
91
19
81

84
Figure 28. Biomass gasification patent yearly application count (a) to the left
English patents only (b) to the right all patent search results no language limiters.
Figure 29. Biomass torrefaction patent yearly application count (a) to the left
English patents only (b) to the right all patent search results no language limiters.
Figure 30. Biomass conversion patent yearly application count (a) to the left
English patents only (b) to the right all patent search results no language limiters.
0
20
40
60
80
100
20
12
20
09
20
06
20
03
20
00
19
97
19
94
19
91
19
86
19
83
19
80
0
100
200
300
400
500
600
20
12
20
08
20
04
20
00
19
96
19
92
19
88
19
84
19
80
0
5
10
15
20
25
30
352
01
2
20
11
20
10
20
09
20
08
20
07
20
05
0
10
20
30
40
50
20
12
20
11
20
10
20
09
20
08
20
07
20
05
0
20
40
60
80
100
20
12
20
09
20
06
20
03
20
00
19
97
19
94
19
91
19
87
19
84
19
81
0
20
40
60
80
100
120
140
160
20
12
20
08
20
04
20
00
19
96
19
92
19
88
19
84
19
79
19
71

85
Biomass pyrolysis and gasification have been around for centuries however, it
was rendered unviable by the discovery of fossil fuel reserves which initiated the
industrial age. The oil shortage crisis of the 1970’s initiated an interest in the
commercialisation of this technology as fossil derived fuel prices increase and the
perceived limited abundance of fossil fuel reserves. The Kyoto protocol was
signed in 1997 and scheduled to be in effect in 2005 might have boosted interests
in green energy technology and thus government and private institutions funded a
lot research in this topic.
Based on the observation of global events and trends at the critical points in time
during the development of biomass pyrolysis technology thus far, it is obvious
that political views play a huge role in the perception of this technology.
The patent search has shown a dip or plateau after the year 2010. Although it
might be too early to comment on this, the following reasons might explain this:
It appears the delay in implementing Kyoto protocol legislation and a
carbon trading market has reduced the investment in this sector.
The number of successful commercial ventures upscaled from research
and lab scale findings is limited. Many patents have been demonstrated on
lab scale and sometimes even up to a pilot plant scale. A saturation of
unproven technology in the intellectual property market might be
discouraging to potential investors.
The current economic recession which was declared mid-2008 might have
caused a shift in focus for most governments. Finding quick and direct
remedies to declining economies proved to be a higher priority.
The technology being presented in these patents is technically important for the
growth of this sector. However, the next step logical move would be to develop a
product that can be commercialised.
2.5 Summary
The literature review has confirmed that there has been a lot of research done on
biomass pyrolysis. A large part of this research is solely based on understanding
86
the nature of this complex process. Predicted energy demand forecasts have
highlighted the need for the development of this technology.
Whilst this is meaningful, and technically important, the issue at hand remains to
be the missing link which will aid in converting the knowledge gained from all
this research into commercial schemes that are at par or at least comparable to the
bar for clean energy set by schemes such as wind or geothermal.
Most of the equipment used in biomass pyrolysis processing plants is based on
equipment used in coal, oil and gas plants.
The poor economics of the process are caused by a lack of market for the biochar
and bio-oil. The stalling of the carbon trading scheme is proving to be a hindrance
to the commercialisation of pyrolysis. Another aspect that has been identified is
the sensitivity of the economics to the scale of operation. A number of preliminary
economic feasibility assessments have theoretically proven that by increasing the
scale of a process the profits increase at a higher rate than the operating costs.
Based on the ethanol production scheme in Brazil, it is clear that a large scale will
improve process economics. Social integration of the plant could also improve
chances for economic feasibility. Social integration relates to collaborative efforts
such as waste heat being sold to neighbouring plants.

87
Chapter 3.
Methodology

88
3.1 Introduction
This chapter presents the methods used for the experiments reported in this thesis.
There are three main areas of experimental work:
1. Feedstock characterisation – This included determining characteristic
properties of the feedstock such as, moisture content, ash content, calorific
value, and elemental composition analysis. The drying characteristics and
decomposition reaction kinetics were also investigated.
2. Pilot plant trials – This involved pyrolysis of sawdust using the Lakeland
Steel pilot plant at different processing conditions by manipulating
moisture content, reaction temperature and auger speed. The product
yields for the different configurations were collected to investigate the
main effects and compound effects using a three factor-three level
experiment approach.
3. Product characterisation – this was similar to feedstock characterisation
and involved determining product characteristics such as, moisture content,
ash content, calorific value, and elemental composition analysis.
3.2 Reagents
Pine sawdust provided by Lakeland Steel was used as the feedstock. This was
directly used in feedstock characterisation experiments and the pilot plant trials.
The product characterisation experiments used the biochar, and syngas. A batch of
oil was also analysed. The analysis techniques did not need the addition of other
reagents with the exception of pure nitrogen and a standard used for calibration of
the GC.
3.3 Equipment
In addition to the pilot plant provided by Lakeland Steel limited, the following
equipment was used:
• Contherm digital series oven

89
• Jetlow Shimaden SR53 Furnace
• TA Instruments SDT 2960 Simultaneous DTA-TGA
• Perkin Elmer Autosystem Arnel gas chromatography system
• Perkin Elmer Ramanstation 400F series raman spectrometer
• Third party institutions – Campbell Labs, Otago University
• Lakeland Steel Ltd kiln
• Picolog thermal data log
3.4 Feedstock Characterisation Experiments
3.4.1 Proximate Analysis
Moisture Content 3.4.1.1
Samples were placed in pre-weighed crucibles and mass measured using a 4 d.p.
balance. Moisture content analysis of the samples was determined by drying at
105°C until the sample was a constant mass. The total moisture content was
calculated by the difference between wet and dry weight divided by the wet
weight.
Ash Content 3.4.1.2
Pre-dried samples were placed in pre-weighed crucibles and mass measured using
a 4 d.p. balance. Ash content was determined by heating the samples up to 600°C
for three hours in a Jetlow Shimaden SR53 Furnace. The change in mass was
recorded and ash content was calculated by dividing the ash weight by the initial
weight.

90
3.4.2 Ultimate Elemental Analysis
Elemental analysis of sawdust was performed by Campbell Labs at Otago
University, New Zealand. The analysis determined C, H, N, S and O was
calculated by difference. Campbell Labs were also able to provide calorific values.
3.4.3 Sawdust Drying Curves
Sawdust drying curves were determined using a Contherm digital series oven. The
drying was performed at three different temperatures and mass loss with time was
recorded. The sample surface area was also recorded to determine the water loss
flux with respect to cross section area. The drying curves were fitted using four
different drying models:
Newton (23)
Page (1949) (24)
Henderson and Pabis (1998) (25)
Simpson and Tschernitz (1979) (26)
Where; MR is moisture ratio, C1 is a constant, t is time, C2 is another constant and
τ is the time constant.
Quality of fit was determined by measuring the sum of squared errors. The most
accurate model was used to calculate the required drying time for the large scale
dryer.
3.4.4 Thermogravimetric Analysis
Thermo-gravimetric analysis of sawdust was performed up to 900°C at three
different heating rates using the TA instruments SDT 2960. The analysis was
performed under an argon atmosphere with a purge flowrate of 150mm3/min.
Analysis of the data was performed in Matlab using gaussian distribution
activation energy models (further described in section 4.2.4).

91
3.5 Pilot Plant Trials
3.5.1 Design of Experiments
Pyrolysis of biomass can be a very broad assignment because of the versatility of
the products. As a result, the products can be used for a number of applications.
The process can be modified by identifying the driving variables and
manipulating them to optimise a desired result.
Studies of biomass pyrolysis are yet to define a universal model for pyrolysis
therefore each feedstock case has to be treated individually. Pseudo reactions are
currently being used to generalise the pyrolytic process, however, there may lie
variation within the feedstock options based on source of origin. This would mean
extensive experimental setup would have to be set up to investigate the effect of
the driving variables on the pyrolysis process.
The design of experiment will look at systematically reducing the number of
variables to be investigated based on the main effects they can have on the process.
3.5.2 Variables for Pilot Plant Trials
From previous studies done on organic wastes such as biosolids, paunch waste
and chicken DAF sludge (Berg., Sichone. et al. 2011, Sichone 2012), it had been
determined that the main driving variables are pyrolysis temperature, feedstock
moisture content and feed rate. The effects of these factors were investigated on:
Char, syngas, and oil yields
Fixed carbon in char
Syngas composition
A three level-three factor experiment was carried out using the parameters shown
in Table 24.

92
Table 24. Three factor-three level range assignment.
Level Moisture (%) Temperature (°C) Throughput (hertz)
0 15% 400 15
1 30% 450 20
2 60% 500 25
The number of trials needed to produce enough data to investigate these factors
using three levels is 27. Table 25 shows the possible combinations required.
Table 25. Three factor-three level combination setup.
Factor A
Factor B Factor C 0 1 2
0 0 000 100 200
0 1 001 101 201
0 2 002 102 202
1 0 010 110 210
1 1 011 111 211
1 2 012 112 212
2 0 020 120 220
2 1 021 121 221
2 2 022 122 222
With the cost and time required per experiment each setup was repeated once.
This means there will be a total of 54 trials.
This experiment model was designed under the assumption that the cost of syngas
analysis was fixed due to the procurement of an gas chromatography unit for
syngas analysis. This is because the cost of analysis via CRL proved to be outside
the budget for the project. The availability of the department’s GC equipment
meant the three level analysis could be afforded.

93
3.5.3 Experimental Setup and Procedure
The pilot plant trials involved:
Processing the feedstock at nominal conditions.
Repeating the pilot plant trials at conditions different from nominal
conditions as described in the experimental procedure for the three factor-
three level approach.
Collection of mass and energy balances
Collecting and characterising products for composition and energy content.
3.6 Product Characterisation
Proximate and ultimate analysis of products was performed using the same
methods used in feedstock characterisation.
3.6.1 Syngas Gas Chromatography Analysis
Gas chromatography analysis was performed for the syngas samples to evaluate
their composition and calorific value. The analysis was predominantly performed
using a Perkin Elmer Autosystem Arnel gas chromatography system, capable of
measuring H2, CH4, O2, N2, CO2 and CO. The system was calibrated using Scotty
Analysed Gases.
A software malfunction and shortage of time prompted the need of a third party.
When this occured, CRL Energy Limited, Lower Hutt, was used for gas analysis.
Syngas samples were collected from pilot plant trials using 1 L tedlar bags
provided by CRL Energy Limited. The gas was analysed within 48 hours of
collection to ensure integrity of the samples.
3.6.2 Raman Spectroscopy
Raman analysis of char produced by pyrolysis and TGA was used to verify the
maximum temperature reached by the feedstock as it went through the auger.
94
Samples were analysed using a Perkin Elmer Raman Station 400F Raman
Spectrometer at a spectral range of 200-3200 cm-1
.
Raman works on the basis of a laser striking the char sample and plotting a
spectrum depicting the alignment of the molecules present in the char. A method
developed by McDonald-Wharry (2012) was used that characterises char using
graphite as the datum (John McDonald-Wharry 2012). Char samples are analysed
for graphene likeness based on the position of the G band, D band and the valley
between them. These bands have been identified as the most promininent features
that change within temperature ranges.
The comparative analysis method assumes the following parameters (John
McDonald-Wharry 2012):
Batch mode operation
Isothermal degradation
12 minute mean residence time at maximum temperature
Spectral range of 200 – 3200 cm-1

95
Chapter 4.
Results and Discussion

96
4.1 Introduction
Experimental work to obtain empirical data for a large scale mobile pyrolysis
plant design is presented in this chapter. Pilot plant data was combined with
labscale analysis to determine characteristics of the associated feedstock and
products. Mass and energy balances were also collected to provide a basis for the
large scale process. Results are discussed in terms of individual main effects of
variables and compound effects of multi-variable conditions on product yields and
composition.
4.2 Feedstock Characterisation
4.2.1 Introduction
Pyrolysis is generally considered to be a distillation process where large complex
organic molecules are thermally cracked into wide-spectrum of smaller molecules
(Slesser. and Lewis. 1979, Antal and Varhegyi 1995, Moyers. and Baldwin 1999,
Rezaiyan and Cheremisinoff 2005, Basu 2010, White, Catallo et al. 2011). As
described in the literature review, the yields will depend on processing parameters
and also the feedstock being used.
In some cases feedstock pre-treatment techniques such as the use of catalysts and
pre-drying is performed to lower heating demands and/or promote the selectivity
of certain products (Lédé 1994, Antal and Varhegyi 1995, Xu, Matsumura et al.
1996, Moyers. and Baldwin 1999, Rezaiyan and Cheremisinoff 2005, Li, Wang et
al. 2008, Basu 2010, French and Czernik 2010, Anis and Zainal 2011, Bulushev
and Ross 2011, Butler, Devlin et al. 2011, White, Catallo et al. 2011).
In other cases such as Municipal Solid Waste (MSW) treatment where feedstock
composition is not consistent, pre-treatment will be required for monitoring
purposes.
4.2.2 Composition Analysis
The sawdust being used as the feedstock is from New Zealand grown pinus
radiatta softwood. This has a lignocellulose structure and has a mean particle

97
diameter of 1.5mm. Table 26 and Table 27 show the proximate and ultimate
analyses of dry pinus radiatta sawdust from the client R.H. Tregoweth Sawmills.
The later includes a comparison to other biomass sources.
Table 26. Proximate analysis composition for pine sawdust.
Moisture
(%)
Ash (%) Organic
matter (%)
HHVa (kJ/kg)
59.88 0.78 99.22 25,543
Table 27. Comparative ultimate analysis of pinus radiatta sawdust and other
organic feedstock.
4.2.3 Drying Characteristics
Green sawdust is normally received with moisture levels higher than typical wood
due to the use of water as a coolant for the saws. Previous work (Berg., Sichone.
Ultimate analysis of dry feedstock (Dry basis) of some biomass and other fossil fuels * dwb
Fuel C
(% )
H
(%)
N
(%)
S
(%)
O †
(%)
Ash
(%)
HHV
(kJ/kg)
Source
Pinus
Radiata
47.2 6.5 0.3 0.3 44.9 0.8% 25,543 Own work
Comparative Literature values
Maple 50.6 6.0 0.3 0 41.7 1.4 19,958 Tillman,1978
Douglas fir 52.3 6.3 9.1 0 40.5 0.8 21,051 Tillman,1978
Douglas fir
(bark)
56.2 5.9 0 0 36.7 1.2 22,098 Tillman,1978
Redwood 53.5 5.9 0.1 0 40.3 0.2 21,028 Tillman,1978
Redwood
(waste)
53.4 6.0 0.1 39.9 0.1 0.6 21,314 Boley and Landers, 1969
Sewage
sludge
29.2 3.8 4.1 0.7 19.9 42.1 16,000
Rice Straw 39.2 5.1 0.6 0.1 35.8 19.2 15,213 Tillman,1978
Rice Husk 38.5 5.7 0.5 0 39.8 15.5 15,376 Tillman,1978
Sawdust 47.2 6.5 0 0 45.4 1.0 20,502 Wen et al., 1970
Paper 43.4 5.8 0.3 0.2 44.3 6.0 17,613 Bowerman, 1969
MSW 47.6 6.0 1.2 0.3 32.9 12.0 19,879 Sanner et al., 1970
Animal
Waste
42.7 5.5 2.4 0.3 31.3 17.8 17,167 Tillman,1978
Peat 54.5 5.1 1.65 0.45 33.0
9
5.2 21,230
Lignite 62.5 4.38 0.94 1.41 17.2 24,451
PRB Coal 65.8 4.88 0.86 1.0 16.2 26,436 Bituminous coal
research, 1974
Anthracite 90.7 2.1 1.0 7.6 11.4 29,963 Probstein and Hicks,
2006
Petcoke 86.3 0.5 0.7 0.8 10.5 29,865
* dwb
= dry weight basis, †=calculatedbydifference

98
et al. 2011) done by the author confirmed statements from literature review
(Rezaiyan and Cheremisinoff 2005, Basu 2010, Jones 2010, Downie 2010-2011).
The moisture content will need to be reduced before the feedstock is introduced
into the reactor to prevent processing issues.
This section presents the results of drying trials conducted on the prospective
feedstock. Drying experiments were set up in an attempt to obtain drying
characteristics of the sawdust
Aim 4.2.3.1
The aim of the drying trials is to investigate the drying characteristics of sawdust.
Thermal efficiencies of rotary dryers are within the 45-80 % (Moyers. and
Baldwin 1999). Rotary dryers are normally designed using empirical data from
small/pilot scale trials. This is because they are normally for cases where the
moisture is not free-moisture. Thus, the drying rates are based on diffusion of the
liquid through the material. This function is very complex for heat sensitive
materials such as sludge due to physical transformations caused by the heat.
However the function can be made simpler for materials that are thermally stable
within the operational temperatures especially when their water activity
coefficient is known.
Theory 4.2.3.2
Drying will occur while the moisture within the solid is not at equilibrium with
the moisture in the drying medium (usually air).
(27)
Where Nw is the mass transfer flux (drying rate), (kg.m-2
s-1
or mol.m-2
s-1
)
kc is mass transfer coefficient (kg.m-2
s-1
or mol.m-2
s-1
)
aw is the water activity coefficient
psat
w is saturation pressure of the water (kg m-2
s-1
or mol m-2
s-1
)
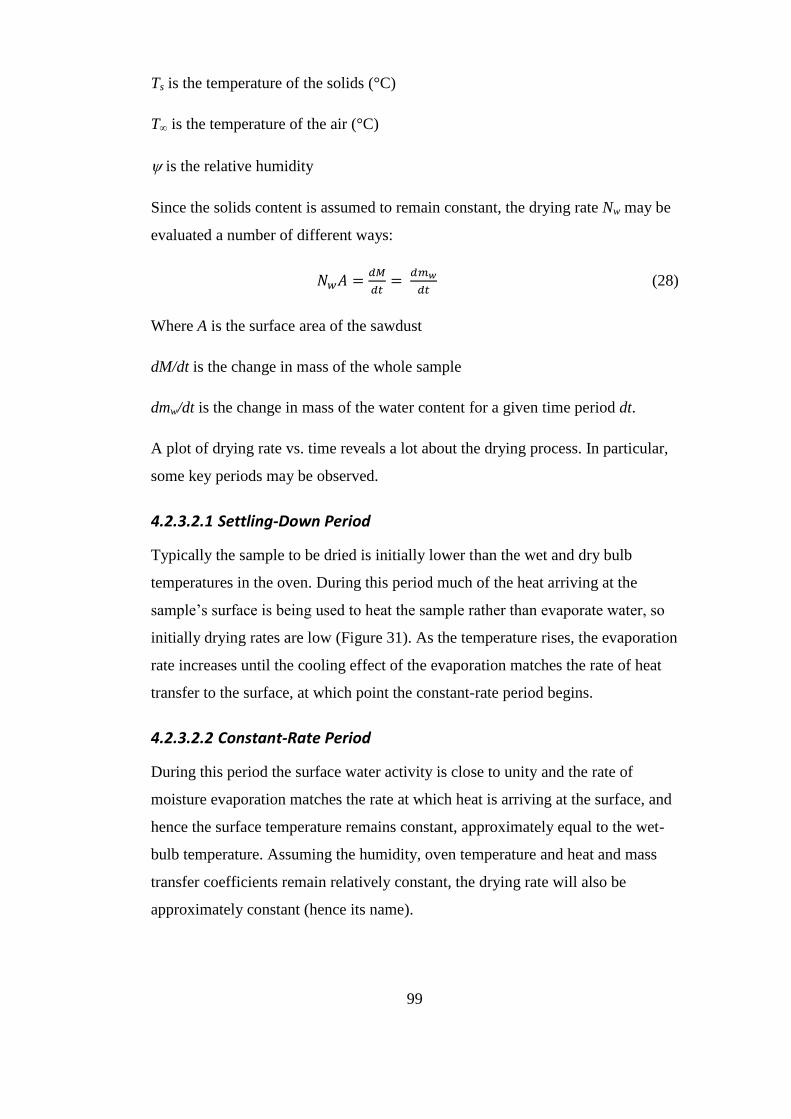
99
Ts is the temperature of the solids (°C)
T∞ is the temperature of the air (°C)
is the relative humidity
Since the solids content is assumed to remain constant, the drying rate Nw may be
evaluated a number of different ways:
(28)
Where A is the surface area of the sawdust
dM/dt is the change in mass of the whole sample
dmw/dt is the change in mass of the water content for a given time period dt.
A plot of drying rate vs. time reveals a lot about the drying process. In particular,
some key periods may be observed.
4.2.3.2.1 Settling-Down Period
Typically the sample to be dried is initially lower than the wet and dry bulb
temperatures in the oven. During this period much of the heat arriving at the
sample’s surface is being used to heat the sample rather than evaporate water so
initially drying rates are low (Figure 31). As the temperature rises, the evaporation
rate increases until the cooling effect of the evaporation matches the rate of heat
transfer to the surface, at which point the constant-rate period begins.
4.2.3.2.2 Constant-Rate Period
During this period the surface water activity is close to unity and the rate of
moisture evaporation matches the rate at which heat is arriving at the surface, and
hence the surface temperature remains constant, approximately equal to the wet-
bulb temperature. Assuming the humidity, oven temperature and heat and mass
transfer coefficients remain relatively constant, the drying rate will also be
approximately constant (hence its name).

100
Figure 31. Drying rate vs time.
4.2.3.2.3 Falling-rate period
If the rate of moisture removal from the surface is greater than the rate at which
water migrates to the surface from within the sample, the surface water activity
will drop below unity and the evaporation rate will decrease, which will mean that
the surface temperature will rise, which in turn will mean that the driving force for
the drying process will decrease and the drying rate will fall (hence its name).
Experimental 4.2.3.3
Drying trials were performed on the selected feedstock for property
characterisation purposes. The trials were performed at three different
temperatures (80, 90 and 100°C) in an attempt to find an optimal drying
temperature. The drying rate for the sawdust is expected to vary depending on the
temperature, grain size and the relative humidity (Simpson and Tschernitz 1979).
Results 4.2.3.4
Data from the drying experiments was recorded and plotted to give mass loss
curves (Figure 32).

101
Figure 32. Mass vs. time for sawdust drying at 80, 90 and 100°C.
The rate at which wood dries depends upon a number of factors, the most
important of which are the temperature, the dimensions of the wood, and the
relative humidity (Simpson and Tschernitz 1979).
The mass loss curves were normalised for reliable comparisons to be made and
the percentage of mass loss for each data set was calculated (Figure 33).
0.034
0.036
0.038
0.04
0.042
0.044
0 50 100 150
mas
s (k
g)
Time (min) 80 °C 90 °C 100 °C

102
Figure 33. Mass fraction vs. time for sawdust drying at 80, 90 and 100°C.
The curves can be defined by the following expression
(29)
Where is the initial mass;
is the final mass and
is the mass at a given time.
The water loss curves were converted into water loss flux curves (Figure 34). The
plots show an increase of mass loss for the first mass value reading. This was due
to the driving force for surface water evaporation governing the mass transfer
rates. The rate of mass loss decreased with time for all samples until the sawdust
reached equilibrium moisture conditions. This behaviour is characteristic of the
falling rate period. It appears that the drying experiments at all three temperatures
do not exhibit the first two stages of drying as predicted by theory. This is because
the theory is based on tray drying of materials of larger size. The small grain size
means the bulk load has a higher surface area to volume and this accelerates
0
10
20
30
40
50
60
70
80
90
100
0 50 100 150
mas
s (%
)
Time (min)
80 °C 90 °C 100 °C

103
evaporation from the surface. Once surface moisture is evaporated the drying rate
is controlled by the moisture diffusion through the sawdust.
The sawdust dried at 100°C reached equilibrium within the shortest time. This
was caused by the higher thermal gradient between the feedstock initial
temperature and the drying air. The higher drying temperature accelerates the
rates of mass loss because the higher thermal gradient provides a higher driving
force for water diffusion. Higher temperatures will yield faster drying times, but
they will also create greater stresses in the wood due because the moisture
gradient will be larger (Simpson and Tschernitz 1979).
Figure 34. Mass loss flux vs. time for sawdust drying at 80, 90 and 100°C.
For the sake of designing the large scale dryer, attempts to fit the drying data to
modelled curves were made using four models described in Table 28.
-0.1
0
0.1
0.2
0.3
0.4
0.5
0.6
0.7
0.8
0.9
1
0 50 100 150
Nw
(kg
.m-2 .
s-1)
Time (min)
80 °C 90 °C 100 °C

104
Table 28. Drying models.
Model name Model Reference
Newton
Lewis, 1921
Page
Page, 1949
Henderson and Pabis
Henderson, 1952; Pabis, 1998
Simpson and Tschernitz (Simpson and Tschernitz 1979)
The Page model appeared to be the most appropriate as it had the lowest residual
sum of squares value for each of the drying temperatures as shown in Table 29.
Table 29. Quality of fit assessment for drying curves.
Drying Temperature 80 °C 90 °C 100 °C
Newton 0.041 0.070 0.031
Page 0.006 0.005 0.015
Henderson and Pabis 0.021 0.027 0.025
Simpson and Tschernitz 0.069 0.103 0.071
.
Figure 35. Newton model.
0
0.2
0.4
0.6
0.8
1
1.2
0 50 100 150 200
80 °C
90 °C
100 °C
80oC Newton
90oC Newton
90oC Newton

105
Figure 36. Page model.
Figure 37. Henderson and Pabis model.
0
0.2
0.4
0.6
0.8
1
1.2
0 50 100 150 200
80 °C
90 °C
100 °C
Series4
Series5
Series6
0
0.2
0.4
0.6
0.8
1
1.2
0 50 100 150 200
80 °C
90 °C
100 °C
Series4
Series5
Series6

106
Figure 38. Simpson and Tschernitz model.
The Page model was used to calculate the required time for drying. This will be
used in the dryer design section.
0
0.2
0.4
0.6
0.8
1
1.2
0 50 100 150 200
80 °C
90 °C
100 °C
Series4
Series5
Series6

107
4.2.4 Reaction Kinetics Model Development
Reaction kinetics of the pyrolysis can be quite complicated to model. There are
currently a lot of models available for the modelling of wood pyrolysis. The
majority of the kinetics are based on Arrhenius law with some sort of adjustment
to accommodate for heating rate or any other variable.
The lab-scale simulations using thermo-gravimetric analysis (TGA) can be used to
predict the behaviour of the feedstock as it is processed in the pilot plant.
A few steps were taken to ensure that the simulation has similar processing
conditions as the pilot plant. These included:
Using argon as the inert medium, ensuring that no combustion occurs.
Controlling the heating rate and using similar to that determined from
preliminary energy balances around the reactor.
The pilot plant operates at a maximum of 680°C, however, to understand
the thermal properties of the feedstock the lab-scale experiments will be
performed up to 900°C.
Sawdust, being a ligno-cellulosic biomass has a heterogeneous composition
comprising of three components which have different temperature ranges for the
initiation of pyrolysis as described in (Rezaiyan and Cheremisinoff 2005).
Hemicellulose: 150-350 °C
Cellulose: 275-350 °C
Lignin: 250-500 °C
Water is the fourth component which can be considered as negligible at low level
analysis. TGA curves suggest that water is removed by 400° K~130°C. This is
because for lab-scale DTA/ TGA experiments it is expected that the water is
normally removed from the biomass before any of the three main constituents
begin decomposing. However, in practice the water vapour might interact with
decomposition products (either the char or the evolved volatile gas). This is
evident in the synthesis reactions responsible for the creation of methane or
hydrogen.

108
Methanation reactions (Apt, Newcomer et al. 2008):
(30)
(31)
(32)
Water- gas reactions using carbon monoxide and methane as feedstock (Kaneko,
Derbyshire et al. 2000):
(33)
(34)
Some of this water is initially present in the feedstock whilst some of it is a
product of pyrolysis. However, by using a lumped semi-global model the origin
and presence of the free water can be regarded as irrelevant.
TGA Analysis 4.2.4.1
TGA analysis of sawdust was performed upto 1273 °K (900 °C). Mass loss
curves were obtained for sawdust at 10, 20 and 30 °K/min.Due to the initial
masses of the samples being slightly different the curves have to be converted to
mass fraction vs temperature curves to enable meaningful comparison as shown
in Figure 39.

109
Figure 39. Normalised mass loss curves mass % vs temperature.
The mass loss curves each give a sinusoidal shape typical of non-isothermal
decomposition. These curves suggest that the sawdust being processed at 10°C
produces the most char 15% whilst the other two trials appear to converge at 11%.
The first drop in mass can be credited to water loss. The sample mass remains
constant before decreasing in what appears to be two-step decomposition. To have
a closer view of the decomposition the curves will need to be converted into mass
loss rate vs. temperature curve.
Distributed Activation Energy Model (DAEM) Reaction 4.2.4.2
Model
The mass loss rate vs temperature curves show two main peaks and a side peak
attached to the second main peak (Figure 40). The first peak can be attributed to
the evaporation of any free moisture. The second main peak and the side peak can
be attributed to devolatilisation of cellulose and hemi-cellulose. After the second
main peak, at approximately 650-700 °K, a shallow gradual slope is observed.
300 400 500 600 700 800 900 1000 11000
0.1
0.2
0.3
0.4
0.5
0.6
0.7
0.8
0.9
1
Temperature (°K)
dm
/dt
10°K/min
20°K/min
30°K/min

110
This slope suggests a slow release of another component. Using decomposition
characteristics highlighted in literature, this fourth component is lignin.
The different component peaks and ranges were highlighted for each heating rate
sample in the following order:
water
lignin
hemi-cellulose
cellulose
The order was used because it proved to be a relatively straight forward approach
to lumping volatile components which showed similar decomposition profiles.
The water fraction was by far the easiest to map due to it outlying position. The
lignin was used first because it had the longest decomposition temperature range
and thus provided a better basis for the other components. Hemi-cellulose and
cellulose were mapped after that.
It is important to note that despite the organic components being labelled as lignin,
hemicellulose and cellulose, the corresponding Gaussian curves are only
approximate as the each of the pseudo components can comprise of a mixture of
decomposing lignin, hemi-cellulose, cellulose and unstable char. Gaussian curves
are can be described by the following relationship
(35)
Where; a is the height of the DTG curve's peak;
b is the temperature corresponding tothe centre of the peak;
c controls the width of the "bell" .
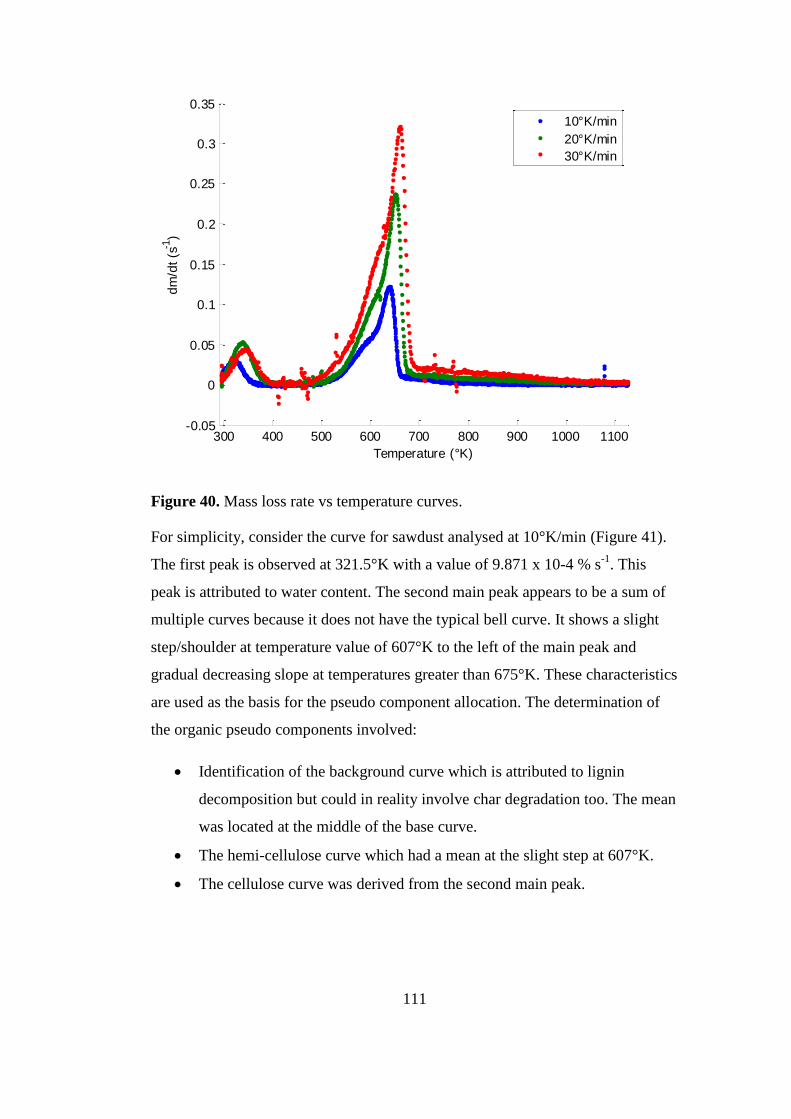
111
Figure 40. Mass loss rate vs temperature curves.
For simplicity, consider the curve for sawdust analysed at 10°K/min (Figure 41).
The first peak is observed at 321.5°K with a value of 9.871 x 10⁻⁴ % s-1
. This
peak is attributed to water content. The second main peak appears to be a sum of
multiple curves because it does not have the typical bell curve. It shows a slight
step/shoulder at temperature value of 607°K to the left of the main peak and
gradual decreasing slope at temperatures greater than 675°K. These characteristics
are used as the basis for the pseudo component allocation. The determination of
the organic pseudo components involved:
Identification of the background curve which is attributed to lignin
decomposition but could in reality involve char degradation too. The mean
was located at the middle of the base curve.
The hemi-cellulose curve which had a mean at the slight step at 607°K.
The cellulose curve was derived from the second main peak.
300 400 500 600 700 800 900 1000 1100-0.05
0
0.05
0.1
0.15
0.2
0.25
0.3
0.35
Temperature (°K)
dm
/dt
(s-1
)
10°K/min
20°K/min
30°K/min
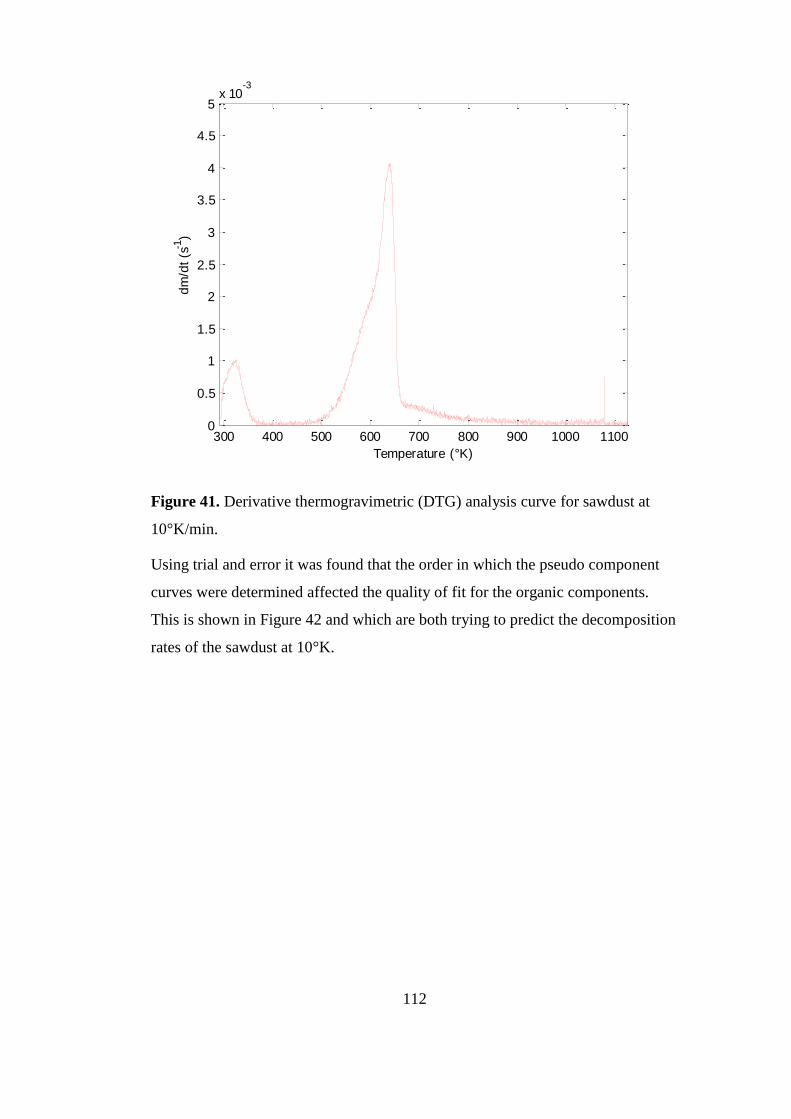
112
Figure 41. Derivative thermogravimetric (DTG) analysis curve for sawdust at
10°K/min.
Using trial and error it was found that the order in which the pseudo component
curves were determined affected the quality of fit for the organic components.
This is shown in Figure 42 and which are both trying to predict the decomposition
rates of the sawdust at 10°K.
300 400 500 600 700 800 900 1000 11000
0.5
1
1.5
2
2.5
3
3.5
4
4.5
5x 10
-3
Temperature (°K)
dm
/dt
(s-1
)

113
Figure 43. Gaussian distribution fitting for sawdust mass loss rate curve for
sample heated at 10°K/ min.
300 400 500 600 700 800 900 1000 11000
0.5
1
1.5
2
2.5
3
3.5
4
4.5
5x 10
-3
Temperature (°K)
dm
/dt
(s-1
)
raw data
water
lignin
hemicelulose
cellulose
predicted composite curve
0 200 400 600 800 1000 0
0.5
1
1.5
2
2.5
3
3.5
4 x 10 -3
Temperature (°K)
dm
/dt
Figure 42. First attempt at pseudo component mapping for sawdust at 10°K/min.

114
The curve fitting assuming a first order decay relationship and this assumption
holds very well for the moisture. However the fit accuracy dropped slightly for the
section describing the organic volatiles evolution. The discrepancies might be
caused by complex interactions which can not be mapped easily by the
assumption of three pseudo components. This method was repeated for sawdust
analysed at 20 and 30° K/min and the graphs are presented in Figure 44 and 45
respectively.
Figure 44. Gaussian distribution fitting for sawdust mass loss rate curve for
sample heated at 20°K/ min.
300 400 500 600 700 800 900 1000 11000
1
2
3
4
5
6
7
8x 10
-3
Temperature (°K)
dm
/dt
(s-1
)
raw data
water
lignin
hemicelulose
cellulose
predicted composite curve

115
Figure 45. Gaussian distribution fitting for sawdust mass loss rate curve for
sample heated at 30°K/ min.
4.2.4.2.1 Determination of Kinetic Triplet
The mass loss rate curve fitting using Gaussian distribution proved to be a great
means of predicting the liberation of the volatiles. However, this did not provide
much information on the kinetic parameters (A, Ea and k).
(36)
4.2.4.2.2 Determination of Reaction Constants (k)
Using the reaction order model, the previous equation can be simplified to
(37)
Rearranging this for k gives
300 400 500 600 700 800 900 1000 11000
0.002
0.004
0.006
0.008
0.01
0.012
Temperature (°K)
dm
/dt
(s-1
)
raw data
water
lignin
hemicelulose
cellulose
predicted composite curve
116
(38)
Where n is =1 for first order reaction modelling. Figure 46 shows a plot of k vs
temperature, for the three heating rates. The plot shows a peak for each heating
rate trial within the range associated with organic volatile release. Maximum
reaction rate constants were 0.52 , 0.943 and 1.182 (s-1
) for heating rates of 10, 20
and 30 ° K/min. The maximum reaction rate constant increases with increase in
heating rate. The increase in heating rate also increased the temperature range of
the main set of decomposition reactions. The plot exhibits some strange results
which indicate a scattered exponential increase in reaction constant with increase
in temperature after the main organic matter decomposition. These results are
inconsistent with the mass loss curves shown in Figure 39 which show a slow
mass loss rate after the main organic matter decomposition region.
Figure 46. Reaction rate vs. temperature.
300 400 500 600 700 800 900 1000 11000
0.2
0.4
0.6
0.8
1
Temperature (°K)
Reaction r
ate
k (
s.- .
1)
10°K/min
20°K/min
30°K/min

117
4.2.4.2.3 Determination of Activation Energy
Figure 47 shows a plot of the activation energy vs. temperature for all three
samples. The graph shows a peak within the same temperature ranges associated
with organic volatile liberation for trials performed using each of the heating rates.
Maximum activation energy values of 180.1, 169.6 and 145.2 (kJ/mol) for heating
rates of 10, 20 and 30 ° K/min. The maximum Ea for the global organic matter
reaction decreased with increase in heating rate. The increase in heating rate also
shifted the peak to the right showing that the decomposition temperature range
was prolonged with increase in heating rate.
Figure 47. Rate constant k vs. Temperature (°K).
The individual Ea vs. temperature for the sawdust analysed at 10°K/min in Figure
48 shows that the distribution of the activation energy required for the main
organic matter devolatilisation can be mapped using two composite curves.
However, the plot also shows a degree of variation for the activation energy levels
at temperatures between 665 and 800 °K with values ranging from ~20 -
300 400 500 600 700 800 900 1000 11000
20
40
60
80
100
120
140
160
180
200
Temperature (°K)
Ea (
kJ/m
ol)
10°K/min
20°K/min
30°K/min

118
~50kJ/mol. A strange pattern is observed for temperatures greater than 800 °K.
However the overall trend of the strange pattern shows that the activation energy
increases exponentially as the temperature approaches 1125 °K. This exponential
increase can be credited to the reduction in volatile matter. Most organic matter is
now converted to char and although char can be burnt, it can be very difficult to
devolatise in absence of oxygen.
Figure 48. Activation energy vs temperature for sawdust at 10°K/min.
300 400 500 600 700 800 900 1000 11000
20
40
60
80
100
120
140
160
180
200
Temperature (°K)
Ea (
kJ/
mo
l)
10°K/min

119
4.2.4.2.4 Determination of Pre-Exponential Constant
The pre-exponential constant was determined using an approximate method by
Braun and Burnham (1987) using the following relationship:
(
)
(39)
Rearranging to make A the subject yields
(
)
(40)
Taking the exponential of both sides gives A.
(
)
(41)
Where A is the pre-exponential constant;
E0 is the maximum activation energy level;
Tmax refers to the temperature value for E0;
R is the universal gas constant;
β is the heating rate.
Using this equation pre-exponential constant values of 1.42627 x 10⁻¹⁵
, 0.000914
and 0.001151 were obtained for sawdust TGA at heating rates of 10, 20 and 30 °
K/min.
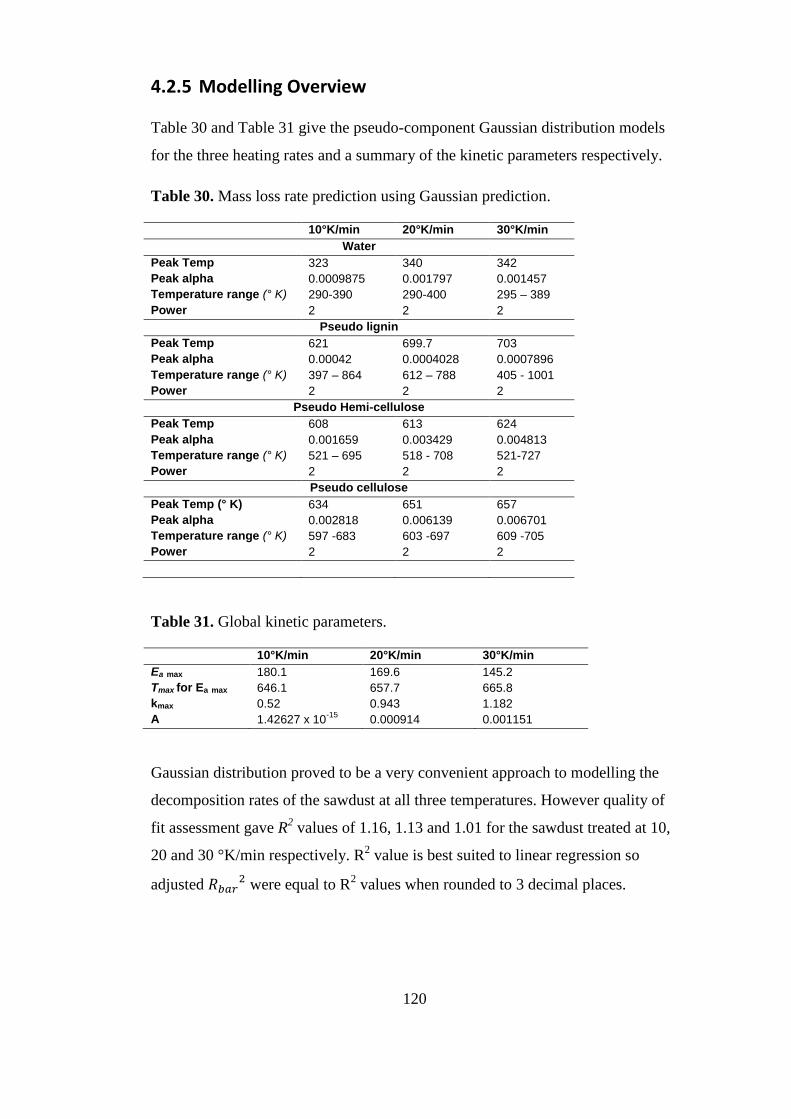
120
4.2.5 Modelling Overview
Table 30 and Table 31 give the pseudo-component Gaussian distribution models
for the three heating rates and a summary of the kinetic parameters respectively.
Table 30. Mass loss rate prediction using Gaussian prediction.
10°K/min 20°K/min 30°K/min
Water
Peak Temp 323 340 342
Peak alpha 0.0009875 0.001797 0.001457
Temperature range (° K) 290-390 290-400 295 – 389
Power 2 2 2
Pseudo lignin
Peak Temp 621 699.7 703
Peak alpha 0.00042 0.0004028 0.0007896
Temperature range (° K) 397 – 864 612 – 788 405 - 1001
Power 2 2 2
Pseudo Hemi-cellulose
Peak Temp 608 613 624
Peak alpha 0.001659 0.003429 0.004813
Temperature range (° K) 521 – 695 518 - 708 521-727
Power 2 2 2
Pseudo cellulose
Peak Temp (° K) 634 651 657
Peak alpha 0.002818 0.006139 0.006701
Temperature range (° K) 597 -683 603 -697 609 -705
Power 2 2 2
Table 31. Global kinetic parameters.
10°K/min 20°K/min 30°K/min
Ea max 180.1 169.6 145.2
Tmax for Ea max 646.1 657.7 665.8
kmax 0.52 0.943 1.182
A 1.42627 x 10⁻¹⁵
0.000914 0.001151
Gaussian distribution proved to be a very convenient approach to modelling the
decomposition rates of the sawdust at all three temperatures. However quality of
fit assessment gave R2 values of 1.16, 1.13 and 1.01 for the sawdust treated at 10,
20 and 30 °K/min respectively. R2 value is best suited to linear regression so
adjusted were equal to R
2 values when rounded to 3 decimal places.

121
4.3 Pilot Plant Trials
4.3.1 Experimental Data
The pilot plant trials were run from 14th
August 2012 to 6th
November 2012. The
Nominal conditions were assigned as:
15% moisture feedstock – This moisture content had theoretically
demonstrated autogenesis for paunch grass pyrolysis in previous studies.
of a higher moisture content
Pyrolysis at 400 °C – this appears to be the lower end of the most
commonly used temperature range (400 – 600°C) for slow pyrolysis
without the aid of catalysts.
An auger speed of 15rpm – This was the lowest speed used in previous
studies.
Table 32. Processing parameter level assignment.
Processing parameters
Level
Moisture
(%)
Temperature
(°C)
Throughput
(hertz)
0 15% 400 15
1 30% 450 20
2 60% 500 25
4.3.2 Pilot Plant Pyrolysis Process Description
The feedstock is force fed into an auger kiln using two augers from the hopper,
the kiln is heated to temperatures between 400 -500°C. Once the reactor reaches
the specified temperature the augers are started and sawdust is fed into the system.
The products leave as hot volatiles and char. The char goes down a small cyclone
whilst the hot volatiles are passed through a flash tank, which separates the heavy
oils. The vapour then flows through a condenser where the remaining water
vapour and oil condenses leaving the syngas to go through.

122
4.3.3 Feedstock Performance
Qualitative observation of the pilot plant trials was used to determine the
processing attributes of the pilot plant and the feedstock highlighting issues that
might need consideration for the large scale design.
The sawdust generally flowed consistently through the augers for two of the
moisture content levels (15% and 30%) identified for analysis. The green sawdust
with a high moisture content of (60%) caused blockages on several attempts
regardless of reactor temperature or auger speed.
As the sawdust was conveyed through the first couple of augers (Figure 49), it
experienced compressional forces which built a firm plug (Figure 50). This was
needed to eliminate the possibility for addition of oxygen via entrapped air in the
system. The compressional and shear forces in combination with the moisture
which acted as a lubricant caused an increase in density of the feedstock as it was
conveyed to the reactor.
Figure 49. Loose sawdust being fed through bulk density 280 kg/m3.

123
Figure 50. Dry compacted sawdust prior to decomposition, bulk density 1,202
kg/m3.
Hot volatiles were produced in as little as 45 – 80 minutes after feeding was
started using the motors. Based on visual interpretation, the effects of
manipulating the three variables (moisture content, reaction temperature and auger
speed) on the process showed characteristics similar to results predicted by theory.
Increase in temperature showed an increase in flame height and reduced the char
yield volumes. This suggests higher volumetric flow rates of syngas due to a
larger degree of volatilisation. This was confirmed by the rotameter readings
which at times exceeded the maximum scale of 2500 ml/min. Generally the pilot
plant results showed more tar formation at 400°C, more oil formation at 450°C
and more syngas formation at 500°C.
For a fixed temperature and fixed motor speed the increase of moisture content in
the sawdust showed a reduction in feedstock flow properties. This is because the
moisture could have acted as a lubricant which allowed the sawdust a higher
degree of shear strain. This in turn caused an increase in density of the sawdust,
thus causing a need for a larger mechanical driving force. The lower moisture feed
generally produced more volatiles.
For a fixed temperature and fixed moisture content increase in feed rate via an
increase in motor speed increased the amount of char produced. The char also
appeared to be cooked less compared to slower feed rates.
A peculiar observation was made during a randomised run. It was noticed that
starting the pyrolysis at a slow auger speed and increasing the motor speed to

124
ranges of 30 – 50 rpm enhanced gas flow properties. This could have been caused
by the agitation of the solids in the reactor which allowed for more evenly
distributed exposure times for different particles in a given channel. The agitation
could have inhibited carbon fixing thus more gas was evolved from each particle
because they had slightly more time to be transferred
Bio oil, bio-char and syngas yields were determined for the specified range of
operating conditions and are shown in Table 33 and Table 34. The green sawdust
could not be processed properly due to blockages. This was probably caused by
increased shear strength of the sawdust due to high moisture (60%). The higher
moisture allowed the sawdust to deform plastically which resulted in higher
density of the sawdust plug. The high density plug required a large force to be
conveyed through the reactor. Thus the pilot plant data was only collected from
trials performed at two moisture levels.

125
Table 33. Raw data collected from pilot plant.
Trial Sample I.D
Moisture content (%)
Temp. (° C)
Auger speed (rpm)
Feed rate (kg/hr)
Char mass (kg/hr)
Oil mass (kg/hr)
Syngas mass
(kg/hr)
1 000 15 400 15 1.54 0.59 0.25 0.71
2 001 15 400 20 1.75 0.77 0.32 0.67
3 002 15 400 25 0.63 0.32 0.17 0.14
4 010 15 450 15 1.74 0.26 0.36 1.11
5 011 15 450 20 1.39 0.56 0.18 0.67
6 012 15 450 25 1.15 0.46 0.23 0.46
7 020 15 500 15 0.77 0.28 0.12 0.36
8 021 15 500 20 1.41 0.52 0.24 0.65
9 022 15 500 25 1.96 0.43 0.39 1.13
10 100 30 400 15 n/r n/r n/r n/r
11 101 30 400 20 n/r n/r n/r n/r
12 102 30 400 25 n/r n/r n/r n/r
13 110 30 450 15 1.19 0.53 0.19 0.48
14 111 30 450 20 0.90 0.33 0.24 0.32
15 112 30 450 25 0.89 0.34 0.23 0.32
16 120 30 500 15 0.80 0.16 0.12 0.52
17 121 30 500 20 1.06 0.29 0.14 0.64
18 122 30 500 25 n/r n/r n/r n/r
Note: Syngas mass was calculated by difference

126
Table 34. Pilot plant trial product distribution.
Trial Sample
I.D
Moisture
content
(%)
Temperature
(° C)
Reactor
auger
speed
(rpm)
Char
yield
(%)
Oil yield
(%)
Syngas
yield
(%)
1 000 15 400 15 38 16 46
2 001 15 400 20 44 18 38
3 002 15 400 25 51 27 22
4 010 15 450 15 15 21 64
5 011 15 450 20 40 13 48
6 012 15 450 25 40 20 40
7 020 15 500 15 37 16 47
8 021 15 500 20 37 17 46
9 022 15 500 25 22 20 58
10 100 30 400 15 23 36 41
11 101 30 400 20 15 67 18
12 102 30 400 25 44 22 33
13 110 30 450 15 44 16 40
14 111 30 450 20 37 27 36
15 112 30 450 25 38 26 36
16 120 30 500 15 20 15 65
17 121 30 500 20 27 13 60
18 122 30 500 25 42 8 50
Trials 19 – 27 Blocked reactor auger due to the use of green sawdust.
4.3.4 Effects of Processing Parameters on Product Yields
The main effects of “reaction temperature” variation were determined using data
from experiments 000, 010, 020 and can be viewed in Figure 51. This ensured that
the other two variables were kept at nominal levels. The nominal yields are 38%,
16% and 46% for char, oil and syngas, respectively.
The char yield appears to decrease from 38% to 15% as the reaction temperature
is raised from 400 to 450 °C causing an increase of liberated volatiles (62% - 85).
It is observed that the syngas production rate has a higher increase (46%-64%)
compared to that of the oil yield (16% - 21%).

127
The second increase in in temperature, displays similar yields to the nominal setup.
This shows a reduction of volatiles liberated from 85% at 450°C to 63% at 500°C.
The syngas yield drops to 47% whilst the oil yield is 16%.
Figure 51. Product yields with respect to change in temperature.
The main effects of sawdust moisture content were determined using data from
experiments 000 and 100. Yields from trial 200 could not be determined due to
blockages caused by processing 60% moisture feedstock. Similar to the analysis
of the main effect/s of temperature, the other two variables were kept constant at
nominal conditions.
Using the nominal trial as a basis, the char yield is reduced from 38% to 23 % for
sawdust at 30% moisture (Figure 52). A simple mass balance from the yield
fractions might suggest this decrease is related to the increase of moisture. The
change in distribution of volatile matter between oil and gas might confirm this
too. The higher water content in the oil will demand a higher organic matter
content in emulsions to reach equilibrium in the condensation step.
When the phenomena dictating the mass transfer is considered; one can note that
drier sawdust will have a higher tendency to carbonise due to a lower heat
capacity compared to the wetter. Therefore the apparent reactive surface for the
0%
10%
20%
30%
40%
50%
60%
400 450 500
Char yield %
Oil yield %
Gas yield %

128
wetter feedstock is higher since the absence of this promotes movement of volatile
matter.
Figure 52. Product yields with respect to change in moisture.
The main effects of “reactor auger speed” variation were determined using data
from experiments 000, 001, 002 and can be viewed in Figure 53. This ensured that
the other two variables were kept at nominal levels. The nominal yields are 38%,
16% and 46% for char, oil and syngas, respectively as stated previously.
The char yield appears to increase from 38% to 44% as the auger speed is raised
from 15 rpm to 20 rpm causing an decrease of liberated volatiles (62% - 55). It is
observed that only the syngas production rate was decreased (46%-38%) while the
oil yield increased (16% - 18%).
The second increase in in temperature, holds a similar trend char yields continue
to increase when auger speed is increased from 20 – 25 rpm. Volatiles are reduced
from 55% at 20rpm to 49% at 25 rpm. The syngas yield drops to 22% whilst the
oil yield increases to 27%.
These effects confirm literature predictions. This can be simplified by considering
the variables directly affected by the auger speed. Increasing the auger speed will
typically alter the heating rates due to the lower contact times. Shorter contact
time at constant temperature will have a lower degree of volatilisation thus char
0%
5%
10%
15%
20%
25%
30%
35%
40%
45%
50%
15% 30%
Char yield %
Oil yield %
Gas yield %

129
yields are increased. A shorter contact time will inhibit the completion of
devolatilisation reactions thus produce a higher solid residue.
Figure 53. Product yield with respect to change in auger speed.
Compound effects of processing parameters on product 4.3.4.1
yields
Compound effects of variables are normally hard to predict theoretically. This is
because the variables might have complex interactions. These interactions could
either be competitive or synergistic by nature. Synergistic interactions are
interactions which produce higher effects than what might be predicted by a
simple addition of the two main effects of the variables. Regardless of this, Table
34 shows different product yields for the other possible combinations of the three
variables with the exception of those involving green sawdust.
4.4 Product Characterisation
4.4.1 Char Characterisation
To simplify the interpretation of the pilot plant results the trials were analysed in
two groups determined by the two moisture contents used. Case A includes all
trials using 15% moisture content sawdust and Case B includes those of 30%
0%
5%
10%
15%
20%
25%
30%
35%
40%
45%
50%
15 20 25
Char yield %
Oil yield %
Gas yield %

130
moisture. Step change of a processing parameter refers to a change in value based
on the processing parameter key in Table 34.
The pilot plant trials showed that biochar yields varied with the experimental set
up. Proximate and ultimate analyses of the different chars are presented in Table
35 and Table 36 respectively.
Table 35. Proximate analysis of biochars.
Case
Moisture
(% wt wb)
Dry solids
(% wt wb)
Total ash
(% wt wb)
Total organic matter
(% wt wb)
Char
yield
A
000 36.74 63.26 9.77% 53.49 38%
001 28.19 71.81 6.83% 64.98 44%
002 26.30 73.70 4.90% 68.80 51%
010 72.86 27.14 2.81% 24.33 15%
011 23.14 76.86 3.55% 73.32 40%
012 21.86 78.14 21.33% 56.82 40%
020 20.38 79.62 4.94% 74.68 37%
021 5.61 94.39 8.00% 86.39 37%
022 3.34 96.66 3.05% 93.60 22%
B
100 10.15 89.85 2.45% 87.40 23%
101 25.95 74.05 1.93% 72.12 15%
102 10.58 89.42 8.07% 81.36 44%
110 47.79 52.21 1.27% 50.94 44%
111 47.79 52.21 4.94% 47.27 37%
112 3.24 96.76 5.13% 91.63 38%
120 43.66 56.34 7.22% 49.12 20%
121 13.81 86.19 7.06% 79.13 27%
122 6.01 93.99 7.29% 86.70 42%
Samples 000, 010, 020 were used to explore the main effects of temperature on
the char proximate composition. No apparent trend is shown as the residual
organic matter fraction decreases from 53.49 % to 24.33% with the first step
increase in temperature from 400 to 450°C then it increases from 24.33% to 74.68%
with increase in temperature from 450°C to 500°C.
Char elemental analysis revealed that carbon, hydrogen and nitrogen contents
increased from 68.88 %, 2.82% and 0.38%, to 77.90 %, 3.36%, and 0.48%
respectively with the first step increase in temperature. The second step increase

131
in temperature causes a slight drop in content levels of carbon, hydrogen and
nitrogen from 77.90 %, 3.36%, and 0.48% to 76.25%, 3.07% and 0.35%.
Table 36. Ultimate elemental analysis for biochar.
Case Sample I.D
C
(%)
H
(%)
N
(%)
S
(%)
O (%)*
HHV (MJ/kg)
L HV
(MJ/kg)
H/C ratio
Residual carbon
(%)
A
000 68.88 2.82 0.38 <0.40 27.53 27.71 27.10 0.04 22.25
001 74.90 3.23 0.41 <0.40 21.07 30.36 29.67 0.04 28.01
002 75.92 3.26 0.27 0.40 20.16 30.77 30.07 0.04 32.91
010 77.90 3.36 0.48 <0.40 17.86 31.58 30.86 0.04 9.93
011 77.50 2.84 0.31 <0.40 18.96 30.70 30.09 0.04 26.35
012 69.78 3.19 2.74 <0.40 23.90 28.55 27.87 0.05 23.72
020 76.25 3.07 0.35 <0.40 19.94 30.60 29.94 0.04 23.98
021 79.52 2.62 0.31 <0.40 17.16 31.07 30.50 0.03 25.01
022 81.43 2.58 0.39 <0.40 15.21 31.66 31.11 0.03 15.23
B
100 80.92 3.38 <0.30 <0.40 15.28 32.65 31.92 0.04 15.82
101 78.41 3.14 0.54 <0.40 17.52 31.44 30.76 0.04 10.00
102 78.93 2.96 0.31 <0.40 17.41 31.36 30.73 0.04 29.52
110 73.10 3.40 0.66 <0.40 22.45 29.99 29.26 0.05 27.34
111 71.54 3.41 0.41 <0.40 24.25 29.47 28.74 0.05 22.50
112 77.99 2.83 0.42 <0.40 18.37 30.85 30.24 0.04 25.19
120 75.24 2.71 0.47 <0.40 21.19 29.73 29.15 0.04 12.79
121 83.06 2.59 0.34 <0.40 13.63 32.24 31.69 0.03 19.06
122 80.10 3.10 0.37 <0.40 16.04 31.96 31.30 0.04 28.59
Residual carbon = Carbon sequestration potential assuming total carbon in char is fixed in soils
The heating values follow suit with HHV increasing from 27.71 to 31.58 before
dropping to 30.60 MJ/kg respectively as they depend on the carbon and hydrogen
contents. Oxygen contents were calculated from difference and show opposing
trends to those of the other elements.
The main effect analysis from samples 000, 001, 002 with auger speeds at 15, 20,
25 rpms respectively, proximate analysis shows that total organic matter increases
with increase in auger motor speed. This confirms that increasing the reactor
auger speed will lead to a decrease in degree of devolatilsation of organic matter.
The total ash content is reduced as a result mostly due to dilution effect.
Char elemental analysis revealed that carbon and hydrogen contents increased
from 68.88 % and 2.82% to 74.90% and 3.23% then 75.92% and 3.26%
respectively. Nitrogen contents initially increase from 0.38%, to 0.41% for the

132
first auger speed step increase but decrease to 0.27% for the second auger speed
step increase.
The heating values are a function of mainly the carbon and hydrogen content
increase from 27.71 to 30.36 then 30.77 MJ/kg respectively with increase in
reactor auger speed.
Oxygen contents calculated from difference and are shown to increase with
increase in reactor auger speed opposing the trends observed for carbon and
hydrogen.
For case B, with moisture content of feedstock at 30% wet weight basis the main
effects of temperature were observed using samples 100, 110, 120. The data
showed that increase in temperature lead to a decrease in total organic matter
content in the char. The total organic matter for the samples were 87.40%, 50.94%,
49.12% respectively. This confirms an increase in degree of devolatilisation of
biomass as reaction temperature is increased.
Char elemental analysis revealed that carbon was decreased from 80.92% to 73.10%
in the first step change, hydrogen, nitrogen and oxygen contents increased from,
3.38%, <0.30% and 15.28% to 3.36%, 0.66% and 22.45% respectively. The
second step increase in temperature causes a slight increase in carbon content
levels from 73.10% to 75.24% of carbon. Hydrogen, nitrogen and oxygen
contents decrease from 3.40%, 0.66% and 22.45% to 2.71% 0.47% and 21.19%
respectively. The heating values of the chars decrease with increase in reaction
temperature with HHV values of 32.65, 29.99 and 29.73 MJ/kg respectively.
The main effects of auger speed for case B were observed using samples 100, 101,
102. The data showed that the total organic content of the char decreased from
87.4% to 70.12% with the first step increase in reactor auger speed from 15rpms
to 20rpms. The next step increase in temperature from 20 to 25rpms shows an
increase of total organic content of the char from 70.12% to 81.36%.
Char elemental analysis revealed that carbon and hydrogen contents were
decreased from 80.92% and 3.38% to 78.41% and 3.14% in the first step change,
nitrogen and oxygen contents increased from, <0.30% and 15.28% to 0.54% and

133
17.52% respectively. The second step increase in auger speed causes a slight
increase in carbon content levels from 78.41% to 78.93% of carbon. Hydrogen,
nitrogen and oxygen contents decrease from 3.14%, 0.54% and 17.52% to 2.96%
0.31% and 17.41% respectively.
The heating values are shown to decrease from 32.65 to 31.44 then 31.36 MJ/kg
respectively with increase in reactor auger speed.
Summary of effects process parameters on char 4.4.1.1
4.4.1.1.1 Feedstock moisture content
An increase in feedstock moisture also showed an increase in total organic matter
in chars from 000, 100 which correspond to 15%, 30% moisture content
respectively. Similar to the preceding subset, the total ash content decreases with
increase in moisture content due to the dilution effects.
It appears that the feedstock moisture does not appear to have a significant effect
on the moisture content of the char. The residual moisture in the char will depend
on the water retention properties of the char product (Taylor 2010). Therefore, it
appears there is no direct correlation between the feedstock moisture and the
moisture content of the chars.
Using a global energy balance on the process based on the rule of mixtures, it is
clear to see that for a specific reaction temperature, sawdust of higher moisture
content will have higher heating demands (3 kJ/kg compared 2.75 MJ/tonne
assuming dry wood has Cp of 2.5 MJ/tonne (The_Engineering_Toolbox)) .
However, considering the pilot plant yields it appears that the 30% moisture
sawdust trials had a higher degree of devolatilisation. This might have been a
result of the water enhancing heat transfer within the saw dust bulk. The excess
water meant the sawdust contained 30% moisture has a higher heating capacity
compared to that which contained only 15%. Steam performs as a heat carrier,
therefore, increasing the amount of moisture will increase the amount of heat
needed to raise the temperature of the feedstock however it will increase the
driving force for heat exchange between the combustion gas and the feedstock
through the reactor walls. Literature states that increase in heating rate will

134
increase volatile product yields (Antal and Grønli 2003, Branan 2005, Rezaiyan
and Cheremisinoff 2005, Mohan, Pittman et al. 2006, Lu, Li et al. 2009, Basu
2010).
4.4.1.1.2 Reactor Temperature
Basic pyrolysis theory states that increase in temperature will increase the fraction
of volatiles released. However, pilot plant trials such as 000,010,020 which were
inconsistent with trends predicted by theory cannot be explained at first glance.
The deviation from trends predicted by basic theory can be explained inspecting
the nature of pyrolytic reactions, the yields obtained suggest that the two extremes,
400°C and 500 °C favour different phenomena.
1. Increase in temperature a constant moisture content level and auger speed
will increase the rate of devolatilisation.
2. Increasing the temperature will also increase the tendency of case
hardening which inhibits liberation of volatile matter thus promoting
carbonisation. Case hardening effects can be minimised by inducing
agitation.
The two phenomena are the principle limiting mechanisms and the product yields
of any configuration will depend on the higher driving force available. An avenue
that might be of great interest is the investigation of the heat transfer scheme of
the reactor which monitors the heat transfer from combustion gases into the
feedstock. This would be very useful in quantifying the heating rate experienced
by the feedstock. Accurate monitoring of the feedstock heating rate has proven to
be a big challenge for pyrolysis at pilot scale levels because the cost could not be
justified.
4.4.1.1.3 Auger Speed
Auger speed manipulation consistently demonstrated a strong relationship with
the extent of devolatilisation. This was proven in both case A and B by a
consistent increase in char yields and residual organic matter content of chars with
increase in auger speeds. This inconsistent behaviour might be explained if you

135
consider the reactor auger speed to have two main responses to the processing
conditions.
1. Increasing the auger speed causes agitation of the bulk sections. This
enhances volatile discharge from sawdust particles. This promotes higher
volatile yields.
2. Increasing the auger speed reduces the contact time for the sawdust
particles and the heating walls. This reduces the extent of decomposition
thus promotes char formation.
3. Increase in auger speed enhances even temperature distribution.
If one is to consider a variant reactor auger speed as shown in samples 100, 101,
102 from case B, The amount of organic matter in the char can be credited to
these two responses. The first response is dominant in the first step change from
15rpms to 20 rpms, whilst the second is dominant in the change from 20rpms to
25 rpms. The third response is expected to be active in both steps but from the
experiment it appears to be a background/recessive response.
Raman spectroscopy 4.4.1.2
Multiple spectra of the samples were collected and mean values were analysed. A
summary of the spectral analysis is shown in Table 37. The samples are referred
to using the same naming code defined in the design of experiments (Table 34).
G band Position
G band position appears to be one of the most sensitive features in terms of
thermo-induced structural morphology. Figure 54 shows the increase of the G
band wavelength position with an increase in heat treatment temperature (HTT)
for batch process char. This scale will be used as a basis for comparison for the
char produced from Lakeland Steel’s continuous process.

136
Table 37. Summarised spectra analysis results.
Code Moisture
content (%)
Temperature
(° C)
Reactor
auger
speed (rpm)
G band
position
000 15 400 15 1572
001 15 400 20 1573
002 15 400 25 1568
010 15 450 15 1572
011 15 450 20 1576
012 15 450 25 1572
020 15 500 15 1576
021 15 500 20 1577
022 15 500 25 1577
100 30 400 15 1570
101 30 400 20 1576
102 30 400 25 1578
110 30 450 15 1572
111 30 450 20 1534
112 30 450 25 1575
120 30 500 15 1579
121 30 500 20 1580
122 30 500 25 1578
Figure 54. Plot of G band position as a function of heat treatment temperature for
chars.Broad horizontal guide lines represent approximate G band positions
measured for glassy carbon and graphite samples. Linear trend line and
correlation based on mean data points (from chars derived from all three
precursors) between HTT ≈ 420 °C and HTT ≈ 700 °C (John McDonald-Wharry
2012).

137
The chars being analysed have been produced within the limits of the linear range.
Figure 55 shows the G band positions for the char samples. With the exception of
sample 111, all the position of the G band for the samples appears to confirm
comparable results. Discrepancies can be attributed to the difference in heating
scheme. The batch process allows for a heat up time and a known retention time at
the reaction temperature whilst the continuous process allows a transient heating
profile for most of the reaction.
Figure 55. G band position for different pine char samples (sample number along
the x axis refers to the sample ordered vertically on the right end).
The comparison of G band positions verified that the char produced from the
continuous process had temperature comparable to char produced in a batch
experiment performed by McDonald-Wharry (2012).
While, sample 111 does not show predicted G band position, minor discrepancies
observed for other samples might have been due to the limitations of the Raman
method which include:
1530
1535
1540
1545
1550
1555
1560
1565
1570
1575
1580
1585
0 5 10 15 20
wav
ele
ngt
h c
m-1
Sample number
000
001
002
010
011
012
020
021
022
100
101
102
110
111
112
120
121
122

138
Inability to directly distinguish main effects of other parameters such as
moisture content and reactor auger speed.
Quantification of a direct correlation of batch operation maximum
feedstock temperature vs continuous mode non-isothermal temperature
profile.
Understanding the similarities between char produced under different conditions
for example batch vs continuous will allow for a better evaluation in terms of
marketing potential of the product.
4.4.2 Syngas Characterisation
Syngas characterisation was performed using two chromatography units as
described in the methodology section. The department’s chromatography method
was only able to detect was not able to detect CH4, CO2, H2, O2, N2, CO. therefore;
C2H4 and C2H6 will not be discussed. From observation of the data presented in
Table 38, Syngas calorific values range from 5.07 - 12.38 MJ/dscm. The earlier
was obtained from pilot plant running at 400°C whilst the later at 500°C. This
confirms pyrolysis theory which predicts that increasing the temperature increases
the calorific value of the syngas. This prediction assumes that the higher degree
of volatilisation will promote the formation of methane and hydrogen.
4.4.3 Bio-Oil Characterisation
Bio-oil was highlighted as the least marketable pyrolysis product in New Zealand
at the moment, despite the huge global interests it has received. This is because
New Zealand has a relatively small infrastructure for liquid fuel refining. Whilst
biochar is sought after for its environmentally friendly properties and syngas is
used to lower processing costs. Thus, characterisation was only performed for
concentrated samples obtained in the first trial (000) and is presented in Table 39.
The sample was concentrated by decanting.

139
Table 38. Syngas characterisation for pilot plant trial samples.
Composition (%) HHV
(MJ/dscm) Trial CH4 CO2 C2H4 C2H6 H2 O2 N2 CO
000 9.40 32.70 0.76 0.81 16.80 5.20 20.60 13.60 8.21
001 9.40 39.90 0.00 0.00 11.55 5.14 30.36 3.66 5.37
002 9.06 31.62 0.00 0.00 13.55 7.21 29.83 31.62 6.10
010 8.26 24.70 0.00 0.00 12.38 8.48 32.85 13.32 6.21
011 11.40 15.60 0.18 0.69 9.30 12.00 45.90 5.00 6.57
012 Not recorded
020 Not recorded
021 7.60 18.50 0.41 0.65 10.30 11.30 45.40 5.90 5.50
022 15.50 30.10 0.61 1.11 27.50 1.60 6.00 17.50 12.38
100 6.27 28.70 0.00 0.00 5.35 7.45 35.05 17.18 5.07
101 9.85 34.95 0.00 0.00 4.90 7.38 26.19 16.72 6.31
102 13.00 38.36 0.00 0.00 8.18 4.51 22.93 13.03 7.45
110 15.29 43.92 0.00 0.00 10.65 2.13 8.30 19.71 9.41
111 10.27 51.22 0.00 0.00 17.78 2.06 8.05 127.87 7.29
112 11.50 31.90 0.37 0.87 15.40 4.30 25.40 10.20 8.23
120 9.90 33.50 0.78 0.58 24.00 4.20 15.90 11.10 8.80
121 17.00 24.50 0.63 0.95 20.50 4.40 17.00 15.00 11.70
122 Not recorded
Trials 012, 02, 122 were not analysed due to technical issues with GC equipment
Table 39. Bio oil ultimate analysis.
C (%)
H (%)
N (%)
S (%)
O* (%)
HHV (MJ/kg)
LHV (MJ/kg)
49.09 7.71 1.56 <0.40 41.24 27.96 26.31
O* calculated by difference

140
Chapter 5.
Large Scale Plant
Design Concept

141
5.1 Introduction
5.1.1 Process Description
The large scale concept will work on the same principles used in Lakeland
Steel Ltd.’s pilot plant. The feedstock is force fed into an auger kiln using
augers from the hopper. The kiln is heated to the desired reaction
Temperature (400°C will be used as a basis) and the products leave as hot
volatiles and char. The char goes down a small funnel (cyclone like) and
conveyed to a collection vessel whilst the hot volatiles are passed through a
flash tank, which separates the heavy oils. The vapour then flows through a
condenser where the remaining water vapour and light oil condenses
allowing the syngas to go through to the syngas buffer tank. The buffer tank
regulates the syngas flow rate as it feeds it into the gas burner.
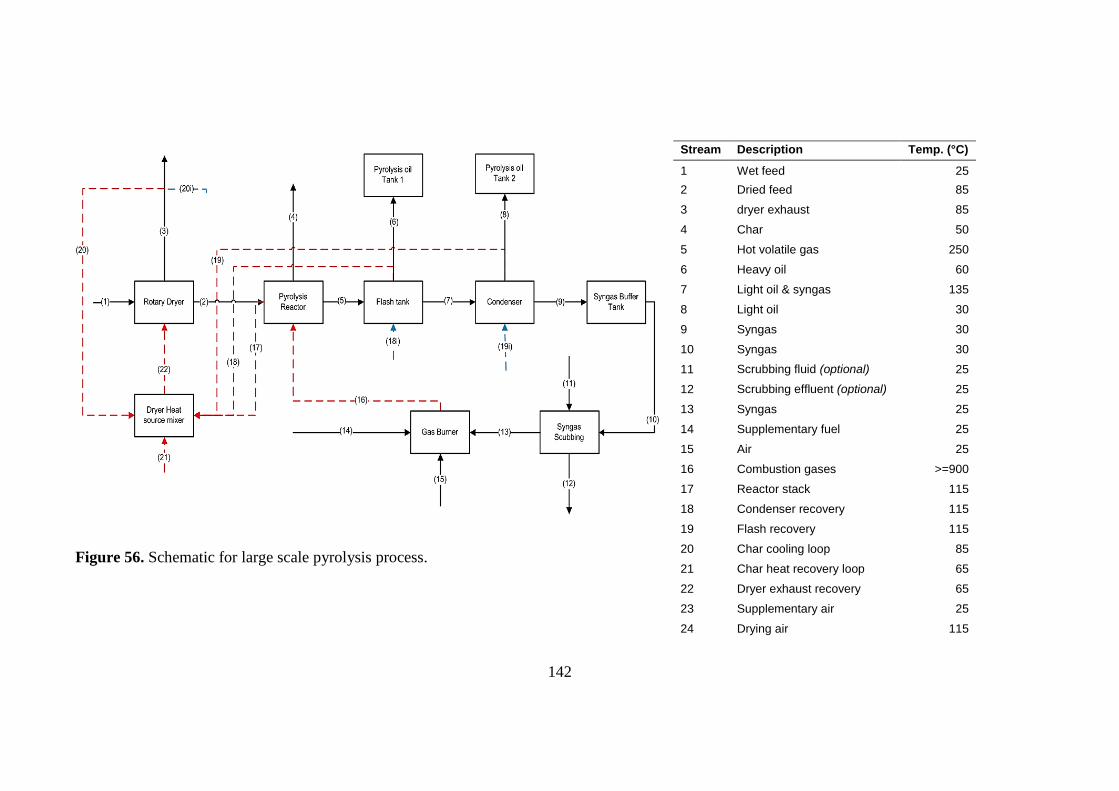
142
Figure 56. Schematic for large scale pyrolysis process.
Stream Description Temp. (°C)
1 Wet feed 25
2 Dried feed 85
3 dryer exhaust 85
4 Char 50
5 Hot volatile gas 250
6 Heavy oil 60
7 Light oil & syngas 135
8 Light oil 30
9 Syngas 30
10 Syngas 30
11 Scrubbing fluid (optional) 25
12 Scrubbing effluent (optional) 25
13 Syngas 25
14 Supplementary fuel 25
15 Air 25
16 Combustion gases >=900
17 Reactor stack 115
18 Condenser recovery 115
19 Flash recovery 115
20 Char cooling loop 85
21 Char heat recovery loop 65
22 Dryer exhaust recovery 65
23 Supplementary air 25
24 Drying air 115

143
Figure 57. Arrangement of equipment in shipping container showing no space for dryer.
Buffer tank
Flash tank
Condensing drum
reactor
Gas burner
Shipping container

144
5.1.2 General Assumptions for Large Scale Plant Design
The large scale plant design is adapted from Lakeland Steel’s pilot plant
technology and uses an auger reactor. The large scale plant design concept
was created based on the project brief specifications. The large scale plant
was needs to handle 3.45 t/hr. which amounts to a yearly throughput of
28,980 tonnes. It also had to be able to fit in a 40 foot/ 12m standard
shipping container. The size would effectively render this to be a mobile
plant. The design will therefore be dimension driven.
5.2 Large Scale Plant Design
The design process will emulate the anatomy of the chemical process shown
in Coulson and Richardsons Chemical Engineering handbook as shown in
Figure 58.
Figure 58. Generic Anatomy of Chemical Processes.
5.2.1 Feed Preparation
Pre-treatment refers to any processes prior to the main reaction which in this
case refers to pyrolysis. Pre-treatment includes procedures such as drying,
particle control. The later will not be considered an issue as the sawdust is
generally small grains with diameters ranging from approximately 2 to 4mm
on average with trace of fines and chips which are up to 15mm long, 4mm
Recycle of
unreacted material

145
wide and 2mm thick. The chips do not pose much threat in terms of mass
conveying but they introduce a slight risk in affecting the even heat
distribution. A simple grate can be used to prevent the inclusion of wood
chips into the hopper.
Dryer Design Selection Criteria 5.2.1.1
Appropriate drying technology is normally selected based on the criteria
shown in the ratings table. All ratings are out of 10, with 10 being the best
and 0 being the worst.
5.2.1.1.1 Operating Cost / Energy Demands
The two technology options being considered have slightly different
dependencies when it comes to operating costs. The rotary dryer operating
costs are generally dependent on the drying duty, whilst the multiple effect
evaporators use pressure swings to take advantage of the heat in the steam
from the evaporated water in the feedstock. This normally means the heat is
being recycled, with each cycle. This means the multiple effect dryer earns a
higher score of 9 while the rotary dryer has greater energy demands and thus
will be rated 7 in this category.
5.2.1.1.2 Compatibility with Feedstock
Some dryers require the feedstock to be pre-formed into specific shapes in
order for the drying to be processed. The rotary dryer gets 8 out of 10 based
on the fact that it can handle the sawdust really well. There are usually no
problems with blockages or any other material flowing characteristics. The
generic multiple effect evaporator normally requires feedstock to be
presented in a thin film. However by using augers with small spacing, the
thickness of the sawdust layer can be controlled. A heating jacket can be
used to indirectly heat the feedstock. The fact that the multiple effect
evaporators being used won’t be the conventional type gives it a rating of 5.

146
5.2.1.1.3 Capital Cost
Some technologies are generally more expensive and thus, using them can
only be justified at high production rates. The multiple effect evaporator is
given a rating of 5 because it is generally known to be expensive. The
number of cycles needed to dry the feedstock will typically determine the
capital cost as each effect will require pressure swing equipment and
housing for the feedstock. The sizing and costing of the rotary dryer is based
on the feedstock occupying around 10 - 15% of the dryer volume for air
circulation purposes. The simplicity of this design results in lower capital
compared to the multiple effect evaporators and this gives it a capital cost
rating of 7.
5.2.1.1.4 Maintenance
The main issue that arises with the maintenance of dryers is the ease of
cleaning in terms of residue sticking to walls. The rotary dryer gets a rating
of 8 because an optimal combination of installation angle and rotational
speed will ensure the feedstock doesn’t stick to the walls. The multiple
effect evaporators will require cleaning of the auger channels as the wet
sawdust can cause blockages. This earns the MEE a maintenance rating of 4.
5.2.1.1.5 Heating Method
The two methods being compared are direct and indirect heating. The direct
heating method being used in the rotary dryer is more efficient as the heat is
directly put into the feedstock. This gives it a rating of 8. The multiple effect
evaporator works on the principle of recycling heat but it also requires the
steam to be at a higher temperature than the air in the rotary dryer so this
gives it a rating of 6.
5.2.1.1.6 Versatility
The versatility of the dryer can be seen as its ability to handle a range of
feedstock and dry them to a range of moisture levels. The rotary dryer has
been rated 7 based on how easy it would be to process a range of feedstocks
or dry to different moisture contents and also handle a range of sawdust

147
particle sizes. The multiple effect evaporators will need to be resized to
account for the different flowing properties of the feedstock. This earns the
MEE a versatility rating of 5.
5.2.1.1.7 Conclusion
Based on this literature review, the most appropriate dryer types for the
project are rotary dryer and multiple effect dryers. This is because the
Rotary dryer is the most appropriate for the feedstock being considered and
the multiple effect evaporators have the potential to have the lowest
operating costs. The most applicable between the two can be determined
after modelling the two designs for the up-scaled plant model. Experimental
data from drying curves will be needed to facilitate the modelling.
The following table shows the rating of the two prospective drying
technologies.
Table 40. : Prospective dryer ratings.
Maximum
weighting
Rotary
Dryer
Multiple Effect
Dryer
Operating cost/ energy demands 10 7 9
Compatibility with feedstock 10 9 5
Capital Cost 10 7 5
Maintenance 10 8 4
Heating method 10 7 6
Versatility 10 7 5
Total (out of 60) 10 45 34
The ratings show that the rotary dryer is the best option for pre-drying the
sawdust.
Rotary Dryer Design 5.2.1.2
The rotary dryer design was based on sawdust
The design of the rotary dryer was performed using data collected from
drying characteristics obtained in labscale experiments. Feedstock drying
trials performed at 80, 90 and 100°C as described in the ‘Methodology’

148
section. Drying curves were used to determine the required residence time
of the sawdust for a100% efficient dryer.
The total energy needed to perform the drying was calculated using
(42)
Where Q is the total energy; U the volumetric heat transfer coefficient; t is
the temperature difference of the solids.
The volumetric heat transfer coefficient is calculated by:
(43)
Where M is the dry solids mass,
is the density of the solids
V is the volume of the sawdust,
G is the mass velocity of the air.
Assuming that the charge only takes up 10% of the volume and that the L/D
is within the 4-10 range as recommended by Perry’s (Moyers. and Baldwin
1999), the dimensions of the dryer can be solved simultaneously.
Calculations were performed (Figure 59) using a spread sheet to produce
dryers of the specifications in Table 41.
Figure 59. Mass and energy balance for sawdust drying.
Dryer
Dryer exhaust air 11,350 kg/hr 31 kJ/kg
Dry sawdust 1,628 kg/hr 126kJ/kg
Wet sawdust 3,450 kg/hr 72 kJ/kg
Drying air intake 9,528 kg/hr 117 kJ/kg

149
Table 41. Rotary dryer specifications.
Sawdust feed rate (kg/h) 3,450
Density (kg/m3) 250
Volume produced (m3) 12.3
Dry solids (kg/h) 1,380
Total moisture removed (kg/h) 2,070
Allowable moisture (@15% dry solids) (kg/h) 248
Pyrolysis charge (kg/h) 1,628
Water removed (kg/h) 1,821
Air needed (kg/hr) 9,528
Residence time(h) 1.65
Volume of dryer assuming feed is 10% vol (m3) 203
Length (m) 16.2
Diameter (m) 4
L/D ratio 4
Operating temperature (°C) 85
Q (MJ/h) 5,000
5.2.2 Reaction stage
Reactor design 5.2.2.1
The reactor is the heart of the process and requires a flexible approach to
design a unit which delivers the best aspects of a number of styles currently
available. Thus flexible design morphology can be used to design the large
scale unit.
5.2.2.1.1 Design Morphology
The variables considered for reactor design include:
Heating approach
Heat type
combustion, dielectric, electric– segmental vs. single input
Feeding considerations – pressure control: gravity assisted,
excess torque on auger,
Volatile gas extraction
Char extraction

150
Heat recovery - including preheating feedstock, accounting for
heat losses.
Table 42. Reactor design morphology overview.
Design variable Options
Heating
Approach
Direct Hot
combustion
gases
Indirect through
walls –
temperature
limited
Partial
combustion of
feedstock (more
a gasification
Heat type Combustion
gases
Dielectric Electric
Resistance
Steam
Feeding
Considerations
Stationary feed Moving bed Fluid assisted Mechanicall
y assisted
Volatile Gas
extraction
Buoyancy effect Post reactor
vacuum/ blower
Pre- reactor
pressure build
using
compressed
inert gas
Char Extraction Gravity Auger
Heat Recovery Heat exchange
with air
Heat exchange
with water
5.2.2.1.2 Reactor Concept Selection Criteria
Using this design morphology a strategic combination of the options can be
used to design a range of reactors. However, the reactor concept selection
will weigh two gas fired options a indirectly heated auger kiln vs. an
indirectly heated rotary kiln reactor. As stated earlier the auger kiln is an
adaptation of Lakeland Steel’s pilot plant whilst the rotary kiln was chosen
due to it being similar to the auger technology. The main difference is the
rotary kiln conveys the feedstock using a combination of gravity feeding
and flights along the reactor walls. Another difference worth noting is that
the rotary kiln relies a lot more on convection and has a higher void fraction
of about 45% reactor volume whilst the effective void fraction of the auger
is ~ 9%. The auger reactor does not actually have any void areas but the
effective void fraction is a result of the auger flights which displace ~9% the
volume. This value could change depending on the pitch and number of
flights being used (the auger in this thesis uses a double flight design).

151
5.2.2.1.3 Compatibility with Feedstock
Sawdust can be easily handled by either reactor concepts. Its physical
properties exhibit low fouling tendencies. Both reactors can be expected to
handle the feedstock well.
5.2.2.1.4 Capital Cost
Both concepts have been chosen due to their exceptional capital cost
compared to other reactors. They are relatively simple when compared to
other options such as microwave reactors or fluidised bed reactors.
5.2.2.1.5 Heating Method
The prospective concepts are both indirectly heated. However the auger
reactor can be expected to have a higher heat flux per unit area of the reactor
wall. This is because the rotary kiln has a high void fraction which
effectively causes difference in driving forces for the heat transfer
mechanism for the two sections of the reactor.
Figure 60. Schematic of heat transfer to feedstock.
The bottom will have a higher heat transfer coefficient whilst the top will be
lower due to the difference in thermal conductivity between the sawdust and
the air/void (Figure 60).
The rotary kiln would be more effective with directly fired heating approach
however; this can lead to a change of process from pyrolysis to gasification.

152
5.2.2.1.6 Versatility
The two reactors work well with feedstock types that have low caking
tendencies. However, the rotary kiln has an advantage as it can be easily
modified for caking materials by incorporation of flights and detachable
chains that clean the walls during processing. This is evident in gypsum
processing where slurries can be conveyed without much difficulty in
calcination processes. The auger kiln has shown tendencies to block when
feedstock of high moisture is fed through. For a fixed diameter, this can be
countered by increasing the linear flight density and increasing the torque
from the motor.
5.2.2.1.7 Operating Cost / Energy Demands and Maintenance
The two reactors appear to have low maintenance costs with non-caking
materials such as sawdust. This is because caking materials have a high
tendency to foul reactor walls and this can lower corresponding heat transfer
efficiencies.
The reactors both require the use of motors and deploy indirect heating.
Whilst the difference in operating cost of the motors might not be easily
distinguished without the aid of tedious sizing calculations, it can be noted
that the higher heating flux from the auger reactor is expected to give it
higher heat transfer efficiency. Therefore, the auger reactor can be expected
to have lower energy consumption.

153
Figure 61. Indirect-fired small Rotary kiln reactor (Courtesy of Harper
International, Lancaster, NY.).
Table 43. Reactor options ranking.
Maximum
weighting
Rotary
kiln
Auger
Operating cost/ energy demands and
Maintenance
10 7 8
Compatibility with feedstock 10 8 9
Capital Cost 10 6 7
Heating method 10 5 6
Versatility 10 8 7
Total (out of 50) 10 34 37
Conclusion 5.2.2.2
The auger reactor was chosen due to its superiority in terms of the selection
criteria discussed. The rotary kiln appears to be almost as effective as the
auger reactor. However, the auger kiln performance has already been proven
at a pilot scale.
Based on the comparisons made the auger reactor can be expected to be a
low cost and simple technology which can handle sawdust pyrolysis
successfully.

154
5.2.3 Reactor Design
This section demonstrates the tasks that were involved in designing the large
scale auger reactor. This design is based on a reactor operating at 400 °C
and approximately atmospheric pressure.
Figure 62. Reactor mass and energy balance.
Table 44. Reactor specifications.
Feed rate (kg/h) 1,628
Density (kg/m3) 250
Volume produced (m3) 12.3
Dry solids (kg/h) 1,380
Allowable moisture (@15% ds) (kg/h) 248
Residence time(h) 0.75
Volume of reactor (m3) 1.4
Length (m) 6.61
Diameter (m) 0.46
L/D ratio 13.2
Operating temperature (°C) 400 -600
Q (MJ/h) 2,400 – 2,700
Volatile matter 1,004 kg/hr 640 kJ/kg
Char 624 kg/hr 109 kJ/kg
Pre-dried sawdust 1,628 kg/hr 126 kJ/kg
Combustion gases 5,255 kg/hr 1,092 kJ/kg
Stack gases 5,255 kg/hr 121kJ/ kg
Heating jacket
Reactor

155
Figure 63. Large scale pyrolysis reactor.
5.2.4 Separation Phase
This section briefly describes the specifications of equipment used in the
large scale plant. The separation phase approach is merely an adaptation of
conventional oil and gas handling systems and is based common steps
applied in industry by technology such as OLGA (Könemann 2009). These
steps can be classified using two groups:
Dust/ particulate removal
Separation train based on component volatility
Cyclone 5.2.4.1
Cyclones are commonly used in industry to remove particulates from gas
streams. The syngas would normally require particulate removal, however,
in an attempt to deploy task integration and minimise the cost of running the
cyclone and space it will not be used.
Figure 64. Gas cyclone design commonly used in industry.
motor
motor
motor motor
heat input
reactor
volatile conditioning chamber
char collection

156
However, the cyclone can be used in association with the rotary dryer to
prevent release of fine particulates in the exhaust.
Flash Tank Design 5.2.4.2
The flash tank was designed to operate at atmospheric pressure, and
temperature of 135°C as determined from pilot plant trials. Temperature will
be maintained using a cooling jacket and air will be used as the heat
exchange medium. The flash tank will be tasked with extracting heavy
volatile organics and flocculating dust particulates from the hot volatile gas
stream due to the elimination of the cyclone.
Figure 65. Mass and energy balance for flash tank.
Table 45. Flash tank specification sheet.
Feed rate (kg/h) 1,004
Density (kg/m3) 1..2
Volumetric input (m3) 842
Liquid product (kg/h) 104
Vapour product (kg/h) 1,071
Residence time(seconds) 5
Volume of vessel (m3) 2.57
Hieght (m) 1.45
Diameter (m) 1.5
L/D ratio 0.97
Operating Temperature (°C) 135
Vapour discharge 815 kg/hr 348 kJ/kg
Heavy oil 189 kg/hr 143 kJ/kg
Hot volatiles 1,004 kg/hr 640 kJ/kg
Flash tank cooling air 4,731 kg/hr 65 kJ/kg
Flash tank heat recovery 4,731 kg/hr 118 kJ/kg
Cooling jacket
Flash tank

157
Condensing Drum Design 5.2.4.3
The condenser was designed to operate at atmospheric pressure, and
temperature of 30°C. Temperature will be maintained using a cooling jacket
and water as the heat exchange medium. The condenser drum will be tasked
with extracting light volatile organics and water vapour from the syngas
stream.
Figure 66. Mass and energy balance for condensing drum.
Table 46. Condensing drum specifications sheet.
Feed rate (kg/h) 815
Density (kg/m3) 0.99
Volumetric input (m3) 820
Liquid product (kg/h) 66
Vapour product (kg/h) 749
Residence time(seconds) 5
Volume of vessel (m3) 3.71
Hieght (m) 1.45
Diameter (m) 1.75
L/D ratio 0.83
Operating temperature (°C) 30
Syngas 749 kg/hr 64 kJ/kg
Light oil + water 66 kg/hr 126 kJ/kg
High volatility organics + water 815 kg/hr 348 kJ/kg
Cooling air 21,972 kg/hr 26 kJ/kg
Heat recovery air stream 21,972 kg/hr 39 kJ/kg
Condensing drum
Cooling jacket

158
5.2.5 Product Handling
This section describes the methods used in product storage and effluent
treatment. The three products of pyrolysis are bio char, syngas and bio-oil.
These products all have different destinations as a result of their market
value.
Biochar 5.2.5.1
Biochar storage has been very challenging due to its low density. This
means a large volume will be needed to store or transport a given mass. The
low density also affects the methods of application to soil. The char has to
be placed at a certain depth below the surface to prevent being blown by the
wind or being carried by water. This problem is usually solved by
pelletizing the char using dense additives as adhesives. The char can also be
explosive if allowed to dry, however the char being produced contains about
15% moisture, therefore, explosions are unlikely.
Gas Storage Tank 5.2.5.2
The syngas does not get produced at a constant rate due to the complex
kinetics of pyrolysis. Evolution of syngas does not only depend on fresh
feedstock as the source, the other two products are also potential reactants.
This means that the flow of syngas is always fluctuating. Since the process
aims to recycle syngas to achieve autogenesis, the flow rate needs to be kept
constant. This will be achieved by having a large tank that will act as a
buffer. The gas can be stored in the tank and released at a constant flow
once the tank pressure reaches a suitable level. The buffer tank can be made
of low carbon steel with lining to prevent risk of corrosion.
Effluent Treatment 5.2.5.3
Effluent streams such as the bio-oil can be recycled and mixed with the
fresh feedstock. Water can be purged. In cases where the oil properties do
not suit combustion due to corrosive nature or low heat content it can be
disposed of depending on the most economically viable solution. This will

159
be investigated once the properties of the oil being produced have been
assessed.

160
Chapter 6. Process
Economics Modelling

161
6.1 Introduction
This section presents preliminary capital and operating cost estimations for
the plant design presented in Chapter 5.
6.1.1 Assumptions for Base Case Economic model
Potential revenue streams include; char sales, landfill diversion
savings.
Carbon credits are not included in these case studies.
Equipment cost is estimated by the main plant item cost (MPIC)
method using quotes from SCENZ 2004 pricing and the New
Zealand consumer capital goods pricing index for inflation rates.
Commodity prices are based on market research performed using
quotes from current suppliers in the market (Berg., Sichone. et al.
2011, Sichone 2012).
All case studies are based on plant operation of 350 days/ 8400 hrs
per year.
All case studies are assumed to be operating at 80% plant capacity.
6.1.2 Base Case Economic model
Capital Cost 6.1.2.1
This sub-section presents the capital cost estimates associated with the
mobile large scale pyrolysis plant for sawdust described in the preceding
chapter 5. Total plant direct costs were calculated to be $460,306. Figure 67
gives an indication of the total plant direct cost distribution. The dryer is the
most expensive component accounting for 23% of the total plant direct cost.
The gas burner is follows at 21%.

162
Figure 67. Main plant equipment cost distribution for mobile large scale
design.
The total capital cost estimation was performed using steps recommended
by Peters (1991). Total plant direct costs were assumed to account for 75%
of the fixed capital investment. Indirect costs were assumed to account for
25% of the fixed capital costs, giving a value of $153,435. Working capital
was estimated at 15% of the fixed capital investment giving it a value of
$122,748. This brought the total capital investment to $736,489.
Table 47. Total capital investment breakdown.
Total Plant Direct Cost $460,306 Indirect Costs $153,435 Fixed Capital Investment $613,741 Working Capital $122,748 Total Capital Investment $736,489
Operating Costs 6.1.2.2
The operating costs of the design model were estimated using the
recommendations in Peters (1991). The total productions cost is estimated to
be $1,207,409 (Table 48). Considering an optimistic option where all the
char was sold adds a revenue source of $787,215 was obtained, leaving a
yearly loss of $420,194.
23%
16%
8% 6%
16%
2%
8%
21% Dryer
Reactor
Flash tank
Condensing drum
Syngas Buffer
Oil Tanks
Char handling system
Gas Burner

163
Table 48. Operating cost breakdown for mobile pyrolysis plant base case.
Plant Capacity 36,225 tonnes/yr Operating capacity 28,980 tonnes/yr
Manufacturing costs
A direct production costs @ 65% of total production cost Cost
1 Raw materials $115,920
2 Operating labour $393,161
3 Direct Supervisory & clerical labour $58,974
4 Utilities $108,380
5 Maintenance and Repairs $42,962
6 Operating supplies $6,444
7 Lab charges $58,974
8 Patents & royalties $0.00
9 Supplementary fuel $0.00
Total direct production costs $784,816
B. Fixed charges @15% of total product cost $181,111
C. General Expenses @ 20% total production cost $241,481
Total production cost $1,207,409
Gross earnings (Assuming all char is sold)
unit price Production (Tpa) Revenue
Char $150/t 5,248 $787,215
Total gross earnings
-$420,194
Payback (years)
-1.8
Minimum char price for Break even operation
$ 230.07
The char revenue was not enough to offset the operating costs and losses.
The negative payback period means there is no achievable payback period
for the process under these assumptions. The operating labour came at a cost
of $393,161 and appears to be the highest contributor to the total direct
production cost. It was determined that the minimum char price for the base
case to operate economically was $207 per tonne (disregarding marketing
mark-ups).
The syngas and oil were recovered and used as an energy source. It was
determined that the pyrolysis plant would be self-sufficient once steady
conditions were achieved. However, start-up would require the use of
supplementary fuel such as natural gas or LPG as used in the pilot plant
trials. The syngas and oil could not directly account for all heating

164
requirements. Therefore, heating of relatively low temperature process such
as drying was done using heat recovered from product streams in
condensation processes such as those in the flash tank and condensing drum.
Sensitivity Analysis Economic Models 6.1.2.3
A sensitivity analysis of the preliminary economic model was performed in
attempt to improve the process economics. The sensitivity analysis
establishes a basis for optimistic and pessimistic scenarios based on
probable scenarios.
6.1.2.3.1 Assumptions for Pessimistic Sensitivity Analysis
Capital costs –A syngas scrubber is needed. This might be the case if
the product gas is very sour due to high content levels of hydrogen
sulphide.
Operating costs – No char is sold. This assumption is based on the
limited bio char market in New Zealand.
6.1.2.3.2 Assumptions for Optimistic Sensitivity Analysis
Capital costs – The rotary dryer is not needed. This assumes the
feedstock can be processed without the need of a dryer. This
assumption ties in with the design limitations which do not allow for
a rotary dryer of the required dimensions as estimated in Chapter 5
Operating costs – A reduction of operating labour costs by 50%
based on automated nature of mobile plant.
Capital Cost 6.1.2.4
The capital cost sensitivity analysis is shown in Table 49. The analysis
showed that the pessimistic total capital investment in the pessimistic case
increases by 64% giving a value of $1,204,669 while the optimistic case
reduces capital investment by 19% with the value of $595,783.

165
Table 49. Sensitivity analysis for capital costs.
Pessimistic Base case Optimistic
Total Plant Direct Cost $752,918 $460,306 $372,364
Indirect costs $250,973 $153,435 $124,121
Fixed capital investment $1,003,891 $613,741 $496,486
Working Capital $200,778 $122,748 $99,297
Total Capital Investment $1,204,669 $736,489 $595,783
Operating Costs 6.1.2.5
The sensitivity analysis for the operating cost estimations are shown in
Table 50. The pessimistic case does not improve process feasibility and
increases the deficit by three times. On the other hand, the optimistic case
shows a gross net profit of $153,226 before taxes. This allows for a payback
period of approximately 4 years.
The sensitivity analysis showed that the even though the base case scenario
is not economically feasible, the process economics can be improved by
reduction of operating labour and reduction of the capital cost by excluding
the dryer.
The minimum char price for a payback period of four years appears to be
quite practical if the biochar market is established. Extensive agricultural
activities have reduced the content of carbon in the soil and biochar might
be sought after as a remedy. The minimum char price for break-even
operations refers to the amount that can be charged for the char once the
capital investment has been paid back. This assumes no profit is being
generated from char sales.
Saw mills are normally located near kilns and it is possible that excess heat
from the kilns and other onsite facilities could be used to dry the green
sawdust. Other factors such as transportation costs might need to be
considered. However in this case it is assumed that the plant will be driven
to the site.

166
Table 50. Sensitivity analysis for operating costs.
Plant Capacity 36,225 tonnes/yr
Operating capacity 28,980 tonnes/yr
Manufacturing costs
A. Direct production costs @ 65% of total production cost
Pessimistic Base case Optimistic
1 Raw materials $115,920 $115,920 $115,920
2 Operating labour $393,161 $393,161 $196,581
3 Direct Supervisory & clerical labour $58,974 $58,974 $19,658
4 Utilities $108,380 $108,380 $39,967
5 Maintenance and Repairs $70,272 $42,962 $34,754
6 Operating supplies $6,444 $6,444 $5,213
7 Lab charges $58,974 $58,974 $0
8 Patents & royalties $0.00 $0.00 $0
9 Supplementary fuel $0.00 $0.00 $0
Total direct production costs $812, 127 $784,816 $412,092
B. Fixed charges @15% total product cost
$187,413 $181,111 $95,098
C. General expenses @ 20% total production cost
$249,885 $241,481 $126,797
Total production cost $1,249,425 $1,207,409 $633,989
Gross earnings
Production (Tpa) Revenue Revenue Revenue
Char 5,248 0 $787,215 $787,215
Total gross earnings
-$1,249,425 -$420,194 $153, 226
Payback (years)
N/A -1.8 3.9
Minimum char price for Break- even operation
$238/t $ 230/t $120/t
Minimum char price for payback period of 4 years
$295/t $265/t $149/t

167
Chapter 7.
Conclusion and
Recommendations
168
7.1 General Findings
Lakeland Steel Limited developed a pilot plant for biomass pyrolysis based on
sawdust. The pilot plant was based on an auger screw design which was indirectly
heated using a double pipe heat exchange configuration to prevent oxidation
(combustion) of the feedstock.
Proximate analysis of sawdust gave a moisture content of 60%. The dry solids had
an organic matter content of 99.22% with ash making the balance. Ultimate
analysis was used to determine content levels of elemental carbon, hydrogen,
nitrogen sulphur and oxygen. The results on a dry basis were 47.2%, 6.5%, 0.3%,
0.3%, and 44.9 % respectively.
Drying models were also used to analyse the sawdust drying characteristics.
Drying curves were obtained experimentally and four models (Newton, Page,
Henderson and Pabis, Simpson and Tschernitz) were fitted to the data and their
accuracy of fit was determined using residual squared sum of errors. Page’s
model was used to describe the sawdust behaviour in the dryer design as it had the
highest accuracy.
The sawdust reaction kinetics were determined using data from thermogravimetric
analysis (TGA) and analysed using distributed action energy model. The kinetics
were observed at three heating rates of 10, 20 and 30 °C/min with a maximum
temperature of 900°C under an argon atmosphere. Sawdust was modelled as a
mixture of water, hemicellulose, cellulose and lignin. Good agreement between
Gaussian distribution functions for each component and experimental data were
observed.
Pilot plant trials were performed using a three factor-three level design of
experiment. The factors under investigation were; feedstock moisture content with
levels at 15, 30 and 60; reaction temperature with levels at 400, 450 and 500°C;
and reactor auger speed with levels at 15, 20 and 25 rpm. Experiments at 60%
moisture could not be performed to completion as the auger blocked repeatedly.
The other two moisture contents showed that moisture content enhanced heat
exchange properties of the feedstock and this generally increased the amount of

169
volatile organic matter released. It was observed that for 15% moisture sawdust
increase of temperature did not consistently exhibit an increase in degree of
devolatilisation of organic matter. However, the 30% moisture sawdust showed an
increase in devolatilisation with increase in temperature. The effects of increasing
reactor auger speed had the most consistent trend with which an increase in speed
showed a decrease in degree of devolatilisation thus increasing char yield.
The empirical data collected from lab scale and pilot plant experiments were used
to create mass and energy balances. These were the basis of the large scale mobile
pyrolysis plant which was designed to process 3.45 tonnes per hour. Due to size
restrictions the large scale dryer was not fitted in the container. It was then
determined that the feedstock would either be dried using an onsite kiln or the
reactor would process green sawdust.
A preliminary economic feasibility assessment was performed for the base case
scenario which processed pre-dried sawdust of 15% moisture content at 400°C
and a retention time of 45 minutes. The base case proved infeasible due to high
operating costs and low revenue generation from char sales. It was determined
that the base case scenario required char to be sold at a minimum of $265/t for a
four year payback period.
A sensitivity analysis based on predicted optimistic conditions showed that
removal of a dryer and automation of the plant which reduced labour by 50% had
the potential to increase the economic viability of the large scale process. This
reduced the capital and operating costs to $608,234 and $636,559 respectively.
The optimistic scenario ensured a payback period of 4 years.
The pessimistic case assumed the char had no value and the syngas required
scrubbing. This increased the capital costs from $748,940 to $1,217,120 and
operating costs from $1,209,979.21 to $1,251,995. The pessimistic scenario
required char to be sold at a minimum of $295/t for a four year payback period.
7.2 Recommendations for Future Work
Future work would attempt to involve characterisation of compounds from the
bio-oil fraction. This was not done because the oil fractions have been identified

170
to need extra processing steps before they can be used as a conventional liquid
fuel. The literature review suggested that the bio-oil can be a source of numerous
types of hydrocarbons and precursors. These organic compounds might improve
the revenue generated from the processing plant.
A larger factorial study looking at a greater number of temperatures, feed rates
and moisture contents could be beneficial to a greater understanding of the effects
of these parameters on char, gas and oil yields observed.
The heating rate of the sawdust during pilot plant trials has been discussed briefly.
It has been related to the reactor auger speed (analogous of sawdust feed rate), the
maximum reaction temperature and the driving force for heat transfer from the
combustion gases through the reactor wall. A temperature profile with data
collected at five points on the reactor shell was used. However, a high resolution
temperature profile which collects more data might give a better indication of the
actual heating rate experienced by the sawdust.
Raman spectrometry was used to verify the maximum reaction temperatures for
the produced char samples by tracking the position of the G band. This
comparison is subjective to the residence time of the batch processed char samples
used as calibration values. Raman spectroscopy could be used to provide more
information on the char structural properties which might give a broader picture of
the degree of carbonisation of the samples.
Online composition analysis of syngas would also be recommended. This is
because syngas production rates were observed to vary for different times of the
process. It was unknown whether the fluctuation of the production rates has an
impact on the composition and therefore the calorific content of the syngas.
The thesis obtains reaction kinetics based on the devolatisation of the organic
matter. However an additional model that could predict the kinetics of
carbonisation would help in creating a global model for the whole process.

171
References
Solids - Specific Heats, The Engineering Toolbox.
(IBI), I. B. I. (2011). Standardized Product Definition and Product Testing
Guidelines for Biochar That Is Used in Soil.
(USA), D. o. E. C. (2013). "Lumber Pressure Treated With Chromated Copper
Arsenate." Retrieved 07/02/2013, 2013.
A.V.Bridgewater. (2004). "Biomass Fast Pyrolysis." Thermal Science 8(2): 21-49.
Aboyade, A. O., T. J. Hugo, M. Carrier, E. L. Meyer, R. Stahl, J. H. Knoetze and
J. F. Görgens (2011). "Non-isothermal kinetic analysis of the devolatilization
of corn cobs and sugar cane bagasse in an inert atmosphere." Thermochimica
Acta 517(1–2): 81-89.
ACUSIM Shell and tube Heat exchangers.
AG, V. P. S. (2011). "Range of VC999 Packaging Machines." Retrieved
05/12/2011, 2011, from http://www.packaging-int.com/suppliers/inauen-
maschinen-ag-vc999-packaging-systems.html.
Alden, N., Z. Humerick and A. Teixeira (2009). Molten Salt Gasification of
Biomass, Worcester Polytechnic Institute.
Anis, S. and Z. A. Zainal (2011). "Tar reduction in biomass producer gas via
mechanical, catalytic and thermal methods: A review." Renewable and
Sustainable Energy Reviews 15(5): 2355-2377.
Antal, M. J. and M. Grønli (2003). "The Art, Science, and Technology of
Charcoal Production†." Industrial & Engineering Chemistry Research 42(8):
1619-1640.
Antal, M. J. and G. Varhegyi (1995). "CELLULOSE PYROLYSIS KINETICS -
THE CURRENT STATE KNOWLEDGE." Industrial & Engineering
Chemistry Research 34(3): 703-717.

172
Apt, J., A. Newcomer, L. B. Lave, S. Douglas, L. M. Dunn and M. Reed (2008).
An Engineering-Economic Analysis of Syngas Storage. U. National Energy
Technology Laboratory.
alat M. M. alat E. Kırtay and H. alat (2009). "Main routes for the thermo-
conversion of biomass into fuels and chemicals. Part 1: Pyrolysis systems."
Energy Conversion and Management 50(12): 3147-3157.
Balci, S., T. Dogu and H. Yucel (1993). "Pyrolysis kinetics of lignocellulosic
materials." Industrial & Engineering Chemistry Research 32(11): 2573-2579.
Barrow, C. J. (2012). "Biochar: Potential for countering land degradation and for
improving agriculture." Applied Geography 34(0): 21-28.
Basu, P. (2010). Biomass Gasification and Pyrolysis : Practical Design and
Theory.
Behrens, M. (2013). Solid State Kinetics, Fritz Haber Institute of the Max Planck
Society Department of Inorganic Chemistry.
Berg., L. v. d., K. Sichone. and H. Kay (2011). EW PYROLYSIS:Market and
Technical Assessment, WaikatoLink.
Boyles, D. (1984). Bio-Energy: Technology ,Thermodynamics and Costs.
Bradley, D. (2006). European Market Study for BioOil (Pyrolysis Oil), Climate
Change Solutions.
Branan, C. R. (2005). 2 - Heat Exchangers. Rules of Thumb for Chemical
Engineers (Fourth Edition). Burlington, Gulf Professional Publishing: 29-58.
Branan, C. R. (2005). 8 - Separators/Accumulators. Rules of Thumb for Chemical
Engineers (Fourth Edition). Burlington, Gulf Professional Publishing: 142-
152.
Branan, C. R. (2005). 12 - Gasification. Rules of Thumb for Chemical Engineers
(Fourth Edition). Burlington, Gulf Professional Publishing: 201-212.
Branca, C., A. Albano and C. Di Blasi (2005). "Critical evaluation of global
mechanisms of wood devolatilization." Thermochimica Acta 429(2): 133-141.

173
Braun, R. L. and A. K. Burnham (1987). "Analysis of chemical reaction kinetics
using a distribution of activation energies and simpler models." Energy &
Fuels 1(2): 153-161.
Bridgwater, A. V. (1999). "Principles and practice of biomass fast pyrolysis
processes for liquids." Journal of Analytical and Applied Pyrolysis 51(1–2):
3-22.
Bridle, T. (2011). Waste to Energy: Alternative uses for paunch waste and DAF
sludge - Waste pyrolysis Review, Bridle Consulting.
Brinkman, A. W. and J. Carles (1998). "The growth of crystals from the vapour."
Progress in Crystal Growth and Characterization of Materials 37(4): 169-209.
Bulushev, D. A. and J. R. H. Ross (2011). "Catalysis for conversion of biomass to
fuels via pyrolysis and gasification: A review." Catalysis Today 171(1): 1-13.
Butler, E., G. Devlin, D. Meier and K. McDonnell (2011). "A review of recent
laboratory research and commercial developments in fast pyrolysis and
upgrading." Renewable and Sustainable Energy Reviews 15(8): 4171-4186.
Cheremisinoff, N. P. (2000). Handbook of chemical processing equipment.
Chibante, V., A. Fonseca and R. Salcedo (2007). "Dry scrubbing of acid gases in
recirculating cyclones." Journal of Hazardous Materials 144(3): 682-686.
Choi, H. S., Y. S. Choi and H. C. Park (2012). "Fast pyrolysis characteristics of
lignocellulosic biomass with varying reaction conditions." Renewable Energy
42(0): 131-135.
co.Ltd, C. H. B. m. e. (2011). "Products." Retrieved 05/12/2011, 2011, from
http://www.cnhengbo.com/en/index.asp.
Crocker, M., Ed. (2010). Thermochemical Conversion of Biomass to Liquid Fuels
and Chemicals.
D.Zhang. and S.Lilly. (2005). "Low-temperature Pyrolysis of Sewage Sludge and
Putrescible Garbage for Fuel Oil Production." Fuel 84: 809-815.
Demirbaş A. (2000). "Mechanisms of liquefaction and pyrolysis reactions of
biomass." Energy Conversion and Management 41(6): 633-646.

174
Diebold, J. P. (1994). "A unified, global model for the pyrolysis of cellulose."
Biomass and Bioenergy 7(1–6): 75-85.
Dominguez., A., J. A. Menendez, M. Inguanzo and J. j. Pis (2006). "Production of
bio-fuels by high temperature pyrolysis of sewage sludge using conventional
and microwave heating." Bioresource Technology 97: 1185-1193.
Downie, A. (2008). Base Case in NSW, Au.
Downie, A. (2010-2011). EW PYROLYSIS:Market and Technical Assessment. L.
v. d. Berg. Hamilton City.
Dupont, C., L. Chen, J. Cances, J.-M. Commandre, A. Cuoci, S. Pierucci and E.
Ranzi (2009). "Biomass pyrolysis: Kinetic modelling and experimental
validation under high temperature and flash heating rate conditions." Journal
of Analytical and Applied Pyrolysis 85(1–2): 260-267.
Dutta, A. (2007). Bio-energy for achieving MDGs in Asia(Lecture 3), Asian
Institute of Technology, School of Environment, Resources and development.
Elliott, D. C. (2010). EW PYROLYSIS:Market and Technical Assessment. L. v. d.
Berg, WaikatoLink.
Exports, C. E. (2011). "Industrial Evaporation Technologies." Retrieved
05/12/2011, 2011, from http://www.compevaporators.com/multi-effect-
evaporators.html.
Fabrication, S. S. (2011). "Dryer." Retrieved 5/12/2011, 2011, from
http://www.indiamart.com/ss-fabrication/dryer.html.
Fake, D. M., A. Nigam and M. T. Klein (1997). "Mechanism based lumping of
pyrolysis reactions: Lumping by reactive intermediates." Applied Catalysis A:
General 160(1): 191-221.
FAO and N. R. M. a. E. Department (unknown). INTEGRATED ENERGY
SYSTEMS IN CHINA - THE COLD NORTHEASTERN REGION
EXPERIENCE... The research progress of biomass pyrolysis processes, ,
Natural Resources Management and Environment Department
French, R. and S. Czernik (2010). "Catalytic pyrolysis of biomass for biofuels
production." Fuel Processing Technology 91(1): 25-32.

175
Imam, T. and S. Capareda (2012). "Characterization of bio-oil, syn-gas and bio-
char from switchgrass pyrolysis at various temperatures." Journal of
Analytical and Applied Pyrolysis 93(0): 170-177.
Intelligence, G. M. (2012). Materials for Heat Exchanger Tubes.
John McDonald-Wharry, M. M.-H., Kim Pickering (2012). Carbonisation of
biomass-derived chars and the thermal reduction of a graphene oxide sample
studied using Raman spectroscopy.
Jones, D. J. (2010). EW PYROLYSIS:Market and Technical Assessment. L. v. d.
Berg.
Kaneko, T., F. Derbyshire, E. Makino, D. Gray and M. Tamura (2000). Coal
Liquefaction. Ullmann's Encyclopedia of Industrial Chemistry, Wiley-VCH
Verlag GmbH & Co. KGaA.
Kapdi, S. S., V. K. Vijay, S. K. Rajesh and R. Prasad (2005). "Biogas scrubbing,
compression and storage: perspective and prospectus in Indian context."
Renewable Energy 30(8): 1195-1202.
Könemann, J. W. (2009). OLGA Tar Removal Technology, Dahlman.
Kovács, T., I. G. Zsély, Á. Kramarics and T. Turányi (2007). "Kinetic analysis of
mechanisms of complex pyrolytic reactions." Journal of Analytical and
Applied Pyrolysis 79(1–2): 252-258.
Lédé, J. (1994). "Reaction temperature of solid particles undergoing an
endothermal volatilization. Application to the fast pyrolysis of biomass."
Biomass and Bioenergy 7(1–6): 49-60.
Lehmann, J. and S. Joseph (2012). Biochar for Environmental Management:
Science and Technology.
Lehmann, J., M. C. Rillig, J. Thies, C. A. Masiello, W. C. Hockaday and D.
Crowley (2011). "Biochar effects on soil biota – A review." Soil Biology and
Biochemistry 43(9): 1812-1836.
Li, G. Wang, X. Meng and J. Gao (2008). "Catalytic Pyrolysis of Gas Oil Derived
from Canadian Oil Sands Bitumen." Industrial & Engineering Chemistry
Research 47(3): 710-716.

176
Liu, Z.-S., M.-Y. Wey and C.-L. Lin (2002). "Reaction characteristics of Ca(OH)2,
HCl and SO2 at low temperature in a spray dryer integrated with a fabric
filter." Journal of Hazardous Materials 95(3): 291-304.
Lu, Q., W.-Z. Li and X.-F. Zhu (2009). "Overview of fuel properties of biomass
fast pyrolysis oils." Energy Conversion and Management 50(5): 1376-1383.
Made-in-China.com. (2008). "Forage Dryer." Retrieved 05/12/2011, 2011, from
http://cn2drying.en.made-in-china.com/product/uqVEBCgLAXcl/China-
Forage-Dryer.html.
Made-in-China.com. (2011). "Screw Conveyor-GX-LS." Retrieved 5/12/2011,
2011, from http://www.hellotrade.com/jyoti-engineering/rotary-drum-
dryers.html.
Mcbirdle, T. (2011). EW PYROLYSIS:Market and Technical Assessment. L. v. d.
Berg. Hamilton Cty.
Mehrabian, R., R. Scharler and I. Obernberger (2012). "Effects of pyrolysis
conditions on the heating rate in biomass particles and applicability of TGA
kinetic parameters in particle thermal conversion modelling." Fuel 93(0):
567-575.
Mohan, D., C. U. Pittman and P. H. Steele (2006). "Pyrolysis of Wood/Biomass
for Bio-oil: A Critical Review." Energy & Fuels 20(3): 848-889.
Moyers., C. G. and G. W. Baldwin (1999). Perry's, Chemical Engineers'
Handbook.
Müller-Hagedorn, M., H. Bockhorn, L. Krebs and U. Müller (2003). "A
comparative kinetic study on the pyrolysis of three different wood species."
Journal of Analytical and Applied Pyrolysis 68–69(0): 231-249.
Oasmaa, A. and C. Peacocke (2010) "Properties and fuel use of biomassderived
fast pyrolysis liquids :A guide."
Ohtsuka, Y., N. Tsubouchi, T. Kikuchi and H. Hashimoto (2009). "Recent
progress in Japan on hot gas cleanup of hydrogen chloride, hydrogen sulfide
and ammonia in coal-derived fuel gas." Powder Technology 190(3): 340-347.
Oziemen., D. and F. Karaosmanoglu. (2004). "Productionand Characterization of
Bio-oil and Biochar from Rapeseed Cake." Renewable Energy 29: 779- 787.

177
Papadikis, K., S. Gu, A. V. Bridgwater and H. Gerhauser (2009). "Application of
CFD to model fast pyrolysis of biomass." Fuel Processing Technology 90(4):
504-512.
Peters, M. S. (1991). Plant design and economics for chemical engineers. New
York.
Pharmainfo.net. (2007). "Fluidised Bed Systems: A review." Retrieved
05/12/2011, 2011, from http://www.pharmainfo.net/free-books/fluidized-bed-
systems-review.
Purchas., C., S. Tammik., T. Hewitt. and A. Hutchinson. (2009). Organic Waste
Options Study. B. Clarke. and N. Milton.
PYNE (2006). UPR 42 Biomasse – Energie CIRAD - FORET
Material Safety Data Sheet. France.
Rezaiyan, J. and N. P. Cheremisinoff (2005). Gasification Technologies.
Richardson, Y., J. Blin and A. Julbe (2012). "A short overview on purification and
conditioning of syngas produced by biomass gasification: Catalytic strategies,
process intensification and new concepts." Progress in Energy and
Combustion Science 38(6): 765-781.
Sauerbrunn, S. and P. Gill Decomposition kinetics using TGA.
Sewry J. D. and M. E. rown (2002). "“Model-free” kinetic analysis?"
Thermochimica Acta 390(1–2): 217-225.
Sharma, S. D., M. Dolan, D. Park, L. Morpeth, A. Ilyushechkin, K. McLennan, D.
J. Harris and K. V. Thambimuthu (2008). "A critical review of syngas
cleaning technologies — fundamental limitations and practical problems."
Powder Technology 180(1–2): 115-121.
Sichone, K. (2012). Optimisation of an organic waste pyrolysis economic
feasibility model by pre-drying feedstock, The University of Waikato.
Simpson, W. and J. Tschernitz (1979). Importance of Thickness Variation in Kiln
Drying Red Oak Lumber. Madison, Wisconsin, Forest Products Laboratory
U.S. Forest Service.
178
Sipilä, K., E. Kuoppala, L. Fagernäs and A. Oasmaa (1998). "Characterization of
biomass-based flash pyrolysis oils." Biomass and Bioenergy 14(2): 103-113.
Slesser., M. and C. Lewis. (1979). Biological Energy Resources.
Smith., J., M.Garcia-Perez. and K.C.Das. (2009). "Producing Fuel and Speciality
Chemicals from the Slow Pyrolysisof Poultry DAF Skimmings." Journal of
Analytical and Applied Pyrolysis 86: 115-121.
Sonobe, T. and N. Worasuwannarak (2008). "Kinetic analyses of biomass
pyrolysis using the distributed activation energy model." Fuel 87(3): 414-421.
Strezov, V., T. J. Evans and C. Hayman (2008). "Thermal conversion of elephant
grass (Pennisetum Purpureum Schum) to bio-gas, bio-oil and charcoal."
Bioresource Technology 99(17): 8394-8399.
Sutton, D., B. Kelleher and J. R. H. Ross (2001). "Review of literature on
catalysts for biomass gasification." Fuel Processing Technology 73(3): 155-
173.
Taylor, P., Ed. (2010). The Biochar Revolution.
The_Engineering_Toolbox Solids- Specific Heats, The Engineering Toolbox.
Thompson, R., Ed. ( 1995). Industrial Inorganic Chemicals: Production and Uses
Vamvuka, D. (2011). "Bio-oil, solid and gaseous biofuels from biomass pyrolysis
processes-An overview." International Journal of Energy Research 35(10):
835-862.
Van de Velden, M., J. Baeyens, A. Brems, B. Janssens and R. Dewil (2010).
"Fundamentals, kinetics and endothermicity of the biomass pyrolysis
reaction." Renewable Energy 35(1): 232-242.
rhegyi G. b. . . ob ly, E. Jakab and H. Chen (2010). "Thermogravimetric
Study of Biomass Pyrolysis Kinetics. A Distributed Activation Energy Model
with Prediction Tests." Energy & Fuels 25(1): 24-32.
Verheijen, F., S. Jeffery, A. C. Bastos, M. v. d. V. and I. Diafas (2010). Biochar
Application to Soils - A Critical Scientific Review of Effects on Soil
Properties, Processes and Functions Luxembourg: Office for Official
Publications of the European

179
Communities, European Commission, Joint Research Centre Institute for
Environment and Sustainability.
White, J. E., W. J. Catallo and B. L. Legendre (2011). "Biomass pyrolysis kinetics:
A comparative critical review with relevant agricultural residue case studies."
Journal of Analytical and Applied Pyrolysis 91(1): 1-33.
Xu, X. D., Y. Matsumura, J. Stenberg and M. J. Antal (1996). "Carbon-catalyzed
gasification of organic feedstocks in supercritical water." Industrial &
Engineering Chemistry Research 35(8): 2522-2530.
Zhang, L. (2010 ). "Overview of recent activities in thermo-chemical conversion
of biomass. ." Energy Conversion and Management 51: 969-982.
i Hasler P, Nussbaumer T. Gas cleaning for IC engine applications from fixed
bed biomass gasification. Biomass Bioenergy 1999;16:385–95.