research center of fluid machinery engineering and
TRANSCRIPT

J. Cent. South Univ. (2014) 21: 1017−1024 DOI: 10.1007/s1177101420322
Statistical analysis of pressure fluctuations during unsteady flow for lowspecificspeed centrifugal pumps
PEI Ji(裴吉), WANG Wenjie(王文杰), YUAN Shouqi(袁寿其)
Research Center of Fluid Machinery Engineering and Technology, Jiangsu University, Zhenjiang 212013, China
© Central South University Press and SpringerVerlag Berlin Heidelberg 2014
Abstract: A threedimensional transient numerical simulation was conducted to study the pressure fluctuations in lowspecificspeed centrifugal pumps. The characteristics of the inner flow were investigated using the SST k–ω turbulence model. The distributions of pressure fluctuations in the impeller and the volute were recorded, and the pressure fluctuation intensity was analyzed comprehensively, at the design condition, using statistical methods. The results show that the pressure fluctuation intensity increases along the impeller streamline from the leading edge to the trailing edge. In the impeller passage, the intensity near the shroud is much higher than that near the hub at the inlet. However, the intensity at the middle passage is almost equal to the intensity at the outlet. The pressure fluctuation intensity is the highest at the trailing edge on the pressure side and near the tongue because of the rotor–stator interaction. The distribution of pressure fluctuation intensity is symmetrical in the axial cross sections of the volute channel. However, this intensity decreases with increasing radial distance. Hence, the pressure fluctuation intensity can be reduced by modifying the geometry of the leading edge in the impeller and the tongue in the volute.
Key words: transient; pressure fluctuation intensity; statistics; low specific speed; centrifugal pump
1 Introduction
Centrifugal pumps are widely used to transport water in most fields of economic development. However, the complex inner flow phenomena of centrifugal pumps, such as strong rotor–stator interaction, can generate hydraulic excitation forces and give rise to pressure fluctuations. The pressure fluctuations thus generated have a significant influence on stability, performance, vibration, and noise of the centrifugal pumps. Therefore, it is essential to study these unsteady pressure fluctuations. In recent years, with the development of computational fluid dynamics and advanced methods of measurement, numerous numerical simulations and experiments have been conducted to research pressure fluctuations.
ARNDT et al [1] investigated the rotor–stator interaction in centrifugal pumps with radial diffusers by measuring and analyzing the pressure fluctuations on the impeller blades and the diffuser vanes. GUO and MARUTA [2] measured the pressure fluctuations induced by rotor–stator interaction on the rotating impeller, using a high speed pressure sensor. It was demonstrated that the pressure fluctuations on the blades, and the static pressures in the volute, have a strong
relationship. YAO et al [3] measured the pressure fluctuations in doublesuction centrifugal pumps under various operating conditions and concluded that the pressure fluctuations at the blade passing frequency were most prominent near the volute tongue zone. KHALIFA et al [4] measured the distribution of pressure fluctuations in the boiler feed pump, and then analyzed the laws of distribution in the pump under offdesign conditions. PAVESI et al [5] measured the pressure fluctuations in the inlet duct and the impeller discharge and demonstrated that an asymmetrical rotating pressure structure existed at the impeller discharge.
Numerical simulations on pressure fluctuations have been performed by a number of researchers. SPECE and AMARALTEIXESRA [6] analyzed the effect of four parameters, i.e., cutwater gap, vane arrangement, snubber gap, and sidewall clearance, on the pressure fluctuations in a centrifugal pump by using a Taguchi method and found that the cutwater gap and vane arrangement had a greater influence on the pressure fluctuations. GONZÁLEZ et al [7] calculated the effects of unsteady flow due to impeller–volute interaction in a centrifugal pump, using numerical simulations and concluded that the pressure fluctuations in the blade frequency represented the blade–tongue interaction with the flow at the impeller outlet plane. GAYO et al [8]
Foundation item: Projects(51239005, 51009072) supported by the National Natural Science Foundation of China; Project(2011BAF14B04) supported by the National Science & Technology Pillar Program of China; Project(13JDG084) supported by the Research Foundation for Advanced Talents of Jiansu University, China
Received date: 2013−03−12; Accepted date: 2013−09−01 Corresponding author: PEI Ji, PhD; Tel: +86−13776474939; Email: [email protected]
J. Cent. South Univ. (2014) 21: 1017−1024 1018
investigated the unsteady pressure distribution existing in the volute of a conventional centrifugal pump. The results showed that the blade–tongue interaction was dominant in the generation of the dynamic pressure field in the volute, under offdesign conditions. SPECE and AMARALTEIXEIRA [9] calculated the pressure pulsations in a centrifugal pump by solving the URANS equations. The results showed that, overall, the CFD analysis agreed reasonably well with the experimental data. BARRIO et al [10] calculated the unsteady flow near the tongue region of a singlesuction volutetype centrifugal pump. The results indicated that the flow pulsation was directly related to the passage of the blades in front of each reference position. FENG et al [11] calculated the unsteady flow with different blade number configurations and different radial gaps between the impeller and the diffuser, using ANSYS CFX. The results demonstrated that the biggest pressure fluctuation on the blade occurred at the trailing edge of the impeller. YUAN et al [12] calculated the pressure fluctuation frequency in a centrifugal pump under different operating conditions and concluded that the dominant frequencies of pressure fluctuations were the blade passing frequency and its integer harmonics. ZHANG et al [13] calculated the pressure fluctuation at the inlet and outlet of the rotor in an axial pump and demonstrated that the periodic pressure fluctuations could be calculated while the amplitude of fluctuation increased from the hub to the tip of the blade.
In previous works, only a few monitoring points were set on the computational domains to study the unsteady pressure fluctuations, as the time and frequency domains were analyzed. Thus, pressure fluctuations could not be easily investigated in the entire domain. In this work, a singlestage, singlesuction centrifugal pump is selected for the numerical simulation model, and the pressure fluctuation intensity is defined in the entire domain to study the unsteady nature of the flow. The standard deviation, maximum, minimum, and average pressure coefficient values at each grid node in the flow domain are calculated in CFDPost. The unsteady pressure fluctuation distribution and intensity are evaluated directly and comprehensively using statistical methods.
2 Geometry of the pump
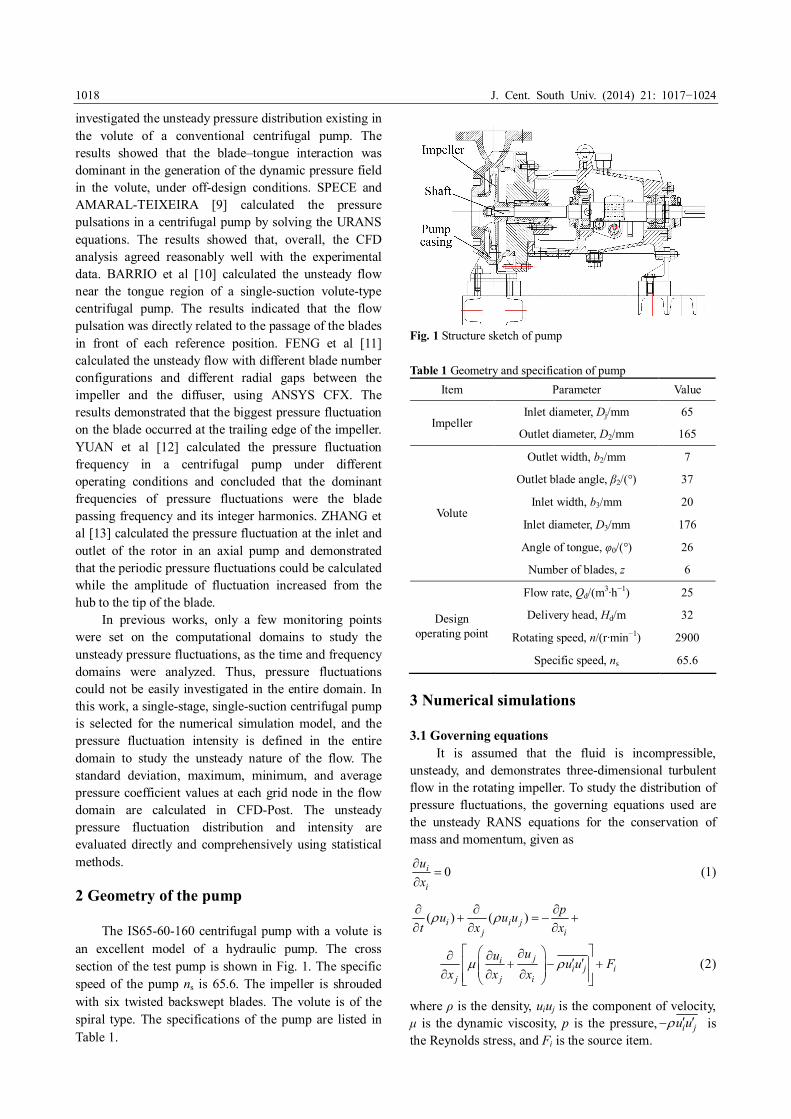
The IS6560160 centrifugal pump with a volute is an excellent model of a hydraulic pump. The cross section of the test pump is shown in Fig. 1. The specific speed of the pump ns is 65.6. The impeller is shrouded with six twisted backswept blades. The volute is of the spiral type. The specifications of the pump are listed in Table 1.
Fig. 1 Structure sketch of pump
Table 1 Geometry and specification of pump Item Parameter Value
Inlet diameter, Dj/mm 65 Impeller
Outlet diameter, D2/mm 165
Outlet width, b2/mm 7
Outlet blade angle, β2/(°) 37
Inlet width, b3/mm 20
Inlet diameter, D3/mm 176
Angle of tongue, φ0/(°) 26
Volute
Number of blades, z 6
Flow rate, Qd/(m 3 ∙h −1 ) 25
Delivery head, Hd/m 32
Rotating speed, n/(r∙min −1 ) 2900 Design
operating point
Specific speed, ns 65.6
3 Numerical simulations
3.1 Governing equations It is assumed that the fluid is incompressible,
unsteady, and demonstrates threedimensional turbulent flow in the rotating impeller. To study the distribution of pressure fluctuations, the governing equations used are the unsteady RANS equations for the conservation of mass and momentum, given as
0 i
i
u x
∂ =
∂ (1)
( ) ( ) i i j j i
p u u u t x x
ρ ρ ∂ ∂ ∂
+ = − + ∂ ∂ ∂
j i i j i
j j i
u u u u F x x x
µ ρ ∂ ∂ ∂ ′ ′ + − + ∂ ∂ ∂
(2)
where ρ is the density, uiuj is the component of velocity, μ is the dynamic viscosity, p is the pressure, i j u u ρ ′ ′ − is the Reynolds stress, and Fi is the source item.

J. Cent. South Univ. (2014) 21: 1017−1024 1019
3.2 Turbulence model The shear stress transport (SST) turbulence model
was chosen to enclose the equations [14]. The SST model is a modified k−ω turbulence model. It is a hybrid model derived from k−ω and k−ε turbulence models, which can switch automatically between the nearwall area and main flow area. The transport equations for k and ω are as follows:
m m m ,m ,m ( ) ( ) [( ) ] l k t k u k k t
ρ ρ µ σ µ ∂
+ ∇ ⋅ = ∇ ⋅ + ∇ + ∂
* m
i ij
j
u k
x τ β ρ ω
∂ −
∂ (3)
m m m ,m ,m ( ) ( ) [( ) ] l t u t ω ρ ω ρ ω µ σ µ ω
∂ + ∇ ⋅ = ∇ ⋅ + ∇
∂ +
* 2 m 1 m 2
1 2(1 ) i
ij t j j j
u k F x x x ω
γ ω τ β ρ ω ρ σ
υ ω ∂ ∂ ∂
− + − ∂ ∂ ∂
(4) where the turbulent viscosity of the mixture is computed by
1 ,m m
1 2 max( , ) t k
F α
µ ρ α ω Ω
= (5)
Two series of model parameters are involved in the SST k−ω model. A k−ω formulation is applied to the inner parts of the boundary layer using the following parameters: σk1=0.85, σω1=0.5, β1=0.075, β * =0.09, κ=0.41,
and * 2 * 1 1 1 / / ω γ β β σ κ β = − . The SST formulation
switches to a k−ε behavior in the freestream, using the following parameters: σk2=1.0, σω2=0.856, β2=0.828,
β * =0.09, κ=0.41, and * 2 * 2 2 2 / / ω γ β β σ κ β = − .
3.3 Calculation grid Threedimensional models of the impeller and the
volute were built using BladeGen and Pro/E, respectively. The multiblock structured grids for the impeller were generated using TurboGrid, and the unstructured girds for the volute were generated using ICEM. The grids for the tongue were refined, and the boundary layer grids were created for both domains. The number of grid nodes was 2020094. The details of the grids are shown in Fig. 2.
3.4 Transient simulation configuration Threedimensional, transient, flow fields of the
pump were solved using the CFD code ANSYS CFX12.1. At the inlet and in the flow direction, the total pressure was specified to be normal to the boundary. The mass flow rate was specified at the outlet. All solid walls were set as no slip, and the roughness was set at 25 μm. The grids of different domains were connected using the general grid interface method. The interface between the impeller and the volute was set as “transient frozen rotor.” The temperature of the working fluid was set at
Fig. 2 Grid of computational domains: (a) One periodic domain of impeller; (b) Impeller outlet; (c) Volute; (d) Tongue
25 °C. The NS equation set was enclosed by the turbulent model SST k−ω. The secondorder backward Euler scheme was chosen for time discretization. The chosen time step Δt for the simulation was 1.724×10 −4 s, corresponding to a 3° change in the impeller circumferential position at the nominal rotating speed; therefore, 120 transient results made up one period calculation. The total time for the simulation was 0.124 s, and the convergence criterion was the maximum residual, which was less than 1×10 −4 . The result of the ninth periodicity was chosen and analyzed to determine the pressure fluctuation intensity.
4 Statistical analysis
Statistical methods were adopted to analyze the pressure fluctuation intensity on each grid node in the fluid domains. The advantage of these methods is their ability to record the pressure fluctuation distribution and strength in the inner unsteady flow field directly and comprehensively for a single impeller revolution.
In statistics, standard deviation generally shows how much dispersion exists from the mean. A lower standard deviation value indicates that the data points are closer to the mean value during a specified period of time. In this work, pressure standard deviation is used to indicate the pressure fluctuation intensity. A higher pressure standard deviation value indicates larger pressure fluctuations. The pressure on any grid node i can be given as pi(x, y, z, t) [15]. The pressure coefficient, which represents the normalized pressure, is defined as follows:
2 p 2 (0.5 ) i i
C p u ρ = (6)

J. Cent. South Univ. (2014) 21: 1017−1024 1020
The average pressure coefficient in any period can be calculated using Eq. (7).
1
p 0
1 ( , , , )
120 i i
N
p n
n C C x y z T N
−
= = ∑ (7)
where N=120, T is the period of one impeller revolution. The maximum and minimum pressure coefficients
can be calculated using Eqs. (8) and (9)
p ,max p max[ ( , , , )] 120 i i
n C C x y z T = (8)
p ,min p min[ ( , , , )] 120 i i
n C C x y z T = (9)
where n=(0, 1, 2, …, 118, 119). The standard deviation of the pressure coefficient,
which can describe pressure fluctuation intensity can be calculated using Eq. (10)
2
p , sdv p p 0
1 ( , , , )
1 120 i i i
N
n
n C C x y z T C N =
= − − ∑
(N=120) (10)
In the CFX solver, most variables, such as the pressure variable, are global variables, which can be read from each grid node in the calculation domain. Therefore, using the CFX Expression Language and the Frozen Copy function, all the statistical coefficients related to the results for the entire impeller revolution period, defined above, can be expressed, and the corresponding global variables can be established. The statistical results on each grid node can then be obtained by reading the variables.
5 Results and discussion
5.1 Pressure fluctuation distribution in impeller Figure 3 shows the different pressure distributions,
considering the entire impeller revolution period, at the design condition. Figures 3(a), (b) and (c) show the distribution of the minimum, average, and maximum
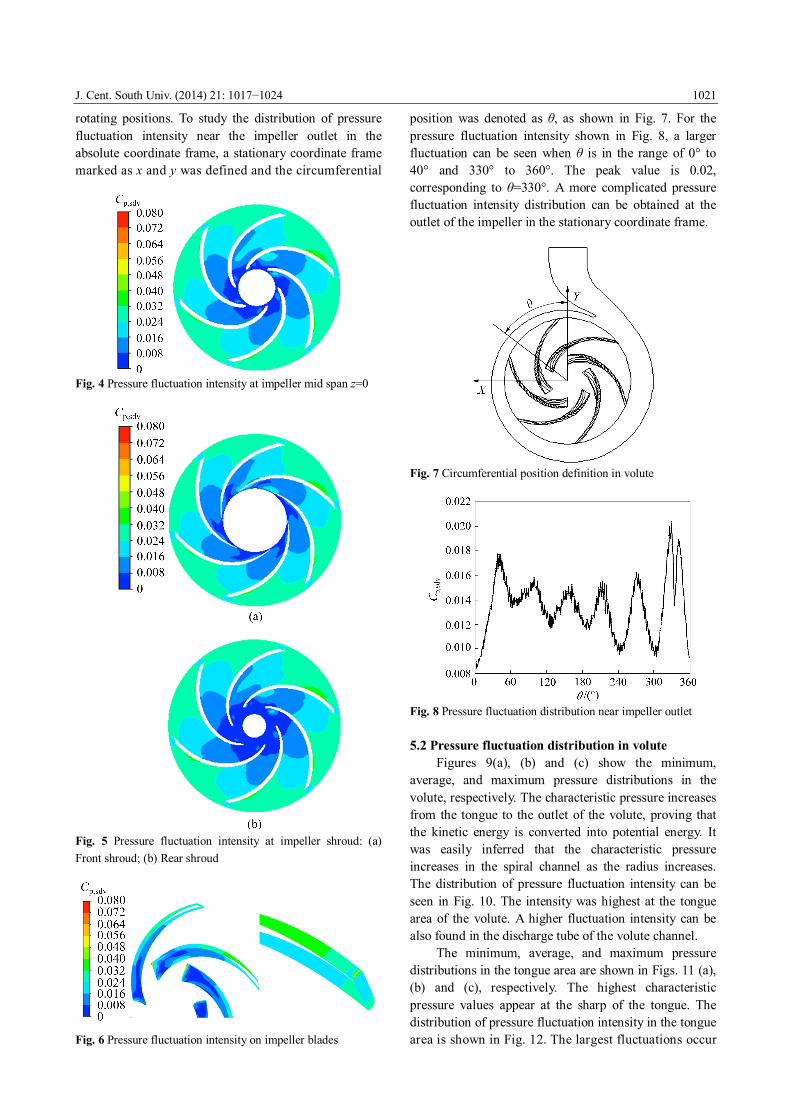
pressures in the impeller, respectively. The characteristic pressure increases with the radial distance increasing, and decreases at the trailing edges of the blades because of variable velocity and unsteady flow shock between the impeller and the volute. Very low pressure exists on the suction side, near the leading edges of the blades, where cavitation occurs easily. The pressure fluctuation intensity is shown in Fig. 4. The lowest values can be seen on the suction side, near the leading edges. The intensity increases with increasing radial distance, and the pressure fluctuation is larger near the pressure side than the suction side. This is because the Coriolis acceleration causes a secondary flow, which results in unequal velocities between the pressure and suction side of the impeller [16].
Figure 5 shows the distribution of pressure fluctuation intensity at the impeller shroud. The area of low pressure fluctuation intensity is smaller at the front shroud than at the rear shroud in the impeller inlet area because of nonuniform flow shocks at the leading edge. Thus, the shock loss is greater at the front shroud. However, it becomes almost the same in the middle channel and the outlet area owing to the flow being nearly normal and uniform.
Figure 6 shows the distribution of pressure fluctuation intensity on the impeller blades at the design condition. The intensity on the pressure side is larger than that on the suction side at the same radius. The intensity is highest at the leading edge near the front shroud because of flow shock. The intensity is higher at the trailing edge on the pressure side. Therefore, optimization of the shape and the position of the leading edge can reduce the pressure fluctuation intensity on the blades.
Because the pressure fluctuation intensity is calculated by taking into account the result at every time step in one impeller revolution period, the resulting distribution of pressure fluctuation intensity shown in the above figures has nothing to do with the present impeller
Fig. 3 Pressure distribution at impeller mid span z=0: (a) Minimum; (b) Average; (c) Maximum
J. Cent. South Univ. (2014) 21: 1017−1024 1021
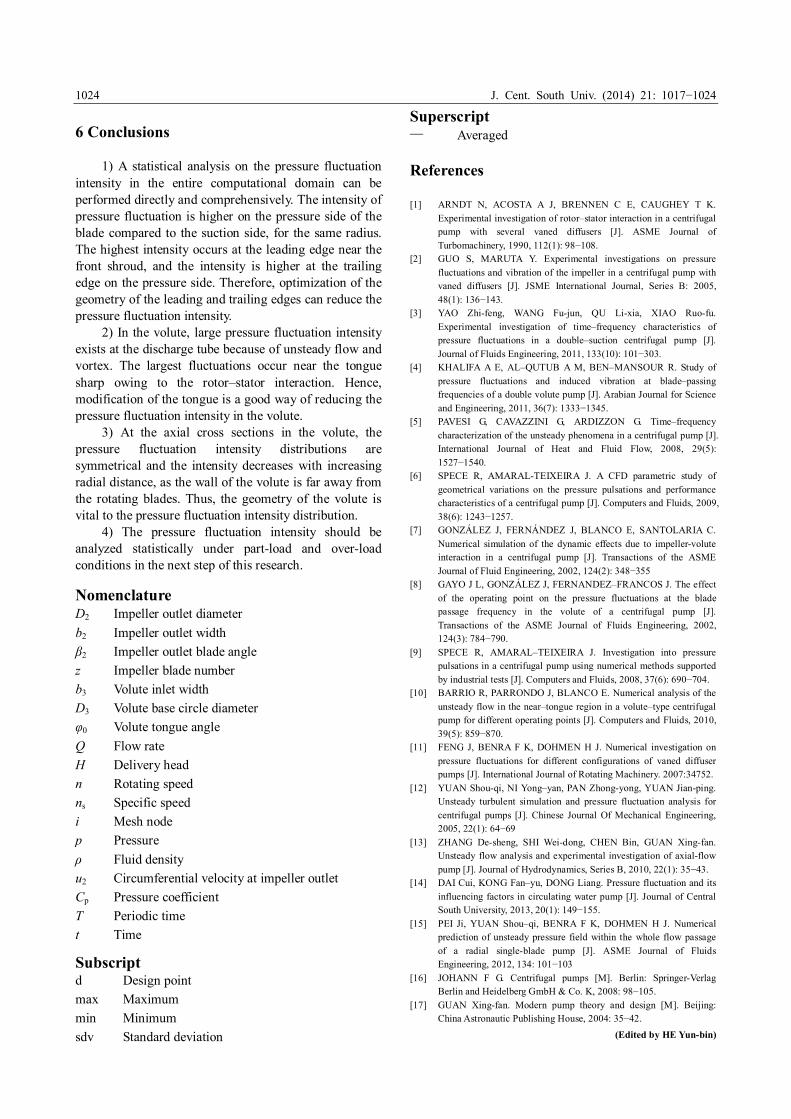
rotating positions. To study the distribution of pressure fluctuation intensity near the impeller outlet in the absolute coordinate frame, a stationary coordinate frame marked as x and y was defined and the circumferential
Fig. 4 Pressure fluctuation intensity at impeller mid span z=0
Fig. 5 Pressure fluctuation intensity at impeller shroud: (a) Front shroud; (b) Rear shroud
Fig. 6 Pressure fluctuation intensity on impeller blades
position was denoted as θ, as shown in Fig. 7. For the pressure fluctuation intensity shown in Fig. 8, a larger fluctuation can be seen when θ is in the range of 0° to 40° and 330° to 360°. The peak value is 0.02, corresponding to θ=330°. A more complicated pressure fluctuation intensity distribution can be obtained at the outlet of the impeller in the stationary coordinate frame.
Fig. 7 Circumferential position definition in volute
Fig. 8 Pressure fluctuation distribution near impeller outlet
5.2 Pressure fluctuation distribution in volute Figures 9(a), (b) and (c) show the minimum,
average, and maximum pressure distributions in the volute, respectively. The characteristic pressure increases from the tongue to the outlet of the volute, proving that the kinetic energy is converted into potential energy. It was easily inferred that the characteristic pressure increases in the spiral channel as the radius increases. The distribution of pressure fluctuation intensity can be seen in Fig. 10. The intensity was highest at the tongue area of the volute. A higher fluctuation intensity can be also found in the discharge tube of the volute channel.
The minimum, average, and maximum pressure distributions in the tongue area are shown in Figs. 11 (a), (b) and (c), respectively. The highest characteristic pressure values appear at the sharp of the tongue. The distribution of pressure fluctuation intensity in the tongue area is shown in Fig. 12. The largest fluctuations occur

J. Cent. South Univ. (2014) 21: 1017−1024 1022
Fig. 9 Pressure distributions in volute at mid span z=0: (a) Minimum; (b) Average; (c) Maximum
Fig. 10 Pressure fluctuation intensity in volute at mid span z=0
Fig. 11 Pressure distribution at tongue mid span z=0: (a) Minimum; (b) Average; (c) Maximum
Fig. 12 Pressure fluctuation intensity at cutwater mid span z=0
near the sharp of the tongue owing to the rotor–stator interaction. Therefore, modifying the tongue is a good way of reducing the pressure fluctuation intensity.
Eight axial cross sections of the volute are shown in Fig. 13. The distributions of pressure fluctuation intensity at four cross sections were analyzed, as shown in Fig. 14. It is evident from the figures that the intensity

J. Cent. South Univ. (2014) 21: 1017−1024 1023
Fig. 13 Sketch of eight axial cross sections in volute: (a) Sketch of volute; (b) Eight axial cross sections
Fig. 14 Pressure fluctuation distribution at four cross sections in volute: (a) I; (b) III; (c) V; (d) VIII
distributions are symmetrical and the intensity decreases with increasing radial distance. This is because the wall of the volute is far away from the rotating blades. Thus, the geometry of the volute is vital to the distribution of pressure fluctuation intensity.
5.3 Performance curves derived from numerical simulations and experimental analysis Performance curves were generated using the
results of the various conditions, calculated using CFD analysis. An experimental analysis of the pump was conducted in the laboratory at the Research Center of Fluid Machinery Engineering and Technology, Jiangsu University. The pressure was measured by the pressure sensor CYG1401, and the flow rate was measured by the
turbine flow meter with an accuracy of ±0.3%. A comparison of the performance curves is shown in Fig. 15. To analyze the performance of the pump, the following parameters were defined as
Head of the pump:
( ) ( ) tot tot 2 1 outlet inlet 1 H P P z z g ρ
= − + − (11)
Flow rate coefficient: 3 / 10 Q D n φ = × (12)
Head coefficient: 2 2 / H D n ψ = (13)
Hydraulic efficiency of the pump:
h gQH M
ρ η
ω = (14)
Fig.15 Performance curves of numerical simulation and experiment
Only the hydraulic loss was considered in the numerical simulation; thus the total efficiency should be revised according to the experiential equations of the mechanical efficiency and the volumetric efficiency [17].
m 7 6 s
1 1 0.07 0.02 0.866
100 n
η = − − =
(15)
v 2 3 s
1 0.96 1 0.68n
η − = = +
(16)
Thus, the total efficiency is given by
h m v η η η η = (17)
It can be inferred that the results of the CFD analysis are in good agreement with the experiment results. The head calculated using CFD analysis is slightly higher than the experimental head. The maximum relative errors in the head and efficiency calculations are 4.8% and 4.3%, respectively. Hence, the performance of the pump can be predicted accurately using the numerical method.
J. Cent. South Univ. (2014) 21: 1017−1024 1024
6 Conclusions
1) A statistical analysis on the pressure fluctuation intensity in the entire computational domain can be performed directly and comprehensively. The intensity of pressure fluctuation is higher on the pressure side of the blade compared to the suction side, for the same radius. The highest intensity occurs at the leading edge near the front shroud, and the intensity is higher at the trailing edge on the pressure side. Therefore, optimization of the geometry of the leading and trailing edges can reduce the pressure fluctuation intensity.
2) In the volute, large pressure fluctuation intensity exists at the discharge tube because of unsteady flow and vortex. The largest fluctuations occur near the tongue sharp owing to the rotor–stator interaction. Hence, modification of the tongue is a good way of reducing the pressure fluctuation intensity in the volute.
3) At the axial cross sections in the volute, the pressure fluctuation intensity distributions are symmetrical and the intensity decreases with increasing radial distance, as the wall of the volute is far away from the rotating blades. Thus, the geometry of the volute is vital to the pressure fluctuation intensity distribution.
4) The pressure fluctuation intensity should be analyzed statistically under partload and overload conditions in the next step of this research.
Nomenclature D2 Impeller outlet diameter b2 Impeller outlet width β2 Impeller outlet blade angle z Impeller blade number b3 Volute inlet width D3 Volute base circle diameter φ0 Volute tongue angle Q Flow rate H Delivery head n Rotating speed ns Specific speed i Mesh node p Pressure ρ Fluid density u2 Circumferential velocity at impeller outlet Cp Pressure coefficient T Periodic time t Time
Subscript d Design point max Maximum min Minimum sdv Standard deviation
Superscript — Averaged
References
[1] ARNDT N, ACOSTA A J, BRENNEN C E, CAUGHEY T K. Experimental investigation of rotor–stator interaction in a centrifugal pump with several vaned diffusers [J]. ASME Journal of Turbomachinery, 1990, 112(1): 98−108.
[2] GUO S, MARUTA Y. Experimental investigations on pressure fluctuations and vibration of the impeller in a centrifugal pump with vaned diffusers [J]. JSME International Journal, Series B: 2005, 48(1): 136−143.
[3] YAO Zhifeng, WANG Fujun, QU Lixia, XIAO Ruofu. Experimental investigation of time–frequency characteristics of pressure fluctuations in a double–suction centrifugal pump [J]. Journal of Fluids Engineering, 2011, 133(10): 101−303.
[4] KHALIFA A E, AL–QUTUB A M, BEN–MANSOUR R. Study of pressure fluctuations and induced vibration at blade–passing frequencies of a double volute pump [J]. Arabian Journal for Science and Engineering, 2011, 36(7): 1333−1345.
[5] PAVESI G, CAVAZZINI G, ARDIZZON G. Time–frequency characterization of the unsteady phenomena in a centrifugal pump [J]. International Journal of Heat and Fluid Flow, 2008, 29(5): 1527−1540.
[6] SPECE R, AMARALTEIXEIRA J. A CFD parametric study of geometrical variations on the pressure pulsations and performance characteristics of a centrifugal pump [J]. Computers and Fluids, 2009, 38(6): 1243−1257.
[7] GONZÁLEZ J, FERNÁNDEZ J, BLANCO E, SANTOLARIA C. Numerical simulation of the dynamic effects due to impellervolute interaction in a centrifugal pump [J]. Transactions of the ASME Journal of Fluid Engineering, 2002, 124(2): 348−355
[8] GAYO J L, GONZÁLEZ J, FERNANDEZ–FRANCOS J. The effect of the operating point on the pressure fluctuations at the blade passage frequency in the volute of a centrifugal pump [J]. Transactions of the ASME Journal of Fluids Engineering, 2002, 124(3): 784−790.
[9] SPECE R, AMARAL–TEIXEIRA J. Investigation into pressure pulsations in a centrifugal pump using numerical methods supported by industrial tests [J]. Computers and Fluids, 2008, 37(6): 690−704.
[10] BARRIO R, PARRONDO J, BLANCO E. Numerical analysis of the unsteady flow in the near–tongue region in a volute–type centrifugal pump for different operating points [J]. Computers and Fluids, 2010, 39(5): 859−870.
[11] FENG J, BENRA F K, DOHMEN H J. Numerical investigation on pressure fluctuations for different configurations of vaned diffuser pumps [J]. International Journal of Rotating Machinery. 2007:34752.
[12] YUAN Shouqi, NI Yong–yan, PAN Zhongyong, YUAN Jianping. Unsteady turbulent simulation and pressure fluctuation analysis for centrifugal pumps [J]. Chinese Journal Of Mechanical Engineering, 2005, 22(1): 64−69
[13] ZHANG Desheng, SHI Weidong, CHEN Bin, GUAN Xingfan. Unsteady flow analysis and experimental investigation of axialflow pump [J]. Journal of Hydrodynamics, Series B, 2010, 22(1): 35−43.
[14] DAI Cui, KONG Fan–yu, DONG Liang. Pressure fluctuation and its influencing factors in circulating water pump [J]. Journal of Central South University, 2013, 20(1): 149−155.
[15] PEI Ji, YUAN Shou–qi, BENRA F K, DOHMEN H J. Numerical prediction of unsteady pressure field within the whole flow passage of a radial singleblade pump [J]. ASME Journal of Fluids Engineering, 2012, 134: 101−103
[16] JOHANN F G. Centrifugal pumps [M]. Berlin: SpringerVerlag Berlin and Heidelberg GmbH & Co. K, 2008: 98−105.
[17] GUAN Xingfan. Modern pump theory and design [M]. Beijing: China Astronautic Publishing House, 2004: 35−42.
(Edited by HE Yunbin)