research background of the project - institutional...
TRANSCRIPT

RELIABILITY EVALUATION OF SABAH
TRANSMISSION AND SUB-TRANSMISSION NETWORKS
AHMAD NASSARUDDIN B. KAMARUZAMAN
A project report submitted in partial
fulfillment of the requirement for the award of the
Degree of Master of Electrical Engineering
Faculty of Electrical and Electronic Engineering
Universiti Tun Hussein Onn Malaysia
JULY 2014

v
ABSTRACT
Reliability planning criteria such N-1 and N-2 are measures of system wide
reliability provided by an electricity distribution utility. These criteria also indirectly
indicate the utility’s Operations and Maintenance (O&M) efficiency, system’s ability
to transfer load to the neighbouring units in case of cable or equipment failures,
response time to locate and isolate a fault and restoration time. This study
considerably extends the modelling and evaluation techniques presently used in
assessing the reliability of transmission networks. The concepts described lead to a
realistic analysis of such systems. The most important features that are described
concern the incorporation of value-based analysis, this often being of vital
importance. In line with the new regulatory framework, Sabah Electricity Sdn Bhd
took the opportunity to enhance its planning methods and approaches by adopting
value-based approach to achieve optimum total cost of ownership. This paper
presents an actual case study of detailed analysis on the connection schemes and
substation configuration for a newly proposed 275/132kV substation. The outcome
of the study results in a significant cost saving as compared to traditional approach. It
was determined that the evaluation study based on the value-based analysis could
save about twenty percent (20%) of project capital expenditure cost.
vi
ABSTRAK
Kriteria Perancangan berdaya harap yang dirujuk sebagai N-1 dan N-2 adalah tanda
ukur untuk menganalisa kadar berdaya harap bagi keseluruhan system pembekalan
elektrik dari utility bekalan elektrik. Kriteria ini juga menjadi asas penting bagi
penyelenggaraan dan operasi serta keboleh daya untuk memastikan bekalan elektrik
yang berterusan sekiranya berlaku gangguan kepada sebarang elemen system
pembekalan elektrik. Kajian ini teknik memodelkan sistem grid dan penilaian dalam
mengkaji kedayaharapan rangkaian system penghantaran. Antara komponen penting
dalam kajian ini adalah dengan mengambil kira analisa nilai sesuatu pembangunan
projek yang mana sangat penting bagi syarikat utiliti. Selari dengan rangka kerja
pembekalan elektrik, Sabah Electricity Sdn Bhd mengambil peluang untuk
menambahbaik kaedah perancangan dengan menerapkan kajian nilai demi mencapai
kos pembangunan yang optimum.Kertas ini membentangkan kes kajian sebenar
berkenaan dengan skema penyambungan yang optimum bagi sistem penghantaran
275kV. Hasil kajian ini akan memberikan penjimatan kos yang signifikan berbanding
kaedah tradisi. Hasil kajian juga akan menunjukkan penjimatan sebanyak dua puluh
peratus (20%) terhadap kos pembangunan projek melalui penilaian berasaskan nilai.

vii
CONTENTS
TITLE i
DECLARATION ii
DEDICATION iii
ACKNOWLEDGEMENTS iv
ABSTRACT v
CONTENTS vii
LIST OF TABLES xi
LIST OF FIGURES xii
LIST OF SYMBOLS AND
ABBREVIATIONS
xiv
CHAPTER 1 INTRODUCTION 1
1.1 Project Background 1
1.2 Problem Statements 2
1.3 Project Objectives 4
1.4 Project Scopes 5
1.5 Thesis structure 5

viii
CHAPTER 2 LITERATURE REVIEW 6
2.1 Introduction 6
2.2 Theories 7
2.3 Description of previous method 13
CHAPTER 3 METHODOLOGY 15
3.1 Project Methodology 15
3.2 Data Collection 16
3.3 Network modelling 18
3.4 Economic analysis 23
3.5 Methodology to conduct BCR
Analysis
24
3.5.1 Step 1 – selection of project 24
3.5.2 Step 2 – selection of options 24
3.5.3 Step 3 and 4 – Analysis on impact
of the project cost
28
3.5.4 Step 5 – Sensitivity analysis 29
3.5.5 Step 6 – Result of analysis 29
3.6 Escalation Factor 29
3.7 Plant economic life 30
3.8 Annual operation and maintenance
(O&M) rate against project cost
31
3.9 Line outage rate 31
3.10 Line outage duration 31
3.11 Load factor 32
3.12 Load probability distribution
function (PDF)
32

ix
3.13 Performance criteria and limits 34
3.13.1 Voltage 35
3.13.2 Frequency limit 35
3.13.3 Rotor angle stability limit 36
3.13.4 Loss of largest single generation
unit
36
3.13.5 Fault clearing time 36
3.13.6 Short circuit limits 37
3.13.7 Thermal loading limits of
transmission component
37
CHAPTER 4 RESULTS AND ANALYSIS 38
4.1 Sabah grid network system 38
4.2 Base case findings (Year 2013/14) 40
4.2.1 Pre-contingency power flow 40
4.2.2 Pre-contingency voltage profiles 40
4.2.3 N-2 contingency result 41
4.3 Y+10 findings (Year:2013/14+10 :
2023/24)
42
4.3.1 Building the horizon year case 42
4.3.2 Pre-contingency power flow 43
4.3.3 Pre-contingency voltage profile 44
4.3.4 N-2 Contingency result 44
4.3.5 Transient stability analysis 45
4.4 Benefit cost ratio 60

x
CHAPTER 5 CONCLUSION AND FUTURE WORKS 65
5.1 Conclusion 65
5.2 Future work 66
REFERENCES 68

xi
LIST OF TABLES
1 Variance of system performance after system
reinforcement
13
2 Summary of VOLL by Jurisdiction 27
3 SESB 275KV Line Outage Rate 31
4 Summary of Economic Parameter 33
5 Summary of technical parameter 34
6 Pre-disturbance voltage limits for transmission
studies
35
7 Post-disturbance voltage limits for transmission
studies
35
8 Short circuit limit 37
9 Thermal loading limits 36
10 N-2 analysis of transmission line that cause loss load 41
11 N-2 Analysis of major transmission network that
cause loss load
45
12 Two different project capital cost with some
compromised scope
60
13 BCR Analysis for RM794Mil 61
14 BCR Analysis for RM758Mil 62
15 BCR Analysis for RM602Mil 63
16 Summary of BCR 64

xii
LIST OF FIGURE
1.1 Existing Sabah Transmission Network Mapping 3
2.1 Basic elements of power system 8
2.2 Power system operating states 9
2.3 Power-Angle Equations 10
2.4 P-V Curve 11
2.5 Receiving Voltage Vs Power Transfer For different
Load Power Factors
11
2.6 Q-V Curves at different loading conditions 12
3.1 Flow Chart of Phase 1 17
3.2 Target Network Modelling 18
3.3 Pre-Disturbance Analysis 19
3.4 N-1 Analysis 20
3.5 N-2 Analysis 22
3.6 Southern Link Project 23
3.7 Element of Cost Benefit in BCR Analysis 25
3.8 Business Risk Exposure Method 25
3.9 Sabah East Coast Load Projection 28
3.10 Malaysia Average Inflation Rate from 1973 to 2014 30
3.11 Minimum safety clearance for overhead transmission
line
33
4.1 Basic electrical network system for Sabah Grid 39
4.2 Voltage Profile Base Year 40
4.3 Illustration of East West Link Operation at N-2 42
4.4 Illustration work related to construction of horizon year 43
4.5 Voltage Profile – Horizon year 44

xiii
4.6 Illustration of loss of East West Link 46
4.7 Frequency Response Plot during loss of East West Link 47
4.8 Frequency Plot during loss of Upper Padas Generation 48
4.9 Frequency plot during loss of Kolopis Kimanis Line 49
4.10 Frequency plot during Kimanis – Kolopis line tripped
(with mitigation of two additional transformer)
50
4.11 Post such event, system stabilized without UFLS being
initiated
51
4.12 Frequency plot 52
4.13 Generator Angle Plot 52
4.14 Frequency plot 53
4.15 Frequency plot (loss of Sipitang – Kimanis) 54
4.16 Generator Angle Plot (loss of Sipitang-Kimanis) 54
4.17 Frequency Plot for loss of Kimanis –Kolopis 55
4.18 Generator angle plot loss of Kimanis Kolopis 56
4.19 Frequency plot for loss of East West Link 57
4.20 Frequency response in the event of loss of Upper Padas
Generation
57
4.21 Frequency response in the event of Sipitang – Kimanis 58
4.22 Frequency response of cascade tripping 59
4.23 Generator angle plot of cascading tripping 59

xiv
LIST OF SYMBOLS AND ABBREVIATIONS
AC Alternating Current
BRE Business Risk Exposure
BCR Benefit Cost Ratio
ECG East Coast Grid
ENS Energy Not Supplied
EENS Expected Energy Not Served
EFOM Energy Flow Optimizing Model
kV KiloVolt
km Kilometre
kw/yr Kilowatt/year
kWh KiloWatt hour
MW MegaWatt
MVA Mega Volt Ampere
PDF Probability Distribution Function
PF Power Factor
p.u Per unit
PSSE Power System Simulator for Engineer
SAIDI System Average Interruption Duration Index
SAIFI System average Interruption Frequency Index
SESB Sabah Electricity Sendirian Berhad
SLGC Sabah Labuan Grid Code
SVC Static Var Compensation
UTHM Universiti Tun Hussein Onn Malaysia
VOLL Value of Loss of Load

1
CHAPTER 1
INTRODUCTION
1.1 Project Background
A set of appropriate criteria are used to evaluate the reliability of the power provided
from Sabah Electricity Sdn Bhd (SESB) through a set of specified delivery points to
high voltage consumers and distribution companies. These criteria comprise of N-1
and N-2 planning criteria that refers to equipment element of transmission line. This
project will address the delivery point interruption performance concept and present
the results obtained from the application of the mentioned planning criteria for newly
275kV transmission system backbone expansion in Sabah Grid.
The obtained results would be analyzed and explained. The past delivery
point interruption performance is quantitatively assessed and the major influencing
factors are determined. In addition, this project would also assess the value-based
approach of transmission line expansion. The findings serve as a guide for
determining the optimum investment after considers the transmission system
expansion needed. It is also recommended that the application of value-based
analysis shall be one of the most important input parameters to the decision making
process for expansion and reinforcement schemes.
A transmission development plan outlines the transmission
expansion/reinforcement required to ensure power generated can be delivered to the
load centers without violating any limits set by the codes/rules/licenses. Under
traditional approach, in formulating a transmission development plan, various
options for transmission expansion/ reinforcement may be assessed and the least cost

2
option will be recommended. The transmission network shall be planned with a
minimum satisfaction of the following principles:
a. Safety (Managing fault level within equipment rating)
b. Adequacy (Ensuring sufficient power to meet demand)
c. Security (Robust system: minimum N-1 or N-2)
d. Reliability (All of the above)
e. Economic (Least Cost Option)
The purpose of this study is to propose and test an improved system to
enhance the transmission system reliability of Sabah Grid and to achieve N-1 and N-
2 planning criteria. The significant contributions expected through this study are the
optimum transmission expansion scheme without jeopardize the 275KV transmission
network stability.
1.2 Problem Statements
Presently, the solely fragile 275kV transmission network in Sabah due to frequent
tripping has hampered the quality of electricity supply to Sabah. Existing
transmission network in Sabah is transverse from West Coast Grid to East Coast Grid
with distance about 255km. This transmission line backbone is link the West Coast
Grid and East Coast grid with N-1 capacity of 639MVA. Normal power transfer
through this line ranging from 60MW to 100MW, which limited due to operational
constraint. In the event of this transmission line tripped, the West Coast Grid would
experience over frequency condition that would trip the generating sets and
subsequently cause the total black out at West Coast Grid. Whilst, the East Coast
Grid would experiencing under frequency that also cause total black out at East
Coast Grid.
Various approaches have been implemented to overcome these issues by
replacing the protection relays and install the disturbance recorder for tripping study.
However, the tripping still occurred which the transmission network required a
permanent medium term and long term approach to improve the supply performance
in Sabah grid. The Figure 1 below shows the mapping of 275kV transmission line.

3
Figure 1.1: Existing Sabah Transmission Network Mapping
Under this study, the existing 275kV transmission network would be studied
to determine whether there is a need for another expansion needed namely Southern
Link that provide second link of the West Coast Grid and East Coast Grid . All
275kV buses reference of transmission network would be assessed and tripping study
to be conducted under load flow analysis to analyse current reliability performance
with current generation scenario. Based on load flow analysis, the specific
transmission will be assessed under transient study. In the event that the loss of load
is higher than permissible value, the development of Southern Link would be needed.
The newly development would be further study with Benefit Cost Ratio (BCR)
analysis to ensure the development is comply with Labuan and Sabah Grid Code.

4
The needs to conduct BCR analysis is stated in Sabah and Labuan Grid Code
under clause PC5.1.2 as follows,
“Minimally, a (N-1) primary criterion shall be applied to the Transmission
Network to determine when reinforcement is required and an N-2 test shall be
undertaken to determine the consequences of a second circuit outage during for
example maintenance.”
“The second transmission circuit outage or interbus transformer outage is
intended to assess the amount of load lost under this contingency and its impact on
the wider Power System. The Network Planner should consider schemes to provide
alternative circuits or interbus transformer capacity, if these can be justified on a
cost benefit basis, where an N-2 contingency causes loss of strategic industrial or
commercial loads or the loss of more than 95 MW2 of generation.”
In summary, the BCR Analysis is required to justify a project identified to
mitigate the impact of (N-2) contingency that causes the loss of strategic industrial or
commercial loads or the loss of more than 95 MW of generation.
1.3 Project Objectives
The major objective of this research is to study the reliability of Sabah transmission
network. Its measurable objectives are as follows:
a. Assess the safety, adequacy, security, reliability and economic of the existing
275KV network under study year 2013 and study year 2023
b. Propose attainable development schemes with respect with the economic
analysis
5
1.4 Project Scopes
This project is primarily concerned with the reliability evaluation of transmission
network. The scopes of this project are:
a. Garner all data required of the existing system based on the transmission data.
b. Model the existing system in accordance with Power System Simulator.
c. Conduct the power flow and transient studies on modelled transmission
system
d. Based on the previous results, the study areas are tabulated for short and
medium term development and system enhancement.
e. Propose attainable scheme of newly second link development
1.5 Thesis structure
In this thesis, it contains five chapters. For the chapter 1 is discussing on the
introduction of this project. The introduction tell about the cascading event occur in
the Sabah system grid. When cascading event occurs in the system, the system is at
risk of total black out.
Chapter 2 is the literature of review. Previous study conducted and journals are
selected as a reference for this project. The enhancement proposed in the previous
study is taking into account to be implemented if necessary.
Chapter 3 discussed about the methodology. In this chapter, procedures to
conduct a study using PSSE software are written. Using this software, few case study
are built to be perform in chapter 4.
Chapter 4 are discussing on the result and analysis. Further elaboration is
discussed in this chapter. This chapter contain four cases study to determine the
weakest point in the system.
Chapter 5 is more to conclusion and future works to enhance and strengthening
the Sabah System grid to its reliable operation.

6
CHAPTER 2
LITERATURE REVIEW
2.1 Introduction
Reliability planning criteria such N-1 and N-2 are measures of system wide
reliability provided by an electricity distribution utility. These criteria also indirectly
indicate the utility’s Operations and Maintenance (O&M) efficiency, system’s ability
to transfer load to the neighboring units in case of cable or equipment failures,
response time to locate and isolate a fault and restoration time. This study
considerably extends the modeling and evaluation techniques presently used in
assessing the reliability of transmission networks. The concepts described lead to a
realistic analysis of such systems. The most important features that are described
concern the incorporation of value-based analysis, this often being of vital
importance. In line with the new regulatory framework, Sabah Electricity Sdn Bhd
took the opportunity to enhance its planning methods and approaches by adopting
value-based approach to achieve optimum total cost of ownership. This paper
presents an actual case study of detailed analysis on the connection schemes and
substation configuration for a newly proposed 275/132kV substation. The outcome
of the study results in a significant cost saving as compared to traditional approach.
Enhancing the adequacy and stability of transmission system would improve the
supply performance. Findings from reliability evaluation would indicate the type of
system improvement needed.

7
2.2 Theories
Electric power systems vary in size and structural components. However, they all
have the same basic characteristics:
a. Are comprised of three phase ac systems operating essentially at
constant voltage. Generation and transmission facilities use three-
phase equipment.
b. Use synchronous machines for generation of electricity.
c. Transmit power over significant distances of consumers spread over a
wide area. This requires a transmission system comprising subsystem
operating at different voltage level.
Figure 2.1 illustrates the basic elements of a modern power system. Electric
power is produced at generating stations and transmitted to consumer through a
complex network of individual components. Under this study, the focus would be
mainly on transmission system and sub-transmission system. The transmission
system interconnects all major generating stations and main load centres in the
system. It forms the backbone of the integrated power system and operates at the
highest voltage levels typically 275kV and above. The sub-transmission system
transmits the power in smaller scales from transmission substation to distribution
substations.

8
Figure 2.1: Basic elements of power system
In analysing the power system security, the system operating conditions could
be classified into five states: normal, alert, emergency, in extremis and restorative.
Figure depicts these operating states and the ways in which transition can take place
from one state to another. In the normal state, all system variables are within the
normal range and no equipment is being overloaded. The system enters the alerts
state if the security level falls below a certain limit of adequacy, or if the possibility
of a disturbance increases because of adverse weather conditions such as the
approach of severe storms. The system has been weakening to the level where a
contingency may cause an overloading of equipment that places the system in an
emergency state. If the disturbance is very severe, the in-extremis state may result
directly from the alert state. Under emergency state, the system may be restored by
initiating of emergency control actions such fault clearing and load curtailment.
9
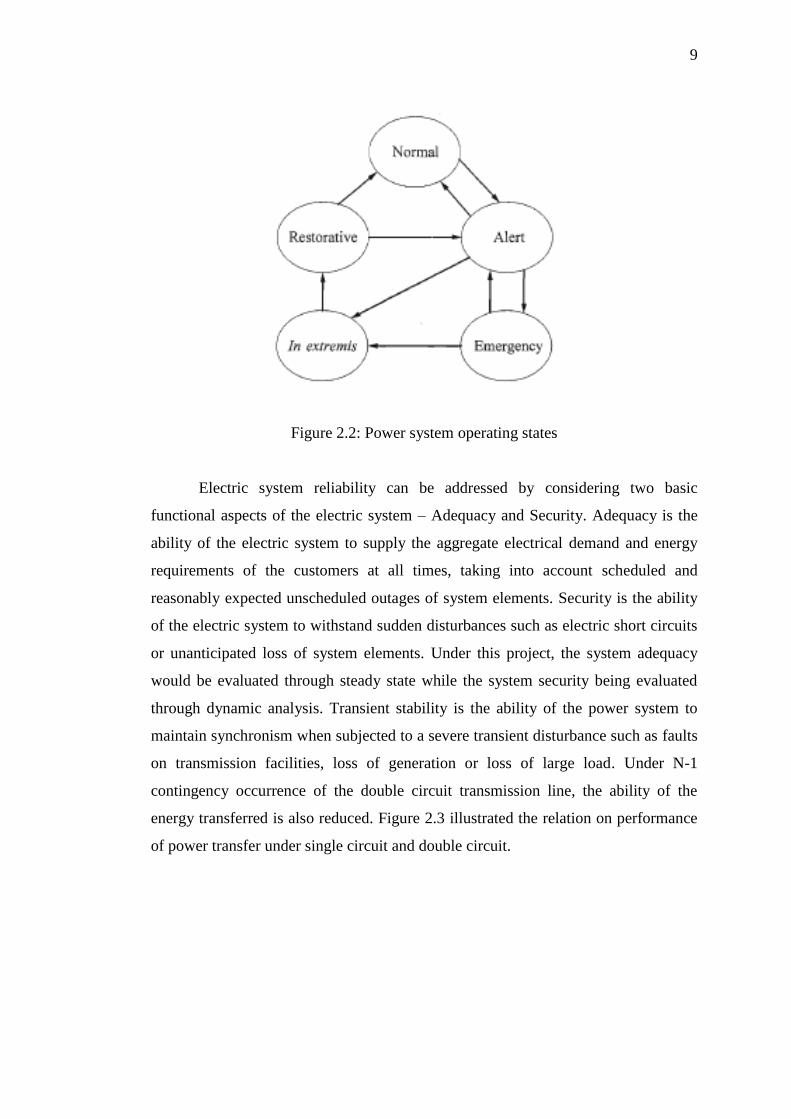
Figure 2.2: Power system operating states
Electric system reliability can be addressed by considering two basic
functional aspects of the electric system – Adequacy and Security. Adequacy is the
ability of the electric system to supply the aggregate electrical demand and energy
requirements of the customers at all times, taking into account scheduled and
reasonably expected unscheduled outages of system elements. Security is the ability
of the electric system to withstand sudden disturbances such as electric short circuits
or unanticipated loss of system elements. Under this project, the system adequacy
would be evaluated through steady state while the system security being evaluated
through dynamic analysis. Transient stability is the ability of the power system to
maintain synchronism when subjected to a severe transient disturbance such as faults
on transmission facilities, loss of generation or loss of large load. Under N-1
contingency occurrence of the double circuit transmission line, the ability of the
energy transferred is also reduced. Figure 2.3 illustrated the relation on performance
of power transfer under single circuit and double circuit.
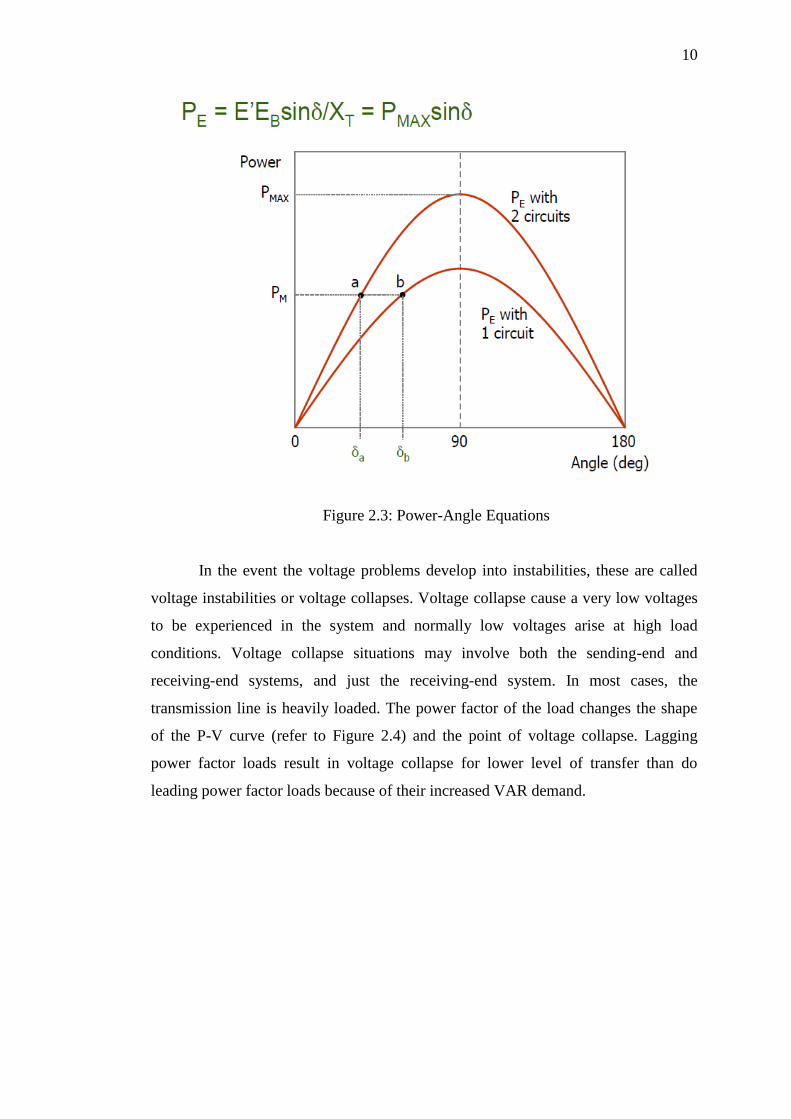
10
Figure 2.3: Power-Angle Equations
In the event the voltage problems develop into instabilities, these are called
voltage instabilities or voltage collapses. Voltage collapse cause a very low voltages
to be experienced in the system and normally low voltages arise at high load
conditions. Voltage collapse situations may involve both the sending-end and
receiving-end systems, and just the receiving-end system. In most cases, the
transmission line is heavily loaded. The power factor of the load changes the shape
of the P-V curve (refer to Figure 2.4) and the point of voltage collapse. Lagging
power factor loads result in voltage collapse for lower level of transfer than do
leading power factor loads because of their increased VAR demand.

11
Figure 2.4: P-V Curve
The load power factor (PF) of the system would tremendously affect the
transmission line power transfer. The lower the PF, the stability of the line would
also being reduced. The relation on the PF is illustrated as Figure 2.5 below.
Figure 2.5: Receiving Voltage Vs Power Transfer for different Load Power Factors
Load flow based analyses are used to assess voltage variations with active
and reactive power change. Two methods are used to determine the loading limits
imposed by voltage stability under the steady- state conditions. The PV/QV analyses
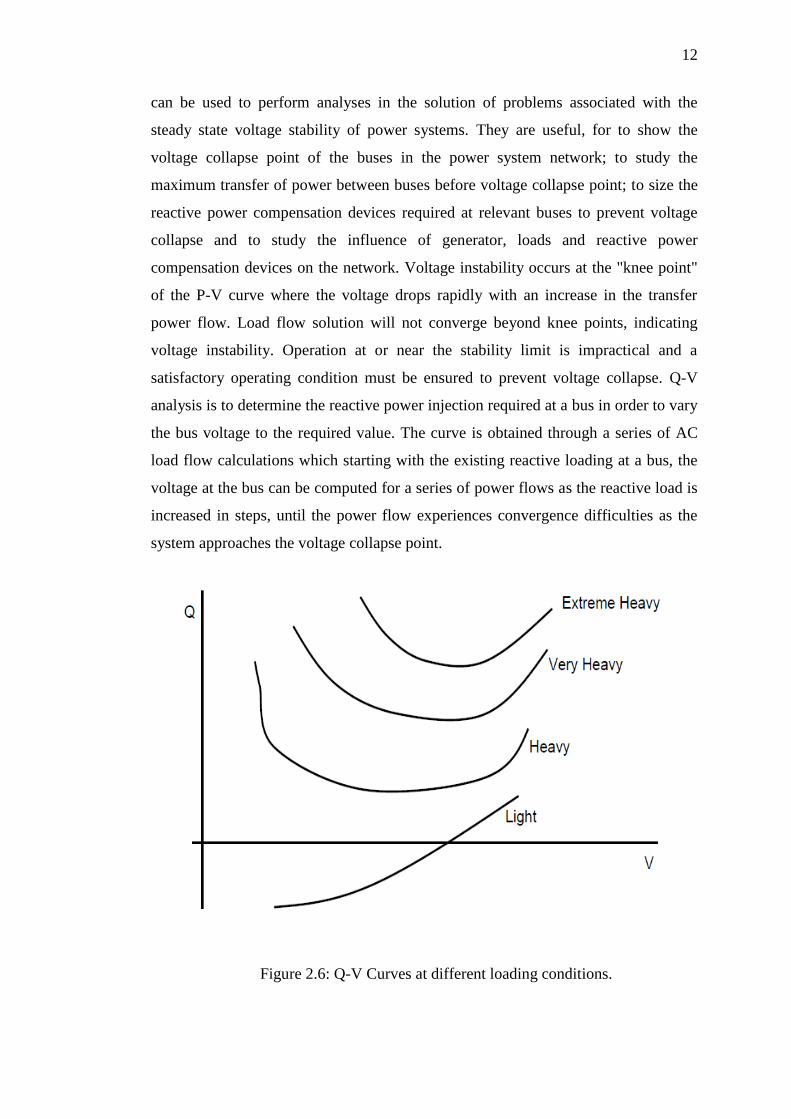
12
can be used to perform analyses in the solution of problems associated with the
steady state voltage stability of power systems. They are useful, for to show the
voltage collapse point of the buses in the power system network; to study the
maximum transfer of power between buses before voltage collapse point; to size the
reactive power compensation devices required at relevant buses to prevent voltage
collapse and to study the influence of generator, loads and reactive power
compensation devices on the network. Voltage instability occurs at the "knee point"
of the P-V curve where the voltage drops rapidly with an increase in the transfer
power flow. Load flow solution will not converge beyond knee points, indicating
voltage instability. Operation at or near the stability limit is impractical and a
satisfactory operating condition must be ensured to prevent voltage collapse. Q-V
analysis is to determine the reactive power injection required at a bus in order to vary
the bus voltage to the required value. The curve is obtained through a series of AC
load flow calculations which starting with the existing reactive loading at a bus, the
voltage at the bus can be computed for a series of power flows as the reactive load is
increased in steps, until the power flow experiences convergence difficulties as the
system approaches the voltage collapse point.
Figure 2.6: Q-V Curves at different loading conditions.
13
2.3 Description of Previous Methods
Based on the previous methods, it was proven by applying the mitigation measures
of identified weaken area through steady state and dynamic analysis, the reliability
indices such SAIDI and SAIFI had significantly reduced.
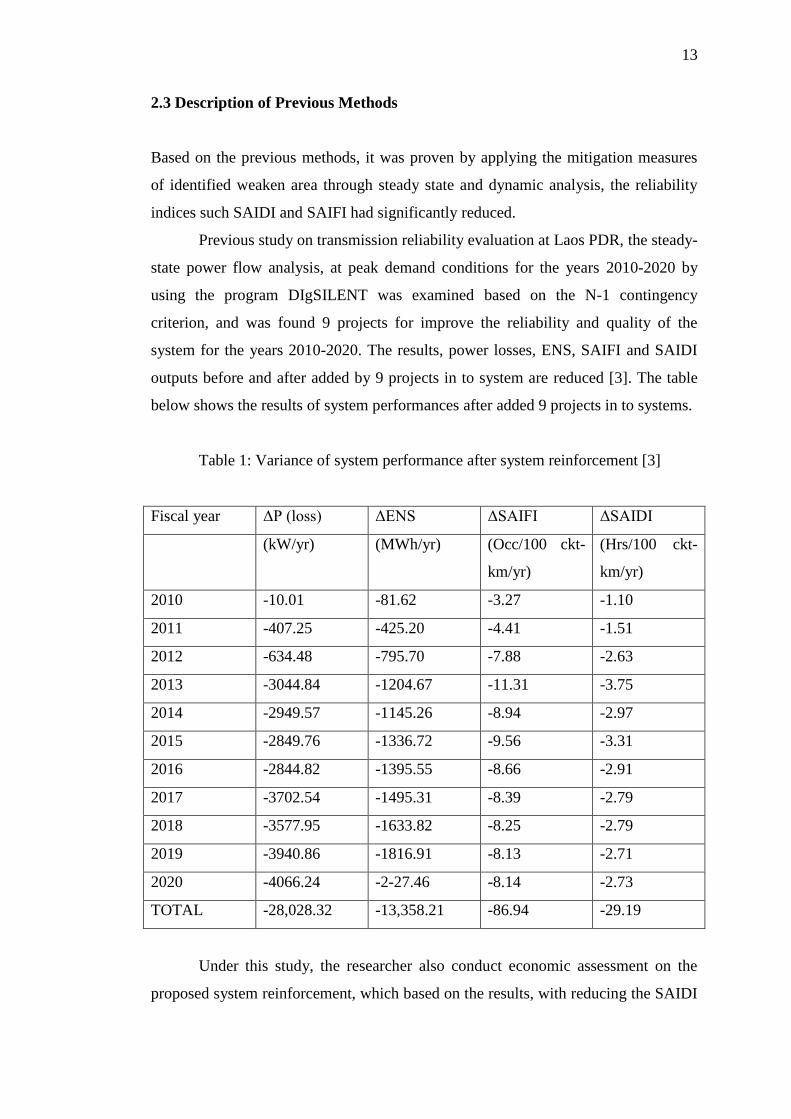
Previous study on transmission reliability evaluation at Laos PDR, the steady-
state power flow analysis, at peak demand conditions for the years 2010-2020 by
using the program DIgSILENT was examined based on the N-1 contingency
criterion, and was found 9 projects for improve the reliability and quality of the
system for the years 2010-2020. The results, power losses, ENS, SAIFI and SAIDI
outputs before and after added by 9 projects in to system are reduced [3]. The table
below shows the results of system performances after added 9 projects in to systems.
Table 1: Variance of system performance after system reinforcement [3]
Fiscal year ΔP (loss) ΔENS ΔSAIFI ΔSAIDI
(kW/yr) (MWh/yr) (Occ/100 ckt-
km/yr)
(Hrs/100 ckt-
km/yr)
2010 -10.01 -81.62 -3.27 -1.10
2011 -407.25 -425.20 -4.41 -1.51
2012 -634.48 -795.70 -7.88 -2.63
2013 -3044.84 -1204.67 -11.31 -3.75
2014 -2949.57 -1145.26 -8.94 -2.97
2015 -2849.76 -1336.72 -9.56 -3.31
2016 -2844.82 -1395.55 -8.66 -2.91
2017 -3702.54 -1495.31 -8.39 -2.79
2018 -3577.95 -1633.82 -8.25 -2.79
2019 -3940.86 -1816.91 -8.13 -2.71
2020 -4066.24 -2-27.46 -8.14 -2.73
TOTAL -28,028.32 -13,358.21 -86.94 -29.19
Under this study, the researcher also conduct economic assessment on the
proposed system reinforcement, which based on the results, with reducing the SAIDI

14
and Energy not Supplied (ENS), the projects become economically viable as the
Benefit Cost Ratio (BCR) are greater than 1 due to higher benefit compare to the
project cost in the long run.
The other study shows because of its wider view of the energy system the
EFOM (Energy Flow Optimizing Model) methodology deals with a more aggregated
representation of the electric power system than what is classically used in electric
power system planning. However, this is often an advantage in the developing
countries where detailed data may be unavailable or sporadic. A methodology
suitable for this purpose is based on representation of energy flow within and among
the sectors [6]. By using the unidirectional graph and liner-programming model, the
researcher had modeled the network from primary sources up to end user that all
operation cost also included. However, the result might be varies due insufficient
data which would be one of disadvantages of this method.
15
CHAPTER 3
METHODOLOGY
3.1 Project Methodology
This research is adopting the methods approach which involves develops and
simulates the case study to enhance Sabah power grid to its reliable operation. Since
simulation is based on the collected data, verification of data important so that result
generated from the software is accurate and reliable.
The derivation of the lines and underground cables sequence data was
conducted using PSCADTM/EMTDCTM software by Manitoba – HVDC Research
Centre. It is a simulation tool widely used by electrical engineers for analysing
electromagnetic transients of electrical systems particularly in doing planning and
operation, design of HV equipment, preparation of tender specifications and teaching
and research.
Among some of the typical applications of the PSCADTM/EMTDCTM
software are as follows:
1) Over voltage studies during lightning and breaker switching
operations
2) Insulation coordination studies
3) Harmonics penetration studies due to FACTS devices
4) Specification of equipment ratings
5) And many other extensive applications of power systems.

16
All of the above applications require extensive modelling of the power
system in order to accurately analyse the response of the power system during a
disturbance.
For the Power System Analysis, software that is being widely used is called Power
System Simulation for Engineer (PSSE). This software usually uses all the data
generated from the PSCAD and will store in the PSSE software. Having accurate and
verified data will produce more accurate result and outcome analysis.
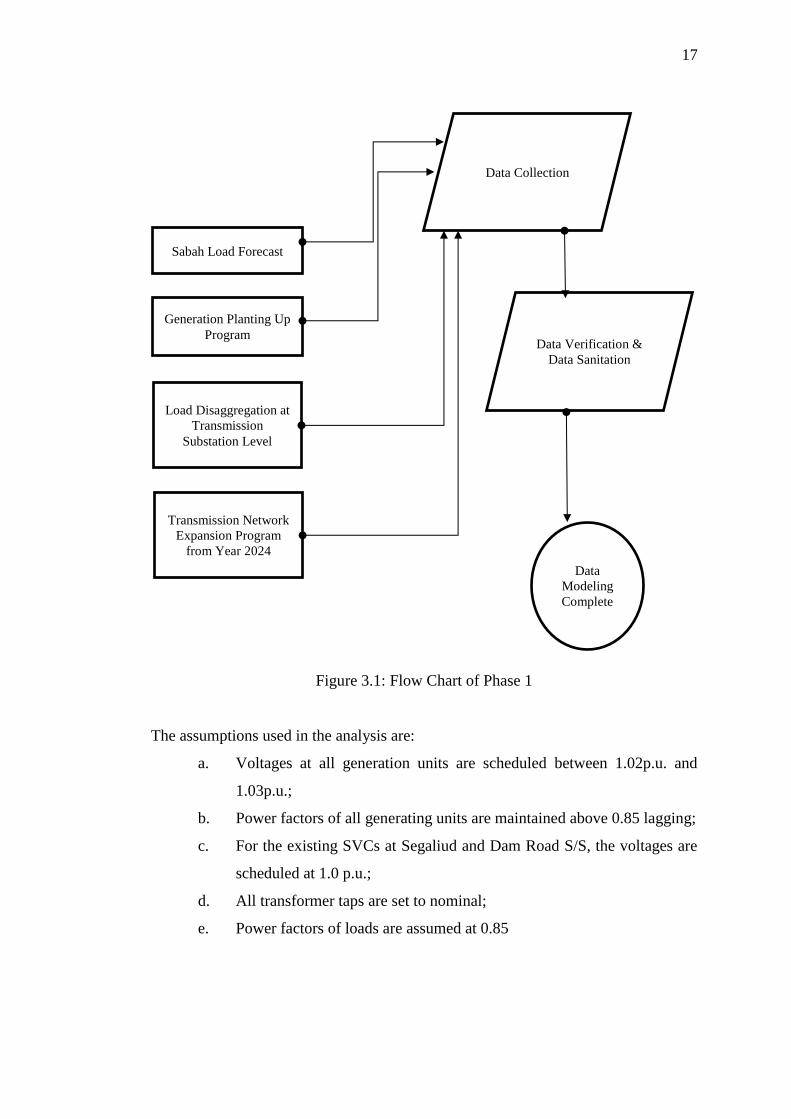
3.2 Data collection
In this phase, the data collection and analysis would be conducted. Various data are
required to proceed with the system study such as Load Forecast, Generation
Planting up Program, Transmission Network expansion program and existing file of
PSSE. The Phase 1’s flow chart as shown in Figure 3.1 below comprises all
preliminary analysis required.
17
Figure 3.1: Flow Chart of Phase 1
The assumptions used in the analysis are:
a. Voltages at all generation units are scheduled between 1.02p.u. and
1.03p.u.;
b. Power factors of all generating units are maintained above 0.85 lagging;
c. For the existing SVCs at Segaliud and Dam Road S/S, the voltages are
scheduled at 1.0 p.u.;
d. All transformer taps are set to nominal;
e. Power factors of loads are assumed at 0.85
Sabah Load Forecast
Generation Planting Up
Program
Load Disaggregation at
Transmission
Substation Level
Transmission Network
Expansion Program
from Year 2024
Data Collection
Data Verification &
Data Sanitation
Data
Modeling
Complete

18
Requirement for additional and/or upgrade of existing SVCs is carried out
first using steady state analysis. If it is necessary, then dynamic simulation is
performed to confirm the requirements.
3.3 Network modelling
In this phase, the input from Phase 1 is required to model the network based on
actual scenario of transmission system. The transmission network study will be based
on Target Network concept where a future system will be developed which will be
adequate and secure to cater for the future load level, in accordance to the Long Term
Demand Forecast & Long Term Generation Development Plan as shown in Figure
3.2 below.
In a Target Network concept/approach, after completing the analysis of the
Base Case Network, the Target Network for the Year Base + 10 will be developed
i.e. Y2013 + 10 = Year 2023.
The result in turn shall be used to assist re-prioritizing the existing and
ongoing project (deferment plan or expedite plan) taking queue from the new
demand forecast and generation development plan or even trigger a new ad hoc
operational measure if any.
Figure 3.2: Target Network Modelling
With reference to the SLGC, Clause PC 5.1.2, the analysis for each Target
Network shall undergo 3 Major Steps as below and benchmarked against the
Performance Criteria & Limits:
Target Network 2023
Base Network 2013
The Load Forecast and
Generation Planting-Up
Program to reflect the target
network 2023 would be
modelled in the software

19
a. Step 1: Pre-Disturbance State Analysis
b. Step 2: N-1 Analysis
c. Step 3: N-2 Analysis & Benefit Cost Ratio Analysis
The pre-disturbance state of the Target Network Case shall follow the
following Step 1: Pre-Disturbance State Analysis shown in Figure 10 as below. In
summary, in the pre-disturbance state of the transmission system, normally no
violations of the criteria and limit are expected, however if found, a mitigation
options should be proposed, analyzed, simulated and technically/economically
ranked. All the options shall be retest and pass Step 1:Pre-Disturbance State each
option shall be listed and ranked in a technical-economic list, and the least cost
option shall be selected as system reinforcement project(s).
Once the Transmission System – Load Flow Case pass the entire criteria/limit
checkpoint, it shall enter into Step 2 shown in Figure 11 as below:
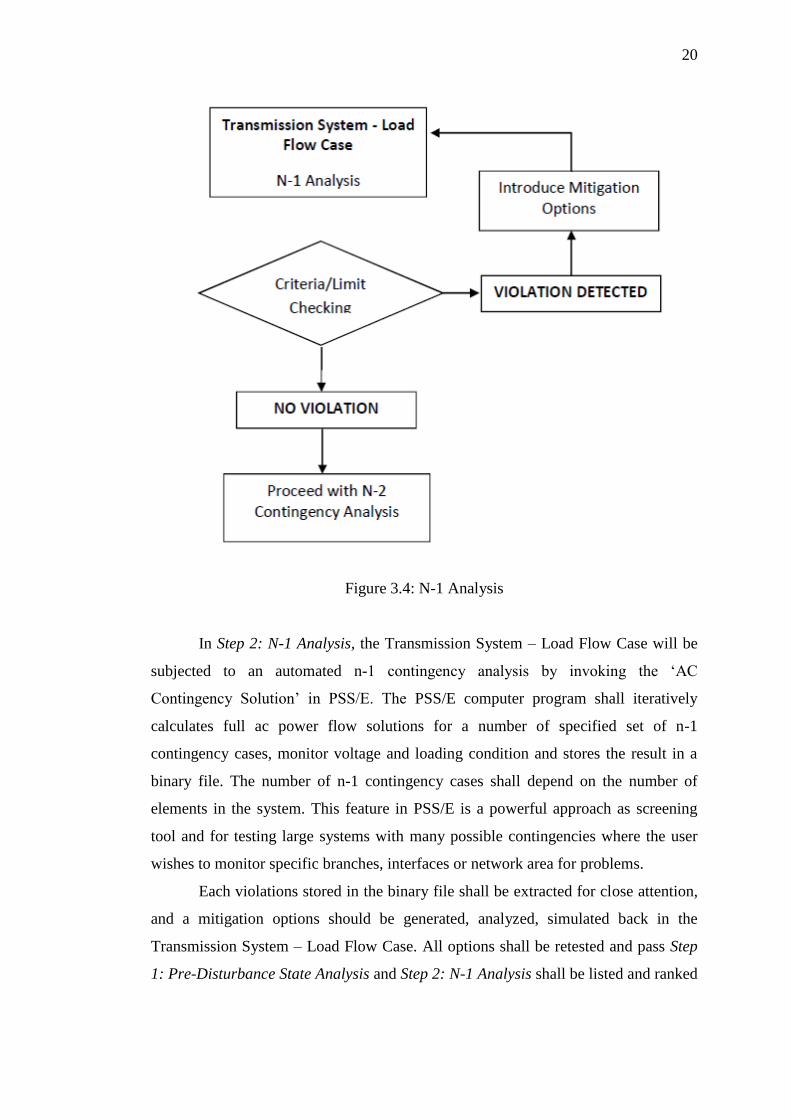
Figure 3.3: Pre-Disturbance Analysis
20
Figure 3.4: N-1 Analysis
In Step 2: N-1 Analysis, the Transmission System – Load Flow Case will be
subjected to an automated n-1 contingency analysis by invoking the ‘AC
Contingency Solution’ in PSS/E. The PSS/E computer program shall iteratively
calculates full ac power flow solutions for a number of specified set of n-1
contingency cases, monitor voltage and loading condition and stores the result in a
binary file. The number of n-1 contingency cases shall depend on the number of
elements in the system. This feature in PSS/E is a powerful approach as screening
tool and for testing large systems with many possible contingencies where the user
wishes to monitor specific branches, interfaces or network area for problems.
Each violations stored in the binary file shall be extracted for close attention,
and a mitigation options should be generated, analyzed, simulated back in the
Transmission System – Load Flow Case. All options shall be retested and pass Step
1: Pre-Disturbance State Analysis and Step 2: N-1 Analysis shall be listed and ranked

21
in a technical-economic list, and the least cost option shall be selected as system
reinforcement project(s).
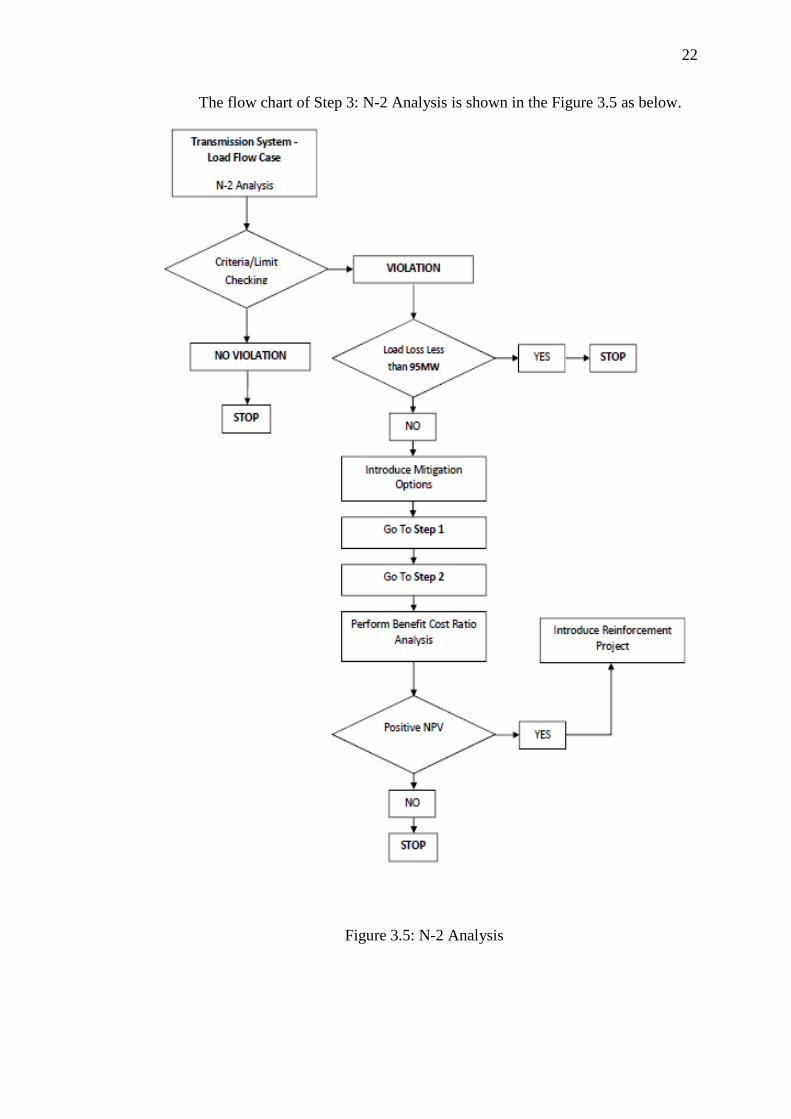
In Step 3: N-2 Analysis, the Transmission System – Load Flow Case will be
subjected to an automated n-2 contingency analysis by invoking the ‘AC
Contingency Solution’ in PSS/E. This is also an iterative step that is similar to the
Step 2. The PSS/E computer program shall iteratively calculates full ac power flow
solutions for a number of specified set of n-2 contingency cases, monitor voltage and
loading condition and stores the result in a binary file. The number of n-2
contingency cases shall depend on the number of elements in the system.
Each violations stored in the binary file shall be extracted for close attention,
and a mitigation options should be generated, analyzed, simulated back in the
Transmission System – Load Flow Case if the N-2 contingency lead to a load loss of
greater than 95MW as stipulated in the SLGC, Clause PC 5.1.2. All the options shall
be retested and pass Step 1:Pre-Disturbance State Analysis and Step 2:-N-1 Analysis
shall be listed and ranked in a technical-economic list, and the least cost option shall
be selected as proposed mitigation option. The proposed mitigation options shall
undergo Benefit Cost Ratio Analysis, whereby only the proposed mitigation option
with a positive Net Present Value (NPV) shall be considered and selected as system
reinforcement project(s).
22
The flow chart of Step 3: N-2 Analysis is shown in the Figure 3.5 as below.
Figure 3.5: N-2 Analysis

23
3.4 Economic analysis
Recalled that for N-2 Analysis, options that have passed Step 1 and 2 shall be listed
and ranked in a technical-economic list, where the least cost option shall be selected
as proposed mitigation option. The proposed mitigation options shall undergo
Benefit Cost Ratio (BCR) Analysis, whereby only the proposed mitigation option
with a positive Net Present Value (NPV) shall be considered and selected as system
reinforcement project(s).
BCR is a systematic approach for calculating and comparing the life-cycle
cost of the option with the overall benefit it brings to the system. In BCR, benefits
and costs are expressed in monetary terms, and are adjusted for the time value of
money, so that all flows of benefits and flows of project costs over time (which tend
to occur at different points in time) are expressed on a common basis in terms of
their Net Present Value (NPV). Under case study of this project, Southern Link
project also called second link to connect the West Coast Grid and East Coast Grid
would be used. The project is proposed to mitigate the impact of losing double circuit
275kV Kolopis-Segaliud. This contingency will result in the loss of over 200MW of
East Coast Grid (ECG) load.
Figure 3.6: Southern Link Project

24
3.5 Methodology to conduct BCR Analysis
The following is a list of steps undertaken to perform the Benefit-Cost Ratio (BCR)
Analysis.
a. Step 1: Decide the project options to be evaluated under BCR Analysis
b. Step 2: Select measurement(s) and measure all cost/benefit elements
c. Step 3: Apply discount rate
d. Step 4: Calculate net present value (NPV) of project options
e. Step 5: Perform sensitivity analysis
f. Step 6: Adopt the options with positive NPV (i.e. the benefit is more or
equal than the cost)
3.5.1 Step 1 – selection of project
Step 1 is to decide on the options. Only project to mitigate failures N-2 with the risk
of losing load of more than 95MW requires assessment of BCR. The selection of loss
of 95MW under N-1 criteria is to comply with the Sabah and F.T Labuan Grid Code.
Any projects under this scenario need to do a BCR analysis.
3.5.2 Step 2 – selection of options
The next step is to define the elements of cost and benefit of the option. Exclusive to
this study, the elements of cost are identified as the capital cost of the project and the
O&M cost throughout the economic life of the project. The benefit component is
defined as the avoided risk or avoided Expected Energy Not Served (EENS) with the
mitigation option in place. All benefits and costs are expressed in monetary terms;
RM. Figure 3.7 illustrates the elements of cost and benefit in BCR analysis.

68
REFERENCES
[1] Prabha Kundur. (1993)” Power System Stability and Control”, Electrical
Power Research Institute.
[2] Witchaya Pimjaipong, Tormit Junrussameevilai and Natthakorn Maneerat
(2005). “Blackout Prevention Plan – The Stability, Reliability and Security
Enhancement in Thailand Power Grid.” IEEE/PES Transmission and
Distribution Conference & Exhibition: Asia and Pacific Dalian, China
[3] P. Kongmany, S. Premrudeepreechacharn and K. Charoenpatcharakij
(2010). “Transmission System Reliability Evaluation in the Central-1 and
Northern Regions of the Lao PDR in Corresponding to Transmission System
Development Plan.” International Conference on AC and DC Power
Transmission.
[4] Mohamed Ibrahim, Paisal Najed, Ahmed Ateiah and Abdukhadir Suhair
(2004). “Emirate of Abu Dhabi Power Transmission System Evaluation &
Expansion.” IEEE Transaction on Power Systems
[5] Komson Daroj and Bundhit Eua-Arporn (2008). “Security-Based
Transmission System Planning Using Transmission Line Performance
Indices.” Proceedings of ECTI-CON
[6] S. M. Sadeghzadeh, and M. Ansarian (2006). “Transmission Network
Expansion Planning for Iran's Power System.” First International Power and
Energy Conference PECon

69
[7] J C Tan, P A Crossley, P G McLaren P F Gale, I Ha11, J Farre114
(2002).“Application of a wide area back-up protection expert system to
prevent cascading outages”IEEE transactions on power delivery, vol. 17, no2.
[8] KeSun,Zhen-Xiang Han. (2005. “Analysis and Comparison on Several Kinds
of Models of Cascading Failure in Power System” IEEE/PES Transmission
and Distribution Conference & Exhibition: Asia and Pacific Dalian, China
[9] Jaime De La Ree, Yilu Liu, LamineMili, Arun G. Phadke, AndLuizDasilva
(2002).catastrophic failures in power systems: causes, analyses, and
countermeasures. IEEE
[10] G. Andersson, P. Donalek, R. Farmer, N. Hatziargyriou, I. Kamwa, P.
Kundur, N. Martins, J. Paserba, P. Pourbeik, J. Sanchez-Gasca, R. Schulz, A.
Stankovic, C. Taylor, and V. Vittal.(2005) “Causes of the 2003 Major Grid
Blackouts in North America and Europe, and Recommended Means to
Improve System Dynamic Performance” IEEE transactions on power
systems, vol. 20, no. 4
[11] Badrul H. Chowdhury, SushantBaravc,(2006). “Creating Cascading Failure
Scenarios in Interconnected Power Systems”.IEEE
[12] U.S.-Canada Power System Outage Task Force,(2004). “Final Report on
theAugust 14, 2003 Blackout in the United States and Canada: Causes
andRecommendations,”North American Electric Reliability
Council,www.nerc.com.
[14] G. Andersson, P. Donalek., R. Farmer, N. Hatziargyriou, I. Kamwa,
P.Kundur, N. Martins, J. Paserba, P. Pourbeik, J. Sanchez-Gasca, R.
Schulz,A. Stankovic, C. Taylor, V. Vittal, (2005).“Causes of the 2003 Major

70
GridBlackouts in North America and Europe and Recommended Means
toImprove System Dynamic Performance,” IEEE Transactions on
PowerSystems, vol. 20, no. 4.
[15] Task Force on Understanding, Prediction, Mitigation and Restoration of
Cascading Failures IEEE PES Computer and Analytical Methods
Subcommittee. (2009).“Vulnerability Assessment for Cascading Failuresin
Electric Power Systems” IEEE Power and Energy Society Power Systems
Conference and Exposition, Seattle, WA
[16] Daniel Bienstock. (2011). “Optimal Control of Cascading Power Grid
Failures” .50th IEEE Conference on Decision and Control and European
Control Conference (CDC-ECC), Orlando, FL, USA,
[17] Weijing Du, JunmingZhang,Yang Zhang, ZhaomingQian.(2013). “Stability
Criterion for Cascaded System With Constant Power Load” IEEEtransactions
on power electronics, vol. 28, no. 4
[18] HadiSaadat. Power System Analysis.Second Edition McGraw Hill. (2004).
[19] Xueguang Wu, Joseph Mutale, Nick Jenkins and GoranStrbac (2003).An
investigation of Network Splitting for Fault Level Reduction
[20] Arief Ibrahim Wuller, Anita Pharmatrisanti. Transmission Line Assessment
2012 IEEE International Conference on Condition Monitoring and Diagnosis
23-27 September 2012, Bali, Indonesia
[21] D. O. Koval, FIEEE A. A. Chowdhury. (2009)Assessment of Transmission
Line Common Mode, Station Originated and Fault Types Forced Outage
Rates

71
[22] Sérgio Kurokawa,Afonso J. Prado, Carlos M. Portela, Maria Cristina Tavares,
José Pissolato Filho. Behavior of Overhead Transmission Line Parameterson
the Presence of Ground Wires.IEEE TRANSACTIONS ON POWER
DELIVERY, VOL. 20, NO. 2, APRIL 2005.ms1669-1675