research article wind energy development in india...
TRANSCRIPT

Research ArticleWind Energy Development in India and a Methodology forEvaluating Performance of Wind Farm Clusters
Sanjeev H. Kulkarni,1 Tumkur Ramakrishnarao Anil,1
and Rajakumar Dyamenally Gowdar2
1Department of Mechanical Engineering, KLS Gogte Institute of Technology, Udyambag, Belagavi, Karnataka 590006, India2Department of Mechanical Engineering, GM Institute of Technology, Davangere, Karnataka 577004, India
Correspondence should be addressed to Sanjeev H. Kulkarni; [email protected]
Received 3 June 2016; Accepted 11 October 2016
Academic Editor: Valerio Lo Brano
Copyright © 2016 Sanjeev H. Kulkarni et al. This is an open access article distributed under the Creative Commons AttributionLicense, which permits unrestricted use, distribution, and reproduction in any medium, provided the original work is properlycited.
With maturity of advanced technologies and urgent requirement for maintaining a healthy environment with reasonable price,India is moving towards a trend of generating electricity from renewable resources. Wind energy production, with its relativelysafer and positive environmental characteristics, has evolved from a marginal activity into a multibillion dollar industry today.Wind energy power plants, also known as wind farms, comprise multiple wind turbines. Though there are several wind-millclusters producing energy in different geographical locations across the world, evaluating their performance is a complex task andis an important focus for stakeholders. In this work an attempt is made to estimate the performance of wind clusters employing amulticriteria approach.Multiple factors that affect wind farmoperations are analyzed by taking experts opinions, and a performanceranking of the wind farms is generated.The weights of the selection criteria are determined by pairwise comparison matrices of theAnalytic Hierarchy Process (AHP). The proposed methodology evaluates wind farm performance based on technical, economic,environmental, and sociological indicators. Both qualitative and quantitative parameters were considered. Empirical data werecollected through questionnaire from the selected wind farms of Belagavi district in the Indian State of Karnataka. This proposedmethodology is a useful tool for cluster analysis.
1. Introduction
On account of continuous industrial development clubbedwith depletion of fossil fuels and emerging environmentalconsciousness, the demands for alternative energy resourceshave been increasing exponentially in the 21st century. Withgrowing demand for energy, increased environmental pol-lution, and depleting energy sources, human society todayfaces multiple challenges of transition towards a sustainabledevelopment and the poverty eradication. In dealing withsustainable development energy is one of the main factorsthat must be considered [1].The concept of sustainable devel-opment according to Brundtland report [2] is based on theidea of meeting the needs of the present without compro-mising the ability of future generations to meet their ownneeds. In developing economies clean and energy-efficienttechnologies can contribute to sustainable development andenergy security [3].
Energy planning involves finding a set of sources to meetthe energy requirements in an optimalmanner. As an alterna-tivemeans and ofmeeting global energy demands, renewableenergy sources, including solar, wind, mini-hydropower,geothermal, and biomass energy, are receiving increasingattention. Being an affordable and clean energy source, windenergy is among the world’s fastest growing renewable energyforms [4]. The challenge for India today is rapid adoption ofrenewable energy sources to power growing economy at aprice that consumers can afford and on a scale large enoughto make a major dent in shortages. India has added large-scale conventional power resources, as demand for power hasgrown since decades [5]. Today there are alternate optionsavailable in the form of solar and wind power technologiesand renewable energy (RE) resources have become com-mercially available in the marketplace. This has added addi-tional options for policymakers who are concerned withthe technical, economic, and environmental characteristics
Hindawi Publishing CorporationJournal of Renewable EnergyVolume 2016, Article ID 6769405, 11 pageshttp://dx.doi.org/10.1155/2016/6769405
2 Journal of Renewable Energy
Wind plants65%
Biomass12%
Solar PV12%
Small hydro11%
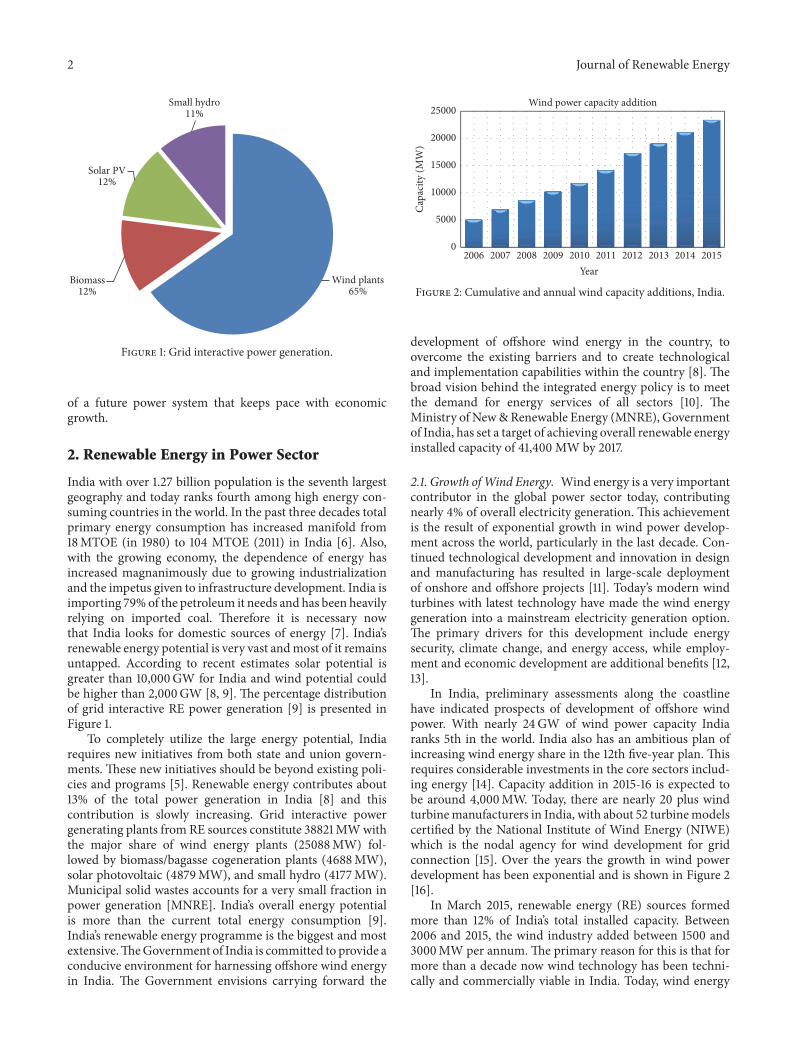
Figure 1: Grid interactive power generation.
of a future power system that keeps pace with economicgrowth.
2. Renewable Energy in Power Sector
India with over 1.27 billion population is the seventh largestgeography and today ranks fourth among high energy con-suming countries in the world. In the past three decades totalprimary energy consumption has increased manifold from18MTOE (in 1980) to 104 MTOE (2011) in India [6]. Also,with the growing economy, the dependence of energy hasincreased magnanimously due to growing industrializationand the impetus given to infrastructure development. India isimporting 79%of the petroleum it needs and has been heavilyrelying on imported coal. Therefore it is necessary nowthat India looks for domestic sources of energy [7]. India’srenewable energy potential is very vast andmost of it remainsuntapped. According to recent estimates solar potential isgreater than 10,000GW for India and wind potential couldbe higher than 2,000GW [8, 9]. The percentage distributionof grid interactive RE power generation [9] is presented inFigure 1.
To completely utilize the large energy potential, Indiarequires new initiatives from both state and union govern-ments. These new initiatives should be beyond existing poli-cies and programs [5]. Renewable energy contributes about13% of the total power generation in India [8] and thiscontribution is slowly increasing. Grid interactive powergenerating plants from RE sources constitute 38821MWwiththe major share of wind energy plants (25088MW) fol-lowed by biomass/bagasse cogeneration plants (4688MW),solar photovoltaic (4879MW), and small hydro (4177MW).Municipal solid wastes accounts for a very small fraction inpower generation [MNRE]. India’s overall energy potentialis more than the current total energy consumption [9].India’s renewable energy programme is the biggest and mostextensive.TheGovernment of India is committed to provide aconducive environment for harnessing offshore wind energyin India. The Government envisions carrying forward the
2006 2007 2008 2009 2010 2011 2012 2013 2014 2015Year
Wind power capacity addition
0
5000
10000
15000
20000
25000
Capa
city
(MW
)
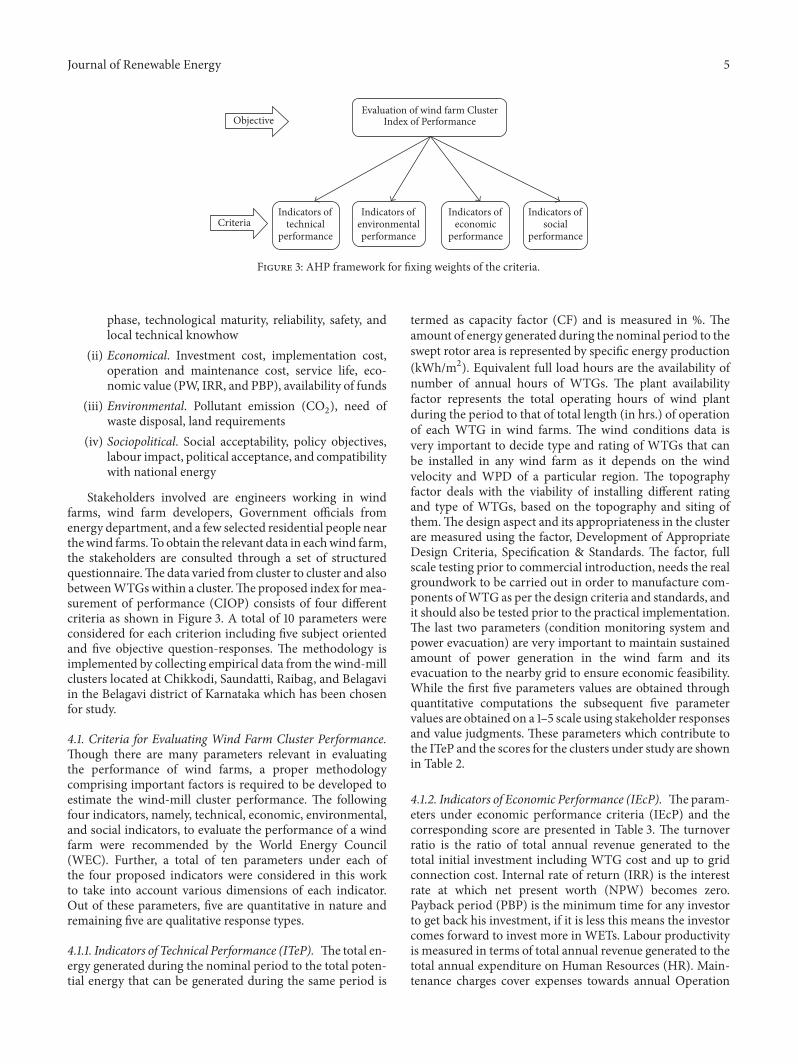
Figure 2: Cumulative and annual wind capacity additions, India.
development of offshore wind energy in the country, toovercome the existing barriers and to create technologicaland implementation capabilities within the country [8]. Thebroad vision behind the integrated energy policy is to meetthe demand for energy services of all sectors [10]. TheMinistry of New&Renewable Energy (MNRE), Governmentof India, has set a target of achieving overall renewable energyinstalled capacity of 41,400 MW by 2017.
2.1. Growth ofWind Energy. Wind energy is a very importantcontributor in the global power sector today, contributingnearly 4% of overall electricity generation. This achievementis the result of exponential growth in wind power develop-ment across the world, particularly in the last decade. Con-tinued technological development and innovation in designand manufacturing has resulted in large-scale deploymentof onshore and offshore projects [11]. Today’s modern windturbines with latest technology have made the wind energygeneration into a mainstream electricity generation option.The primary drivers for this development include energysecurity, climate change, and energy access, while employ-ment and economic development are additional benefits [12,13].
In India, preliminary assessments along the coastlinehave indicated prospects of development of offshore windpower. With nearly 24GW of wind power capacity Indiaranks 5th in the world. India also has an ambitious plan ofincreasing wind energy share in the 12th five-year plan. Thisrequires considerable investments in the core sectors includ-ing energy [14]. Capacity addition in 2015-16 is expected tobe around 4,000MW. Today, there are nearly 20 plus windturbinemanufacturers in India, with about 52 turbinemodelscertified by the National Institute of Wind Energy (NIWE)which is the nodal agency for wind development for gridconnection [15]. Over the years the growth in wind powerdevelopment has been exponential and is shown in Figure 2[16].
In March 2015, renewable energy (RE) sources formedmore than 12% of India’s total installed capacity. Between2006 and 2015, the wind industry added between 1500 and3000MW per annum. The primary reason for this is that formore than a decade now wind technology has been techni-cally and commercially viable in India. Today, wind energy

Journal of Renewable Energy 3
is a key constituent of India’s energy basket. Recognizing theimmense potential of wind resource, the Indian Governmenthas set a target of installing 60GW of wind by 2022. Thisimplies a quantum jump from the current level of annualdeployment. Therefore, the Prime Minister’s Council onClimate Change has proposed to induct a National WindEnergy Mission under India’s National Action Plan on Cli-mate Change (NAPCC) [9, 13].
Even though there is a huge potential for wind energy,there are also many issues to be addressed for exploiting thefull potential. Particularly, most regions of India are classifiedas low wind energy regimes necessitating identification ofappropriate models for estimation and realization of poten-tial. Besides, proper site selection, new composite materialsfor wind turbines, new techniques of manufacturing windturbines and attractive policy for wind energy, and so forthare the other aspects to be focused on. At present, thereare hardly any measures for estimating the performance ofthe existing wind-mill clusters. In the present research anattempt has been made to address this issue by proposing aquantitative and comprehensive performance index for theanalysis of wind-mill clusters.
In India the southern state of Tamil Nadu leads in windenergy extraction followed by Maharashtra, Gujarat, andKarnataka. The coastal region (west coast) of the countryexperiences high wind speed which ranges from 3 to 5m/sannually. The southern and central part (west coast) experi-ences higher wind speed duringmonsoon (June–Sept) whichwill be more than 5m/s. Estimation shows that the westerncoast of Karnataka, Tamil Nadu, Kerala, Maharashtra, andGujarat and plains of Rajasthan, Gujarat, and Karnataka arethe ideal places for wind energy harvesting where the annualaverage wind speed is higher [17].
3. Wind Farm/Cluster Definition
Wind farms comprise number of wind turbines. These tur-bines are built on areas that are conductive to consistent goodwinds. In a “wind farm” a group of wind turbines are built inclose proximity to each other to form a cluster. More turbinescan be added based on the electricity demand. Basicallythese wind turbines convert the kinetic energy availablein wind into mechanical energy and then to electricitythrough a generator. Amodern wind turbine comprises threeintegral components.The rotor which is themain componentincludes the blades for convertingwind energy to an interme-diate low speed rotational energy. The generator componentincludes the electrical generator, the control electronics, anda gearbox for converting the low speed rotational energy toelectricity. Finally the structural support component includesthe tower which orientates the rotor to the wind energysource. Majority of the wind turbines installed for powergeneration are horizontal axis turbines as these can adjusttheir blades to avoid high wind storms and can collect maxi-mum amount of wind energy.The vertical axis wind turbinesare rarely used [18]. The energy generated from these windfarms is supplied to customers through a central grid. In alarge wind farm the space between the wind turbines is usedfor agricultural purposes. Each turbine in a wind farm is
connected with another through a communication networkand a voltage system. In many instances to take advantagesof strong winds over an ocean or sea, wind turbines may belocated offshore as well. To select ideal locations for settingup of wind farms, wind power density (WPD) is expressedin terms of the elevation above ground level over a period oftime, taking into account velocity and mass [19].
3.1. Review of Wind Farm Cluster Performance. Today windturbine generators (WTGs) are almost comparable to con-ventional units of power generation in terms of both cost andcapacity ratings due to the development in wind technology[20]. The performance of a WTG is affected by reliability,power factor, technical availability, and capacity factor [21].Doubling the wind speed magnifies the power developedby 9 times, as power is proportional to cube of velocity.Also wind velocity variation has an impact on the economicsand smooth running of the wind energy conversion system.Today variable speed generations are available in marketswhich are cost effective [22]. Power density and annual meanwind speed need to be measured in order to assess the longterm trend of wind speed [23]. The annual energy outputat a location also depends on interconnection with electricnetworks, height of installation, effect of wind gusting, andso forth [24]. According to expert’s prediction, by the yr 2020wind power can capture 5% of the world energy market withimproved technologies and superior economics [25].
There are many notable studies on development andperformance of wind farms in literature. Lee et al. [25] con-structed a comprehensive evaluation model to select a suit-able location for developing a wind farm in Taiwan. Senel etal. [26] performed a study to determine the current positionof wind energy in Turkey and policies to increase the usage ofwind energy. Sholapurkar and Mahajan [10] carried a reviewon Maharashtra’s (India) wind energy progress, consideringfactors such as wind project installations, total capacity,declared wind sites, and wind power density at differentaltitudes. Barin et al. [27] developed a multicriteria decisionanalysis (MCDA) to evaluate the operation of the renewableenergy sources-wind generators, microturbines, photovoltaiccells, and fuel cells. Himri et al. [28] worked on wind farmdevelopment in Algeria. Wind speed data over a period ofalmost 10 years was utilized, in order to assess the energyoutput of a wind farm in terms of gross energy, renewableenergy delivered, specific yield, and wind farm capacityfactor. Phadke et al. [29] assess the technoeconomic onshorewind potential in India at three hub heights: 80m, 100m,and 120m. Nemes and Munteanu [30] developed a prob-abilistic model for capacity factor and technical efficiencyestimation in the wind farms of North-East of Romania. Atechnoeconomic evaluation of small wind electric generator(SWEG) projects for providing decentralized power supplyin remote locations in India is presented by Nouni et al. [31]Also Rajakumar andNagesha [32] estimated the performanceof a wind-mill cluster adopting a multicriteria approach.The methodology was implemented by collecting empiricaldata from three wind-mill clusters located at Chitradurga,Davangere, and Gadag in the southern Indian State ofKarnataka.

4 Journal of Renewable Energy
To improve the reliability of the system and to rectifythe failures it is important to analyze the performance of awind farm.TheWPDwhich is a prime parameter varies withdifferent locations as well as with seasons in India. FromAprilto September high WPD is observed and during October toDecember low WPD is observed. The energy generation at asite varies due to speed of the wind speed and other technicalfactors. The power curve is the most important performancecriterion. On the basis of the power curve the annual energyoutput can be calculated for a given site which indirectlygives the Capacity Utilization Factor (CUF) of a wind farm.Other factors which describe the performance of a windfarm are site factor, transmission losses, net energy output,individual WTG performance in the cluster, and so forth.Further, parameters like return on investment or cost/unit,machine availability, and grid connectivity are also relevantin estimating performance of any wind farm [32]. A lot ofquantitative and qualitative factors are involved in decisionmaking process. Energy evaluations may involve both quan-titative and qualitative factors. These should cover technical,economic, environmental, and socioeconomic factors [33].In the earlier studies multiple evaluation criteria were usedwhich include (a) technical (efficiency, primary energy ratio,safety, reliability, and maturity); (b) economic (investmentcost, operation and maintenance cost, fuel cost, net presentvalue, payback period, service life, equivalent annual cost,etc.); (c) environmental (CO
2emission, NO
𝑥emission, SO
2
emission, particles emission, land use, noise, etc.); and (d)social (social acceptability, job creation, social benefits, etc.)parameters [34].
3.2. Details of the Wind Farm under Study. Karnataka is oneof the top five states in India having high potential of windenergy generation [35]. It has about 30,000MW of officiallyestimated renewable energy (RE) potential, making it one ofthe country’s top five RE-rich states. Out of 15.0GW installedelectricity generating capacity in Karnataka, RE sourcescontribute for about 5.1 GW or 30% [36]. By March 2016, thetotal allotted wind energy generation capacity to variousgroups was 13983MW. But the commissioned capacity standsat 2916MW (20.84%) only, which is 20% of allotted capacity.3427MW of allotted capacity was cancelled due to severalreasons.
The district of Belagavi is located in north western partof the state of Karnataka. It has an average elevation of 751m.The Belagavi district wind farm cluster consists of 318 windturbine generators with a total installed capacity of 319.3MW.The installed capacities of wind energy ranged from 250 kWto 2MW and cost per MW varies for different developers. InBelgaum district wind cluster, the wind farms are located inmany places, namely, Chikkodi, Ramdurg, Raibag, Saundatti,Hukkeri, and Belagavi. The wind potential variability lies inthe range of 4.27 to 6.75m/s annual wind velocity with windpower density (WPD) ranging from 170W/m2 to 350W/m2at 50m hub height.The total installed capacity is 319.3MWason July 2015 with 318 totalWTGs [36].The district of Belagaviis one among the top five districts having higher potentialfor wind energy generation. For the analysis a questionnaire-based research survey was conducted. Opinions and
Table 1: Details of Belagavi district wind turbine installations.
Wind farm Nor. of WTGs Installed capacity in MWChikkodi 84 94.85Hukkeri 05 02Raibag 38 59.55Ramdurg 25 20Saundatti 95 82.5Belagavi 71 60.4Total 318 319.3
judgments were collected from wide variety of experts andstakeholders. All respondents were knowledgeable aboutthe power sector and were familiar with clean, efficient, andrenewable energy generation technologies and the barriershindering their widespread diffusion and adoption. Thedetails of wind turbine installations are presented in Table 1[36].
3.3. AHPMethodology forWindCluster PerformanceAnalysis.One of the main objectives of this work is to develop amethodology to evaluate the performance of wind farmclusters. For this purpose the Analytic Hierarchy Method(AHP) has been employed. In AHP methodology [37] ini-tially problem is defined with the main objective. In thenext step, the criteria are identified and the problem isstructured in a hierarchy. Then each element is comparedon a 1–9 scale (ranging from equal importance to extremeimportance) and finally calculations are done to find themax.eigenvalue, consistency index (CI), consistency ratio (CR),and normalized values for each criteria. Finally decisionis taken if the calculated max. eigenvalue, CI, and CR aresatisfactory. The consistency of the judgments is checked onthe basis of consistency ratio (CR) which should be less than0.1 [38]. The advantage of AHP is to find priority weightsthrough paired comparison of attributes through a qualitativeand quantitative approach [39].
4. Wind Farm Cluster Performance
In the present work, an attempt is made to evaluate the wind-mill cluster performance through multicriteria approach.The index to measure the performance is termed as CIOP-Cluster Index of Performance. The usage of energy is closelyassociated with human activities as well as sustainabilityissues and hence an energy system can provide lead indicatorsfor sustainable development [40]. The selection of indicatorsis the primary step in wind farm cluster performance. Severalstudies have been carried out in the past using variousMCDM methodologies such as AHP, VIKOR, fuzzy, andaxiomatic design method, on assessment of sustainabilityindicators [33, 41]. The chosen indicators in the presentwork include technical, economic, environmental, and socialcomponents.
The evaluation criteria considered under each indicatorare presented below:
(i) Technical. Energy production capacity, feasibility,risk, duration of preparation and implementation
Journal of Renewable Energy 5
Evaluation of wind farm ClusterIndex of PerformanceObjective
CriteriaIndicators of
technicalperformance
Indicators ofenvironmentalperformance
Indicators ofeconomic
performance
Indicators ofsocial
performance
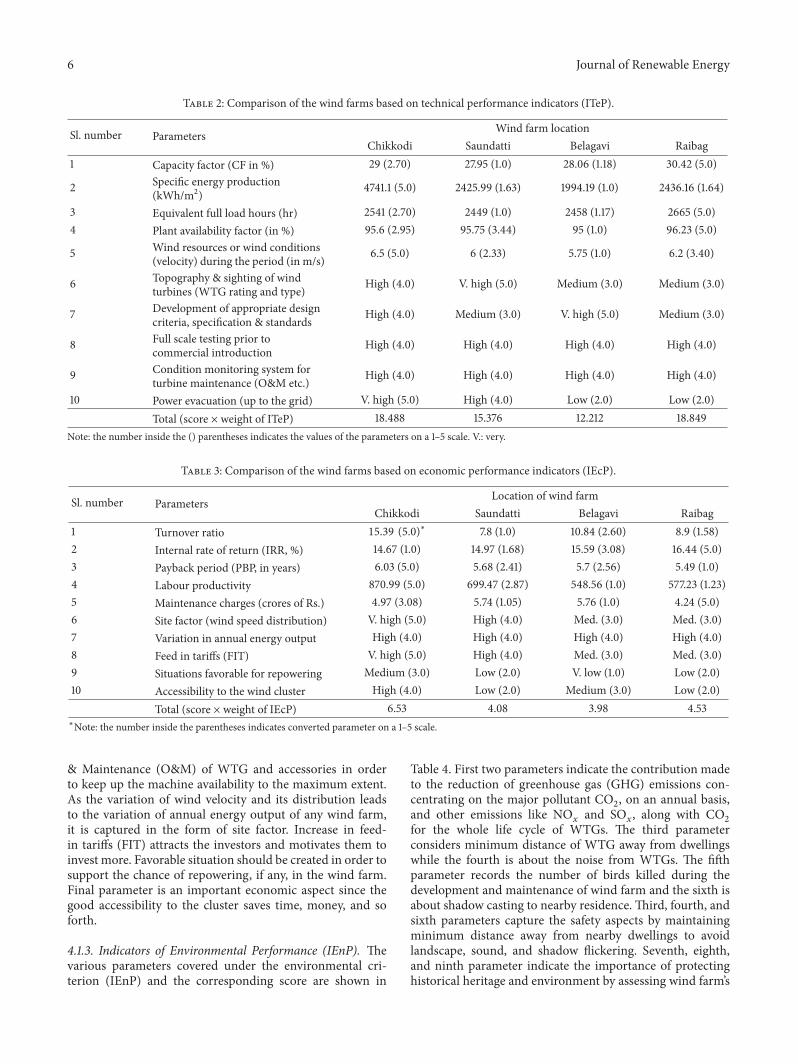
Figure 3: AHP framework for fixing weights of the criteria.
phase, technological maturity, reliability, safety, andlocal technical knowhow
(ii) Economical. Investment cost, implementation cost,operation and maintenance cost, service life, eco-nomic value (PW, IRR, and PBP), availability of funds
(iii) Environmental. Pollutant emission (CO2), need of
waste disposal, land requirements(iv) Sociopolitical. Social acceptability, policy objectives,
labour impact, political acceptance, and compatibilitywith national energy
Stakeholders involved are engineers working in windfarms, wind farm developers, Government officials fromenergy department, and a few selected residential people nearthewind farms. To obtain the relevant data in eachwind farm,the stakeholders are consulted through a set of structuredquestionnaire.The data varied from cluster to cluster and alsobetweenWTGswithin a cluster.The proposed index formea-surement of performance (CIOP) consists of four differentcriteria as shown in Figure 3. A total of 10 parameters wereconsidered for each criterion including five subject orientedand five objective question-responses. The methodology isimplemented by collecting empirical data from the wind-millclusters located at Chikkodi, Saundatti, Raibag, and Belagaviin the Belagavi district of Karnataka which has been chosenfor study.
4.1. Criteria for Evaluating Wind Farm Cluster Performance.Though there are many parameters relevant in evaluatingthe performance of wind farms, a proper methodologycomprising important factors is required to be developed toestimate the wind-mill cluster performance. The followingfour indicators, namely, technical, economic, environmental,and social indicators, to evaluate the performance of a windfarm were recommended by the World Energy Council(WEC). Further, a total of ten parameters under each ofthe four proposed indicators were considered in this workto take into account various dimensions of each indicator.Out of these parameters, five are quantitative in nature andremaining five are qualitative response types.
4.1.1. Indicators of Technical Performance (ITeP). The total en-ergy generated during the nominal period to the total poten-tial energy that can be generated during the same period is
termed as capacity factor (CF) and is measured in %. Theamount of energy generated during the nominal period to theswept rotor area is represented by specific energy production(kWh/m2). Equivalent full load hours are the availability ofnumber of annual hours of WTGs. The plant availabilityfactor represents the total operating hours of wind plantduring the period to that of total length (in hrs.) of operationof each WTG in wind farms. The wind conditions data isvery important to decide type and rating of WTGs that canbe installed in any wind farm as it depends on the windvelocity and WPD of a particular region. The topographyfactor deals with the viability of installing different ratingand type of WTGs, based on the topography and siting ofthem.The design aspect and its appropriateness in the clusterare measured using the factor, Development of AppropriateDesign Criteria, Specification & Standards. The factor, fullscale testing prior to commercial introduction, needs the realgroundwork to be carried out in order to manufacture com-ponents ofWTG as per the design criteria and standards, andit should also be tested prior to the practical implementation.The last two parameters (condition monitoring system andpower evacuation) are very important to maintain sustainedamount of power generation in the wind farm and itsevacuation to the nearby grid to ensure economic feasibility.While the first five parameters values are obtained throughquantitative computations the subsequent five parametervalues are obtained on a 1–5 scale using stakeholder responsesand value judgments. These parameters which contribute tothe ITeP and the scores for the clusters under study are shownin Table 2.
4.1.2. Indicators of Economic Performance (IEcP). Theparam-eters under economic performance criteria (IEcP) and thecorresponding score are presented in Table 3. The turnoverratio is the ratio of total annual revenue generated to thetotal initial investment including WTG cost and up to gridconnection cost. Internal rate of return (IRR) is the interestrate at which net present worth (NPW) becomes zero.Payback period (PBP) is the minimum time for any investorto get back his investment, if it is less this means the investorcomes forward to invest more in WETs. Labour productivityis measured in terms of total annual revenue generated to thetotal annual expenditure on Human Resources (HR). Main-tenance charges cover expenses towards annual Operation
6 Journal of Renewable Energy
Table 2: Comparison of the wind farms based on technical performance indicators (ITeP).
Sl. number Parameters Wind farm locationChikkodi Saundatti Belagavi Raibag
1 Capacity factor (CF in %) 29 (2.70) 27.95 (1.0) 28.06 (1.18) 30.42 (5.0)
2 Specific energy production(kWh/m2) 4741.1 (5.0) 2425.99 (1.63) 1994.19 (1.0) 2436.16 (1.64)
3 Equivalent full load hours (hr) 2541 (2.70) 2449 (1.0) 2458 (1.17) 2665 (5.0)4 Plant availability factor (in %) 95.6 (2.95) 95.75 (3.44) 95 (1.0) 96.23 (5.0)
5 Wind resources or wind conditions(velocity) during the period (in m/s) 6.5 (5.0) 6 (2.33) 5.75 (1.0) 6.2 (3.40)
6 Topography & sighting of windturbines (WTG rating and type) High (4.0) V. high (5.0) Medium (3.0) Medium (3.0)
7 Development of appropriate designcriteria, specification & standards High (4.0) Medium (3.0) V. high (5.0) Medium (3.0)
8 Full scale testing prior tocommercial introduction High (4.0) High (4.0) High (4.0) High (4.0)
9 Condition monitoring system forturbine maintenance (O&M etc.) High (4.0) High (4.0) High (4.0) High (4.0)
10 Power evacuation (up to the grid) V. high (5.0) High (4.0) Low (2.0) Low (2.0)Total (score × weight of ITeP) 18.488 15.376 12.212 18.849
Note: the number inside the () parentheses indicates the values of the parameters on a 1–5 scale. V.: very.
Table 3: Comparison of the wind farms based on economic performance indicators (IEcP).
Sl. number Parameters Location of wind farmChikkodi Saundatti Belagavi Raibag
1 Turnover ratio 15.39 (5.0)∗ 7.8 (1.0) 10.84 (2.60) 8.9 (1.58)
2 Internal rate of return (IRR, %) 14.67 (1.0) 14.97 (1.68) 15.59 (3.08) 16.44 (5.0)3 Payback period (PBP, in years) 6.03 (5.0) 5.68 (2.41) 5.7 (2.56) 5.49 (1.0)4 Labour productivity 870.99 (5.0) 699.47 (2.87) 548.56 (1.0) 577.23 (1.23)5 Maintenance charges (crores of Rs.) 4.97 (3.08) 5.74 (1.05) 5.76 (1.0) 4.24 (5.0)6 Site factor (wind speed distribution) V. high (5.0) High (4.0) Med. (3.0) Med. (3.0)7 Variation in annual energy output High (4.0) High (4.0) High (4.0) High (4.0)8 Feed in tariffs (FIT) V. high (5.0) High (4.0) Med. (3.0) Med. (3.0)9 Situations favorable for repowering Medium (3.0) Low (2.0) V. low (1.0) Low (2.0)10 Accessibility to the wind cluster High (4.0) Low (2.0) Medium (3.0) Low (2.0)
Total (score × weight of IEcP) 6.53 4.08 3.98 4.53∗Note: the number inside the parentheses indicates converted parameter on a 1–5 scale.
& Maintenance (O&M) of WTG and accessories in orderto keep up the machine availability to the maximum extent.As the variation of wind velocity and its distribution leadsto the variation of annual energy output of any wind farm,it is captured in the form of site factor. Increase in feed-in tariffs (FIT) attracts the investors and motivates them toinvest more. Favorable situation should be created in order tosupport the chance of repowering, if any, in the wind farm.Final parameter is an important economic aspect since thegood accessibility to the cluster saves time, money, and soforth.
4.1.3. Indicators of Environmental Performance (IEnP). Thevarious parameters covered under the environmental cri-terion (IEnP) and the corresponding score are shown in
Table 4. First two parameters indicate the contribution madeto the reduction of greenhouse gas (GHG) emissions con-centrating on the major pollutant CO
2, on an annual basis,
and other emissions like NO𝑥and SO
𝑥, along with CO
2
for the whole life cycle of WTGs. The third parameterconsiders minimum distance of WTG away from dwellingswhile the fourth is about the noise from WTGs. The fifthparameter records the number of birds killed during thedevelopment and maintenance of wind farm and the sixth isabout shadow casting to nearby residence. Third, fourth, andsixth parameters capture the safety aspects by maintainingminimum distance away from nearby dwellings to avoidlandscape, sound, and shadow flickering. Seventh, eighth,and ninth parameter indicate the importance of protectinghistorical heritage and environment by assessing wind farm’s

Journal of Renewable Energy 7
Table 4: Comparison of the wind farms based on environmental performance indicators (IEnP).
Sl. number ParametersWind farm location
Chikkodi Saundatti Belagavi Raibag
1Contribution to the reduction ofGHG emissions (avoided CO
2in
t/mW/y)189700 (5.0) 165000 (3.6) 120800 (1.1) 119100 (1.0)
2 Pollutant emissions during lifecycle; 𝑄CO2 , 𝑄SO𝑥 , 𝑄NO𝑥 (t/kWh)
1853.48 (5.0) 1488.47 (2.87) 1167.33 (1.0) 1228.35 (1.36)
3Visual effects/landscape protectiondistance (minimum distance awayfrom dwellings in m)
1350 (2.4) 2000 (5.0) 1000 (1.0) 1100 (1.4)
4 Noise from wind turbines (in dB) 49.6 (4.80) 49 (5.0) 57 (2.33) 61 (1.0)
5 Birds fatalities (number of birdskilled/WTG/Yr. n/yr)
3 (1.0) 1 (5.0) 2 (3.0) 2 (3.0)
6Shadow casting to nearby residence(number of hrs/yr when the nearbydwellings suffer from shadowcasting)
V. low (5.0) Medium (3.0) Low (4.0) Low (4.0)
7 Archaeological and historicalheritage
Low (2.0) High (4.0) Medium (3.0) Low (2.0)
8 Hydrological assessment Low (4.0) Medium (3.0) Medium (3.0) V. low (5.0)
9Assessment of flora andfauna/climate change (e.g., dangercaused to species, migrating birds)
V. low (5.0) Medium (3.0) Low (4.0) Low (4.0)
10 Interference with telecom. systems Low (4.0) Medium (3.0) Low (4.0) Low (4.0)
Total (score × weight of IEnP) 3.13 3.07 2.16 2.11
effects on flora and fauna, climate change, and so forth.Final parameter is relevant when the wind farm is nearbythe dwellings where there is interruption for communicationsystems like mobile towers, antennas, and so forth.
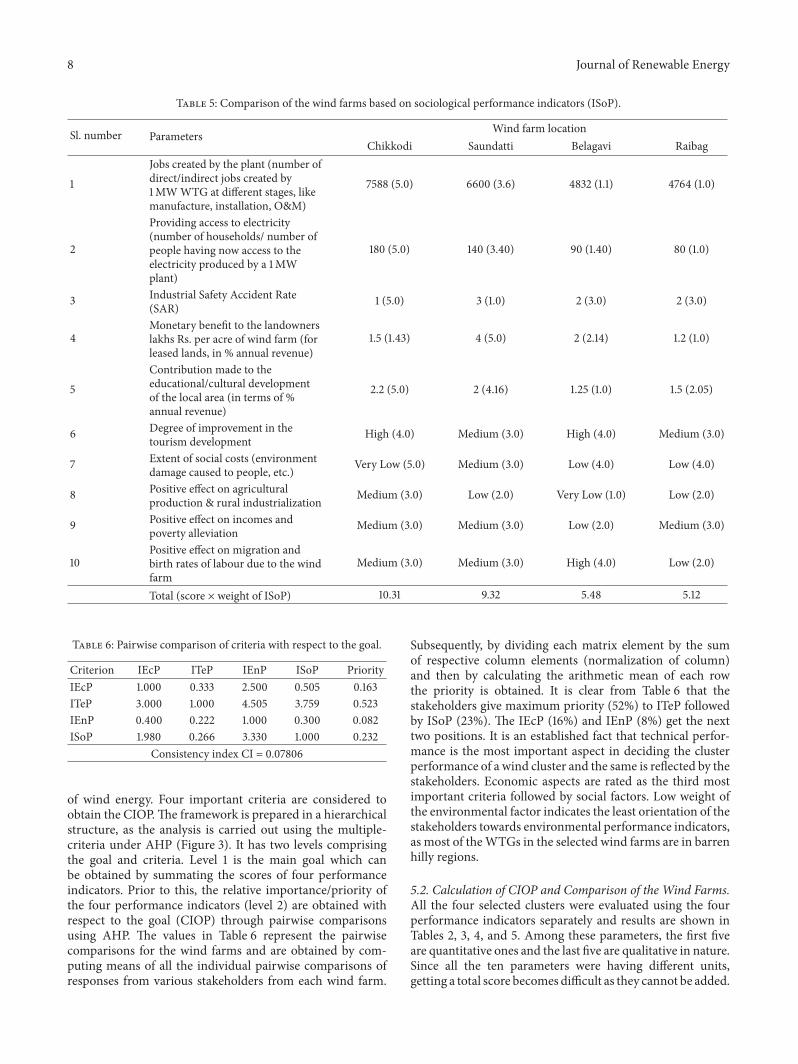
4.1.4. Indicators of Sociological Performance (ISoP). Table 5shows the ten parameters which are used in evaluating thesociological performance (ISoP) of a wind farm along withthe score for the clusters. First parameter considers thenumber of jobs that a wind farm can generate from themanufacturing to the erection and commissioning stage andalso during maintenance. Number of households electrifieddue to the development of wind farm is covered in the secondparameter.Third parameter is very important for the smoothfunctioning and development of wind energy farm activitiesby ensuring safety. Fourth parameter is vital for landownersand nearby villagers who have given land for setting up thewind farm. Fifth parameter deals with the contributionmadetowards educational and cultural development of locality.Sixth parameter considers the degree of improvement intourism due to the attraction of wind farm. The degreeof damage caused by wind farm to nearby environment,people, and so forth is covered by the seventh parameter.The last three parameters try to figure out the positive effectof wind farm on the development of agricultural and ruralindustrialization, poverty alleviation, and migration/birthrates of nearby people.
5. Evaluation of Cluster Index ofPerformance (CIOP)
Different performance indicators have been used in this workto compare the performance of the different wind clusters.This is accomplished by developing an index to evaluate theperformance called “Cluster Index of Performance (CIOP)”.As presented in Section 3.3, Analytic Hierarchy Process(AHP) under multicriteria framework is used as a tool toevaluate CIOP. The advantage of AHP is that it helps todevelop a theory and then provides a methodology for mod-eling the unstructured problems in the economic, technical,social, and management sciences [37]. By its flexible andpowerful weighed scoring decision making process, AHPhelps to set priorities and makes the best decision when bothqualitative and quantitative aspects of a decision need to beconsidered [38]. AHP engages decision makers in breakingdown a decision into parts, proceeding from the goal (at thetop level) to criteria (at the subsequent level). The decisionmakers then make simple pairwise comparison judgmentsthrough the hierarchy to arrive at overall priorities for thecriteria [42].
5.1. Cluster Performance Analysis under the AHP Framework.A cluster performance analysis framework is developed inthis section utilizing the existing literature pertaining to theperformance analysis and discussion with experts in the field
8 Journal of Renewable Energy
Table 5: Comparison of the wind farms based on sociological performance indicators (ISoP).
Sl. number Parameters Wind farm locationChikkodi Saundatti Belagavi Raibag
1Jobs created by the plant (number ofdirect/indirect jobs created by1MWWTG at different stages, likemanufacture, installation, O&M)
7588 (5.0) 6600 (3.6) 4832 (1.1) 4764 (1.0)
2
Providing access to electricity(number of households/ number ofpeople having now access to theelectricity produced by a 1MWplant)
180 (5.0) 140 (3.40) 90 (1.40) 80 (1.0)
3 Industrial Safety Accident Rate(SAR) 1 (5.0) 3 (1.0) 2 (3.0) 2 (3.0)
4Monetary benefit to the landownerslakhs Rs. per acre of wind farm (forleased lands, in % annual revenue)
1.5 (1.43) 4 (5.0) 2 (2.14) 1.2 (1.0)
5Contribution made to theeducational/cultural developmentof the local area (in terms of %annual revenue)
2.2 (5.0) 2 (4.16) 1.25 (1.0) 1.5 (2.05)
6 Degree of improvement in thetourism development High (4.0) Medium (3.0) High (4.0) Medium (3.0)
7 Extent of social costs (environmentdamage caused to people, etc.) Very Low (5.0) Medium (3.0) Low (4.0) Low (4.0)
8 Positive effect on agriculturalproduction & rural industrialization Medium (3.0) Low (2.0) Very Low (1.0) Low (2.0)
9 Positive effect on incomes andpoverty alleviation Medium (3.0) Medium (3.0) Low (2.0) Medium (3.0)
10Positive effect on migration andbirth rates of labour due to the windfarm
Medium (3.0) Medium (3.0) High (4.0) Low (2.0)
Total (score × weight of ISoP) 10.31 9.32 5.48 5.12
Table 6: Pairwise comparison of criteria with respect to the goal.
Criterion IEcP ITeP IEnP ISoP PriorityIEcP 1.000 0.333 2.500 0.505 0.163ITeP 3.000 1.000 4.505 3.759 0.523IEnP 0.400 0.222 1.000 0.300 0.082ISoP 1.980 0.266 3.330 1.000 0.232
Consistency index CI = 0.07806
of wind energy. Four important criteria are considered toobtain the CIOP.The framework is prepared in a hierarchicalstructure, as the analysis is carried out using the multiple-criteria under AHP (Figure 3). It has two levels comprisingthe goal and criteria. Level 1 is the main goal which canbe obtained by summating the scores of four performanceindicators. Prior to this, the relative importance/priority ofthe four performance indicators (level 2) are obtained withrespect to the goal (CIOP) through pairwise comparisonsusing AHP. The values in Table 6 represent the pairwisecomparisons for the wind farms and are obtained by com-puting means of all the individual pairwise comparisons ofresponses from various stakeholders from each wind farm.
Subsequently, by dividing each matrix element by the sumof respective column elements (normalization of column)and then by calculating the arithmetic mean of each rowthe priority is obtained. It is clear from Table 6 that thestakeholders give maximum priority (52%) to ITeP followedby ISoP (23%). The IEcP (16%) and IEnP (8%) get the nexttwo positions. It is an established fact that technical perfor-mance is the most important aspect in deciding the clusterperformance of a wind cluster and the same is reflected by thestakeholders. Economic aspects are rated as the third mostimportant criteria followed by social factors. Low weight ofthe environmental factor indicates the least orientation of thestakeholders towards environmental performance indicators,as most of theWTGs in the selected wind farms are in barrenhilly regions.
5.2. Calculation of CIOP and Comparison of the Wind Farms.All the four selected clusters were evaluated using the fourperformance indicators separately and results are shown inTables 2, 3, 4, and 5. Among these parameters, the first fiveare quantitative ones and the last five are qualitative in nature.Since all the ten parameters were having different units,getting a total score becomes difficult as they cannot be added.
Journal of Renewable Energy 9
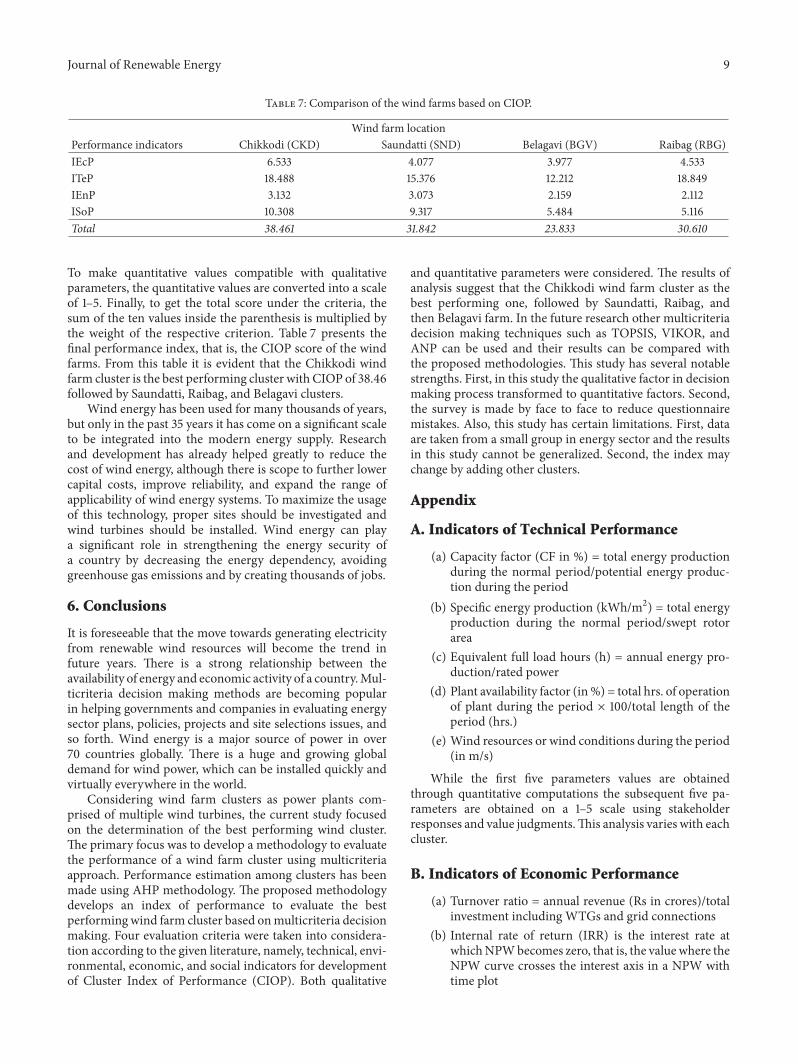
Table 7: Comparison of the wind farms based on CIOP.
Wind farm locationPerformance indicators Chikkodi (CKD) Saundatti (SND) Belagavi (BGV) Raibag (RBG)IEcP 6.533 4.077 3.977 4.533ITeP 18.488 15.376 12.212 18.849IEnP 3.132 3.073 2.159 2.112ISoP 10.308 9.317 5.484 5.116Total 38.461 31.842 23.833 30.610
To make quantitative values compatible with qualitativeparameters, the quantitative values are converted into a scaleof 1–5. Finally, to get the total score under the criteria, thesum of the ten values inside the parenthesis is multiplied bythe weight of the respective criterion. Table 7 presents thefinal performance index, that is, the CIOP score of the windfarms. From this table it is evident that the Chikkodi windfarm cluster is the best performing cluster with CIOP of 38.46followed by Saundatti, Raibag, and Belagavi clusters.
Wind energy has been used for many thousands of years,but only in the past 35 years it has come on a significant scaleto be integrated into the modern energy supply. Researchand development has already helped greatly to reduce thecost of wind energy, although there is scope to further lowercapital costs, improve reliability, and expand the range ofapplicability of wind energy systems. To maximize the usageof this technology, proper sites should be investigated andwind turbines should be installed. Wind energy can playa significant role in strengthening the energy security ofa country by decreasing the energy dependency, avoidinggreenhouse gas emissions and by creating thousands of jobs.
6. Conclusions
It is foreseeable that the move towards generating electricityfrom renewable wind resources will become the trend infuture years. There is a strong relationship between theavailability of energy and economic activity of a country.Mul-ticriteria decision making methods are becoming popularin helping governments and companies in evaluating energysector plans, policies, projects and site selections issues, andso forth. Wind energy is a major source of power in over70 countries globally. There is a huge and growing globaldemand for wind power, which can be installed quickly andvirtually everywhere in the world.
Considering wind farm clusters as power plants com-prised of multiple wind turbines, the current study focusedon the determination of the best performing wind cluster.The primary focus was to develop a methodology to evaluatethe performance of a wind farm cluster using multicriteriaapproach. Performance estimation among clusters has beenmade using AHP methodology. The proposed methodologydevelops an index of performance to evaluate the bestperformingwind farm cluster based onmulticriteria decisionmaking. Four evaluation criteria were taken into considera-tion according to the given literature, namely, technical, envi-ronmental, economic, and social indicators for developmentof Cluster Index of Performance (CIOP). Both qualitative
and quantitative parameters were considered. The results ofanalysis suggest that the Chikkodi wind farm cluster as thebest performing one, followed by Saundatti, Raibag, andthen Belagavi farm. In the future research other multicriteriadecision making techniques such as TOPSIS, VIKOR, andANP can be used and their results can be compared withthe proposed methodologies. This study has several notablestrengths. First, in this study the qualitative factor in decisionmaking process transformed to quantitative factors. Second,the survey is made by face to face to reduce questionnairemistakes. Also, this study has certain limitations. First, dataare taken from a small group in energy sector and the resultsin this study cannot be generalized. Second, the index maychange by adding other clusters.
Appendix
A. Indicators of Technical Performance
(a) Capacity factor (CF in %) = total energy productionduring the normal period/potential energy produc-tion during the period
(b) Specific energy production (kWh/m2) = total energyproduction during the normal period/swept rotorarea
(c) Equivalent full load hours (h) = annual energy pro-duction/rated power
(d) Plant availability factor (in%) = total hrs. of operationof plant during the period × 100/total length of theperiod (hrs.)
(e) Wind resources or wind conditions during the period(in m/s)
While the first five parameters values are obtainedthrough quantitative computations the subsequent five pa-rameters are obtained on a 1–5 scale using stakeholderresponses and value judgments.This analysis varies with eachcluster.
B. Indicators of Economic Performance
(a) Turnover ratio = annual revenue (Rs in crores)/totalinvestment including WTGs and grid connections
(b) Internal rate of return (IRR) is the interest rate atwhichNPWbecomes zero, that is, the valuewhere theNPW curve crosses the interest axis in a NPW withtime plot
10 Journal of Renewable Energy
(c) Payback period (PBP) = initial investment/(annualrevenue – O&M charges)
(d) Labour productivity = annual revenue/annual HRexpenditure
(e) Maintenance factor = annual revenue/annual O&Mcost
For environmental and sociological indicators requireddata is directly collected fromwind cluster site through ques-tionnaire.
C. Indicators of Environmental Performance
(a) Contribution to the reduction of GHG emissions(avoided CO
2t/MW/y)
(b) Pollutant emissions during life cycle; 𝑄CO2 , 𝑄SO𝑥 ,𝑄NO𝑥 (g/kWh) = quantities of CO
2, SO𝑥, and NO
𝑥
emitted per kWh during the whole life cycle of theplant
The above parameters are evaluated by considering thedata that 1MW of power generation from coal thermal pro-duces 19 ton of CO
2, 136 kg of SO
2, 7 ton of fly ash, and 60 kg
of particulate matter per day, assuming an average plant loadfactor (PLF) of 75% [43].
D. Indicators of Sociological Performance
(a) Jobs created by the plant: number of jobs created by1MW capacity WTG at different stages includingmanufacturing, installation, O&M period, and soforth
(b) Providing access to electricity: number of householdshaving access to the electricity produced by a 1MWplant
(c) Industrial safety accident rate (SAR): number of acci-dents for all utility personnel assigned to plant.
Competing Interests
The authors declare that they have no competing interests.
Acknowledgments
The authors wish to thank all the people who have sparedtheir valuable time to respond to the research questionnaire.The authors express their gratitude to the technical staff at thewind sites for sharing the information and technical data.Theauthors also wish to thank the Visvesvaraya TechnologicalUniversity (VTU) Belagavi, the management of KLS, and thePrincipal of KLSGIT for permitting to carry out the researchwork.
References
[1] Sustainable Development: From Brundtland to Rio 2012—BackgroundPaper prepared for consideration by theHigh LevelPanel on Global Sustainability at its first meeting, September2010.
[2] F. Urban, Sustainable energy for developing countries: modelingtransitions to renewable and clean energy in rapidly developingcountries [M.S. thesis], 2008.
[3] V. Del Rosario, Community stakeholder management in windenergy development projects: a planning approach [M.S. thesis],2007.
[4] R. B. Hiremath, S. Shikha, and N. H. Ravindranath, “Decen-tralized energy planning; modeling and application-a review,”Renewable and Sustainable Energy Reviews, vol. 11, no. 5, pp.729–752, 2007.
[5] NITI Aayog, Report on India’s Renewable Electricity Roadmap2030: Toward Accelerated Renewable Electricity Deployment,NITI Aayog, New Delhi, India, 2015.
[6] EIA, Annual Energy Outlook 2013, With Projections to 2040,EIA-2013, U.S. Energy Information Administration, Office ofIntegrated and International Energy Analysis, U.S. Departmentof Energy, Washington, DC, USA, 2013.
[7] Reenergizing India, Policy, Regulatory and Financial Initiativesto Augment Renewable Energy Deployment in India: ClimateParliament—2014, IDAM Infrastructure Advisory Private, NewDelhi, India, 2014.
[8] MNRE, National Offshore wind Energy Policy, Ministry ofNew and Renewable Energy. Government of India, 2015, http://mnre.gov.in/information/policies-2/.
[9] H. Jami, “India’s wind power potential,” Tech. Rep., Ministry ofNew and Renewable Energy, 2015.
[10] R. B. Sholapurkar and Y. S. Mahajan, “Review of wind energydevelopment and policy in India,” Energy Technology & Policy,vol. 2, no. 1, pp. 122–132, 2015.
[11] Wwindea—New Record in Worldwide Wind Installations,http://www.wwindea.org/the-world-sets-new-wind-installa-tions-record-637-gw-new-capacity-in-2015/.
[12] J. Hossain, V. Sinha, and V. V. N. Kishore, “A GIS based assess-ment of potential for windfarms in India,” Renewable Energy,vol. 36, no. 12, pp. 3257–3267, 2011.
[13] WinDForce, Report on India’s Wind Power Potential Submittedto MNRE, WinDForce Management Services Pvt. Ltd., Gur-gaon, India; CSTEP, Bengaluru, India; Shakti Foundation, NewDelhi, India, 2015.
[14] Twelfth five year plan 2012–2017, II-Economic sectors, PlanningCommission (Government of India), Sage, 2013.
[15] C.Mehra and J.Hossain,Barriers to AcceleratingWind Energy inIndia, 2015, http://case-bharat.org/dox/Wind%20POS%20Pa-per.pdf.
[16] M. N. R. E. Varsha Joshi, 2014, http://www.slideshare.net/varshajoshi95/wind-power-in-india-an-ongoing-success-story-40134571.
[17] T. V. Ramachandra and G. Hegde, “Energy trajectory inIndia: challenges and opportunities for innovation,” Journal ofResources, Energy and Development, vol. 12, no. 1-2, pp. 1–24,2016.
[18] O. Badran and E. Abdulhadi, “Evaluation of factors affectingwind power generation in Jordan,” in Proceedings of the 7thAsia-Pacific Conference on Wind Engineering, Taipei, Taiwan,November 2009.
[19] K. Bruce Newbold and M. Mckeary, Wind energy powerpants—review and analysis [M.S. thesis], Institute of Environ-ment & Health (MIEH), 2010, http://www.mcmaster.ca/mihe/documents/publications/Wind Farms 2010.pdf.
[20] A. H. I. Lee, H.-Y. Kang, and C.-C. Chang, “An integratedinterpretive structural modeling-fuzzy analytic network pro-cessbenefits, opportunities, costs and risks model for selecting
Journal of Renewable Energy 11
technologies,” International Journal of Information Technologyand Decision Making, vol. 10, no. 5, pp. 843–871, 2011.
[21] O. Ozgener and L. Ozgener, “Exergy and reliability analysis ofwind turbine systems: a case study,” Renewable and SustainableEnergy Reviews, vol. 11, no. 8, pp. 1811–1826, 2007.
[22] J. A. Baroudi, V. Dinavahi, andA.M. Knight, “A review of powerconverter topologies for wind generators,” Renewable Energy,vol. 32, no. 14, pp. 2369–2385, 2007.
[23] T. L. Acker, S. K. Williams, E. P. N. Duque, G. Brummels, andJ. Buechler, “Wind resource assessment in the state of Arizona:inventory, capacity factor, and cost,” Renewable Energy, vol. 32,no. 9, pp. 1453–1466, 2007.
[24] G.M. J. Herbert, S. Iniyan, E. Sreevalsan, and S. Rajapandian, “Areview of wind energy technologies,”Renewable and SustainableEnergy Reviews, vol. 11, no. 6, pp. 1117–1145, 2007.
[25] A. H. I. Lee, H. H. Chen, and H.-Y. Kang, “Multi-criteria deci-sion making on strategic selection of wind farms,” RenewableEnergy, vol. 34, no. 1, pp. 120–126, 2009.
[26] B. Senel, M. Senel, and L. Bilir, “Role of wind power in theenergy policy of Turkey,” Energy Technology & Policy, vol. 1, no.1, pp. 123–130, 2014.
[27] A. Barin, L. N. Canha, and A. da Rosa Abaide, “Multicriteriaanalysis of the operation of renewable energy sources taking asbasis the AHP method and fuzzy logic concerning distributedgeneration systems,” The Online Journal on Electronics andElectrical Engineering, vol. 1, no. 1, pp. 52–57.
[28] Y. Himri, A. Boudghene Stambouli, and B. Draoui, “Prospectsof wind farm development in Algeria,” Desalination, vol. 238,no. 1–3, pp. 130–138, 2009.
[29] A. Phadke, R. Bharvirkar, and J. Khangura, Reassessing WindPotential Estimates for India: Economic and Policy Implications,Environmental Energy Technologies Division , InternationalEnergy Studies, 2012.
[30] C. Nemes and F. Munteanu, “The wind energy system per-formance overview: capacity factor vs. technical efficiency,”International Journal of Mathematical Models and Methods inApplied Sciences, vol. 1, no. 5, pp. 159–166, 2011.
[31] M. R. Nouni, S. C. Mullick, and T. C. Kandpal, “Techno-economics of small wind electric generator projects for decen-tralized power supply in India,” Energy Policy, vol. 35, no. 4, pp.2491–2506, 2007.
[32] D. G. Rajakumar and N. Nagesha, “Estimating windmill clusterperformance: a multicriteria approach,” Journal of SustainableManufacturing and Renewable Energy, vol. 2, no. 3-4, pp. 93–107, 2013.
[33] O. Demirtas, “Evaluating the best renewable energy technologyfor sustainable energy planning,” International Journal of EnergyEconomics and Policy, vol. 3, pp. 23–33, 2013.
[34] T. Kaya and C. Kahraman, “Multicriteria renewable energyplanning using an integrated fuzzy VIKOR & AHP methodol-ogy: the case of Istanbul,” Energy, vol. 35, no. 6, pp. 2517–2527,2010.
[35] NRDC—Council for energy environment and water andSHAKTI Foundation—Issue paper A Second Wind for India’sEnergy Market: Financing Mechanisms to Support India’sNational Wind Energy Mission, August 2014.
[36] KREDL-KarnatakaRenewable EnergyDevelopment Ltd, http://www.kredlinfo.in/.
[37] T. L. Saaty, The Analytic Hierarchy Process: Planning, PrioritySetting, Resource Allocation, Mcgraw-Hill International BookCompany, New York, NY, USA, 1980.
[38] T. L. Saaty, “How to make a decision: the analytic hierarchyprocess,” European Journal of Operational Research, vol. 48, no.1, pp. 9–26, 1990.
[39] S. D. Pohekar and M. Ramachandran, “Application of multi-criteria decision making to sustainable energy planning—areview,” Renewable and Sustainable Energy Reviews, vol. 8, no.4, pp. 365–381, 2004.
[40] A. Kemmler and D. Spreng, “Energy indicators for trackingsustainability in developing countries,”Energy Policy, vol. 35, no.4, pp. 2466–2480, 2007.
[41] G.Wang, Y.Wang, and T. Zhao, “Analysis of interactions amongthe barriers to energy saving in China,” Energy Policy, vol. 36,no. 6, pp. 1879–1889, 2008.
[42] N. Nagesha and P. Balachandra, “Barriers to energy efficiencyin small industry clusters: multi-criteria-based prioritizationusing the analytic hierarchy process,” Energy, vol. 31, no. 12, pp.1633–1647, 2006.
[43] S. Peribesh, Biodiversity-Ecosystems Management and the GreenEconomy, State Pollution Control Board, Bhubaneswar, India,2010.

TribologyAdvances in
Hindawi Publishing Corporationhttp://www.hindawi.com Volume 2014
International Journal of
AerospaceEngineeringHindawi Publishing Corporationhttp://www.hindawi.com Volume 2014
FuelsJournal of
Hindawi Publishing Corporationhttp://www.hindawi.com Volume 2014
Journal ofPetroleum Engineering
Hindawi Publishing Corporationhttp://www.hindawi.com Volume 2014
Industrial EngineeringJournal of
Hindawi Publishing Corporationhttp://www.hindawi.com Volume 2014
Power ElectronicsHindawi Publishing Corporationhttp://www.hindawi.com Volume 2014
Advances in
CombustionJournal of
Hindawi Publishing Corporationhttp://www.hindawi.com Volume 2014
Journal of
Hindawi Publishing Corporationhttp://www.hindawi.com Volume 2014
Renewable Energy
Submit your manuscripts athttp://www.hindawi.com
Hindawi Publishing Corporationhttp://www.hindawi.com Volume 2014
StructuresJournal of
International Journal of
RotatingMachinery
Hindawi Publishing Corporationhttp://www.hindawi.com Volume 2014
EnergyJournal of
Hindawi Publishing Corporationhttp://www.hindawi.com Volume 2014
Hindawi Publishing Corporation http://www.hindawi.com
Journal ofEngineeringVolume 2014
Hindawi Publishing Corporation http://www.hindawi.com Volume 2014
International Journal ofPhotoenergy
Hindawi Publishing Corporationhttp://www.hindawi.com Volume 2014
Nuclear InstallationsScience and Technology of
Hindawi Publishing Corporationhttp://www.hindawi.com Volume 2014
Solar EnergyJournal of
Hindawi Publishing Corporationhttp://www.hindawi.com Volume 2014
Wind EnergyJournal of
Hindawi Publishing Corporationhttp://www.hindawi.com Volume 2014
Nuclear EnergyInternational Journal of
Hindawi Publishing Corporationhttp://www.hindawi.com Volume 2014
High Energy PhysicsAdvances in
The Scientific World JournalHindawi Publishing Corporation http://www.hindawi.com Volume 2014