research article safety identifying of integral abutment
TRANSCRIPT

Research ArticleSafety Identifying of Integral Abutment Bridges underSeismic and Thermal Loads
Narges Easazadeh Far and Majid Barghian
Department of Structural Engineering Faculty of Civil Engineering University of Tabriz Tabriz 5166616471 Iran
Correspondence should be addressed to Majid Barghian barghiantabrizuacir
Received 2 August 2014 Revised 6 September 2014 Accepted 6 September 2014 Published 27 October 2014
Academic Editor Siamak Talatahari
Copyright copy 2014 N Easazadeh Far and M Barghian This is an open access article distributed under the Creative CommonsAttribution License which permits unrestricted use distribution and reproduction in any medium provided the original work isproperly cited
Integral abutment bridges (IABs) have many advantages over conventional bridges in terms of strength and maintenance cost Dueto the integrity of these structures uniform thermal and seismic loads are known important ones on the structure performanceAlthough all bridge design codes consider temperature and earthquake loads separately in their load combinations for conventionalbridges the thermal load is an ldquoalways onrdquo load and during the occurrence of an earthquake these two important loads act on bridgesimultaneously Evaluating the safety level of IABs under combination of these loads becomes important In this paper the safetyof IABsmdashdesigned by AASHTO LRFD bridge design codemdashunder combination of thermal and seismic loads is studied To fulfillthis aim first the target reliability indexes under seismic load have been calculated Then these analyses for the same bridge undercombination of thermal and seismic loads have been repeated and the obtained reliability indexes are compared with target indexesIt is shown that for an IAB designed by AASHTO LRFD the indexes have been reduced under combined effects So the targetlevel of safety during its design life is not provided and the codersquos load combination should be changed
1 Introduction
Integral abutment bridges (IABs) are continuous single ormultispans bridges in which the jointless superstructure isconnected rigidly to the abutment So in the longitudinaldirection these two parts can be assumed as a single integralcomponent The rigid connection between them leads mostof displacements and loads transfer from superstructure tosubstructure consisting of abutments and piled foundationsBy eliminating the expansion joints in IABs most problemsassociated with expansion joints and bearings are reducedsuch as highmaintenance costs deterioration due to decidingchemicals and impact loads These advantages of IABs havecaused them to be used throughout the world increasinglyespecially in USA Canada UK and Republic of KoreaThese bridges similar to conventional bridges are subjected toprimary (loads live loads dead loads seismic loads etc) andsecondary effects (shrinkage creep passive pressure uniformtemperature changes thermal gradients etc) Among theseloadsmdashdue to the integrity of these bridges and the resultantcomplexity of soilstructure interactionsmdashuniform thermal
and longitudinal seismic loads become important and havedeterministic role in the behavior of IABs
Several researchers studied the behavior of these bridgesunder thermal and seismic loads separately and showedthe importance of these loads on the IABrsquos response Tsangand England [1] investigated the soilstructure interactionof integral bridge with full height abutments Dicleli andAlbhaisi [2] studied the effect of cyclic thermal loading onthe behavior of steel H-piles foundation of integral bridgesIn this research the abutments of bridges are stub Kimand Laman [3] investigated the integral abutment bridgeresponse under the thermal loading In the other researchthey studied the long-term behavior of integral abutmentbridges by using numerical analysis Tegos et al [4] proposedtwo different abutment configurations to improve seismicbehavior of integral bridges Itani and Pekcan [5] and Froschet al [6] investigated the seismic behavior of IABs anddeveloped design recommendations Maleki and Mahjoubi[7] introduced a 2D finite element model for seismic analysisof retaining walls and integral bridge abutments They alsoproposed a new seismic soil pressure distribution to replace
Hindawi Publishing Corporatione Scientific World JournalVolume 2014 Article ID 757608 12 pageshttpdxdoiorg1011552014757608
2 The Scientific World Journal
the Mononobe-Okabe [8] equations Kim [9] proposednew load combinations for the load and resistance factordesign (LRFD) to design typical IABs by developing thenominal IAB response prediction models and establishingIABrsquos response statistics usingMonte Carlo simulationThesedeveloped load combinations were established using reliabil-ity analysis and included dead load live load and thermalload due to temperature variation temperature gradientbackfill pressure and time-dependent effects
As (1) Eurocode 8 [10] American Association of StateHighway and Transportation Officials (AASHTO LRFD2012) [11] and other developed bridge design codes considertemperature and earthquake loads separately in their speci-fied load combinations for the design of bridges (2) by know-ing that the these load combinations have been primarilydefined for conventional bridges with expansion joints whiledue to the elimination of expansion joints and due to theintegration between substructure and superstructure of IABsoverall performance of bridges is different from conventionalbridges (3) according to the fact that there is a temperaturedifference between temperature at any time of bridge lifeand bridge construction time temperature hence a uniformtemperature load is applied to the bridge Therefore duringearthquake the existence of a uniform temperature load is anobvious matter and (4) both the uniform temperature loadand earthquake load are important for integral bridges dueto their structural nature and the role of the mentioned loadson these bridges Therefore the importance of evaluating thesafety level IABsmdashdesigned by AASHTO LRFD [11] bridgedesigned codemdashunder combination of temperature andearthquake loads during the design life of IABs is perceived
For this reason in this paper by using structural relia-bility analysis conducted on a case study bridgemdashdesignedin accordance with existing AASHTO LRFD [11] codemdashthe safety level of bridge under combination of seismic andthermal loads was evaluated during its 75-year design life [11]Comparing the obtained results with the target safety levelit will be clear whether the target safety level for designedintegral bridgemdashduring design life (according to AASHTOLRFD)mdashunder combined effect of seismic and thermal loadsis guaranteed or not On the other hand the current codehas been written for conventional bridges but it is used forIABs Codes are gradually developed to consider new bridgessuch as IABs If the target safety level for these bridges is notsatisfied then themodification of the codersquos load combinationis needed
To achieve this objective this paper reviews the basic reli-ability concepts and available analytical models for studyingthe reliability of structures under the combination of loadsThese models are (1) Turkstrarsquos rule [19] (2) the Ferry-Borges(or Ferry Borges-Castanheta) model [20] (3) Wenrsquos loadcoincidence method [21] and (4) scenario sampling model[22 23]
As the reliability index is usually used to evaluate thesafety level of a structure an IABdesigned based onAASHTOLRFD bridge design specification [11] was analyzed to eval-uate reliability index values for its 75-year design life (a 75-year design life is used for an IAB [11]) for different limitstates As moments and shears at the interface of pile with
the abutment are most affected by the temperature changethat accompanies an earthquake the bending moment andshearing limit states of piled foundation are considered inthis paper First the reliability indexes are calculated forbridges under the effect of only earthquake load to evaluatethe target reliability indexes [24] Then by repeating theseanalyses for the same bridges subjected to the combination ofseismic and thermal loads and comparing evaluated indexeswith the target reliability indexes whether the target safetylevel for designed integral bridgemdashaccording to AASHTOLRFDcode under uniform temperature and earthquake loadscombinationmdashis satisfied or not will be investigated
As mentioned above AASHTO LRFD [11] considersearthquake load separately in the extreme event I load com-bination as addressed in
Extreme Event 119868 = 120574DLDL + 120574119875119886
119875119886+ 120574Δ119875119886
Δ119875119886119890+ 120574EQEQ
(1)
where EQ DL 119875119886 andΔ119875
119886119890are seismic load dead load static
earth pressure and seismic earth pressure respectively and120574DL = 125 120574
119875119886
= 15 120574Δ119875119886
= 1 120574EQ = 1 are the consideredload factors
The statistical data required for this reliability analysisare assembled from reliability literature Ghosn et al [24]United States Geological survey (USGS)website [16] weatherwebsite [18 25] and Kim [9]
2 Basic Concepts of StructuralReliability Theory
The purpose of the structural reliability theory is includ-ing the uncertainties associated with the member capacityand the occurrence intensities and effect of loads that themembers are subjected to during their design life Thusall variables contributing in the member resistance and theload effects should be represented by random variables Theminimum characteristics to define a random variable 119877are probability distribution function PDF the Mean value119877 and the standard deviation 120590
119877 As shown in (2) the
coefficient of variation (COV) is defined as the ratio ofstandard deviation 120590
119877 to mean value 119877 and bias factor 119887
119903
as the ratio of the mean value 119877 to the nominal or designvalue 119877
119899 Consider
COV =120590119877
119877
119887119903=119877
119877119899
(2)
Based on structural reliability theory the safety of astructure can be achieved just when the structural resistance(119877) exceeds the load effects (119878) So the reliability 119877
119890 of a
structure is the probability of this exceedance as follows
119877119890= Pr [119877 gt 119878]
119877119890= Pr [119885 = 119877 minus 119878 gt 0]
or 119877119890= Pr [119885 (119883
1 1198832 119883
119899) gt 0]
(3)
where 119885 is the limit state function that relates the resistance(119877) to the load effects (119878) for evaluating the safety level
The Scientific World Journal 3
of the structure 1198831 1198832 119883
119899are the random variables
associated with the resistance and the applied loads Incontrast probability of failure 119875
119891 is the probability that the
safety margin 119885 is less than zero as follows
119875119891= Pr [119877 lt 119878] = Pr [119885 lt 0] = 1 minus 119877119890 (4)
The reliability index 120573 is usually used to evaluate thesafety level of a structure This index is related to theprobability of failure as follows
120573 = minusΦminus1(119875119891) (5)
where Φ is the cumulative standard normal distributionfunction A general equation for the probability of failure isdefined as follows
119875119891= int119885(X)lt0
119891X (x) 11988911990911198891199092 sdot sdot sdot 119889119909119899 (6)
where X = 1198831 1198832 119883
119899 is a random variables vector
119891X(X) is the probability density of vector X and 119885(X)
is the limit state function As 119891X119894 is generally unknownthe evaluation of the probability of failure 119875
119891 using (6) is
very difficult Therefore based on the type of distributionfunction corresponding to the structural resistance (119877) andload effects (119878) in the limit state function (119885) in (3) thereare several methods to evaluate the reliability index Themethods include the first order reliability method (FORM)the second order reliability method (SORM) and MonteCarlo simulation method In this paper the Monte Carlosimulation method was used to evaluate the probability offailure Then by using (5) the reliability index was obtainedThe Monte Carlo method creates large number simulatedoutcomes of a limit state Next by counting the number offailure events (119885 lt 0) and dividing them into the totalnumber of simulated events the probability of failure 119875
119891
can be estimated In this method during each simulation allinvolved variables in the limit state function are chosen (orgenerated) randomly [26]
The reliability index has been used to express structuralrisk For this index the range of 2 to 4 is usually specifiedto failure of a single component for different structuralapplication [24]
To calculate the reliability index at first the statisticaldata for all the random variables associated with the limitstate function119885 of (3) should be obtainedThese data includeall the uncertainties in estimating themember resistances andthe load effects According to Nowak [13] and Ellingwood etal [15] approach a bridge member resistance capacity by avariable 119877 can be defined as follows
119877 = 119872119865119875119877119899 (7)
where 119872 is material factor representing properties such asstrength and modulus of elasticity 119865 is fabrication factorincluding geometry dimensions and section modulus 119875 isanalysis factor such as approximate models for estimatingmember capacity idealized stress and strain distributionmodels and 119877
119899is predicted member capacity using code-
specified methods Equation (7) can be used to find the mean
value of 119877 using (2) if the total resistance bias 119887119903 is set to
be equal to the product of the mean values of 119872 119865 and119875 The resistance model of (7) does not directly account formember deterioration or other changes with time Thus allthe variables are time-independent random variables
For a bridge member (or structural system) to be safethe resistance should be large enough for the maximum loadeffect that could occur within the structurersquos service life Esti-mating the effects of the maximum loads involves a numberof randomvariables whichmay often be associatedwith largelevels of modeling uncertainties In particular the intensitiesof the maximum loads are time-dependent random variablesin the sense that longer service lives imply higher chances thatthe structure will be subjected to a given extreme load levelOn the other hand the projection of limited load intensitydata collected from previous measurements over short peri-ods of time to future return periods is associated with var-ious levels of statistical modeling uncertainties In additionmodeling the structurersquos response to the applied loads andestimating the variables that control the effects of the loadson the structure are associated with high levels of uncertaintythat are independent of the return period These modelinguncertainties are often represented by time-independentrandom variables Thus the effect of a particular load type119894 on a structural member may be represented as follows
119878119894= 120582119894119891119894(120582119876119894119862119894119895119876119894) (8)
where 119878119894is the load effect for load type 119894 120582
119894is the anal-
ysis modeling factor that accounts for differences betweenmeasured load effects and predicted load effects 119891
119894() is the
analysis prediction model that converts load intensities intoload effects119876
119894is the projected intensity variable of load type 119894
for the return period of interest 120582119876119894
is the statisticalmodelingvariable that accounts for the limitations in predicting thevalue of 119876
119894 and 119862
119895119894is the analysis variables such as bridge
material and geometrical properties required for executingthe analysis for load type 119894 All the variables in (8) may beconsidered random where 119876
119894is a time-dependent random
variable and the remaining variables are time-invariant Theprobability density of the load intensity119876
119894 for a given return
period 119905 can be calculated by studying the probability that119876119894
will exceed a given value within 119905 Assuming that the occur-rence of load events follows a Poisson model the probabilitythat the load intensity will exceed a value 119909 within a period 119905is represented by (1minus119865
119876119894119905
[119909]) whichmay be approximated as
Pr (119876119894gt 119909 119879 lt 119905) = 1 minus 119865
119876119894119905
(119909) = 1 minus 119890(minus119905119901)
(9)
where 119901 is the rate of exceedance per unite time 119875 is equalto the probability of exceeding 119909 when 119905 equals 10
119901 = Pr (119876119894gt 119909) = 1 minus 119865
119876119894
(119909) (10)
For extreme values of 119909 when the values of 119865119876119894
(119909) are closeto 10 and 119901 is calculated for one unit of time while the return
4 The Scientific World Journal
period 119905 consists of119898 units of time (9) can be approximatedas
Pr (119876119894gt 119909 119879 lt 119905) = 1 minus 119865
119876119894119905
(119909)
= 1 minus 119890(minus119905119901)
asymp 1 minus (1 minus 119901)119898
= 1 minus (119865119876119894
(119909))119898
(11)
Equation (10) can be written as follows
Pr (119876119894lt 119909 119879 lt 119905) = 119865
119876119894119905
(119909) asymp (119865119876119894
(119909))119898
(12)
Equation (12) indicates that the cumulative probabilityfunction for a return period of time 119905 may be approximatedby raising the cumulative probability function of the basictime period to the power119898
3 Reliability Methods forCombination of Loads
In general by considering the variability of the load magni-tude with time the loads can be classified as permanent loadsthat are time independent and transient loads that vary withtime The minimum required characteristics to represent atime-dependent load are the rate of occurrence in time thetime duration and the intensity of load This kind of loadcan be modeled by a random process As described beforein order to evaluate the probability of failure of the structureunder the combination of load effects the extreme value ofthe combined load effects is required For this purpose theextreme value of the combined load effects corresponding toconsidered limit state should be calculated During the designlife time of a structure (119879) different individually acting time-dependent loadsmay bemodeled as the sum of the load effectprocesses 119883
119894(119905) and the extreme value 119883max(119879) is calculated
as follows
119883max (119879) = max119879
1198831 (119905) + 1198832 (119905) + sdot sdot sdot + 119883119899 (119905) (13)
As generally it is very difficult to obtain an exact solutionof (13) some approximate analytical models exit to estimatethis solution These are (1) Turkstrarsquos rule [19] (2) the Ferry-Borges (or Ferry Borges-Castanheta) model [20] (3) Wenrsquosload coincidence method [21] and (4) scenario samplingmodel [22 23] As in this paper the scenario sampling modelis used this model is described briefly below
31 Scenario Sampling Method Scenario Sampling [22 23]method can be used for time-dependent loads combinationCompared with other methods this method has high accu-racy and can be used for any linear and nonlinear loadscombinations This method is presented based on MonteCarlo sampling
To calculate the probability of structural failure underthe combination of several time-dependent loads for a limitstate function using scenario sampling method it is doneas follows with the knowledge of the rate of occurrencetime duration and intensity of each time-dependent loadand by using Poissonrsquos distribution function to estimate the
occurrence time of any event of load first during structurersquos119879-years design life a scenario of load occurrence is generatedThen whenever the intensity of any load changes the amountof limit state function is calculated Among the limit statefunction amount for each T-year life the minimum limitstate function amount is selected which is related to themaximum loads effect in the structure life This procedureis repeated 119899 times According to Monte Carlorsquos method thefailure probability is calculated by dividing the total statesmdashinwhich their limit state functionminimum amount is negative(indicatingmember failure)mdashinto the total simulating cycles119899 and finally the reliability index is calculated from (5) Thetotal of simulating cycles 119899 is chosen in a way that coefficientof variation related to failure probability is maximum 2
4 IAB Pile Resistance Capacity
As described before the considered limit state in this study isthe bending moment and shearing failure of the IAB pile Forsupporting the abutments of the considered IAB a single rowof steel H-piles is used As the bending moment and shearingcapacities of steel pile are defined by its yield stress 119865
119910 and
geometric parameters by considering the yield stress of pilesection as a randomvariable the uncertainties associatedwiththe bending moment and shearing capacities of the pile aretaken into account during reliability analysis So for the yieldstress 119865
119910 a bias of 105 and a COV of 10 using a lognormal
distribution are used [27]
5 Reliability Models for Loads
According to extreme event I load combination of AASHTOLRFD [11] nominal design loads dead load earth pressureseismic load and uniform thermal load are just consideredin this study The required statistical models of these loadsare described in this section
51 Dead Load Based on Nowak [13] the statistics for deadload are summarized in Table 1
Since in this study the deck of considered IAB is afactory-made steel girder composite and cast-in place con-crete slab a bias of 108 = 103 times 105 with a COV of 128 =radic102 + 82 using a normal distribution is used for dead load
52 Backfill Earth Pressure Backfill static earth pressuredependent on the movement direction of IABrsquos abutmentsunder applied loads can be the form of passive or active Thebackfill passive pressure (abutment moves far from backfill)resists bridge against applied load while active pressure(abutment moves toward backfill) is a permanent load onthe abutments Based on Rankinrsquos theory the lateral earthpressure considering cohesionless backfill soil is determinedby unit weight and fraction angle of soil Based on Beckerrsquosresearches [14] statistics for backfill soil are summarized inTable 2
53 Earthquake Load The reliability analysis of a structuralmember under earthquake load involves a number of randomvariables that the uncertainty of them should be considered
The Scientific World Journal 5
Table 1 Dead load Statistics [13]
Load Bias factor(119887119903)
Coefficient of variation(COV )
Dead load(factory-made component) 103 8
Dead load(cast-in place component) 105 10
Asphalt wearing surface(889mm assumed) 1 25
Table 2 Backfill Soil related statistics [14]
Variable Bias COV Distribution typeUnit weight (120574) 10 7 NormalFraction angle (120601
119904) 10 13 Normal
Rankine coefficient (119870119875 119870119886) 15 20 Normal
Cyclic effects 120582cyc 10 15 Normal
A brief discussion of each variable is given and statistics foreach are summarized in Table 3
531 Intensity of Earthquake Acceleration The expectedearthquake intensity for IABrsquos sites was obtained from theUSGS [16] These maps provide the horizontal peak groundaccelerations (PGAs) for various sites throughout the UnitedStates with 7 percent exceedance probability in 75 years (areturn period of about 1000 yr) In this study five sites wereconsidered as the IABrsquos site San Francisco with 94117 zipcode Seattle with 98195 zip code Memphis with 38101 zipcode New York with 10031 zip code and St Paul with 55418zip code An annual exceedance probability curves for PGAwas provided by Frankel et al [12] for a number of sites(see Figure 1)
532 Rate of Earthquake Occurrence The number ofexpected earthquakes varies from site to site and is availableat the USGS [16] The average number of earthquakes inone year is about 8 for San Francisco 2 for Seattle 05 forMemphis (one every 2 years) 04 for New York (one every25 years) and 9 times 10minus3 for St Paul (one every 111 years)
533 Natural Period of IABs The natural period of an IABis related to the type of bridge structure type of bridgefoundation the characteristics of the used materials thecharacteristics of bridge geometry the interaction betweensoil and structure (SSI) and so forth As the considered IABin this study included the effects of SSI based on publishedresearches [17] a bias of 09 and aCOVof 20using a normaldistribution was used for the natural period of the IAB
534 Mass Applied To account for uncertainties associatedwith the mass applied on the IABrsquos members (consideringweight alone) a bias of 105 and a COV of 5 using a normaldistribution were used [13 15]
535 Seismic Response Coefficient Thedesign response spec-trum proposed by AASHTO LRFD [11] was used in thispaper These design spectra are based on the USGS [16]For considering uncertainties associated with these spectrathe statistics provided by Frankel et al [12] were used Theyfound that for all sites inside USA themean value of spectralaccelerations is very close to the design spectral accelerationsso a bias of 10 can be used Also for all sites COV dependson the number of observed earthquakes at which the COVis low for sites with high frequency of earthquakes and forsites with low frequency the COV is high Therefore for SanFrancisco the COV is about 15 for Seattle and Memphis itis about 25 for New York it is about 30 and for St Paul itis about 40 For this variable a normal distribution is used
536 Modeling Factor Modeling factor was used to take intoaccount for the uncertainties produced during the dynamicanalysis process A bias of 1 and a COVof 20 using a normaldistribution were used for this variable [15]
537 Reliability Equation for Earthquake Load Using thepresented information the equivalent seismic load applied onthe IAB is defined as follows
119865EQ = 120582eq1198621015840119878119886(1199051015840119879) times
119860 times119882
119877119898
(14)
where 119865EQ is the equivalent applied load 120582eq is the modelingfactor 1198621015840 is the response spectrum modeling parameter 119860is the maximum 75-year peak ground acceleration at thesite 119878
119886is the calculated spectral acceleration using the IABrsquos
period 119879 and period modeling factor 1199051015840 119882 is the weightof system and 119877
119898is the response modification factor which
is equal to 10 for IABrsquos pile [11] The statistics for randomvariables used in (14) are summarized in Table 3
54 Uniform Thermal Load Due to eliminating expansionjoints in IABrsquos superstructure and due to the rigid connec-tion of IABrsquos superstructure to substructure (consisting ofabutments pile and backfill soil) the movements of IABrsquossuperstructure due to temperature variation are transferredto substructure and induce thermal load on substructureThis uniform thermal load depends on the superstructurersquostemperature variation thermal expansion coefficient andbridge span length
To consider the uncertainties associated with this loadsuper structure temperature and thermal expansion areconsidered as random variables as follows
541 Superstructure Temperature The superstructure tem-perature is affected by the ambient air temperature solarradiation wind speed and direction and so forth Theprimary component of them is the ambient air temperatureand can be assumed as the IABrsquos superstructure temperature[28] Thus based on Kimrsquos research [9] for every 7 daysthe IABrsquos superstructure temperature is a normal distributionwith a mean value defined by (15) and standard deviationwhich have been tabulated in Table 4
119879mean (119905) = 120583119879 + 119860119879 sin (120596119905 + 120601119879) (15)
6 The Scientific World Journal
Table 3 Earthquake load related statistics
Variable Bias COV Distribution type ReferenceEarthquake modeling factor 120582eq 10 20 Normal [15]
Spectrum modeling factor 1198621015840
San Francisco
10
15
Normal [12]Seattle 25
Memphis 25New York 30St Paul 40
75-year PGA 119860
San Francisco
from Figure 1 from Figure 1 from Figure 1 [16]Seattle
MemphisNew YorkSt Paul
Period modeling factor 1199051015840 09 20 Normal [17]Weight119882 105 5 Normal [15]
Freq
uenc
y of
exce
edan
ce
1
01
001
0001
0001
New York
Peak acceleration (g)
San FranciscoSeattle
St PaulMemphis
00172 0103 0556 2
00001
000001
0000001
00000001
Figure 1 Annual probability of exceedance curves for PGA [12]
where 120583119879is annual mean temperature 119860
119879is annual mean
temperature variation120596 is frequency (2120587) 119905 is analyzing time(year) and 120601
119879is phase lag For three sites considered in this
study the temperature statistics were established from theweather website [18] and summarized in Table 4
542 Thermal Expansion Coefficient In this study based onAASHTO LRFD [11] a nominal design value of 117 times 10minus6∘Cis considered for the thermal expansion coefficient of theIABrsquos deck steel girders A bias of 10 and a COV of 01 usinga normal distribution are used for this random variable [27]
6 Reliability Analysis of the IntegralAbutment Bridge
In this section the reliability analysis is performed for a basicIABdesigned to satisfy the currentAASHTOLRFD specifica-tions for evaluating the safety level under seismic and thermal
loads for its 75-year design life (a 75-year design life is usedfor an IAB [11]) for different limit states As Piles momentsand shears are most affected by the temperature changethat accompanies an earthquake the bending moment andshearing limit states of piled foundation are considered inthis paper For evaluating the safety level of a structure firstthe reliability indexes are calculated for bridges under theeffect of only earthquake load to evaluate the target reliabilityindexes [24] Then these analyses are repeated for the samebridges subjected to the combination of seismic and thermalloads Finally resultant indexes will be compared with thetarget reliability indexes and the satisfaction of the targetsafety level for designed integral bridge according to AASTOLRFD specifications under the temperature and earthquakeload combination will be investigated
In this paper the reliability indexes have been calculatedby using Monte Carlo method To combine the seismicand thermal loads the scenario sampling method [22] andreliability analysis the Rt Software has been used [23]
The Scientific World Journal 7
Table 4 Thermal load related statistics [18]
Variable San Francisco Seattle Memphis New York St PaulAnnual mean 120583
119879
∘C 2389 1568 1601 1278 583Annual variation 119860
119879
∘C 333 7 125 65 42Daily standard deviation (∘C) 659 568 6 575 65
Geometric and structural properties of the basic IAB aredescribed below
61 Geometric and Structural Properties of the Basic IABThe considered IAB in this study is a one-span 40m IABhaving the longitudinal section as shown in Figure 2 Thesuperstructure of the bridge is composed of concrete slabwhit 20 cm thickness and steel beams at 2m spacing Eachabutment of this bridge has 7m height and 1mwall thicknessand supported on a single rowof steelHpiles with 12m lengthat 1m spacingThe section properties of deck girder and pilesare given in Table 5
The abutments backfill soil is assumed to be densecohesionless soil with 30∘ angle of internal friction and a unitweight of 1672 kNm3
As described earlier the piles moment and shear forceare affected the most by the earthquake and thermal loadsthus in this study bendingmoment and shearing failure limitstate of the IAB piles at point 119860 (where the pile connectto abutment) were considered for reliability analysis Therequirement moment and shear capacity were calculated tosatisfy the current AASHTO LRFD specifications The freebody diagram of the basic IAB pile under applied load isshown in Figure 3 where 119865DL = 19816 kN is the permanentweight of superstructure 119872DL = 132MN is the momentcaused by the permanent weight of superstructure 119875
119886=
27282 kN is the static active backfill force and acts on theH3 from the bottom of abutment Δ119875
119886119890is the seismic active
backfill force based on Mononobe and Matsue [29] andOkabe [30] and for San Francisco Seattle and Memphis itis equal to 81933 kN for New York it is equal to 16628 kNand for St Paul it is equal to 1727 kN This load acts on the06119867 from the bottom of abutment [31] 119867 = 7m is theabutment height 119890
1= 025m is the dead load eccentricity
from the point 119860 and 119865EQ is the equivalent earthquakeforcemdashdescribed belowmdashtransferred from the IAB deck andacts on the distance 119891 = 6m from the bottom of abutment
The equivalent internal earthquake force 119865EQ by usingthe nominal natural period of 119879 = 041 s the soil of type 119863and the calculated spectra acceleration for 1000-year returnperiod (7 probability of exceedance in 75 years) [11] isobtained as follows
119865EQ =119878119886times119882
119877119898
(16)
where 119878119886is the spectral acceleration 119882 is the weight of
structure and 119877119898is the response modification factor Based
on AASHTOLRFD [11] by using amodification factor119877119898= 1
the equivalent earthquake is equal to 30754 kN for SanFrancisco site 21052 kN for Seattle 17638 kN for Memphis4405 kN for New York and 1051 kN for St Paul
As the dominant AASHTO LRFD [11] load combinationto design the considered pile is the extreme event I combina-tion at point 119860 (see Figure 3) the design equation used forcalculating the nominal moment capacity is as follows
120601119872req = 125119872DL + 15119872119875119886
+119872Δ119875119886119890
+119872EQ (17)
where 120601 is the resistance factor which for bending is equalto 09 119872DL = 137MNm (= 0198 times 025 + 132) is thetotal moment caused by permanent weight of superstructure119872119875a
= 064MNm (= 0273MN times 2333m) is the momentcaused by static active backfill force and 119872
Δ119875119886119890
is themoment caused by seismic active backfill force and is equalto 344MNm (= 0819MN times 06 times 7m) for San FranciscoSeattle and Memphis equal to 0698MNm for New Yorkand equal to 00725MNm for St Paul119872EQ is the equivalentearthquake moment that is equal to 185MNm for SanFrancisco 126MNm for Seattle 1058MNm for Memphis0264MNm for New York and 0063MNm for St Paul
Based on the extreme event I combination at point 119860(see Figure 3) the design equation used for calculating thenominal shear capacity is as follows
120601119881req = 125119881DL + 15119881119875119886
+ 119881Δ119875119886119890
+ 119881EQ (18)
where 120601 is the resistance factor which for shearing is equalto 09 119881DL is the total shear caused by permanent weightof superstructure and usual 0 119881
119875119886
= 0272MN is the shearcaused by static active backfill force and 119881
Δ119875119886119890
is the shearcaused by seismic active backfill force and is equal to0819MN for San Francisco Seattle and Memphis equalto 0166MN for New York and equal to 00172MN for StPaul 119881EQ is the equivalent earthquake shear that is equal to0308MN for San Francisco 0211MN for Seattle 0176MNfor Memphis 0044MN for New York and 00105MN for StPaul
Using (17) the requirement moment capacity 119872req isequal to 884MNm for San Francisco 818MNm for Seattle796MNm for Memphis 4024MNm for New York and312MNm for St Paul Using (18) the requirement shearcapacity 119881req is equal to 1706MN for San Francisco 16MNfor Seattle 156MNm for Memphis 069MN for New Yorkand 049MN for St Paul
62 Reliability Analysis under Seismic Load The reliabilityanalysis of the IAB pile is performed using the modelsdescribed in Section 4 and the free body diagram shown in
8 The Scientific World Journal
Span lengthApproach slabPavement
Sleeper slab
Near fieldbackfill
H-pile
Subabutment
SuperstructureFar field
soil
Soil aroundpile
Soil aroundpile
Approach slab Pavement
Sleeper slab
Near fieldbackfill
Far fieldsoil
Soil aroundpile
Subabutment
(deck+ girder)
Figure 2 Longitudinal section of the IAB
ΔPae
Pa06H
H3
H
FDL
MDL
FEQ
f
A
e1
Figure 3 Free body diagram of IAB pile dominant failure is bending at point 119860
The Scientific World Journal 9
Table 5 Steel sections properties
Section Size Height (cm) Flange width (cm) Flange thickness (cm) Web thickness (cm)Girder W 1000 times 975 111 43 9 5Piles
San Francisco 119867 300 times 300 times 15 times 15 30 30 15 15Seattle 119867 300 times 300 times 12 times 12 30 30 12 12Memphis 119867 250 times 250 times 9 times 14 25 25 14 09New York 119867 200 times 200 times 12 times 12 20 20 12 12St Paul 119867 200 times 200 times 8 times 12 20 20 12 08
Figure 3 Referring to Figure 3 the failure function for pilebending can be represented by following equation
119885119872= 119872Pile minus (119872DL + (Δ119875119886119890 times 06119867 + 119875
119886times (
119867
3))
times120582cyc + 119865EQ times 119891)
(19)
where119872Pile is the pile bending moment capacity119872DL is thetotal moment caused by superstructure weight 119865EQ is theequivalent earthquake load transferred from superstructuredefined by (14) 119875
119886is the static active backfill force and acts
on the1198673 from the bottom of abutment Δ119875119886119890is the seismic
active backfill force [29 30] and acts on the 06119867 from thebottom of abutment [31] 119867 = 7m is the abutment height119891 = 6m is the distance earthquake load from point 119860 and120582cyc is the model of the effect of cyclic loading on the pile
Based on Figure 3 the failure equation for pile shearingcan be represented as follows
119885119881= 119881Pile minus ((Δ119875119886119890 + 119875119886) times 120582cyc + 119865EQ) (20)
where 119881Pile is the pile shearing capacityReferring to (19)-(20) failure occurs when 119885
119872or 119885119881are
less than zero All variables in (19)-(20) are considered ran-dom expect for abutment height119867 and distance earthquakeload from point 119860 119891 The statistical models used to describethe random variables are provided in Tables 1 2 3 and 4In these failures limit state only earthquake load composedof time-depended and time-in depended random variablesThe reliability analysis of the IAB pile was performed forfive sites by using Monte Carlo simulation method usingthe Rt software [23] Figures 4 and 5 show the reliabilityfor the bending and shearing failure limit states for each offive sites as a function of pile moment and shear capacityrespectively The abscissa of the plot is normalized such thata ratio of 10 indicates that the bridge is designed to exactlysatisfy the AASHT LRFD [11] specifications requirementsand reliability index corresponding to this ratio is usedas the target reliability index 120573
119879 Figure 4 shows that the
AASHTO LRFD [11] specifications using a nominal responsemodification factor 119877
119898= 1 for pile bending limit state will
produce a reliability index 120573 between 212 and 257 Theaverage from the five sites is equal to 228 Figure 5 shows thatfor pile shearing limit state the average reliability index forfive sites is 233 with a minimum index equaling 209 and amaximum value equaling 268
63 Reliability Analysis for Combination of Earthquake andUniform Thermal Loads As it was written earlier there isa temperature difference between temperature at any timeof bridge life and bridge construction time temperaturehence a uniform temperature load is applied to the bridgeTherefore during earthquake the existence of a uniformtemperature load is an obvious matter Due to integritystructure of integral bridges thermal and earthquake loadsare important for these bridges and have determinant role inthe performance of integral bridges
Since most bridge design codes such as AASHTO LRFDhave considered these two loads in combination separatelyin this study designed integral bridge safety level evaluationaccording to AASHTO LRFD under thermal and earthquakeloads combination was investigated Also comparing theresults with target safety level (which was the bridge safetylevel under seismic load alone) was studied The researchwas done to understand whether the safety of these kindsof bridges (during structure life) under the combination ofthermal and earthquake loads was satisfied or not
631 Combination of Earthquake and Thermal Loads (EQ +TU) The IAB pile was analyzed to illustrate the combinedeffects of earthquake and thermal loads on the pile The datafrom five earthquake sites described in Figure 1 were usedThe uniform thermal load data were obtained from modelsdeveloped byKim [9] andweather website [18]The reliabilitycalculations of the IAB pile under considered combined loadsfollow the scenario samplingmethod described in Section 31For this method the following assumptions are made
(i) The reliability calculations are performed for thebending moment and shearing failure limit states ofIAB pile
(ii) All earthquakes last 30 sec [24] and during this timeit is assumed that the moment and shear at point119860 ofthe IAB pile remain at their highest value
(iii) All thermal loads last 7 days [9] and during this timethe intensity of thermal load remains constant
(iv) The reliability analysis accounts for uncertaintieswhich is associated with predicting the earthquakeintensity estimating the bridge pile response for givenearthquake intensity projecting the thermal loadmagnitude and estimating pile moment and shearcapacity
10 The Scientific World Journal
00000000500000100000015000002000000250000030000003500000400000045000005000000
04 06 08 1 12 14 16 18 2
St Paul
Relia
bilit
y in
dex120573
Mpile Mdesign
New YorkSan FranciscoSeattle
Memphis
Figure 4 Reliability index for the bending of considered IABrsquos pile under earthquake load alone
00000000500000100000015000002000000250000030000003500000400000045000005000000
04 06 08 1 12 14 16 18 2
Relia
bilit
y in
dex120573
Vpile Vdesign
St PaulNew YorkSan Francisco
SeattleMemphis
Figure 5 Reliability index for the shearing of considered IABrsquos pile under earthquake load alone
Referring to Figure 3 the failure function of pile bendingunder combined load effects can be represented as follows
119885119872= 119872pile
minus (119872DL + (Δ119875119886119890 times 06119867 + 119875119886times (
119867
3))
times120582cyc + 119865EQ+TU75 times 119891)
(21)
where 119872EQ+TU75 = 119865EQ+TU75 times 119891 is the applied momentcaused by the combined effects of the earthquake anduniform thermal loads in the period of 119879 = 75 years
Based on Figure 3 the failure equation for pile shearingcan be represented as follows
119885119881= 119881Pile minus ((Δ119875119886119890 + 119875119886) times 120582cyc + 119865EQ+TU75) (22)
where 119865EQ+TU75 is the applied shear caused by the combinedeffects of the earthquake and uniform thermal loads This
combined effect is calculated by using scenario sampling[22 23] method as described in Section 31
The reliability analysis of the IAB pile was performed forfive sites by using Monte Carlo simulation method usingscenario sampling method to combine seismic and thermalloads and using the Rt software [22 23] Tables 6 and 7show the reliability index for the bending and shearingfailure limit states for each of five sites In these tables thetarget reliability indexes are also shown and the resultantindexes under combined effect of seismic and thermal canbe compared with them As shown in Tables 6 and 7 forboth limit states for all considered sites when seismic andthermal loads combined the reliability indexes and thereforethe safety level have been reducedTherefore for pile bendingand shearing limit states under combined effect of seismicand thermal loads theAASHTOLRFD [11] specificationswillnot produce a responsible reliability index 120573 by comparingresultant indexes with target indexes
The Scientific World Journal 11
Table 6 Reliability indexes for the bending moment limit stateunder combined seismic and thermal loads
Site Reliability indexes undercombined effect 120573EQ+TU
Target reliability indexes120573119879
SanFrancisco 221 2223
Seattle 2211 223Memphis 252 257New York 208 212St Paul 207 227
Table 7 Reliability indexes for the shearing limit state undercombined seismic and thermal loads
Site Reliability indexes undercombined effect 120573EQ+TU
Target reliability indexes120573119879
SanFrancisco 210807 212296
Seattle 211144 220097Memphis 228674 254758New York 191 209St Paul 215 267815
7 Conclusion
Integral abutment bridges (IABs) are jointless bridges that byeliminating the expansion joints have many advantages overconventional bridges Due to the integrity of these bridgesamong the loads acting on these bridges seismic loads havemajor role in designing these bridges and readily transferredto substructure and affect the design of these componentsAs AASHTO LRFD like other developed bridge design codesconsider temperature and earthquake loads separately intheir specified load combinations for the design of bridgesaccording to the fact that there is a temperature differencebetween temperature at any time of bridge life and bridgeconstruction time temperature a uniform temperature loadis applied to the bridge Therefore during earthquake theexisting of a uniform temperature load is an obvious matter
Then evaluating the safety level of IABsmdashdesigned byAASHTOLRFDbridge design codemdashunder the combinationof temperature and earthquake loads during the design life ofIABs is important
In this paper by concerning the safety of the pile foun-dation of an IAB designed by AASHTO LRFD bridge designcode under seismic load the target safety level of IABs hasbeen evaluated Then by repeating these reliability analysesfor the same bridge under combination of thermal andseismic loads and comparing calculated reliability indexeswith target reliability indexes it is shown that that for an IABdesigned byAASHTOLRFD the reliability indexes have beenreduced under combined effects and the target level of safetyduring its design life is not provided
Conflict of Interests
The authors declare that there is no conflict of interestsregarding the publication of this paper
Acknowledgment
The authors thank the Research Center of Optimization andEngineering Tabriz Iran for the support
References
[1] N C M Tsang and G L England ldquoSoilstructure interactionof integral bridge with full height abutmentsrdquo in Proceedingsof the 15th ASCE Engineering Mechanics Conference ColumbiaUniversity New York NY USA 2002
[2] M Dicleli and S M Albhaisi ldquoEffect of cyclic thermal loadingon the performance of steel H-piles in integral bridges withstub-abutmentsrdquo Journal of Constructional Steel Research vol60 no 2 pp 161ndash182 2004
[3] W Kim and J A Laman ldquoIntegral abutment bridge responseunder thermal loadingrdquo Engineering Structures vol 32 no 6pp 1495ndash1508 2010
[4] I Tegos A Sextos S Mitoulis and M Tsitotas ldquoContributionto the improvement of seismic performance of integral Bridgesrdquoin Proceedings of the 4th European Workshop on the SeismicBehavior of Irregular and Complex Structures ThessalonikiGreece 2005
[5] A Itani and G Pekcan ldquoSeismic performance of steel plategirder bridgeswith integral abutmentsrdquo Publication no FHWA-HIF-11-043 2011
[6] R J Frosch M E Kreger and A M Talbott ldquoEarth-quake resistance of integral abutment bridgesrdquo PublicationFHWAINJTRP-200811 Joint Transportation Research Pro-gram Indiana Department of Transportation and Purdue Uni-versity West Lafayette Ind USA 2009
[7] S Maleki and S Mahjoubi ldquoA new approach for estimating theseismic soil pressure on retaining wallsrdquo Scientia Iranica vol 17no 4 A pp 273ndash284 2010
[8] N Mononobe and H Matsue ldquoOn the determination of earthpressures during earthquakesrdquo in Proceedings of the WorldEngineering Congress vol 9 pp 176ndash182 1929
[9] W Kim Load and resistance factor for integral abutment bridges[PhD dissertation] Pennsylvania State University UniversityPark Pa USA 2008
[10] ldquoEuropean Standard EN 1998-2 has the status of a BritishStandardrdquo Eurocode 8 Bridges 2005
[11] AASHTO LRFD Bridge Design Specifications American Associ-ation of State Highway and Transportation Officials Washing-ton DC USA 2012
[12] A Frankel S Harmsen C Mueller et al ldquoUniform hazardspectra de-aggregation and uncertaintyrdquo in Proceedings ofFHWANCEER Workshop on the National Representation ofSeismic GroundMotion for New and Existing Highway FacilitiesNCEER Technical Report 97-0010 pp 39ndash73 SUNY BuffaloNY USA 1997
[13] A S Nowak ldquoCalibration of LRFD bridge design coderdquo ASNCHRPReport TransportationResearchBoard of theNationalAcademies Washington DC USA 1999
[14] D E Becker ldquoEighteenth Canadian geotechnical colloquiumLimit states design for foundations Part II Development forthe national building code of Canadardquo Canadian GeotechnicalJournal vol 33 no 6 pp 984ndash1007 1996
[15] B Ellingwood T V Galambos J G MacGregor and C AComell Development of a Probability Based Load Criterion forAmerican National Standard A58 National Bureau of Stan-dards Washington DC USA 1980
12 The Scientific World Journal
[16] US Geological Survey USGS 2013 httpearthquakeusgsgovearthquakes
[17] A K Chopra and R K Goel ldquoBuilding period formulas forestimating seismic displacementsrdquo Earthquake Spectra vol 16no 2 pp 533ndash536 2000
[18] Weather online 2013 httpwwwweathercomweatherwxcli-matologyUSWA0395
[19] C J Turkstra and H O Madsen ldquoLoad Combinations inCodified Structural Designrdquo Journal of Structural Engineeringvol 106 no 12 pp 2527ndash2543 1980
[20] J Ferry Borges andM Castanheta Structural Safety Course 101Labratorio National de Engenharia Civil Lisbon Portugal 2ndedition 1971
[21] Y K Wen Structural Load Modeling and Combination forPerformance and Safety Evaluation Elsevier New York NYUSA 1990
[22] M Mahsuli Probabilistic models methods and software forevaluating risk to civil infrastructure [A thesis submited in partialfuliment of the requirments for the degree of doctor of philosophyin the faculty of graduated studies] The University of BritishColumbia Vancouver Canada 2012
[23] M Mahsuli and T Haukaas ldquoComputer program for multi-model reliability and optimization analysisrdquo Journal of Comput-ing in Civil Engineering vol 27 no 1 pp 87ndash98 2013
[24] M Ghosn F Moses and J Wang ldquoDesign of highway bridgesfor extreme eventsrdquo NCHRP Report 489 TransportationResearch Board of the National Academices Washington DCUSA 2003
[25] Weather Site 2013 httpwwwwundergroundcomhistory[26] M Lemaire Structural Reliability ISTE London UK John
Wiley amp Sons Hoboken NJ USA 2009[27] T V Galambos andM K Ravindra ldquoProperties of Steel for Use
in LRFDrdquo Journal of the Structural Division vol 104 no 9 pp1459ndash1468 1978
[28] C W Roeder ldquoThermal movement design procedure for steeland concrete bridgesrdquo A Report to the National CooperativeHighway Research Program NCHRP 20-07106 2002
[29] N Mononobe and H Matsue ldquoOn the determination of earthpressures during earthquakesrdquo in Proceedings of the WorldEngineering Conference vol 9 p 176 1929
[30] S Okabe ldquoGeneral theory of earth pressurerdquo Journal of theJapanese Society of Civil Engineers vol 12 no 1 1926
[31] H B Seed and R V Whitman ldquoDesign of earth retainingstructures for dynamic loadsrdquo in Proceedings of the SpecialtyConference on Lateral Stresses in the Ground and Design of EarthRetaining Structures pp 47ndash103 ASCE 1970
International Journal of
AerospaceEngineeringHindawi Publishing Corporationhttpwwwhindawicom Volume 2014
RoboticsJournal of
Hindawi Publishing Corporationhttpwwwhindawicom Volume 2014
Hindawi Publishing Corporationhttpwwwhindawicom Volume 2014
Active and Passive Electronic Components
Control Scienceand Engineering
Journal of
Hindawi Publishing Corporationhttpwwwhindawicom Volume 2014
International Journal of
RotatingMachinery
Hindawi Publishing Corporationhttpwwwhindawicom Volume 2014
Hindawi Publishing Corporation httpwwwhindawicom
Journal ofEngineeringVolume 2014
Submit your manuscripts athttpwwwhindawicom
VLSI Design
Hindawi Publishing Corporationhttpwwwhindawicom Volume 2014
Hindawi Publishing Corporationhttpwwwhindawicom Volume 2014
Shock and Vibration
Hindawi Publishing Corporationhttpwwwhindawicom Volume 2014
Civil EngineeringAdvances in
Acoustics and VibrationAdvances in
Hindawi Publishing Corporationhttpwwwhindawicom Volume 2014
Hindawi Publishing Corporationhttpwwwhindawicom Volume 2014
Electrical and Computer Engineering
Journal of
Advances inOptoElectronics
Hindawi Publishing Corporation httpwwwhindawicom
Volume 2014
The Scientific World JournalHindawi Publishing Corporation httpwwwhindawicom Volume 2014
SensorsJournal of
Hindawi Publishing Corporationhttpwwwhindawicom Volume 2014
Modelling amp Simulation in EngineeringHindawi Publishing Corporation httpwwwhindawicom Volume 2014
Hindawi Publishing Corporationhttpwwwhindawicom Volume 2014
Chemical EngineeringInternational Journal of Antennas and
Propagation
International Journal of
Hindawi Publishing Corporationhttpwwwhindawicom Volume 2014
Hindawi Publishing Corporationhttpwwwhindawicom Volume 2014
Navigation and Observation
International Journal of
Hindawi Publishing Corporationhttpwwwhindawicom Volume 2014
DistributedSensor Networks
International Journal of
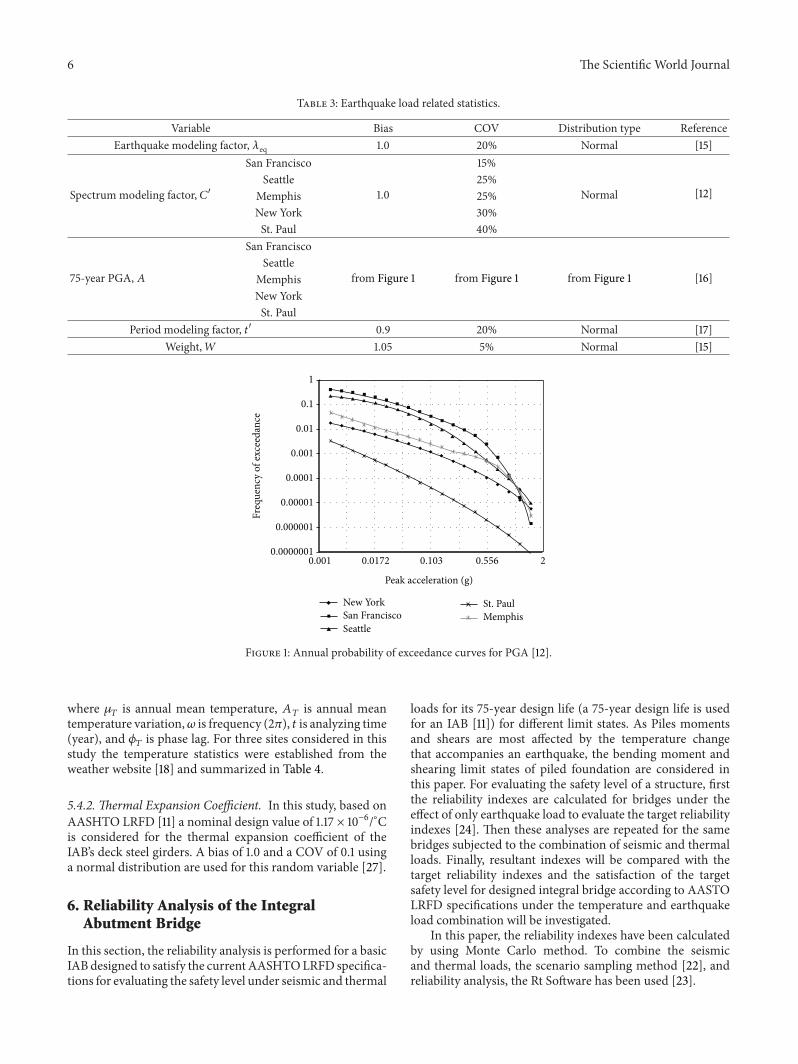
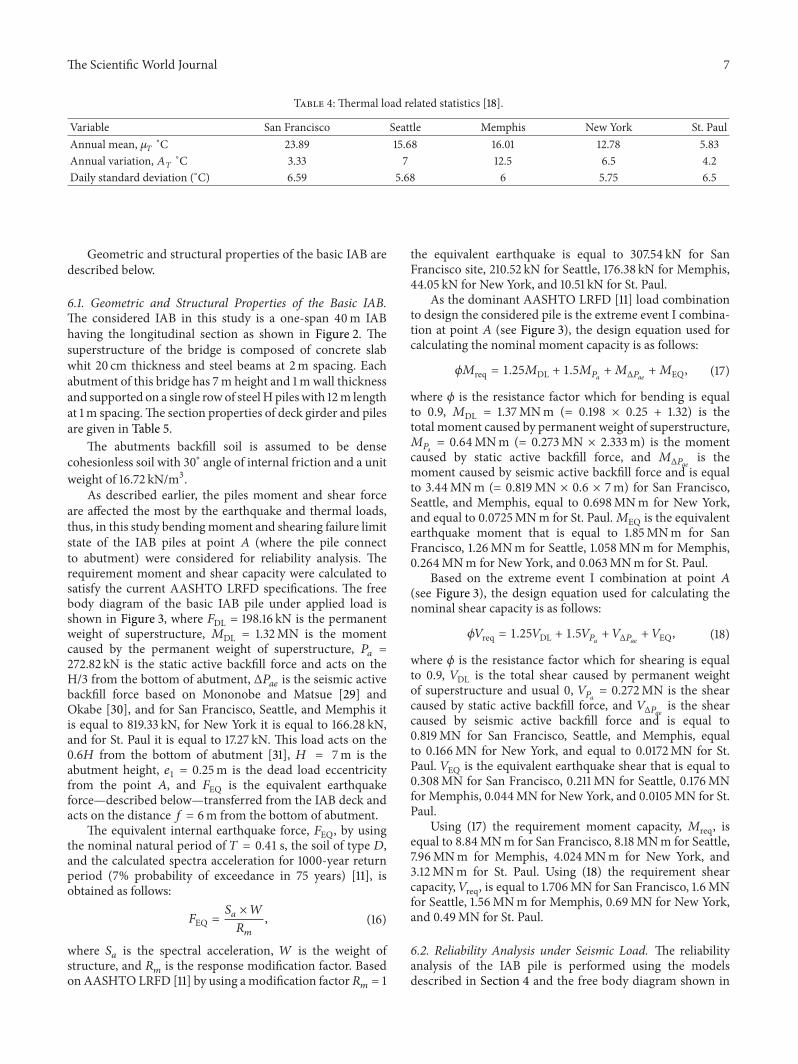
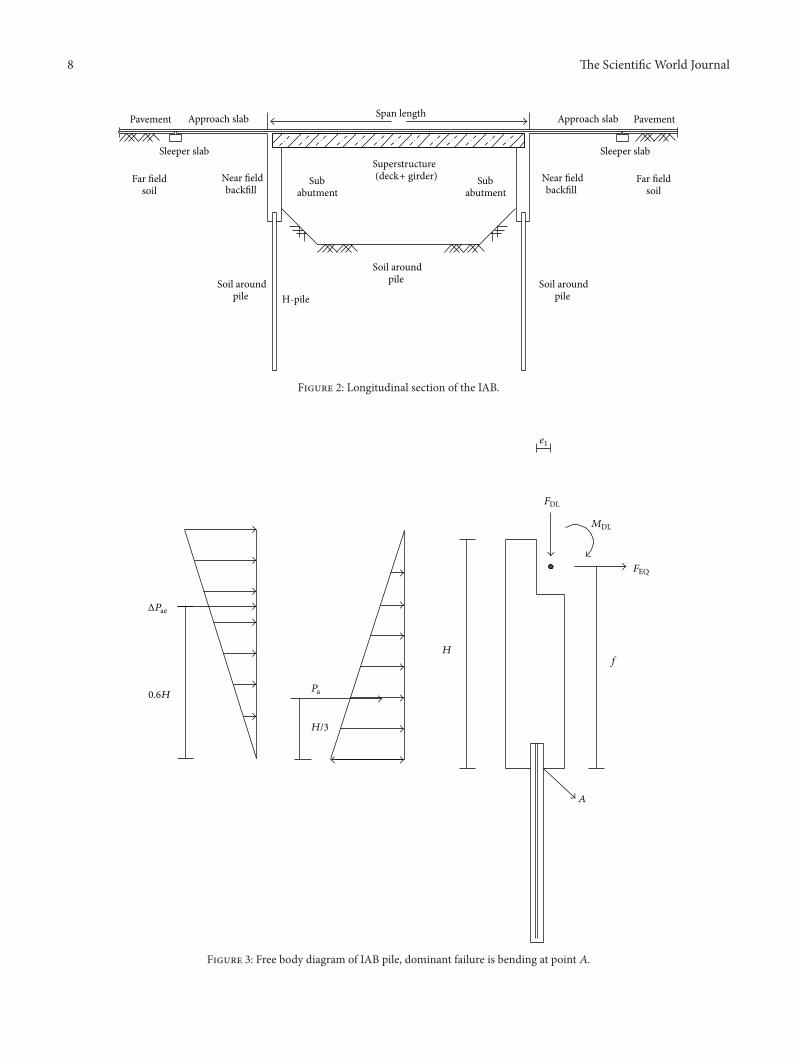

International Journal of
AerospaceEngineeringHindawi Publishing Corporationhttpwwwhindawicom Volume 2014
RoboticsJournal of
Hindawi Publishing Corporationhttpwwwhindawicom Volume 2014
Hindawi Publishing Corporationhttpwwwhindawicom Volume 2014
Active and Passive Electronic Components
Control Scienceand Engineering
Journal of
Hindawi Publishing Corporationhttpwwwhindawicom Volume 2014
International Journal of
RotatingMachinery
Hindawi Publishing Corporationhttpwwwhindawicom Volume 2014
Hindawi Publishing Corporation httpwwwhindawicom
Journal ofEngineeringVolume 2014
Submit your manuscripts athttpwwwhindawicom
VLSI Design
Hindawi Publishing Corporationhttpwwwhindawicom Volume 2014
Hindawi Publishing Corporationhttpwwwhindawicom Volume 2014
Shock and Vibration
Hindawi Publishing Corporationhttpwwwhindawicom Volume 2014
Civil EngineeringAdvances in
Acoustics and VibrationAdvances in
Hindawi Publishing Corporationhttpwwwhindawicom Volume 2014
Hindawi Publishing Corporationhttpwwwhindawicom Volume 2014
Electrical and Computer Engineering
Journal of
Advances inOptoElectronics
Hindawi Publishing Corporation httpwwwhindawicom
Volume 2014
The Scientific World JournalHindawi Publishing Corporation httpwwwhindawicom Volume 2014
SensorsJournal of
Hindawi Publishing Corporationhttpwwwhindawicom Volume 2014
Modelling amp Simulation in EngineeringHindawi Publishing Corporation httpwwwhindawicom Volume 2014
Hindawi Publishing Corporationhttpwwwhindawicom Volume 2014
Chemical EngineeringInternational Journal of Antennas and
Propagation
International Journal of
Hindawi Publishing Corporationhttpwwwhindawicom Volume 2014
Hindawi Publishing Corporationhttpwwwhindawicom Volume 2014
Navigation and Observation
International Journal of
Hindawi Publishing Corporationhttpwwwhindawicom Volume 2014
DistributedSensor Networks
International Journal of