research article quantification of margins and...
TRANSCRIPT

Research ArticleQuantification of Margins and Uncertainties Approach forStructure Analysis Based on Evidence Theory
Chaoyang Xie12 and Guijie Li2
1School of Mechatronics Engineering University of Electronic Science and Technology of China Chengdu 611731 China2Institute of Systems Engineering China Academy of Engineering Physics Mianyang 621900 China
Correspondence should be addressed to Chaoyang Xie xiezycaepcn
Received 14 February 2016 Revised 17 May 2016 Accepted 19 May 2016
Academic Editor Egidijus R Vaidogas
Copyright copy 2016 C Xie and G Li This is an open access article distributed under the Creative Commons Attribution Licensewhich permits unrestricted use distribution and reproduction in any medium provided the original work is properly cited
Quantification of Margins and Uncertainties (QMU) is a decision-support methodology for complex technical decisions centeringon performance thresholds and associated margins for engineering systems Uncertainty propagation is a key element in QMUprocess for structure reliability analysis at the presence of both aleatory uncertainty and epistemic uncertainty In order to reducethe computational cost of Monte Carlo method a mixed uncertainty propagation approach is proposed by integrated Krigingsurrogate model under the framework of evidence theory for QMU analysis in this paper The approach is demonstrated by anumerical example to show the effectiveness of the mixed uncertainty propagation method
1 Introduction
The uncertainties of material properties environment loadsand design models are inevitable in engineering Uncertaintyis usually classified into aleatory and epistemic types [1 2]and the presence of uncertain factors introduces uncertaintyin the reliability of the structure Probabilistic approaches thatdeal with aleatory parameter uncertainty have been vastlyinvestigated in typical structure reliability analysis Whensufficient data are not available or there is lack of informationdue to ignorance the concept of subjective probability is wellestablished for quantifying epistemic uncertainty Howeverwhen the probabilities of rare events are very difficult to assessor events occur only once the classical probability methodol-ogy may not be suitable because there is not enough statisticdata [3 4] In order to overcome the lack of probabilisticmethod the nonprobabilistic methods have been proposedand are more suitable to handle the epistemic uncertaintybased on the Fuzzy theory interval theory evidence theoryand so forth The theoretical concept and the applicationof the Quantification of Margins and Uncertainties (QMU)methodology were reported in the certification of reliabilitysafety of nuclear weapons stockpile and risk-informed deci-sion making process under restriction of test data in the last
decade Recently the QMUmethodology has been applied tomore general complex systems such as commercial nuclearpower plants reactor safety and missile reliability [5 6]Eardley [7] described the main components (performancegates margins and uncertainties) of the QMUmethodologyUnder the key ideas and application procedures of QMUmethodology the uncertainty propagation that determinesthe output uncertainty from input uncertainty is a broadresearch area for QMU process Reference [8] shows thatevidence theory is amore general theory that can handle bothtypes of uncertainty but it requiresmuchmore computationalcost
The objective of this paper is to propose an implemen-tation framework of QMU under mixed uncertainty basedon the evidence theory To alleviate the computational costsa stochastic surrogate model based on Kriging model andadaptive sampling method has been applied for uncertaintypropagation for structure performance response The rest ofthis paper is organized as follows Section 2 briefly introducesthe basic concept and metric of QMU Section 3 detailsthe mixed uncertainty propagation using evidence theoryin QMU implementation The new calculation scheme ofmixed uncertainty analysis by integrating Kriging model and
Hindawi Publishing CorporationMathematical Problems in EngineeringVolume 2016 Article ID 6419058 5 pageshttpdxdoiorg10115520166419058
2 Mathematical Problems in Engineering
Performance gate upper bound
Performance gate lower bound
(failure threshold)
Margin (M)
Performanceuncertainty (U)
Performancegate
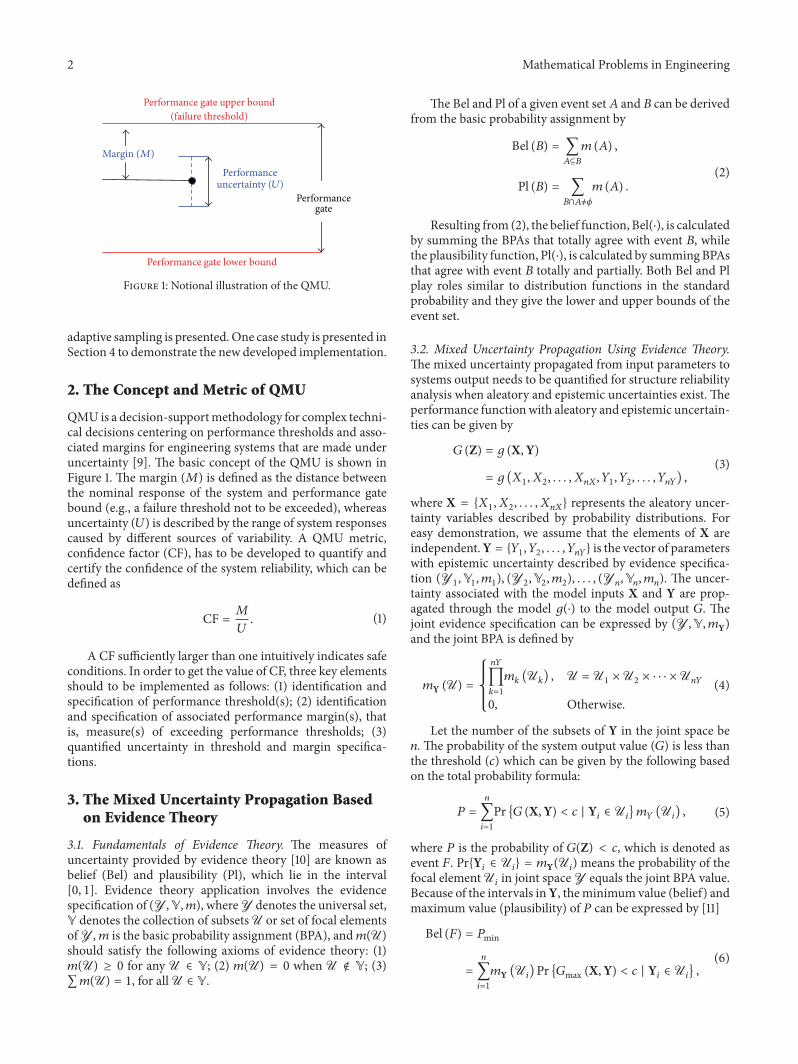
Figure 1 Notional illustration of the QMU
adaptive sampling is presented One case study is presented inSection 4 to demonstrate the new developed implementation
2 The Concept and Metric of QMU
QMU is a decision-supportmethodology for complex techni-cal decisions centering on performance thresholds and asso-ciated margins for engineering systems that are made underuncertainty [9] The basic concept of the QMU is shown inFigure 1 The margin (119872) is defined as the distance betweenthe nominal response of the system and performance gatebound (eg a failure threshold not to be exceeded) whereasuncertainty (119880) is described by the range of system responsescaused by different sources of variability A QMU metricconfidence factor (CF) has to be developed to quantify andcertify the confidence of the system reliability which can bedefined as
CF =119872
119880 (1)
A CF sufficiently larger than one intuitively indicates safeconditions In order to get the value of CF three key elementsshould to be implemented as follows (1) identification andspecification of performance threshold(s) (2) identificationand specification of associated performance margin(s) thatis measure(s) of exceeding performance thresholds (3)quantified uncertainty in threshold and margin specifica-tions
3 The Mixed Uncertainty Propagation Basedon Evidence Theory
31 Fundamentals of Evidence Theory The measures ofuncertainty provided by evidence theory [10] are known asbelief (Bel) and plausibility (Pl) which lie in the interval[0 1] Evidence theory application involves the evidencespecification of (YY 119898) whereY denotes the universal setY denotes the collection of subsetsU or set of focal elementsofY119898 is the basic probability assignment (BPA) and119898(U)
should satisfy the following axioms of evidence theory (1)119898(U) ge 0 for any U isin Y (2) 119898(U) = 0 when U notin Y (3)sum119898(U) = 1 for allU isin Y
The Bel and Pl of a given event set119860 and 119861 can be derivedfrom the basic probability assignment by
Bel (119861) = sum119860sube119861
119898(119860)
Pl (119861) = sum119861cap119860 =120601
119898(119860) (2)
Resulting from (2) the belief function Bel(sdot) is calculatedby summing the BPAs that totally agree with event 119861 whilethe plausibility function Pl(sdot) is calculated by summing BPAsthat agree with event 119861 totally and partially Both Bel and Plplay roles similar to distribution functions in the standardprobability and they give the lower and upper bounds of theevent set
32 Mixed Uncertainty Propagation Using Evidence TheoryThemixed uncertainty propagated from input parameters tosystems output needs to be quantified for structure reliabilityanalysis when aleatory and epistemic uncertainties exist Theperformance functionwith aleatory and epistemic uncertain-ties can be given by
119866 (Z) = 119892 (XY)
= 119892 (1198831 1198832 119883
119899119883 1198841 1198842 119884
119899119884)
(3)
where X = 1198831 1198832 119883
119899119883 represents the aleatory uncer-
tainty variables described by probability distributions Foreasy demonstration we assume that the elements of X areindependentY = 119884
1 1198842 119884
119899119884 is the vector of parameters
with epistemic uncertainty described by evidence specifica-tion (Y
1Y1 1198981) (Y2Y2 1198982) (Y
119899Y119899 119898119899) The uncer-
tainty associated with the model inputs X and Y are prop-agated through the model 119892(sdot) to the model output 119866 Thejoint evidence specification can be expressed by (YY 119898Y)and the joint BPA is defined by
119898Y (U) =
119899119884
prod119896=1
119898119896(U119896) U = U
1timesU2times sdot sdot sdot timesU
119899119884
0 Otherwise(4)
Let the number of the subsets of Y in the joint space be119899 The probability of the system output value (119866) is less thanthe threshold (119888) which can be given by the following basedon the total probability formula
119875 =
119899
sum119894=1
Pr 119866 (XY) lt 119888 | Y119894isin U119894119898119884(U119894) (5)
where 119875 is the probability of 119866(Z) lt 119888 which is denoted asevent 119865 PrY
119894isin U119894 = 119898Y(U119894) means the probability of the
focal elementU119894in joint spaceY equals the joint BPA value
Because of the intervals inY theminimum value (belief) andmaximum value (plausibility) of 119875 can be expressed by [11]
Bel (119865) = 119875min
=
119899
sum119894=1
119898Y (U119894)Pr 119866max (XY) lt 119888 | Y
119894isin U119894
(6)
Mathematical Problems in Engineering 3
Pl (119865) = 119875max
=
119899
sum119894=1
119898Y (U119894)Pr 119866min (XY) lt 119888 | Y
119894isin U119894
(7)
33 The Solution Framework of Mixed Uncertainty Propa-gation Equations (6)-(7) can be calculated using samplingmethods such as MCS with large computational cost TheKriging surrogate model [12 13] can be employed to reducethe cost for uncertainty propagation With training observa-tions the response and predicted mean square error for anygiven new point x1015840 can be expressed as
(x1015840) = 120583 + r119879Rminus1 (G minus A120583)
(x1015840) = 1205902 [
[
1 minus r119879Rminus1r +(1 minus A119879Rminus1r)
2
A119879Rminus1A]
]
(8)
where R represents a correlation matrix r is the correlationvector between x1015840 and the observed samples and A is an119899 times 1 unit vector This surrogate model is used to evaluatethe uncertainty distribution of system output based on thetraditional MCS method without calling the original perfor-mance function The Maximum Confidence Enhancementadaptive sampling [13] is employed to ensure the surrogatemodel accuracy by adding new training sample
The procedure of the kriging-based method for solving(7) is simply introduced as follows
(1) Calculate the joint BPA of epistemic uncertaintiesvariables Y
(2) Use the Latin hypercube sampling (LHS) to generate119873 = (119899 + 1)(119899 + 2)2 sample points x
119905= (1199091119905
119909119899119905) (119905 = 1 2 119873) of the aleatory variables X
(3) For each x119905 calculate the minimum output value of
119866min(x119905) in focal elementU119894of joint space
(4) Build Kriging model based on training data x119905and
119866min(x119905)(5) Calculate the maximum Confidence point (119909lowast) from
the MC sampling and update Kriging model byadding new training sample (119909lowast 119866min(119909
lowast))(6) Repeat steps (4)-(5) until the surrogatemodel approx-
imate accuracy is satisfied(7) Calculate the probability boundary using the updated
Kriging model and MC samples(8) Repeat steps (3)ndash(7) for each focal element of Y(9) Compute the Pl(sdot) based on the joint BPA and proba-
bility of each focal element
For the Bel(sdot) solution the minimum output value119866min(x119905) needs to change to the maximum output value119866max(x119905)
34 Calculation of CF under the Evidence Theory FrameworkAs described in Section 2 the safety or reliability of a struc-tural system will be measured by the Confidence Factor CF
Random distribution
M
FCPF
CBF
CDF
10
08
06
04
02
0System response parameter
System outputPerformance gate
boundary
Pl
Bel
UT
Ufunction
P = 05
P =1 + 120574
2
P =1 minus 120574
2
Figure 2 Demonstration of uncertainties and margins under beliefand plausibility
M
M
N N
M-M section
F
e
a b
d1
d2
o1
o3
o2
120596
Figure 3 A crank-slider mechanism
When the system output uncertainty is represented in termsof evidence theory measures with belief and plausibility thedemonstration of uncertainties and margins with distancebetween system output and performance gate boundary isshown in Figure 2 The performance gate boundary is a ran-dom variable
The calculations of119872 and119880 to perform upper boundaryare given by the following equations
119872 =1003816100381610038161003816Bel119875=05 minus 119865
119875=05
1003816100381610038161003816
119880 = 119880function + 119880119879
=10038161003816100381610038161003816Bel119875=(1+120574)2
minus Pl119875=05
10038161003816100381610038161003816+10038161003816100381610038161003816119865119875=05
minus 119865119875=(1minus120574)2
10038161003816100381610038161003816
(9)
where the subscript 119875 corresponds to the quantity of beliefplausibilityprobability level and 120574 is the specified confidencelevel
4 Application Example for Structure Analysis
Figure 3 shows a crank-slider mechanism [11] The length ofthe crank 119886 the length of the coupler 119887 the external force119875 Youngrsquos modulus of the material of the coupler 119864 andthe yield strength of the coupler 119878 are random variables Thecoefficient of friction 119906 between the ground and the slider andthe offset 119890 are epistemic variablesThe random variables andepistemic variables with BPA are provided in Tables 1 and 2
4 Mathematical Problems in Engineering
Table 1 Random variables
Variable Parameterssymbol Mean Standard
deviation Distribution
1198831 119886 (mm) 100 001 Normal
1198832 119887 (mm) 400 001 Normal
1198833 119875 (KN) 280 28 Normal
1198834 119864 (GPa) 200 10 Normal
1198835 119878 (MPa) 290 29 Normal
1198836 119889
1(mm) 60 3 Normal
1198837 119889
2(mm) 25 25 Normal
Table 2 Uncertain variables with epistemic uncertainty
Variable Symbol Intervals BPA
1198841
119890
[100 120] 02[120 140] 04[140 150] 04
1198842
120583
[015 018] 03[018 023] 03[023 025] 04
Table 3 Calculated CF vs different 120574
120574 119872 119880 CF095 1335 138 0967409 1335 1175 113608 1335 935 1428
Bel
Pl
CBF
CPF
CDF
1
08
09
06
04
07
05
02
03
01
0
Stressstrength0 50 100 150 200 250 300 350 400 450 500
YT
Figure 4 The uncertainty distribution of system performance andthreshold
The performance function is defined by the maximum stressas (10) and the boundary is the material strength
119884 =4119875 (119887 minus 119886)
120587 (radic(119887 minus 119886)2minus 1198902 minus 120583119890) (1198892
2minus 11988921)
(10)
The belief and plausibility measures of the maximumstress are calculated by the proposed adaptive samplingKriging model approach and these results are shown inFigure 4TheQMUanalysis with different 120574 is summarized inTable 3 Results show that the confidence level is very sensitivefor QMU analysis in risk-informed decision-making
5 Conclusion
Themixed uncertainty propagation approach is proposed byintegrated adaptive sampling method and Kriging model forQMU analysis in this paper The technique is demonstratedby a numerical example to account for the QMU analysisprocess and the approach for mixed uncertainty propagationThe results indicate the potential effectiveness of the proposedQMU approach for the evaluation of structure reliability
Competing Interests
The authors declare that there is no conflict of interestsregarding the publication of this paper
Acknowledgments
The authors acknowledge China Academy of EngineeringPhysics (CAEP) Foundation (2013ZK12) and Foundation ofNSAF Grant no U1330130 (NSAF-U1330103)
References
[1] J C Helton J D Johnson W L Oberkampf and C J Salla-berry ldquoRepresentation of analysis results involving aleatory andepistemic uncertaintyrdquo International Journal of General Systemsvol 39 no 6 pp 605ndash646 2010
[2] J C Helton and W L Oberkampf ldquoAlternative representationsof epistemic uncertaintyrdquo Reliability Engineering amp SystemSafety vol 85 no 1ndash3 pp 1ndash10 2004
[3] R Rackwitz ldquoReliability analysismdasha review and some perspec-tivesrdquo Structural Safety vol 23 no 4 pp 365ndash395 2001
[4] S-K Au and J L Beck ldquoEstimation of small failure probabilitiesin high dimensions by subset simulationrdquo Probabilistic Engi-neering Mechanics vol 16 no 4 pp 263ndash277 2001
[5] X Du P K Venigella andD Liu ldquoRobustmechanism synthesiswith random and interval variablesrdquo Mechanism amp MachineTheory vol 44 no 7 pp 1321ndash1337 2009
[6] H-Z Huang Z LWang Y F Li B Huang N C Xiao and L PHe ldquoA nonprobabilistic set model of structural reliability basedon satisfaction degree of intervalrdquoMechanika vol 17 no 1 pp85ndash92 2011
[7] D Eardley ldquoQuantification of margins and uncertainties(QMU)rdquo Tech Rep JSR-04-330 JASON 2005
[8] H Shah S Hosder and T Winter ldquoQuantification of marginsand mixed uncertainties using evidence theory and stochasticexpansionsrdquoReliability Engineeringamp System Safety vol 138 pp59ndash72 2015
[9] NASNRC (National Academy of ScienceNational ResearchCouncil) Evaluation of Quantification of Margins and Uncer-tainties for Assessing and Certifying the Reliability of the NuclearStockpile National Academy Press Washington DC USA2008
[10] H-R Bae RVGrandhi andRACanfield ldquoAn approximationapproach for uncertainty quantification using evidence theoryrdquoReliability Engineering amp System Safety vol 86 no 3 pp 215ndash225 2004
[11] X P Du ldquoUnified uncertainty analysis by the first order reli-ability methodrdquo Journal of Mechanical Design vol 130 no 9pp 1ndash10 2008
Mathematical Problems in Engineering 5
[12] I-K Bang D-S Han G-J Han and K-H Lee ldquoStructuraloptimization for a jaw using iterative Kriging metamodelsrdquoJournal of Mechanical Science and Technology vol 22 no 9 pp1651ndash1659 2008
[13] Z Wang and P Wang ldquoA maximum confidence enhance-ment based sequential sampling scheme for simulation-baseddesignrdquo Journal of Mechanical Design vol 136 no 2 Article ID021006 2014
Submit your manuscripts athttpwwwhindawicom
Hindawi Publishing Corporationhttpwwwhindawicom Volume 2014
MathematicsJournal of
Hindawi Publishing Corporationhttpwwwhindawicom Volume 2014
Mathematical Problems in Engineering
Hindawi Publishing Corporationhttpwwwhindawicom
Differential EquationsInternational Journal of
Volume 2014
Applied MathematicsJournal of
Hindawi Publishing Corporationhttpwwwhindawicom Volume 2014
Probability and StatisticsHindawi Publishing Corporationhttpwwwhindawicom Volume 2014
Journal of
Hindawi Publishing Corporationhttpwwwhindawicom Volume 2014
Mathematical PhysicsAdvances in
Complex AnalysisJournal of
Hindawi Publishing Corporationhttpwwwhindawicom Volume 2014
OptimizationJournal of
Hindawi Publishing Corporationhttpwwwhindawicom Volume 2014
CombinatoricsHindawi Publishing Corporationhttpwwwhindawicom Volume 2014
International Journal of
Hindawi Publishing Corporationhttpwwwhindawicom Volume 2014
Operations ResearchAdvances in
Journal of
Hindawi Publishing Corporationhttpwwwhindawicom Volume 2014
Function Spaces
Abstract and Applied AnalysisHindawi Publishing Corporationhttpwwwhindawicom Volume 2014
International Journal of Mathematics and Mathematical Sciences
Hindawi Publishing Corporationhttpwwwhindawicom Volume 2014
The Scientific World JournalHindawi Publishing Corporation httpwwwhindawicom Volume 2014
Hindawi Publishing Corporationhttpwwwhindawicom Volume 2014
Algebra
Discrete Dynamics in Nature and Society
Hindawi Publishing Corporationhttpwwwhindawicom Volume 2014
Hindawi Publishing Corporationhttpwwwhindawicom Volume 2014
Decision SciencesAdvances in
Discrete MathematicsJournal of
Hindawi Publishing Corporationhttpwwwhindawicom
Volume 2014 Hindawi Publishing Corporationhttpwwwhindawicom Volume 2014
Stochastic AnalysisInternational Journal of
2 Mathematical Problems in Engineering
Performance gate upper bound
Performance gate lower bound
(failure threshold)
Margin (M)
Performanceuncertainty (U)
Performancegate
Figure 1 Notional illustration of the QMU
adaptive sampling is presented One case study is presented inSection 4 to demonstrate the new developed implementation
2 The Concept and Metric of QMU
QMU is a decision-supportmethodology for complex techni-cal decisions centering on performance thresholds and asso-ciated margins for engineering systems that are made underuncertainty [9] The basic concept of the QMU is shown inFigure 1 The margin (119872) is defined as the distance betweenthe nominal response of the system and performance gatebound (eg a failure threshold not to be exceeded) whereasuncertainty (119880) is described by the range of system responsescaused by different sources of variability A QMU metricconfidence factor (CF) has to be developed to quantify andcertify the confidence of the system reliability which can bedefined as
CF =119872
119880 (1)
A CF sufficiently larger than one intuitively indicates safeconditions In order to get the value of CF three key elementsshould to be implemented as follows (1) identification andspecification of performance threshold(s) (2) identificationand specification of associated performance margin(s) thatis measure(s) of exceeding performance thresholds (3)quantified uncertainty in threshold and margin specifica-tions
3 The Mixed Uncertainty Propagation Basedon Evidence Theory
31 Fundamentals of Evidence Theory The measures ofuncertainty provided by evidence theory [10] are known asbelief (Bel) and plausibility (Pl) which lie in the interval[0 1] Evidence theory application involves the evidencespecification of (YY 119898) whereY denotes the universal setY denotes the collection of subsetsU or set of focal elementsofY119898 is the basic probability assignment (BPA) and119898(U)
should satisfy the following axioms of evidence theory (1)119898(U) ge 0 for any U isin Y (2) 119898(U) = 0 when U notin Y (3)sum119898(U) = 1 for allU isin Y
The Bel and Pl of a given event set119860 and 119861 can be derivedfrom the basic probability assignment by
Bel (119861) = sum119860sube119861
119898(119860)
Pl (119861) = sum119861cap119860 =120601
119898(119860) (2)
Resulting from (2) the belief function Bel(sdot) is calculatedby summing the BPAs that totally agree with event 119861 whilethe plausibility function Pl(sdot) is calculated by summing BPAsthat agree with event 119861 totally and partially Both Bel and Plplay roles similar to distribution functions in the standardprobability and they give the lower and upper bounds of theevent set
32 Mixed Uncertainty Propagation Using Evidence TheoryThemixed uncertainty propagated from input parameters tosystems output needs to be quantified for structure reliabilityanalysis when aleatory and epistemic uncertainties exist Theperformance functionwith aleatory and epistemic uncertain-ties can be given by
119866 (Z) = 119892 (XY)
= 119892 (1198831 1198832 119883
119899119883 1198841 1198842 119884
119899119884)
(3)
where X = 1198831 1198832 119883
119899119883 represents the aleatory uncer-
tainty variables described by probability distributions Foreasy demonstration we assume that the elements of X areindependentY = 119884
1 1198842 119884
119899119884 is the vector of parameters
with epistemic uncertainty described by evidence specifica-tion (Y
1Y1 1198981) (Y2Y2 1198982) (Y
119899Y119899 119898119899) The uncer-
tainty associated with the model inputs X and Y are prop-agated through the model 119892(sdot) to the model output 119866 Thejoint evidence specification can be expressed by (YY 119898Y)and the joint BPA is defined by
119898Y (U) =
119899119884
prod119896=1
119898119896(U119896) U = U
1timesU2times sdot sdot sdot timesU
119899119884
0 Otherwise(4)
Let the number of the subsets of Y in the joint space be119899 The probability of the system output value (119866) is less thanthe threshold (119888) which can be given by the following basedon the total probability formula
119875 =
119899
sum119894=1
Pr 119866 (XY) lt 119888 | Y119894isin U119894119898119884(U119894) (5)
where 119875 is the probability of 119866(Z) lt 119888 which is denoted asevent 119865 PrY
119894isin U119894 = 119898Y(U119894) means the probability of the
focal elementU119894in joint spaceY equals the joint BPA value
Because of the intervals inY theminimum value (belief) andmaximum value (plausibility) of 119875 can be expressed by [11]
Bel (119865) = 119875min
=
119899
sum119894=1
119898Y (U119894)Pr 119866max (XY) lt 119888 | Y
119894isin U119894
(6)
Mathematical Problems in Engineering 3
Pl (119865) = 119875max
=
119899
sum119894=1
119898Y (U119894)Pr 119866min (XY) lt 119888 | Y
119894isin U119894
(7)
33 The Solution Framework of Mixed Uncertainty Propa-gation Equations (6)-(7) can be calculated using samplingmethods such as MCS with large computational cost TheKriging surrogate model [12 13] can be employed to reducethe cost for uncertainty propagation With training observa-tions the response and predicted mean square error for anygiven new point x1015840 can be expressed as
(x1015840) = 120583 + r119879Rminus1 (G minus A120583)
(x1015840) = 1205902 [
[
1 minus r119879Rminus1r +(1 minus A119879Rminus1r)
2
A119879Rminus1A]
]
(8)
where R represents a correlation matrix r is the correlationvector between x1015840 and the observed samples and A is an119899 times 1 unit vector This surrogate model is used to evaluatethe uncertainty distribution of system output based on thetraditional MCS method without calling the original perfor-mance function The Maximum Confidence Enhancementadaptive sampling [13] is employed to ensure the surrogatemodel accuracy by adding new training sample
The procedure of the kriging-based method for solving(7) is simply introduced as follows
(1) Calculate the joint BPA of epistemic uncertaintiesvariables Y
(2) Use the Latin hypercube sampling (LHS) to generate119873 = (119899 + 1)(119899 + 2)2 sample points x
119905= (1199091119905
119909119899119905) (119905 = 1 2 119873) of the aleatory variables X
(3) For each x119905 calculate the minimum output value of
119866min(x119905) in focal elementU119894of joint space
(4) Build Kriging model based on training data x119905and
119866min(x119905)(5) Calculate the maximum Confidence point (119909lowast) from
the MC sampling and update Kriging model byadding new training sample (119909lowast 119866min(119909
lowast))(6) Repeat steps (4)-(5) until the surrogatemodel approx-
imate accuracy is satisfied(7) Calculate the probability boundary using the updated
Kriging model and MC samples(8) Repeat steps (3)ndash(7) for each focal element of Y(9) Compute the Pl(sdot) based on the joint BPA and proba-
bility of each focal element
For the Bel(sdot) solution the minimum output value119866min(x119905) needs to change to the maximum output value119866max(x119905)
34 Calculation of CF under the Evidence Theory FrameworkAs described in Section 2 the safety or reliability of a struc-tural system will be measured by the Confidence Factor CF
Random distribution
M
FCPF
CBF
CDF
10
08
06
04
02
0System response parameter
System outputPerformance gate
boundary
Pl
Bel
UT
Ufunction
P = 05
P =1 + 120574
2
P =1 minus 120574
2
Figure 2 Demonstration of uncertainties and margins under beliefand plausibility
M
M
N N
M-M section
F
e
a b
d1
d2
o1
o3
o2
120596
Figure 3 A crank-slider mechanism
When the system output uncertainty is represented in termsof evidence theory measures with belief and plausibility thedemonstration of uncertainties and margins with distancebetween system output and performance gate boundary isshown in Figure 2 The performance gate boundary is a ran-dom variable
The calculations of119872 and119880 to perform upper boundaryare given by the following equations
119872 =1003816100381610038161003816Bel119875=05 minus 119865
119875=05
1003816100381610038161003816
119880 = 119880function + 119880119879
=10038161003816100381610038161003816Bel119875=(1+120574)2
minus Pl119875=05
10038161003816100381610038161003816+10038161003816100381610038161003816119865119875=05
minus 119865119875=(1minus120574)2
10038161003816100381610038161003816
(9)
where the subscript 119875 corresponds to the quantity of beliefplausibilityprobability level and 120574 is the specified confidencelevel
4 Application Example for Structure Analysis
Figure 3 shows a crank-slider mechanism [11] The length ofthe crank 119886 the length of the coupler 119887 the external force119875 Youngrsquos modulus of the material of the coupler 119864 andthe yield strength of the coupler 119878 are random variables Thecoefficient of friction 119906 between the ground and the slider andthe offset 119890 are epistemic variablesThe random variables andepistemic variables with BPA are provided in Tables 1 and 2
4 Mathematical Problems in Engineering
Table 1 Random variables
Variable Parameterssymbol Mean Standard
deviation Distribution
1198831 119886 (mm) 100 001 Normal
1198832 119887 (mm) 400 001 Normal
1198833 119875 (KN) 280 28 Normal
1198834 119864 (GPa) 200 10 Normal
1198835 119878 (MPa) 290 29 Normal
1198836 119889
1(mm) 60 3 Normal
1198837 119889
2(mm) 25 25 Normal
Table 2 Uncertain variables with epistemic uncertainty
Variable Symbol Intervals BPA
1198841
119890
[100 120] 02[120 140] 04[140 150] 04
1198842
120583
[015 018] 03[018 023] 03[023 025] 04
Table 3 Calculated CF vs different 120574
120574 119872 119880 CF095 1335 138 0967409 1335 1175 113608 1335 935 1428
Bel
Pl
CBF
CPF
CDF
1
08
09
06
04
07
05
02
03
01
0
Stressstrength0 50 100 150 200 250 300 350 400 450 500
YT
Figure 4 The uncertainty distribution of system performance andthreshold
The performance function is defined by the maximum stressas (10) and the boundary is the material strength
119884 =4119875 (119887 minus 119886)
120587 (radic(119887 minus 119886)2minus 1198902 minus 120583119890) (1198892
2minus 11988921)
(10)
The belief and plausibility measures of the maximumstress are calculated by the proposed adaptive samplingKriging model approach and these results are shown inFigure 4TheQMUanalysis with different 120574 is summarized inTable 3 Results show that the confidence level is very sensitivefor QMU analysis in risk-informed decision-making
5 Conclusion
Themixed uncertainty propagation approach is proposed byintegrated adaptive sampling method and Kriging model forQMU analysis in this paper The technique is demonstratedby a numerical example to account for the QMU analysisprocess and the approach for mixed uncertainty propagationThe results indicate the potential effectiveness of the proposedQMU approach for the evaluation of structure reliability
Competing Interests
The authors declare that there is no conflict of interestsregarding the publication of this paper
Acknowledgments
The authors acknowledge China Academy of EngineeringPhysics (CAEP) Foundation (2013ZK12) and Foundation ofNSAF Grant no U1330130 (NSAF-U1330103)
References
[1] J C Helton J D Johnson W L Oberkampf and C J Salla-berry ldquoRepresentation of analysis results involving aleatory andepistemic uncertaintyrdquo International Journal of General Systemsvol 39 no 6 pp 605ndash646 2010
[2] J C Helton and W L Oberkampf ldquoAlternative representationsof epistemic uncertaintyrdquo Reliability Engineering amp SystemSafety vol 85 no 1ndash3 pp 1ndash10 2004
[3] R Rackwitz ldquoReliability analysismdasha review and some perspec-tivesrdquo Structural Safety vol 23 no 4 pp 365ndash395 2001
[4] S-K Au and J L Beck ldquoEstimation of small failure probabilitiesin high dimensions by subset simulationrdquo Probabilistic Engi-neering Mechanics vol 16 no 4 pp 263ndash277 2001
[5] X Du P K Venigella andD Liu ldquoRobustmechanism synthesiswith random and interval variablesrdquo Mechanism amp MachineTheory vol 44 no 7 pp 1321ndash1337 2009
[6] H-Z Huang Z LWang Y F Li B Huang N C Xiao and L PHe ldquoA nonprobabilistic set model of structural reliability basedon satisfaction degree of intervalrdquoMechanika vol 17 no 1 pp85ndash92 2011
[7] D Eardley ldquoQuantification of margins and uncertainties(QMU)rdquo Tech Rep JSR-04-330 JASON 2005
[8] H Shah S Hosder and T Winter ldquoQuantification of marginsand mixed uncertainties using evidence theory and stochasticexpansionsrdquoReliability Engineeringamp System Safety vol 138 pp59ndash72 2015
[9] NASNRC (National Academy of ScienceNational ResearchCouncil) Evaluation of Quantification of Margins and Uncer-tainties for Assessing and Certifying the Reliability of the NuclearStockpile National Academy Press Washington DC USA2008
[10] H-R Bae RVGrandhi andRACanfield ldquoAn approximationapproach for uncertainty quantification using evidence theoryrdquoReliability Engineering amp System Safety vol 86 no 3 pp 215ndash225 2004
[11] X P Du ldquoUnified uncertainty analysis by the first order reli-ability methodrdquo Journal of Mechanical Design vol 130 no 9pp 1ndash10 2008
Mathematical Problems in Engineering 5
[12] I-K Bang D-S Han G-J Han and K-H Lee ldquoStructuraloptimization for a jaw using iterative Kriging metamodelsrdquoJournal of Mechanical Science and Technology vol 22 no 9 pp1651ndash1659 2008
[13] Z Wang and P Wang ldquoA maximum confidence enhance-ment based sequential sampling scheme for simulation-baseddesignrdquo Journal of Mechanical Design vol 136 no 2 Article ID021006 2014
Submit your manuscripts athttpwwwhindawicom
Hindawi Publishing Corporationhttpwwwhindawicom Volume 2014
MathematicsJournal of
Hindawi Publishing Corporationhttpwwwhindawicom Volume 2014
Mathematical Problems in Engineering
Hindawi Publishing Corporationhttpwwwhindawicom
Differential EquationsInternational Journal of
Volume 2014
Applied MathematicsJournal of
Hindawi Publishing Corporationhttpwwwhindawicom Volume 2014
Probability and StatisticsHindawi Publishing Corporationhttpwwwhindawicom Volume 2014
Journal of
Hindawi Publishing Corporationhttpwwwhindawicom Volume 2014
Mathematical PhysicsAdvances in
Complex AnalysisJournal of
Hindawi Publishing Corporationhttpwwwhindawicom Volume 2014
OptimizationJournal of
Hindawi Publishing Corporationhttpwwwhindawicom Volume 2014
CombinatoricsHindawi Publishing Corporationhttpwwwhindawicom Volume 2014
International Journal of
Hindawi Publishing Corporationhttpwwwhindawicom Volume 2014
Operations ResearchAdvances in
Journal of
Hindawi Publishing Corporationhttpwwwhindawicom Volume 2014
Function Spaces
Abstract and Applied AnalysisHindawi Publishing Corporationhttpwwwhindawicom Volume 2014
International Journal of Mathematics and Mathematical Sciences
Hindawi Publishing Corporationhttpwwwhindawicom Volume 2014
The Scientific World JournalHindawi Publishing Corporation httpwwwhindawicom Volume 2014
Hindawi Publishing Corporationhttpwwwhindawicom Volume 2014
Algebra
Discrete Dynamics in Nature and Society
Hindawi Publishing Corporationhttpwwwhindawicom Volume 2014
Hindawi Publishing Corporationhttpwwwhindawicom Volume 2014
Decision SciencesAdvances in
Discrete MathematicsJournal of
Hindawi Publishing Corporationhttpwwwhindawicom
Volume 2014 Hindawi Publishing Corporationhttpwwwhindawicom Volume 2014
Stochastic AnalysisInternational Journal of