research article personal verification/identification via
TRANSCRIPT
Research ArticlePersonal Verification/Identification via Analysisof the Peripheral ECG Leads: Influence of the PersonalHealth Status on the Accuracy
Irena Jekova1 and Giovanni Bortolan2
1 Institute of Biophysics andBiomedical Engineering, BulgarianAcademy of Sciences, Acad.G. Bonchev Street Bl 105, 1113 Sofia, Bulgaria2Institute of Neuroscience (IN), CNR, 35127 Padova, Italy
Correspondence should be addressed to Irena Jekova; [email protected]
Received 3 April 2015; Accepted 15 September 2015
Academic Editor: Jason Ng
Copyright © 2015 I. Jekova and G. Bortolan. This is an open access article distributed under the Creative Commons AttributionLicense, which permits unrestricted use, distribution, and reproduction in any medium, provided the original work is properlycited.
Traditional means for identity validation (PIN codes, passwords), and physiological and behavioral biometric characteristics(fingerprint, iris, and speech) are susceptible to hacker attacks and/or falsification. This paper presents a method for personverification/identification based on correlation of present-to-previous limb ECG leads: I (𝑟I), II (𝑟II), calculated from them firstprincipal ECG component (𝑟PCA), linear and nonlinear combinations between 𝑟I, 𝑟II, and 𝑟PCA. For the verification task, the one-to-one scenario is applied and threshold values for 𝑟I, 𝑟II, and 𝑟PCA and their combinations are derived.The identification task supposesone-to-many scenario and the tested subject is identified according to the maximal correlation with a previously recorded ECG ina database. The population based ECG-ILSA database of 540 patients (147 healthy subjects, 175 patients with cardiac diseases, and218 with hypertension) has been considered. In addition a common reference PTB dataset (14 healthy individuals) with short timeinterval between the two acquisitions has been taken into account.The results on ECG-ILSA database were satisfactory with healthypeople, and there was not a significant decrease in nonhealthy patients, demonstrating the robustness of the proposedmethod.WithPTB database, the method provides an identification accuracy of 92.9% and a verification sensitivity and specificity of 100% and89.9%.
1. Introduction
The reliability of automatic person identification has becomecritical in our life, considering the necessary security forthe cases of financial transactions, access control, travelling,and so forth. The traditional means for identity validation,such as PIN codes, passwords, and identity cards, are sus-ceptible to hacker attacks and falsification. In the past fewdecades, identification based on physiological and behavioralbiometric characteristics, such as fingerprint, iris, and speech,were proposed. However, these biometrics could be easilycircumvented, for example, by using prosthetic finger or iris[1] or voice playback. Considering these drawbacks, recentlythe efforts are focused on the development of next generationof biometric characteristics that are internal to the human’sbody and therefore are robust to the above discussed attacks.
The analysis of the electrocardiogram (ECG) as a bio-metric tool was started about a decade ago and two generalapproaches could be distinguished: (i) methods that usemeasurements after detection of fiducial points and (ii)methods that analyze the overall morphology of the ECG.
The fiducial based approaches had been applied sincethe very beginning. One of the earliest studies that demon-strated the feasibility of ECG signals for biometrics [2]involved 12 uncorrelated clinical diagnosis features relatedto P, QRS, T amplitudes, and durations. The interpretationof the similarities/differences between individuals’ heartbeatswas performed by principal component analysis (PCA) scoreplots.The authors achieved classification rate of 100%using 10of the features. Israel et al. [3] employed 15 temporal featuresdescribing the P-QRS-T segment which were fed into a set ofdiscriminant functions for individual recognition.This group
Hindawi Publishing CorporationBioMed Research InternationalVolume 2015, Article ID 135676, 13 pageshttp://dx.doi.org/10.1155/2015/135676

2 BioMed Research International
reported accuracy for the individual classification between97% and 100%. In 2008,Wang et al. [4] introduced a two-stepdetection that incorporates temporal and amplitude mea-surements based on fiducial points detection and appearancebased features that capture the patterns of the heartbeats.Theauthors achieved 100% subject identification based on thiscombined approach.
The methods incorporating time and amplitude char-acteristics of the heartbeats strongly rely on the correctlocalization of wave boundaries within the P-QRS-T segment.Current algorithms for ECGdelineation are dedicatedmainlyto themedical applicationswhere the detection of the approx-imate fiducial point positions is adequate for diagnostic pur-poses. In contrast, in order to reduce the rejection rate, perfectheartbeat synchronization is required for biometric pur-poses [5]. For that reason, fiducial independent approachesappeared after 2006. Great part of the proposed methods wasbased on calculation of correlation coefficients. Plataniotis etal. [6] proposed amethod for personal identification applyingautocorrelation (AC) of windowed ECG followed by discretecosine transform (DCT) and reported 100% accuracy. Agrafi-oti and Hatzinakos [5] utilized the AC of 5 s ECG segmentsfor biometric identification. The AC signals were processedby discriminant analysis and accuracy of 96.4% is reported.This work also presented an arrhythmia screening algorithmbased on complexity measurement analysis which preventedconsidering ECG segments with ventricular ectopic beats.Poree et al. [7] reported 100% identification accuracy usingthemaximal correlation coefficient applied over 12-lead ECG.The accuracy dropped down to 91.4% when the method wasapplied over single ECG lead. Wubbeler et al. [8] formed atwo-dimensional heart vector using limb leads ECGs, as wellas its first and second temporal derivatives. The proposedidentification relies on distance based approach and providesaccuracy higher than 97%. Ye et al. [9] applied discretewavelet transform (DWT) and independent component anal-ysis (ICA) on ECG beats and obtained 136 features that werefurther reduced to 26 using PCA. The classification withSVM led to 99.6% accuracy. Recently, Zokaee and Faez [10]promoted a multimodal biometric system based on ECGand palm print analysis. They used Mel-frequency cepstrumcoefficient (MFCC) approach to extract features of ECGbiometrics and PCA to extract features from palm print.The accuracy provided by KNN classification was 94.7%.Sidek et al. [11] achieved personal recognition accuracyof 96.1% by feeding a normalized QRS complex into aMultilayer perceptron. Zhao et al. [1] reported a humanECG identification system based on ECG decompositionin a number of intrinsic mode functions combined withWelch spectral analysis for extraction of significant heartbeatfeatures. PCA was used for feature space reduction. Theclassification with KNNmethod provided 95% identificationaccuracy.
Despite the reported high accuracy results and thereported evidences for ECG stability in different physiologi-cal conditions [3, 7, 11, 12] the validation of ECG for biometricidentification requires more severe testing conditions andreduction to easily acquirable ECG leads in order to be ade-quate to the real situation and to be convenient and reliable
for the person under identification process. In this respect,the cited papers have the following limitations:
(1) Several studies use ECG recordings acquired in a veryshort temporal interval or in the same session [1, 3–5, 10, 11, 13] and this produces higher accuracy values.This factwas reported in a recent comparative analysis[14] over 20 authentication methods based on ECGanalysis, where significant accuracy degradation wasobserved when training and testing data come fromdifferent sessions if compared to the case of singlesession.
(2) The proposed methods are applied generally onhealthy subjects. However, there are factors of patho-logic nature that can severely influence ECG mor-phology and stability, such as transient or acutecardiac ischemia (manifested in ST-segment changesand sometimes in intra-QRS changes), hypertonia(high ECGvoltage), ectopic beats, conductive anoma-lies causing sometimes intermittent bundle branchblocks, and paroxysmal atrial fibrillation. Many ofthese changes are of a long-lasting nature and couldobviously influence the verification/identificationaccuracy.
(3) Some studies are based on analysis over all standard12 ECG leads [7] or on ECG acquired with electrodesplaced on the chest [11]. However, the acquisitionof the precordial leads is not realistic in many realsituations or applications, and the analysis of reducednumber of leads produces a reduction of the iden-tification accuracy [7]. The acquisition of ECG forperson identification is addressed by Chan et al. [15]and Lourenco et al. [13] who reported 95% and 94.3%accuracy using ECG leads acquired from palms andfingers, respectively.
The aim of this paper is to present, test, and validate amethodfor person verification and identification based on correlationusing only the limb ECG leads. The method is developedand tested using a population based ECG database, in whichthe two recordings have been performed at an interval of5 years. In addition, the database considers both healthypeople andpersonwith some cardiac disease or hypertension.The influence of the presence of nonhealthy patients in thevalidation phase is studied in detail.
2. Material and Methods
2.1. ECG Database. Two independent ECG databases havebeen used in this study for training and testing the proposedmethod: a population based database (ECG-ILSA) and areference database present in many comparisons in literature(the PTB database).
2.1.1. The ECG-ILSA Database. The ECG signals used fortraining and testing are taken from a computerized ECG-ILSA database, collected for the Italian Longitudinal Studyon Aging Project [16–19]. A random sample of 5632 indi-viduals aged from 65 to 84 years, living independently or in

BioMed Research International 3
institutions, stratified by age and sex with an equal allocationstrategywas identified on the demographic lists of the registryoffice of 8 Italian municipalities. They were followed upwith an interval of 5 years in order to study and evaluatephysiologic and pathologic modifications connected withaging. The computerized acquisition of ECG signals wasperformed in about 43% of the initial population.
This population based ECG-ILSA database consists of2513 ECG signals in the first phase (𝑇
1) and 1352 ECG signals
in the second phase (𝑇2= 𝑇1+ 5 years), and both ECGs
are present in 901 patients. For this study, a subset of 540subjects considered in a previous study [20] was selected.This group is consisting of 147 healthy subjects, 218 peoplewith hypertension, and 175 with cardiac diseases.The healthygroup is characterized by absence of cardiovascular andchronic pulmonary disease, no use of drugs that can influencethe electrical cardiac activity, and no electrolyte imbalance.The cardiac group is characterized by 56 patients with singlediagnosis of cardiovascular diseases, while, in the remaininggroup with multiple diagnoses, there are 51 patients with MI,44 with ischemia, and 24 with both.
The ECG recordings are with duration of 10 s and theyinclude the standard 12 leads, sampled at 500Hz. In orderto have a more robust validation procedure, considering thetemporal variability of ECG signal and/or modifications inthe pathologies, the learning phase was performed in thehealthy group. For this purpose, a random subset of 98 ECGsfrom the healthy group at times 𝑇
1and 𝑇
2represents the
training set. Consequently the remaining group of 49 healthysubjects and the entire cardiac and hypertension groups havebeen considered for the validation/testing procedure.
2.1.2. The Reference PTB Database. We have used an addi-tional test set, the PTB ECG database, which is a commonreference database present in the literature for comparativeresults. The ECG signals are taken from the Physikalisch-Technische Bundesanstalt (PTB) database. The ECGs werecollected from healthy volunteers and patients with differentheart diseases. The database contains 549 records from 290subjects, each one represented by one to five recordings,and it includes the conventional 12 leads together with the3 Frank leads, sampled at 1000Hz. The testing ECG setused in this study includes 14 healthy control subjects withmultiple ECG recordings, for whom the first (𝑇
1) and the
last (𝑇2) ECG recordings have been considered. This dataset
is characterized by a short time interval between the twoacquisitions at 𝑇
1and 𝑇
2: they were performed mainly in a
temporal interval from hours (in half of patients) to somemonths. These ECG recordings have been used in literatureas a reference for the evaluation of the methods for personverification/identification [4, 5].
2.2. Methods. Aiming at a practicable biometric system, thepresented method operates over 10 s ECG segments and usesonly the limb leads I and II. To minimize the negative effectof random noises the ECG signals were passed through
(i) high-pass filter with 0.64Hz cutoff frequency tosuppress baseline drift,
(ii) low-pass filter with cutoff frequency 35Hz to reducemuscle noise,
(iii) a notch filter to eliminate power-line interference.
The filtered signals were subjected toQRS detection [21], pro-viding the R-peak positions (QRSindex). The QRS detectionwas based on comparison of a complex lead, representing thesum of the absolute values of the differentiated lead I and leadII with a combined adaptive threshold
LeadQRS det (𝑖) = abs (LeadI (𝑖) − LeadI (𝑖 − 1))
+ abs (LeadII (𝑖) − LeadII (𝑖 − 1)) .(1)
For the purposes of biometric recognition, an ECG fromSet2 (2nd recording) is compared to the ECG in Set1 (1strecording) by applying the following procedures:
(1) Calculation of the mean RR interval of the testedECGSet2 and the ECGSet1 involved in the current com-parison (the smaller RR interval is further referred toas RRmin).
(2) Opening of a window (QRSindex − RRmin/3 toQRSindex + 2RRmin/3) around the QRS complexesdetected in ECGSet1 and ECGSet2.
(3) Application of principle component analysis (PCA)over the opened window, for derivation of combinedinformation for the waveforms in leads I and II.
(4) Calculation of the correlation between each coupleQRSSet1, QRSSet2, using the equation below:
𝑟 (QRSSet2,QRSSet1)
=
∑QRSindex+2RRmin/3
𝑖=QRSindex−RRmin/3QRSSet2 (𝑖)QRSSet1 (𝑖)
√∑QRSindex+2RRmin/3
𝑖=QRSindex−RRmin/3QRS (Set2)2
𝑖∑
QRSindex+2RRmin/3
𝑖=QRSindex−RRmin/3QRS (Set1)2
𝑖
.
(2)
The maximal correlation coefficient representing the bestcorrelated couple QRSSet1, QRSSet2 is considered. The valuesof three independent correlation coefficients—𝑟I (for theheartbeats in lead I), 𝑟II (lead II), and 𝑟PCA (for the firstprincipal component), two combined correlation coefficients(𝑟I + 𝑟II)/2, (𝑟I + 𝑟II + 𝑟PCA)/3, and two nonlinear com-binations between them representing the minimal valuemin(𝑟I, 𝑟II, 𝑟PCA) and the maximal value max(𝑟I, 𝑟II, 𝑟PCA) arefurther analyzed over the training dataset.
There are two typical scenarios for application of biomet-ric recognition.
(1) Person Verification.The one-to-one scenario is applicable;that is, the ECG of the tested subject in 𝑇
2is compared
to previously recorded ECG in 𝑇1with known identity. If
the maximal correlation is above a preset threshold value(CorrThr), it is accepted that both ECGs belong to one andthe same person and the identity of the tested person isverified.
The accuracy for person verification over the trainingdatabase is represented by sensitivity (Se verification) andspecificity (Sp verification). Se verification is calculated asthe percentage of subjects for whom the assessed correlation
4 BioMed Research International
78.6
77.0
0102030405060708090
100
0.9 0.91 0.92 0.93 0.94 0.95 0.96 0.97 0.98 0.99 1
(%)
Correlation threshold
Se_verification (I)Sp_verification (I)Optimization criterion (I)
(a)
(%)
85.783.7
0102030405060708090
100
0.9 0.91 0.92 0.93 0.94 0.95 0.96 0.97 0.98 0.99 1Correlation threshold
Se_verification (II)Sp_verification (II)Optimization criterion (II)
(b)
(%)
79.6
76.6
0102030405060708090
100
0.9 0.91 0.92 0.93 0.94 0.95 0.96 0.97 0.98 0.99 1Correlation threshold
Se_verification (PCA)Sp_verification (PCA)Optimization criterion (PCA)
(c)
00.10.20.30.40.50.60.70.80.9
1
0 0.1 0.2 0.3 0.4 0.5 0.6 0.7 0.8 0.9 1
Se_v
erifi
catio
n
1 − Sp_verification
ROC(PCA) →AUC(PCA) = 0.842ROC(II) →AUC(II) = 0.919ROC(I) →AUC(I) = 0.852
(d)
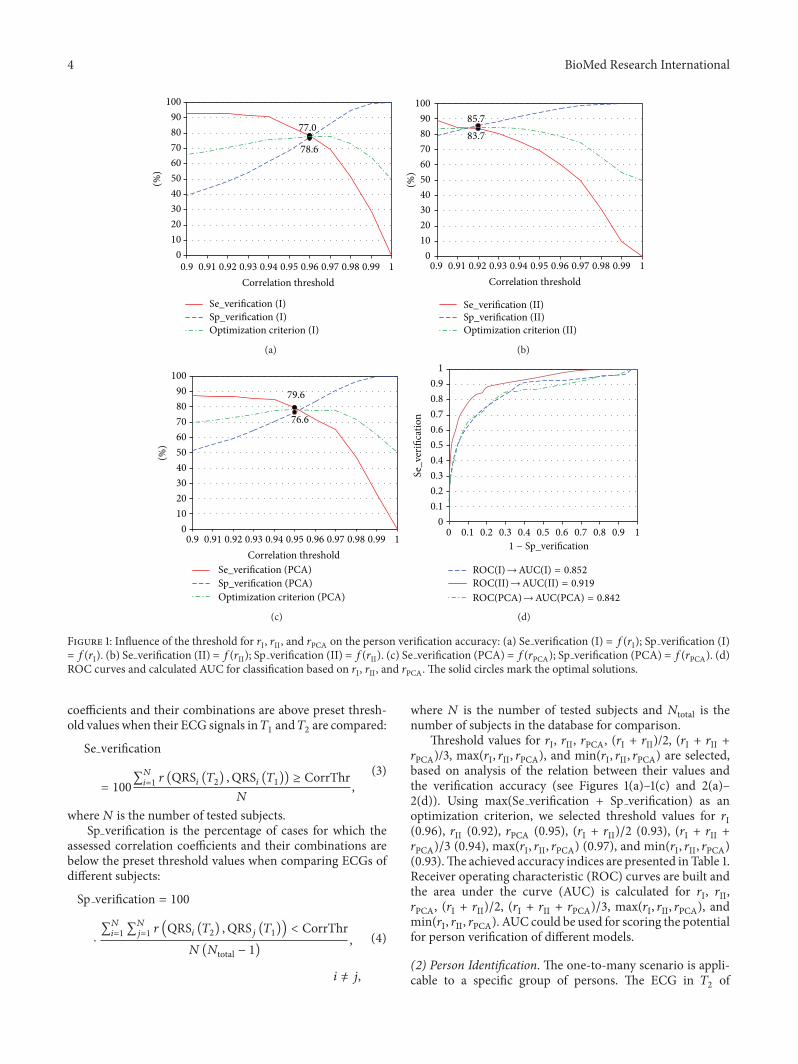
Figure 1: Influence of the threshold for 𝑟I, 𝑟II, and 𝑟PCA on the person verification accuracy: (a) Se verification (I) = 𝑓(𝑟I); Sp verification (I)= 𝑓(𝑟I). (b) Se verification (II) = 𝑓(𝑟II); Sp verification (II) = 𝑓(𝑟II). (c) Se verification (PCA) = 𝑓(𝑟PCA); Sp verification (PCA) = 𝑓(𝑟PCA). (d)ROC curves and calculated AUC for classification based on 𝑟I, 𝑟II, and 𝑟PCA. The solid circles mark the optimal solutions.
coefficients and their combinations are above preset thresh-old values when their ECG signals in𝑇
1and𝑇2are compared:
Se verification
= 100
∑𝑁
𝑖=1𝑟 (QRS
𝑖(𝑇2) ,QRS
𝑖(𝑇1)) ≥ CorrThr
𝑁
,
(3)
where𝑁 is the number of tested subjects.Sp verification is the percentage of cases for which the
assessed correlation coefficients and their combinations arebelow the preset threshold values when comparing ECGs ofdifferent subjects:
Sp verification = 100
⋅
∑𝑁
𝑖=1∑𝑁
𝑗=1𝑟 (QRS
𝑖(𝑇2) ,QRS
𝑗(𝑇1)) < CorrThr
𝑁(𝑁total − 1),
𝑖 = 𝑗,
(4)
where 𝑁 is the number of tested subjects and 𝑁total is thenumber of subjects in the database for comparison.
Threshold values for 𝑟I, 𝑟II, 𝑟PCA, (𝑟I + 𝑟II)/2, (𝑟I + 𝑟II +𝑟PCA)/3, max(𝑟I, 𝑟II, 𝑟PCA), and min(𝑟I, 𝑟II, 𝑟PCA) are selected,based on analysis of the relation between their values andthe verification accuracy (see Figures 1(a)–1(c) and 2(a)–2(d)). Using max(Se verification + Sp verification) as anoptimization criterion, we selected threshold values for 𝑟I(0.96), 𝑟II (0.92), 𝑟PCA (0.95), (𝑟I + 𝑟II)/2 (0.93), (𝑟I + 𝑟II +𝑟PCA)/3 (0.94), max(𝑟I, 𝑟II, 𝑟PCA) (0.97), and min(𝑟I, 𝑟II, 𝑟PCA)(0.93).The achieved accuracy indices are presented in Table 1.Receiver operating characteristic (ROC) curves are built andthe area under the curve (AUC) is calculated for 𝑟I, 𝑟II,𝑟PCA, (𝑟I + 𝑟II)/2, (𝑟I + 𝑟II + 𝑟PCA)/3, max(𝑟I, 𝑟II, 𝑟PCA), andmin(𝑟I, 𝑟II, 𝑟PCA). AUC could be used for scoring the potentialfor person verification of different models.
(2) Person Identification. The one-to-many scenario is appli-cable to a specific group of persons. The ECG in 𝑇
2of

BioMed Research International 5
87.8
85.6
0102030405060708090
100
0.9 0.91 0.92 0.93 0.94 0.95 0.96 0.97 0.98 0.99 1Correlation threshold
(%)
Optimization criterion (I + II)Sp_verification (I + II)Se_verification (I + II)
(a)
85.7
87.4
0102030405060708090
100
0.9 0.91 0.92 0.93 0.94 0.95 0.96 0.97 0.98 0.99 1Correlation threshold
(%)
Optimization criterion (I + II + PCA)Sp_verification (I + II + PCA)Se_verification (I + II + PCA)
(b)
80.6
83.0
0102030405060708090
100
0.9 0.91 0.92 0.93 0.94 0.95 0.96 0.97 0.98 0.99 1Correlation threshold
(%)
Sp_verification (max(I, II, PCA))(I, II, PCA))
Se_verification (max(I, II, PCA))
Optimization criterion (max
(c)
Sp_verification (min(I, II, PCA))Se_verification (min(I, II, PCA))
Optimization criterion (min
77.6
92.7
0102030405060708090
100
0.9 0.91 0.92 0.93 0.94 0.95 0.96 0.97 0.98 0.99 1
(%)
Correlation threshold
(I, II, PCA))
(d)
ROC(min(I, II, PCA))→AUC(min(I, II, PCA)) = 0.905
00.10.20.30.40.50.60.70.80.9
1
0 0.1 0.2 0.3 0.4 0.5 0.6 0.7 0.8 0.9 11 − Sp_verification
ROC(I + II)→AUC(I + II) = 0.926
ROC(max(I, II, PCA))→AUC(max(I, II, PCA)) = 0.864ROC(I + II + PCA)→AUC(I + II + PCA) = 0.906
Se_v
erifi
catio
n
(e)
Figure 2: Influence of the threshold for (𝑟I + 𝑟II)/2, (𝑟I + 𝑟II + 𝑟PCA)/3, max(𝑟I, 𝑟II, 𝑟PCA), and min(𝑟I, 𝑟II, 𝑟PCA) on the person verificationaccuracy: (a) Se verification (I + II) = 𝑓((𝑟I + 𝑟II)/2); Sp verification (I + II) = 𝑓((𝑟I + 𝑟II)/2). (b) Se verification (I + II + PCA) = 𝑓((𝑟I + 𝑟II +𝑟PCA)/3); Sp verification (I + II + PCA) = 𝑓((𝑟I + 𝑟II + 𝑟PCA)/3). (c) Se verification (max(𝑟I, 𝑟II, 𝑟PCA)) = 𝑓(max(𝑟I, 𝑟II, 𝑟PCA)); Sp verification(max(𝑟I, 𝑟II, 𝑟PCA)) = 𝑓(max(𝑟I, 𝑟II, 𝑟PCA)). (d) Se verification (min(𝑟I, 𝑟II, 𝑟PCA)) = 𝑓(min(𝑟I, 𝑟II, 𝑟PCA)); Sp verification (min(𝑟I, 𝑟II, 𝑟PCA)) =𝑓(min(𝑟I, 𝑟II, 𝑟PCA)). (e) ROC curves and calculated AUC for classification based on 𝑟I + 𝑟II, 𝑟I + 𝑟II + 𝑟PCA, min(𝑟I, 𝑟II, 𝑟PCA), and max(𝑟I, 𝑟II,𝑟PCA). The solid circles mark the optimal solutions.
6 BioMed Research International
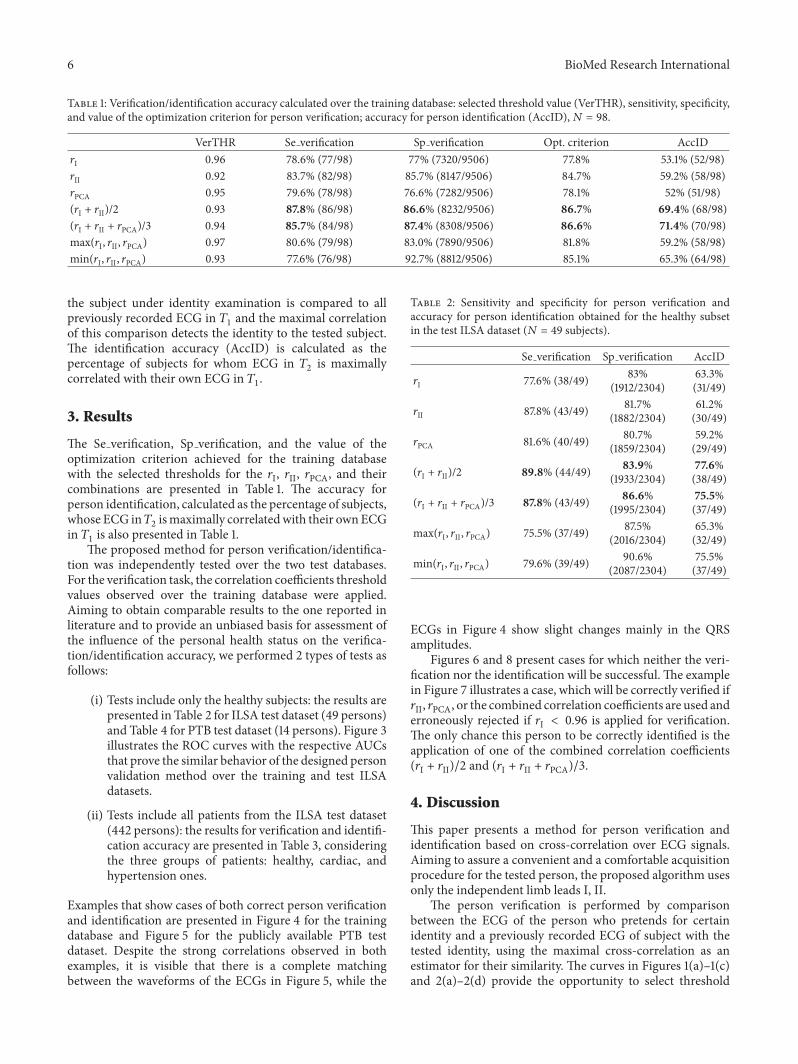
Table 1: Verification/identification accuracy calculated over the training database: selected threshold value (VerTHR), sensitivity, specificity,and value of the optimization criterion for person verification; accuracy for person identification (AccID),𝑁 = 98.
VerTHR Se verification Sp verification Opt. criterion AccID𝑟I 0.96 78.6% (77/98) 77% (7320/9506) 77.8% 53.1% (52/98)𝑟II 0.92 83.7% (82/98) 85.7% (8147/9506) 84.7% 59.2% (58/98)𝑟PCA 0.95 79.6% (78/98) 76.6% (7282/9506) 78.1% 52% (51/98)(𝑟I + 𝑟II)/2 0.93 87.8% (86/98) 86.6% (8232/9506) 86.7% 69.4% (68/98)(𝑟I + 𝑟II + 𝑟PCA)/3 0.94 85.7% (84/98) 87.4% (8308/9506) 86.6% 71.4% (70/98)max(𝑟I, 𝑟II, 𝑟PCA) 0.97 80.6% (79/98) 83.0% (7890/9506) 81.8% 59.2% (58/98)min(𝑟I, 𝑟II, 𝑟PCA) 0.93 77.6% (76/98) 92.7% (8812/9506) 85.1% 65.3% (64/98)
the subject under identity examination is compared to allpreviously recorded ECG in 𝑇
1and the maximal correlation
of this comparison detects the identity to the tested subject.The identification accuracy (AccID) is calculated as thepercentage of subjects for whom ECG in 𝑇
2is maximally
correlated with their own ECG in 𝑇1.
3. Results
The Se verification, Sp verification, and the value of theoptimization criterion achieved for the training databasewith the selected thresholds for the 𝑟I, 𝑟II, 𝑟PCA, and theircombinations are presented in Table 1. The accuracy forperson identification, calculated as the percentage of subjects,whose ECG in𝑇
2ismaximally correlatedwith their ownECG
in 𝑇1is also presented in Table 1.
The proposed method for person verification/identifica-tion was independently tested over the two test databases.For the verification task, the correlation coefficients thresholdvalues observed over the training database were applied.Aiming to obtain comparable results to the one reported inliterature and to provide an unbiased basis for assessment ofthe influence of the personal health status on the verifica-tion/identification accuracy, we performed 2 types of tests asfollows:
(i) Tests include only the healthy subjects: the results arepresented in Table 2 for ILSA test dataset (49 persons)and Table 4 for PTB test dataset (14 persons). Figure 3illustrates the ROC curves with the respective AUCsthat prove the similar behavior of the designed personvalidation method over the training and test ILSAdatasets.
(ii) Tests include all patients from the ILSA test dataset(442 persons): the results for verification and identifi-cation accuracy are presented in Table 3, consideringthe three groups of patients: healthy, cardiac, andhypertension ones.
Examples that show cases of both correct person verificationand identification are presented in Figure 4 for the trainingdatabase and Figure 5 for the publicly available PTB testdataset. Despite the strong correlations observed in bothexamples, it is visible that there is a complete matchingbetween the waveforms of the ECGs in Figure 5, while the
Table 2: Sensitivity and specificity for person verification andaccuracy for person identification obtained for the healthy subsetin the test ILSA dataset (𝑁 = 49 subjects).
Se verification Sp verification AccID
𝑟I 77.6% (38/49) 83%(1912/2304)
63.3%(31/49)
𝑟II 87.8% (43/49) 81.7%(1882/2304)
61.2%(30/49)
𝑟PCA 81.6% (40/49) 80.7%(1859/2304)
59.2%(29/49)
(𝑟I + 𝑟II)/2 89.8% (44/49) 83.9%(1933/2304)
77.6%(38/49)
(𝑟I + 𝑟II + 𝑟PCA)/3 87.8% (43/49) 86.6%(1995/2304)
75.5%(37/49)
max(𝑟I, 𝑟II, 𝑟PCA) 75.5% (37/49) 87.5%(2016/2304)
65.3%(32/49)
min(𝑟I, 𝑟II, 𝑟PCA) 79.6% (39/49) 90.6%(2087/2304)
75.5%(37/49)
ECGs in Figure 4 show slight changes mainly in the QRSamplitudes.
Figures 6 and 8 present cases for which neither the veri-fication nor the identification will be successful. The examplein Figure 7 illustrates a case, which will be correctly verified if𝑟II, 𝑟PCA, or the combined correlation coefficients are used anderroneously rejected if 𝑟I < 0.96 is applied for verification.The only chance this person to be correctly identified is theapplication of one of the combined correlation coefficients(𝑟I + 𝑟II)/2 and (𝑟I + 𝑟II + 𝑟PCA)/3.
4. Discussion
This paper presents a method for person verification andidentification based on cross-correlation over ECG signals.Aiming to assure a convenient and a comfortable acquisitionprocedure for the tested person, the proposed algorithm usesonly the independent limb leads I, II.
The person verification is performed by comparisonbetween the ECG of the person who pretends for certainidentity and a previously recorded ECG of subject with thetested identity, using the maximal cross-correlation as anestimator for their similarity. The curves in Figures 1(a)–1(c)and 2(a)–2(d) provide the opportunity to select threshold

BioMed Research International 7
Table 3: Sensitivity and specificity for person verification, together with the accuracy for person identification, obtained for the entire testILSA dataset (𝑁 = 442 subjects), considering the health status of the tested subjects.
Se verification (%) Sp verification (%) AccID (%)Healthy Card Hypt Healthy Card Hypt Healthy Card Hypt
𝑟I 77.6% 74.9% 76.1% 82.8% 87.9% 81.4% 38.8% 46.3% 46.3%𝑟II 87.8% 77.7% 78.9% 85.4% 90.8% 86.7% 42.9% 52.0% 44.5%𝑟PCA 81.6% 80.0% 79.4% 81.6% 85.0% 78.9% 42.9% 48.0% 41.3%(𝑟I + 𝑟II)/2 89.8% 86.3% 82.6% 86.6% 91.8% 87.0% 59.2% 60.6% 53.7%(𝑟I + 𝑟II + 𝑟PCA)/3 87.8% 78.3% 79.8% 88.9% 92.9% 88.4% 61.2% 62.3% 54.6%max(𝑟I, 𝑟II, 𝑟PCA) 75.5% 73.1% 74.8% 87.4% 90.9% 85.8% 42.9% 57.7% 46.8%min(𝑟I, 𝑟II, 𝑟PCA) 79.6% 69.7% 71.6% 92.6% 95.6% 92.9% 59.2% 54.9% 49.5%
Se_v
erifi
catio
n
00.10.20.30.40.50.60.70.80.9
1
0 0.1 0.2 0.3 0.4 0.5 0.6 0.7 0.8 0.9 11 − Sp_verification
ROC(PCA) →AUC(PCA) = 0.886ROC(II) →AUC(II) = 0.913ROC(I) →AUC(I) = 0.871
ILSA testSe
_ver
ifica
tion
00.10.20.30.40.50.60.70.80.9
1
0 0.1 0.2 0.3 0.4 0.5 0.6 0.7 0.8 0.9 11 − Sp_verification
ROC(I + II + PCA)→AUC(I + II + PCA) = 0.921ROC(I + II)→AUC(I + II) = 0.922
ROC(min(I , II, PCA))→AUC(min(I, II, PCA)) = 0.923ROC(max(I, II, PCA))→AUC(max(I, II, PCA)) = 0.871
ILSA test
(a)
Se_v
erifi
catio
n
00.10.20.30.40.50.60.70.80.9
1
0 0.1 0.2 0.3 0.4 0.5 0.6 0.7 0.8 0.9 11 − Sp_verification
ROC(PCA) →AUC(PCA) = 0.944ROC(II) →AUC(II) = 0.954ROC(I) →AUC(I) = 0.956
PTB test
Se_v
erifi
catio
n
00.10.20.30.40.50.60.70.80.9
1
0 0.1 0.2 0.3 0.4 0.5 0.6 0.7 0.8 0.9 11 − Sp_verification
ROC(I + II + PCA)→AUC(I + II + PCA) = 0.974ROC(I + II)→AUC(I + II) = 0.975
ROC(min(I , II, PCA))→AUC(min(I, II, PCA)) = 0.982ROC(max(I, II, PCA))→AUC(max(I, II, PCA)) = 0.933
PTB test
(b)
Figure 3: ROC curves and calculated AUCs for the test datasets: (a) ILSA test dataset (healthy subjects), (b) PTB healthy controls.

8 BioMed Research International
Table 4: Sensitivity and specificity for person verification andaccuracy for person identification over the test PTB dataset (𝑁 = 14subjects).
Se verification Sp verification AccID
𝑟I 85.7% (12/14) 91.2% (166/182) 92.9%(13/14)
𝑟II 100% (14/14) 69.8% (127/182) 92.9%(13/14)
𝑟PCA 92.9% (13/14) 75.3% (137/182) 78.6%(11/14)
(𝑟I + 𝑟II)/2 100% (14/14) 81.9% (149/182) 92.9%(13/14)
(𝑟I + 𝑟II + 𝑟PCA)/3 92.9% (13/14) 83.0% (151/182) 85.7%(12/14)
max(𝑟I, 𝑟II, 𝑟PCA) 78.6% (11/14) 87.4% (159/182) 78.6%(11/14)
min(𝑟I, 𝑟II, 𝑟PCA) 92.9% (13/14) 90.7% (165/182) 92.9%(13/14)
0
1000
I (A
DC
units
)II
(AD
C un
its)
0
500
0
500
1000
PCA
(AD
C un
its)
0 100 200 300 400 500 600Samples
0 100 200 300 400 500 600Samples
0 100 200 300 400 500 600Samples
−1000
−500
ILSA: patient number 3 versus 3
ILSA: patient number 3 versus 3
ILSA: patient number 3 versus 3 rI = 0.99437
rII = 0.98104
rPCA = 0.99457
Figure 4: Subject 3 from the ILSA database. The strong correlation(>0.98) between the P-QRS-T waveforms of this person of thetraining set in 𝑇
1(blue solid line) and 𝑇
2(red dashed line) assures
both correct verification and correct identification.The time intervalbetween the recordings of ECG in 𝑇
1and 𝑇
2is about 5 years.
values for 𝑟I, 𝑟II, 𝑟PCA, (𝑟I + 𝑟II)/2, (𝑟I + 𝑟II + 𝑟PCA)/3, max(𝑟I,𝑟II, 𝑟PCA), andmin(𝑟I, 𝑟II, 𝑟PCA) depending on the application.Lower thresholds are suitable when low rejection rate (highsensitivity) is required at the expense of increased erroneousverifications. On the other side, the higher threshold valuesguarantee high security combined with higher rejection rate.Depending on the exact task that has to be solved, one candecide threshold values of the applied correlation coefficients.The ROC curves andAUCs presented in Figures 1(d) and 2(e)illustrate the behavior of the models over the train dataset.
0 100 200 300 400 500 600Samples
700 800 900
0 100 200 300 400 500 600Samples
700 800 900
0 100 200 300 400 500 600Samples
700 800 900
0
2000
I (A
DC
units
)II
(AD
C un
its)
0
2000
4000
PCA
(AD
C un
its)
−2000
0
2000
−2000
PTB: patient number 117 versus 117
PTB: patient number 117 versus 117
PTB: patient number 117 versus 117 rI = 0.99719
rII = 0.99776
rPCA = 0.99794
Figure 5: Subject 117 from the PTB database.The strong correlation(>0.99) between the P-QRS-T waveforms of this person in 𝑇
1(blue
solid line) and 𝑇2(red dashed line) assures both correct verification
and correct identification.The time interval between the recordingsof ECG in 𝑇
1and 𝑇
2is less than 24 hours.
According to [22], AUC higher than 0.9 is an approximateindication of an excellent classifier.
The person identification is performed by computing thecorrelation between the ECG of the subject under exami-nation and a previously collected ECG database. The testedperson is identified according to the maximal correlation to asubject in the database.
Considering the accuracy results (Tables 1, 2, and 3) overthe training and test ILSA database and the AUCs (Figures1(d) and 3), 𝑟II seems more reliable for person verificationthan 𝑟I. However, this observation is not confirmed by theresults over the test PTB database (Table 4, Sp verification <70%). Although the first PCA component presents a combi-nation between leads I and II, 𝑟PCA do not lead to verificationaccuracy increase neither for the training nor for the testdatabases. Generally, the best verification/identification accu-racy is achieved with the combined correlation coefficients(𝑟I + 𝑟II)/2, (𝑟I + 𝑟II + 𝑟PCA)/3 that also present AUCs higherthan 0.9 (Figure 2(e) for training, Figure 3 for testing).This isin concord with the results of Poree et al. [7], who reportedaccuracy increase when more ECG leads are involved in theanalysis.
Considering the verification/identification of healthy per-sons, the following observations can be pointed out:
(i) There is comparable verification accuracy for bothtraining and test part of ILSA database (Table 1versus Table 2, AUCs in Figures 1(d) and 2(e) versusFigure 3).
(ii) The identification accuracy is higher in the healthyECG-ILSA test set (𝑁 = 49 Table 2) than in thelearning set (𝑁 = 98, Table 1).

BioMed Research International 9
Samples0 100 200 300 400 500
Samples0 100 200 300 400 500
Samples0 100 200 300 400 500
0
1000
I (A
DC
units
)
0
500
II (A
DC
units
)
0
500
1000
PCA
(AD
C un
its)
−1000
−500
ILSA: patient number 16 versus 16
ILSA: patient number 16 versus 16
ILSA: patient number 16 versus 16 rI = 0.94581
rII = 0.91934
rPCA = 0.94974
(a)
Samples
Samples
0 50 100 150 200 250 300 350 400 450
Samples0 50 100 150 200 250 300 350 400 450
0 100 200 300 400 500
0
500
1000
PCA
(AD
C un
its)
0
1000
I (A
DC
units
)
0
500
II (A
DC
units
)
−1000
−500
ILSA: patient number 16 versus 37
ILSA: patient number 16 versus 312
ILSA: patient number 16 versus 466 Max(rI) = 0.98987
Max(rII) = 0.97594
Max(rPCA) = 0.98521
(b)
Figure 6: Subject 16 from the test part of ILSA database. (a) The assessed correlation coefficients 𝑟I < 0.946, 𝑟II = 0.919, and 𝑟PCA < 0.949 arebelow the preset threshold values (0.96, 0.92, and 0.95, resp.) and the identity of this person will not be verified neither by means of 𝑟I, 𝑟II,and 𝑟PCA nor by applying any of their combinations. (b) This subject will be identified as subjects 466 (Max(𝑟I) ∼ 0.99, max(𝑟I, 𝑟II, 𝑟PCA) =0.99); 312 (Max(𝑟II) ∼ 0.98), 37 (Max(𝑟PCA) ∼ 0.99); 134 ((𝑟I + 𝑟II)/2 = 0.95, (𝑟I + 𝑟II + 𝑟PCA)/3 = 0.96); or 439 (min(𝑟I, 𝑟II, 𝑟PCA) = 0.94). Whenthe patient’s ECG is compared to his own previously recorded ECG (𝑟I + 𝑟II)/2 = 0.93, (𝑟I + 𝑟II + 𝑟PCA)/3 = 0.94, max(𝑟I, 𝑟II, 𝑟PCA) = 0.95, andmin(𝑟I, 𝑟II, 𝑟PCA) = 0.92.
Samples0 50 100 150 200 250 300 350 400 450
Samples0 50 100 150 200 250 300 350 400 450
Samples0 50 100 150 200 250 300 350 400 450
II (A
DC
units
)
0
500
PCA
(AD
C un
its)
I (A
DC
units
)
0
500
−500
0
500
−500
ILSA: patient number 124 versus 124
ILSA: patient number 124 versus 124
ILSA: patient number 124 versus 124 rI = 0.95436
rII = 0.97367
rPCA = 0.96321
(a)
Samples0 50 100 150 200 250 300 350 400 450
Samples0 50 100 150 200 250 300 350 400 450
0 50 100 150 200 250 300 350 4000
500
PCA
(AD
C un
its)
Samples
0
1000
I (A
DC
units
)
0
500
II (A
DC
units
)
−1000
−500
ILSA: patient number 124 versus 240
ILSA: patient number 124 versus 528
ILSA: patient number 124 versus 320 Max(rI) = 0.98184
Max(rII) = 0.97931
Max(rPCA) = 0.97632
(b)
Figure 7: Subject 124 from the training part of ILSA database. Considering the independent correlation coefficients 𝑟I, 𝑟II, and 𝑟PCA, thissubject will be identified either as subjects 320 (Max(𝑟I) = 0.98, max(𝑟I, 𝑟II, 𝑟PCA) = 0.98), 528 (Max(𝑟II) = 0.979), 240 (𝑟PCA = 0.98) or assubject 255 (min(𝑟I, 𝑟II, 𝑟PCA) = 0.96). However, the combined correlation coefficients (𝑟I + 𝑟II)/2, (𝑟I + 𝑟II + 𝑟PCA)/3 both have maximal valuesof 0.96 when the ECG in 𝑇
2of this person is compared to his own ECG in 𝑇
1.

10 BioMed Research International
Samples
Samples
II (A
DC
units
)
0 100 200 300 400 500 600 700 800
0 100 200 300 400 500 600 700 800
Samples0 100 200 300 400 500 600 700 800
0
1000
2000
PCA
(AD
C un
its)
0
2000
−2000
I (A
DC
units
)
0
500
−500
PTB: patient number 174 versus 174
PTB: patient number 174 versus 174
PTB: patient number 174 versus 174 rI = 0.92981
rII = 0.94245
rPCA = 0.93913
(a)
Samples0 100 200 300 400 500 600 700 800 900
Samples0 100 200 300 400 500 600 700 800 900
Samples0 100 200 300 400 500 600 700 800 900
0
1000
2000
PCA
(AD
C un
its)
II (A
DC
units
)
0
2000
−2000
I (A
DC
units
)
0
500
−500
PTB: patient number 174 versus 236
PTB: patient number 174 versus 236
PTB: patient number 174 versus 233 Max(rI) = 0.9563
Max(rII) = 0.9586
Max(rPCA) = 0.94002
(b)
Figure 8: Subject 174 from the PTB database-time interval between the recordings of ECG in𝑇1and𝑇
2is 59 days. (a)The assessed correlation
coefficients 𝑟I = 0.93 and 𝑟PCA = 0.94 are below the preset threshold values (0.96 and 0.95, resp.) and the identity of this person will not beverified. (b) This subject will be identified as 233 according to Max(𝑟I) ∼ 0.96, (𝑟I + 𝑟II)/2 = 0.95, (𝑟I + 𝑟II + 𝑟PCA)/3 = 0.95, min(𝑟I, 𝑟II, 𝑟PCA) =0.94, or as 236 if Max(𝑟II) ∼ 0.96, Max(𝑟PCA) ∼ 0.97, and max(𝑟I, 𝑟II, 𝑟PCA) = 0.97 are considered. When the patient’s ECG is compared to hisown previously recorded ECG (𝑟I + 𝑟II)/2 = 0.94, (𝑟I + 𝑟II + 𝑟PCA)/3 = 0.94, max(𝑟I, 𝑟II, 𝑟PCA) = 0.94, and min(𝑟I, 𝑟II, 𝑟PCA) = 0.93.
(iii) There is lower identification accuracy for the test ILSAdataset when all ECGs in the ECG-ILSA test set (𝑁 =442) are used as database for comparison (Table 3versus Tables 1 and 2).
(iv) There is higher verification/identification accuracyfor the test PTB dataset compared to the ECG-ILSAtraining and test sets.
These observations can be motivated by the followingremarks:
(i) The better verification accuracy for the test PTBdataset can be explained by the shorter temporalinterval between the two acquisition times 𝑇
1and
𝑇2, compared to the temporal interval of 5 years in
the ECG ILSA database which is in concord withthe observations in [14]. In fact the 14 subjects arecharacterized by
(a) (𝑇2− 𝑇1) < 24 hours in 7 cases,
(b) (𝑇2− 𝑇1) < 1 month in 2 patients,
(c) (𝑇2− 𝑇1) > 1 and < 3 months in 2 patients,
(d) (𝑇2− 𝑇1) > 6 months for 3 patients.
(ii) The identification accuracy is influenced by the num-ber of records in the testing set, and, consequentlywith reduced number of patients, it is possible toobtain higher values. In fact, the PTB database withonly 14 records produces better identification accu-racy (92.9% with (𝑟I + 𝑟II)/2 in Table 4) if comparedwith the test set of 49 healthy people of the ECG-ILSA
database (Table 2) or if comparedwith all 442 subjectsof the test set (Table 3). This behavior is in agreementwith the study of Zokaee and Faez [10] where theincreasing from 10 to 50 of the number of ECGs inthe test dataset produced decreasing of the accuracyof about 10% (from 98.6% to 89%).
In literature there are only few studies [5] which consider theECG biometric recognition in the presence of cardiac irreg-ularity conditions, although they were performed mainlywith single day sessions. Consequently, the present workrepresents a significant test on the influence of the personalhealth status for the verification/identification accuracy in thepresence of long term interval recordings.
Our observations for cardiac and hypertension personsare as follows.
Considering the (𝑟I + 𝑟II)/2 classification method, thevalidation procedure on the entire test set of 442 healthy andnonhealthy patients, some observations can be performed asfollows:
(i) The hypertension group (Table 3) shows lowerSe verification (82.6%) and AccID (53.7%) comparedto the healthy and cardiac groups (resp., 89.8%, 86.3%and 59.2%, 60.6%).
(ii) The cardiac group shows a slight improvement inAccID (60.6%) and in Sp verification (91.8%) in com-parison with the healthy group (59.2% and 86.6%).
These results show the robustness of the proposed classi-fication method for person identification and verification,

BioMed Research International 11
Table 5: Comparison between verification/identification accuracy achieved by the proposed method over the test dataset and the resultsreported by other authors with different databases used (db). The number of ECG recordings per patient (1 rpp for one and mrpp for more)and the acquisition interval (acq int) on the same patient are reported.
Method Database Accuracy
Agrafioti and Hatzinakos, 2009 [5]MIT-BIH normal sinusMIT-BIH arrhythmia 1 rppPTB db, 13 healthy subjects mrpp
AccID = 96.2%Sp ver = 99%Se ver = 87%
Israel et al., 2005 [3] Own db: 29 subjectsclose in time recordings AccID = 100%
Lourenco et al., 2011 [13] Own db: 16 subjectsclose in time recordings
AccID = 94.3%Se = Sp = 87%
Sidek et al., 2012 [11] Own db: 30 healthy subj., close in time recordings AccID = 96.1%
Wang et al., 2008 [4] MIT-BIH normal sinus 1 rppPTB db, 13 healthy subj. mrpp AccID = 100%
Zhao et al., 2013 [1] MIT-BIH ST change db, long-term ST db 1 rpp;PTB db, 12 healthy subj. mrpp
AccID (tot) = 95.6%AccID (PTB) = 96%
Zokaee and Faez, 2012 [10] MIT-BIH db 1 rppOwn Holter, 50 subjects 1 rpp
AccID = 100%AccID = 89%
Poree et al., 2011 [7] Own db: 11 subjects, mrpp, acq int = 16 months AccID = 91.4%Lee et al., 2012 [23] Own db: 10 subjects, ∼100 rpp within 3-month period AccID = 99.5%
Wubbeler et al., 2007 [8] db from 74 subjects, mrpp, acq int = 16 months AccID = 98.1%Se = Sp = 97.2%
Our method(based on assessment of (𝑟I + 𝑟II)/2)
Test ILSA db, 49 healthy subjects mrppAccID = 77.6%Se ver = 89.8%Sp ver = 83.9%
Test PTB db, 14 healthy subjects mrppAccID = 92.9%Se ver = 100%Sp ver = 81.9%
although the obtained results are probably not effective forreal applications. It is interesting to consider the classificationof some examples with or without problematic identifica-tion/verification.
The example in Figure 5 shows strong correlationbetween 2 ECG recordings of one subject from thetest database that lead to unconditional correct personverification and identification. It should be mentioned,however, that both ECGs are recorded within time intervalless than 24 hours. High values of the correlation coefficientsare also observed for ECG recordings with temporal intervalof several years (see the example in Figure 4); however, forsuch cases the expected ECG changes are visible.
On the other pole, the examples in Figures 6 and 8 presentaligned P-QRS-T segments of subjects, for whommost of thecorrelation coefficients are below the thresholds for personverification. Moreover, the ECGs of these people are morecorrelated with ECGs of other members in the datasets usedfor comparison which leads to incorrect identification.
The example in Figure 7 proves the advantages of thecombined correlation coefficients (𝑟I + 𝑟II)/2 and (𝑟I +𝑟II + 𝑟PCA)/3 that prevent erroneous identifications whenstrong correlation with a wrong ECG from the database forcomparison is observed only in lead I, lead II, or the first PCAcomponent.
Considering the differences in the verification/identifica-tion accuracy over the training and test databases, aswell as the presented examples for correct and erroneous
verification, we can conclude that the changes appearingin ECG with time could affect the accuracy of personverification/identification. This is also confirmed by thecomparison between our results on healthy persons andthe results reported in literature (see Table 5). It is obviousthat the studies using only close in time ECG recordings[3, 10, 11] report higher identification and/or verificationperformances. The direct comparison to studies that usethe healthy controls in PTB database is not possible, sincethe authors have applied their methods on part of thehealthy persons (12 or 13 from all 14 patients) and havemixed them with cases that do not have separated in timeECGs. Nevertheless, our results could be positively comparedwith studies for the identification task which consider ECGdatasets with comparable size and similar temporal intervalbetween the 1st and the 2nd recording [1, 5, 7, 10].
The ECG variability within small time interval could bedue to electrode position variation between the two record-ings. Even a meal can cause considerable ECG changes, bothin healthy people and in cardiac patients. ECG recordingsacquired one or more years apart show larger intraindividualvariability. Sources such as age, weight, and heart positionthen come into play, in addition to the sources already havingeffect on smaller time scales. The influences of different fac-tors on the intraindividual ECG variability are summarizedby Schijvenaars [24]. In healthy people, the most prominentchanges after a standard meal are an increase of heart rate,a decrease of T-wave amplitude and QT interval, and small
12 BioMed Research International
left axis shifts of the QRS and T-axes. The influences ofage, weight, and heart position are often interdependent;the heart position becomes more horizontal when one gainsweight, people generally gain some weight as years pass,and so forth. The general trend is a decrease in amplitudesand a left axis shift in frontal QRS axis with increasing ageor weight. The general age trends found among adults aredecrease of precordial amplitudes (QRS spatial magnitudedecreases with approximately 8% per decade), a leftward shiftof the frontal plane axis (approximately 10∘ per decade), and amore anterior axis in the horizontal plane. Interval durations’increase for PR andQT interval and decrease inQRSdurationare also observed.
Considering the above mentioned sources of ECG vari-ability, as well as our observations over the training and testdatabases, we conclude the following.
(i) Aiming at higher identification accuracy, the databasefor comparison (TrainSet1, TestSet1) should be keptas small as possible for the particular application andshould be updated with actual ECG recordings.
(ii) Aiming at higher verification accuracy, the ECGrecordings in the database for comparison should beupdated on a regular basis (as short as possible, e.g.,every time when the person passes through bordercontrol). The new ECG could replace the old one,after verification, or could be added to a personalfolder with a reasonable size. This would guaranteehigher values of Se verification andwould provide theopportunity to increase the threshold values for thecorrelation coefficients which in turn would increaseSp verification.
5. Conclusions
This paper studies the reliability of the ECG signal for personverification/identification. The population based ECG-ILSAdatabase of 540 patients (147 healthy subjects, 175 patientswith cardiac diseases, and 218 with hypertension) has beenconsidered for the validation procedure. For a more robustvalidation procedure, considering the temporal variabilityof ECG signal and/or modifications in the pathologies, thelearning phase was performed only in the healthy group, andthe testing procedures have been performed also with non-healthy patients. The proposed method relies on assessmentof correlation coefficients as well as their linear and nonlin-ear combinations and provides 100% verification sensitivitycombined with 18.1% erroneous verification rate in the PTBdatabase, a widely used test set in literature, with a relativelyshort temporal interval of ECG acquisition and a limitednumber of healthy subjects (𝑁 = 14). This dataset producesan identification accuracy of 92.9%. The test set of healthysubjects in the ECG-ILSA database (𝑁 = 49) producesa lower verification sensitivity (89.8%) and identificationaccuracy (77.6%) but a better erroneous verification rate(16.1%). For cardiac and hypertension patients we observedecreased sensitivity and increased specificity for verification.Considering the identification task, our conclusions are that
the accuracy depends generally on the size of the database forcomparison, but not on the person’s health status.
Although the ECG is considered to be strongly individualbiometric feature, this study shows that there are somechanges over time that could prevent correct individualverification, and two healthy persons could have similarECGs that could lead to incorrect identification. This posesrequirements towards the database stored for comparison,such as size of the database and maximal time intervalbetween the tested ECG and the ECG stored in this database.Despite these limitations, the ECG has the indisputableadvantage to be not susceptible to falsification. It seemsto be a reliable biometric characteristic for specific accesscontrol applications, which operatewith smaller databases forcomparison.
Although there are several limitations in this methodol-ogy, which can prevent its use in real practice, it could bepossible to overcome the drawbacks with the inclusion ofsome demographic/personal information in the classificationprocess for obtaining “certain” identification. Moreover, thisstudy proves the potential of ECG application for increasingthe reliability of person verification and identification basedon biometrical information from other sources.
Conflict of Interests
The authors declare that there is no conflict of interestsregarding the publication of this paper.
Acknowledgment
This study is supported by Bulgarian National Science Fund,Grant no. T02/11.
References
[1] Z. Zhao, L. Yang, D. Chen, and Y. Luo, “A human ECG identi-fication system based on ensemble empirical mode decomposi-tion,” Sensors, vol. 13, no. 5, pp. 6832–6864, 2013.
[2] L. Biel, O. Pettersson, L. Philipson, and P. Wide, “ECG analysis:a new approach in human identification,” IEEE Transactions onInstrumentation and Measurement, vol. 50, no. 3, pp. 808–812,2001.
[3] S. A. Israel, J. M. Irvine, A. Cheng, M. D.Wiederhold, and B. K.Wiederhold, “ECG to identify individuals,” Pattern Recognition,vol. 38, no. 1, pp. 133–142, 2005.
[4] Y. Wang, F. Agrafioti, D. Hatzinakos, and K. N. Plataniotis,“Analysis of human electrocardiogram for biometric recogni-tion,” EURASIP Journal on Advances in Signal Processing, vol.2008, Article ID 148658, 2008.
[5] F. Agrafioti and D. Hatzinakos, “ECG biometric analysis in car-diac irregularity conditions,” Signal, Image andVideo Processing,vol. 3, no. 4, pp. 329–343, 2009.
[6] K. N. Plataniotis, D. Hatzinakos, and J. K. M. Lee, “ECG bio-metric recognition without fiducial detection,” in Proceedingsof the Biometrics Symposium: Special Session on Research at theBiometric Consortium Conference (BSYM ’06) , 2006 (BSYM’06), pp. 1–6, Baltimore, Md, USA, September 2006.
[7] F. Poree, A. Gallix, and G. Carrault, “Biometric identificationof individuals based on the ECG. Which conditions?” in

BioMed Research International 13
Proceedings of the Computing in Cardiology, vol. 38, pp. 761–764,IEEE, Hangzhou, China, September 2011.
[8] G. Wubbeler, M. Stavridis, D. Kreiseler, R.-D. Bousseljot, andC. Elster, “Verification of humans using the electrocardiogram,”Pattern Recognition Letters, vol. 28, no. 10, pp. 1172–1175, 2007.
[9] C. Ye, M. T. Coimbra, and B. V. K. V. Kumar, “Investigation ofhuman identification using two-lead Electrocardiogram (ECG)signals,” in Proceedings of the 4th IEEE International Conferenceon Biometrics: Theory, Applications and Systems (BTAS ’10),Washington, DC, USA, September 2010.
[10] S. Zokaee and K. Faez, “Human identification based on ECGand palmprint,” International Journal of Electrical andComputerEngineering, vol. 2, no. 2, pp. 261–266, 2012.
[11] K. Sidek, I. Khalil, andM. Smolen, “ECG biometric recognitionin different physiological conditions using robust normalizedQRS complexes,” in Proceedings of the Computers in Cardiology,pp. 97–100, IEEE, Krakow, Poland, September 2012.
[12] F. Poree, J. Y. Bansard, G. Kervio, and G. Carrault, “Stabilityanalysis of the 12-lead ECG morphology in different physi-ological conditions of interest for biometric applications,” inProceedings of the Computers in Cardiology, vol. 36, pp. 285–288,IEEE, Park City, Utah, USA, September 2009.
[13] A. Lourenco, H. Silva, and A. Fred, “Unveiling the biometricpotential of finger-based ECG signals,” Computational Intelli-gence and Neuroscience, vol. 2011, Article ID 720971, 8 pages,2011.
[14] I. Odinaka, P.-H. Lai, A. D. Kaplan, J. A. O’Sullivan, E. J.Sirevaag, and J. W. Rohrbaugh, “ECG biometric recognition:a comparative analysis,” IEEE Transactions on InformationForensics and Security, vol. 7, no. 6, pp. 1812–1824, 2012.
[15] A. D. C. Chan, M. M. Hamdy, A. Badre, and V. Badee,“Wavelet distance measure for person identification usingelectrocardiograms,” IEEE Transactions on Instrumentation andMeasurement, vol. 57, no. 2, pp. 248–253, 2008.
[16] S. Maggi, M. Zucchetto, F. Grigoletto et al., “The Italianlongitudinal study on aging (ILSA): design andmethods,”AgingClinical and Experimental Research, vol. 6, no. 6, pp. 464–470,1994.
[17] L. Amaducci, M. Baldereschi, A. DiCarlo et al., “Prevalence ofchronic diseases in older Italians: comparing self-reported andclinical diagnoses,” International Journal of Epidemiology, vol.26, no. 5, pp. 995–1002, 1997.
[18] G. Bortolan, M. Bressan, and F. Golferini, “Serial analysis inthe ECG-ILSA database: study of longitudinal modifications,”in Proceedings of the Computers in Cardiology, vol. 26, pp. 667–670, Hannover, Germany, September 1999.
[19] G. Bortolan, M. Bressan, F. Golferini, and ILSA Study Group,“QT dispersion in the elderly. The ILSA study,” Aging Clinicaland Experimental Research, vol. 16, no. 5, pp. 342–348, 2004.
[20] G. Bortolan, M. Bressan, and I. Christov, “Longitudinal modifi-cations of T-loop morphology,” in Proceedings of the Computersin Cardiology, vol. 29, pp. 685–688, IEEE, September 2002.
[21] I. I. Christov, “Real-time electrocardiogram QRS detectionusing combined adaptive threshold,” Biomedical EngineeringOnline, vol. 3, no. 28, pp. 1–9, 2004.
[22] F. Gorunescu, Data Mining: Concepts, Models and Techniques,Springer, Beijing, China, 2011.
[23] J. Lee, Y. Chee, and I. Kim, “Personal identification based onvectorcardiogram derived from limb leads electrocardiogram,”Journal of Applied Mathematics, vol. 2012, Article ID 904905, 12pages, 2012.
[24] B. Schijvenaars, Intra-individual variability of electrocardio-gram. Assessment and exploitation in computerized ECG analysis[Ph.D. thesis], Erasmus University Rotterdam, Rotterdam, TheNetherlands, 2000.

Submit your manuscripts athttp://www.hindawi.com
Hindawi Publishing Corporationhttp://www.hindawi.com Volume 2014
Anatomy Research International
PeptidesInternational Journal of
Hindawi Publishing Corporationhttp://www.hindawi.com Volume 2014
Hindawi Publishing Corporation http://www.hindawi.com
International Journal of
Volume 2014
Zoology
Hindawi Publishing Corporationhttp://www.hindawi.com Volume 2014
Molecular Biology International
GenomicsInternational Journal of
Hindawi Publishing Corporationhttp://www.hindawi.com Volume 2014
The Scientific World JournalHindawi Publishing Corporation http://www.hindawi.com Volume 2014
Hindawi Publishing Corporationhttp://www.hindawi.com Volume 2014
BioinformaticsAdvances in
Marine BiologyJournal of
Hindawi Publishing Corporationhttp://www.hindawi.com Volume 2014
Hindawi Publishing Corporationhttp://www.hindawi.com Volume 2014
Signal TransductionJournal of
Hindawi Publishing Corporationhttp://www.hindawi.com Volume 2014
BioMed Research International
Evolutionary BiologyInternational Journal of
Hindawi Publishing Corporationhttp://www.hindawi.com Volume 2014
Hindawi Publishing Corporationhttp://www.hindawi.com Volume 2014
Biochemistry Research International
ArchaeaHindawi Publishing Corporationhttp://www.hindawi.com Volume 2014
Hindawi Publishing Corporationhttp://www.hindawi.com Volume 2014
Genetics Research International
Hindawi Publishing Corporationhttp://www.hindawi.com Volume 2014
Advances in
Virolog y
Hindawi Publishing Corporationhttp://www.hindawi.com
Nucleic AcidsJournal of
Volume 2014
Stem CellsInternational
Hindawi Publishing Corporationhttp://www.hindawi.com Volume 2014
Hindawi Publishing Corporationhttp://www.hindawi.com Volume 2014
Enzyme Research
Hindawi Publishing Corporationhttp://www.hindawi.com Volume 2014
International Journal of
Microbiology