research article open access the first national survey of
TRANSCRIPT

Coimbra et al. BMC Public Health 2013, 13:52http://www.biomedcentral.com/1471-2458/13/52
RESEARCH ARTICLE Open Access
The First National Survey of Indigenous People’sHealth and Nutrition in Brazil: rationale,methodology, and overview of resultsCarlos EA Coimbra Jr1*, Ricardo Ventura Santos1,2, James R Welch1, Andrey Moreira Cardoso1,Mirian Carvalho de Souza3, Luiza Garnelo4, Elias Rassi5, Maj-Lis Follér6 and Bernardo L Horta7
Abstract
Background: Although case studies indicate that indigenous peoples in Brazil often suffer from higher morbidityand mortality rates than the national population, they were not included systematically in any previous nationalhealth survey. Reported here for the first time, the First National Survey of Indigenous People’s Health and Nutritionin Brazil was conducted in 2008–2009 to obtain baseline information based on a nationwide representative sample.This paper presents the study’s rationale, design and methods, and selected results.
Methods: The survey sought to characterize nutritional status and other health measures in indigenous childrenless than 5 years of age and indigenous women from 14 to 49 years of age on the basis of a survey employing arepresentative probabilistic sample of the indigenous population residing in villages in Brazil, according to fourmajor regions (North, Northeast, Central-West, and South/Southeast). Interviews, clinical measurements, andsecondary data collection in the field addressed the major topics: nutritional status, prevalence of hypertension anddiabetes mellitus in women, child hospitalization, prevalence of tuberculosis and malaria in women, access tohealth services and programs, and characteristics of the domestic economy and diet.
Results: The study obtained data for 113 villages (91.9% of the planned sample), 5,305 households (93.5%), 6,692women (101.3%), and 6,128 children (93.1%). Multiple household variables followed a pattern of greater economicautonomy and lower socioeconomic status in the North as compared to other regions. For non-pregnant women,elevated prevalence rates were encountered for overweight (30.3%), obesity (15.8%), anemia (32.7%), andhypertension (13.2%). Among children, elevated prevalence rates were observed for height-for-age deficit (25.7%),anemia (51.2%), hospitalizations during the prior 12 months (19.3%), and diarrhea during the prior week (23.6%).
Conclusions: The clinical-epidemiological parameters evaluated for indigenous women point to the accentuatedoccurrence of nutrition transition in all regions of Brazil. Many outcomes also reflected a pattern wherebyindigenous women’s and children’s health indicators were worse than those documented for the national Brazilianpopulation, with important regional variations. Observed disparities in health indicators underscore that basichealthcare and sanitation services are not yet as widely available in Brazil’s indigenous communities as they are inthe rest of the country.
Keywords: Brazil, Indigenous peoples, Health surveys, Nutrition surveys, Health status indicators, Epidemiologicmeasurements, Maternal health, Child health
* Correspondence: [email protected] Nacional de Saúde Pública, Fundação Oswaldo Cruz, Rua LeopoldoBulhões 1480, Rio de Janeiro, RJ 21041-210, BrazilFull list of author information is available at the end of the article
© 2013 Coimbra et al.; licensee BioMed Central Ltd. This is an Open Access article distributed under the terms of the CreativeCommons Attribution License (http://creativecommons.org/licenses/by/2.0), which permits unrestricted use, distribution, andreproduction in any medium, provided the original work is properly cited.

Coimbra et al. BMC Public Health 2013, 13:52 Page 2 of 19http://www.biomedcentral.com/1471-2458/13/52
BackgroundDuring the last decade international debates regarding thehealth of indigenous peoples have emphasized strategiesfor promoting health equity and reducing disparities [1-3].Comparative analyses indicate that indigenous peoples areamong the most politically and socioeconomically margin-alized segments of society in the many countries in whichthey are present [4,5]. These disparities are reflected ininequities between indigenous and non-indigenous popu-lations in relation to diverse health indicators, such asrates of illness and death from transmissible diseases,prevalence of child undernutrition, infant mortality rates,and years of potential life lost, all of which are generallymuch higher among indigenous people when compared tonon-indigenous segments of the national populationswhere they live [6-10].The global indigenous population is estimated at 370
million and indigenous peoples are present in about 90countries [11]. Of this total, about 50 million live in LatinAmerica, comprising more than 400 different ethnicgroups [5]. Of all Latin American countries, Brazil hasone of the smallest indigenous populations by percentage,
Manaus
Porto Aleg
North
Centra
Figure 1 Map of Brazil indicating indigenous reserves (shaded in blacSurvey of Indigenous People’s Health and Nutrition, 2012.
since indigenous people make up only 0.4 percent(896,917 individuals) of the total population according tothe latest national demographic census [12]. Despite thesmall relative size of the indigenous population in Brazil,it has enormous ethnic and linguistic diversity. Presently,as many as 300 indigenous ethnic groups, speakers of over200 distinct languages, are present in the country [12],constituting one of the national indigenous populationswith the greatest ethnic diversity in the world.The historical advance of non-indigenous populations
and economic frontiers into the interior of Brazil causeddrastic depopulation and even extinction of numerous in-digenous societies [13-15]. However, despite continuinghigh infant mortality rates and low life expectancy at birthamong indigenous peoples as compared to the generalpopulation, notable demographic growth of indigenouspeoples has been observed in Brazil in recent decades[16], including growth rates above the national averages[12,17].At present, the majority of indigenous people in Brazil
live in over 600 federally recognized reserves, 98% ofwhich by area is located in the Amazon (Figure 1). The
Rio de Janeiro
Belém
re
RecifeNortheast
l-West
South/Southeast
Brasília
k) and the four geopolitical regions utilized in the First National

Coimbra et al. BMC Public Health 2013, 13:52 Page 3 of 19http://www.biomedcentral.com/1471-2458/13/52
reserves located in the eastern and southern portions ofthe country tend to be smaller in size than those in thenorth and occur more frequently in urban settings. Thereis also a large indigenous contingent living outside federalreserves, both in rural and urban contexts. According tothe 2010 Brazilian census, 42.3% (379,534) of the self-declared indigenous population resides outside recognizedreserves [12]. Of this segment, 78.7% (298,871) lives inurban areas. In contrast, the urban segment of the indi-genous population residing inside reserves is only 5.0%(25,963).If, in recent decades, the major political challenge in
Brazil was to ensure indigenous peoples full land rights,presently there also emerges the question of long-termcontinuity of traditional cultural systems in the face of di-verse and prominent changes associated with their in-volvement in national society and globalization processes.With regard to indigenous subsistence and dietary prac-tices in Brazil, diverse ethnic groups have experiencedrapid transformation of economic systems in recent dec-ades, which impacts diet and nutrition, whether throughthe adoption of agriculture or extractive production ofgoods directed to the market (coffee, rice, timber, etc.) orthrough paid labor [18-21].The recent reorientation of indigenous economies has
been described as causing important changes in social dy-namics, food security, nutritional status, and generalhealth [22]. In epidemiological terms, available studiespoint to the maintenance of high morbidity levels due toinfectious and parasitic diseases (e.g., malaria, tubercu-losis, diarrhea, pneumonia), much higher than those ofthe general Brazilian population [23-27]. Moreover, recentstudies have also identified the concomitant emergence ofobesity, hypertension, and diabetes mellitus in a growingnumber of indigenous communities in all regions of thecountry [19,20,28-30].In Brazil, periodic nationwide population-based surveys
conducted since the 1970s monitored not only the prin-cipal trends of morbidity and mortality, but also thoserelated to access and use of health services by diversesocioeconomic strata of the general population. Thesesurveys have become increasingly important for the con-struction of health indicators in the country. The set ofinformation generated by these studies is recognized asfundamentally important for identifying the major healthneeds of different segments of the population and sup-porting health prevention and promotion efforts throughpublic policy planning and evaluation [31,32]. Researchbased on these databases is of great interest for its poten-tial to reveal health inequities that otherwise would re-main invisible [33-35].Considering the Brazilian government’s current agenda
prioritizing the reduction of social inequities [36,37],knowledge of the health conditions, diet, and nutrition of
indigenous peoples in the country is still superficial ascompared to what is known about the national popula-tion, thus limiting the possibilities for characterizing anddiscussing their health trends. In particular, indigenouspeoples in Brazil have not been adequately addressed bythe major national health surveys [38]. It is noteworthythat not until 1991 did the national decennial census in-clude the response option “indigenous” for the questionabout race or skin color. Also, the census only began col-lecting data on ethnicity and languages spoken for thosewho classified themselves as indigenous in 2010 [12,16].Nevertheless, the recurrent observation of certain health
conditions (e.g., high infant mortality rates, high preva-lence of child undernutrition, and higher risk of tubercu-losis than observed in the general population) in casestudies conducted in different ethnic groups and regionsindicate the vulnerability of indigenous peoples in Brazil,which places them at great disadvantage in comparison toother segments of society. Recent review articles drawattention to the difficulty of obtaining reliable and re-presentative demographic and epidemiological data forthe indigenous populations in Latin American countries,which hinders public policy formulation and prevents ad-equate planning and evaluation of health actions [5,39].In order to address this lack of national health statistics
for the indigenous population in Brazil, the First NationalSurvey of Indigenous People’s Health and Nutrition (hence-forth, “National Survey”) was conducted in 2008–2009. Itwas the first initiative to collect reliable population-basedinformation on key health and nutrition indicators forBrazil’s indigenous peoples and is among the few of itskind in South America (for a study of comparable scopeand focus in Argentina, see [40]). More commonly, demo-graphic and health censuses in South American countriesfocus on specific ethnic groups rather than nationally re-presentative samples [41-43]. The National Survey focusedon the health and nutrition of indigenous women andchildren in all regions of Brazil in order to provide muchneeded information for the development of better in-formed national health policies.The primary aim of this paper is to describe the rationale,
design, and methods of the National Survey, as well as topresent an overview of its results concerning demographiccharacteristics of the study population, socioeconomicand sanitation profiles of households, and the health andnutritional status of women and children. This is the firstarticle in a series to present distinct components of thesurvey results. The National Survey is an important publichealth milestone in Brazil, as it provides for the first timeinformation on the health and nutrition of indigenouspeoples based on a nationwide representative sample. Thedata collected will serve as a useful resource for futureevaluations of Brazil’s Indigenous Healthcare Subsystem,as well as providing a baseline for evaluating recent and
Coimbra et al. BMC Public Health 2013, 13:52 Page 4 of 19http://www.biomedcentral.com/1471-2458/13/52
future actions by the nutritional surveillance systemattending the indigenous population [44]. For this reason,the findings selected for presentation in this article includehealth and socioeconomic indicators of comparative valuerelative to available data for the non-indigenous Brazilianpopulation. Such evaluation of Brazil’s current model ofindigenous healthcare is necessary for improving coverage,access, and quality of services [38,45,46].
MethodsOverviewAs predefined by the Brazilian Ministry of Health’sNational Health Foundation (Fundação Nacional de Saúde –FUNASA), the objective of the National Survey was tocharacterize nutritional status and other health measuresin indigenous children under 5 years of age and indige-nous women from 14 to 49 years of age, on the basis of arepresentative probabilistic sample of the indigenouspopulation residing in Brazil.a The study sample was alsopredesigned to be representative of the country’s officialgeopolitical regions. These divisions – North, Northeast,Central-West, Southeast, and South – were originally deli-neated on the basis of analyses of a set of environmental,economic, social, and political factors that differentiatesthe national territory [47]. For the purposes of theNational Survey, the South and Southeast regions werejoined. Thus, whereas the survey employed the four re-gional strata North, Northeast, Central-West, and South/Southeast, it is not possible to make inferences for specificethnic groups, states, or administrative districts of theIndigenous Healthcare Subsystem.Specifically, the National Survey aimed to characterize
for the country as a whole and by major geopolitical re-gion: (a) the nutritional status of children and women; (b)the prevalence of hypertension and diabetes mellitus inwomen; (c) the proportion of children hospitalized fordiarrhea and acute respiratory infections during the prior12 months, as reported by a parent or guardian; (d) theproportion of women reporting tuberculosis and malariaduring the prior 12 months; (e) access to prenatal care,vaccination, and dietary supplementation services andprograms; and (f) characteristics of the domestic economyand diet.Realization of the National Survey was part of the imple-
mentation of the Brazilian government’s National Policy ofHealthcare for Indigenous Peoples, initiated in 1999 toimprove healthcare access, coverage, and quality in thispopulation. The study was conducted by a consortiumcomprised of the Brazilian Public Health Association (Asso-ciação Brasileira de Saúde Coletiva – ABRASCO), whichbrings together public health educational and researchinstitutions in Brazil, and the University of Gothenburg,Sweden, in collaboration with a network of researchersfrom universities and research institutes throughout Brazil.
Sampling proceduresA stratified probability sample of indigenous villages inBrazil was obtained according to the regions North,Northeast, Central-West, and South/Southeast on thebasis of a list provided by FUNASA on January 22, 2008.This list, the only available source of information regard-ing the indigenous population on a national scale, identi-fied village populations served by the Indigenous HealthSubsystem.b On the date of consultation, the list contained3,995 indigenous “villages” (“aldeias”) located throughoutthe country. Villages identified on the list as vacated(“desaldeadas”) or deactivated and those with less than 31inhabitants were excluded from consideration.c Althoughmost villages were located inside federally recognized indi-genous reserves, such status was not required for inclusion.Based on these criteria, 151 villages (3.8%) were excludedfrom the original list for being vacated or deactivated and1,076 (26.9%) for having total populations less than 31people. A total of 2,768 villages remained on the list for thepurposes of selection.Sample size was estimated based on the size of the tar-
get population in each region, a prevalence of 50% for alloutcomes, a relative precision of 5%, and a confidencelevel of 95%, according to the methodology proposed byLemeshow [48]. The presumed prevalence of 50% waschosen because this proportion maximizes the size of thesample despite a lack of overall estimates about the para-meters to be investigated.To avoid loss of precision of estimates, it was predeter-
mined that at least 1,000 women and 1,000 children wouldbe evaluated in each region. Furthermore, the estimatedsample size was increased by 20% to avoid decreases in ac-curacy due to nonparticipation and other losses. It wasestimated that to achieve the research objectives, it wouldbe necessary to include at least 6,605 women and 6,583children nationally. The numbers of villages and size ofthe populations of women and children eligible for thestudy, as well as the planned sample sizes, are presentedin Table 1.Based on the calculated sample size for each region,
villages were then selected according to the criteria ofSequential Poisson Sampling [49]. Substitution of villageswas not allowed. In the end, 123 villages were selected,distributed by region as follows: 65 (North), 14 (Central-West), 23 (Northeast), and 21 (South/Southeast).Two strategies were defined for data collection in villages:
census and sample. A village was investigated by means ofcensus when the total number of women (with or withoutchildren) between 14.0 and 49.9 years of age and children< 5 years was less than or equal to 150 individuals, accor-ding to the FUNASA list of villages. If the number ofwomen and children in the age groups of interest wasgreater than 150, the village was investigated by means ofa systematic sample of households. The sampling strategy

Table 1 Target populations of villages, women, and children (N), planned samples (n), and final samples, by region,First National Survey of Indigenous People’s Health and Nutrition, Brazil, 2008-2009
Regions Villages Women Children
(14–49 years) (< 60 months)
N Sample N Sample N Sample
n Final % realization n Final % realization n Final % realization
All regions 2768 123 113 91.9 104354 6605 6692 101.3 69259 6583 6128 93.1
North 1688 65 60 92.3 44812 2720 2564 94.3 30287 2708 2584 95.4
Central-West 310 14 13 92.9 19101 1204 1295 107.6 17584 1200 1304 108.7
Northeast 586 23 22 95.7 26688 1481 1769 119.4 14232 1475 1355 91.9
South/Southeast 184 21 18 85.7 13753 1200 1064 88.7 7156 1200 885 73.8
Coimbra et al. BMC Public Health 2013, 13:52 Page 5 of 19http://www.biomedcentral.com/1471-2458/13/52
combining village censuses and samples was adopted toprevent any single large village from overwhelming theresults of an entire region. Although the mode of investi-gation (census or sample) was predetermined before thestart of fieldwork, it was altered in the field for a smallnumber of villages that were found to have actual popula-tions that diverged greatly from those indicated on the ori-ginal FUNASA list. In villages investigated by sample,households were selected according to a standardizedmethodology involving a predetermined increment with-out substitution in the event of absence or refusal. In thecase of absence of residents, three visits were made beforenon-inclusion of a household in the final sample. Allwomen living in selected households who identified them-selves as indigenous were interviewed. Children whosemothers self-identified as indigenous and children identi-fied as indigenous by a non-indigenous mother or care-taker were included in the study.
Questionnaires and interviewsFor the purposes of data collection, four questionnaireswere applied: Village, Household, Adult Female, and Child.The first (Village) was answered by one or more commu-nity leaders. The second (Household) was answered by anadult resident, usually head-of-household. The third(Adult Female) was answered by women between 14 and49 years of age, mothers under 14 years of age, and guar-dians of children under 5 years of age. Finally, the fourth(Child) was answered by a parent or caregiver of childrenunder 5 years of age. For the sake of comparability, thequestionnaires were partially based on protocols used inother population-based studies conducted in Brazil. How-ever, given the diversity of contexts in which they wouldbe applied in the National Survey, some items requiredadaptation and many additional variables were developedexclusively for the purposes of this study.A major challenge faced during preparatory stages of the
National Survey was to develop a set of questionnaireswith interview questions that could be clearly commu-nicated to and answered by respondents. Due to the
enormous cultural and linguistic diversity of the populationsurveyed, questionnaires were written in Portuguese andlocal indigenous translators (most frequently indigenoushealth agents or primary education teachers) were used forinterviewees that did not speak that language.The Village questionnaire addressed community food
production for internal consumption and for sale, includ-ing plant cultivation, animal rearing, hunting, fishing,collecting, as well as seasonality of food shortages and sur-pluses. The Household questionnaire included questionsregarding the physical characteristics of the house, sani-tation, durable household goods, sources of monetaryincome, food production and consumption, and seasonal-ity of food shortages or surpluses. The Adult Female ques-tionnaire addressed women’s education, reproductivehistory, current use of medications (for hypertension,diabetes, or anemia), history of illness (malaria and tuber-culosis), access to prenatal care, anthropometric and clin-ical measurements (weight, height, arterial blood pressure,hemoglobin, and glucose levels), and vaccination history.The Child questionnaire addressed birth circumstances,access to pediatric healthcare, prior hospitalizations, recenthistory of diarrhea and acute respiratory infection, use ofiron sulfate supplementation for anemia, breastfeedingduration, diet (for children < 2 years of age), anthropo-metric and clinical measurements (weight, height, andhemoglobin level), and vaccination history.
Fieldwork and dataFieldwork was accomplished by previously trained multi-disciplinary teams. Two workshops were held to train teamleaders in research procedures, methods, and instruments.Anthropometry workshops were held to standardize field-workers on measurement techniques. Research teams wereconfigured according to the practical circumstances ofeach region and village, including population size andavailable forms of transportation. All teams included atleast one trained leader and one person previously standar-dized for anthropometric measurement. In most villages,teams were accompanied by one or more local health

Coimbra et al. BMC Public Health 2013, 13:52 Page 6 of 19http://www.biomedcentral.com/1471-2458/13/52
professionals, usually nurses or nutritionists, serving eachstudy community on behalf of FUNASA. Teams alsosought the collaboration of health technicians and indigen-ous health agents at the FUNASA point-of-service healthposts serving each village in order to facilitate interviewsand the collection of secondary health data.With very few exceptions, interviews were conducted in
private households. Secondary health data were obtainedfrom diverse records in the possession of participants orheld at local or regional healthcare facilities (e.g., vaccin-ation certificates and medical files). If possible, basicdemographic information, such as sex, birthdate, and filia-tion, were obtained from local FUNASA healthcarerecords prior to conducting household interviews. Other-wise, this information was obtained from participants’personal documents (identification cards or birth certifi-cates) or informed by interviewees.
MeasurementsHeight and weight measurements were obtained from chil-dren and women while barefoot and wearing minimumclothing. Standing height was measured with an Altura-Exata portable anthropometer (Belo Horizonte, Brazil) andrecorded to the nearest 0.1 cm. This anthropometer wasalso used to measure recumbent length of children ≤24 months. Body weight was measured with a portabledigital floor scale with 150 kg maximum capacity and ac-curacy to 100 g (seca model 872, Hamburg, Germany). Thisscale features a mother and child weighing function thatallowed children ≤ 24 months to be weighed while beingheld by an adult. Anthropometric measurements wereobtained in accordance with Lohman [50].Two blood pressure readings were taken from adult
women 18 to 49 years of age while rested and within aninterval of approximately ten to fifteen minutes using anautomated wrist monitor (Omrom model HEM-631int,Bannockburn, Illinois, USA) placed on the left wrist, fol-lowing standard recommendations [51]. The arithmeticmean of the two measurements was used in analyses.To determine hemoglobin level in children and women,
one drop of capillary blood obtained by fingerprick wasanalyzed using a portable hemoglobinometer modelHemoCue Hb 201+ (Ängelholm, Sweden). Casual bloodglucose level in women was assessed using an ACCU-CHECKW Active blood glucose monitoring system byRoche (Mannheim, Germany). Blood samples were col-lected using one-way lancets fitted to an ACCU-CHEKW
lancing device.
Data management and analysisData entry of questionnaire responses was done independ-ently by two typists using Epi InfoTM software, version6.04d (Centers for Disease Control and Prevention,
Atlanta, GA, USA). All discrepancies between typists wereresearched and corrected. Data files were exported foranalysis to Statistical Package for the Social Sciences(SPSS) for Windows version 16.0 (SPSS Inc., Chicago, IL,USA) and STATA 10 (College Station, TX, USA) files.Statistics related to the characterization of the study
population could be calculated without loss of precisionfor each of the four regions. As this was a complex sam-ple, it was necessary to consider the effect of the studydesign by taking into account weights. Calculation ofweights involved the relative population of each region,the relative proportions of women and children in theentire sample, and the data collection strategy adopted ineach village (census or sample). To prevent statistical fluc-tuations, the results of calculations based on fewer than30 responses are not reported.The anthropometric indicators used to evaluate women’s
and children’s nutrition, as well as the criteria employed todiagnose anemia, diabetes mellitus, and arterial hyperten-sion, followed the World Health Organization (WHO)[52,53], The Seventh Report of the Joint National Commit-tee on Detection, Evaluation, and Treatment of HighBlood Pressure (JNC) [51], and The Expert Committee onthe Diagnosis and Classification of Diabetes Mellitus [54],respectively.A household goods index was generated based on the
presence of durable goods in the households. A principalcomponent analysis was carried out for 19 durablegoods, considering the suitability of the data for this stat-istical tool. Before applying this technique, the correlationmatrix between the quantities of the 19 items was calcu-lated. Correlations varied between −0.14 (outboard motorx bicycle) and 0.58 (television x VCR/DVD). The Kaiser-Meyer-Olkin measure reached 0.81, which exceeds theminimum value (0.60) recommended for proceeding withprincipal component analysis. The eigenvalue of the firstcomponent of multivariate analysis was 3.56, accountingfor 19% of the total variability in the dataset. The secondcomponent showed an eigenvalue 64% lower than thefirst, explaining 9% of the total variability.Standing out in the first component were television set,
refrigerator and/or freezer, VCR and/or DVD player, stove,telephone, and satellite dish. In the second component,outboard motor, cassava grater, and chainsaw stood out.Thus, the first component is strongly influenced by house-hold appliances, while the second mainly includes itemsrelated to rural economic activities. Only the first compo-nent was used in defining the socioeconomic indicator,since the items in the second component disproportion-ally distinguished the North region. The value of thehousehold goods index for each household is the result ofthe sum of the contribution of each item (generated fromthe principal component analysis) multiplied by the quan-tity of each in that household. Households were then

Coimbra et al. BMC Public Health 2013, 13:52 Page 7 of 19http://www.biomedcentral.com/1471-2458/13/52
classified according to terciles of the combined distribu-tion, considering the four regions.
EthicsThe National Survey was authorized by the NationalResearch Ethics Commission (Comissão Nacional de Éticaem Pesquisa – CONEP) and the National Indian Foundation(Fundação Nacional do Índio – FUNAI). All visits to vil-lages occurred after seeking permission from communityleaders via available channels of communication, such astelephone, radio, or personal communication by FUNASAhealth professionals. If prior permission could not beobtained due to failures of communication, permissionwas sought immediately upon arrival. Before initiatinginterviews in a given village, a meeting was held with com-munity leaders to obtain community permission to con-duct the study. To the extent possible, these meetingswere held in public and formulated according to localprotocols for community decision-making. In addition todescribing the objectives and procedures of the study, aFree and Informed Collective Consent form was presentedin detail and any questions posed by leaders or commu-nity members were answered. If consent was provided,one or more community leaders were asked to sign theform. Any particular village, household, parent, or guard-ian was allowed to decline to participate at any moment offieldwork. During household visits, any additional ques-tions about the study were answered before conductingresearch. Under no circumstances were individuals inter-viewed or measured without their consent. When possible,a community meeting was held at the conclusion of datacollection in order to provide an additional opportunityfor answering questions.
ResultsSamplesTable 1 presents planned and obtained samples. Of the123 villages in the sample, the study obtained data for 113(91.9%). The 10 villages in the final sample that were notinvestigated were distributed geographically as follows: 5in the North region, 1 in the Central-West, 1 in theNortheast, and 3 in the South/Southeast. The number ofvillages in which the study was conducted as compared tothose planned varied from 85.7% in the South/Southeastto 95.7% in the Northeast. The non-investigation of vil-lages was due to: refusal by village leaders to participate(3 cases); non-existence of a village at the time of research,potentially due to an error in the original FUNASA list ofvillages (1 case); impossibility of access due to excessive rainand flooding (1 case); access impeded by FUNASA due toH1N1 influenza epidemic (1 case); cost of access in excessof the available budget (1 case); and loss of completed re-search questionnaires by the postal service (1 case).
Of a total of 5,674 indigenous households originallyplanned for investigation, 6.5% were not interviewed,thus resulting in a total of 5,305 households investigated.The principal reason for non-inclusion was absence ofthe residents at the time of the field team’s visit (5.9%).It is noteworthy that only 33 households (0.6%) were notinterviewed due to refusal to participate. In relation tothe sex of the respondent for household questionnaires,66% were females, with the highest percentage of femalerespondents being in the Northeast region (81.4%).Overall, more than 90% of planned individual interviews
(adult women and children questionnaires) were realized.The relationship between planned and realized individualinterviews with women (adult female questionnaire) va-ried from 88.7% in the South/Southeast to 119.4% in theNortheast. As for interviews regarding children, this pro-portion varied from 73.8% in the South/Southeast to108.7% in the Central-West (Table 1). The final sampleexceeded that planned in the Central-West region forwomen (107.6%) and children (108.7%) and in the Northeastfor women (119.4%). Some final sample sizes exceededthose planned because the original FUNASA populationestimates were lower than those encountered during datacollection. Despite losses in some regions, there was noloss of precision due to non-inclusion of adult females orchildren, as the allowance for non-participation in thestudy design was sufficient for all statistical outcomes forthe entire sample and for each of the four regions.
Sociodemographic characteristics of the sampleTable 2 presents descriptive statistics for all residents ofthe 113 villages investigated, as well as for women andchildren in the age groups of interest.The average total number of residents per village varied
from 360.9 (North region) to 2,494.8 (Central-West), whilethe medians varied from 181 (North) to 1,407 (Central-West). In general, sampled villages were small, with overhalf having less than 268 inhabitants. Few villages hadpopulations surpassing 7,000, as observed in the Central-West, which was the region with the largest villages in thesample. Consistent with these findings, the distribution ofwomen and children by region (Table 2) showed the lar-gest contingents by village in the Central-West region.Table 2 shows that the mean number of household resi-
dents varied from 5.2 in the Northeast to 7.4 in the North.The maximum number of residents varied greatly, from20 in the South/Southeast to 41 in the North. Importantdifferences were also observed by region in the number ofwomen and children in sampled households, with theNorth presenting the highest values for both (11 womenand 11 children).The age distribution of sampled children was relatively
balanced between regions (Table 3). Approximately 20%of sampled children were distributed in each 12 month

Table 2 Descriptive statistics for the total population and target population (women and children) of villages andhouseholds investigated, by region, First National Survey of Indigenous People’s Health and Nutrition, Brazil,2008-2009
Characteristicsstudied
All regions Region
North Central-West Northeast South/Southeast
Villages
Total residents
Mean/SD 716.4/1304.8 360.9/659.3 2494.8/2620.5 792.9/1103.5 472.3/403.8
Min/max 30/7081 30/4642 74/7081 66/5200 81/1500
Median 268 181 1407 517 320
Women from 14 to 49 years
Mean/SD 151.0/281.7 78.0/143.1 560.8/601.2 134.8/100.2 102.6/91.0
Min/max 8/1651 8/826 23/1651 14/411 14/352
Median 56 33 357 108 69
Children < 5 years
Mean/SD 120.0/223.0 63.2/95.4 457.6/463.5 99.4/139.4 75.2/70.3
Min/max 5/1245 5/640 9/1245 11/606 7/252
Median 41 34 206 49 48
Households
Total residents
Mean/SD 6.1/3.0 7.4/3.4 5.5/2.6 5.2/2.5 5.4/2.4
Min/max 1/41 2/41 1/24 1/25 2/20
Median 6 7 5 5 5
Women from 14 to 49 years
Mean/SD 1.4/0.8 1.6/1.0 1.3/0.6 1.4/0.8 1.3/0.7
Min/max 0/11 0/11 0/5 0/5 0/5
Median 1 1 1 1 1
Children < 5 years
Mean/SD 1.2/1.0 1.5/1.1 1.2/1.0 1.0/1.0 1.0/1.0
Min/max 0/11 0/11 0/7 0/5 0/7
Median 1 1 1 1 1
Coimbra et al. BMC Public Health 2013, 13:52 Page 8 of 19http://www.biomedcentral.com/1471-2458/13/52
interval. For the entire sample, as for each of the regions,the number of boys was slightly higher than girls, espe-cially in the Northeast and Central-West regions.Approximately a third of women interviewed (38.4%)
were between 20 and 29 years of age (Table 4), varyingfrom 36.7% in the North to 39.9% in the Northeast. Intotal, 15.2% of women had no formal education, reaching21.9% in the Central-West region. The greater proportionof women reported having between 1 and 4 years ofschooling (38.0%), varying from 34.4% in the South/South-east to 43.8% in the North. The highest percentages ofwomen with 10 or more years of schooling were observedin the Northeast (29.7%) and South/Southeast (19.3%).
Household characteristicsSubstantial differences between regions were observed inhousehold construction materials used for flooring, walls,
and roofing (Table 5). In the North, wood was the pre-dominant material for flooring and walls (55.6% and64.0%, respectively) and corrugated zinc/asbestos sheetsand wood or thatch (52.6% and 46.3%, respectively) werethe most common for roofing. In contrast, the predomi-nant construction materials used in the Northeast wereindustrialized: ceramic or cement for flooring (82.4%),bricks for walls (76.5%), and roofing of clay tiles (81.3%).The distribution of the household goods index (Table 5)
used as a proxy for socioeconomic status shows that theNorth was the region with the greatest proportion ofhouseholds in the lower tercile (50.8%). In contrast, in theNortheast and South/Southeast regions, the greatestproportions of households were in the upper tercile of thedistribution (50.5% and 48.7%, respectively).With regard to sanitation, the residents of 19.4% of
households reported defecating in facilities inside their

Table 3 Distribution of indigenous children < 60 months by age group and sex, by region, First National Survey ofIndigenous People’s Health and Nutrition, Brazil, 2008-2009
Characteristics Allregions
Region
studied North Central-West Northeast South/Southeast
Age group n = 6128 n = 2584 n = 1304 n = 1355 n = 885
0 to 11 months 21.7% 22.4% 22.1% 20.5% 21.6%
CI:20.5-22.9 CI:21.2-23.7 CI:20.2-24.1 CI:18.7-22.5 CI:18.2-25.5
12 to 23 months 19.3% 21.5% 17.0% 19.4% 19.3%
CI:18.0-20.6 CI:19.9-23.1 CI:13.9-20.6 CI:16.8-22.3 CI:16.6-22.4
24 to 35 months 19.2% 19.3% 20.3% 19.4% 18.3%
CI:18.2-20.3 CI:17.5-21.1 CI:18.4-22.3 CI:17.0-22.0 CI:16.2-20.7
36 to 47 months 20.8% 19.4% 19.6% 23.0% 20.8%
CI:19.7-21.8 CI:18.1-20.8 CI:18.4-20.8 CI:21.6-24.5 CI:18.1-23.9
48 to 59 months 19.1% 17.4% 21.1% 17.6% 19.9%
CI:17.7-20.5 CI:16.3-18.6 CI:18.2-24.3 CI:16.1-19.3 CI:16.3-24.1
Sex n = 6127 n = 2584 n = 1303 n = 1355 n = 885
Male 51.4% 50.7% 52.5% 52.3% 50.2%
CI:49.8-52.9 CI:49.1-52.3 CI:50.3-54.7 CI:49.3-55.3 CI:45.9-54.5
Female 48.6% 49.3% 47.5% 47.7% 49.8%
CI:47.1-50.2 CI:47.7-50.9 CI:45.3-49.7 CI:44.7-50.7 CI:45.5-54.1
CI: 95% confidence interval.
Table 4 Distribution of indigenous women from 14 to 49 years by age group and schooling, by region, First NationalSurvey of Indigenous People’s Health and Nutrition, Brazil, 2008-2009
Characteristics Allregions
Region
studied North Central-West Northeast South/Southeast
Age group n = 6692 n = 2564 n = 1295 n = 1769 n = 1064
14 to 19 years 25.2% 26.1% 25.2% 22.9% 26.3%
CI:23.9-26.5 CI:24.0-28.3 CI:22.9-27.7 CI:20.2-25.9 CI:23.6-29.2
20 to 29 years 38.4% 36.7% 39.9% 39.5% 37.7%
CI:36.8-40.1 CI:34.4-39.0 CI:36.0-43.9 CI:36.0-43.0 CI:34.1-41.4
30 to 39 years 24.1% 25.5% 23.7% 25.2% 22.6%
CI:23.0-25.3 CI:23.6-27.5 CI:20.8-26.9 CI:23.2-27.3 CI:20.5-25.0
40 to 49 years 12.3% 11.7% 11.2% 12.4% 13.4%
CI:11.3-13.3 CI:10.3-13.2 CI:9.9-12.7 CI:9.9-15.5 CI:11.5-15.4
Schooling n = 6643 n = 2523 n = 1294 n = 1766 n = 1060
None 15.2% 16.5% 21.9% 8.2% 14.6%
CI:12.1-18.8 CI:11.5-23.2 CI:14.8-31.1 CI:4.8-13.8 CI:.9.0-22.9
1-4 years 38.0% 43.8% 39.0% 36.4% 34.4%
CI:35.1-40.9 CI:39.0-48.7 CI:33.4-45.0 CI:28.9-44.7 CI:29.6-39.5
5-9 years 28.3% 27.1% 27.8% 25.6% 31.7%
CI:25.8-30.9 CI:23.0-31.7 CI:21.7-34.8 CI:21.0-31.0 CI:26.6-37.2
10 years or + 18.6 12.6 11.3 29.7 19.3
CI:15.0-22.9 CI:9.0-17.3 CI:6.4-19.0 CI:21.8-39.1 CI:12.9-27.9
CI: 95% confidence interval.
Coimbra et al. BMC Public Health 2013, 13:52 Page 9 of 19http://www.biomedcentral.com/1471-2458/13/52
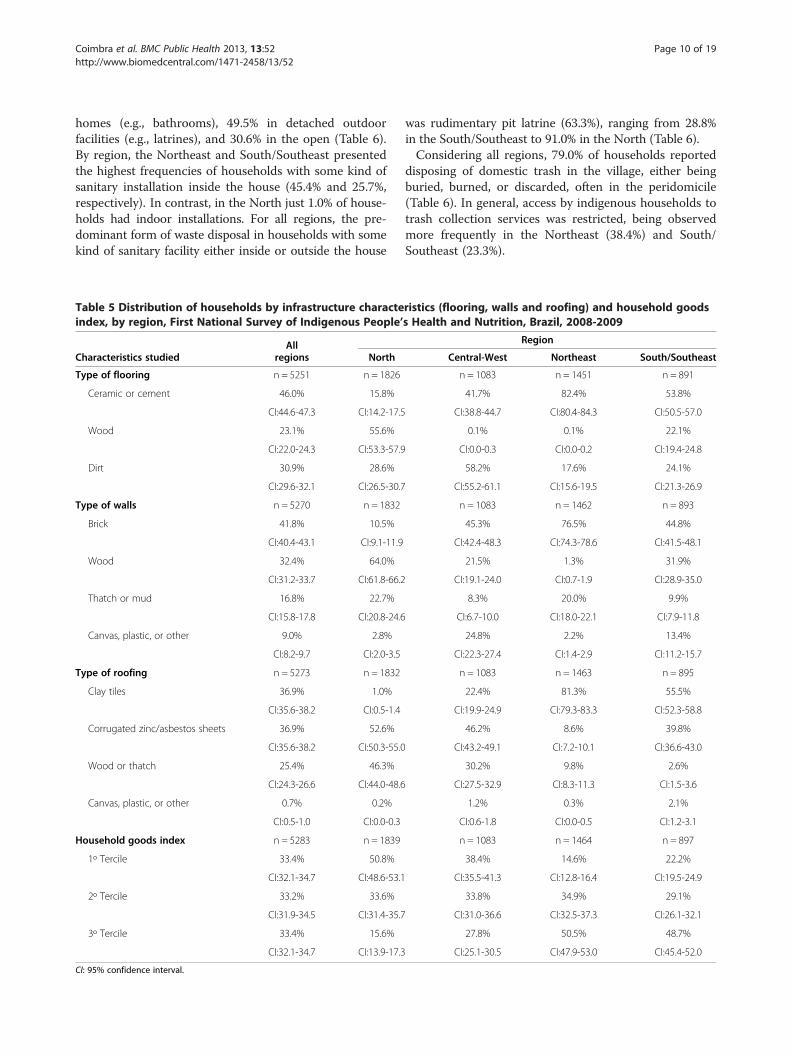
Coimbra et al. BMC Public Health 2013, 13:52 Page 10 of 19http://www.biomedcentral.com/1471-2458/13/52
homes (e.g., bathrooms), 49.5% in detached outdoorfacilities (e.g., latrines), and 30.6% in the open (Table 6).By region, the Northeast and South/Southeast presentedthe highest frequencies of households with some kind ofsanitary installation inside the house (45.4% and 25.7%,respectively). In contrast, in the North just 1.0% of house-holds had indoor installations. For all regions, the pre-dominant form of waste disposal in households with somekind of sanitary facility either inside or outside the house
Table 5 Distribution of households by infrastructure characteindex, by region, First National Survey of Indigenous People’
Characteristics studiedAll
regions North
Type of flooring n = 5251 n = 1826
Ceramic or cement 46.0% 15.8%
CI:44.6-47.3 CI:14.2-17.5
Wood 23.1% 55.6%
CI:22.0-24.3 CI:53.3-57.9
Dirt 30.9% 28.6%
CI:29.6-32.1 CI:26.5-30.7
Type of walls n = 5270 n = 1832
Brick 41.8% 10.5%
CI:40.4-43.1 CI:9.1-11.9
Wood 32.4% 64.0%
CI:31.2-33.7 CI:61.8-66.2
Thatch or mud 16.8% 22.7%
CI:15.8-17.8 CI:20.8-24.6
Canvas, plastic, or other 9.0% 2.8%
CI:8.2-9.7 CI:2.0-3.5
Type of roofing n = 5273 n = 1832
Clay tiles 36.9% 1.0%
CI:35.6-38.2 CI:0.5-1.4
Corrugated zinc/asbestos sheets 36.9% 52.6%
CI:35.6-38.2 CI:50.3-55.0
Wood or thatch 25.4% 46.3%
CI:24.3-26.6 CI:44.0-48.6
Canvas, plastic, or other 0.7% 0.2%
CI:0.5-1.0 CI:0.0-0.3
Household goods index n = 5283 n = 1839
1º Tercile 33.4% 50.8%
CI:32.1-34.7 CI:48.6-53.1
2º Tercile 33.2% 33.6%
CI:31.9-34.5 CI:31.4-35.7
3º Tercile 33.4% 15.6%
CI:32.1-34.7 CI:13.9-17.3
CI: 95% confidence interval.
was rudimentary pit latrine (63.3%), ranging from 28.8%in the South/Southeast to 91.0% in the North (Table 6).Considering all regions, 79.0% of households reported
disposing of domestic trash in the village, either beingburied, burned, or discarded, often in the peridomicile(Table 6). In general, access by indigenous households totrash collection services was restricted, being observedmore frequently in the Northeast (38.4%) and South/Southeast (23.3%).
ristics (flooring, walls and roofing) and household goodss Health and Nutrition, Brazil, 2008-2009
Region
Central-West Northeast South/Southeast
n = 1083 n = 1451 n = 891
41.7% 82.4% 53.8%
CI:38.8-44.7 CI:80.4-84.3 CI:50.5-57.0
0.1% 0.1% 22.1%
CI:0.0-0.3 CI:0.0-0.2 CI:19.4-24.8
58.2% 17.6% 24.1%
CI:55.2-61.1 CI:15.6-19.5 CI:21.3-26.9
n = 1083 n = 1462 n = 893
45.3% 76.5% 44.8%
CI:42.4-48.3 CI:74.3-78.6 CI:41.5-48.1
21.5% 1.3% 31.9%
CI:19.1-24.0 CI:0.7-1.9 CI:28.9-35.0
8.3% 20.0% 9.9%
CI:6.7-10.0 CI:18.0-22.1 CI:7.9-11.8
24.8% 2.2% 13.4%
CI:22.3-27.4 CI:1.4-2.9 CI:11.2-15.7
n = 1083 n = 1463 n = 895
22.4% 81.3% 55.5%
CI:19.9-24.9 CI:79.3-83.3 CI:52.3-58.8
46.2% 8.6% 39.8%
CI:43.2-49.1 CI:7.2-10.1 CI:36.6-43.0
30.2% 9.8% 2.6%
CI:27.5-32.9 CI:8.3-11.3 CI:1.5-3.6
1.2% 0.3% 2.1%
CI:0.6-1.8 CI:0.0-0.5 CI:1.2-3.1
n = 1083 n = 1464 n = 897
38.4% 14.6% 22.2%
CI:35.5-41.3 CI:12.8-16.4 CI:19.5-24.9
33.8% 34.9% 29.1%
CI:31.0-36.6 CI:32.5-37.3 CI:26.1-32.1
27.8% 50.5% 48.7%
CI:25.1-30.5 CI:47.9-53.0 CI:45.4-52.0

Table 6 Distribution of households by sanitary conditions and presence of electricity, by region, First National Surveyof Indigenous People’s Health and Nutrition, Brazil, 2008-2009
Characteristics studiedAll
regions
Region
North Central-West Northeast South/Southeast
Defecation location n = 5268 n = 1827 n = 1083 n = 1463 n = 895
Indoor household facility 19.4% 1.0% 10.0% 45.4% 25.7%
CI:18.3-20.5 CI:0.6-1.5 CI:8.2-11.8 CI:42.9-48.0 CI:22.8-28.6
Outdoor household facility 49.5% 58.2% 71.2% 29.5% 38.1%
CI:48.1-50.8 CI:55.9-60.4 CI:68.5-73.9 CI:27.1-31.8 CI:34.9-41.3
Outdoors in the open 30.6% 40.4% 18.6% 23.9% 35.9%
CI:29.3-31.8 CI:38.2-42.7 CI:16.2-20.9 CI:21.7-26.0 CI:32.7-39.0
Other 0.6% 0.3% 0.3% 1.2% 0.3%
CI:0.4-0.8 CI:0.1-0.6 CI:0.0-0.6 CI:0.7-1.8 CI:0.0-0.7
Predominant destination of human waste n = 3567 n = 1041 n = 875 n = 1085 n = 566
Sewage disposal system 5.9% 0% 0.2% 14.8% 8.3%
CI:5.1-6.6 – CI:0.0-0.5 CI:12.6-16.9 CI:6.0-10.6
Septic system 30.6% 8.7% 26.3% 38.3% 62.5%
CI:29.1-32.1 CI:7.0-10.5 CI:23.4-29.2 CI:35.4-41.2 CI:58.5-66.5
Rudimentary pit latrine 63.3% 91.0% 73.5% 46.6% 28.8%
CI:61.7-64.9 CI:89.2-92.7 CI:70.6-76.4 CI:43.7-49.6 CI:25.1-32.5
River, lake, or ocean 0.2% 0.3% 0% 0.3% 0.4%
CI:0.1-0.4 CI:0.0-0.6 – CI:0.0-0.6 CI:0.0-0.8
Predominant destination of household trash n = 5271 n = 1831 n = 1083 n = 1463 n = 894
Collected by removal service 15.0% 1.1% 0% 38.4% 23.3%
CI:14.0-16.0 CI:0.6-1.6 – CI:35.9-40.9 CI:20.5-26.0
Buried, discarded, or burned in the village 79.0% 85.9% 98.6% 58.6% 74.7%
CI:77.9-80.1 CI:84.3-87.5 CI:97.9-99.3 CI:56.0-61.1 CI:71.9-77.6
Discarded in a river, lake, or ocean 0.8% 2.2% 0% 0.2% 0%
CI:0.6-1.1 CI:1.5-2.9 – CI:0.0-0.4 –
Other 5.2% 10.8% 1.4% 2.8% 2.0%
CI:4.6-5.8 CI:9.4-12.2 CI:0.7-2.1 CI:2.0-3.6 CI:1.1-2.9
Predominant source of drinking water n = 5236 n = 1799 n = 1082 n = 1461 n = 894
Municipal system 9.4% 0.2% 0.1% 28.0% 8.6%
CI:8.6-10.1 CI:0.0-0.4 CI:0.0-0.3 CI:25.7-30.3 CI:6.8-10.5
Spring or artesian well 55.2% 36.3% 87.5% 40.4% 78.4%
CI:53.9-56.6 CI:34.1-38.5 CI:85.6-89.5 CI:37.9-42.9 CI:75.7-81.1
Shallow well 8.6 13.3 3.8 6.2 8.6
CI:7.8-9.3 CI:11.8-14.9 CI:2.6-4.9 CI:4.9-7.4 CI:6.8-10.5
River, lake or reservoir 11.6% 28.1% 4.8% 1.8% 2.3%
CI:10.7-12.4 CI:26.0-30.1 CI:3.5-6.1 CI:1.2-2.5 CI:1.4-3.3
Other 15.3% 22.1% 3.8% 23.6% 2.0%
CI:14.3-16.3 CI:20.2-24.0 CI:2.6-4.9 CI:21.4-25.8 CI:1.1-2.9
Electricity in the home n = 5266 n = 1827 n = 1083 n = 1461 n = 895
Yes 64.8% 30.1% 66.4% 94.4% 85.6%
CI:63.5-66.1 CI:28.0-32.2 CI:63.6-69.2 CI:93.2-95.6 CI:83.3-87.9
Yes, but discontinuous 12.8% 34.5% 2.7% 0.4% 0.9%
Coimbra et al. BMC Public Health 2013, 13:52 Page 11 of 19http://www.biomedcentral.com/1471-2458/13/52

Table 6 Distribution of households by sanitary conditions and presence of electricity, by region, First National Surveyof Indigenous People’s Health and Nutrition, Brazil, 2008-2009 (Continued)
CI:11.9-13.7 CI:32.4-36.7 CI:1.7-3.6 CI:0.1-0.7 CI:0.3-1.5
No 22.4% 35.4% 30.9% 5.2% 13.5%
CI:21.2-23.5 CI:33.2-37.6 CI:28.2-36.7 CI:4.1-6.3 CI:11.3-15.8
CI: 95% confidence interval.
Coimbra et al. BMC Public Health 2013, 13:52 Page 12 of 19http://www.biomedcentral.com/1471-2458/13/52
Considering all regions together, the most commonlyreported primary sources of drinking water were thoselocated in the immediate vicinities of villages, such as na-tural springs and artesian wells (Table 6). This categorypresented strong variation between regions, ranging from36.3% in the North to 87.5% in the Central-West. TheNorth region was distinguished from the others by pre-senting greater frequencies of shallow wells (13.3%) andrivers, lakes, or reservoirs (28.1%) as important sources ofdrinking water. In contrast, the Northeast showed thehighest rates of water deriving from public municipal net-works (28.0%) and other sources, such as trucks or ponds(23.6%).d
Nationwide, 77.6% of households reported having elec-tricity, with 64.8% having continuous sources (public orprivate utilities) and 12.8% discontinuous (private or com-munity generators). Notable contrasts in the presence ofdomestic electricity were observed between regions.Whereas the proportion of households without electricitywas only 5.2% in the Northeast, it reached 35.4% in theNorth and 30.9% in the Central-West.Although differences were observed between regions in
how foods were obtained, almost all households in thenationwide sample (96.4%) reported routinely purchasingat least one food item (Table 7). In the North, a slightly
Table 7 Distribution of principle food sources reported by indIndigenous People’s Health and Nutrition, Brazil, 2008-2009
Characteristics studiedAll
regions N
n = 5273 n =
Cultivation and/or raising animals 83.2% 89
CI:82.2-84.2 CI:87
Hunting or fishing 64.8% 94
CI:63.5-66.0 CI:92
Collecting 69.0% 85
CI:67.7-70.2 CI:83
Purchase 96.4% 91
CI:95.8-96.9 CI:90
Basic food baskets 41.1% 3
CI:39.8-42.4 CI:2
Other donations (churches, NGOs and others) 13.5% 8
CI:12.6-14.5 CI:6
CI: 95% confidence interval.
lower proportion of households reported purchasing atleast some food (91.8%) than in the other regions. Thesecond most frequently reported means of acquiring foodswas plant cultivation and animal rearing, which presentedrelative homogeneity between all regions except theNortheast, where the prevalence was significantly lower(71.7%). The proportions of households reporting acquiringfoods by collecting ranged from 58.2% (South/Southeast)to 85.4% (North), and by hunting or fishing from 45.0%(Central-West) to 94.0% (North). Obtaining food bymeans of government distribution of “basic food baskets”(cestas básicas) presented some disparity between regions.Whereas the greater proportions of indigenous house-holds in the Central-West (88.6%) and South/Southeast(77.8%) received food by this means, this figure was sig-nificantly lower in the Northeast (30.6%) and North(3.5%). Although other food sources (e.g., donations bychurches, NGOs, and others) were reported much lessfrequently in all regions, these were somewhat less preva-lent in the North (8.1%).
Women’s healthNationwide, 46.1% of non-pregnant indigenous womenhad excess weight (30.3% overweight and 15.8% obese)following WHO cut-off points for the interpretation of
igenous households, by region, First National Survey of
Region
orth Central-West Northeast South/Southeast
1832 n = 1083 n = 1463 n = 895
.4% 87.4% 71.7% 84.6%
.9-90.8 CI:85.4-89.3 CI:69.4-74.0 CI:82.2-87.0
.0% 45.0% 52.9% 48.3%
.9-95.1 CI:42.0-47.9 CI:50.3-55.5 CI:45.0-51.5
.4% 62.2% 60.0% 58.2%
.8-87.0 CI:59.3-65.1 CI:57.5-62.5 CI:55.0-61.4
.8% 97.9% 99.2% 99.1%
.6-93.1 CI:97.0-98.7 CI:98.8-99.7 CI:98.5-99.7
.5% 88.6% 30.6% 77.8%
.6-4.3 CI:86.7-90.5 CI:28.3-33.0 CI:75.0-80.5
.1% 16.3% 17.0% 15.8%
.8-9.3 CI:14.1-18.5 CI:15.0-18.9 CI:13.4-18.1

Coimbra et al. BMC Public Health 2013, 13:52 Page 13 of 19http://www.biomedcentral.com/1471-2458/13/52
Body mass index (BMI) [52]. Notably, comparing theNorth with the other regions, the frequencies of womenclassified as overweight or obese were markedly different.In the South/Southeast and Central-West, obesity preva-lence rates reached 22.6% and 17.2%, respectively, excee-ding that observed in the North by 3.7 and 2.8 times,respectively.The prevalence of anemia in non-pregnant women
according to WHO diagnosis criteria [53] was elevated(32.7%), with important differences between regions(Table 8). The North was the region with the highest fre-quency of anemia (46.8%). In this region, the prevalenceof anemia exceeded by 1.4 times the value observedamong indigenous women nationally.
Table 8 Prevalence rates of underweight, overweight, obesityindigenous women from 14 to 49 years and principle results< 60 months, by region, First National Survey of Indigenous P
Characteristics StudiedAll
regions
Underweight 1
n = 5714
2.4%
CI:1.7-3.2
Overweight 1n = 5714
30.3%
CI:28.2-32.4
Obesity 1
n = 5714
15.8%
CI:12.5-19.8
Anemia 2
n = 5720
32.7%
CI:29.7-35.8
Hypertension 3
n = 4753
13.2%
CI:11.2-15.5
Diabetes mellitus 4
n = 5722
1.4%
CI:1.0-1.9
At least 1 prenatal consultation during first trimester 5n = 2427
46.1%
CI:41.3-51.0
At least six prenatal consultations 5
n = 2549
36.4%
CI:31.0-42.1
CI: 95% confidence interval.1 Underweight (BMI < 18.5 kg/m2), overweight (BMI 25–29.9), and obesity (BMI ≥ 30)2 Hemoglobin concentration < 12.0 mg/dL in non-pregnant women [53].3 Sistolic blood pressure (BP) ≥ 140 and/or diastolic BP ≥ 90 mmHg, according to thewho reported current use of anti-hypertension medication as members of the grou4 Blood glucose ≥ 200 mg/dl in non-pregnant women [54].5 Proportions calculated with reference to women with at least one prenatal consulchild < 60 months of age.
The prevalence of hypertension following the JNC sev-enth report [51], was 13.2% for the entire sample of non-pregnant women (Table 8). The frequency of womenwith high blood pressure in the four regions was hetero-geneous, with the prevalence in the North (3.6%) beingsignificantly lower than in the other regions. In contrast,the prevalence of hypertension was approximately threetimes higher in the Northeast and five times higherin the South/Southeast and Central-West than in theNorth.The prevalence of blood glucose values suggestive of
diabetes mellitus in non-pregnant women was 1.4%,varying from 0.5% in the North to 2.1% in the South/Southeast (Table 8).
, anemia, hypertension, and diabetes mellitus inrelated to prenatal exam of the youngest childeople’s Health and Nutrition, Brazil, 2008-2009
Region
North Central-West Northeast South/Southeast
n = 2064 n = 1112 n = 1585 n = 953
2.4% 0.9% 3.6% 2.5%
CI:1.6-3.4 CI:0.4-2.2 CI:2.5-5.2 CI:1.3-4.6
n = 2064 n = 1112 n = 1585 n = 953
24.7% 35.3% 27.7% 32.0%
CI:20.8-29.5 CI:32.7-38.0 CI:25.1-30.5 CI:27.6-36.7
n = 2064 n = 1112 n = 1585 n = 953
6.1% 17.2% 13.5% 22.6%
CI:3.4-10.7 CI:13.0-22.3 CI:10.4-17.5 CI:14.5-33.4
n = 2068 n = 1116 n = 1586 n = 950
46.8% 34.9% 22.6% 30.6%
CI:41.4-52.3 CI:31.4-38.5 CI:18.1-27.8 CI:25.2-36.5
n = 1679 n = 942 n = 1347 n = 785
3.6% 17.5% 11.2% 17.4%
CI:2.3-5.6 CI:13.9-21.9 CI:7.8-15.9 CI:15.0-20.1
n = 2070 n = 1115 n = 1587 n = 950
0.5% 1.4% 1.1% 2.1%
CI:0.3-1.0 CI:0.9-2.1 CI:0.6-2.2 CI:1.2-3.6
n = 792 n = 642 n = 578 n = 415
33.4% 43.3% 58.6% 47.2%
CI:27.3-40.1 CI:34.1-53.1 CI:53.0-63.9 CI:37.8-56.7
n = 848 n = 654 n = 586 n = 461
10.9% 33.3% 48.3% 45.0%
CI:7.4-16.0 CI:24.5-43.5 42.1-54.5 CI:35.2-55.2
in non-pregnant women [52].
JNC 7 report [51] in non-pregnant women. Prevalence rates include womenp with elevated BP, independent of observed BP levels.
tation with a nurse or doctor during the pregnancy with the youngest living

Coimbra et al. BMC Public Health 2013, 13:52 Page 14 of 19http://www.biomedcentral.com/1471-2458/13/52
Prenatal consultation with a nurse or doctor during thefirst trimester of pregnancy with one’s youngest livingchild less than five years of age was reported by 46.1% ofwomen nationwide, ranging from 33.4% in the North to58.6% in the Northeast (Table 8). Only 36.4% of womennationwide had at least six prenatal consultations duringthis pregnancy, ranging from 10.9% in the North to 48.3%in the Northeast.
Children’s healthThe survey results regarding children less than five yearsof age show elevated prevalence rates of low height-for-age according to the growth curve reference publishedby the WHO [52] (25.7%), varying from 13.9% in theNortheast to 40.8% in the North. Additionally, 51.2% ofindigenous children nationally were found to be anemic,varying from 41.1% in the Northeast to 66.4% in theNorth (Table 9).The nationwide proportion of children with reported
hospitalizations during the prior 12 months (19.3%) waselevated (Table 9). This prevalence was highest in theCentral-West (27.3%). Diarrhea and acute respiratory in-fection were frequent causes of hospitalization. With re-spect to referred morbidity during the prior week, about
Table 9 Prevalence rates of low height-for-age and anemia inwith reported hospitalization during the previous year, propoacute respiratory infection and proportion with reported diarSurvey of Indigenous People’s Health and Nutrition, Brazil, 2
Characteristics studied Allregions N
Low height-for-age 1
n = 6011 n =
25.7% 40
CI:21.8-30.0 CI:35
Anemia 2
n = 5397 n =
51.2% 66
CI:47.9-54.6 CI:61
Hospitalized during prior year
n = 6087 n =
19.3% 16
CI:16.6-22.3 CI:12
With at least one hospitalization due todiarrhea during prior year
n = 1117 n =
37.2% 48
CI:32.5-42.1 CI:39
With at least one hospitalization due to acuterespiratory infection during prior year
n = 1115 n =
47.6% 54
CI:41.8-53.5 CI:45
With diarrhea during the prior week
n = 6068 n =
23.6% 38
CI:20.9-26.4 CI:34
CI: 95% confidence interval.1 Low height-for-age according to WHO standards [52].2 Hemoglobin concentration < 11.0 mg/dL in children > 6 months of age [53].
one in four children (23.6%) presented diarrhea. In theNorth, the proportion of children presenting diarrhea dur-ing the prior week (38.1%) was significantly higher ascompared to the other regions.
DiscussionThis article presents the design and methodology usedin the First National Survey of Indigenous People’sHealth and Nutrition conducted in Brazil and reports ongeneral characteristics of the population and householdsinvestigated, as well as the nutrition and health profilesof indigenous women and children. The study includeda total sample of 113 villages, 5,305 households, 6,692women, and 6,128 children. The scope of the survey wassimilar to population-based studies previously conductedfor Brazil’s non-indigenous population, such as a recent2006 national survey of women 15–49 years of age andchildren less than 5 years of age, which had a samplesize of approximately 15,000 women and 5,000 children[55]. In addition to examining and interviewing a largenumber of indigenous individuals, the National Surveyinvolved complex logistical planning in order to reachmore distant and isolated communities, especially in the
indigenous children < 60 months, proportion of childrenrtions of reported hospitalization due to diarrhea andrhea during the previous week, by region, First National008-2009
Region
orth Central-West Northeast South/Southeast
2539 n = 1277 n = 1331 n = 864
.8% 27.6% 13.9% 22.3%
.7-46.2 CI:20.4-36.1 CI:10.3-18.6 CI:14.2-33.3
2280 n = 1141 n = 1211 n = 765
.4% 51.5% 41.1% 48.0%
.6-70.9 CI:45.7-57.3 CI:34.4-48.0 CI:40.6-55.4
2555 n = 1298 n = 1352 n = 882
.9% 27.3% 14.0% 19.2%
.2-22.9 CI:22.2-33.1 CI:11.0-17.6 CI:15.2-24.0
426 n = 347 n = 181 n = 163
.4% 43.5% 24.8% 29.8%
.9-56.9 CI:36.6-50.7 CI:16.7-35.3 CI:21.9-39.1
425 n = 348 n = 180 n = 162
.4% 40.4% 35.6% 58.4%
.2-63.2 CI:33.0-48.1 CI:27.6-44.4 CI:43.6-71.8
2546 n = 1298 n = 1347 n = 877
.1% 21.4% 19.4% 17.8%
.6-41.8 CI:18.6-24.4 CI:14.9-24.9 CI:12.8-24.2

Coimbra et al. BMC Public Health 2013, 13:52 Page 15 of 19http://www.biomedcentral.com/1471-2458/13/52
North and Central-West regions, many of which couldonly be accessed by riverboats, small airplanes, or four-wheel drive vehicles.Considered generally, the results of the National Survey
reveal marked differences between the indigenous popula-tions in the country’s major geopolitical regions for manyof the variables investigated. In part, these contrasts areassociated with the regional histories of Brazil’s expandingdemographic and economic frontiers and how these af-fected indigenous peoples. An interesting aspect of thishistorical process involves the regional distribution of in-digenous reserves, as mentioned in the introduction tothis article (Figure 1). About 13% of the Brazilian territoryis recognized as federal indigenous land [56]. Of this, 98%by area is located in the Amazon (North region and thenorthern portion of the Central-West region) and theremaining 2% is in the other portions of the country. Theindigenous reserves in the northern portion of the countrytend to be much larger than those in the coastal Northeastand South/Southeast regions, which were the first to becolonized by Europeans [13,57]. The indigenous peoplesliving in these regions often suffered larger territoriallosses as a result of early depopulation and historical po-licies unfavorable to the recognition of their land rights.The colonization of the country subsequently progressedwestward and northward, with encroachment of indigen-ous lands in the Brazilian Amazon region generally occur-ring more recently, often as late as recent decades whenthe country’s more favorable policies for recognizing indi-genous lands resulted in larger indigenous reserves.The findings of the National Survey regarding regional
patterns of dietary subsistence in indigenous householdsare likely related to the historical contrasts in the country’sdistribution of indigenous lands. As described in theMethods, most of the villages sampled were located inindigenous reserves, although this was not a selection cri-terion. Accordingly, in the North, the region with thegreatest extension of indigenous lands, a larger proportionof indigenous households reported consuming foods ob-tained from cultivation and animal raising, hunting andfishing, and collecting. Foods obtained by these productiveactivities were reported less frequently for households inthe Northeast and South/Southeast regions. These inter-regional differences in subsistence patterns may partiallyderive from the regional heterogeneity of access to landwith the potential to support indigenous food productionactivities.The distribution of materials used for roofing, walls,
and flooring in indigenous houses follows a similar pat-tern. Whereas locally produced materials, such as woodand thatch, predominated in the North, industrializedmaterials, such as cement, clay tiles, and corrugatedzinc/asbestos sheets, were found to be more common inthe Northeast and South/Southeast.
Although the observed regional distributions of foodproduction and house construction may partially reflectcontrasting patterns of territorial access to natural re-sources in indigenous reserves, they also appear related todisparate socioeconomic conditions. Households in theNorth region not only utilize proportionally less industria-lized materials in their physical construction, but also haveless access to electricity and present lower socioeconomicscores, as measured by the household goods index, whichwas strongly influenced by electric appliances. Reiteratingthe pattern of interregional heterogeneity mentionedabove, households in the Northeast and South/Southeastregions had the highest socioeconomic scores. Similarly,the results indicate that indigenous women in the Northand Central-West regions tend to have less years ofschooling than those residing in the Northeast and South/Southeast.Effective human waste disposal is considered a key in-
tervention in disease prevention and environmental health[58-60]. The results of the National Survey highlightmajor gaps in the availability of public services to indige-nous villages such as basic sanitation, safe drinking water,and waste management. The most typical human wastedisposal infrastructure observed in the sample was that ofa simple pit latrine, with sewage rarely being collected orreceiving any treatment. Even in those regions with highersocioeconomic scores, substantial proportions of intervie-wees reported that their household members defecate inthe open, as in the South/Southeast (35.9%). Householdtrash management was also found to be precarious, withtrash most commonly being buried, discarded, or burnedin the peridomicile or elsewhere in the village. Only in theNortheast was there greater access to public garbage col-lection services, which reached 38.4% of households inthis region.These findings sharply contrast with the non-indigenous
population in Brazil. According to the 2008 National BasicSanitation Survey [61], 91.8% of households located inBrazil’s rural areas had human waste disposal infrastruc-ture, ranging from 84.8% in the Northeast to 99.1% in theSouth. With respect to garbage collection, 42.4% of Brazilianrural households had access to public services, varyingfrom 24.2% in the North to 63.0% in the South [61].The profile of sanitation conditions outlined by the
National Survey reveals marked inequities between indi-genous and non-indigenous households in Brazil, withthe indigenous population being strongly disadvantagedwith regard to access to water, sanitation infrastructure,and management of solid waste. It is important to notethat the results of the National Survey show that manyvillages, particularly in the Central-West region, have ar-tesian well water supply systems, often installed byFUNASA. These are part of an important governmentalinitiative aimed at expanding the sanitation network in

Coimbra et al. BMC Public Health 2013, 13:52 Page 16 of 19http://www.biomedcentral.com/1471-2458/13/52
indigenous communities. However, despite the widespreadpresence of such wells, interviews with indigenous leadersduring the survey fieldwork commonly revealed complaintsthat problems persisted with their daily functioning, suchas insufficient water tank capacities, broken valves orpumps, and nonexistent connections between dug wellsand installed water tanks, among others.The epidemiological parameters evaluated for indigen-
ous women point to the accentuated occurrence of nutri-tion transition in all regions of Brazil. In total, 30.3% ofindigenous women were classified as overweight and15.8% as obese. There were also important inter-regionaldifferences, with women in the North region presentinglower prevalence rates of overweight and obesity thanthose in the other regions. Previous case studies from dif-ferent indigenous communities in Brazil have documentedsimilarly high prevalence rates of overweight and obesityin adults. For example, obesity was found to affect 22.2%of women among the Suruí, 24.5% among the Xavante,and 30.8% among the Guarani-Kaiowá [19,20,62]. Whereasthe prevalence of obesity observed among indigenouswomen in the National Survey is comparable to that ofnon-indigenous Brazilian women 15–49 years (16.1%),non-indigenous women have a higher prevalence of over-weight (43.1%) according to the 2006 National Demog-raphy and Health Survey [55].The overall prevalence rates of hypertension among
indigenous women was 13.2%, with higher values in theCentral-West (17.5%) and South/Southeast (17.4%).According to the results of the most recent health surveybased on a representative sample of the national non-indigenous population, 24.0% of Brazilian women pre-sented hypertension [63]. The prevalence of anemiaamong non-pregnant indigenous women was also ele-vated, affecting approximately one in three women in theoverall sample. In comparison, the prevalence of anemiaamong non-indigenous women in Brazil is slightly lower(29.4%) [55].Case studies conducted in specific indigenous commu-
nities in Brazil since the 1990s, mainly in the North andCentral-West regions, call attention to high prevalencerates of chronic undernutrition among indigenous chil-dren, characterized by linear growth deficits [21,64-68].The results of the National Survey confirm on a nationalscale that chronic undernutrition, as measured by lowheight-for-age, is in fact a problem of great magnitude,affecting one in four indigenous children in Brazil. Inaddition, approximately half of indigenous children inBrazil were found to have anemia. In contrast, the informa-tion available for non-indigenous Brazilian children in thesame age group indicates lower prevalence rates of anemia(20.9%) and of low height-for-age (7.1%) [33,55]. The nu-tritional profile of the overall child population in Brazil hasbeen interpreted favorably as resulting from the recent
implementation of a universal public healthcare system, aswell as increased sanitation coverage and maternal educa-tion [69]. The notable disparities in health indicatorsobserved between non-indigenous and indigenous childrenin Brazil underscore that these basic services are not yet aswidely distributed in Brazil’s indigenous communities asthey are in the rest of the country.The poor sanitary conditions under which the majority
of Brazil’s indigenous population lives, without access tohuman waste management, proper disposal of garbage,and safe drinking water at home, underlies the NationalSurvey results indicating diarrhea as an important cause ofrecent hospitalization for indigenous children. This situ-ation contrasts with the national Brazilian population, forwhich diarrhea is no longer considered a leading cause ofchild hospital admission in pediatric wards, even in thepoorer regions of the country. For example, in the BrazilianNortheast, where in the 1990s diarrhea represented 57% ofthe total causes of hospitalization for children in the gen-eral population, this rate is now less than 15% [70]. Theseoptimistic national results have been attributed to multiplesanitary interventions under way in Brazil for the last threedecades, reduction in infant undernutrition, and wide-spread availability of oral rehydration therapy through thepublic healthcare system. According to Victora [71], thisset of measures and interventions had such a positive im-pact on child health in Brazil that
“. . .Anyone who has worked with child health in Brazilknows that these declines are real. Hospital admissionsdue to diarrhea have also dropped markedly in thepoorest parts of the country, and it is now difficult, ifnot impossible, to teach our medical students the signsof acute dehydration in children, which once used tobe a common finding in our outpatient and emergencyservices”.
Unfortunately, the results of the National Survey do notpermit the conclusion that the indigenous component ofthe Brazilian population has equal access to these impor-tant advances. The results of this National Survey and re-cent regional studies confirm that diarrhea remains aleading cause of hospitalization for indigenous children,being commonly associated with acute undernutrition anddehydration [25,26,72].The National Survey represents a major step in docu-
menting the health and nutrition conditions of indigenouspeoples in Brazil. Its results provide for the first time theinformation necessary to characterize the health and nu-trition profile of indigenous peoples in Brazil on a nationalscale. One of its most important potential contributions isto identify the social and health inequities that continue toexist among the indigenous peoples in Brazil, as comparedto the non-indigenous population, despite the country
Coimbra et al. BMC Public Health 2013, 13:52 Page 17 of 19http://www.biomedcentral.com/1471-2458/13/52
having made major public health advances in recent de-cades. Such differences tend to increase the gap betweenindigenous and non-indigenous populations in Brazil interms of health and nutrition indicators, as has beendocumented previously in numerous local case studiesconducted in different regions of the country.It is important to emphasize that despite its significance
for characterizing the country’s national and regional indi-genous populations, the design of the National Surveydoes not allow characterization of health conditions forspecific indigenous ethnic groups. Although desirable,doing so would be a logistical challenge of enormousscale, considering that there are more than two hundredindigenous ethnicities in Brazil, some of which have popu-lations of less than 200 people residing in remote and in-accessible locations.
Conclusions and future directionsThe overview of results presented in this article precedesa series of publications reporting on specific issues relatedto the demography and health of Brazil’s indigenous popu-lation based on the National Survey findings. Whereas thepresent article focuses on national and regional prevalencerates of major health and sanitation indicators, these fu-ture articles will report on more diverse sets of variablesand will present statistical analyses to ascertain the asso-ciations between them. A first group of articles will ad-dress nutritional assessment of children, child anemia andassociated factors, morbidity due to diarrhea and acuterespiratory infection in children, and coverage and qualityof prenatal care delivered to women. A second group ofarticles will address nutritional assessment of women,anemia and associated factors in women, blood pressurelevels and hypertension in women, history of malaria inwomen and children, assessment of child BCG vaccin-ation, and household dietary economies.According to its original formulation, the National Survey
was to focus on indigenous women and young childrenresiding within federally recognized villages served by theIndigenous Healthcare Subsystem. As a result, certain seg-ments of Brazil’s indigenous population were not includedin the sample design, namely, men, adolescents, the el-derly of both sexes, as well as Brazil’s self-identified in-digenous population residing outside of the villagesidentified by FUNASA. Future nationally representativedemographic and health surveys of indigenous peoples inBrazil should consider including these population seg-ments, for which few data are currently available.The primary motivation for publishing the present ar-
ticle, as well as the future articles mentioned above, is toaugment the coverage of information deriving from na-tional surveys in Brazil, which never before specificallyaddressed indigenous peoples. However, it is also hopedthat the results presented here and to be published in the
future will stimulate in-depth medium-scale surveys aim-ing to better characterize local health conditions in Brazil’smajor indigenous cultural and geographical regions, aswell as in its more populous ethnic groups. As argued byJokisch and McSweeney [41] in an article reporting theresults of a demographic and health survey of the Shuarpeople, a populous indigenous ethnic group in Ecuador,medium-scale regional surveys are an effective but under-utilized tool that have the potential to fill the gap betweennational surveys of indigenous populations, such as theone reported here, and local case studies, which are thetype most frequently realized due to their lower costs andmore modest logistical requirements. If the National Surveyhas the unique capacity to characterize indigenous healthand sanitation conditions at a national and macro-regionalscale in Brazil, medium-scale surveys will have the bestpotential to uncover the unique local circumstances thatcontribute to these patterns.
EndnotesaThe objectives of the study and some aspects of its
methodology, including the target population, the cat-egories of variables collected, and stratification of thepopulation into four geopolitical regions, were pre-defined through a public request for proposals byFUNASA, the government agency responsible for indi-genous health services at the time of the study, and theWorld Bank. After the study, responsibility for indigen-ous health services and policies were assumed by thenewly created Indigenous Health Secretariat (Secretariade Saúde Indígena), Ministry of Health. bFUNASA didnot have an operational definition for the term “indige-nous village,” apparently using it for any place groups ofIndians lived, regardless of the existence of elements ofsocial organization that could characterize a village orcommunity. This created an important operational diffi-culty because the list included several enigmatic config-urations of “villages,” including those without inhabitants(possibly already abandoned), those with only male inhabi-tants, those comprising small sectors of neighborhoods onthe outskirts of larger cities, and those identified as tran-sient camps within military installations, among others.These situations were verified to the extent possible beforepreparation of the final list of villages to be used for thesample selection. cThis cutoff point was selected becausesuch small numbers of inhabitants would have over-extended the available research budget despite not havinga statistical bearing on the survey results nationally or byregional stratum. dDue to droughts that routinely impactrural areas in the Northeast region, the Brazilian govern-ment promotes the construction of ponds to store rain-water or distributes water directly to communities inwater trucks.

Coimbra et al. BMC Public Health 2013, 13:52 Page 18 of 19http://www.biomedcentral.com/1471-2458/13/52
AbbreviationsABRASCO: Associação Brasileira de Saúde Coletiva; BMI: Body mass index;BP: Blood pressure; CI: Confidence interval; CONEP: Comissão Nacional deÉtica em Pesquisa; ENSP: Escola Nacional de Saúde Pública; FUNAI: FundaçãoNacional do Índio; FUNASA: Fundação Nacional de Saúde; IBGE: InstitutoBrasileiro de Geografia e Estatística; JNC: The Joint National Committee onDetection, Evaluation, and Treatment of High Blood Pressure; MS: Ministérioda Saúde; SPSS: Statistical Package for the Social Sciences; UN: UnitedNations.
Competing interestsThe authors declare that they have no competing interests.
Authors’ contributionsAll authors participated in formulating the research concept and design.CEAC, RVS, JRW, AMC, ER, LG, and BLH participated in field data collection.MCS, AMC, RVS, and BLH conducted statistical analyses. CEAC, RVS, JRW, andAMC wrote the manuscript and all other authors read and commented onthe manuscript. The final paper submitted for publication was read andapproved by all authors.
Authors’ informationCEAC was coordinator-general of the First National Survey of IndigenousPeople’s Health and Nutrition. MLF represented the University of Gothenburgin the research consortium with ABRASCO. AMC, BLH, MLF, and RVSparticipated in coordinating the study. MCS coordinated data entry anddatabase organization. JRW, LG, and ER were senior field researchers.
AcknowledgementsThe Brazilian Ministry of Health and the World Bank provided financialsupport through the Vigisus II project. Equipment was provided by FUNASAand the Escola Nacional de Saúde Pública (ENSP). Support and assistancewere offered by indigenous leaders and community members in all of thevillages surveyed, the project’s team leaders and research assistants, and thestaff at local FUNASA and FUNAI offices. Special note is made of theinvaluable administrative support provided by Maria Nair R. Salvá at ENSPand the staff at ABRASCO who, under the coordination of Alvaro Matida,greatly facilitated travel and financial logistics.
Author details1Escola Nacional de Saúde Pública, Fundação Oswaldo Cruz, Rua LeopoldoBulhões 1480, Rio de Janeiro, RJ 21041-210, Brazil. 2Departamento deAntropologia, Museu Nacional, Universidade Federal do Rio de Janeiro,Quinta da Boa Vista s/n, Rio de Janeiro, RJ 20940-040, Brazil. 3Divisão deEpidemiologia, Instituto Nacional de Câncer, Rua dos Inválidos 212, Rio deJaneiro, RJ 20231-020, Brazil. 4Centro de Pesquisa Leônidas e Maria Deane,Fundação Oswaldo Cruz, Rua Terezina 476, Manaus, AM 69057-070, Brazil.5Departamento de Saúde Coletiva, Instituto de Patologia Tropical e SaúdePública, Universidade Federal de Goiás, Rua 235 s/n, Goiânia, GO 74605-050,Brazil. 6School of Global Studies, University of Gothenburg, Box 700,Göteborg SE-405 30, Sweden. 7Departamento de Medicina Social, Faculdadede Medicina, Universidade Federal de Pelotas, Rua Marechal Deodoro 1160,Pelotas, RS 96001-970, Brazil.
Received: 5 June 2012 Accepted: 15 January 2013Published: 19 January 2013
References1. Cooke M, Mitrou F, Lawrence D, Guimond E, Beavon D: Indigenous well-
being in four countries: an application of the UNDP’s humandevelopment index to indigenous peoples in Australia, Canada, NewZealand, and the United States. BMC Int Health Hum Rights 2007, 7:9.
2. Gracey M, King M: Indigenous health. Part 1: determinants and diseasepatterns. Lancet 2009, 374:65–75.
3. Stephens C, Nettleton C, Porter J, Willis R, Clark S: Indigenous peoples’health - why are they behind everyone, everywhere? Lancet 2005,366:10–13.
4. Torres C: La equidad en materia de salud vista con enfoque étnico. RevPanam Salud Publica 2001, 10:188–201.
5. Montenegro RA, Stephens C: Indigenous health in Latin America and theCaribbean. Lancet 2006, 367:1859–1869.
6. Adelson N: The embodiment of inequity: health disparities in aboriginalCanada. Can J Public Health 2005, 96(Sup. 2):S45–S55.
7. Marmot M: Social determinants and the health of Indigenous Australians.Med J Aust 2011, 194:512–513.
8. Bramley D, Hebert P, Jackson R, Chassin M: Indigenous disparities indisease-specific mortality, a cross-country comparison: New Zealand,Australia, Canada, and the United States. N Z Med J 2004, 117:1–16.
9. Pan WK-Y, Erlien C, Bilsborrow RE: Morbidity and mortality disparitiesamong colonist and indigenous populations in the Ecuadorian Amazon.Soc Sci Med 2010, 70:401–411.
10. Morrissey M: Poverty and Indigenous health. Health Sociol Rev 2003,12:17–30.
11. UN - United Nations: State of the World’s Indigenous Peoples. New York:Secretariat of the Permanent Forum on Indigenous Issues, Department ofEconomic and Social Affairs, United Nations; 2009.
12. IBGE - Instituto Brasileiro de Geografia e Estatística: Censo Demográfico 2010:Características Gerais dos Indígenas. Resultados do Universo. Rio de Janeiro:Instituto Brasileiro de Geografia e Estatística; 2012.
13. Hemming J: The Amazon Frontier: the Defeat of the Brazilian Indians. London:MacMillan Press; 1987.
14. Davis SH: Victims of the Miracle: Development and the Indians of Brazil.Cambridge: Cambridge University Press; 1977.
15. Ribeiro D: Convívio e contaminação: Efeitos dissociativos da depopulaçãoprovocada por epidemias em grupos tribais. Sociologia (São Paulo) 1956,18:3–50.
16. Santos RV, Teixeira P: The “indigenous” category in the 2010 BrazilianNational Census. Cad Saude Publica 2011, 27:1048–1049.
17. Pagliaro H, Azevedo M, Santos RV: Demografia dos povos indígenas noBrasil: Um panorama crítico. In Demografia dos Povos Indígenas no Brasil.Edited by Pagliaro H, Azevedo M, Santos RV. Rio de Janeiro: Editora Fiocruz;2005:11–32.
18. Coimbra CEA Jr, Flowers NM, Salzano FM, Santos RV: The Xavánte inTransition: Health, Ecology, and Bioanthropology in Central Brazil. Ann Arbor:University of Michigan Press; 2002.
19. Lourenço AEP, Santos RV, Orellana JDY, Coimbra CEA Jr: Nutrition transitionin Amazonia: obesity and socioeconomic change in the Suruí Indiansfrom Brazil. Am J Hum Biol 2008, 20:564–571.
20. Welch JR, Ferreira AA, Santos RV, Gugelmin SA, Werneck G, Coimbra CEA Jr:Nutrition transition, socioeconomic differentiation, and gender amongadult Xavante Indians, Brazilian Amazon. Hum Ecol 2009, 37:13–26.
21. Ferreira AA, Welch JR, Santos RV, Gugelmin SA, Coimbra CEA Jr: Nutritionalstatus and growth of indigenous Xavante children, Central Brazil. Nutr J2012, 11(1):3.
22. Godoy R, Reyes-García V, Byron E, Leonard WR, Vadez V: The effect ofmarket economies on the well-being of Indigenous peoples and on theiruse of renewable natural resources. Annu Rev Anthrop 2005, 34:121–138.
23. Coimbra CEA Jr, Basta PC: The burden of tuberculosis in indigenouspeoples in Amazonia, Brazil. Trans R Soc Trop Med Hyg 2007, 101:635–636.
24. Souza-Santos R, Oliveira MVG, Escobar AL, Santos RV, Coimbra CEA Jr:Spatial heterogeneity of malaria in Indian reserves of southwesternAmazonia, Brazil. Int J Health Geogr 2008, 7:55.
25. Cardoso AM, Coimbra CEA Jr, Tavares FG: Hospital morbidity among theGuarani Indians in Southeastern and Southern Brazil. Rev Brasil Epidemiol2010, 13:21–34.
26. Lunardi R, Santos RV, Coimbra CEA Jr: Morbidade hospitalar de indígenasXavante, Mato Grosso, Brasil (2000–2002). Rev Brasil Epidemiol 2007,10:441–452.
27. Cabral AC, Fé NF, Suárez-Mutis MC, Bóia MN, Carvalho-Costa FA: Increasingincidence of malaria in the Negro River basin, Brazilian Amazon. Trans RSoc Trop Med Hyg 2010, 104:556–562.
28. Tavares EF, Vieira-Filho JPB, Andriolo A, Sañudo A, Gimeno SGA, Franco LJ:Metabolic profile and cardiovascular risk patterns of an Indian tribeliving in the Amazon Region of Brazil. Hum Biol 2003, 75:31–46.
29. Meyerfreund D, Goncalves CP, Cunha RS, Pereira AC, Krieger JE, Mill JG:Age-dependent increase in blood pressure in two different NativeAmerican communities in Brazil. J Hypertens 2009, 27:1753–1760.
30. Rocha AKS, Bós AJG, Huttner E, Machado DC: Prevalência da síndromemetabólica em indígenas com mais de 40 anos no Rio Grande do Sul,Brasil. Rev Panam Salud Publica 2011, 29:41–45.
31. Viacava F: Informações em saúde: A importância dos inquéritospopulacionais. Cien Saude Colet 2002, 7:607–621.

Coimbra et al. BMC Public Health 2013, 13:52 Page 19 of 19http://www.biomedcentral.com/1471-2458/13/52
32. Vasconcellos MTL, Silva PLN, Szwarcwald CL: Sampling design for theWorld Health Survey in Brazil. Cad Saude Publica 2005, 21(Sup):S89–S99.
33. Monteiro CA, Benício MHD, Conde WL, Konno S, Lovadino AL, Barros AJD,Victora CG: Narrowing socioeconomic inequality in child stunting: TheBrazilian experience, 1974–2007. Bull World Health Organ 2010, 88:305–311.
34. Szwarcwald CL, Andrade CLT, Bastos FI: Income inequality, residentialpoverty clustering and infant mortality: a study in Rio de Janeiro, Brazil.Soc Sci Med 2002, 55:2083–2092.
35. Sousa A, Hill K, Poz MRD: Sub-national assessment of inequality trends inneonatal and child mortality in Brazil. Int J Equity Health 2010, 9:21.
36. Santos LMP, Paes-Sousa R, Miazagi E, Silva TF, Fonseca AMM: The BrazilianExperience with Conditional Cash Transfers: A Successful Way to ReduceInequity and to Improve Health, World Conference on Social Determinantesof Health. Rio de Janeiro: The World Health Organization; 2011:16.
37. Westphal MF, Zioni F, Almeida MF, Nascimento PR: Monitoring millenniumdevelopment goals in Brazilian municipalities: Challenges to be met infacing up to inequities. Cad Saude Publica 2011, 27(Sup. 2):S155–S163.
38. Coimbra CEA Jr, Santos RV: Saúde, minorias e desigualdade: Algumasteias de inter-relações, com ênfase nos povos indígenas. Cien Saude Colet2000, 5:125–132.
39. San Sebastián M, Hurtig A-K: Review of health research on indigenouspopulations in Latin America, 1995–2004. Salud Publica Mex 2007,49:316–320.
40. Ministério de Salud y Medio Ambiente de la Nación: Diseño y Realización dela Encuesta de Salud Infantil de los Pueblos Originarios: Informe Final. BuenosAires: Ministério de Salud y Medio Ambiente de la Nación; 2007.
41. Jokisch B, McSweeney K: Assessing the potential of indigenous-rundemographic/health surveys: The 2005 Shuar Survey, Ecuador. Hum Ecol2011, 39:683–698.
42. Teixeira P, Brasil M, Silva EM: Demografia de um povo indígena daAmazônia brasileira: Os Sateré-Mawé. Rev Bras Estud Popul 2011, 28:429–448.
43. Benavides M, Magrith y Ponce C: Estado de la Niñez Indígena en el Perú.Lima: Instituto Nacional de Estadistica e Informática - INEI/Fondo de lasNaciones Unidas para la Infancia - UNICEF; 2010.
44. Caldas ADR, Santos RV: Vigilância alimentar e nutricional para os povosindígenas no Brasil: Análise da construção de uma política pública emsaúde. Physis 2012, 22:545–565.
45. Garnelo L, Macedo G, Brandão LC: Os Povos Indígenas e a Construção dasPolíticas de Saúde no Brasil. Brasília: Organização Pan-Americana de Saúde; 2003.
46. Sousa MC, Scatena JHG, Santos RV: O Sistema de Informação da Atençãoà Saúde Indígena (SIASI): Criação, estrutura e funcionamento. Cad SaudePublica 2007, 23:853–861.
47. Guimarães FMS: Divisão Regional do Brasil. Rio de Janeiro: Instituto Brasileirode Geografia e Estatística; 1942.
48. Lemeshow S, Hosmer D, Klar J, Lwanga SK: Adequacy of Sample Size inHealth Studies. Chichester, England: John Wiley & Sons; 1990.
49. Ohlsson E: Sequential poisson sampling. J Off Stat 1998, 14:149–162.50. Lohman TG, Roche AF, Martorell R: Anthropometric Standardization Reference
Manual. Champaign, Illinois: Human Kinetics; 1988.51. Chobanian AV, Bakris GL, Black HR, Cushman WC, Green LA, Izzo JL Jr, Jones
DW, Materson BJ, Oparil S, Wright JT Jr, et al: The Seventh Report of theJoint National Committee on Detection, Evaluation, and Treatment ofHigh Blood Pressure: The JNC 7 Report. JAMA 2003, 289:2560–2571.
52. WHO - World Health Organization: Length/Height-for-Age, Weight-for-Age,Weight-for-Length, Weight-for-Height and Body Mass Index-for-Age: Methodsand Development. Geneva: World Health Organization; 2006.
53. WHO - World Health Organization: Iron Deficiency Anaemia Assessment,Prevention and Control. A Guide for Programme Managers. Geneva: WorldHealth Organization; 2001.
54. Genuth S, Alberti KG, Bennett P, Buse J, Defronzo R, Kahn R, Kitzmiller J,Knowler WC, Lebovitz H, Lernmark A, et al: Follow-up report on thediagnosis of diabetes mellitus. Diabetes Care 2003, 26:3160–3167.
55. MS - Ministério da Saúde: Pesquisa Nacional de Demografia e Saúde daCriança e da Mulher – PNDS 2006: Dimensões do Processo Reprodutivo e daSaúde da Criança, Série G Estatística e Informação em Saúde. Brasília:Ministério da Saúde; Brasília, 2009.
56. Ricardo CA: A sociodiversidade nativa contemporânea no Brasil. In PovosIndígenas no Brasil 1991/1995. Edited by Ricardo CA. São Paulo: InstitutoSocioambiental; 1996:i–xii.
57. Abreu MA: European conquest, Indian subjection and the conflicts ofcolonization: Brazil in the early modern era. GeoJournal 2004, 60:365–373.
58. Fewtrell L, Kaufmann RB, Kay D, Enanoria W, Haller L, Colford JJM: Water,sanitation, and hygiene interventions to reduce diarrhoea in lessdeveloped countries: A systematic review and meta-analysis. Lancet InfectDis 2005, 5:42–52.
59. Esrey SA, Habicht J: Epidemiologic evidence for health benefits fromimproved water and sanitation in developing countries. Epidemiol Rev1986, 8:117–128.
60. Victora CG, Smith PG, Vaughan JP, Nobre LC, Lombardi C, Teixeira AM,Fuchs SC, Moreira LB, Gigante LP, Barros FC: Water supply, sanitation andhousing in relation to the risk of infant mortality from diarrhoea.Int J Epidemiol 1988, 17:651–654.
61. IBGE - Instituto Brasileiro de Geografia e Estatística: Pesquisa Nacional deSaneamento Básico - 2008. Rio de Janeiro: Instituto Brasileiro de Geografiae Estatística; 2010.
62. Oliveira GF, Oliveira TR, Rodrigues FF, Correa LF, de Arruda TB, Casulari LA:Prevalence of metabolic syndrome in the indigenous population, aged19 to 69 years, from Jaguapiru Village, Dourados (MS), Brazil. Ethn Dis2011, 21:301–306.
63. IBGE - Instituto Brasileiro de Geografia e Estatística: Pesquisa Nacional porAmostra de Domicílios. Um Panorama da Saúde no Brasil: Acesso e Utilizaçãodos Serviços, Condições de Saúde e Fatores de Risco e Proteção à Saúde -2008. Rio de Janeiro: Instituto Brasileiro de Geografia e Estatística; 2010.
64. Orellana JDY, Coimbra CEA Jr, Lourenço AEP, Santos RV: Estado nutricional eanemia em crianças Suruí, Amazônia, Brasil. J Pediatr (Rio J) 2006, 82:383–388.
65. Santos RV, Coimbra CEA Jr: Socioeconomic transition and physical growthof Tupí-Mondê Amerindian children of the Aripuanã Park, BrazilianAmazon. Hum Biol 1991, 63:795–819.
66. Mondini L, Rodrigues D, Gimeno SGA, Baruzzi RG: Estado nutricional e níveisde hemoglobina em crianças Aruak e Karibe: Povos indígenas do AltoXingu, Brasil Central, 2001–2002. Rev Brasil Epidemiol 2009, 12:469–477.
67. Kühl AM, Corso ACT, Leite MS, Bastos JL: Perfil nutricional e fatoresassociados à ocorrência de desnutrição entre crianças indígenasKaingáng da Terra Indígena de Mangueirinha, Paraná, Brasil. Cad SaudePublica 2009, 25:409–420.
68. Leite MS, Santos RV, Coimbra CEA Jr: Sazonalidade e estado nutricional depopulações indígenas: O caso Wari’, Rondônia, Brasil. Cad Saude Publica2007, 23:2631–2642.
69. Monteiro CA, Benício MHA, Konno SC, Silva ACF, Conde WL: Causes for thedecline in child under-nutrition in Brazil, 1996–2007. Rev Saude Publica2009, 43:35–43.
70. Victora CG, Bryce J, Fontaine O, Monasch R: Reducing deaths fromdiarrhoea through oral rehydration therapy. Bull World Health Organ 2000,78:1246–1255.
71. Victora CG: Diarrhea mortality: what can the world learn from Brazil?J Pediatr (Rio J) 2009, 85:3–5.
72. Orellana JDY, Basta PC, Santos RV, Coimbra CEA Jr: Morbidade hospitalarem crianças indígenas Suruí menores de dez anos, Rondônia, Brasil:2000 a 2004. Revista Brasileira de Saúde Materno Infantil 2007, 7:281–287.
doi:10.1186/1471-2458-13-52Cite this article as: Coimbra et al.: The First National Survey ofIndigenous People’s Health and Nutrition in Brazil: rationale,methodology, and overview of results. BMC Public Health 2013 13:52.
Submit your next manuscript to BioMed Centraland take full advantage of:
• Convenient online submission
• Thorough peer review
• No space constraints or color figure charges
• Immediate publication on acceptance
• Inclusion in PubMed, CAS, Scopus and Google Scholar
• Research which is freely available for redistribution
Submit your manuscript at www.biomedcentral.com/submit