research article open access performance of four computer
TRANSCRIPT

Medicine for Global Health
Desai et al. BMC Medicine 2014, 12:20http://www.biomedcentral.com/1741-7015/12/20
RESEARCH ARTICLE Open Access
Performance of four computer-coded verbalautopsy methods for cause of death assignmentcompared with physician coding on 24,000 deathsin low- and middle-income countriesNikita Desai1, Lukasz Aleksandrowicz1, Pierre Miasnikof1, Ying Lu2, Jordana Leitao1, Peter Byass3,4,Stephen Tollman4,5,6, Paul Mee4,5, Dewan Alam7, Suresh Kumar Rathi1, Abhishek Singh8, Rajesh Kumar9,Faujdar Ram8 and Prabhat Jha1*
Abstract
Background: Physician-coded verbal autopsy (PCVA) is the most widely used method to determine causes ofdeath (CODs) in countries where medical certification of death is uncommon. Computer-coded verbal autopsy(CCVA) methods have been proposed as a faster and cheaper alternative to PCVA, though they have not beenwidely compared to PCVA or to each other.
Methods: We compared the performance of open-source random forest, open-source tariff method, InterVA-4, andthe King-Lu method to PCVA on five datasets comprising over 24,000 verbal autopsies from low- and middle-incomecountries. Metrics to assess performance were positive predictive value and partial chance-corrected concordance atthe individual level, and cause-specific mortality fraction accuracy and cause-specific mortality fraction error at thepopulation level.
Results: The positive predictive value for the most probable COD predicted by the four CCVA methods averagedabout 43% to 44% across the datasets. The average positive predictive value improved for the top three most probableCODs, with greater improvements for open-source random forest (69%) and open-source tariff method (68%) than forInterVA-4 (62%). The average partial chance-corrected concordance for the most probable COD predicted by theopen-source random forest, open-source tariff method and InterVA-4 were 41%, 40% and 41%, respectively, with betterresults for the top three most probable CODs. Performance generally improved with larger datasets. At the populationlevel, the King-Lu method had the highest average cause-specific mortality fraction accuracy across all five datasets(91%), followed by InterVA-4 (72% across three datasets), open-source random forest (71%) and open-source tariffmethod (54%).
Conclusions: On an individual level, no single method was able to replicate the physician assignment of COD morethan about half the time. At the population level, the King-Lu method was the best method to estimate cause-specificmortality fractions, though it does not assign individual CODs. Future testing should focus on combining differentcomputer-coded verbal autopsy tools, paired with PCVA strengths. This includes using open-source tools applied tolarger and varied datasets (especially those including a random sample of deaths drawn from the population), so as toestablish the performance for age- and sex-specific CODs.
Keywords: Causes of death, Computer-coded verbal autopsy (CCVA), InterVA-4, King-Lu, Physician-certified verbalautopsy (PCVA), Random forest, Tariff method, Validation, Verbal autopsy
* Correspondence: [email protected] for Global Heath Research, St. Michael’s Hospital, Dalla Lana Schoolof Public Health, University of Toronto, Toronto, Ontario, CanadaFull list of author information is available at the end of the article
© Desai et al.; licensee BioMed Central LCommons Attribution License (http://creativecreproduction in any medium, provided the or
2014
td. This is an open access article distributed under the terms of the Creativeommons.org/licenses/by/2.0), which permits unrestricted use, distribution, andiginal work is properly cited.
Desai et al. BMC Medicine Page 2 of 82014, 12:20http://www.biomedcentral.com/1741-7015/12/20
BackgroundVerbal autopsy (VA) is used in areas with limited medicalcertification of death to obtain information on causes ofdeath (CODs) [1-3]. VA tools typically consist of a structuredsurvey administered to a close relative or associate of thedeceased by a trained field worker, to record the signs andsymptoms that occurred before death. This information isused to assign the most probable COD, most often viaphysician-certified verbal autopsy coding (PCVA).PCVA has limitations in inter- and intra-observer differ-
ences in coding [3], but remains widely useful, particularlyin establishing population-based estimates of the majorCODs [1]. There has been interest in the use of computer-coded VA (CCVA) methods to automate COD assignment[3]. CCVA methods are, in theory, cheaper, faster and moreconsistent over time - but their performance against PCVAand against each other has not yet been assessed reliably.Here, we compare the performance of four of the most
promising CCVA methods - InterVA-4, King-Lu (KL), opensource random forest (ORF) and open source tariff method(OTM) - across VA studies in several countries, coveringmore than 24,000 deaths, including community- andhospital-based deaths (Table 1). We define performanceby their ability to replicate physician coding.
MethodsDatasetsTable 1 summarizes important features of the five VAdatasets. The datasets from the Matlab study in Bangladesh[4], from China [5], from Agincourt, South Africa [6],and a published study of the Institute for Health Metricsand Evaluation (IHME) [7,8] comprised adult deaths.The Indian Million Death Study (MDS) [9,10] includedonly child deaths from ages 1 to 59 months. Each study
Table 1 Dataset specifications
Variable China Institute for HealthMetrics and Evaluat
Region China N/Aa
Sample size 1,502 1,556
Ages 15+ years 15 to 105 years
Number of CODs 31 32
Population Hospital deaths Hospital deaths
Proportion ill-defined deathsb 0% 0%
Physician coding Coding by a panelof three physiciansassisted with medicalrecords and diagnostictests
Coding by onephysician assistedwith medical recordsand diagnostic tests
All VA data in the Million Death Study, Agincourt and Matlab studies were collectedhospital-based dataset includes 12,000 VA records from India, Philippines, Tanzaniawith the study team suggested these data were from Bangladesh but the full detaiClassification of Diseases-10 codes R95-R99. VA, verbal autopsy.
used different field procedures, although with similar col-lection of major symptoms for each death. Physician cod-ing guidelines and procedures also varied but generallyinvolved at least one doctor examining each record. TheChina and IHME datasets involved physician coding ofhospital-based deaths with additional information onmedical histories and diagnostic tests. The four CCVAmethods were tested on all five datasets with each study’sPCVA assignment as the reference standard. We could nottest InterVA-4 on the China and IHME data due to theunavailability of a data dictionary at the time of analysis.
Computer-coded verbal autopsy methodsInterVA-4InterVA-4 assigns CODs using a Bayesian model with apriori probabilities based on expert consensus. InterVA-4version 4.02 was used in this study, and the programwith a full description of its logic can be freely obtainedonline [11].
Open-source random forestThe ORF is a data-driven, probabilistic method that buildsupon a similar tool published by IHME [12]. Random forestand tariff methods have been described as having unrivaledperformance against all other VA coding methods [12].However, at the time of writing, these two methodswere not publicly available, and their results have not yetbeen independently replicated. We thus ‘reverse-engi-neered’ these two methods into open-source tools (detailsare in Additional file 1). An independent programmingexpert reviewed the algorithm to assess replication of theIHME method (to the extent of the published details),and we compared the ORF performance on the IHME dataavailable to us to the published results of the IHME
ionMillion Death Study Agincourt Matlab
India South Africa Bangladesh
12,225 5,823 3,270
1 to 59 months 15 to 64 years 20 to 64 years
15 17 17
Community deaths Community deaths Community deaths
3% 12% 2%
Dual, independentcoding of VA records,disagreements resolvedby reconciliation, andfor remaining cases byadjudication by a thirdphysician
Dual, independentcoding of VA records,disagreements resolvedby third physician.
Single physicianre-coding of VArecords after initialcoding by anotherphysician.
by non-medical field staff, and coded by medical staff. aThe full IHMEand Mexico and was released after this paper went to press; correspondencels of the 1,556 deaths are not published. bIll-defined deaths are International
Desai et al. BMC Medicine Page 3 of 82014, 12:20http://www.biomedcentral.com/1741-7015/12/20
methods (Figure 1). The ORF showed very similar trends tothose from the IHME random forest, though differenceswere to be expected due to the unavailability of the fullIHME hospital-based dataset [7]. In addition, 96 symptomindicators were used by ORF whereas the IHME methodused only the top 40 most-predictive symptoms, the detailsof which were unavailable [12].
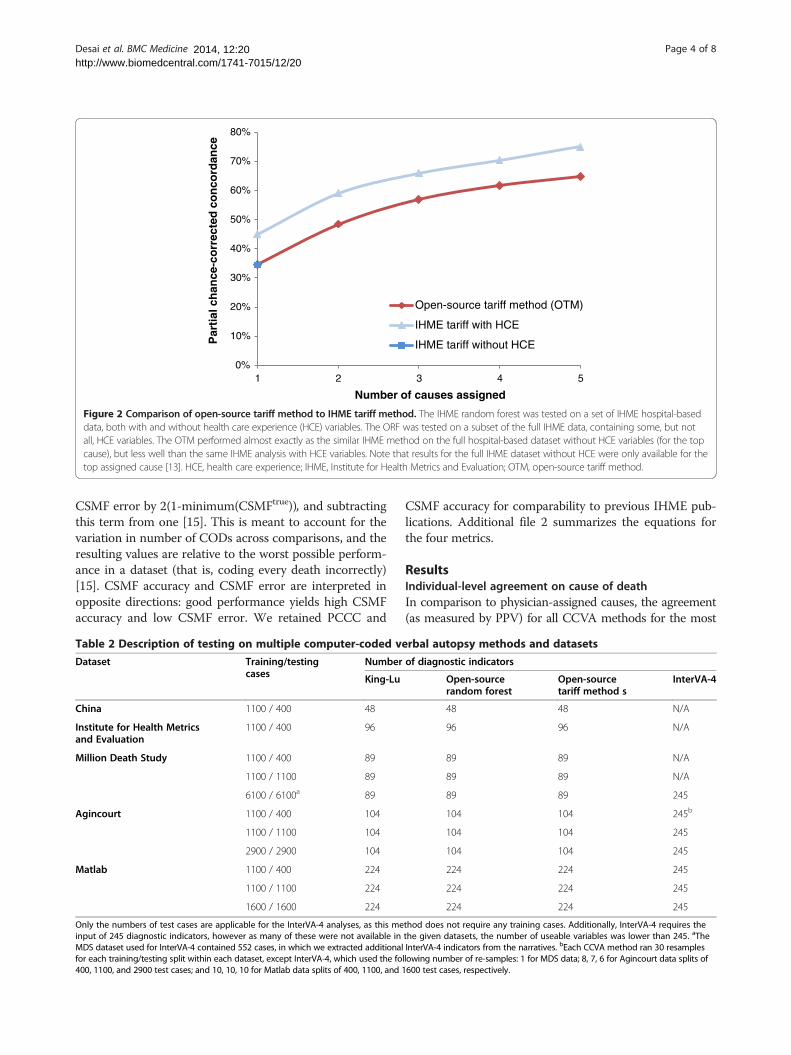
Open-source tariff methodThe OTM is a data-driven, probabilistic method that buildsupon that published by IHME [13]. The OTM performanceon the IHME data available to us was comparable to theresults of the IHME method (Figure 2). The resultingdifferences may be due to similar factors as those men-tioned in the ORF description above.
King-Lu methodThe KL method directly estimates cause-specific mortalityfractions (CSMFs) without assigning individual CODs.Version 0.9-2.12 was used, for which a full descriptionof the method and discussions of its performance havebeen published [5], and which is available for download[14].
TestingDataset splits and resamplingInterVA-4 uses pre-assigned Bayesian probabilities to assignthe COD and thus does not require a training component.
0%
10%
20%
30%
40%
50%
60%
70%
80%
1 2 3 4 5
Par
tial
ch
ance
-co
rrec
ted
co
nco
rdan
ce
Number of causes assigned
Open-source random forest (ORF)
IHME random forest without HCE
IHME random forest with HCE
Figure 1 Comparison of open-source random forest to IHMErandom forest. The IHME random forest was tested on a set of IHMEhospital-based data, both with and without health care experience (HCE)variables. HCE variables are binary questions on previous medicallydiagnosed conditions (including high blood pressure, tuberculosis, cancer),and details transcribed from the respondents’ medical records. Our IHMEsubset contained some, but not all, HCE variables. The ORF performancewas similar to the IHME random forest method on the full hospital-baseddataset without HCE variables, but performed less well when HCEvariables were included [12]. HCE, health care experience; IHME, Institutefor Health Metrics and Evaluation; ORF, open-source random forest.
The remaining three methods required a training com-ponent, consisting of a subset of the original data withassigned CODs, from which the method learned the cause-specific symptom profiles. The trained algorithm was thenused to predict CODs in the test dataset.Table 2 describes the training and testing samples used
in the comparisons. Three sample sizes of the datasetswere used to highlight changes in performance based onvarying dataset sizes (training/testing splits of 1,100/400and 1,100/1,100 cases, and a split of the full dataset intoan equal number of training and testing cases, whose sizevaried by dataset.) The IHME and China datasets wererelatively small (approximately 1,500 cases), which onlyallowed for the 1100/400 split. Each of the split sizesabove were randomly repeated (random splits of the ori-ginal dataset into the specified number of training andtesting cases) 30 times. However, the performance of themethods converged (that is, did not alter by more than0.5% compared to the average of any previousresamples [15]) well before the full 30 resamples wererun.The required format of input data varied by assignment
method. Two slightly modified versions of each ori-ginal dataset were created; one version to be used forthe data-driven methods (ORF, OTM, KL), and anotherfor InterVA-4, which only uses specific indicators [16].InterVA-4 testing on the MDS dataset used 552 childdeaths, which had additional details extracted from theMDS narratives to match the required InterVA-4 inputs.Resampling was not done on these 552 records due to thesmall sample size.
Performance metricsPositive predictive value (PPV) and partial chance-correctedconcordance (PCCC) were used to measure agreementfor individual COD assignment. PPV is the proportionof assigned CODs that were the ‘true’ COD (hereaftercalled reference COD), and is a common metric in hospital-based VA comparison studies [17]. PCCC is a variationon the PPV, meant to account for correct COD assign-ments made purely by chance [15]. As the CCVAmethods could assign each VA record several CODswith varying probabilities, we calculated PPV andPCCC for agreement between the reference COD andthe CCVA’s most probable COD, and for the threemost probable CODs. These two measures were simplyinterpreted as whether the reference COD matched theCCVA method’s most probable cause, or matched oneof the three most probable causes.At the population level, accuracy was measured using
CSMF absolute accuracy and error. CSMF error is theabsolute difference between the estimated and referenceCSMFs, summed across all causes. CSMF accuracy, as pro-posed by Murray et al., is determined by dividing the
0%
10%
20%
30%
40%
50%
60%
70%
80%
1 2 3 4 5
Par
tial
ch
ance
-co
rrec
ted
co
nco
rdan
ce
Number of causes assigned
Open-source tariff method (OTM)
IHME tariff with HCE
IHME tariff without HCE
Figure 2 Comparison of open-source tariff method to IHME tariff method. The IHME random forest was tested on a set of IHME hospital-baseddata, both with and without health care experience (HCE) variables. The ORF was tested on a subset of the full IHME data, containing some, but notall, HCE variables. The OTM performed almost exactly as the similar IHME method on the full hospital-based dataset without HCE variables (for the topcause), but less well than the same IHME analysis with HCE variables. Note that results for the full IHME dataset without HCE were only available for thetop assigned cause [13]. HCE, health care experience; IHME, Institute for Health Metrics and Evaluation; OTM, open-source tariff method.
Desai et al. BMC Medicine Page 4 of 82014, 12:20http://www.biomedcentral.com/1741-7015/12/20
CSMF error by 2(1-minimum(CSMFtrue)), and subtractingthis term from one [15]. This is meant to account for thevariation in number of CODs across comparisons, and theresulting values are relative to the worst possible perform-ance in a dataset (that is, coding every death incorrectly)[15]. CSMF accuracy and CSMF error are interpreted inopposite directions: good performance yields high CSMFaccuracy and low CSMF error. We retained PCCC and
Table 2 Description of testing on multiple computer-coded ve
Dataset Training/testingcases
Number
King-Lu
China 1100 / 400 48
Institute for Health Metricsand Evaluation
1100 / 400 96
Million Death Study 1100 / 400 89
1100 / 1100 89
6100 / 6100a 89
Agincourt 1100 / 400 104
1100 / 1100 104
2900 / 2900 104
Matlab 1100 / 400 224
1100 / 1100 224
1600 / 1600 224
Only the numbers of test cases are applicable for the InterVA-4 analyses, as this meinput of 245 diagnostic indicators, however as many of these were not available inMDS dataset used for InterVA-4 contained 552 cases, in which we extracted additionalfor each training/testing split within each dataset, except InterVA-4, which used the fo400, 1100, and 2900 test cases; and 10, 10, 10 for Matlab data splits of 400, 1100, and 1
CSMF accuracy for comparability to previous IHME pub-lications. Additional file 2 summarizes the equations forthe four metrics.
ResultsIndividual-level agreement on cause of deathIn comparison to physician-assigned causes, the agreement(as measured by PPV) for all CCVA methods for the most
rbal autopsy methods and datasets
of diagnostic indicators
Open-sourcerandom forest
Open-sourcetariff method s
InterVA-4
48 48 N/A
96 96 N/A
89 89 N/A
89 89 N/A
89 89 245
104 104 245b
104 104 245
104 104 245
224 224 245
224 224 245
224 224 245
thod does not require any training cases. Additionally, InterVA-4 requires thethe given datasets, the number of useable variables was lower than 245. aTheInterVA-4 indicators from the narratives. bEach CCVA method ran 30 resamplesllowing number of re-samples: 1 for MDS data; 8, 7, 6 for Agincourt data splits of600 test cases, respectively.
Desai et al. BMC Medicine Page 5 of 82014, 12:20http://www.biomedcentral.com/1741-7015/12/20
probable COD averaged 43% to 44% for all datasets, withthe highest PPV being 58% for ORF, followed by 52% forOTM, both on the MDS data (Table 3). The average PPVimproved for the top three most probable CODs, withgreater improvements for ORF (69%) and OTM (68%) thanfor InterVA-4 (62%). Similar results were seen using PCCC(Table 4): the average PCCC for the most probable CODacross the datasets, using ORF, OTM and InterVA-4,was 41%, 40% and 41%, respectively. The average PCCCimproved for the top three most probable CODs to 67%,62% and 58%, respectively.The values of PPV and PCCC rose with larger training
and testing datasets, suggesting that their results werepartly dependent on having a sufficient number of trainingcases for each COD. The confidence intervals for thesemetrics were narrow as they mostly represented randomresampling, and did not express the true underlying un-certainty in the data arising from misclassification ofcauses. Additional file 3 provides detailed results for eachof the four metrics, including the confidence intervals.
Population-level agreement on cause-specificmortality fractionKL had the best average CSMF accuracy across all fivedatasets (91%), followed by InterVA-4 (72% across threedatasets), ORF (71%) and OTM (54%). Except for KL, theremaining CCVA methods traded best performance bydataset, with no clear trend (Table 5). CSMF error yieldedsimilar results, with KL having the lowest error scores(Additional file 3).Using the MDS data, KL had the closest similarity to
the ranking of population-level CODs as compared toPCVA, with the top three causes in children under 5 yearsbeing the same (acute respiratory infection, diarrhealdiseases, and other and unspecified infections; Additionalfile 3). ORF ended up with the same top three, but rankedother and unspecified infections ahead of acute respiratoryinfections, and ahead of diarrheal diseases. In the Agincourt
Table 3 Positive predictive values of computer-coded verbalreference standards
Test cases
Open-source random forest
Dataset Top (%) Top 3 (%)
China 400 35 57
Institute for Health Metricsand Evaluation
400 33 55
Million Death Study 6100 58 82
Agincourt 2900 45 77
Matlab 1600 49 74
Average 44 69
Top cause represents accuracy of the CCVA method’s most probable cause matchinprobable causes contain the cause assigned by PCVA. Averages calculated across Cdataset used for InterVA-4 contained a sample of 552 cases, in which we extracted
data, KL performed better than ORF, matching the topthree causes but not in the same ranking as PCVA. Bycontrast, ORF, somewhat inexplicably, ranked maternaldeaths as the second most common COD. In the Matlabdata, both KL and ORF showed similar performance inranking CODs, accurately matching the top three causes.Results for InterVA-4 varied across the comparisons.
DiscussionThis is the largest comparison study yet done of CCVAand PCVA methods. We found that, at an individuallevel, ORF, OTM and InterVA-4 replicated the coding ofphysicians comparably, but that the average agreementlevel for the leading COD was about 50%. Agreementwith the physician-assigned code rose substantially forall CCVA methods if the three most probable CODs wereconsidered, and generally improved with larger subsetswithin a given study. On a population level, the KL methodperformed best in terms of CSMF accuracy and error, andreplicated the CSMF distribution of PCVA in the originaldatasets fairly well. ORF did not outperform KL, even onthe IHME dataset, and did not perform better thanInterVA-4, despite claims to the contrary [18]. At the indi-vidual level, InterVA-4, which does require training on adataset, produced broadly comparable results to themethods that do require training.Comparison to physician coding as a reference standard
poses several methodological challenges. Importantly, ourstudy focused on CCVA replication of physician codes (anderrors), and not whether the underlying COD assigned bythe physician was correct. Validation of PCVA is limitedby the lack of a true reference standard in countries whereverbal autopsy is performed [1-3,9]. Nonetheless, PCVAwith good quality control can yield useful results on CODdistributions in countries where medical certificationremains uncommon [1]. The studies we included in thecomparisons had physician coding done with reasonablygood levels of quality control [4-7,9] as shown by a low
autopsy methods versus physician-coded verbal autopsy
Open-source tariff method InterVA-4 Average fortop cause (%)Top (%) Top 3 (%) Top (%) Top 3 (%)
36 70 N/A N/A 36
34 53 N/A N/A 34
52 76 42a 63a 51
42 69 42 58 43
52 74 48 64 50
43 68 44 62
g the cause assigned by PCVA; Top 3 represents whether CCVA’s three mostCVA methods only use results for the top cause. aThe Million Death Studyadditional InterVA-4 indicators from the narratives.
Table 4 Partial chance-corrected concordance of computer-coded verbal autopsy methods versus physician-coded verbalautopsy reference standards
Dataset Test cases
Open-source random forest Open-source tariff method InterVA-4 Average fortop cause (%)Top (%) Top 3 (%) Top (%) Top 3 (%) Top (%) Top 3 (%)
China 400 33 55 32 64 N/A N/A 33
Institute for Health Metricsand Evaluation
400 31 54 32 48 N/A N/A 32
Million Death Study 6100 55 81 48 70 38a 60a 47
Agincourt 2900 42 75 38 62 39 56 40
Matlab 1600 45 72 48 68 45 59 46
Average 41 67 40 62 41 58
Top cause represents accuracy of the CCVA method’s most probable cause matching the cause assigned by PCVA; Top 3 represents whether CCVA’s three mostprobable causes contain the cause assigned by PCVA. Averages calculated across CCVA methods only use results for the top cause. aThe Million Death Studydataset used for InterVA-4 contained a sample of 552 cases, in which we attempted to extract additional InterVA-4 indicators from the narratives.
Desai et al. BMC Medicine Page 6 of 82014, 12:20http://www.biomedcentral.com/1741-7015/12/20
proportion of ill-defined deaths. Physician coding thatcontains large amounts of random errors would reduceagreement on a COD in the dual-physician coding system,and would tend to increase the number of unspecified CODsin the International Classification of Diseases (ICD-10)[19], such as ‘senility’ (ICD-10 code R54) or ‘cause not de-termined’ (ICD-10 code R99). This would in turn make itharder for CCVA methods to identify specific causes.Moreover, the size of the errors or biases in CCVA methodsdepends on the inherent errors and biases of PCVA results.This is particularly relevant for machine learning, as its ac-curacy requires learning on “true” class labels. Highmisclassification rates in the training set will also affectperformance in the testing set across datasets, as noted re-cently on the full IHME dataset [20].The performance of each CCVA method at individual
assignment improved when trained and tested on a largernumber of cases, most likely due to a greater number ofcases from which to learn the distinct relationships betweenspecific symptom profiles and CODs. The differences inthe field and coding methods across studies would tend toreduce the observed differences in PCVA and CCVA be-tween the various comparisons (and more likely so at theindividual level than at the population level). This might
Table 5 Cause-specific mortality fraction accuracy of computeverbal autopsy reference standards
Datasets Test cases King-Lu (%) Open-sorandom
China 400 84 79
Institute for Health Metricsand Evaluation
400 88 73
Million Death Study 6100 96 64
Agincourt 2900 94 72
Matlab 1600 95 69
Average 91 71aThe Million Death Study dataset used for InterVA-4 contained a sample of 552 casethe narratives.
have contributed to the observed comparability of the re-sults for the four CCVA methods. With larger studiesand more standardized field and physician coding methods,any real, underlying differences between various CCVAmethods may become apparent. Finally, we note thatInterVA-4 has a threshold of probability for designating themost probable cause (that is, the most probable cause mustalso have a probability above 50%, otherwise the death isclassified as indeterminate), whereas ORF and OTM selectthe most probable causes without applying any thresholds.On an individual level, no single method was able to
replicate physician assignment of COD more than abouthalf the time. At the population level, the King-Lu methodwas the best method to estimate CSMFs, though it doesnot assign individual CODs. However, good population-level agreement accuracy does not guarantee good individ-ual agreement [21,22]. A key methodological feature isthe need to avoid the false gold standard of hospital-baseddeaths [1,3]. Reliance on hospital or urban-based deathsfor training of automated methods may lead to learning ofsymptom patterns and other features that are not represen-tative of populations without medical attention. Indeed, theCSMFs between home and hospital deaths are dissimilar,as demonstrated in India [23].
r-coded verbal autopsy methods versus physician-coded
urceforest (%)
Open-sourcetariff method (%)
InterVA-4 (%) Average (%)
75 N/A 79
63 N/A 75
33 70a 66
38 75 70
59 72 74
54 72
s, in which we attempted to extract additional InterVA-4 indicators from
Desai et al. BMC Medicine Page 7 of 82014, 12:20http://www.biomedcentral.com/1741-7015/12/20
Our study is the largest cross-country comparison ofcurrent CCVA methods versus PCVA, covering about twiceas many deaths as an earlier multi-country study [7],and including a mix of various ages, and community andhospital deaths. Nonetheless, we faced certain limitations.First, we could not compare the original IHME randomforest and tariff algorithms, though the original methodswere re-created to the best of our abilities from the pub-lished descriptions [12,13], yielding broadly similar results(Figures 1 and 2). Second, access during the analyses phaseto the full IHME hospital-based dataset of 12,000 recordswould have allowed more robust comparisons. Similarly,the China dataset was also somewhat limited by the smallsample size.
ConclusionsDifferent CCVA methods have various strengths andweaknesses depending on the study scenario and studyobjective. An ideal solution could involve a combinationof automated methods to obtain robust individual- andpopulation-level estimates. In the medium term, it appearsunwise and certainly premature to recommend that auto-mated systems replace physicians in coding VAs. CCVAmethods could be used in parallel with physician codingto increase speed, efficiency and quality of coding. Futurework may focus on the performance of a combination ofvarious automated methods, and must extend to largerdatasets and explore specifics for important age groups(children, maternal, adult), by gender, and across varioussettings of home- and hospital-based deaths. Future studiesneed to also place specific emphasis on testing computerbased methods on a random sample of deaths in coun-tries, as this would be much more useful in determiningthe true underlying CSMF at the population level [24].
Additional files
: Details of the open-source random forest and tariffmethods. Explanation of the major logical steps of the open-sourcerandom forest and tariff methods.
: Description of comparison metrics. Formulas andexplanation of positive predictive value, partial chance-correctedconcordance, CSMF error and CSMF accuracy.
: Full results of CCVA comparisons on severaldataset splits. Results presented by CCVA method, dataset, datasetsplits, and top and top-three cause of death predictions.
AbbreviationsCCVA: computer-coded verbal autopsy; COD: cause of death; CSMF: cause-specificmortality fraction; HCE: health care experience; ICD-10: International Classificationof Diseases-10; IHME: Institute for Health Metrics and Evaluation; KL: King-Lu verbalautopsy method; MDS: Million Death Study; ORF: open-source random forest;OTM: open-source tariff method; PCCC: partial chance-corrected concordance;PCVA: physician-certified verbal autopsy; PPV: positive predictive value;VA: verbal autopsy.
Competing interestsThe authors declare that they have no competing interests.
Additional file 1
Additional file 2
Additional file 3
Authors’ contributionsND, LA and PM conducted the analysis. All authors contributed to datainterpretation and critical revisions of the paper. All authors read andapproved the final manuscript.
AcknowledgementsWe thank Khaled Hasan for help with data formatting, and Michael Palmerfor editorial assistance and Abraham Flaxman for guidance on IHME datasets.
Author details1Centre for Global Heath Research, St. Michael’s Hospital, Dalla Lana Schoolof Public Health, University of Toronto, Toronto, Ontario, Canada. 2Center forthe Promotion of Research Involving Innovative Statistical Methodology,Steinhardt School of Culture, Education and Human Development, New YorkUniversity, New York, NY, USA. 3WHO Collaborating Centre for VerbalAutopsy, Umeå Centre for Global Health Research, Umeå University, Umeå,Sweden. 4Umeå Centre for Global Health Research, Division of Epidemiologyand Global Health, Department of Public Health and Clinical Medicine, UmeåUniversity, Umeå, Sweden. 5Medical Research Council/Wits University RuralPublic Health and Health Transitions Research Unit (Agincourt), School ofPublic Health, Faculty of Health Sciences, University of the Witwatersrand,Johannesburg, South Africa. 6International Network for the DemographicEvaluation of Populations and Their Health (INDEPTH) Network, Accra, Ghana.7International Centre for Diarrhoeal Disease Research, Bangladesh (ICDDR,B),Dhaka, Bangladesh. 8International Institute for Population Sciences, Mumbai,Maharashtra, India. 9School of Public Health, Post Graduate Institute ofMedical Research and Education, Chandigarh, India.
Received: 2 September 2013 Accepted: 1 November 2013Published:
References1. Jha P: Counting the dead is one of the world’s best investments to
reduce premature mortality. Hypothesis 2012, 10:e3.2. Setel PW, Sankoh O, Rao C, Velkoff VA, Mathers C, Gonghuan Y, Hemed Y,
Jha P, Lopez AD: Sample registration of vital events with verbal autopsy:a renewed commitment to measuring and monitoring vital statistics.Bull World Health Organ 2005, 83:611–617.
3. Fottrell E, Byass P: Verbal autopsy: methods in transition. Epidemiol Rev2010, 32:38–55.
4. Health and Demographic Surveillance Unit: Health and DemographicSurveillance System: Matlab. Volume 36: Registration of Health andDemographic Events 2003. Dhaka: ICDDR, B; 2005.
5. King G, Lu Y: Verbal autopsy methods with multiple causes of death.Statistical Science 2008, 23:78–91.
6. Kahn K, Collinson MA, Gómez-Olivé FX, Mokoena O, Twine R, Mee P, Afolabi SA,Clark BD, Kabudula CW, Khosa A, Khoza S, Shabangu MG, Silaule B, TibaneJB, Wagner RG, Garenne ML, Clark SJ, Tollman SM: Profile: Agincourthealth and socio-demographic surveillance system. Int J Epidemiol 2012,41:988–1001.
7. Murray CJ, Lopez AD, Black R, Ahuja R, Ali SM, Baqui A, Dandona L, Dantzer E,Das V, Dhingra U, Dutta A, Fawzi W, Flaxman AD, Gómez S, Hernández B,Joshi R, Kalter H, Kumar A, Kumar V, Lozano R, Lucero M, Mehta S, Neal B,Ohno SL, Prasad R, Praveen D, Premji Z, Ramírez-Villalobos D, Remolador H,Riley I, et al: Population Health Metrics Research Consortium gold standardverbal autopsy validation study: design, implementation, anddevelopment of analysis datasets. Popul Health Metr 2011, 9:27.
8. Green ST, Flaxman AD: Machine learning methods for verbal autopsy indeveloping countries. In AAAI Spring Symposium on Artificial Intelligence forDevelopment (AI-D): March 22-24 2010; Stanford. Stanford: StanfordUniversity; 2010 [https://github.com/aflaxman/verbal-autopsy-challenge]
9. Jha P, Gajalakshmi V, Gupta PC, Kumar R, Mony P, Dhingra N, Peto R:Prospective study of one million deaths in India: rationale, design, andvalidation results. PLoS Med 2006, 3:e18.
10. Million Death Study Collaborators, Bassani DG, Kumar R, Awasthi S, Morris SK,Paul VK, Shet A, Ram U, Gaffey MF, Black RE, Jha P: Causes of neonatal andchild mortality in India: a nationally representative mortality survey. Lancet2010, 376:1853–1860.
11. Byass P, Chandramohan D, Clark SJ, D'Ambruoso L, Fottrell E, Graham WJ,Herbst AJ, Hodgson A, Hounton S, Kahn K, Krishnan A, Leitao J, OdhiamboF, Sankoh OA, Tollman SM: Strengthening standardised interpretation of
04 Feb 2014
Desai et al. BMC Medicine Page 8 of 82014, 12:20http://www.biomedcentral.com/1741-7015/12/20
verbal autopsy data: the new InterVA-4 tool. Glob Health Action 2012,5:1–8. Available for download at www.interva.net.
12. Flaxman A, Vahdatpour A, Green S, James S, Murray C, for the PopulationHealth Metrics Research Consortium (PHMRC): Random forests for verbalautopsy analysis: multisite validation study using clinical diagnostic goldstandards. Popul Health Metr 2011, 9:29.
13. James S, Flaxman A, Murray C, and the Public Health Metrics ResearchConsortium: Performance of the tariff method: Validation of a simpleadditive algorithm for analysis of verbal autopsies. Popul Health Metr2011, 9:31.
14. King G, Lu Y, Shibuya K: Designing verbal autopsy studies. Popul HealthMetr 2010, 8:19. Available for download at http://gking.harvard.edu/va.
15. Murray C, Lozano R, Flaxman AD, Vadhatpour A, Lopez AD: Robust metricsfor assessing the performance of different verbal autopsy causeassignment methods in validation studies. Popul Health Metr 2011, 9:28.
16. Leitao JC, Chandramohan D, Byass P, Jakob R, Bundhamcharoen K,Choprapowan C, de Savigny D, Fottrell E, França E, Frøen F, Gewaifel G,Hodgson A, Hounton S, Kahn K, Krishnan A, Kumar V, Masanja H, Nichols E,Notzon F, Rasooly MH, Sankoh O, Spiegel P, AbouZahr C, Amexo M, KebedeD, Alley WS, Marinho F, Ali M, Loyola E, Chikersal J, et al: Revising the WHOverbal autopsy instrument to facilitate routine cause-of-death monitoring.Glob Health Action 2013, 6:21518.
17. Leitao J, Desai N, Aleksandrowicz L, Byass P, Miasnikof P, Tollman S, Alam D,Lu Y, Rathi SK, Singh A, Suraweera W, Ram F, Jha P: Comparison ofphysician-certified verbal autopsy with computer-coded verbal autopsyfor cause of death assignment in hospitalized patients in low- andmiddle-income countries: systematic review. BMC Med 2014, 12:22.
18. Flaxman A, Vahdatpour A, James S, Birnbaum J, Murray C, for thePopulation Health Metrics Research Consortium (PHMRC): Direct estimationof cause-specific mortality fractions from verbal autopsies: multisitevalidation study using clinical diagnostic gold standards. Popul HealthMetr 2011, 9:35.
19. World Health Organization (WHO): International Statistical Classifications ofDiseases and Related Health Problems, Volume 1. 10th edition. Geneva,Switzerland: World Health Organization; 2008.
20. Byass P: Usefulness of the Population Health Metrics ResearchConsortium Gold Standard Verbal Autopsy Data for General VerbalAutopsy Methods. BMC Med 2014, 12:23.
21. Anker M: The effect of misclassification error on reported cause-specificmortality fractions from verbal autopsy. Int J Epidemiol 1997, 26:1090–1096.
22. Maude GH, Ross DA: The effect of different sensitivity, specificity andcause-specific mortality fractions on the estimation of differences incause-specific mortality rates in children from studies using verbalautopsies. Int J Epidemiol 1997, 26:1097–1106.
23. Aleksandrowicz L, Malhotra V, Dikshit R, Gupta PC, Kumar R, Sheth J, Rathi SK,Suraweera W, Miasnikofi P, Jotkar R, Sinha D, Awasthi S, Bhatia P, Jha P:Performance criteria for verbal autopsy‐based systems to estimatenational causes of death: development and application to the IndianMillion Death Study. BMC Med, 2014, 12:21.
24. Jha P: Reliable direct measurement of causes of death in low- andmiddle-income countries. BMC Med 2014, 12:19.
Cite this article as: Desai et al.: Performance of four computer-codedverbal autopsy methods for cause of death assignment compared withphysician coding on 24,000 deaths in low- and middle-income countries.BMC Medicine
10.1186/1741-7015-12-20
2014, 12:20
Submit your next manuscript to BioMed Centraland take full advantage of:
• Convenient online submission
• Thorough peer review
• No space constraints or color figure charges
• Immediate publication on acceptance
• Inclusion in PubMed, CAS, Scopus and Google Scholar
• Research which is freely available for redistribution
Submit your manuscript at www.biomedcentral.com/submit
Reproduced with permission of the copyright owner. Further reproduction prohibited withoutpermission.
- c.1741-7015-12-20_14270.pdf

Desai et al. BMC Medicine Page 3 of 82014, 12:20http://www.biomedcentral.com/1741-7015/12/20
methods (Figure 1). The ORF showed very similar trends tothose from the IHME random forest, though differenceswere to be expected due to the unavailability of the fullIHME hospital-based dataset [7]. In addition, 96 symptomindicators were used by ORF whereas the IHME methodused only the top 40 most-predictive symptoms, the detailsof which were unavailable [12].
Open-source tariff methodThe OTM is a data-driven, probabilistic method that buildsupon that published by IHME [13]. The OTM performanceon the IHME data available to us was comparable to theresults of the IHME method (Figure 2). The resultingdifferences may be due to similar factors as those men-tioned in the ORF description above.
King-Lu methodThe KL method directly estimates cause-specific mortalityfractions (CSMFs) without assigning individual CODs.Version 0.9-2.12 was used, for which a full descriptionof the method and discussions of its performance havebeen published [5], and which is available for download[14].
TestingDataset splits and resamplingInterVA-4 uses pre-assigned Bayesian probabilities to assignthe COD and thus does not require a training component.
0%
10%
20%
30%
40%
50%
60%
70%
80%
1 2 3 4 5
Par
tial
ch
ance
-co
rrec
ted
co
nco
rdan
ce
Number of causes assigned
Open-source random forest (ORF)
IHME random forest without HCE
IHME random forest with HCE
Figure 1 Comparison of open-source random forest to IHMErandom forest. The IHME random forest was tested on a set of IHMEhospital-based data, both with and without health care experience (HCE)variables. HCE variables are binary questions on previous medicallydiagnosed conditions (including high blood pressure, tuberculosis, cancer),and details transcribed from the respondents’ medical records. Our IHMEsubset contained some, but not all, HCE variables. The ORF performancewas similar to the IHME random forest method on the full hospital-baseddataset without HCE variables, but performed less well when HCEvariables were included [12]. HCE, health care experience; IHME, Institutefor Health Metrics and Evaluation; ORF, open-source random forest.
The remaining three methods required a training com-ponent, consisting of a subset of the original data withassigned CODs, from which the method learned the cause-specific symptom profiles. The trained algorithm was thenused to predict CODs in the test dataset.Table 2 describes the training and testing samples used
in the comparisons. Three sample sizes of the datasetswere used to highlight changes in performance based onvarying dataset sizes (training/testing splits of 1,100/400and 1,100/1,100 cases, and a split of the full dataset intoan equal number of training and testing cases, whose sizevaried by dataset.) The IHME and China datasets wererelatively small (approximately 1,500 cases), which onlyallowed for the 1100/400 split. Each of the split sizesabove were randomly repeated (random splits of the ori-ginal dataset into the specified number of training andtesting cases) 30 times. However, the performance of themethods converged (that is, did not alter by more than0.5% compared to the average of any previousresamples [15]) well before the full 30 resamples wererun.The required format of input data varied by assignment
method. Two slightly modified versions of each ori-ginal dataset were created; one version to be used forthe data-driven methods (ORF, OTM, KL), and anotherfor InterVA-4, which only uses specific indicators [16].InterVA-4 testing on the MDS dataset used 552 childdeaths, which had additional details extracted from theMDS narratives to match the required InterVA-4 inputs.Resampling was not done on these 552 records due to thesmall sample size.
Performance metricsPositive predictive value (PPV) and partial chance-correctedconcordance (PCCC) were used to measure agreementfor individual COD assignment. PPV is the proportionof assigned CODs that were the ‘true’ COD (hereaftercalled reference COD), and is a common metric in hospital-based VA comparison studies [17]. PCCC is a variationon the PPV, meant to account for correct COD assign-ments made purely by chance [15]. As the CCVAmethods could assign each VA record several CODswith varying probabilities, we calculated PPV andPCCC for agreement between the reference COD andthe CCVA’s most probable COD, and for the threemost probable CODs. These two measures were simplyinterpreted as whether the reference COD matched theCCVA method’s most probable cause, or matched oneof the three most probable causes.At the population level, accuracy was measured using
CSMF absolute accuracy and error. CSMF error is theabsolute difference between the estimated and referenceCSMFs, summed across all causes. CSMF accuracy, as pro-posed by Murray et al., is determined by dividing the
0%
10%
20%
30%
40%
50%
60%
70%
80%
1 2 3 4 5
Par
tial
ch
ance
-co
rrec
ted
co
nco
rdan
ce
Number of causes assigned
Open-source tariff method (OTM)
IHME tariff with HCE
IHME tariff without HCE
Figure 2 Comparison of open-source tariff method to IHME tariff method. The IHME random forest was tested on a set of IHME hospital-baseddata, both with and without health care experience (HCE) variables. The ORF was tested on a subset of the full IHME data, containing some, but notall, HCE variables. The OTM performed almost exactly as the similar IHME method on the full hospital-based dataset without HCE variables (for the topcause), but less well than the same IHME analysis with HCE variables. Note that results for the full IHME dataset without HCE were only available for thetop assigned cause [13]. HCE, health care experience; IHME, Institute for Health Metrics and Evaluation; OTM, open-source tariff method.
Desai et al. BMC Medicine Page 4 of 82014, 12:20http://www.biomedcentral.com/1741-7015/12/20
CSMF error by 2(1-minimum(CSMFtrue)), and subtractingthis term from one [15]. This is meant to account for thevariation in number of CODs across comparisons, and theresulting values are relative to the worst possible perform-ance in a dataset (that is, coding every death incorrectly)[15]. CSMF accuracy and CSMF error are interpreted inopposite directions: good performance yields high CSMFaccuracy and low CSMF error. We retained PCCC and
Table 2 Description of testing on multiple computer-coded ve
Dataset Training/testingcases
Number
King-Lu
China 1100 / 400 48
Institute for Health Metricsand Evaluation
1100 / 400 96
Million Death Study 1100 / 400 89
1100 / 1100 89
6100 / 6100a 89
Agincourt 1100 / 400 104
1100 / 1100 104
2900 / 2900 104
Matlab 1100 / 400 224
1100 / 1100 224
1600 / 1600 224
Only the numbers of test cases are applicable for the InterVA-4 analyses, as this meinput of 245 diagnostic indicators, however as many of these were not available inMDS dataset used for InterVA-4 contained 552 cases, in which we extracted additionalfor each training/testing split within each dataset, except InterVA-4, which used the fo400, 1100, and 2900 test cases; and 10, 10, 10 for Matlab data splits of 400, 1100, and 1
CSMF accuracy for comparability to previous IHME pub-lications. Additional file 2 summarizes the equations forthe four metrics.
ResultsIndividual-level agreement on cause of deathIn comparison to physician-assigned causes, the agreement(as measured by PPV) for all CCVA methods for the most
rbal autopsy methods and datasets
of diagnostic indicators
Open-sourcerandom forest
Open-sourcetariff method s
InterVA-4
48 48 N/A
96 96 N/A
89 89 N/A
89 89 N/A
89 89 245
104 104 245b
104 104 245
104 104 245
224 224 245
224 224 245
224 224 245
thod does not require any training cases. Additionally, InterVA-4 requires thethe given datasets, the number of useable variables was lower than 245. aTheInterVA-4 indicators from the narratives. bEach CCVA method ran 30 resamplesllowing number of re-samples: 1 for MDS data; 8, 7, 6 for Agincourt data splits of600 test cases, respectively.
Desai et al. BMC Medicine Page 5 of 82014, 12:20http://www.biomedcentral.com/1741-7015/12/20
probable COD averaged 43% to 44% for all datasets, withthe highest PPV being 58% for ORF, followed by 52% forOTM, both on the MDS data (Table 3). The average PPVimproved for the top three most probable CODs, withgreater improvements for ORF (69%) and OTM (68%) thanfor InterVA-4 (62%). Similar results were seen using PCCC(Table 4): the average PCCC for the most probable CODacross the datasets, using ORF, OTM and InterVA-4,was 41%, 40% and 41%, respectively. The average PCCCimproved for the top three most probable CODs to 67%,62% and 58%, respectively.The values of PPV and PCCC rose with larger training
and testing datasets, suggesting that their results werepartly dependent on having a sufficient number of trainingcases for each COD. The confidence intervals for thesemetrics were narrow as they mostly represented randomresampling, and did not express the true underlying un-certainty in the data arising from misclassification ofcauses. Additional file 3 provides detailed results for eachof the four metrics, including the confidence intervals.
Population-level agreement on cause-specificmortality fractionKL had the best average CSMF accuracy across all fivedatasets (91%), followed by InterVA-4 (72% across threedatasets), ORF (71%) and OTM (54%). Except for KL, theremaining CCVA methods traded best performance bydataset, with no clear trend (Table 5). CSMF error yieldedsimilar results, with KL having the lowest error scores(Additional file 3).Using the MDS data, KL had the closest similarity to
the ranking of population-level CODs as compared toPCVA, with the top three causes in children under 5 yearsbeing the same (acute respiratory infection, diarrhealdiseases, and other and unspecified infections; Additionalfile 3). ORF ended up with the same top three, but rankedother and unspecified infections ahead of acute respiratoryinfections, and ahead of diarrheal diseases. In the Agincourt
Table 3 Positive predictive values of computer-coded verbalreference standards
Test cases
Open-source random forest
Dataset Top (%) Top 3 (%)
China 400 35 57
Institute for Health Metricsand Evaluation
400 33 55
Million Death Study 6100 58 82
Agincourt 2900 45 77
Matlab 1600 49 74
Average 44 69
Top cause represents accuracy of the CCVA method’s most probable cause matchinprobable causes contain the cause assigned by PCVA. Averages calculated across Cdataset used for InterVA-4 contained a sample of 552 cases, in which we extracted
data, KL performed better than ORF, matching the topthree causes but not in the same ranking as PCVA. Bycontrast, ORF, somewhat inexplicably, ranked maternaldeaths as the second most common COD. In the Matlabdata, both KL and ORF showed similar performance inranking CODs, accurately matching the top three causes.Results for InterVA-4 varied across the comparisons.
DiscussionThis is the largest comparison study yet done of CCVAand PCVA methods. We found that, at an individuallevel, ORF, OTM and InterVA-4 replicated the coding ofphysicians comparably, but that the average agreementlevel for the leading COD was about 50%. Agreementwith the physician-assigned code rose substantially forall CCVA methods if the three most probable CODs wereconsidered, and generally improved with larger subsetswithin a given study. On a population level, the KL methodperformed best in terms of CSMF accuracy and error, andreplicated the CSMF distribution of PCVA in the originaldatasets fairly well. ORF did not outperform KL, even onthe IHME dataset, and did not perform better thanInterVA-4, despite claims to the contrary [18]. At the indi-vidual level, InterVA-4, which does require training on adataset, produced broadly comparable results to themethods that do require training.Comparison to physician coding as a reference standard
poses several methodological challenges. Importantly, ourstudy focused on CCVA replication of physician codes (anderrors), and not whether the underlying COD assigned bythe physician was correct. Validation of PCVA is limitedby the lack of a true reference standard in countries whereverbal autopsy is performed [1-3,9]. Nonetheless, PCVAwith good quality control can yield useful results on CODdistributions in countries where medical certificationremains uncommon [1]. The studies we included in thecomparisons had physician coding done with reasonablygood levels of quality control [4-7,9] as shown by a low
autopsy methods versus physician-coded verbal autopsy
Open-source tariff method InterVA-4 Average fortop cause (%)Top (%) Top 3 (%) Top (%) Top 3 (%)
36 70 N/A N/A 36
34 53 N/A N/A 34
52 76 42a 63a 51
42 69 42 58 43
52 74 48 64 50
43 68 44 62
g the cause assigned by PCVA; Top 3 represents whether CCVA’s three mostCVA methods only use results for the top cause. aThe Million Death Studyadditional InterVA-4 indicators from the narratives.
Table 4 Partial chance-corrected concordance of computer-coded verbal autopsy methods versus physician-coded verbalautopsy reference standards
Dataset Test cases
Open-source random forest Open-source tariff method InterVA-4 Average fortop cause (%)Top (%) Top 3 (%) Top (%) Top 3 (%) Top (%) Top 3 (%)
China 400 33 55 32 64 N/A N/A 33
Institute for Health Metricsand Evaluation
400 31 54 32 48 N/A N/A 32
Million Death Study 6100 55 81 48 70 38a 60a 47
Agincourt 2900 42 75 38 62 39 56 40
Matlab 1600 45 72 48 68 45 59 46
Average 41 67 40 62 41 58
Top cause represents accuracy of the CCVA method’s most probable cause matching the cause assigned by PCVA; Top 3 represents whether CCVA’s three mostprobable causes contain the cause assigned by PCVA. Averages calculated across CCVA methods only use results for the top cause. aThe Million Death Studydataset used for InterVA-4 contained a sample of 552 cases, in which we attempted to extract additional InterVA-4 indicators from the narratives.
Desai et al. BMC Medicine Page 6 of 82014, 12:20http://www.biomedcentral.com/1741-7015/12/20
proportion of ill-defined deaths. Physician coding thatcontains large amounts of random errors would reduceagreement on a COD in the dual-physician coding system,and would tend to increase the number of unspecified CODsin the International Classification of Diseases (ICD-10)[19], such as ‘senility’ (ICD-10 code R54) or ‘cause not de-termined’ (ICD-10 code R99). This would in turn make itharder for CCVA methods to identify specific causes.Moreover, the size of the errors or biases in CCVA methodsdepends on the inherent errors and biases of PCVA results.This is particularly relevant for machine learning, as its ac-curacy requires learning on “true” class labels. Highmisclassification rates in the training set will also affectperformance in the testing set across datasets, as noted re-cently on the full IHME dataset [20].The performance of each CCVA method at individual
assignment improved when trained and tested on a largernumber of cases, most likely due to a greater number ofcases from which to learn the distinct relationships betweenspecific symptom profiles and CODs. The differences inthe field and coding methods across studies would tend toreduce the observed differences in PCVA and CCVA be-tween the various comparisons (and more likely so at theindividual level than at the population level). This might
Table 5 Cause-specific mortality fraction accuracy of computeverbal autopsy reference standards
Datasets Test cases King-Lu (%) Open-sorandom
China 400 84 79
Institute for Health Metricsand Evaluation
400 88 73
Million Death Study 6100 96 64
Agincourt 2900 94 72
Matlab 1600 95 69
Average 91 71aThe Million Death Study dataset used for InterVA-4 contained a sample of 552 casethe narratives.
have contributed to the observed comparability of the re-sults for the four CCVA methods. With larger studiesand more standardized field and physician coding methods,any real, underlying differences between various CCVAmethods may become apparent. Finally, we note thatInterVA-4 has a threshold of probability for designating themost probable cause (that is, the most probable cause mustalso have a probability above 50%, otherwise the death isclassified as indeterminate), whereas ORF and OTM selectthe most probable causes without applying any thresholds.On an individual level, no single method was able to
replicate physician assignment of COD more than abouthalf the time. At the population level, the King-Lu methodwas the best method to estimate CSMFs, though it doesnot assign individual CODs. However, good population-level agreement accuracy does not guarantee good individ-ual agreement [21,22]. A key methodological feature isthe need to avoid the false gold standard of hospital-baseddeaths [1,3]. Reliance on hospital or urban-based deathsfor training of automated methods may lead to learning ofsymptom patterns and other features that are not represen-tative of populations without medical attention. Indeed, theCSMFs between home and hospital deaths are dissimilar,as demonstrated in India [23].
r-coded verbal autopsy methods versus physician-coded
urceforest (%)
Open-sourcetariff method (%)
InterVA-4 (%) Average (%)
75 N/A 79
63 N/A 75
33 70a 66
38 75 70
59 72 74
54 72
s, in which we attempted to extract additional InterVA-4 indicators from
Desai et al. BMC Medicine Page 7 of 82014, 12:20http://www.biomedcentral.com/1741-7015/12/20
Our study is the largest cross-country comparison ofcurrent CCVA methods versus PCVA, covering about twiceas many deaths as an earlier multi-country study [7],and including a mix of various ages, and community andhospital deaths. Nonetheless, we faced certain limitations.First, we could not compare the original IHME randomforest and tariff algorithms, though the original methodswere re-created to the best of our abilities from the pub-lished descriptions [12,13], yielding broadly similar results(Figures 1 and 2). Second, access during the analyses phaseto the full IHME hospital-based dataset of 12,000 recordswould have allowed more robust comparisons. Similarly,the China dataset was also somewhat limited by the smallsample size.
ConclusionsDifferent CCVA methods have various strengths andweaknesses depending on the study scenario and studyobjective. An ideal solution could involve a combinationof automated methods to obtain robust individual- andpopulation-level estimates. In the medium term, it appearsunwise and certainly premature to recommend that auto-mated systems replace physicians in coding VAs. CCVAmethods could be used in parallel with physician codingto increase speed, efficiency and quality of coding. Futurework may focus on the performance of a combination ofvarious automated methods, and must extend to largerdatasets and explore specifics for important age groups(children, maternal, adult), by gender, and across varioussettings of home- and hospital-based deaths. Future studiesneed to also place specific emphasis on testing computerbased methods on a random sample of deaths in coun-tries, as this would be much more useful in determiningthe true underlying CSMF at the population level [24].
Additional files
: Details of the open-source random forest and tariffmethods. Explanation of the major logical steps of the open-sourcerandom forest and tariff methods.
: Description of comparison metrics. Formulas andexplanation of positive predictive value, partial chance-correctedconcordance, CSMF error and CSMF accuracy.
: Full results of CCVA comparisons on severaldataset splits. Results presented by CCVA method, dataset, datasetsplits, and top and top-three cause of death predictions.
AbbreviationsCCVA: computer-coded verbal autopsy; COD: cause of death; CSMF: cause-specificmortality fraction; HCE: health care experience; ICD-10: International Classificationof Diseases-10; IHME: Institute for Health Metrics and Evaluation; KL: King-Lu verbalautopsy method; MDS: Million Death Study; ORF: open-source random forest;OTM: open-source tariff method; PCCC: partial chance-corrected concordance;PCVA: physician-certified verbal autopsy; PPV: positive predictive value;VA: verbal autopsy.
Competing interestsThe authors declare that they have no competing interests.
Additional file 1
Additional file 2
Additional file 3
Authors’ contributionsND, LA and PM conducted the analysis. All authors contributed to datainterpretation and critical revisions of the paper. All authors read andapproved the final manuscript.
AcknowledgementsWe thank Khaled Hasan for help with data formatting, and Michael Palmerfor editorial assistance and Abraham Flaxman for guidance on IHME datasets.
Author details1Centre for Global Heath Research, St. Michael’s Hospital, Dalla Lana Schoolof Public Health, University of Toronto, Toronto, Ontario, Canada. 2Center forthe Promotion of Research Involving Innovative Statistical Methodology,Steinhardt School of Culture, Education and Human Development, New YorkUniversity, New York, NY, USA. 3WHO Collaborating Centre for VerbalAutopsy, Umeå Centre for Global Health Research, Umeå University, Umeå,Sweden. 4Umeå Centre for Global Health Research, Division of Epidemiologyand Global Health, Department of Public Health and Clinical Medicine, UmeåUniversity, Umeå, Sweden. 5Medical Research Council/Wits University RuralPublic Health and Health Transitions Research Unit (Agincourt), School ofPublic Health, Faculty of Health Sciences, University of the Witwatersrand,Johannesburg, South Africa. 6International Network for the DemographicEvaluation of Populations and Their Health (INDEPTH) Network, Accra, Ghana.7International Centre for Diarrhoeal Disease Research, Bangladesh (ICDDR,B),Dhaka, Bangladesh. 8International Institute for Population Sciences, Mumbai,Maharashtra, India. 9School of Public Health, Post Graduate Institute ofMedical Research and Education, Chandigarh, India.
Received: 2 September 2013 Accepted: 1 November 2013Published:
References1. Jha P: Counting the dead is one of the world’s best investments to
reduce premature mortality. Hypothesis 2012, 10:e3.2. Setel PW, Sankoh O, Rao C, Velkoff VA, Mathers C, Gonghuan Y, Hemed Y,
Jha P, Lopez AD: Sample registration of vital events with verbal autopsy:a renewed commitment to measuring and monitoring vital statistics.Bull World Health Organ 2005, 83:611–617.
3. Fottrell E, Byass P: Verbal autopsy: methods in transition. Epidemiol Rev2010, 32:38–55.
4. Health and Demographic Surveillance Unit: Health and DemographicSurveillance System: Matlab. Volume 36: Registration of Health andDemographic Events 2003. Dhaka: ICDDR, B; 2005.
5. King G, Lu Y: Verbal autopsy methods with multiple causes of death.Statistical Science 2008, 23:78–91.
6. Kahn K, Collinson MA, Gómez-Olivé FX, Mokoena O, Twine R, Mee P, Afolabi SA,Clark BD, Kabudula CW, Khosa A, Khoza S, Shabangu MG, Silaule B, TibaneJB, Wagner RG, Garenne ML, Clark SJ, Tollman SM: Profile: Agincourthealth and socio-demographic surveillance system. Int J Epidemiol 2012,41:988–1001.
7. Murray CJ, Lopez AD, Black R, Ahuja R, Ali SM, Baqui A, Dandona L, Dantzer E,Das V, Dhingra U, Dutta A, Fawzi W, Flaxman AD, Gómez S, Hernández B,Joshi R, Kalter H, Kumar A, Kumar V, Lozano R, Lucero M, Mehta S, Neal B,Ohno SL, Prasad R, Praveen D, Premji Z, Ramírez-Villalobos D, Remolador H,Riley I, et al: Population Health Metrics Research Consortium gold standardverbal autopsy validation study: design, implementation, anddevelopment of analysis datasets. Popul Health Metr 2011, 9:27.
8. Green ST, Flaxman AD: Machine learning methods for verbal autopsy indeveloping countries. In AAAI Spring Symposium on Artificial Intelligence forDevelopment (AI-D): March 22-24 2010; Stanford. Stanford: StanfordUniversity; 2010 [https://github.com/aflaxman/verbal-autopsy-challenge]
9. Jha P, Gajalakshmi V, Gupta PC, Kumar R, Mony P, Dhingra N, Peto R:Prospective study of one million deaths in India: rationale, design, andvalidation results. PLoS Med 2006, 3:e18.
10. Million Death Study Collaborators, Bassani DG, Kumar R, Awasthi S, Morris SK,Paul VK, Shet A, Ram U, Gaffey MF, Black RE, Jha P: Causes of neonatal andchild mortality in India: a nationally representative mortality survey. Lancet2010, 376:1853–1860.
11. Byass P, Chandramohan D, Clark SJ, D'Ambruoso L, Fottrell E, Graham WJ,Herbst AJ, Hodgson A, Hounton S, Kahn K, Krishnan A, Leitao J, OdhiamboF, Sankoh OA, Tollman SM: Strengthening standardised interpretation of
04 Feb 2014
Desai et al. BMC Medicine Page 8 of 82014, 12:20http://www.biomedcentral.com/1741-7015/12/20
verbal autopsy data: the new InterVA-4 tool. Glob Health Action 2012,5:1–8. Available for download at www.interva.net.
12. Flaxman A, Vahdatpour A, Green S, James S, Murray C, for the PopulationHealth Metrics Research Consortium (PHMRC): Random forests for verbalautopsy analysis: multisite validation study using clinical diagnostic goldstandards. Popul Health Metr 2011, 9:29.
13. James S, Flaxman A, Murray C, and the Public Health Metrics ResearchConsortium: Performance of the tariff method: Validation of a simpleadditive algorithm for analysis of verbal autopsies. Popul Health Metr2011, 9:31.
14. King G, Lu Y, Shibuya K: Designing verbal autopsy studies. Popul HealthMetr 2010, 8:19. Available for download at http://gking.harvard.edu/va.
15. Murray C, Lozano R, Flaxman AD, Vadhatpour A, Lopez AD: Robust metricsfor assessing the performance of different verbal autopsy causeassignment methods in validation studies. Popul Health Metr 2011, 9:28.
16. Leitao JC, Chandramohan D, Byass P, Jakob R, Bundhamcharoen K,Choprapowan C, de Savigny D, Fottrell E, França E, Frøen F, Gewaifel G,Hodgson A, Hounton S, Kahn K, Krishnan A, Kumar V, Masanja H, Nichols E,Notzon F, Rasooly MH, Sankoh O, Spiegel P, AbouZahr C, Amexo M, KebedeD, Alley WS, Marinho F, Ali M, Loyola E, Chikersal J, et al: Revising the WHOverbal autopsy instrument to facilitate routine cause-of-death monitoring.Glob Health Action 2013, 6:21518.
17. Leitao J, Desai N, Aleksandrowicz L, Byass P, Miasnikof P, Tollman S, Alam D,Lu Y, Rathi SK, Singh A, Suraweera W, Ram F, Jha P: Comparison ofphysician-certified verbal autopsy with computer-coded verbal autopsyfor cause of death assignment in hospitalized patients in low- andmiddle-income countries: systematic review. BMC Med 2014, 12:22.
18. Flaxman A, Vahdatpour A, James S, Birnbaum J, Murray C, for thePopulation Health Metrics Research Consortium (PHMRC): Direct estimationof cause-specific mortality fractions from verbal autopsies: multisitevalidation study using clinical diagnostic gold standards. Popul HealthMetr 2011, 9:35.
19. World Health Organization (WHO): International Statistical Classifications ofDiseases and Related Health Problems, Volume 1. 10th edition. Geneva,Switzerland: World Health Organization; 2008.
20. Byass P: Usefulness of the Population Health Metrics ResearchConsortium Gold Standard Verbal Autopsy Data for General VerbalAutopsy Methods. BMC Med 2014, 12:23.
21. Anker M: The effect of misclassification error on reported cause-specificmortality fractions from verbal autopsy. Int J Epidemiol 1997, 26:1090–1096.
22. Maude GH, Ross DA: The effect of different sensitivity, specificity andcause-specific mortality fractions on the estimation of differences incause-specific mortality rates in children from studies using verbalautopsies. Int J Epidemiol 1997, 26:1097–1106.
23. Aleksandrowicz L, Malhotra V, Dikshit R, Gupta PC, Kumar R, Sheth J, Rathi SK,Suraweera W, Miasnikofi P, Jotkar R, Sinha D, Awasthi S, Bhatia P, Jha P:Performance criteria for verbal autopsy‐based systems to estimatenational causes of death: development and application to the IndianMillion Death Study. BMC Med, 2014, 12:21.
24. Jha P: Reliable direct measurement of causes of death in low- andmiddle-income countries. BMC Med 2014, 12:19.
Cite this article as: Desai et al.: Performance of four computer-codedverbal autopsy methods for cause of death assignment compared withphysician coding on 24,000 deaths in low- and middle-income countries.BMC Medicine
10.1186/1741-7015-12-20
2014, 12:20
Submit your next manuscript to BioMed Centraland take full advantage of:
• Convenient online submission
• Thorough peer review
• No space constraints or color figure charges
• Immediate publication on acceptance
• Inclusion in PubMed, CAS, Scopus and Google Scholar
• Research which is freely available for redistribution
Submit your manuscript at www.biomedcentral.com/submit
Reproduced with permission of the copyright owner. Further reproduction prohibited withoutpermission.
- c.1741-7015-12-20_14270.pdf

Desai et al. BMC Medicine Page 8 of 82014, 12:20http://www.biomedcentral.com/1741-7015/12/20
verbal autopsy data: the new InterVA-4 tool. Glob Health Action 2012,5:1–8. Available for download at www.interva.net.
12. Flaxman A, Vahdatpour A, Green S, James S, Murray C, for the PopulationHealth Metrics Research Consortium (PHMRC): Random forests for verbalautopsy analysis: multisite validation study using clinical diagnostic goldstandards. Popul Health Metr 2011, 9:29.
13. James S, Flaxman A, Murray C, and the Public Health Metrics ResearchConsortium: Performance of the tariff method: Validation of a simpleadditive algorithm for analysis of verbal autopsies. Popul Health Metr2011, 9:31.
14. King G, Lu Y, Shibuya K: Designing verbal autopsy studies. Popul HealthMetr 2010, 8:19. Available for download at http://gking.harvard.edu/va.
15. Murray C, Lozano R, Flaxman AD, Vadhatpour A, Lopez AD: Robust metricsfor assessing the performance of different verbal autopsy causeassignment methods in validation studies. Popul Health Metr 2011, 9:28.
16. Leitao JC, Chandramohan D, Byass P, Jakob R, Bundhamcharoen K,Choprapowan C, de Savigny D, Fottrell E, França E, Frøen F, Gewaifel G,Hodgson A, Hounton S, Kahn K, Krishnan A, Kumar V, Masanja H, Nichols E,Notzon F, Rasooly MH, Sankoh O, Spiegel P, AbouZahr C, Amexo M, KebedeD, Alley WS, Marinho F, Ali M, Loyola E, Chikersal J, et al: Revising the WHOverbal autopsy instrument to facilitate routine cause-of-death monitoring.Glob Health Action 2013, 6:21518.
17. Leitao J, Desai N, Aleksandrowicz L, Byass P, Miasnikof P, Tollman S, Alam D,Lu Y, Rathi SK, Singh A, Suraweera W, Ram F, Jha P: Comparison ofphysician-certified verbal autopsy with computer-coded verbal autopsyfor cause of death assignment in hospitalized patients in low- andmiddle-income countries: systematic review. BMC Med 2014, 12:22.
18. Flaxman A, Vahdatpour A, James S, Birnbaum J, Murray C, for thePopulation Health Metrics Research Consortium (PHMRC): Direct estimationof cause-specific mortality fractions from verbal autopsies: multisitevalidation study using clinical diagnostic gold standards. Popul HealthMetr 2011, 9:35.
19. World Health Organization (WHO): International Statistical Classifications ofDiseases and Related Health Problems, Volume 1. 10th edition. Geneva,Switzerland: World Health Organization; 2008.
20. Byass P: Usefulness of the Population Health Metrics ResearchConsortium Gold Standard Verbal Autopsy Data for General VerbalAutopsy Methods. BMC Med 2014, 12:23.
21. Anker M: The effect of misclassification error on reported cause-specificmortality fractions from verbal autopsy. Int J Epidemiol 1997, 26:1090–1096.
22. Maude GH, Ross DA: The effect of different sensitivity, specificity andcause-specific mortality fractions on the estimation of differences incause-specific mortality rates in children from studies using verbalautopsies. Int J Epidemiol 1997, 26:1097–1106.
23. Aleksandrowicz L, Malhotra V, Dikshit R, Gupta PC, Kumar R, Sheth J, Rathi SK,Suraweera W, Miasnikofi P, Jotkar R, Sinha D, Awasthi S, Bhatia P, Jha P:Performance criteria for verbal autopsy‐based systems to estimatenational causes of death: development and application to the IndianMillion Death Study. BMC Med, 2014, 12:21.
24. Jha P: Reliable direct measurement of causes of death in low- andmiddle-income countries. BMC Med 2014, 12:19.
Cite this article as: Desai et al.: Performance of four computer-codedverbal autopsy methods for cause of death assignment compared withphysician coding on 24,000 deaths in low- and middle-income countries.BMC Medicine
10.1186/1741-7015-12-20
2014, 12:20
Submit your next manuscript to BioMed Centraland take full advantage of:
• Convenient online submission
• Thorough peer review
• No space constraints or color figure charges
• Immediate publication on acceptance
• Inclusion in PubMed, CAS, Scopus and Google Scholar
• Research which is freely available for redistribution
Submit your manuscript at www.biomedcentral.com/submit

Reproduced with permission of the copyright owner. Further reproduction prohibited withoutpermission.