research article open access evaluation of pre · pdf fileariane leites larentis1,3*,...
TRANSCRIPT

Larentis et al. BMC Research Notes 2014, 7:671http://www.biomedcentral.com/1756-0500/7/671
RESEARCH ARTICLE Open Access
Evaluation of pre-induction temperature, cellgrowth at induction and IPTG concentrationon the expression of a leptospiral protein in E. coliusing shaking flasks and microbioreactorAriane Leites Larentis1,3*, Júlia Fabiana Monteiro Quintal Nicolau1, Gabriela dos Santos Esteves1,Daniel Tait Vareschini1, Fernanda Vicente Ribeiro de Almeida1, Mitermayer Galvão dos Reis2, Ricardo Galler1
and Marco Alberto Medeiros1,3*
Abstract
Background: Leptospirosis is a zoonose that is increasingly endemic in built-up areas, especially where there arecommunities living in precarious housing with poor or non-existent sanitation infrastructure. Leptospirosis can kill,for its symptoms are easily confused with those of other diseases. As such, a rapid diagnosis is required so it can betreated effectively. A test for leptospirosis diagnosis using Leptospira Immunoglobulin-like (Lig) proteins is currentlyat final validation at Fiocruz.
Results: In this work, the process for expression of LigB (131-645aa) in E. coli BL21 (DE3)Star™/pAE was evaluated.No significant difference was found for the experiments at two different pre-induction temperatures (28°C and37°C). Then, the strain was cultivated at 37°C until IPTG addition, followed by induction at 28°C, thereby reducingthe overall process time. Under this condition, expression was assessed using central composite design for twovariables: cell growth at which LigB (131-645aa) was induced (absorbance at 600 nm between 0.75 and 2.0) andinducer concentration (0.1 mM to 1 mM IPTG). Both variables influenced cell growth and protein expression. Inductionat the final exponential growth phase in shaking flasks with Absind = 2.0 yielded higher cell concentrations andLigB (131-645aa) productivities. IPTG concentration had a negative effect and could be ten-fold lower than the concentrationcommonly used in molecular biology (1 mM), while keeping expression at similar levels and inducing less damageto cell growth. The expression of LigB (131-645aa) was associated with cell growth. The induction at the end of theexponential phase using 0.1 mM IPTG at 28°C for 4 h was also performed in microbioreactors, reaching higher celldensities and 970 mg/L protein. LigB (131-645aa) was purified by nickel affinity chromatography with 91% homogeneity.
Conclusions: It was possible to assess the effects and interactions of the induction variables on the expression of solubleLigB (131-645aa) using experimental design, with a view to improving process productivity and reducing the productioncosts of a rapid test for leptospirosis diagnosis.
Keywords: Leptospira, Leptospirosis, Diagnosis, Statistical experimental design, Microbioreactor
* Correspondence: [email protected]; [email protected], Bio-Manguinhos, Vice Directory of Technological Development,Laboratory of Recombinant Technologies (LATER), Av. Brasil 4365, Manguinhos,Rio de Janeiro, RJ 21.040-360, Brazil3Current address: Fiocruz, Sergio Arouca National School of Public Health(ENSP), CESTEH), Rua Leopoldo Bulhões 1480, Manguinhos, Rio de Janeiro,RJ 21041-210, BrazilFull list of author information is available at the end of the article
© 2014 Larentis et al.; licensee BioMed Central Ltd. This is an Open Access article distributed under the terms of the CreativeCommons Attribution License (http://creativecommons.org/licenses/by/2.0), which permits unrestricted use, distribution, andreproduction in any medium, provided the original work is properly credited. The Creative Commons Public DomainDedication waiver (http://creativecommons.org/publicdomain/zero/1.0/) applies to the data made available in this article,unless otherwise stated.

Larentis et al. BMC Research Notes 2014, 7:671 Page 2 of 13http://www.biomedcentral.com/1756-0500/7/671
BackgroundLeptospirosis is a zoonotic disease caused by spirochetesof the genus Leptospira that occurs in tropical, subtrop-ical and temperate climates. It is an increasing problemin cities, particularly as people migrate from poor, ruralareas to towns, where they often end up living in poorhousing conditions with limited or no sanitation infra-structure, resulting in a change in the epidemiologicalprofile of the disease. Infection occurs during exposureto animal reservoirs or environments contaminated withurine. The most widespread source of infection is due torodents that carry the Leptospira in their kidneys andeliminate it in their urine, contaminating water, soil andfoodstuffs. Leptospirosis produces a variety of clinicalmanifestations ranging from an undifferentiated febrileillness to severe forms such as Weil’s disease and pul-monary hemorrhage syndrome, for which mortality is5% to 40% [1-4].Leptospirosis has become a major public health issue,
demanding increased investments in housing conditionsand especially the development of rapid diagnosis anddirected treatment methods. Prompt diagnosis is criticalin preventing severe outcomes, since antibiotics are be-lieved to provide the greatest benefit when initiated earlyin the course of the illness. Early phase leptospirosis isoften missed or else is misdiagnosed and put down tosome other cause of acute febrile disease because of itsnon-specific clinical presentation. The identification ofleptospirosis depends on high clinical suspicion and ef-fective laboratory tests [1,2]. The standard diagnosticassay (Microscopic Agglutination Test, MAT) requirespaired serum samples for proper interpretation and isnot adequate for clinical decision-making. Recent evalu-ation found that commercial whole Leptospira-basedassays such as ELISAs and other rapid formats had 29-52% sensitivity and 85-100% specificity, and the sensitiv-ity for these assays was below 25% for patients in thefirst week of illness [5]. PCR-based detection methodshave been restricted to the reference laboratory settingand are unlikely to be implemented in developing coun-tries, which shoulder the greatest public health burdenof leptospirosis [1,5]. Therefore, it is ever more urgentthat new strategies for diagnosis be developed and newdiagnostic markers be identified, which can aid earlycase identification and timely administration of anti-biotic therapy.The urgent need for intervention at the early stages of
the disease has led several different groups to join forcesin developing a new generation of diagnostic reagents toimprove and accelerate the identification of cases andconsequently bring forward the start of antimicrobialtherapy. Researchers from Fiocruz (Bio-Manguinhos/Riode Janeiro and CPqGM/Bahia) are developing a rapidserodiagnostic test for leptospirosis based on the Dual
Path Platform (DPP®) Technology from Chembio, whichis crucially important for leptospirosis detection so treat-ment can be started promptly under the Brazilian publichealth system. The rapid test result is given in just 15 mi-nutes. It uses a drop of blood from individuals suspectedof having the illness, and is easy to handle and withdiagnostic accuracy similar to currently used assays [6].The test is based on antigen-antibody reaction with seraof leptospirosis patients, which reacts with immunodo-minant proteins of the bacteria. The proteins expressedduring host infection are expected to elicit a specificantibody response, and may therefore serve as candidateserodiagnostic markers [5,6].In order to develop this diagnostic kit, targets from
the genome of L. interrogans serovar Copenhageni [7,8]were selected and a novel protein family was identified,named Leptospira Immunoglobulin-like proteins (Lig):LigA, LigB and LigC. Lig proteins are Microbial SurfaceComponents Recognizing Adhesive Matrix Molecules(MSCRAMMs), in that they have the ability to bindto fibronectin, laminin, collagen, fibrinogen, elastin, andtropoelastin in host cells, and also binding several com-plement components and complement regulator pro-teins [9-13]. A recent study [13] proposed that LigB hasother activities suggesting its importance early in infec-tion, including binding extracellular matrix, plasma, andcutaneous repair proteins and inhibiting hemostasis.LigA and LigB both have an identical region calledLigB (131-645aa), which is made up of seven repeateddomains present in both proteins (Figure 1). The Ligproteins are conserved between pathogenic leptospiresand can be used as candidate serodiagnostic markers forleptospirosis at its acute phase; for this reason they havebeen used in the development of assays for leptospirosisdiagnosis. Previous data showed that sera from patientsidentified during urban outbreaks in Brazil reactedstrongly with immunoblots of a recombinant fragmentof LigB (131-645aa) from L. interrogans serovarCopenhageni and a LigB analogous fragment derivedfrom L. kirschneri serovar Grippotyphosa [5]. Anotherstudy showed 92% sensitivity with sera in the acutephase and specificity ranged from 86 to 100% amongsera from healthy individuals from endemic area andfrom patients diagnosed with others diseases with clin-ical signs that overlap with leptospirosis [6]. Thesefindings indicate that the antibody response to thisputative virulence determinant is a sensitive and specificmarker for acute infection. Therefore, the proteinLigB (131-645aa) was selected as a promising candidate tocompose the new rapid diagnostic test for leptospirosis [5,6].So as to obtain these proteins on a large enough scale
for the widespread use of the rapid diagnostic test forleptospirosis, LigB (131-645aa) protein was cloned inplasmid pAE with a T7 promoter induced by isopropyl

Figure 1 Scheme of LigA and LigB proteins from L. interrogans serovar Copenhageni adapted from Silva et al. [17]. The squaresrepresent the immunoblobulin-like repeat domains found in the proteins of Leptospira. The C-terminal portion of the LigB protein is representedby the final rectangle. LigA (1224 amino acids and 128 kDa) and LigB (1891 amino acids and 201 kDa) present a region with seven repeatedidentical domains named LigB (131-645aa) (corresponding to amino acids 131 to 645 of LigA and LigB with 54 kDa, indicated by grey squares).
Larentis et al. BMC Research Notes 2014, 7:671 Page 3 of 13http://www.biomedcentral.com/1756-0500/7/671
β-D-1-thiogalactopyranoside (IPTG), using Escherichiacoli as the host because of its capacity to grow fast inhigh cell concentrations and in cheap, relatively simplecultures. In order to take advantage of the flexibility ofinducible promoter systems, the optimal point in E. coligrowth for inducing the expression of the recombinantprotein and the optimal inducer concentration should bedetermined [14]. Nevertheless, the most common strat-egy employed in molecular biology is still to evaluate theinfluence of such variables on heterologous protein ex-pression by changing one factor at a time while holdingthe others constant, assuming that each variable is inde-pendent. This assumption is usually too simplistic whenconsidering complex biological systems and is not effi-cient in many cases because it does not enable the inter-action between variables to be analyzed. Experimentaldesign techniques were developed to enable the max-imum information about the process using as few exper-iments as possible [15].As such, the expression of the recombinant protein
LigB (131-645aa) from E. coli was assessed in shakingflasks, using central composite design (CCD) for twovariables: cell growth for the induction of protein ex-pression, and the inducer concentration to be used inthe recombinant system (IPTG). The conditions wereconfirmed in a microbioreactor and resulted in highdensity cell growth and protein expression.
MethodsStrain usedE. coli BL21 (DE3) Star™ (Invitrogen) was the bacteriumused to express the recombinant protein LigB (131-645aa)from L. interrogans serovar Copenhageni (54 kDa) clonedin the vector pAE [16,17].
ChemicalsBacto™ yeast extract and tryptone were purchased fromBD (Becton, Dickinson and Company); the potassium salts(K2HPO4 and KH2PO4), glucose and NaCl came fromMerck; the glycerol was from Invitrogen; the ampicillin
was from Sigma; and IPTG (isopropyl β-D-1-thiogalacto-pyranoside) was from Promega.
Cell viability testThe cell viability of the stock of recombinant E. coli BL21(DE3) Star™/pAE/LigB (131-645aa) in LB (5 g/L yeastextract, 10 g/L tryptone, 10 g/L NaCl, pH 7.0) with 25%glycerol, stored at -70°C, was assessed by counting colonyforming units (CFU’s). Serial dilutions were made in PBS,pH 7.4, and transferred to Petri dishes containing LB Agarand 100 μg/mL ampicillin. Cell concentrations of stockswere obtained around 3.5 × 10¹⁰ CFU/mL, with 20% error.
Evaluation of pre-induction temperatureThe recombinant bacteria E. coli BL21 (DE3) Star™/pAE/LigB (131-645aa) were cultivated (10 μL) in 10 mL TBmedium supplemented with 1% glucose, 0.4% glycerol and100 μg/mL ampicillin in 50 mL flasks agitated at 200 rpm,at 28°C and 37°C, with samples being taken at 30-minuteintervals to measure growth by absorbance at 600 nm. Atboth temperatures, LigB (131-645aa) expression wasinduced at Absind = 0.75 with 0.55 mM IPTG, with databeing taken hourly to assess cell growth, specific growthrates and recombinant protein expression, for the purposesof comparison with the curves without induction.
Calculation of specific growth ratesThe specific growth rates (μ) were calculated using thecell mass balance equation for batch processes: dXdt ¼ X μWhen this equation is integrated from X0 (initial cellconcentration) to X and from t = 0 to t, it gives:X = X0 eμ ⋅ t and ln(X/X0) = μ t. Using this equation, andtaking X as the absorbance measurements at 600 nm,linear adjustments were made to the plots during theexponential growth phase prior to induction, and ofgrowth after IPTG addition. The specific growth rateswere obtained with the linear correlation coefficient (R2)at around 0.99.

Larentis et al. BMC Research Notes 2014, 7:671 Page 4 of 13http://www.biomedcentral.com/1756-0500/7/671
Expression of recombinant LigB to assess cell growth forinduction (Absind) and IPTG concentrationInoculum: 10 μL of the E. coli BL21 (DE3) Star™/pAE/LigB (131-645aa) stock was pre-inoculated in 10 mL TBmedium (23.6 g/L yeast extract, 11.8 g/L tryptone,9.4 g/L K2HPO4, and 2.2 g/L KH2PO4, pH 7.2) enrichedwith 1% glucose, 0.4% glycerol and 100 μg/mL ampicil-lin for 16 h at 37°C and 200 rpm, in shaking 50 mLflasks.Growth: 2 mL of the inoculum saturated was grown in
100 mL of the same medium (resulting in initial absorb-ance at 600 nm of around 0.1), in 500 mL flasks at 37°Cand 200 rpm. Cells were left to grow until the desiredconditions were reached for the recombinant protein tobe induced with IPTG.Induction: induction with IPTG was conducted at 28°C
and 200 rpm for 4 h, varying the cell growth by absorbancemeasurements at 600 nm (Absind) of between 0.75 and 2.0,and varying the inducer concentration between 0.1 mMand 1.0 mM IPTG, using central composite design forthese two variables, with triplicate runs at the central point(Absind 1.4 and 0.55 mM IPTG). The means ± standarddeviation at the central point were calculated for each re-sponse analyzed (cell growth, LigB (131-645aa) expression,glucose and pH).
Assessment of cell growth and determination of the drymass of cellsAfter 4 h induction, cell growth was measured by absorb-ance at 600 nm. Cell pellets were obtained from 25 mLculture after centrifugation at 3220 × g for 20 min at 10°C,and stored at -20°C. The conversion from absorbance mea-sured at 600 nm to the dry cell mass of E. coli BL21 (DE3)Star™/pAE/LigB (131-645aa) was obtained for the samplesafter 4 h induction taken in duplicate, for each 25 mLbacterial culture. Each pellet was washed three times using25 mL sterile WFI (water for injection) and centri-fuged at 18514 × g for at least 30 min. The super-natant was monitored by absorbance at 600 nm anddiscarded when the measure was lower than 0.010. Ifthe absorbance at 600 nm was higher than 0.010,another centrifugation was done. A curve with differ-ent samples from the experimental design wasobtained as g (dry cell)/L = 0.23 Abs600nm (R2 = 0.93).
Glucose and pH measurementsAfter 4 h induction, 0.5 mL samples were taken andcentrifuged at 20817 × g for 5 min to separate the cells(stored at -20°C) from the bacterial culture super-natant (used for pH and glucose measurements). Ini-tial pH of TB medium was 7.2 and the final pH ofeach culture medium was determined in a potentiom-eter (Corning). To determine glucose uptake, enzymecolorimetric assays were used with glucose oxidase
(Laborlab commercial kit), using absorbance at 500 nmand 100 mg/dL standard solution supplied by the manu-facturer. The samples were diluted at 1:10 in order tomaintain the linearity of the reaction (following manufac-turer’s instructions, until 450 mg/dL). Glucose concentra-tions were measured in triplicate, including the standardsolution.
Analysis of expression by SDS-PAGE and densitometryCell samples (1 mL) from before induction and at theend of cultivation under each expression condition fromthe experimental design were resuspended in a lysisbuffer (20 mM Tris, 1 mM EDTA, 0.1% Triton X-100,pH8) to obtain the total protein extracts normalized bycell growth, at a ratio of 25 μL for each 0.1 of Abs600nm.Each total extract was disrupted by sonication on iceduring 5 cycles of 10-s pulses with 30-s intervals and 30%amplitude using an ultrasonic cell disruptor (Sonics &Material, Inc.), centrifuged at 20,817 × g for 20 min at10°C and separated into the soluble and insolublefractions of the total proteins from recombinant E. coli.These samples from each condition were run on 12.5%polyacrylamide gel, stained with Coomassie Blue R-250,with a marker made up of 2 μg of different proteins(BSA, 60 kDa; egg albumin, 45 kDa; trypsinogen, 24 kDa;β-lactoglobulin, 18.4 kDa; and lysozyme, 14.4 kDa), forthe purposes of comparison with bands of a similarintensity to those of LigB (131-645aa) presented in thesame gel. A curve of different BSA concentrations wasproduced using SDS-PAGE to confirm the intensity of thebands. The areas of the bands corresponding to theLigB (131-645aa, 54 kDa) expressed under each condition(total protein and soluble and insoluble fractions) wereanalyzed by densitometry using a Bio-Rad GS-800Calibrated Densitometer and quantified using theQuantityOne 4.4.1 program by comparing with the stand-ard marker. The densitometry analyses were undertakenin duplicate under each of the conditions. For yield andproductivity calculations, only the soluble fraction wasconsidered. The yield of soluble LigB (131-645aa)expressed under each condition was obtained using theequation below, where 4 is the concentration factorused in the preparation of total protein extract samples:(mg/L) = (Abs600nm × densitometry band)/4.
Experimental design and statistical analysisThe analysis of the effects of the induction variables(Absind and IPTG) on the expression of solubleLigB (131-645aa) in recombinant E. coli BL21 (DE3)Star™/pAE was performed using a central composite de-sign containing all the combinations of the two codifiedvariables at levels -1 (lowest value of the experimentalconditions used), +1 (highest value of the experimentalconditions), and triplicate at 0 (central point condition,

Larentis et al. BMC Research Notes 2014, 7:671 Page 5 of 13http://www.biomedcentral.com/1756-0500/7/671
defined as the intermediate value in the range of eachvariable), in order to analyze experimental error and tocheck the curvature of the responses. The central pointswere run on different days, alongside the other assays, inorder to control and obtain a more realistic assessmentof experimental error. The codification of the levels ofeach variable allows the comparison of the importanceof each variable effect, in reference to the evaluatedresponse.The significance of each linear coefficient and its inter-
actions was determined using Student’s t-test, at 0.05 prob-ability level (95% confidence level). The statistical evaluationof the effects of Absind and IPTG on LigB (131-645aa)expression was performed with the help of STATISTICA9.1 software (Statsoft, USA). The fit of the models wasexpressed by the correlation coefficients (the closer theR2 value was to 1, the better it described the experimen-tal data) and by comparison between the experimentaland model data (calculating the residues and relativeerrors for each experiment). The statistical significanceof the model equations for cell growth (g (dry cell)/L)and expressed LigB (131-645aa) (mg/L and (mg/L)/h)was checked using the F-test analysis of variance(ANOVA). The response surfaces were obtained by thesame software as used for the statistical analysis(STATISTICA).
Expression of LigB protein in microbioreactorLigB (131-645aa) expression was also performed inBiopod f800 microbioreactors (Fogale nanotech) using70 mL culture medium with 1vvm aeration, and modi-fied polydimethylsiloxane as an anti-foaming agent.Induction was performed with 0.1 mM IPTG for 4 h,starting at the end of the exponential phase, as indicatedin the statistical analysis performed in shaking flasks.The basic parameters for the operation of the micro-bioreactors followed those described by Frachon et al.[18].
Protein purification by Immobilized metal affinitychromatography (IMAC)Cells grew in microbioreactor were harvested by centri-fugation at 10,000 × g and resuspended in 20 mM Tris,1 mM EDTA pH 8.0 and 0.1% Triton X-100. After incu-bating for 30 minutes at 4°C, the cells were disrupted bysonication (Sonics & Material). The protein lysate wascentrifuged at 10,000 × g for 20 minutes at 4°C. The re-covered soluble fraction was applied to a Ni2+-chargedcolumn (Histrap HP, GE Healthcare) in a High pressureliquid chromatography (HPLC) system and washed with10 column volumes of buffer (PBS, pH 7.4, 20 mM imid-azole). The protein was eluted using stepwise gradient ofimidazole varying from 20 mM to 300 mM at 1 mL/minflow rate. Purified LigB (131-645aa) was checked for
homogeneity, protein quality and amount in a 12.5%SDS-PAGE by densitometry and quantified by the BCAmethod (BCA Thermo Scientific Pierce, Rockford, IL,USA) according to the manufacturer's recommenda-tions to determine protein concentration, calculateyield and relative losses at the different steps. Theprocedure was repeated three times for evaluatingreproducibility.
ResultsEvaluation of pre-induction temperatureThe recombinant E. coli BL21 (DE3) Star™/pAE/LigB (131-645aa) was cultivated at 28°C and 37°C, andmonitored by absorbance at 600 nm every 30 min with aview to obtaining growth curves for these temperaturesand assessing the specific growth rates at the exponentialphase. It can be seen from Figure 2(a) and the calcula-tions of specific growth rates at the exponential growthphases that the maximum growth rate at 28°C (μmax =0.62 h-1) was around 40% lower than the growth rateobtained at the optimal E. coli growth temperature of37°C (μmax = 1.05 h-1). It took 1 h 50 min to reach ab-sorbance of 0.75 (early exponential phase) at 37°C,while it took 3 h to reach the same absorbance at 28°C.At 37°C, the cell was grown for 4.5 h until reached theabsorbance at 600 nm of around 4, while it took 6 h toreach this cell growth at 28°C, as shown in Figure 2(a).At 37°C, μmax of 1.05 h-1 was maintained until 3 hgrowth, at absorbance (measured at 600 nm) of around2, when cells reach the final exponential growth phase.In two other runs, the bacteria were cultivated at 28°C
and 37°C until absorbance reached 0.75, at which pointIPTG was added to induce the expression of the recom-binant protein LigB (131-645aa). In both experimentsthe post-induction temperature was kept at 28°C for4 h, while absorbance was monitored at 600 nm andthe expression level was checked every hour usingSDS-PAGE. In the experiment conducted at 28°C(both before and after induction with IPTG), a fall ofover 60% in the bacteria growth rate was identifiedafter induction with IPTG (from 0.62 h-1 to 0.24 h-1)(Figure 2b). The reduction of the growth rate afterinduction may have been caused by the toxic effectof IPTG and/or the metabolic burden imposed onthe cells due to heterologous gene expression or pro-tein toxicity [19-24].When the LigB (131-645aa) expression kinetics at
28°C were compared for the assays using different pre-induction temperatures (28°C and 37°C), there wasfound to be no significant difference between thegrowth obtained under the two conditions after induc-tion with IPTG, nor between the expression levels ob-tained in 4 h (Table 1).

(a)
(b)
E. coli BL21 (DE3) Star / pAE / LigB (131-645aa)
0.0
0.5
1.0
1.5
2.0
2.5
3.0
3.5
4.0
4.5
5.0
0 1 2 3 4 5 6 7 8
Time (h)
Cel
l gro
wth
(abs
orba
nce
at 6
00nm
) 37°C
28°C
E. coli BL21 (DE3) Star / pAE / LigB (131-645aa)
0.0
0.5
1.0
1.5
2.0
2.5
3.0
3.5
4.0
4.5
5.0
0 1 2 3 4 5 6 7 8
Time (h)
Cel
l gro
wth
(abs
orba
nce
at 6
00nm
)
28°C (uninduced)
28°C (IPTG induced)
IPTG addition
Figure 2 Growth curves of E. coli BL21 (DE3) Star™/pAE/LigB (131-645aa). (a) Cell growth at 37°C and 28°C in TB at 200 rpm(errors in absorbance measured at 600 nm of between 1 and 2%).(b) Comparison between uninduced and IPTG-induced growth at28°C. Induction was performed for 4 h after IPTG was added (equivalentto 7 h process) at Absind = 0.75 (the time when 0.55 mM IPTG was addedis indicated by an arrow at 3 h process). As indicated in the scale, 1 hinduction was reached after 4 h process, 2 h induction after 5 h process,and 3 h induction after 6 h process, respectively.
Table 1 Comparison of cell growth during 4 h inductionat 28°C (after addition of 0.55 mM IPTG at absorbance0.75) of E. coli BL21 (DE3) Star™/pAE/LigB (131-645aa)after two pre-induction growth temperatures, 28°C and37°C, at 200 rpm in TB medium with the addition of 0.4%glycerol, 1% de glucose and 100 μg/mL ampicillin
Cell growth (Abs600nm)Soluble LigB (131-645aa)
expression (mg/L)
Postinductiontime (h)
Tgrowth(pre-induction)
28°C
Tgrowth(pre-induction)
37°C
Tgrowth(pre-induction)
28°C
Tgrowth(pre-induction)
37°C
Induction 0.75 0.76 - -
1 h 1.36 1.40 17 15
2 h 1.69 1.80 80 67
3 h 2.25 2.29 108 118
4 h 2.73 2.97 176 186
Larentis et al. BMC Research Notes 2014, 7:671 Page 6 of 13http://www.biomedcentral.com/1756-0500/7/671
As the specific growth rate during the pre-inductionphase was higher at 37°C, the process was initiallyconducted at 37°C (optimal temperature for E. coligrowth), and only at the induction phase was thetemperature reduced to 28°C (optimal temperature forLigB (131-645aa) expression in E. coli). For the evalu-ation of the effect of IPTG induction at the exponential
phase, the culture took around 3 h at 37°C to reachabsorbance near 2 (highest cell concentration at whichthe μmax is kept constant, i.e., the end of the exponen-tial growth phase). The same absorbance took almost5 h with growth at 28°C, which would reduce processproductivity.
Expression of recombinant LigB using experimentaldesign to assess cell growth for induction (Absind) andIPTG concentrationDifferent experimental conditions were tested to vary the ab-sorbance for the induction of recombinant LigB (131-645aa)expression and IPTG concentration, using central compositedesign for two variables. E. coli BL21 (DE3) Star™ was culti-vated at 37°C and 200 rpm until the exponential phasewas reached (Absind of between 0.75 and 2.0), at whichpoint IPTG (between 0.1 mM and 1 mM) was addedfor the expression of recombinant LigB (131-645aa) at28°C for 4 h.The bands for the total protein extract, soluble frac-
tion and insoluble fraction analyzed in gel were nor-malized by cell growth measured by absorbance at600 nm, as described in Methods. The SDS-PAGEbands are similar for all the Absind and IPTG concen-trations tested, indicating that the expression normal-ized by cell growth did not depend on these variables.Under all the conditions tested, LigB (131-645aa) wasobtained in its soluble form in the lysis buffer (20 mMTris, 1 mM EDTA, 0.1% Triton X-100) with around15% of the total expressed protein in its insolublefraction in all conditions tested, except in assay 4(at Absind 2.0 and 1 mM IPTG) where the insolublefraction was higher, near 35% of the total expressedprotein. The SDS-PAGE analyses undertaken to assessLigB (131-645aa) expression normalized by cell growthand solubility by densitometry are shown in Figure 3.

Figure 3 SDS-PAGE with uninduced and IPTG-inducedE. coli BL21 (DE3) Star/pAE/LigB (131-645aa) samples normalizedby absorbance at 600 nm from assay 3 (Absind = 2.0 and IPTG0.1 mM), total protein extract separated into soluble andinsoluble fractions of recombinant protein in 20 mM Tris/1 mMEDTA/0.1% Triton X-100 (pH8). Unind = uninduced; Ind = induced;TE = Total Extract.
Larentis et al. BMC Research Notes 2014, 7:671 Page 7 of 13http://www.biomedcentral.com/1756-0500/7/671
The results of cell growth and LigB (131-645aa) ex-pression in the soluble fraction are shown in Table 2.In assays 1 and 2, induced at Absind = 0.75, cells grew
for 1 h 45 min and 1 h 50 min, respectively, at 37°Cprior to induction; cells grew for 2 h 45 min and 3 h inassays 3 and 4 (Absind = 2.0), respectively. At the centralpoints, cells grew for 2 h 15 min for absorbance to reach1.4 each. These cell growth times in each experiment
Table 2 Results for cell growth (measured by absorbance at 6(DE3) Star™/pAE/LigB (131-645aa), yield (mg/L) and productivexpressed in shaking flasks at 28°C for 4 h in TB using centrainduction) with triplicate at the central point (CP)
Induction conditions Cell growth (4 h ind)
Assays Totalprocesstime (h)a
Absind (x1) IPTG (x2) Abs600nmDry cell(g/L)
Mode(g/L)
1 5.75 0.75 (-1) 0.1 mM (-1) 3.75 0.9 0.94 (-4
2 5.83 0.75 (-1) 1.0 mM (+1) 3.31 0.8 0.74 (7.
3 6.75 2.0 (+1) 0.1 mM (-1) 6.33 1.6 1.54 (3.
4 7.00 2.0 (+1) 1.0 mM (+1) 5.19 1.3 1.34 (-3
CP 1c 6.25 1.4 (0) 0.55 mM (0) 4.83 1.2 1.14 (5.0
CP 2 6.25 1.4 (0) 0.55 mM (0) 4.46 1.1 1.14 (-3
CP 3 6.25 1.4 (0) 0.55 mM (0) 4.53 1.1 1.14 (-3aTotal process time = growth time + 4 h induction. The growth time varied accordinIPTG and induction of LigB (131-645aa).bModel response obtained for each variable with its relative error in parenthesis (%cCP is the central point, calculated as the intermediate condition between the inferdesign procedures.The calculated errors were lower than 12%.
prior to the addition of the inducer were added to the4 h induction time for the productivity calculationsshown in Table 2.With regard to the cell growth at which LigB (131-645aa)
was to be induced, there was found to be a significantincrease in cell growth and recombinant proteinexpression when Absind 0.75 was compared with 2.0,while the IPTG concentration was kept the same(Table 2). In assays 1 and 3, where induction wasdone at 0.75 and 2.0, respectively, and the IPTGconcentration was the same (0.1 mM), cell growth of0.95 and 1.6 g (dry cell)/L was obtained (respectively3.75 and 6.33 in terms of absorbance at 600 nm)while 180 mg/L and 288 mg/L LigB (131-645aa) wasexpressed, representing around 70% higher cell growthand 60% higher protein expression. When assays 2 and4 are compared, where induction with 1 mM IPTGwas made at different absorbances, cell growth andLigB (131-645aa) expression were also found to behigher when the Absind was higher. When the concen-tration of inducer was varied, the comparison of assays1 and 2 (Absind 0.75) and the comparison of assays 3 and4 (Absind 2.0) show that cell growth and LigB (131-645aa)expression were both higher at 0.1 mM (Table 2), althoughthe difference was lower than when the cell concentrationwas varied at induction. The productivity data (amount ofexpressed target protein per volume of bacterial cultureper process time) indicated that at the lower concentrationof IPTG (0.1 mM), expressing the target protein at Absind2.0 was better.
00 nm and converted to g (dry cell)/L) of E. coli BL21ity ((mg/L)/h) of soluble recombinant LigB (131-645aa)l composite design for two variables (Absind and IPTG for
Soluble LigB expression (4 h ind)
lb
Yield(mg/L)
Model(mg/L)b
Productivity(mg/L)/h
Model((mg/L)/h)b pH Residual
glucose (g/L)
.4%) 180 177 (2%) 31.3 31.2 (0.4%) 6.64 6.4
5%) 166 163 (2%) 28.4 28.4 (0.1%) 6.75 6.8
8%) 288 286 (1%) 42.7 42.6 (0.2%) 6.36 5.2
.1%) 221 218 (1%) 31.5 31.4 (0.5%) 6.24 5.1
%) 198 211 (-7%) 31.7 33.4 (-5.4%) 6.63 6.4
.6%) 214 211 (1%) 34.2 33.4 (2.4%) 6.53 5.8
.6%) 210 211 (-1%) 33.6 33.4 (0.6%) 6.55 5.1
g to the time each culture took to reach the Absind required for the addition of
= ((experimental data - predicted by model)/experimental data) x 100).ior (-1) and superior levels (+1) and coded as 0, according to experimental

Larentis et al. BMC Research Notes 2014, 7:671 Page 8 of 13http://www.biomedcentral.com/1756-0500/7/671
In the analysis of the triplicate at the central point(Absind = 1.4 and 0.55 mM IPTG), the errors associatedwith each of the response variables were assessed bycalculations of means and their respective standarddeviations, resulting in 1.15 ± 0.05 g (dry cell)/L for cellgrowth (equivalent of 4.61 ± 0.20 measured by absorb-ance at 600 nm), and 207 ± 8 mg/L for the yield of sol-uble LigB (131-645aa) expressed, while productivitywas found to be 33.2 ± 1.3 (mg/L)/h. The errors calcu-lated for the intermediate Absind and IPTG conditions,in triplicate (Central Points 1-3), were lower than 5%.The errors in the data obtained from the densitometryanalysis that were used to calculate protein expressionwere found to be around 8%.There was no significant reduction in the pH at the
end of the experiments, as they were buffered with po-tassium salts in the TB medium (Table 2). The final pHat the central points was measured at around 6.6 ± 0.1(errors of less than 1%). The glucose uptake after the4 h induction period was found to be 30-50% of the ini-tial concentration (9-10 g/L confirmed by the enzymecolorimetric method used) (Table 2). This indicatesthat the initial glucose concentration could have beenlower. The assessment of the central point indicatedthe error in the glucose measurements to be around12%, averaging 5.8 ± 0.7 g/L. The experiments that re-sulted in the greatest drop in pH and the greatest glu-cose uptake were the ones that yielded the highest cellgrowth.Experimental design techniques were developed so
that the maximum of process information could begathered using the smallest number of experiments.Experimental design techniques usually rely on em-pirical model structures in order to interpret experi-mental data and provide optimal process operationconditions [23]. The linear effects and the effect ofthe interaction between Absind and IPTG concentra-tion (x1 and x2 for codified variables, respectively) oncell growth (in g (dry cell)/L), the yield of expressedsoluble LigB (131-645aa) (mg/L) and productivity((mg/L)/h) can be described by linear models ob-tained by the statistical analysis with 95% confidencelevel (p < 0.05 for statistically significant parameters),according to the equations below (in terms of codi-fied variables):
g dry cellð Þ = L ¼ 1:14 � 0:02ð Þ þ 0:3 � 0:02ð Þx1 þ
mg LigB=L ¼ 211:0 � 3:2ð Þ þ 40:8 � 4:2ð Þx1 þ − 2ð
mg LigB=Lð Þ=h ¼ 33:4 � 0:4ð Þ þ 3:6 � 0:6ð Þx1 þ −ð
Experimental and model data for each experimentwere compared in order to check if the models are real-ist (shown in Table 2). The relative errors confirmed themodels were representative of the experimental data.The correlation coefficients (R2) obtained were around0.98 and Fcal> > Ftab in the F-test analysis of variance(ANOVA), shown in Table 3, indicating that the modelsare statistically significant and predictive.The models were evaluated by the correlation coefficients
R2 and ANOVA, demonstrating that they represent the ex-perimental data (good agreement between the experimentalvalues and the values predicted by the models); as such, theresponse surfaces could be obtained from themodels. The re-sponse surfaces for cell growth and soluble LigB (131-645aa)productivity can be seen in Figure 4, where the linear effects ofAbsind and IPTG and the effect of their interactions on theresponse variables can be assessed.The models indicate that the growth of E. coli BL21
(DE3) Star™/pAE/LigB (131-645aa) (measured by absorb-ance at 600 nm and converted to g (dry cell)/L), the yield ofsoluble protein (mg/L) at the end of 4 h induction and theproductivity of the process taken as a whole, in (mg/L)/h,were influenced both by the cell growth at which proteinexpression was induced by IPTG, and by the concentrationof the inducer. It was also found that the interactionbetween the two variables, Absind and IPTG, had a signifi-cant effect on soluble LigB (131-645aa) expression: theconcentration of IPTG that yielded increased protein pro-duction depended on the cell growth when induction wasbegun. The interaction between these two variables did nothave a statistically significant effect only on cell growth,since p > 0.05 for this parameter. The statistical analysis forthe densitometry values of the bands corresponding to thesoluble fractions in SDS-PAGE (that means the solubleexpression of LigB (131-645aa) normalized by cell growth)indicated that both Absind and IPTG concentration had nostatistical influence on this response, as all the effectsresulted in p > 0.05.The data on soluble LigB (131-645aa) expression indi-
cated that productivity was improved when 0.1 mMIPTG was used (lower inducer concentration) and whenthe highest absorbances were reached for induction atthe final exponential growth phase, keeping the max-imum specific growth rates (Absind 2.0). Induction atAbsind 2.0 resulted in a higher level of expression of the
−0:1 � 0:02ð Þx2 R2 ¼ 0:98� �
0:4 � 4:2Þx2 þ −13:3 � 4:2ð Þx1x2 R2 ¼ 0:98� �
3:5 � 0:6Þx2 þ −2:1 � 0:6ð Þx1x2 R2 ¼ 0:97� �
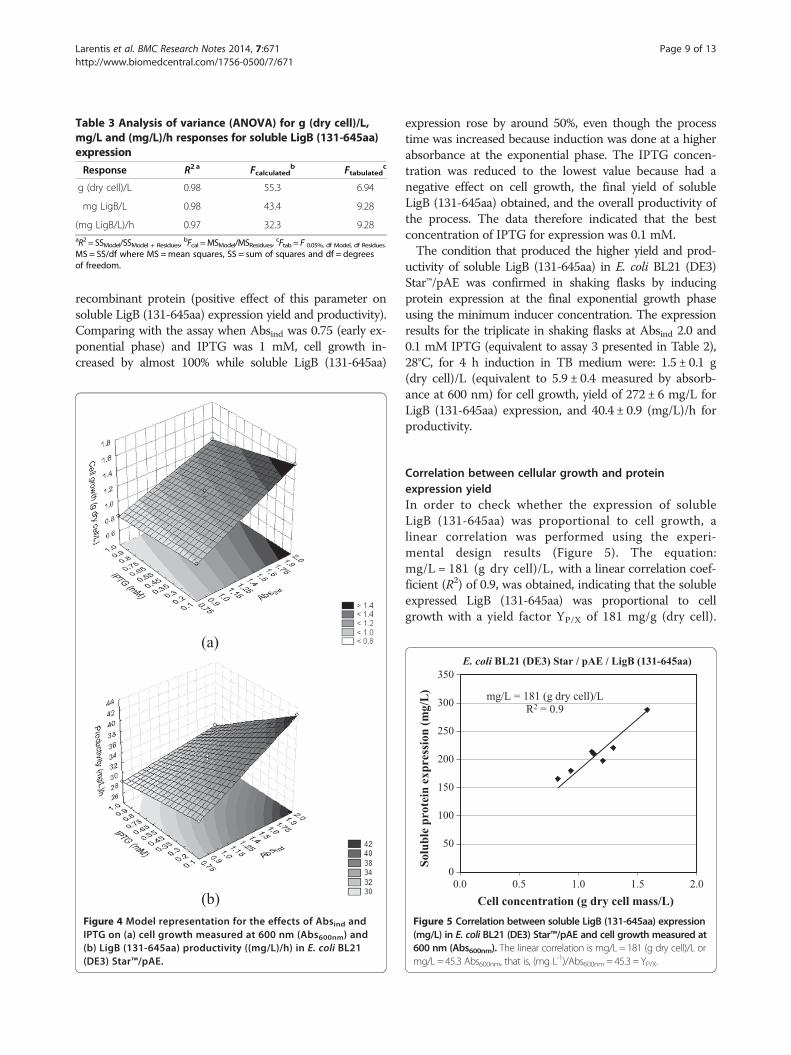
Table 3 Analysis of variance (ANOVA) for g (dry cell)/L,mg/L and (mg/L)/h responses for soluble LigB (131-645aa)expression
Response R2 a Fcalculatedb Ftabulated
c
g (dry cell)/L 0.98 55.3 6.94
mg LigB/L 0.98 43.4 9.28
(mg LigB/L)/h 0.97 32.3 9.28aR2 = SSModel/SSModel + Residues,
bFcal =MSModel/MSResidues,cFtab = F 0.05%, df Model, df Residues.
MS = SS/df where MS =mean squares, SS = sum of squares and df = degreesof freedom.
Larentis et al. BMC Research Notes 2014, 7:671 Page 9 of 13http://www.biomedcentral.com/1756-0500/7/671
recombinant protein (positive effect of this parameter onsoluble LigB (131-645aa) expression yield and productivity).Comparing with the assay when Absind was 0.75 (early ex-ponential phase) and IPTG was 1 mM, cell growth in-creased by almost 100% while soluble LigB (131-645aa)
(b)
(a)
Figure 4 Model representation for the effects of Absind andIPTG on (a) cell growth measured at 600 nm (Abs600nm) and(b) LigB (131-645aa) productivity ((mg/L)/h) in E. coli BL21(DE3) Star™/pAE.
expression rose by around 50%, even though the processtime was increased because induction was done at a higherabsorbance at the exponential phase. The IPTG concen-tration was reduced to the lowest value because had anegative effect on cell growth, the final yield of solubleLigB (131-645aa) obtained, and the overall productivity ofthe process. The data therefore indicated that the bestconcentration of IPTG for expression was 0.1 mM.The condition that produced the higher yield and prod-
uctivity of soluble LigB (131-645aa) in E. coli BL21 (DE3)Star™/pAE was confirmed in shaking flasks by inducingprotein expression at the final exponential growth phaseusing the minimum inducer concentration. The expressionresults for the triplicate in shaking flasks at Absind 2.0 and0.1 mM IPTG (equivalent to assay 3 presented in Table 2),28°C, for 4 h induction in TB medium were: 1.5 ± 0.1 g(dry cell)/L (equivalent to 5.9 ± 0.4 measured by absorb-ance at 600 nm) for cell growth, yield of 272 ± 6 mg/L forLigB (131-645aa) expression, and 40.4 ± 0.9 (mg/L)/h forproductivity.
Correlation between cellular growth and proteinexpression yieldIn order to check whether the expression of solubleLigB (131-645aa) was proportional to cell growth, alinear correlation was performed using the experi-mental design results (Figure 5). The equation:mg/L = 181 (g dry cell)/L, with a linear correlation coef-ficient (R2) of 0.9, was obtained, indicating that the solubleexpressed LigB (131-645aa) was proportional to cellgrowth with a yield factor YP/X of 181 mg/g (dry cell).
mg/L = 181 (g dry cell)/L
R2 = 0.9
0
50
100
150
200
250
300
350
0.0 0.5 1.0 1.5 2.0
Solu
ble
prot
ein
expr
essi
on (m
g/L
)
Cell concentration (g dry cell mass/L)
E. coli BL21 (DE3) Star / pAE / LigB (131-645aa)
Figure 5 Correlation between soluble LigB (131-645aa) expression(mg/L) in E. coli BL21 (DE3) Star™/pAE and cell growth measured at600 nm (Abs600nm). The linear correlation is mg/L = 181 (g dry cell)/L ormg/L = 45.3 Abs600nm, that is, (mg L-1)/Abs600nm = 45.3 = YP/X.
Larentis et al. BMC Research Notes 2014, 7:671 Page 10 of 13http://www.biomedcentral.com/1756-0500/7/671
When it came to protein production in milligrams perliter of culture at Abs600nm of 1, the yield factor was45.3 mg/L per absorbance measured at 600 nm, whichindicates the same significance as the yield of productper unit of cell [25]. This finding indicates that the ex-pression of soluble LigB (131-645aa) in the conditionstested in this work in terms of mg L−1 Abs−1 was simi-lar in all the experiments, with an error of around 10%.That is, LigB (131-645aa) expression per cell in termsof mg L−1 Abs−1 obtained from the bands of the solublefractions in the densitometry analysis was not statisti-cally influenced by either of the variables (Absind andIPTG concentration), as already indicated before.
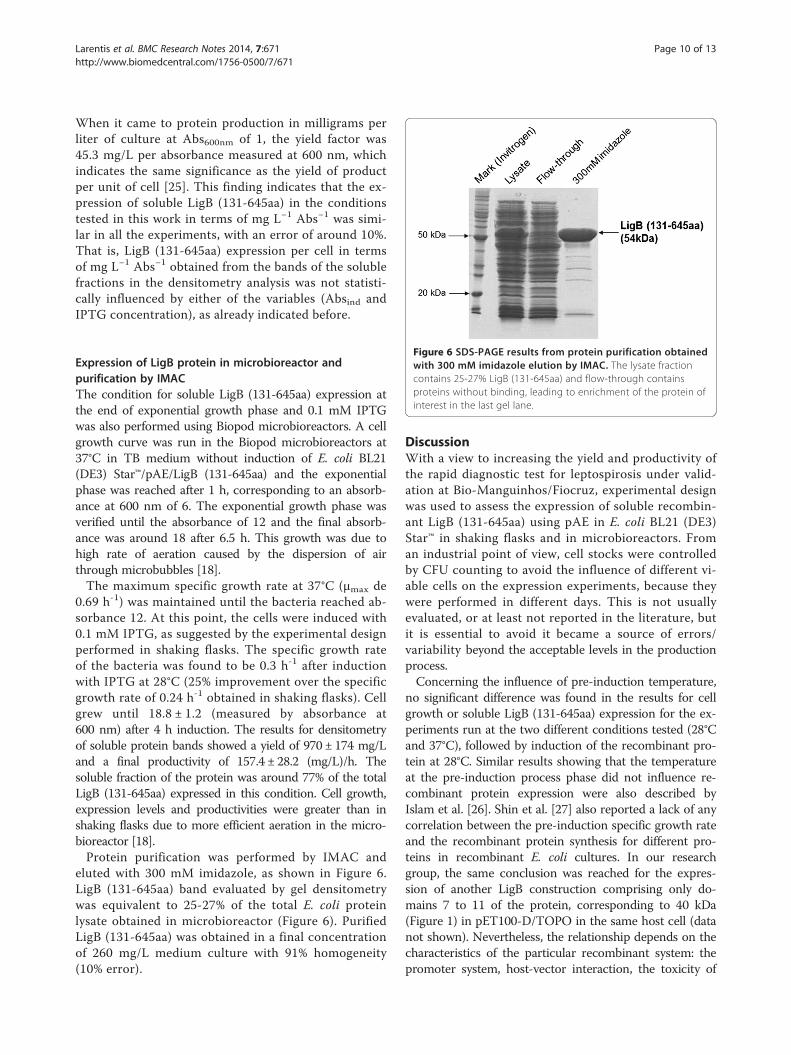
Figure 6 SDS-PAGE results from protein purification obtainedwith 300 mM imidazole elution by IMAC. The lysate fractioncontains 25-27% LigB (131-645aa) and flow-through containsproteins without binding, leading to enrichment of the protein ofinterest in the last gel lane.
Expression of LigB protein in microbioreactor andpurification by IMACThe condition for soluble LigB (131-645aa) expression atthe end of exponential growth phase and 0.1 mM IPTGwas also performed using Biopod microbioreactors. A cellgrowth curve was run in the Biopod microbioreactors at37°C in TB medium without induction of E. coli BL21(DE3) Star™/pAE/LigB (131-645aa) and the exponentialphase was reached after 1 h, corresponding to an absorb-ance at 600 nm of 6. The exponential growth phase wasverified until the absorbance of 12 and the final absorb-ance was around 18 after 6.5 h. This growth was due tohigh rate of aeration caused by the dispersion of airthrough microbubbles [18].The maximum specific growth rate at 37°C (μmax de
0.69 h-1) was maintained until the bacteria reached ab-sorbance 12. At this point, the cells were induced with0.1 mM IPTG, as suggested by the experimental designperformed in shaking flasks. The specific growth rateof the bacteria was found to be 0.3 h-1 after inductionwith IPTG at 28°C (25% improvement over the specificgrowth rate of 0.24 h-1 obtained in shaking flasks). Cellgrew until 18.8 ± 1.2 (measured by absorbance at600 nm) after 4 h induction. The results for densitometryof soluble protein bands showed a yield of 970 ± 174 mg/Land a final productivity of 157.4 ± 28.2 (mg/L)/h. Thesoluble fraction of the protein was around 77% of the totalLigB (131-645aa) expressed in this condition. Cell growth,expression levels and productivities were greater than inshaking flasks due to more efficient aeration in the micro-bioreactor [18].Protein purification was performed by IMAC and
eluted with 300 mM imidazole, as shown in Figure 6.LigB (131-645aa) band evaluated by gel densitometrywas equivalent to 25-27% of the total E. coli proteinlysate obtained in microbioreactor (Figure 6). PurifiedLigB (131-645aa) was obtained in a final concentrationof 260 mg/L medium culture with 91% homogeneity(10% error).
DiscussionWith a view to increasing the yield and productivity ofthe rapid diagnostic test for leptospirosis under valid-ation at Bio-Manguinhos/Fiocruz, experimental designwas used to assess the expression of soluble recombin-ant LigB (131-645aa) using pAE in E. coli BL21 (DE3)Star™ in shaking flasks and in microbioreactors. Froman industrial point of view, cell stocks were controlledby CFU counting to avoid the influence of different vi-able cells on the expression experiments, because theywere performed in different days. This is not usuallyevaluated, or at least not reported in the literature, butit is essential to avoid it became a source of errors/variability beyond the acceptable levels in the productionprocess.Concerning the influence of pre-induction temperature,
no significant difference was found in the results for cellgrowth or soluble LigB (131-645aa) expression for the ex-periments run at the two different conditions tested (28°Cand 37°C), followed by induction of the recombinant pro-tein at 28°C. Similar results showing that the temperatureat the pre-induction process phase did not influence re-combinant protein expression were also described byIslam et al. [26]. Shin et al. [27] also reported a lack of anycorrelation between the pre-induction specific growth rateand the recombinant protein synthesis for different pro-teins in recombinant E. coli cultures. In our researchgroup, the same conclusion was reached for the expres-sion of another LigB construction comprising only do-mains 7 to 11 of the protein, corresponding to 40 kDa(Figure 1) in pET100-D/TOPO in the same host cell (datanot shown). Nevertheless, the relationship depends on thecharacteristics of the particular recombinant system: thepromoter system, host-vector interaction, the toxicity of

Larentis et al. BMC Research Notes 2014, 7:671 Page 11 of 13http://www.biomedcentral.com/1756-0500/7/671
the recombinant product [27], and the effect of the pre-induction temperature on the expression of some recom-binant proteins after induction have also been reported inthe literature [25,27].As such, the strain was cultivated at 37°C until IPTG
was added, while induction was conducted at 28°C,thereby reducing the overall process time. Under thiscondition, LigB (131-645aa) expression was assessedusing central composite design for two variables: cellgrowth at which the expression was induced (absorbanceat 600 nm of between 0.75 and 2.0) and the concentra-tion of the inducer in the recombinant system (varyingfrom 0.1 to 1 mM IPTG). Induction at the highest ab-sorbance at the exponential phase while keeping the spe-cific growth rate at its maximum resulted in higheryields of cell growth and soluble protein expressed. Theobtained linear models indicated that higher expressionof the recombinant protein could be achieved usinghigher absorbances than 2.0 for later induction time.However, higher absorbances were not tested becauseprocess time would be increased when conducting thebatches to higher times than the corresponding workshift of the technicians in the factory and this should betaken into consideration when making an economicevaluation of the process.Meanwhile, a higher IPTG concentration had a negative
effect on cell growth and on soluble LigB (131-645aa) yieldand productivity, as described for other recombinant sys-tems [21,26,28-33]. Because of the negative effect of IPTG,the common strategy of using IPTG at an untestedpre-determined concentration for inducing recombinantE. coli can result in the process being performed undernon-optimal conditions, reducing cell and protein yields[28,30]. The data obtained using experimental design toolsindicate that in the shaking flasks it was suitable to use aninducer concentration that was ten times smaller than the“standard” concentration of 1 mM usually employed inmolecular biology [14,24], resulting in reduced damage oncell growth and increased soluble LigB (131-645aa) ex-pression, while also keeping IPTG at its lowest and mosteconomical level. Reducing the IPTG concentration is alsoattractive from an industrial point of view because it is anexpensive compound and is potentially toxic [19,20], andhigh IPTG concentrations can lead to a severe reductionin the growth rate of some recombinant E. coli (especiallywhen toxic proteins are produced) or to the expression ofsome proteases, reducing the yield of recombinant pro-teins [28-30]. However, the establishment of an optimalinducer concentration is essential for the expression ofheterologous proteins, since low concentrations may failto achieve full induction [29].Based on the scale of E. coli growth in shaking flasks,
the minimal level of IPTG tested (0.1 mM) was enough toinduce the expression of recombinant LigB (131-645aa),
as described for other proteins and verified in otherworks by our research group, and often have no de-trimental effect on recombinant protein expression[31-39]. However, for high cell density cultures in bio-reactors, the IPTG concentration should be adjustedto the higher cell levels obtained, although care shouldbe taken to prevent raising the concentration too highbecause of its toxic effect on the cells. Even if part ofthe expressed protein was insoluble with increase ofthe IPTG concentration, as was the case when expres-sion took place at a higher absorbance at the exponen-tial phase with 1 mM IPTG in shaking flasks, growthat high cell densities is essential to provide increasingheterologous protein production.As growth in shaking flasks is limited by the low oxy-
gen transfer rate, the obtainment of high cell densities ina bioreactor, enabling a higher yield of cell mass, is es-sential for establishing a process with a greater final yieldof soluble protein. Urban et al. [29] note that the limitedsolubility of the expressed product may be partially off-set by the accumulation of cells; taken together, thesetwo factors determine optimal expression conditions.Ultimately, the experimental condition that yields an op-timal response should consider both cell growth andgenetic factors (mRNA and metabolic synthesis and deg-radation of the protein) in order to enhance expressionof the heterologous protein. Islam et al. [26] and Urbanet al. [29] discuss that the highest soluble protein yieldsare obtained under conditions which promote both aslow growth rate during protein synthesis and a highfinal cell mass yield.It was found that the expression of soluble
LigB (131-645aa) in shaking flasks using the pAE systemwas proportional to cell growth in E. coli BL21 (DE3)Star™. As discussed in the literature, the level of intracel-lular accumulation of a recombinant protein depends onthe final cell growth and the specific productivity of theprotein, with the level of accumulation being relative tototal protein [22]. The proportionality of heterologousprotein production and cell mass is also shown by theexperimental findings of Sunitha et al. [40], since theamount of phytase from Bacillus sp. DS11 produced bylactose induction under the control of a strong T7 pro-moter was proportional to E. coli BL21 (DE3) mass.However, this is not always the case, as shown in theworks of Nikerel et al. [41,42] involving the expressionof TaqI restriction endonuclease in E. coli under thecontrol of a strong T7 RNA polymerase promoter.Also, the results of the expression of a soluble viralstructural protein from murine polyomavirus in E. coliin terms of normalized expression level in mg.L−1.Abs−1
(milligrams per liter of culture at Abs600nm of 1), werenot the same for the different conditions tested byChuan et al. [25].

Larentis et al. BMC Research Notes 2014, 7:671 Page 12 of 13http://www.biomedcentral.com/1756-0500/7/671
ConclusionsInduction at Absind 2.0 and 0.1 mM IPTG, 28°C, for 4 hin TB medium in shaking flasks produced 270 mg/L ofsoluble LigB (131-645aa). In microbioreactors, the in-duction was performed at the end of exponential phase(Absind 11-12), under which condition 970 mg/L of sol-uble LigB (131-645aa) was obtained, which is compatiblewith results obtained in works that evaluate the expressionof other recombinant proteins in E. coli [28,30,35-38]. Thebest strategy for obtaining higher protein yields was foundto be growth at high cell densities, since the process is de-termined by cell growth; therefore, the growth using highcell densities in microbioreactors with induction at theend exponential phase with lower IPTG concentrationsshowed better results for protein expression, achieving350% increase. Thanks to experimental design, it was pos-sible to assess the effects and interactions of the inductionvariables on the expression of soluble LigB (131-645aa),with a view to improving the productivity of the processand reducing the production costs of a rapid test for theefficient diagnosis of leptospirosis. These results highlightsthe importance of using experimental design tools to avoidtaking a simplistic approach that considers each variableas being independent.
AbbreviationsAbsind: Cell growth at induction (measured by absorbance at 600 nm);Abs600nm: Cell growth at the end of process (measured by absorbance at600 nm); ANOVA: Analysis of variance; BSA: Dovine serum albumin; CCD:Central composite design; CFU: Colony forming units; DPP®: Dual path platform;EDTA: Ethylenediaminetetraacetic acid; F-test: Fisher test; IMAC: Immobilizedmetal affinity chromatography; IPTG: Isopropyl β-D-1-thiogalactopyranoside;LB: Luria-bertani medium; Lig: Leptospira Immunoglobulin-like; MAT: Microscopicagglutination test; MSCRAMM: Microbial surface components recognizingadhesive matrix molecules; PBS: Phosphate buffered saline; R2: Correlationcoefficient; SDS-PAGE: Sodium dodecyl sulfate polyacrylamide gelelectrophoresis; T: Temperature; t: Time; TB: Terrific Broth medium; WFI:Water for injection; X: Cell concentration; YP/X: Yield of product per cell;Vvm: Volume of air per volume of medium per min; μ: Specific growth rates.
Competing interestsThe authors declare that they have no competing interests.
Authors’ contributionsIn this work, ALL was responsible for the experimental design strategy,discussion and statistical interpretation of expression data, densitometryanalysis, preparation and revision of the manuscript. JFMQN and GSE havecarried out the cloning and expression of the recombinant protein. DTV wasresponsible for microbioreactor experiments and FVRA for purificationprocedures. MGR was responsible for financial and technical support fromLaboratory of Pathology and Molecular Biology at CPqGM/Fiocruz. RG madeperiodic analysis of project and careful revision of the manuscript. MAM wasresponsible for financial and technical support from Laboratory ofRecombinant Technology (LATER) at Bio-Manguinhos/Fiocruz and periodicanalysis of project development. All authors read and approved the finalmanuscript.
AcknowledgmentsFiocruz/Bio-Manguinhos and Renorbio-CNPq (Rede Nordeste de Biotecnologia)supported this work, and Vice-Presidência de Ensino, Informação e Comunicaçãofrom Fiocruz supported the publication in BioMed Central. We thank theBio-Manguinhos technicians for their technical support to this work. Weacknowledge Dr. Maria Isabel Rodrigues (PROTIMIZA) for statistical assistance;the researchers of the lab of Dr. Filipe Soares Quirino da Silva from Setor de
Imunobiológicos/Departamento de Química/INCQS/Fiocruz for making availablethe Bio-Rad Densitometer and the program QuantiOne 4.4.1; Maurício Lopes(Lobov Científica) for the support with the Biopod f800 (Fogale nanotech) atLATER/Bio-Manguinhos/Fiocruz and Prof. Dr. Tito Lívio Moitinho Alves fromCOPPE/UFRJ for help with the dry cell mass analysis.
Author details1Fiocruz, Bio-Manguinhos, Vice Directory of Technological Development,Laboratory of Recombinant Technologies (LATER), Av. Brasil 4365, Manguinhos,Rio de Janeiro, RJ 21.040-360, Brazil. 2Fiocruz, Gonçalo Moniz Research Center(CPqGM), Laboratory of Pathology and Molecular Biology, Rua Waldemar Falcão121, Candeal, Salvador, BA 40.296-710, Brazil. 3Current address: Fiocruz, SergioArouca National School of Public Health (ENSP), CESTEH), Rua Leopoldo Bulhões1480, Manguinhos, Rio de Janeiro, RJ 21041-210, Brazil.
Received: 30 October 2013 Accepted: 27 August 2014Published: 25 September 2014
References1. McBride AJ, Athanazio DA, Reis MG, Ko AI: Leptospirosis. Curr Opin Infect Dis
2005, 18(5):376–386.2. Ko AI, Goarant C, Picardeau M: Leptospira: the dawn of the molecular
genetics era for an emerging zoonotic pathogen. Nat Rev Microbiol 2009,7(10):736–747.
3. Félix SR, Hartwig DD, Argondizzo AP, Silva EF, Seixas FK, Neto AC, MedeirosMA, Lilenbaum W, Dellagostin OA: Subunit approach to evaluation of theimmune protective potential of leptospiral antigens. Clin Vaccine Immunol2011, 18(12):2026–2030.
4. Lessa-Aquino C, Borges Rodrigues C, Pablo J, Sasaki R, Jasinskas A, Liang L,Wunder EA Jr, Ribeiro GS, Vigil A, Galler R, Molina D, Liang X, Reis MG, Ko AI,Medeiros MA, Felgner PL: Identification of seroreactive proteins ofLeptospira interrogans serovar copenhageni using a high-density proteinmicroarray approach. PLoS Negl Trop Dis 2013, 7(10):e2499.
5. Croda J, Ramos JGR, Matsunaga J, Queiroz A, Homma A, Riley LW,Haake DA, Reis MG, Ko AI: Leptospira immunoglobulin-like proteins asa serodiagnostic marker for acute leptospirosis. J Clin Microbiol 2007,45(5):1528–1534.
6. Nabity SA, Ribeiro GS, Aquino CL, Takahashi D, Damião AO, Gonçalves AH,Miranda-Filho DB, Greenwald R, Esfandiari J, Lyashchenko KP, Reis MG,Medeiros MA, Ko AI: Accuracy of a dual path platform (DPP) assay forthe rapid point-of-care diagnosis of human leptospirosis. PLoS Negl TropDis 2012, 6(11):e1878.
7. Medeiros MA, Reis MG, Silva EF, McBride AJA, Croda J, Ramos JGR,Dellagostin OA: Proteínas LigA e LigB (Leptospiral Ig-like (Lig) domains)para vacinação e diagnóstico. Patente 2005, PI0505529-6.
8. Medeiros MA, Reis MG, Silva EF, McBride AJA, Croda J, Ramos JGR,Dellagostin OA, McBride FWC, Ko AI: LigA and LigB Proteins (LeptospiralIg-Like (Lig) domains) for Vaccination and Diagnosis. Patent 2006,Publication number WO2007070996.
9. Choy HA, Kelley MM, Chen TL, Møller AK, Matsunaga J, Haake DA:Physiological osmotic induction of Leptospira interrogans adhesion:LigA and LigB bind extracellular matrix proteins and fibrinogen.Infect Immun 2007, 75(5):2441–2450.
10. Lin Y-P, Lee D-W, McDonough SP, Nicholson LK, Sharma Y, Chang Y-F:Repeated domains of Leptospira immunoglobulin-like proteins interactwith elastin and tropoelastin. J Biol Chem 2009, 284(29):19380–19391.
11. Lin YP, McDonough SP, Sharma Y, Chang YF: The terminalimmunoglobulin-like repeats of LigA and LigB of Leptospira enhancetheir binding to gelatin binding domain of fibronectin and host cells.PLoS One 2010, 5(6):e11301.
12. Castiblanco-Valencia MM, Fraga TR, Silva LB, Monaris D, Abreu PA, Strobel S,Józsi M, Isaac L, Barbosa AS: Leptospiral immunoglobulin-like proteinsinteract with human complement regulators factor H, FHL-1, FHR-1,and C4BP. J Infect Dis 2012, 205(6):995–1004.
13. Choy HA: Multiple activities of LigB potentiate virulence of Leptospirainterrogans: inhibition of alternative and classical pathways ofcomplement. PLoS One 2012, 7(7):e41566.
14. Donovan RS, Robinson CW, Glick BR: Optimizing inducer and cultureconditions for expression of foreign proteins under the control of the lacpromoter. J Ind Microbiol Biotechnol 1996, 16:145–154.

Larentis et al. BMC Research Notes 2014, 7:671 Page 13 of 13http://www.biomedcentral.com/1756-0500/7/671
15. Larentis AL, Sampaio HCC, Martins OB, Rodrigues MI, Alves TLM: Influenceof induction conditions on the expression of carbazole dioxygenasecomponents (CarAa, CarAc, and CarAd) from Pseudomonas stutzeri inrecombinant Escherichia coli using experimental design. J Ind MicrobiolBiotechnol 2011, 38:1045–1054.
16. Ramos CRR, Abreu PAE, Nascimento ALTO, Ho PL: A high-copy T7Escherichia coli expression vector for the production of recombinantproteins with a minimal N-terminal His-tagged fusion peptide. Braz J MedBiol Res 2004, 37(8):1103–1109.
17. Silva EF, Medeiros MA, McBride AJ, Matsunaga J, Esteves GS, Ramos JG,Santos CS, Croda J, Homma A, Dellagostin OA, Haake DA, Reis MG, Ko AI:The terminal portion of leptospiral immunoglobulin-like protein LigAconfers protective immunity against lethal infection in the hamstermodel of leptospirosis. Vaccine 2007, 25(33):6277–6286.
18. Frachon E, Bondet V, Munier-Lehmann H, Bellalou J: Multiple microfermen-tor battery: a versatile tool for use with automated parallel cultures ofmicroorganisms producing recombinant proteins and for optimization ofcultivation protocols. Appl Environ Microbiol 2006, 72(8):5225–5231.
19. Volontè F, Marinelli F, Gastaldo L, Sacchi S, Pilone MS, Pollegioni L, Molla G:Optimization of glutaryl-7-aminocephalosporanic acid acylase expressionin E. coli. Protein Expr Purif 2008, 61(2):131–137.
20. Pan H, Xie Z, Bao W, Zhang J: Optimization of culture conditions toenhance cis-epoxysuccinate hydrolase production in Escherichia coli byresponse surface methodology. Biochem Eng J 2008, 42(2):133–138.
21. Manderson D, Dempster R, Chisti Y: A recombinant vaccine againsthydatidosis: production of the antigen in Escherichia coli. J Ind MicrobiolBiotechnol 2006, 33(3):173–182.
22. Lee KM, Rhee CH, Kang CK, Kim JH: Sequential and simultaneousstatistical optimization by dynamic design of experiment for peptideoverexpression in recombinant Escherichia coli. Appl Biochem Biotechnol2006, 135:59–80.
23. Papaneophytou CP, Kontopidis G: Statistical approaches to maximizerecombinant protein expression in Escherichia coli: A general review.Protein Expr Purif 2014, 94:22–32.
24. Sambrook J, Russell DW: Molecular Cloning: A Laboratory Manual. Nova York,USA: Cold Spring Harbor Laboratory Press; 2001.
25. Chuan YP, Lua LHL, Middelberg APJ: High-level expression of soluble viralstructural protein in Escherichia coli. J Biotechnol 2008, 134:64–71.
26. Islam RS, Tisi D, Levy MS, Lye GJ: Framework for the rapid optimization ofsoluble protein expression in Escherichia coli combining microscaleexperiments and statistical experimental design. Biotechnol Prog 2007,23:785–793.
27. Shin CS, Hong MS, Bae CS, Lee J: Enhanced production of humanmini-proinsulin in fed-batch cultures at high cell density of Escherichiacoli BL21(DE3)[pET-3aT2M2]. Biotechnol Prog 1997, 13:249–257.
28. De León A, Islãs HJ, Cuevas MG, Rosa APB: Analysis of the expression ofthe Trichoderma harzianum ech42 gene in two isogenic clones ofEscherichia coli by surface response methodology. Process Biochem 2004,39:2173–2178.
29. Urban A, Ansmant I, Motorin Y: Optimisation of expression and purificationof the recombinant Yol066 (Rib2) protein from Saccharomyces cerevisiae.J Chromatogr B Biomed Sci Appl 2003, 786(1–2):187–195.
30. Choi JH, Keum KC, Lee SY: Production of recombinant proteins by highcell density culture of Escherichia coli. Chem Eng Sci 2006, 61:876–885.
31. Wang YH, Jing CF, Yang B, Mainda G, Dong ML, Xu AL: Production of anew sea anemone neurotoxin by recombinant Escherichia coli:Optimization of culture conditions using response surface methodology.Process Biochem 2005, 40(8):2721–2728.
32. Swalley SE, Fulghum JR, Chambers SP: Screening factors effecting aresponse in soluble protein expression: Formalized approach usingdesign of experiments. Anal Biochem 2006, 351:122–127.
33. Beigi L, Karbalaei-Heidari HR, Kharrati-Kopaei M: Optimization of anextracellular zinc-metalloprotease (SVP2) expression in Escherichia coliBL21 (DE3) using response surface methodology. Protein Expr Purif 2012,84(1):161–166.
34. Lo PK, Hassan O, Ahmad A, Muhammad Mahadi N, Illias RM: Excretoryover-expression of Bacillus sp. G1 cyclodextrin glucanotransferase(CGTase) in Escherichia coli: Optimization of the cultivation conditionsby response surface methodology. Enzyme Microb Technol 2007,40:1256–1263.
35. Larentis AL, Argondizzo APC, Esteves GS, Jessouron E, Galler R, MedeirosMA: Cloning and optimization of induction conditions for mature PsaA(pneumococcal surface adhesin A) expression in Escherichia coli andrecombinant protein stability during long-term storage. Protein Expr Purif2011, 78:38–47.
36. Larentis AL, Nicolau JFMQ, Argondizzo APC, Galler R, Rodrigues MI,Medeiros MA: Optimization of medium formulation and seed conditions forexpression of mature PsaA (pneumococcal surface adhesin A) in Escherichiacoli using a sequential experimental design strategy and response surfacemethodology. J Ind Microbiol Biotechnol 2012, 39:897–908.
37. Einsfeldt K, Severo Júnior JB, Argondizzo APC, Medeiros MA, Alves TLM,Almeida RV, Larentis AL: Cloning and expression of protease ClpP fromStreptococcus pneumoniae in Escherichia coli: study of the influence ofkanamycin and IPTG concentration on cell growth, recombinant proteinproduction and plasmid stability. Vaccine 2011, 29:7136–7143.
38. Chew FN, Tan WS, Boo HC, Tey BT: Statistical optimization of greenfluorescent protein production from Escherichia coli BL21(DE3). PrepBiochem Biotechnol 2012, 42:535–550.
39. Marini G, Luchese MD, Argondizzo AP, De Góes AC, Galler R, Alves TL,Medeiros MA, Larentis AL: Experimental design approach in recombinantprotein expression: determining medium composition and inductionconditions for expression of pneumolysin from Streptococcus pneumoniaein Escherichia coli and preliminary purification process. BMC Biotechnol2014, 14:1.
40. Sunitha K, Kim YO, Lee JK, Oh TK: Statistical optimization of seed andinduction conditions to enhance phytase production by recombinantEscherichia coli. Biochem Eng J 2000, 5:51–56.
41. Nikerel İE, Toksoy E, Kirdar B, Yildirim R: Optimizing medium composition forTaqI endonuclease production by recombinant Escherichia coli cells usingresponse surface methodology. Process Biochem 2005, 40:1633–1639.
42. Nikerel İE, Öner E, Kirdar B, Yildirim R: Optimization of mediumcomposition for biomass production of recombinant Escherichia coli cellsusing response surface methodology. Biochem Eng J 2006, 32:1–6.
doi:10.1186/1756-0500-7-671Cite this article as: Larentis et al.: Evaluation of pre-induction temperature,cell growth at induction and IPTG concentration on the expression of aleptospiral protein in E. coli using shaking flasks and microbioreactor.BMC Research Notes 2014 7:671.
Submit your next manuscript to BioMed Centraland take full advantage of:
• Convenient online submission
• Thorough peer review
• No space constraints or color figure charges
• Immediate publication on acceptance
• Inclusion in PubMed, CAS, Scopus and Google Scholar
• Research which is freely available for redistribution
Submit your manuscript at www.biomedcentral.com/submit