research article management index systems and energy
TRANSCRIPT

Research ArticleManagement Index Systems and Energy Efficiency DiagnosisModel for Power Plant Cases in China
Jing-Min Wang XiaoJie Ge LiLi Zhang and Hang Zhang
Department of Economic Management North China Electric Power University Baoding 071003 China
Correspondence should be addressed to XiaoJie Ge gexiaojie0809163com
Received 6 June 2016 Accepted 10 August 2016
Academic Editor Sebastien Poncet
Copyright copy 2016 Jing-Min Wang et alThis is an open access article distributed under the Creative Commons Attribution Licensewhich permits unrestricted use distribution and reproduction in any medium provided the original work is properly cited
In recent years the energy efficiency of thermal power plant largely contributes to that of the industry A thorough understanding ofinfluencing factors as well as the establishment of scientific and comprehensive diagnosis model plays a key role in the operationalefficiency and competitiveness for the thermal power plant Referring to domestic and abroad researches towards energy efficiencymanagement based on Cloud model and data envelopment analysis (DEA) model a qualitative and quantitative index systemand a comprehensive diagnostic model (CDM) are construed To testify rationality and usability of CDM case studies of large-scaled Chinese thermal power plants have been conducted In this case CDM excavates such qualitative factors as technologymanagement and so forthThe results shows that compared with conventional model which only considered production runningparameters the CDM bears better adaption to reality It can provide entities with efficient instruments for energy efficiencydiagnosis
1 Introduction
In China the amount of coal-fired thermal power takesup about 80 of the total generating production and thecoal consumption accounts for 50 of the total productionThe Chinese average coal consumption is about 370 gkWsdothsurpassing the counterpart of developed countries like Japanand Germany by 55 gkWsdoth Therefore it is imperative forChina to manage the factors affecting energy efficiency andestablish a scientific energy efficiency diagnosis and analysismechanism It is also significant for Chinese power plants toimprove the energy efficiency
The domestic scholars and those abroad have done deepresearches in the factors affecting power plantsrsquo energy effi-ciency management From the perspective of the operationmode of thermal power unit Wang [1] analyzed the factorsinfluencing energy efficiency Dan [2] suggested that theinfluential factors of comprehensive benefit indexes includeload rate coal consumption rate unit capacity of waterconsumption and electricity consumption to grid Graus andWorrell [3] conducted statistical analysis of electricity salesamount (from 2001 to 2006) suggesting that energy efficiencyis affected by the power consumptionThe existing researches
focus on operational parameters during production processHowever in practice human factors [4] like transformationtechniques [5] and external environment alike [6] couldaffect the long-term development of power plants Mean-while there are few studies that have been conducted onthe impact of management level [7] energy saving recon-struction and so forth on energy efficiency Any specificinfluencing factor indicator system has not been given yet [8]
In the field of the energy efficiency diagnosis modelHitachi Research Laboratory initially established the flameimage recognition system which improved the efficiency ofboiler system via the analysis of the combustion condition[9] Jun [10] proposed strategies to realize optimal operationby lowering oxygen content in boiler boilerrsquos flue gas temper-ature and air leakage rate of the air preheater
Aimed at the energy saving diagnosis of generator setthe American Electric Power Research Institute set up acomprehensive economic diagnosis research plan and theexpert online property diagnosis system of industrial equip-ment installation [11] In the early 1990s the artificial intelli-gence and neural network diagnosis system were graduallyintroduced into power plant The Intelligent diagnosis hasbecome a tendency worldwide Intelligence systems such as
Hindawi Publishing CorporationMathematical Problems in EngineeringVolume 2016 Article ID 8159871 13 pageshttpdxdoiorg10115520168159871
2 Mathematical Problems in Engineering
Table 1 Effect of variation of the boiler thermal on efficiency of coal consumption
Sequence number Influence factor VariationVariation of
energy efficiency()
Variation of coalconsumption(gkWsdoth)
1 Oxygen content at furnace outlet Variation 1 04 122 Carbon content in fly ash Increase 1
minus015 053 Exhaust temperature Increase 1 ∘C
minus004 0124 Air intake temperature Increase 1 ∘C 004 012Data resource XirsquoanThermal Power Research Institute Co Ltd
American online performance monitoring system ItalianPERFEXS expert system and American SMOP expert sys-tem have been successfully developed and put into practice
Nevertheless most of the previous energy efficiency diag-nosis only focuses on thermal economic performance andoperation parameter analysis during the power productionand lacks the study of influential factors (such asmanagementlevel and energy saving transformation degree) on energyefficiency There is still space for the research of the energyefficiency indexes diagnosis based on the combination ofqualitative and quantitative indexes
In order to objectively reflect the energy efficiency influ-ential mechanism of thermal plants this paper presentsenergy management index system which includes unit oper-ation energy saving technology and management level aswell as the comprehensive energy efficiency diagnosis modelbased on DEA model In practice these results of this paperhelp power plants to manage energy efficiency
2 Construction of Index System forComprehensive Energy EfficiencyInfluencing Factors in Thermal Power Plant
Several compound indexes interactively exert impact onenergy efficiency not by separated single index Compoundindexes not only embody quantitative technical and eco-nomic parameters but also embody qualitative indicatorssuch as power-saving and management measures Conse-quently in the duration of index system establishmentscientific reflection on power plant economic operation isan essential requirement Apart from this the specific indexsystem should lay a substantial foundation for the thermalpower plant to accelerate technological transformation tapinto the internal potential and continuously improve theoperation and management level
21 Quantitative Index Screening According to the energystructure of the thermal power plants the main consump-tion is coal In order to facilitate quantification productiondepartments of the power at home and abroad mainly adoptldquothe power supply coal consumption raterdquo or ldquoheat consump-tion raterdquo as the primary indicator in the process of judgingthe efficiency of power plants both are important factors inthe evaluation of energy saving for power plant In this lightthe following quantitative indicators are selectedmainly fromthe perspective of coal consumption of electricity and coal
consumption for power supply to show their respective effectson the energy efficiency of power plants
211 Boiler Thermal Efficiency Utility boiler is the mainequipment in the combustion system Boiler thermal effi-ciency refers to the ratio of the boiler heat output and heatinput It is calculated by measuring heat loss through theindirect analysis of boiler effective use of heat Its variationaffects coal consumption for power generation and coal con-sumption for power supply Xirsquoan Thermal Power ResearchInstitute Co Ltd examined a unit with capacity of 300MWThe experiment results show the influence of variation ofthe boiler thermal on the efficiency of coal consumption forpower generation as shown in Table 1
In addition the boiler efficiency has an effect on coalconsumption for power supply A study from a power plantin the northeast of China with capacity of 300MW unitin 2005ndash2014 operating conditions [12] indicates a negativecorrelation of the thermal efficiency of the boiler and the coalconsumption of power supply Boiler combustion conditionand the well-conditioned heating paragraphs surface of heatexchanger alongwith the improvement of the overall thermalefficiency can ensure reduction of coal consumption forpower generation and coal consumption of electricity supplyBased on this the thermal efficiency of the boiler is thepriority of the analysis of energy efficiency
The baseline of boiler efficiency calculation is based onthe amount of fuel consumption per kilogram Take the fuelreceived from the net calorific value as the input heat Boilerthermal efficiency can be generalized as follows
120578g =(100 minus 119902
2minus 119902
3minus 119902
4minus 119902
5minus 119902
6)
100
(1)
In the equation 120578g is boiler thermal efficiency 1199022is
waste heat loss kJkg 1199023is unburned gas loss kJkg 119902
4is
solid unburned loss kJkg 1199025is heat loss kJkg and 119902
6is ash
physical heat loss kJkg
212 Turbine Thermal Efficiency Turbine is one of the mostinfluential engines in the electrical system the operation ofwhich in good condition or not affects the heat lossThemainfactors influencing the efficiency of steam turbine consistof noncompliance pressure of condenser steam parametersdeviation and feed water heating process of heat loss whichexert a direct impact on the overall efficiency of powergenerationThe thermal efficiency of steam turbine generator
Mathematical Problems in Engineering 3
units is the percentage of total heat consumption per kilowatthour of steam turbine generator unit The formulas are asfollows
120578
119902=
3600
119902
lowast 100
119902 =
119876
119904119903minus 119876
119892119903
119875
119902119895
(2)
In the equation 120578119902is turbine thermal efficiency 119902 is
heat rate which is the ratio of turbine power consumptionand electrical power outlet side kJ(kWsdoth) 119876
119904119903is unit heat
consumption which is constituted by main steam finalwater supply steam turbine reheat steam cold reheat steamwater for the attemperation of reheater and water for theattemperation of super heater kJh 119876
119892119903is unit for the heat
kJh and 119875119902119895is electrical power outlet side kW
213 Pipeline Efficiency Pipeline efficiency is the percentageof the heat from the boiler to that from boiler combustionThe efficiency loss mostly embraces pure pipeline lossessewage unit loss steam and water loss and so forth Under-utilized energy of the steam turbine results in a direct impacton the power consumption
The equation is
120578
119892119889=
sum119876
119904119903
sum119876
119897
times 100 (3)
In the equation 120578119892119889
is pipeline efficiency sum119876119904119903is heat
input of turbine in statistical period kJh and sum119876119897is heat
output of boiler in statistical period GJ
214 Power Consumption Rate Factory electricity is con-sumed by the auxiliary equipment of power plant directlydetermining how much power supply and power consump-tion Plant power consumption rate refers to the propor-tion of power self-consumption accounting for generatingcapacity Its variation is pertinent to the design of auxiliarysystem equipment and every 1 change will produce about33 gkWsdoth of power supply coal consumption According to arough estimate assuming that price is $006kWsdoth operating5000 h if annual plant electricity rate decreased by 01equivalent to adding extra 1725 billion (kWsdoth) another $104million output value would be created Therefore as one ofthe important technical and economic indicators to measurethe performance of generating units the power efficiency ofthe plant plays a decisive role in the analysis of the influencefactors of energy efficiency Hence
119890
119901=
119864
119901
119864
119864
119901= 119864
119888minus 119864
119889
(4)
In the equation 119890119901is power consumption rate 119864
119901
is plant for electricity generation in the calculation periodkWsdoth 119864
119888is total electricity consumption in the calculation
period kWsdoth and 119864119889is nonproduction plant consumption
which should be deducted in the calculation period kWsdoth
215 Load Rate Load rate is the ratio of the average loadto the maximum load Load insufficiency will result in theheat loss of the pipe network corresponding to the efficiencydecrease of the boiler and steam turbine The load rate thuscan be used as a key indicator to quantify the variation ofthe load in the specified time and the effective utilizationassessment of the electrical equipment
The equation is
119901 =
119901
119901119895
119901maxtimes 100 (5)
Unitrsquos average load is the ratio of the generating capacityof turbo generator and run time during statistics which is
119901
119901119895=
119882
119891
ℎ
(6)
In the equation 119901119901119895is unitrsquos average load in the statistical
period kW 119901max is unitrsquos maximum load in the statisticalperiod kW 119882
119891is unitrsquos power generation in the statistical
period kWsdoth and ℎ is unitrsquos operating time hThrough the above analysis taking the main power
plant operation parameters of thermal power plant in theduration of production into account quantitative indexesare eventually given as follows thermal efficiency of theboiler the thermal efficiency of steam turbine generator unitpipeline efficiency plant electricity rate and load rate
22 Qualitative Indicators Screening From the analysisabove it can be seen that the production and operationparameters of thermal power enterprises in the process ofthermal power generation can better reflect the factors thatdirectly affect the efficiency of the power plant similar to thehardware of the power generation systemHowever hardwarelays the foundation of system operation while the softwaresustains maintenance and improvement of system operationTherefore the software comprising enterprise internal energysaving technology and management also affects energy effi-ciency of the power plant major In light of this according tocombination with the major production process and systemin the duration of power enterprises production this paperqualitatively screened and analyzed such quantitative indexesas management characteristics
For the rationality of the qualitative indicators the 0-1 cumulative scoring method to screen the qualitative indi-cators is applied In accordance with specific evaluationindicators pairwise indexes comparison method is utilizedto conform relative importance of the objects ldquo1rdquo indicatesrelatively more important otherwise ldquo0rdquo assuming ldquolowastrdquo ascomparison with their own The next step is to find outthe cumulative score of each program calculate the weightcoefficient of each index and finally order the importance ofthe indexes
221 Determination of the Qualitative Indicators to BeScreened Referring to ldquothe thermal power industry cleanerproduction evaluation index systemrdquo issued by the NationalDevelopment and Reform Commission (Implementation)and other documents along with discussion with 10 experts
4 Mathematical Problems in Engineering
Table 2 The results of the evaluation of an expert on the 0-1 score matrix table
Index 119866
1
119866
2
119866
3
119866
4
119866
5
119866
6
119866
7
119866
8
119866
9
Accumulative score 119902119894119896
119866
1
lowast 0 1 1 1 1 0 1 1 6119866
2
1 lowast 1 0 1 1 0 1 0 5119866
3
0 0 lowast 0 1 0 0 1 0 2119866
4
0 1 1 lowast 1 1 0 1 1 6119866
5
0 0 0 0 lowast 0 0 1 0 1119866
6
0 0 1 0 1 lowast 0 1 1 4119866
7
1 1 1 1 1 1 lowast 1 1 8119866
8
0 0 0 0 0 0 0 lowast 0 0119866
9
0 1 1 0 1 0 0 1 lowast 4Total 119876 = 36
Table 3 Comprehensive evaluation matrix table
Index 119866
1
119866
2
119866
3
119866
4
119866
5
119866
6
119866
7
119866
8
119866
9
Total cumulativescore 119902
119894
Importancecoefficient 120583
119894
Importanceranking
119866
1
lowast 72 72360 1119866
2
lowast 64 64360 2119866
3
lowast 20 20360 7119866
4
lowast 48 48360 4119866
5
lowast 13 13360 9119866
6
lowast 37 37360 5119866
7
lowast 58 58360 3119866
8
lowast 14 14360 8119866
9
lowast 34 34360 6Total 360 100
in three large-scale power generation enterprises this paperselected the following nine qualitative indexes to be screened
119866
1 advanced degree of operating equipment
119866
2 operation optimization of circulating water sys-
tem
119866
3 the degree of preventive maintenance process
119866
4 water reuse
119866
5 pollutant emissions
119866
6 coal management system
119866
7 unit operation management system
119866
8 the establishment of clean production manage-
ment system
119866
9 energy conservation policy implementation
222 Experts Scoring Qualitative Indicators 10 expertsaccording to three distinct power enterprise productionoperation and management situations rate the nine quali-tative indicators on a scale of 1 to 10 by means of back-to-back approach Accumulative score (119902
119894119896) of each qualitative
indicator represents the relative importance of each experton the recognition of the relative importance of different
programs119876 stands for total score of score sheets calculationof 119876 can be described as follows
119876 =
119899 (119899 minus 1)
2
=
119899
sum
119894=1
119902
119894119896 119896 = 1 2 119901 (7)
Table 2 shows the score of119870 expert for the 119894th index119873 isthe number of indicators
223 Summarize the 0-1 Score Table andThenRank the Impor-tance of Each Index 0-1matrix table will be gathered togetherinto the 0-1 comprehensive evaluation matrix table (Table 3)then calculate the total cumulative score Next order theimportance of the factor Among them the total cumulativescore and the importance coefficient were calculated by thefollowing formula
Total cumulative score 119902119894=
119901
sum
119896=1
119902
119894119896
Importance coefficient 120583119894=
119902
119894
sum
119894
119902
119894
=
sum
119896
119902
119894119896
sum
119894
sum
119896
119902
119894119896
(8)
Based on the above calculation formula the importanceorder of 119866
1ndash1198669is finally obtained
According to 0-1 cumulative score the final selectedqualitative indicators are as follows operation equipment
Mathematical Problems in Engineering 5
Table 4 Influence factors index system of energy efficiency man-agement in thermal power plant
First-grade indexes Second-grade indexes
Operatingparameters of powerplant
Boiler thermal efficiencyThermal efficiency of steam turbinegenerator setPipeline efficiencyPlant power consumption rateLoad rate
Energy savingreconstructiontechnology
Advanced degree of operating equipmentOperation optimization of circulatingwater systemReclaimed water reuse
Comprehensivemanagement level
Admission coal management systemUnit operation management levelEnergy saving policy implementation
advanced degree circulating water system operation opti-mization degree reclaimed water degree admission coalmanagement system unit operation and management sys-tem and energy saving policy implementation efforts
The principals of index extraction lie in the combinationof comprehensiveness and emphasis coconstraints betweeninfluence and controllability integration of qualitative andquantitative technique and coalition of simplicity with com-plexity Referring to major processes and management char-acteristics factors affecting energy efficiency of the powerplant are analyzed from the perspective of plant operationparameters energy saving technology and comprehensivemanagement level The model could compensate the defectof conventional index systemwhich only focuses on the tech-nical and economic indexes ignoring qualitative indicatorsand finally determines the final diagnosis of energy efficiencyinfluence factors index system just as displayed in Table 4
3 Comprehensive Energy Efficiency DiagnosisModel Based on One-Dimensional CloudModel and DEA Model
31 Based on Qualitative Indicators In the 1990s Deyi et alconstructed Cloud model [13ndash16] to address the defect ofthe probability theory and fuzzy mathematics when dealingwith uncertain indicators proposing an uncertain conversionmodel with qualitative concept and quantitative descriptionThe process of computing is given by the cloudization ofrandom variables via its digital feature so as to realize theconversion from fuzzy concept to specific data the results ofwhich are displayed in the form of graphic featuring moreintuitive and specific than conventional technique
Suppose that 119880 is a quantitative domain expressed byprecise numerical 119883 sube 119880 119879 stands for a fuzzy set part offuzzy space119880 For any element 119909 (119909 isin 119883) there always existsa random number with 119862
119879(119909) isin [0 1] a stable tendency
namely subordinate degree 119909 to 119879 Concept 119879 mappingfrom domain 119880 to range of distribution in data space [0 1]
5 10 15 20 25 30 3500
01
02
03
04
05
06
07
08
09
10
Ex
He
3En
Figure 1 Digital characteristics of the Cloud
is named as membership Cloud simplified as the Cloudnamely
119862
119879(119909) 119880 997888rarr [0 1]
forall119909 isin 119883 (119883 sube 119880) 119909 997888rarr 119862
119879(119909)
(9)
The Cloud model highlights three numerical character-istics expectation Ex entropy En and hyper entropy HeFigure 1 depicts figure characteristics for the CloudThe hori-zontal axis represents the range of uncertainty quantificationThe vertical axis represents the degree of membership
Expectations are the center of the field the point bestable to represent the qualitative concept always part of thisqualitative concept Reflected in the Cloud is the highestpoint whose degree of membership is 1
Entropy En represents a range of qualitative concepts thatcan be measured The greater En is the broader spectrum ofmeasurement will be [17] Entropy reflects the fuzziness ofthe fuzzy concept that is the uncertainty and fuzziness of thequalitative concept
Hyper entropy is the entropy of itself used to repre-sent the uncertainty reflecting the randomness the sam-ples express also known as Cloud droplet dispersiondegree Super entropy associated fuzziness with randomnessreflected in the Cloud as ldquothicknessrdquo that is the greater theHe gets the thicker the Cloud will be
Cloud model as a type of transformation model realizesthe convention from qualitative concept to numerical valueIts uniqueness lies in portability three digital values fullyintegrate the fuzziness and randomness of qualitative repre-sentation [18] of which the Cloud model presents linguisticvalue generalizing the feature of linguistic value with thatof the Cloud model In this way fuzziness and randomnessare correlated In the end conversion of the uncertainty ofqualitative to quantitative data is available
32 DEA Model Based on Energy Efficiency Diagnosis DEA[19] is put forward by Charnes and Cooper on the basis ofefficiency evaluation method It is an overlapping researchacross operations research management science and quan-titative economics Mathematical programming methods
6 Mathematical Problems in Engineering
are adopted to evaluate decision making units (DMUs) bycomprehensive analysis of input and output ratio so as todetermine whether the DMU is efficient or not navigatingthe landscape for the improvement The result navigatesthe landscape for the improvement DEA is characterizedby inclusiveness of the input and output indexes whichcan ensure the integrity of the original information whilegreatly simplifying themeasurement process possessing highsensitivity and reliability119862
2
119877 is perceived as an essential model of DEA method[20ndash23] an overall effectiveness evaluation model to assesstechnical efficiency and scale efficiency In general 1198622119877 canbe categorized into two groups models based on inputs andmodels based on outputsThe aimof the study is to investigateenergy efficiency improvement of thermal power plant soDEA minus 1198622119877 is more appropriate
Firstly there are 119899 decision making units DMU119895(1 le 119895 le
119899) The amount of input indicators is 119894 (1 le 119894 le 119898) and thatof output indicators is 119903 (1 le 119903 le 119904) respectively The inputand output vectors of DMU
119895are
119883
119895= (119909
1119895 119909
2119895 119909
119898119895)
119879
gt 0 119895 = 1 119899
119884
119895= (119910
1119895 119910
2119895 119910
119898119895)
119879
gt 0 119895 = 1 119899
(10)
At the same time the weight of each input and outputindex is given as follows
119881 = (V1 V2 V
119898)
119879
gt 0
119880 = (119906
1 119906
2 119906
119898)
119879
gt 0
(11)
The weight vectors are regarded as variables and theirvalues are determined in the analysis process First of alldefine efficiency evaluation index
ℎ
119895=
119880
119879
119884
119895
119881
119879
119883
119895
=
sum
119904
119903=1
119906
119903119910
119903119895
sum
119898
119894=1
V119894119909
119894119895
(119895 = 1 119899) (12)
For the efficiency evaluation index of the 119895th decisionmaking unit DMU
119895 set the weight coefficient as V and 119906 to
make ℎ119895le 1 Assuming the input and output as (119909
119895 119910
119895) then
the efficiency evaluation index is ℎ119895(ℎ
119895le 1) Thus the larger
ℎ
119895 the smaller inputDMU
119895plunged into To identify whether
DMU119895is optimal among these DMUs maximum value can
be confirmed with the variation of V and 119906Taking ℎ
119895as objective build the following 1198622119877model
max =
sum
119904
119903=1
119906
119903119910
119903119895
sum
119898
119894=1
V119894119909
119894119895
= 119881119901
stsum
119904
119903=1
119906
119903119910
119903119895
sum
119898
119894=1
V119894119909
119894119895
le 1 119895 = 1 119899
119906
119903ge 0 119903 = 1 119904
V119894ge 0 119894 = 1 119898
(13)
The optimal value proves to be the optimal efficiencyevaluation indexWith Charnes-Cooper transformation (13)transforms from fractional programming to a linear pro-gramming form
max 120583
119879
119884
0= 119881
119901
st 120596119883
119895minus 120583
119879
119884
119895ge 0 119895 = 1 119899
120596119883
0= 1
120596 ge 0
120583 ge 0
(14)
According to the duality theory of linear programmingthe slack variables are introduced into the dual programmingmodel 119904+ ge 0 119904minus ge 0 119904+ = (119904
1
+
119904
2
+
119904
119904
+
) 119904
minus
=
(119904
1
minus
119904
2
minus
119904
119898
minus
) turn into the following linear program-ming model
min 120579 = 119881
119863
st119899
sum
119895=1
120582
119895119883
119895+ 119904
minus
= 119884
0
120582
119895ge 0 119895 = 1 119899
119904
+
ge 0
119904
minus
ge 0
(15)
In order to simplify the solving process a little change ofthe model can be made to simplify the testing process Dueto the introduction of non-Archimedes infinitesimal variable[24] the following models can be obtained
min [120579 minus 120576 (
119879
119904
minus
+ 119890
119879
119904
+
)] = 119881
119863120576
st119899
sum
119895=1
120582
119895119883
119895+ 119904
minus
= 120579119883
0
119899
sum
119895=1
120582
119895119884
119895minus 119904
+
= 119884
0
120582
119895ge 0 119895 = 1 119899
119904
+
ge 0
119904
minus
ge 0
(16)
In the equation 120576 is one figure in the extension of thereal number field less than any positive real number but alsogreater than zero In calculation it is generally taken as 10minus10119890 = (1 1)119879 isin 119877
119898 119890 = (1 1)119879 isin 119877
119904
In the linear programming model the optimal value 119881119863
equals 1 For each optimal solution 120582lowast 119904lowastminus 119904lowast+ 120579lowast if thereexist 120579lowast = 0 119904lowastminus = 0 119904lowast+ = 0 then DMU
119863is effective under
DEA if only they meet the condition that the optimal valueequals 1 then DMU
119863is weakly effective under DEA
Mathematical Problems in Engineering 7
120579
119895stands for the technical efficiency of the jth decision
making unit 120579lowast = 1 means for given output 1199100 the input
119909
0cannot be proportionally reduced that is 119909
0down to the
minimum value But if 120579lowast lt 1 means that actual investmentcan be diminished by the ratio of 120579lowast then 119904lowastminus = 0 is said tobe excessive input for the same output and 119904lowast+ = 0 expressesthe opposite Corresponding adjustments should be made toachieve DEA effective value
With the application of DEA model based on 1198622119877 toassess the efficiency evaluation of thermal power enterprisesif optimal value is 1 its suggested scale and technology areDEA-efficient at the same time if the optimal value is lessthan 1 thenDEA is weekly efficient According to the analysisof model (16) determine whether technology and scale arevalid or not if invalid it indicates that the energy efficiencymanagement of enterprises at present is still inadequate andthere remains space to improve Furthermore with referenceto DEA effective value adjust the input indicators to correctenergy efficiency indicators for the sake of effectiveness andpracticability
33 The Effectiveness of the Comprehensive Energy EfficiencyDiagnosis Model Based on Cloud Model and DEA ModelData envelopment analysis can achieve more efficiencyindex evaluation purposes and it also can conduct moreaccurate influence power diagnostic on indicator Howeverthis method needs quantitative indicators Cloud modelquantifies the qualitative indicators which can improve thereliability of the weights and overcome drawbacks of contraryconventional qualitative and quantitative transformation inhuman cognitive processes Basing on Cloud model andDEA model this paper constructs a comprehensive energydiagnostic model By implementing the integration and unityof fuzziness and randomness it can ensure the scientificalnessand comprehensiveness during the energy efficiency diagno-sis process Specific steps are as follows
Step 1 (index system) Select the qualitative and quantitativeindicatorswhich can impact on the energy efficiencymanage-ment Then establish a factors index system which combinesqualitative and quantitative indicators
Step 2 (cloud the qualitative variables) The value of qual-itative variable 119880 is usually assigned by expertsrsquo commentIn the process of reverse variable Cloud conducting Clouddescription on qualitative concept by process 119901 includingobtaining the Cloud digital feature (ExEnHe) and theCloud shape this model can get clouding of the qualitativevariables in realization 119899 Cloud models including qualitativevariables assigned by 119873 experts can be expressed by acomprehensive Cloud and its digital feature can be derivedby the following formula
Ex =Ex1lowast En1+ Ex2lowast En2+ sdot sdot sdot + Ex
119899lowast Ex119899
En1+ En2+ sdot sdot sdot + En
119899
En = En1+ En2+ sdot sdot sdot + En
119899
He =He1lowastHe1+He2lowastHe2+ sdot sdot sdot +He
119899lowastHe119899
En1+ En2+ sdot sdot sdot + En
119899
(17)
Step 3 (conversion of qualitative input to quantitative output)(1) Assume that there are 119899 qualitative indicators whichconstitute119883 = (119909
1 119909
2 119909
119899) Based on the unified standard
119888
119894 conduct membership 120572
119894(0 lt 120572 lt 1) of each index which
is established by experts Then the membership of relativestandard value of the 119894th nonquantitative indicators is 120572
119894 and
the memberships of relative standard value of all indicatorsare (120572
1 120572
2 120572
119899) Take these Cloud droplets as input and
use estimation algorithm to restore the final Cloud digitalfeature (ExEnHe) Then matrix 119860 is obtained
119860 =
[
[
[
[
[
[
[
[
Ex1205721
En1205721
He1205721
Ex1205722
En1205722
He1205722
Ex120572119899
En120572119899
He120572119899
]
]
]
]
]
]
]
]
119879
(18)
Among them
Ex = 119883
En = radic12
1
119899
119899
sum
119894=1
1003816
1003816
1003816
1003816
119909
119894minus Ex1003816100381610038161003816
He = radic1003816100381610038161003816
119878
2
minus En21003816100381610038161003816
(19)
After several cycles this paper gets the final desired valuematrix 119860 and it is the quantitative conversion result ofqualitative inputs
(2) Assign the weight according to expertsrsquo assessmentIn order to reduce the subjectivity of expertsrsquo weighting thispaper estimated again the weight of index to determine theCloud digital feature (Ex1015840En1015840He1015840) of weights and obtainweight matrix 119877
119877 =
[
[
[
[
[
[
[
Ex1
En1
He1
Ex2
En2
He2
Ex119899
En119899
He119899
]
]
]
]
]
]
]
(20)
(3) Calculate nonquantifiable indicators by using calcula-tion method of Fuzzy Composite Operators in multiplyingand bounded operator [25] and combining with Cloudalgorithms Then this paper obtains the final Cloud digitalfeature analysis results which can fully reflect the qualitativefactors trait and the results are regarded as matrix 119861
8 Mathematical Problems in Engineering
Table 5 Cloud computing rule
Ex En He+ Ex
1
+ Ex2
radicEn1
2
+ En2
2
radicHe1
2
+He2
2
minus Ex1
minus Ex2
radicEn1
2
+ En2
2
radicHe1
2
+He2
2
lowast Ex1
lowast Ex2
1003816
1003816
1003816
1003816
Ex1
Ex2
1003816
1003816
1003816
1003816
radic(
En1
Ex1
)
2
+ (
En2
Ex2
)
2
1003816
1003816
1003816
1003816
Ex1
Ex2
1003816
1003816
1003816
1003816
radic(
He1
Ex1
)
2
+ (
He2
Ex2
)
2
divide
Ex1
Ex2
1003816
1003816
1003816
1003816
1003816
1003816
1003816
1003816
Ex1
Ex2
1003816
1003816
1003816
1003816
1003816
1003816
1003816
1003816
radic(
En1
Ex1
)
2
+ (
En2
Ex2
)
21003816
1003816
1003816
1003816
1003816
1003816
1003816
1003816
Ex1
Ex2
1003816
1003816
1003816
1003816
1003816
1003816
1003816
1003816
radic(
He1
Ex1
)
2
+ (
He1
He2
Ex2
)
2
119861 = 119860 ∘ 119877 =
[
[
[
[
[
[
[
[
Ex1205721
En1205721
He1205721
Ex1205722
En1205722
He1205722
Ex120572119899
En120572119899
He120572119899
]
]
]
]
]
]
]
]
119879
∘
[
[
[
[
[
[
[
Ex1
En1
He1
Ex2
En2
He2
Ex119899
En119899
He119899
]
]
]
]
]
]
]
=
[
[
[
[
[
[
[
[
[
[
[
[
[
Ex1205721
lowast Ex1+ Ex1205722
lowast Ex2+ sdot sdot sdot + Ex
120572119899
lowast Ex119899
radic
(
1003816
1003816
1003816
1003816
1003816
Ex1205721
Ex1
1003816
1003816
1003816
1003816
1003816
radic(
En1205721
Ex1205721
)
2
+ (
En1
Ex1
)
2
)
2
+ (
1003816
1003816
1003816
1003816
1003816
Ex1205722
Ex2
1003816
1003816
1003816
1003816
1003816
radic(
En1205722
Ex1205722
)
2
+ (
En2
Ex2
)
2
)
2
+ sdot sdot sdot + (
1003816
1003816
1003816
1003816
1003816
Ex120572119899
Ex119899
1003816
1003816
1003816
1003816
1003816
radic(
En120572119899
Ex120572119899
)
2
+ (
En119899
Ex119899
)
2
)
2
radic
(
1003816
1003816
1003816
1003816
1003816
Ex1205721
Ex1
1003816
1003816
1003816
1003816
1003816
radic(
He1205721
Ex1205721
)
2
+ (
He1
Ex1
)
2
)
2
+ (
1003816
1003816
1003816
1003816
1003816
Ex1205722
Ex2
1003816
1003816
1003816
1003816
1003816
radic(
He1205722
Ex1205722
)
2
+ (
He2
Ex2
)
2
)
2
+ sdot sdot sdot + (
1003816
1003816
1003816
1003816
1003816
Ex120572119899
Ex119899
1003816
1003816
1003816
1003816
1003816
radic(
He120572119899
Ex120572119899
)
2
+ (
He119899
Ex119899
)
2
)
2
]
]
]
]
]
]
]
]
]
]
]
]
]
= (Ex0En0He0)
119879
(21)
The rules of Cloud computing used above are shown inTable 5 [26]
Through the above steps this paper obtains a Cloud digi-tal feature analytical result (Ex
0En0He0)
119879 based on Cloudquantization process namely comprehensive quantitativeresult of qualitative indicators
Step 4 (diagnosis and analysis ofmodel) Input the qualitativeand quantitative indicators to get the final output indicatorsand conduct energy efficiency diagnosis and analysis
4 Empirical Analysis
Firstly this paper establishes a management index systemcombining qualitative and quantitative factors Then basedon the Cloud model [10] and DEA model [11] (Cloudmodel can quantify qualitative indicators reasonably andDEA model has obvious advantages in evaluating generationenterprise multiefficiency indicators) it carries out empiricalanalysis of data by selecting the 2014 data of 300MW unitsfrom Hebei Guohua Huanghua Power Plant (hereinafterreferred to as Plant A) Kunming Second Power Plant (here-inafter referred to as Plant B) and Zhongfu Power Plant(hereinafter referred to as Plant C)
41 Indicator Definitions and Data Sources By constructingthe index system the 11 input indicators are determined asfollows boiler thermal efficiency turbine thermal efficiencypipeline efficiency power consumption rate loading ratethe degree of water reuse recycling water system operationoptimization operating equipment advanced degree coal-fired admission management level the unit operation andmanagement level efforts to implement energy efficiencypolicies and so forth and output indicators are generationcoal consumption and power supply coal consumption
Taking into account the characteristics of qualitative andquantitative indicators quantitative indicators of data arederived from field researches related Technical Agreement(Boiler Technology Agreement Turbo Technology Agree-ment etc) of Hebei Guohua Huanghua Power Plant andannual reports and so forth qualitative indicators datasources are derived from field researches statistical calcula-tions and technical expertsrsquo advisory from all of the abovethree power plants
42 Basic Data Processing
421 Quantitative Data Processing By querying data andfield researches about the normal condition of 300MWunitsof three power plants data of 2014 is regarded as the basis for
Mathematical Problems in Engineering 9
Table 6 Plant raw data
Indicator Unit Plant A Plant B Plant CExhaust loss 466 575 668Gas incomplete combustion loss 018 0 106Solid incomplete combustion loss 070 302 274Heat loss 017 027 049Ash physical heat loss 035 033 014Heat consumption kJ(kWsdoth) 820304 822718 8184Boiler heat input GJh 631911 mdash mdashBoiler heat output GJh 593607 mdash mdashTurbine heat input GJh 590461 mdash mdashThe average unit load MW mdash 27015 mdashMaximum load unit MW mdash 30464 mdashPower supply standard coal consumption g(kWsdoth) 31569 34632 357Generation standard coal consumption g(kWsdoth) 30069 30642 3246
Table 7 Raw data calculations
Indicator Unit Plant A Plant B Plant CBoiler thermal efficiency 9394 9063 8790Turbine thermal efficiency 9895 9897 9824Pipeline efficiency 9947 9868 9901Power consumption rate 503 757 911Loading rate 8517 8868 8300
Table 8 Membership of qualitative indicators
The degree ofwater reuse
Recycling watersystem operationoptimization
Operatingequipment
advanced degree
Coal-firedadmission
management level
The unitoperation and
management level
Efforts toimplement
energy efficiencypolicies
Expert 1 085 090 075 085 075 060Expert 2 080 085 070 085 070 070Expert 3 080 090 070 080 075 070Expert 4 075 095 070 085 075 065Expert 5 080 090 065 070 080 060Expert 6 075 085 065 085 075 065Expert 7 080 090 060 080 080 060Expert 8 080 090 070 090 080 070Expert 9 075 095 075 075 075 075Expert 10 085 095 065 070 085 080
the initial analysis of the model to obtain the raw index data(see Table 6)
Combined with the original data calculate the index dataaccording to the formulas Results are shown in Table 7
422 Qualitative Data Processing In considering the char-acteristics of indicators and data availability determine theweight in accordance with expert assessment and quantifyqualitative indicators by the Cloud model A case study withPlant A invited 10 experts to score 6 qualitative indicators
including water reuse degree circulating water system oper-ation optimization operating equipment advanced degreecoal-fired admission management level the unit operationand management level and efforts to implement energyefficiency policy Firstly set thememberships of six indicatorswith respect to the standard value 1 by the experts the resultsare shown in Table 8
Using estimation algorithm Cloud digital features ofvarious qualitative indicators of Plant A are determined Thecalculation results are shown in Table 9
10 Mathematical Problems in Engineering
Table 9 Qualitative indicators Cloud digital features
The degree ofwater reuse
Recycling watersystem operationoptimization
Operatingequipment
advanced degree
Coal-firedadmission
management level
The unitoperation and
management level
Efforts toimplement
energy efficiencypolicies
Ex 0795 0905 0685 0805 077 0675S 0001361 0001361 000225 0004694 0001778 0004583En 0021216 0007858 0007072 0007858 0015323 0008644He 0030182 0036047 0046904 0068064 0039281 0067146
Table 10 Experts on Plant A qualitative indicators assignment
The degree ofwater reuse
Recycling watersystem operationoptimization
Operatingequipment
advanced degree
Coal-firedadmission
management level
The unitoperation and
management level
Efforts toimplement
energy efficiencypolicies
Expert 1 65 80 45 85 80 80Expert 2 70 75 50 90 90 75Expert 3 65 70 50 90 85 85Expert 4 65 75 50 85 85 70Expert 5 70 60 45 80 80 80Expert 6 55 75 40 85 95 75Expert 7 60 60 40 90 90 70Expert 8 60 70 50 85 80 85Expert 9 55 75 45 85 85 80Expert 10 65 75 55 95 80 85
Table 11 Cloud digital signature of qualitative indicators weights
The degree ofwater reuse
Recycling watersystem operationoptimization
Operatingequipment
advanced degree
Coal-firedadmission
management level
The unitoperation and
management level
Efforts toimplement
energy efficiencypolicies
Ex 63 715 47 87 85 785S 2888889 4472222 2333333 1777778 2777778 3361111En 3457489 4086123 3143171 2671696 3143171 3771806He 4115175 5293942 3667943 3261874 4230632 4402794
Then this paper obtains the Cloud digital feature matrix119860 of qualitative indicators as follows
119860 =
(
(
(
(
(
(
0795 00212 00301
0905 00079 00360
0685 00071 00469
0805 00079 00681
077 00153 00393
0675 00086 00671
)
)
)
)
)
)
(22)
Through field researches the expert evaluationmethod isreused to determine the weight of nonquantifiable indicators10 experts assign weights of the six indicators of Plant Aaccording to the external conditions which influence thechange of each factor The full mark is 100 the maximummark is 100 and minimummark is 0 By assignment we can
evaluate all aspects in operation of Plant A Table 10 shows thecases that experts assigned
Likewise the Cloud digital features of the weight are asshown in Table 11
The Cloud digital features matrix of the weights ofqualitative indicators can be expressed as follows
119877 =
(
(
(
(
(
(
63 34575 41152
715 40861 52939
47 31432 36679
87 26717 32619
85 31432 42306
785 37718 44028
)
)
)
)
)
)
(23)
Mathematical Problems in Engineering 11
Finally the Cloud algorithm obtains the overall Clouddigital features of qualitative indicators of Plant A
119861 = 119877
119879
∘ 119860
=
(
(
(
(
(
(
63 34575 41152
715 40861 52939
47 31432 36679
87 26717 32619
85 31432 42306
785 37718 44028
)
)
)
)
)
)
119879
∘
(
(
(
(
(
(
0795 00212 00301
0905 00079 00360
0685 00071 00469
0805 00079 00681
077 00153 00393
0675 00086 00671
)
)
)
)
)
)
= (33546 166150 97568)
119879
(24)
Similarly the qualitative indicators of Plant B and PlantC are quantified The final diagnosis obtains basic data of thethree power plants as shown in Table 12
43 Diagnosis and Analysis of Energy Efficiency
431 The Energy Efficiency Diagnosis Which Only Consid-ers the Productive Operational Parameters Combined withTable 3 by using the model through MATLAB software thequantitative data of the three plants are diagnosed which onlyconsiders the impact of productive operational parameterson energy efficiency managementThematrix of input119883 andoutput 119884 is as shown in Table 13
Get the relative value efficiency of the power plant 11986411 =08898 11986422 = 10000 and 11986433 = 07568 By definitionDMU
2at least is weakly effective DMU
1and DMU
3are
noneffective
432 Energy Efficiency Diagnosis of Index System Which IsBased on Qualitative and Quantitative Factors In additionto considering productive operational parameters the energysaving technologies and the impact of the comprehensivemanagement level are also considered the input-outputmatrix is as shown in Table 14
And 11986411 = 10000 11986422 = 09542 and 11986433 = 08567Similarly in the MATLAB software according to model
(14) programming language the results are as follows
11986411 = 10000
11986422 = 09542
11986433 = 08567
(25)
It was found thatDMU1is at least weakly effective DMU
2
and DMU3are nonweakly effective
Table 12 Qualitative indicators integrated cloud digital features ofplant
Ex En HePlant A 33546 166150 97568Plant B 31770 155593 108217Plant C 1835930 260128 84438
Table 13 Input and output conditions of quantitative variables
DMU1
DMU2
DMU3
1198831 9394 9063 87901198832 9895 9897 98241198833 9947 9868 99011198834 503 757 9111198835 8517 8868 83001198841 31569 34632 3571198842 30069 30642 3246
Table 14 The input and output conditions of quantitative-qualitative variables
DMU1
DMU2
DMU3
1198831 9394 9063 87901198832 9895 9897 98241198833 9947 9868 99011198834 503 757 9111198835 8517 8868 83001198836 (Ex) 33546 31770 18359301198837 (En) 166150 155593 2601281198838 (He) 97568 108217 844381198841 31569 34632 3571198842 30069 30642 3246
To further confirm the reason that DMU2and DMU
3are
nonweakly effective this paper uses model (16) to get DEAdiagnostic results which are shown in Table 15
44 Analysis of Energy Efficiency Diagnosis
441 Verification of the Rationality of the Diagnostic ModelBy comparing the results of DEA diagnosis it can be foundthat the ranking results of energy efficiency are differentwhen only considering productive operational parametersindicators andwhen comprehensively considering qualitativeand quantitative indicators When diagnosing the energyefficiency based on only quantitative indicators the energyefficiency order of the three plants is as follows Plant B gtPlant A gt Plant C which is changed to ldquoPlant A gt Plant Bgt Power Crdquo after bringing in qualitative indicatorsrsquo Clouddigital feature (ExEnHe) processed by the Cloud model
While in actual production by using Shenhua coal whichis transported to Huanghua Port by Shenhuang Railway andthen transferred to the power plant by the conveyor beltPlant A (Hebei Guohua Huanghua Power Plant) achieves ascientificmanagement of coal combustion and its circulationof cooling water is optimized by using the way of seawater
12 Mathematical Problems in Engineering
Table 15 The results of DEA diagnosis
DMU 120579
lowast
120582
lowast Technical efficiency 120582
lowast
120579
1
lowast Returns to scale DEA effectivenessDMU
1
(A) 1 1 Valid 1 Constant ValidDMU
2
(B) 09542 09238 Invalid 09681 Increasing InvalidDMU
3
(C) 08567 08328 Invalid 09721 Increasing Invalid
Table 16 Plant B and Plant C results of economic evaluation
DMUDMU
2
(Plant B) DMU3
(Plant C)Current value Improved value Difference Current value Improved value Difference
Input
1198831 9063 9294 231 8790 8993 2031198832 9897 9905 008 9824 9876 0521198833 9868 9897 029 9901 9903 0021198834 757 603 minus154 911 724 minus1871198835 8868 8917 049 8300 8469 1691198836 31770 33546 1776 1835930 1841526 055961198837 155593 166150 10557 260128 274112 139841198838 108217 117568 09351 84438 88935 04497
Output 1198841 34632 34632 0 357 357 01198842 30642 30642 0 3246 3246 0
once-through cooling from the Huanghua harbor basin Inaddition Plant A brings in the Wet Limestone-Gypsum FlueGas Desulfurization technology of Germany Lurgi Energyand Environmental Protection Company making the desul-furization efficiency above 95
Through the transformation of the above three aspectsthe energy efficiency of Plant A is significantly better thanPlant B Thus combined with reality the analysis results ofthe diagnostic model of thermal power enterprisesrsquo energyefficiency management which is based on a combination ofqualitative and quantitative indicators are more similar to thereal situation which proves the validity of the model
442 Analysis of Diagnostic Results According to the anal-ysis of the results when adding the qualitative indicatorsof Cloud digital features processed by Cloud model theefficiency value of Plant A increased reaching DEA effectivevalue and Plant B changed from being effective to invalidwhile Plant Crsquos efficiency increased but it needed to be furtherstrengthened The following gives the major suggestions forPlant B and Plant C as shown in Table 16
Take Plant B as an example tomake the following analysisthe DEA diagnosis of Plant B is invalid in order to achieveDEA effective value the ways of reducing the amount ofcold air into the boiler reconstructing the air preheaterheat storage element increasing the heat transfer area ofeconomizer and reconstructing boiler burning belt shouldbe used And the boiler thermal efficiency may increase231 By using cellular contact steam seal optimizing gasdistribution mode the steam turbine generator set thermalefficiency may increase 008 and pipeline efficiency mayincrease 029 By reducing pump power consumption andchanging the circulating pump control mode to achievemaximum control of circulating water and other ways the
power consumption rate can decrease 154 and the load ratecan increase 049
In addition Plant B is required to increase investment inwater reuse degree advanced degree of operating equipmentcoal-fired admission management level management levelof machine set implementation of energy policy and soforth such as phasing out the equipment which has beenrunning for a long time correcting unreasonable parametersof plant fan and increasing the design space of flue gas ductto achieve the advancement ofmajor equipment the scientificmanagement of coal-fired the refinement of unit operationand thorough implementation of energy conservation policy
From the above analysis it is found that the comprehen-sive diagnostic model analysis results which are processedby Cloud model are more reasonable compared with theonly use of the general quantitative data energy efficiencyassessment On the one hand a more accurate ranking ofplant energy efficiency can be got and it can improve theaccuracy of subjective assignment and prove the rationality ofthe model through empirical analysis on the other hand bycombining the Cloudmodel with DEAmodel the horizontalcomparison of the three power generation companies canbe achieved and relatively targeted recommendations canbe made for the power generation company whose energyefficiency is backward It plays a referential role for the variousenterprises in energy saving practical work in the future andproves the validity of the diagnostic model
5 Conclusion
Effective diagnosis and energy management can obviouslyreduce carbon emissions and overall energy consumption ofthermal power enterprises which can promote the devel-opment of the whole industry This paper analyzes and
Mathematical Problems in Engineering 13
summarizes the factors that affect energy efficiency man-agement from the aspect of actual internal and externalenvironment of energy efficiency management This methodovercomes the defect of previous researches which onlyconsidered quantitative indicators and sets diagnosis indexsystem of energy efficiency management of 11 qualitative andquantitative indicators which contains the unit operation andmanagement level efforts to implement energy efficiencypolicies and so forth Besides this method combines Cloudmodel with DEA model into an integrated diagnostic modelwhich is called ldquoCDMrdquo This model was used in actualenergy efficiency analysis of thermal power enterprises Therationality of index system in this paper is verified bycomparing quantitative index systems which only considerproductive operational parameters Finally in order to pro-vide a reference for the same type of enterprises in the actualimplementation of the energy efficiency management thispaper puts forward improvements by comparing the effec-tiveness of three power plantsrsquo energy efficiency
Competing Interests
The authors declare that there is no conflict of interestsregarding the publication of this article
Acknowledgments
This paper was supported by the Social Science Foundationof Beijing (Project ID 15JGB050)
References
[1] M Wang Efficiency of Fired Power Plants Investment in Envi-ronment Protection Evaluation System and Application InnerMongolia University 2010
[2] F Dan Economic Analysis of Thermal Power Plant Basedon Comprehensive Benefit Index North China Electric PowerUniversity Beijing China 2011
[3] W H J Graus and E Worrell ldquoEffects of SO2
and NO119909
controlon energy-efficiency power generationrdquo Energy Policy vol 35no 7 pp 3898ndash3908 2007
[4] N Shen J Zhou and W Zou ldquoEnergy efficiency measures andconvergence in China taking into account the effects of envi-ronmental and random factorsrdquoPolish Journal of EnvironmentalStudies vol 24 no 1 pp 257ndash267 2015
[5] S Ludig E Schmid M Haller and N Bauer ldquoAssessmentof transformation strategies for the German power sectorunder the uncertainty of demand development and technologyavailabilityrdquo Renewable and Sustainable Energy Reviews vol 46pp 143ndash156 2015
[6] C-Y Fang J-L Hu and T-K Lou ldquoEnvironment-adjustedtotal-factor energy efficiency of Taiwanrsquos service sectorsrdquoEnergyPolicy vol 63 pp 1160ndash1168 2013
[7] R Martin M Muuls L B De Preux and U J WagnerldquoAnatomy of a paradox management practices organizationalstructure and energy efficiencyrdquo Journal of Environmental Eco-nomics and Management vol 63 no 2 pp 208ndash223 2012
[8] Y Cai B Li Z Hu Y Song and Y Zhao ldquoCalculation of carbonemission index of coal-fired generating unit and analysis on
influencing factorsrdquo Power System Technology vol 37 no 5 pp1185ndash1189 2013
[9] U Schiffers ldquoCombined gas and steam-turbine power generat-ing stationrdquo US Patent 4697415 1987
[10] H Jun Research on Large Thermal Plants Management Mode ofSaving Energy North China Electric Power University BeijingChina 2011
[11] M Ghadimi A Ramezani and K Bozorgi ldquoEnergy efficiencyand power quality optimization using a modified capacitorbank An Industrial Case Studyrdquo in Proceedings of the UKSim3rd EuropeanModelling Symposium on ComputerModelling andSimulation (EMS rsquo09) pp 384ndash388 November 2009
[12] L Deyi ldquoThe cloud control method and balancing patterns oftriple link inverted pendulum systemsrdquoEngineering Science vol2 pp 41ndash46 1999
[13] Y Zhaohui and L Deyi ldquoPlanar model and its application inpredictionrdquo Chinese Computers vol 11 pp 961ndash969 1998
[14] J Yue L Deyi and Y Zhaohui ldquoA new method to evaluate theeffectiveness of Csim3I systemrdquo Systems EngineeringmdashTheory ampPractice vol 12 pp 69ndash74 1998
[15] H Chen D Li and C Z Shen ldquoA Cloud model applied tocontrolling inverted pendulumrdquo Journal of Computer Researchamp Development vol 10 pp 1180ndash1187 1999
[16] Q Ye S-W Li Y-H Zhang X-W Shu and D-P Ni ldquoCloudmodel and application overviewrdquo Computer Engineering andDesign vol 3 no 12 pp 4198ndash4201 2011
[17] X-Y Du Q-J Yin K-D Huang and D-N Liang ldquoTrans-formation between qualitative variables and quantity basedon cloud models and its applicationrdquo Systems Engineering andElectronics vol 30 no 4 pp 772ndash776 2008
[18] A Charnes W W Cooper Q L Wei and Z M HuangldquoCone ratio data envelopment analysis and multi-objectiveprogrammingrdquo International Journal of Systems Science vol 20no 7 pp 1099ndash1118 1989
[19] Z Huang and S X Li ldquoDominance stochastic models indata envelopment analysisrdquo European Journal of OperationalResearch vol 95 no 2 pp 390ndash403 1996
[20] L Wu Effectiveness Analysis Based on the Size of Institutionsof Higher Learning Data Envelopment Analysis (DEA) TongjiUniversity Shanghai China 2006
[21] C Kao and S-T Liu ldquoFuzzy efficiency measures in dataenvelopment analysisrdquo Fuzzy Sets and Systems vol 113 no 3pp 427ndash437 2000
[22] G Yu QWei and P Brockett ldquoA generalized data envelopmentanalysis model a unification and extension of existing methodsfor efficiency analysis of decision making unitsrdquo Annals ofOperations Research vol 66 no 2 pp 47ndash59 1996
[23] S Su A Study on the Efficiency of the Listed Companies of RealEstate in China Based on DEA Method Chongqing UniversityChongqing China 2007
[24] S-L Ning L Chen and L Li ldquoAnalyzing fuzzy compositeoperators for application to command efficiency evaluationrdquoFire Control and Command Control vol 33 no 12 pp 117ndash1202008
[25] Y-B Shi A Zhang X-J Gao and Z-J Tan ldquoCloud modeland its application in effectiveness evaluationrdquo in Proceedingsof the International Conference on Management Science andEngineering 15th Annual Conference (ICMSE rsquo08) pp 250ndash255September 2008
[26] S Rujia Research on the Index Evaluation System of ThermalPower North China Electric Power University Beijing China2011
Submit your manuscripts athttpwwwhindawicom
Hindawi Publishing Corporationhttpwwwhindawicom Volume 2014
MathematicsJournal of
Hindawi Publishing Corporationhttpwwwhindawicom Volume 2014
Mathematical Problems in Engineering
Hindawi Publishing Corporationhttpwwwhindawicom
Differential EquationsInternational Journal of
Volume 2014
Applied MathematicsJournal of
Hindawi Publishing Corporationhttpwwwhindawicom Volume 2014
Probability and StatisticsHindawi Publishing Corporationhttpwwwhindawicom Volume 2014
Journal of
Hindawi Publishing Corporationhttpwwwhindawicom Volume 2014
Mathematical PhysicsAdvances in
Complex AnalysisJournal of
Hindawi Publishing Corporationhttpwwwhindawicom Volume 2014
OptimizationJournal of
Hindawi Publishing Corporationhttpwwwhindawicom Volume 2014
CombinatoricsHindawi Publishing Corporationhttpwwwhindawicom Volume 2014
International Journal of
Hindawi Publishing Corporationhttpwwwhindawicom Volume 2014
Operations ResearchAdvances in
Journal of
Hindawi Publishing Corporationhttpwwwhindawicom Volume 2014
Function Spaces
Abstract and Applied AnalysisHindawi Publishing Corporationhttpwwwhindawicom Volume 2014
International Journal of Mathematics and Mathematical Sciences
Hindawi Publishing Corporationhttpwwwhindawicom Volume 2014
The Scientific World JournalHindawi Publishing Corporation httpwwwhindawicom Volume 2014
Hindawi Publishing Corporationhttpwwwhindawicom Volume 2014
Algebra
Discrete Dynamics in Nature and Society
Hindawi Publishing Corporationhttpwwwhindawicom Volume 2014
Hindawi Publishing Corporationhttpwwwhindawicom Volume 2014
Decision SciencesAdvances in
Discrete MathematicsJournal of
Hindawi Publishing Corporationhttpwwwhindawicom
Volume 2014 Hindawi Publishing Corporationhttpwwwhindawicom Volume 2014
Stochastic AnalysisInternational Journal of
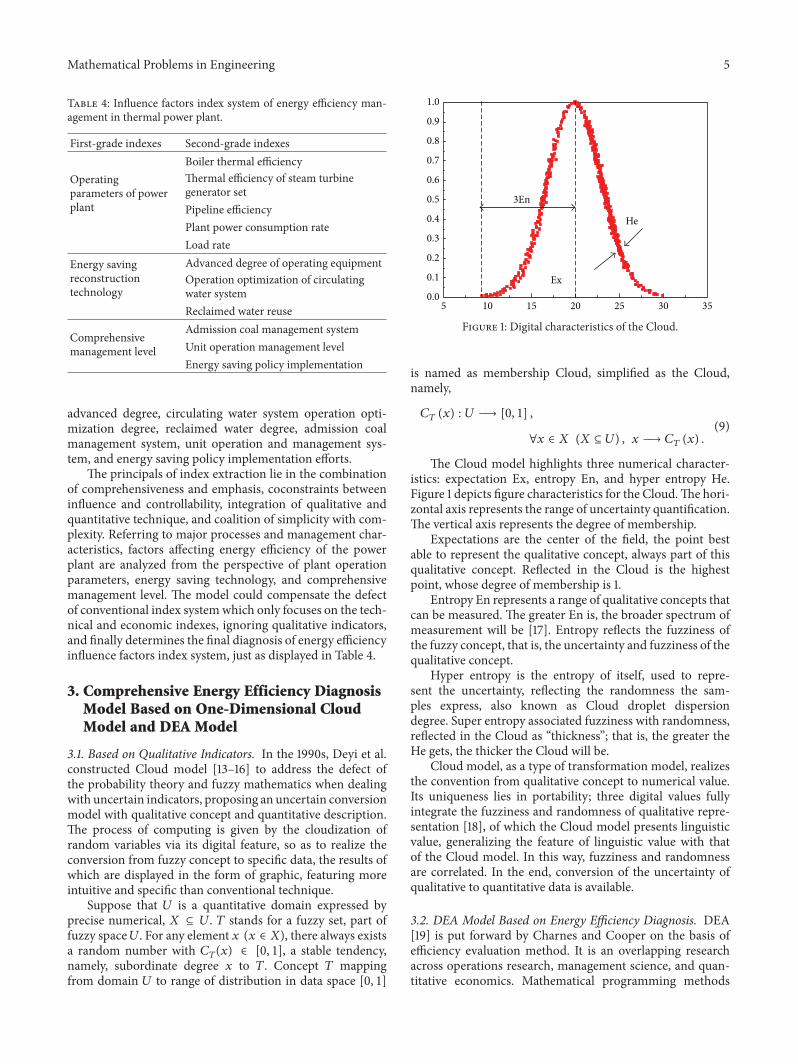
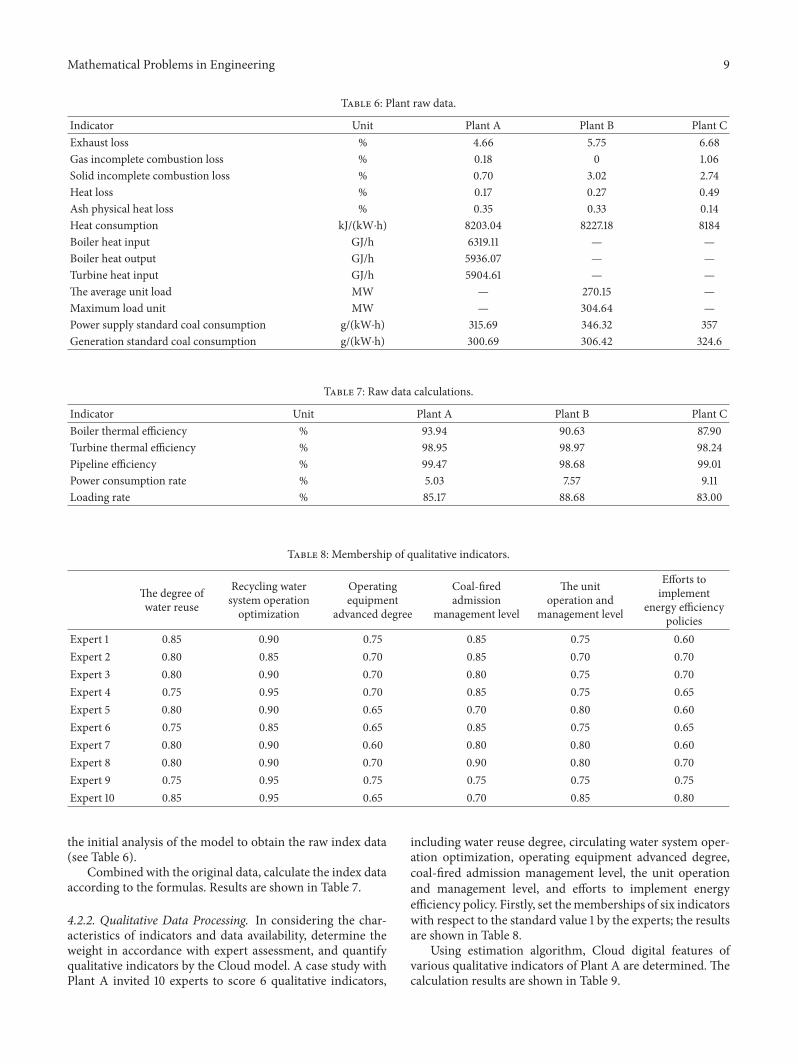
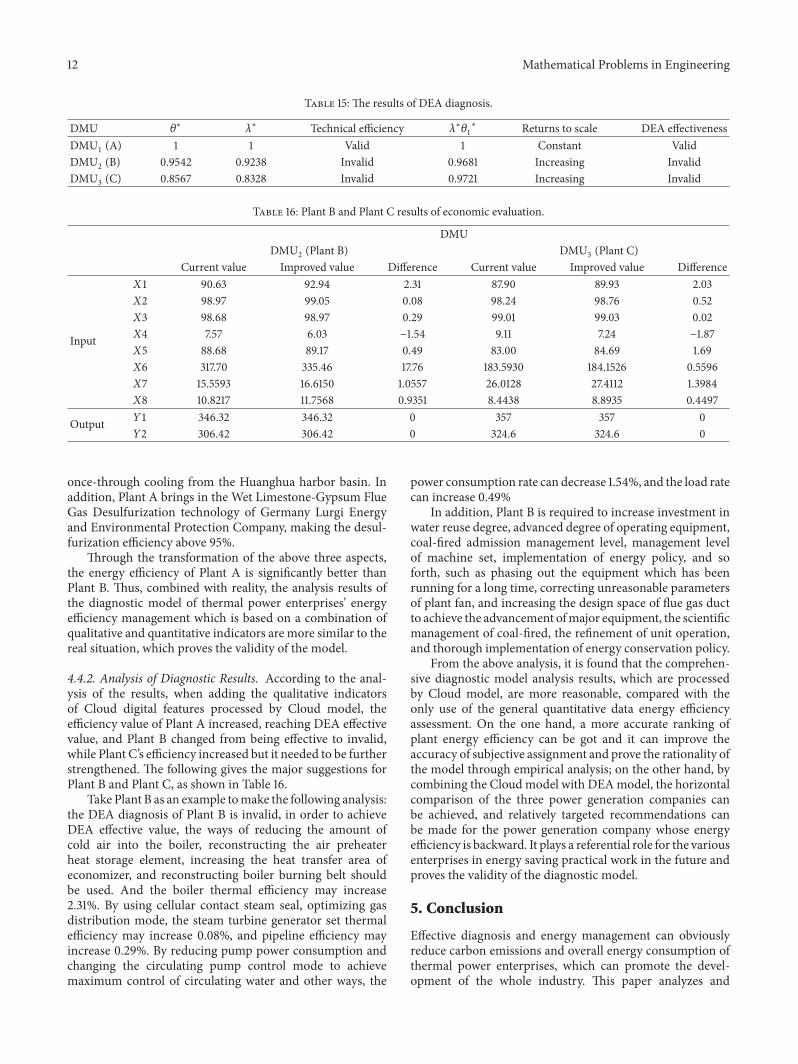