research article high-resolution imaging of polyethylene...
TRANSCRIPT

Research ArticleHigh-Resolution Imaging of Polyethylene GlycolCoated Dendrimers via Combined Atomic Force andScanning Tunneling Microscopy
Shawn Riechers,1 Qian Zhong,2 Nai-Ning Yin,1 Arpad Karsai,1
Sandro R. P. da Rocha,2 and Gang-yu Liu1
1Department of Chemistry, University of California, Davis, CA 95616, USA2Department of Chemical Engineering & Materials Science, Wayne State University, Detroit, MI 48202, USA
Correspondence should be addressed to Gang-yu Liu; [email protected]
Received 10 September 2014; Accepted 11 December 2014
Academic Editor: Kang Choon Lee
Copyright © 2015 Shawn Riechers et al.This is an open access article distributed under the Creative CommonsAttribution License,which permits unrestricted use, distribution, and reproduction in any medium, provided the original work is properly cited.
Dendrimers have shown great promise as drug delivery vehicles in recent years because they can be synthesized with designedsize and functionalities for optimal transportation, targeting, and biocompatibility. One of the most well-known termini usedfor biocompatibility is polyethylene glycol (PEG), whose performance is affected by its actual conformation. However, theconformation of individual PEG bound to soft materials such as dendrimers has not been directly observed. Using atomic forcemicroscopy (AFM) and scanning tunneling microscopy (STM), this work characterizes the structure adopted by PEGylateddendrimers with the highest resolution reported to date. AFM imaging enables visualization of the individual dendrimers, as well asthe differentiation and characterization of the dendrimer core and PEG shell. STM provides direct imaging of the PEG extensionswith high-resolution. Collectively, this investigation provides important insight into the structure of coated dendrimers, which iscrucial for the design and development of better drug delivery vehicles.
1. Introduction
Dendrimers provide an alternative and potent means fordrug delivery due to their nanometer size and the abilityto incorporate various functionalities on their interior andexterior. Modern chemical synthesis capabilities allow var-ious functionalities to be incorporated on the dendrimerexterior in order to optimize performance in terms of drugbinding, transport, targeting, delivery, and biocompatibility[1–3]. Polyamidoamine (PAMAM) dendrimers, for example,have been tailored for enhanced drug solubility, retentiontime, targeting, and efficacy [1–3]. In addition to optimizingdelivery, another issue is the reduction or elimination ofcytotoxicity, which has been addressed by masking theterminal functional groups and charge [4]. This can beaccomplished by adding biologically compatible terminalgroups such as carboxylate, hydroxyl, acetamide, lipid, or
polyethylene glycol (PEG) [2]. Among these, PEG is themost widely used due to its minimal or nontoxicity, nonim-munogenicity, and nonantigenicity and has been approved bythe FDA in oral intravenous and pulmonary pharmaceuticalformulations [5–8]. It is known that PEG chains adopt avariety of conformations, lengths, and packing density andthat these structural presentations directly affect biocompat-ibility [9–11]. In some cases, PEG alters dendrimer’s drugloading capacity, retention time, and thus their deliveryperformance [8, 12, 13]. Therefore, the characterization ofPEG coating prior to animal testing is of great importance.While computational studies have been carried out to probePEG conformation on dendrimers surfaces, experimentalstudies are lacking due to the difficulties in obtaining high-resolution structural characterization of PEG when boundto soft materials, such as dendrimers [11, 14]. Our priorwork shows that high-resolution structural characterization
Hindawi Publishing CorporationJournal of Drug DeliveryVolume 2015, Article ID 535683, 10 pageshttp://dx.doi.org/10.1155/2015/535683
2 Journal of Drug Delivery
of simple dendrimers such as PAMAM can be achieved byadvanced sample preparation and combined atomic force andscanning tunneling microscopy (AFM and STM) imaging[15, 16]. Encouraged by this initial success, this work reportsextending our approach to PEGylated PAMAM dendrimers.From the high-resolution images, the molecular conforma-tion, packing density, and distribution of PEG on the surfaceof individual dendrimers can be obtained. This knowledgeof the PEG presentation on dendrimers provides importantinsights for understanding structure-delivery performancecorrelation, which could guide the design, optimization, anddevelopment of the next generation of dendrimers and reduceusage of animal tests.
2. Materials and Methods
2.1. Materials. The followingmaterials were used as received:methoxy polyethylene glycol 1000Da (PEG
1000) (Sigma-
Aldrich), triethylamine (TEA) (99.5%, Sigma-Aldrich), pyri-dine (99.8%, Sigma-Aldrich) p-nitrophenyl chloroformate(pNPCF) (98%, Sigma-Aldrich), 2,5-dihydroxybenzoic acid(2,5-DHB) (Sigma-Aldrich), anhydrous dichloromethane(DCM) (Sigma-Aldrich), dimethyl sulfoxide (DMSO) (AcrosGeel), K
2PtCl4(min. 42.4% Pt, Alfa Aesar), n-octanethiol
(C8) (98%, Sigma-Aldrich), deuterium oxide (D, 99.96%,Cambridge Isotope Laboratories), and phosphate buffer (10x,Lief Technologies). Fourth generation amine terminatedPAMAM dendrimers were purchased as 10% by weightsolutions in methanol (Sigma-Aldrich, St. Louis, MO). Silicagel 60A 230–400mesh ATSM (Whatman Inc) and silicagel 60 F
254plastic sheets (TLC) (Merck KGaA) were used
for column and thin layer chromatography, respectively.Ultrapure water (≥18MΩ⋅cm, Millipore Milli-Q) and 200proof ethanol (Gold Shield Chemical Co.) were used fordilution and washing. Ultrapure N
2(98%, Air Gas Co.)
and H2(99.99%, Praxair, Inc.) were used for drying and
flaming, respectively. Tungsten wire (𝑑 = 0.010 in., 99.95%,California Fine Wire Co.) was used to make STM tips. Auslugs (99.99%, Alpha Aesar Premion Co.) and mica (clearrubymuscovite, Mica New York Corp.) were used for Au thinfilm preparation.
2.2. Methods
2.2.1. Preparation of GoldThin Films. The followingmaterialswere used as received: methoxy polyethylene glycol 1000Da(PEG1000) (Sigma-Aldrich, St. Louis, MO), triethylamine(TEA) (99.5%, Sigma-Aldrich, St. Louis, MO), pyridine(99.8%, Sigma-Aldrich, St. Louis, MO) p-nitrophenyl chlo-roformate (pNPCF) (98%, Sigma-Aldrich, St. Louis, MO),2,5-dihydroxybenzoic acid (2,5-DHB) (Sigma-Aldrich, St.Louis, MO), anhydrous dichloromethane (DCM) (Sigma-Aldrich, St. Louis, MO), dimethyl sulfoxide (DMSO) (99.7%,Acros, Geel, Belgium), K2PtCl4 (min. 42.4%Pt, Alfa Aesar,Ward Hill, Massachusetts), n-octanethiol (C8) (98%, Sigma-Aldrich, St. Louis, MO), deuterium oxide (D, 99.96%, Cam-bridge Isotope Laboratories, Tewksbury,MA), and phosphatebuffer (10x, Lief Technologies, Grand Island, NY). Fourthgeneration amine terminated PAMAM dendrimers were
purchased as 10% by weight solutions in methanol (Sigma-Aldrich, St. Louis, MO). Silica gel 60A 230-400 mesh ATSM(Whatman Inc, Pittsburgh, PA) and silica gel 60 F254 plasticsheets (TLC) (Merck KGaA, Darmstadt, Germany) wereused for column and thin layer chromatography, respectively.Ultrapure water (≥18MΩ ⋅ cm, MilliporeMilli-Q, Billerica,MA) and 200 proof ethanol (Gold Shield Chemical Co.,Hayward, CA) were used for dilution and washing. UltrapureN2 (98%, Air Gas Co., Woodland, CA) and H2 (99.99%,Praxair Inc., Sacramento, CA) were used for drying andflaming, respectively. Tungsten wire (𝑑 = 0.010 in., 99.95%,California Fine Wire Co., Grover Beach, CA) was used tomake STM tips. Au slugs (99.99%, Alpha Aesar PremionCo., Ward Hill MA) and mica (clear ruby muscovite, MicaNew York Corp., New York, NY) were used for Au thin filmpreparation.
2.2.2. PEGylation of G4-PAMAM-NH2
Dendrimers. G4-PAMAM-NH
2dendrimers were PEGylated according to pre-
vious reports with some modifications [13]. Briefly, PEG1000
was first modified by reaction with TEA and a catalystamount of pyridine in anhydrous DCMwith PEG
1000. To the
organic solution was added pNPCF dropwise. The organicsolventwas then removed under reduced pressure. To removeunreacted pNPCF, the resultant product was purified bycolumn chromatography.
TheG4-PAMAM-nPEG1000 was synthesized by adding ananhydrous DMSO solution of G4-PAMAM-NH
2dropwise to
a solution of PEG1000
carbonate in anhydrous DMSO. Thereaction system was then stirred 24 hours for G4-PAMAM-6PEG
1000, or 72 hours for G4-PAMAM-50PEG
1000. The
resulting G4-PAMAM-nPEG1000
was purified by centrifugalfilter (MWCO = 10 kDa) until thin layer chromatography(DCM/methanol = 80/20, v/v) showed no unreacted PEG
1000
carbonate or byproduct p-nitrophenol.
2.2.3. G4-PAMAM-nPEG1000
Characterization. The molec-ular weight of the modified and unmodified dendrimerswas determined by matrix assisted laser desorption ion-ization time-of-flight mass spectrometry (MALDI-TOF-MS)(Ultraflex, Bruker). Spectra were acquired under positive ionreflector mode. The conjugates were dissolved in deionizedwater at a concentration of 1.0mg/mL. 10mg/mL of 2,5-DHB in methanol was used as matrix. 10 𝜇L of the conjugatesolution was mixed with 10 𝜇L of the DHB solution. 2𝜇L ofthe sample was spotted on a MALDI target plate (MTP 384,Bruker Daltonics, Inc.). The spotted sample was dried gentlyby air flow. The G4-PAMAM-NH
2, G4-PAMAM-6PEG
1000,
and G4-PAMAM-50PEG1000
dendrimers were found to havea molecular weight of 14,579, 22,080, and 75,929Da, respec-tively.
The number of PEG chains per dendrimer was deter-mined by 1H NMR spectroscopy (MR-400, Agilent) usingdeuterated solvent. The deuterated solvent peak (DMSO d6:2.483; D
2O: 4.577) in 1H NMR was set as a reference peak.
The PEGylation resulted in 5.9 PEG per dendrimer, referredto as G4-PAMAM-6PEG
1000, and 50.5 PEG per dendrimer,
referred to as G4-PAMAM-50PEG1000
.

Journal of Drug Delivery 3
The hydrodynamic diameter (HD) of samples was mea-sured using dynamic light scattering (DLS) (Zetasizer NanoZS, Melvern Instruments). The sample (1.0mg/mL) wasdissolved in phosphate buffer solution (0.1M, pH 7.4) tomaintain the pH during the measurement. HD and standarddeviations were automatically calculated by built-in soft-ware. G4-PAMAM-NH
2, G4-PAMAM-6PEG
1000, and G4-
PAMAM-50PEG1000
dendrimers were found to have a HD of4.4 ± 1.4, 5.8 ± 2.1, and 12.2 ± 4.4 nm, respectively.
2.2.4. AFM and STM Imaging. Dendrimers were immobi-lized on gold surfaces for AFM and STM imaging. Thesolutions were prepared following previously establishedprocedures, including metal ion doping to facilitate STMimaging [15–17]. In short, dendrimer solutions were dilutedto 1 𝜇M in pure water. K
2PtCl4was then added to obtain
molar ratios of 1 : 70, or 1 : 700 dendrimer : Pt2+. Solutionswere kept at room temperature for 48 hours in order to allowfor sufficient Pt2+-amine coordination within dendrimers.For the surface deposition of dendrimers, 1 cm2 pieces of goldfilms were H
2-flamed and allowed to cool for 10 minutes
under clean ambient conditions. Then, a 60–100𝜇L drop ofthe dendrimer solution was deposited resulting in a dropletwith a contact diameter of 0.7–0.9 cm. After 1.25 minutes thesurface was washed with 2mL of pure water, dried with N
2,
washed with 2mL of ethanol, and dried again with N2. A 60–
100 𝜇L drop of 1.0mM C8 solution was then applied to thesubstrate for 4 minutes, washed with 2mL of ethanol, anddried with N
2. C8 SAMs are incorporated in order to replace
weakly adsorbedmolecules, confine dendrimers laterally, andprevent mobility during scanning. This process results in aclean, high coverage submonolayer of dendrimers on thesurface.
AFM images were acquired using a MFP3D-SA system(Asylum Research), which includes a closed loop capability.A silicon cantilever (AC-240, Olympus) was used for imagingand nanoshaving.Theprobe has a typical force constant of 𝑘=1.0N/m as measured by the thermal noise method [16, 18, 20,21]. During tapping mode imaging, the cantilever was modu-lated by a driving frequency of 74 kHz and amplitude of 87 nm(1.0 V). During nanoshaving to displace adsorbates such asdendrimers or alkanethiolates, tips were placed in contactwith the surface with increasing load beyond threshold [22,23]. Image processing anddata analysis were performedusingGwyddion (Version 2.33, http://gwyddion.net/).
STM images were taken using a walker-type scanner(UHV 300, RHKTechnologies, Inc.), under ambient pressureand temperature [18, 19]. STM tips were prepared by etchingtungsten wires electrochemically at 2.0 V in 3.0M NaOHsolutions using a homemade potentiostat to monitor theetching process [18, 19]. All STM images were acquired inconstant current mode with typical bias voltages rangingfrom 0.4 to 0.9V and tunneling currents from 10 to 40 pA.The scanner was calibrated laterally using an octanethiolSAM lattice constant of 0.50 nm and vertically using Au(111)single atomic step (0.235 nm). Image processing and dataanalysis were performed using XPMPro (Version 2.0.0.8,RHK Technologies, Inc.). Surface contact area measurementswere carried out using ImageJ (Version 1.47v, Wayne Ras-band, NIH, http://imagej.nih.gov/ij/index.html).
3. Results and Discussion
3.1. AFM Imaging of the PEGylated G4 Dendrimers. Thecharacteristic AFM tapping mode images of G4-PAMAM-50PEG
1000, are shown in Figures 1(a) and 1(b). The two
images are of the same area but under two different dampingset points during tapping mode AFM imaging. In the caseof G4-PAMAM-50PEG
1000, the topographic images were
found to vary with the set point values. In Figure 1(a), at42% damping, each dendrimer appears as a ring. Reducingthe damping to 23%, that is, gentler tapping, an ellipsoidalcap morphology is observed, as shown in Figure 1(b). Wehave varied damping (from 0% to 100%) and found thatdendrimers appear as either rings as shown in Figure 1(a)or ellipsoidal caps as shown in Figure 1(b). We assigned thetwo features to PAMAM core and PEG shell (or coating),respectively. The assignment is based on three observa-tions. First, the damping-dependence was not present fornon-PEGylated dendrimers, such as G4-PAMAM-NH
2, as
revealed in Figures 1(c) and 1(d). Regardless of tapping con-ditions, the G4-PAMAM-NH
2dendrimers always appear as
ellipsoidal caps, consistent with prior studies [16]. Secondly,the core region of theG4-PAMAM-50PEG
1000ring structures
is commensurate in size with that of the G4-PAMAM-NH2core, as shown in cursor 1 of Figure 1. Thirdly, damp-
ing dependence in tapping mode AFM imaging typicallyindicates variation in materials’ viscoelastic property, forexample, how materials respond to periodical tapping ofthe AFM tip [24–27]. The distinct differences in the caseof G4-PAMAM-50PEG
1000dendrimers are consistent with a
tight and elastic dendrimer core and a relatively loose andviscoelastic PEG coating.The PEG regions could exhibit highresponses at specific damping conditions, revealing ringsmore evidently.
The width of the rings, measured as full width at halfof the maximum height, varies from 5.0 to 12.4 nm, withan average value of 6.9 ± 2.3 nm. The measured ring widthprovides an approximate view regarding the extension, orconformation, of the PEG molecules suggesting a variationin the PEG conformation. According to AFM imaging,the thickness of the PEG coating surrounding individualdendrimers is asymmetric. The difference between the thick-est and thinnest regions of the PEG coating on a singledendrimer varies by 3.4% up to 47.6%. This preliminaryassessment of dendrimer morphology indicates that the PEGdensity and extension are not uniform at the outer shell ofindividual dendrimers. To determine the fine structure ofthe PEG coating, STM imaging is performed and provides amore accurate visualization of the PEG presentation, as willbe discussed in detail in Section 3.2.
To verify that the features are not due to deforma-tion upon surface immobilization, we have also imageddendrimers at various surface coverages. At high surfacecoverage, as shown in Figure 2, AFM topographs are againfound to depend on tapping conditions. Overall, the trend issimilar to that at low coverage, that is, solid ellipsoidal capsare observed under most tapping conditions, while rings areobserved at greater dampening. This indicates that the ring-like features are intrinsic to the dendrimer structure insteadof surface deformation.

4 Journal of Drug Delivery
0 20 40 60Distance (nm)
2
0
1
2
3
4
Hei
ght (
nm)
0 20 40 60Distance (nm)
0
1
2
3
4
Hei
ght (
nm)
1
(b)
23% dampening
100nm
(d)
100nm
(c)
100nm
G4
-PA
MA
M-N
H2
(a)
42% dampening
100nm
G4
-PA
MA
M-50
PEG1000
Figure 1: AFM tappingmode imaging ofG4-PAMAM-50PEG1000
dendrimers. 300× 300 nm2 topographic images ofG4-PAMAM-50PEG1000
acquired at a damping set point of 42% (a) and 23% (b). 300 × 300 nm2 AFM topographic images of G4-PAMAM-NH2at damping set
points of 42% (c), and 23% (d). Cursor profile 1 is a representative G4-PAMAM-50PEG1000
and G4-PAMAM-NH2dendrimer imaged with
42% dampening as indicated in (a) (red) and (c) (blue). Cursor profile 2 is a representative G4-PAMAM-50PEG1000
and G4-PAMAM-NH2
dendrimer imaged with 23% dampening as indicated in (b) (red) and (d) (blue).
One specific difference was seen under 42% damping,at which ring contrast was observed previously; the mor-phology appears fragmented, analogous to flower pedals,as shown in Figure 2(a). The brighter lobes correspond tooverlapping PEG regions between two neighboring den-drimers. This overlapping region can extend the entirethickness of the PEG coating up to the PAMAM core as
shown in the cursor profile (red). At 23% damping, PEG-coated G4 dendrimers appear as individual ellipsoidal capswith a clear depression between adjacent dendrimers, asshown in Figure 2(b) and the cursor (blue) of Figure 2.In the case of G4-PAMAM-NH
2dendrimers, no overlap
among dendrimers was ever observed, regardless of imagingconditions. These observations suggest that the PEG chains

Journal of Drug Delivery 5
0
1
2
0 20 40 60
Hei
ght (
nm)
Distance (nm)
23% dampening42% dampening
(a) (b)
100nm100nm
G4
-PA
MA
M-50
PEG1000
Figure 2: 300 × 300 nm2 AFM topographic images of G4-PAMAM-50PEG1000
imaged with 42% (a) and 23% (b) dampening. Cursor profileis taken from representative G4-PAMAM-50PEG
1000dendrimers in images (a) (red) and (b) (blue).
could be interdigitated at close proximity, which could leadto stacking, interspersion, and merging among neighboringdendrimers.This behavior is in sharp contrast to the PAMAMcores, where no overlapping or coalescing was seen. Theseobservations are important in the context of drug delivery invivo, as aggregation due to high accumulations of dendrimersis of concern.
Our previous work has demonstrated that the physicalheight of surface immobilized dendrimers can be measuredusing nanoshaving, an AFM based technique, in conjunctionwith topographic imaging [15–17]. The surface was firstsurveyed to select a relatively flat 1.5𝜇m × 1.5 𝜇m region.Higher force was then applied during scanning of a central0.5 𝜇m × 0.5 𝜇m region to remove the dendrimer monolayer.Finally the entire area was imaged again in tapping modeto reveal both the freshly exposed surface region and thesurrounding dendrimer monolayer in a single frame, shownin Figure 3(a) inset. The physical height of individual G4-PAMAM-NH
2dendrimers relative to the bare substrate can
be directly obtained from the cursor profile. As shown inFigure 3(a), cursor 1 reveals the height of five individualdendrimers.The height taken frommultiple experiments anda large number of G4-PAMAM-NH
2dendrimers was found
to be 2.2 ± 0.3 nm, which is identical to 3 previous mea-surements of surface immobilized G4-PAMAM dendrimers[15–17]. This value is lower than 4.4 nm determined by DLSwhich probes hydrodynamic diameter. This is not uncom-mon due to the deformation of the dendrimer upon surfaceimmobilization under ambient conditions [15–17, 28–30].G4-PAMAM-50PEG
1000dendrimers appear taller than the
G4-PAMAM-NH2core. Figure 3(b) is a topographical AFM
image containing G4-PAMAM-50PEG1000
. The dendrimerswere displaced in the upper left region, enabling accurateheight measurements, as shown for two representative G4-PAMAM-50PEG
1000in cursor 2. The average height of G4-
PAMAM-50PEG1000
measured from two experiments andmultiple images is 3.4 ± 1.2 nm, which is 1.2 nm taller thanthe core, G4-PAMAM-NH
2. As indicated by the increased
standard deviation relative to G4-PAMAM-NH2, the PEGy-
lated dendrimers have a far greater distribution of height,indicating a greater range of size and/or conformation uponsurface immobilization.
3.2. High-Resolution STM Imaging of PEGylated G4 Den-drimers. STM provides submolecular resolution characteri-zation of PEGylated dendrimers, revealing the morphologyand structure of the PEG chains. With the overall mor-phology of dendrimers established by AFM, we could useSTM to provide a more detailed look at the intramolecularstructure especially at PEG region. Although dendrimers arenot sufficiently conductive for direct STM imaging, our priorwork has indicated that STM conductivity may be enhancedby coordinating metal ions into the dendrimer [15–17]. Thiswork demonstrates that the same approach is effective toenable STM imaging of PEGylated dendrimers.
The G4-PAMAM-NH2structure was first characterized
without PEGylation. Figure 4(a) is a STM topographic imageof G4-PAMAM-NH
2. Individual dendrimers are clearly
resolved, at the coverage of submonolayer with sufficientinterparticle separation. At higher resolution shown inFigure 4(b), it is apparent that the geometry of surfaceimmobilized G4-PAMAM-NH
2adopts a very similar shape
to the most commonly known PAMAM dendrimers, G4-PAMAM-OH, which are ellipsoidal caps [15–17]. While thesedendrimers are considered to be nearly spherical in solution,the flattening and deformation from spherical geometry aredue to dendrimer-surface interaction.Thedendrimer-surfacecontact areas, as highlighted in red, of the three dendrimerswere measured as 7.7, 12.0, and 13.4 nm2. Intraparticularfeatures are also visible, such as the bright protrusions onthe surface of each dendrimer, which likely correspond toindividual NH
2termini, analogous to OH termini visualized
previously [16].Upon PEGylation, the STM images reveal significant
structural changes from that of core particles. Figure 4(c)is a typical high-resolution STM image for G4-PAMAM-50PEG
1000. The PAMAM cores of individual dendrimers are

6 Journal of Drug Delivery
0
2
4
0 100 200 300
Hei
ght (
nm)
Distance (nm)
2
1
(a) (b)
1 2
0
2
4
0 100 200
Hei
ght (
nm)
Distance (nm)
G4-PAMAM-NH2 G4-PAMAM-50PEG1000
100nm100nm
Figure 3: Height characterization of dendrimers without andwith PEGylation via nanoshaving. (a) A 300× 300 nm2 AFM topographic imageof a nanoshaved monolayer of G4-PAMAM-NH
2. The (a) inset is a 1.5 × 1.5 𝜇m AFM topographic image of the G4-PAMAM-NH
2surface
where a 0.5 × 0.5 𝜇m area was removed during nanoshaving to reveal the Au substrate. (b) A 400 × 400 nm2 AFM topographic image of ananoshaved monolayer of G4-PAMAM-50PEG
1000. The (b) inset is a 1.5 × 1.5𝜇m AFM topographic image of the G4-PAMAM-50PEG
1000
surface where a 0.5 × 0.5 𝜇m area was removed during nanoshaving to reveal the Au substrate. Cursor 1 reveals the height of individualG4-PAMAM-NH
2from image (a). From left to right, the gold substrate (gold), dendrimers displaced during nanoshaving (grey), and the
dendrimer monolayer (blue). Cursor 2 reveals the height of individual G4-PAMAM-50PEG1000
from image (b). From left to right, the goldsubstrate (gold), dendrimers displaced during nanoshaving (grey), and the dendrimer monolayer (red).
still visible, but the footprint or dendrimer-surface contactarea is interspersed with PEG chains spreading out and fillingthe space between dendrimers. At higher resolution the PEGare visualized more clearly, as shown in Figure 4(d). UnlikeG4-PAMAM-NH
2, the dendrimers are no longer ellipsoidal,
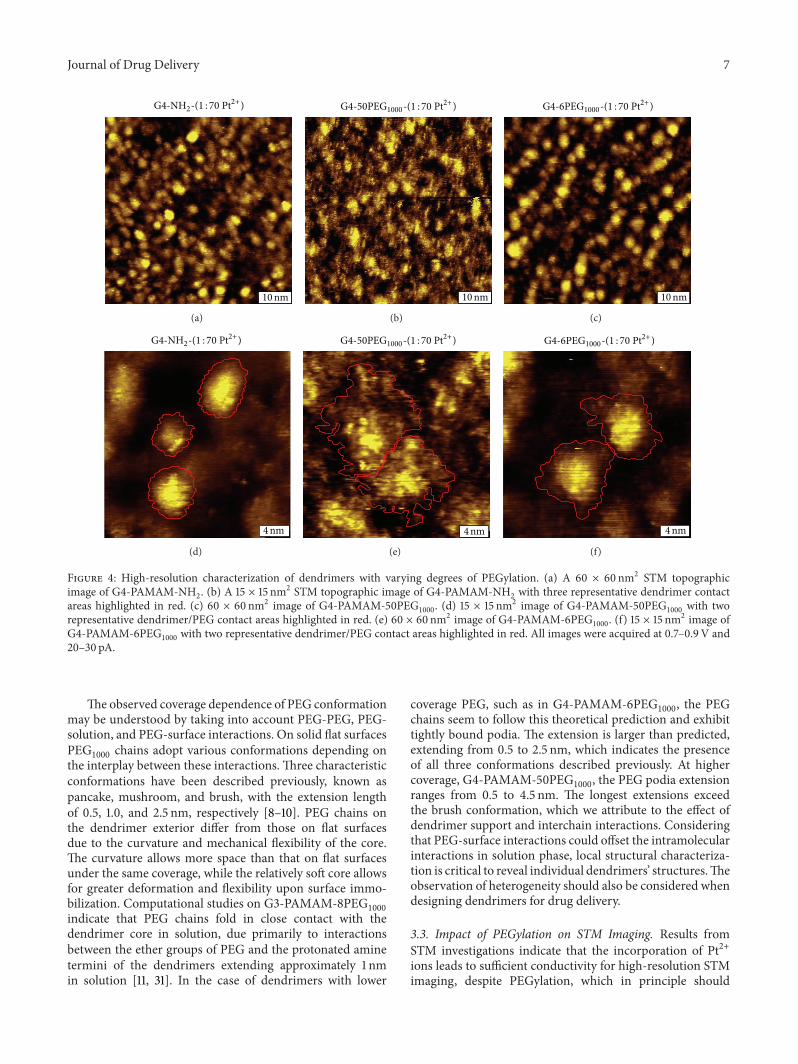
as the contact area adopts a more irregular geometry (seered lines tracing the boundaries). The periphery of thesedendrimers was determined using multiple cursor profilesto accurately determine the boundaries of each dendrimer.The contact area of the two PEGylated dendrimers is muchgreater than the corresponding core particles, measuring41.8 and 29.1 nm2, respectively. These high-resolution imagesreveal that the PEG presentation varies from dendrimerto dendrimer, which leads to a large variation in contactupon surface immobilization. As shown in Figure 4(d),the majority of the PEG chains extend as groups to formPEG “podia.” The PEG podia tend to fan out in regions ofbare substrate and bunch up near adjacent dendrimer PEGextensions. These PEG podia extend from 0.5 to 4.5 nm fromthe core contact region, which indicate variations in PEGconformation. Previous work indicated several conforma-tions adopted by PEG chains attached to solid substrates
[9, 10]. To our knowledge, results shown in Figure 4 representthe first observation of the PEG conformational variations inthe context of dendrimers.
In order to determine the effect of the packing densityof the PEG at the dendrimer surfaces, various PEG : coreratios were prepared. Figure 4(e) shows a STM topographof a low PEGylation, G4-PAMAM-6PEG
1000. The overall
morphology of G4-PAMAM-6PEG1000
closely resembles thatof G4-PAMAM-NH
2, as clearly defined ellipsoidal caps with
intraparticular features and protrusions visible. The degreeof spreading observed is shown in Figure 4(f), which fallsin between G4-PAMAM-50PEG
1000and G4-PAMAM-NH
2.
The dendrimer-surface contact area of the two representativeG4-PAMAM-6PEG
1000shown in Figure 4(f) measures 24.5
and 21.1 nm2, from left to right. The majority of the PEGchains are located close to the core. PEG podia appear shorterthan that in high PEG : core ratio cases with their extension0.5–2.0 nm from the PAMAM core. It is known that thepacking density of PEG chains on flat surfaces greatly impactstheir conformation [9, 13]. Our investigations indicate thatthis concept appears to be valid in the context of PEG chainsat the surface of PAMAM dendrimers.
Journal of Drug Delivery 7
10nm
G4-NH2-(1 : 70 Pt2+)
(a)
10nm
G4-50PEG1000-(1 : 70 Pt2+)
(b)
10nm
G4-6PEG1000-(1 : 70 Pt2+)
(c)
4nm
G4-NH2-(1 : 70 Pt2+)
(d)
4nm
G4-50PEG1000-(1 : 70 Pt2+)
(e)
4nm
G4-6PEG1000-(1 : 70 Pt2+)
(f)
Figure 4: High-resolution characterization of dendrimers with varying degrees of PEGylation. (a) A 60 × 60 nm2 STM topographicimage of G4-PAMAM-NH
2. (b) A 15 × 15 nm2 STM topographic image of G4-PAMAM-NH
2with three representative dendrimer contact
areas highlighted in red. (c) 60 × 60 nm2 image of G4-PAMAM-50PEG1000
. (d) 15 × 15 nm2 image of G4-PAMAM-50PEG1000
with tworepresentative dendrimer/PEG contact areas highlighted in red. (e) 60 × 60 nm2 image of G4-PAMAM-6PEG
1000. (f) 15 × 15 nm2 image of
G4-PAMAM-6PEG1000
with two representative dendrimer/PEG contact areas highlighted in red. All images were acquired at 0.7–0.9 V and20–30 pA.
The observed coverage dependence of PEG conformationmay be understood by taking into account PEG-PEG, PEG-solution, and PEG-surface interactions. On solid flat surfacesPEG1000
chains adopt various conformations depending onthe interplay between these interactions. Three characteristicconformations have been described previously, known aspancake, mushroom, and brush, with the extension lengthof 0.5, 1.0, and 2.5 nm, respectively [8–10]. PEG chains onthe dendrimer exterior differ from those on flat surfacesdue to the curvature and mechanical flexibility of the core.The curvature allows more space than that on flat surfacesunder the same coverage, while the relatively soft core allowsfor greater deformation and flexibility upon surface immo-bilization. Computational studies on G3-PAMAM-8PEG
1000
indicate that PEG chains fold in close contact with thedendrimer core in solution, due primarily to interactionsbetween the ether groups of PEG and the protonated aminetermini of the dendrimers extending approximately 1 nmin solution [11, 31]. In the case of dendrimers with lower
coverage PEG, such as in G4-PAMAM-6PEG1000
, the PEGchains seem to follow this theoretical prediction and exhibittightly bound podia. The extension is larger than predicted,extending from 0.5 to 2.5 nm, which indicates the presenceof all three conformations described previously. At highercoverage, G4-PAMAM-50PEG
1000, the PEG podia extension
ranges from 0.5 to 4.5 nm. The longest extensions exceedthe brush conformation, which we attribute to the effect ofdendrimer support and interchain interactions. Consideringthat PEG-surface interactions could offset the intramolecularinteractions in solution phase, local structural characteriza-tion is critical to reveal individual dendrimers’ structures.Theobservation of heterogeneity should also be considered whendesigning dendrimers for drug delivery.
3.3. Impact of PEGylation on STM Imaging. Results fromSTM investigations indicate that the incorporation of Pt2+ions leads to sufficient conductivity for high-resolution STMimaging, despite PEGylation, which in principle should
8 Journal of Drug Delivery
2
5
1
4
3
6
(a)
(d)
(b)
(e)
(c)
(f)
5nm 5nm 5nm
5nm5nm5nm
G4-PAMAM-NH2G4-PAMAM-50PEG1000 G4-PAMAM-6PEG1000
G4-PAMAM-NH2G4-PAMAM-50PEG1000 G4-PAMAM-6PEG1000
0.0
0.2
0.4
0.6
0 5 10 15Distance (nm)
0 5 10 15Distance (nm)
3
6
0.0
0.2
0.4
0.6
0 5 10 15Distance (nm)
0 5 10 15Distance (nm)
2
5
0.0
0.2
0.4
0.6
0.0
0.2
0.4
0.6
0 5 10 15Distance (nm)
0 5 10 15Distance (nm)
1
4
0.0
0.2
0.4
0.6
0.0
0.2
0.4
0.6
(1: 70
Pt2+)
(1: 70
Pt2+)
(1: 700
Pt2+)
(1: 700
Pt2+)
hA
PP(n
m)
hA
PP(n
m)
hA
PP(n
m)
hA
PP(n
m)
hA
PP(n
m)
hA
PP(n
m)
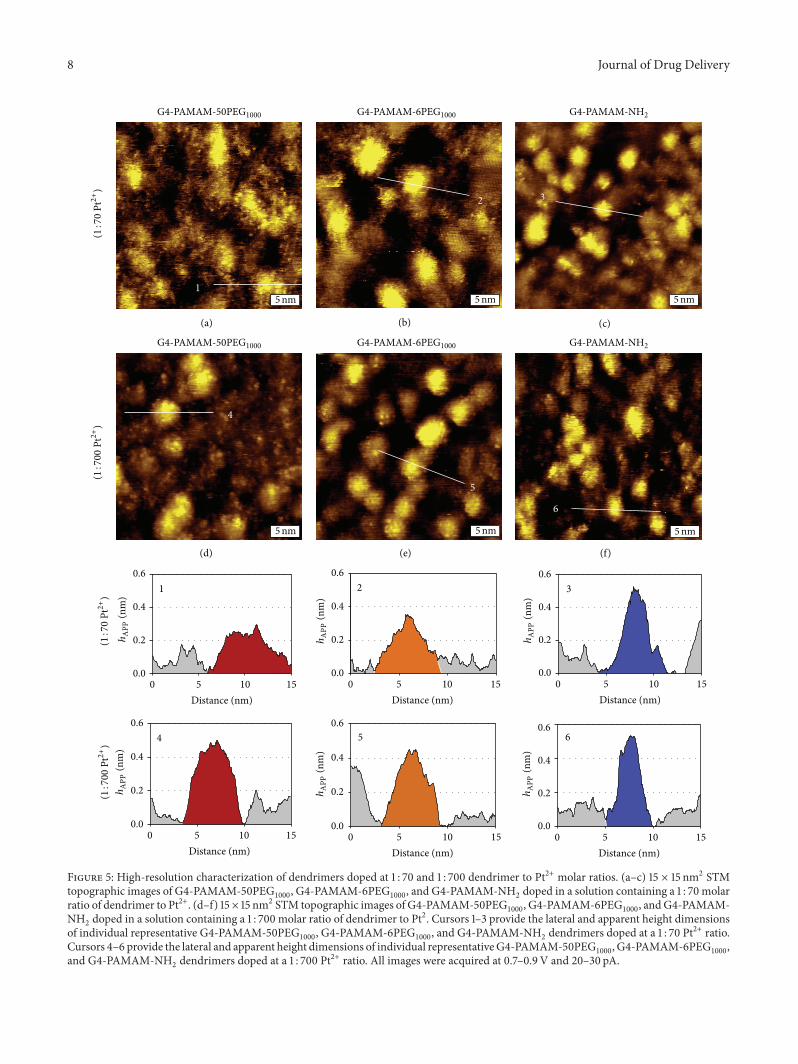
Figure 5: High-resolution characterization of dendrimers doped at 1 : 70 and 1 : 700 dendrimer to Pt2+ molar ratios. (a–c) 15 × 15 nm2 STMtopographic images of G4-PAMAM-50PEG
1000, G4-PAMAM-6PEG
1000, and G4-PAMAM-NH
2doped in a solution containing a 1 : 70 molar
ratio of dendrimer to Pt2+. (d–f) 15 × 15 nm2 STM topographic images of G4-PAMAM-50PEG1000
, G4-PAMAM-6PEG1000
, andG4-PAMAM-NH2doped in a solution containing a 1 : 700 molar ratio of dendrimer to Pt2. Cursors 1–3 provide the lateral and apparent height dimensions
of individual representative G4-PAMAM-50PEG1000
, G4-PAMAM-6PEG1000
, and G4-PAMAM-NH2dendrimers doped at a 1 : 70 Pt2+ ratio.
Cursors 4–6 provide the lateral and apparent height dimensions of individual representativeG4-PAMAM-50PEG1000
, G4-PAMAM-6PEG1000
,and G4-PAMAM-NH
2dendrimers doped at a 1 : 700 Pt2+ ratio. All images were acquired at 0.7–0.9V and 20–30 pA.

Journal of Drug Delivery 9
hinder metal ion doping. In comparison to PAMAM den-drimers, the incorporation of metal ions follows slowerkinetics. In the case of G4-PAMAM-OH, for example, eachdendrimer was saturated by Pt2+ within 48 hrs, under 1 : 70dendrimer : Pt2+ molar ratio, at a 1𝜇M concentration [16].The resulting increase in tunneling probability allowed forhigh-resolution STM imaging, which could resolve individ-ual dendrimer termini [15–17]. Under identical conditions,G4-PAMAM-NH
2also yielded high-resolution STM images,
as shown in Figures 4(b) and 5(c). In the presence of aPEG coating high-resolution is still provided; however, theapparent height, or ℎAPP, is lower, as shown in Figures 5(a)–5(c) and cursors 1–3. The average ℎAPP of G4-PAMAM-NH2is 0.42 ± 0.11 nm, whereas the ℎAPP for G4-PAMAM-
6PEG1000
and G4-PAMAM-50PEG1000
is 0.38 ± 0.13 nmand 0.32 ± 0.07 nm, respectively. We infer that the metalion concentration inside G4-PAMAM-50PEG
1000and G4-
PAMAM-6PEG1000
dendrimers is lower than G4-PAMAM-NH2, leading to a lower local density of states and therefore
ℎAPP. To increase the metal ion coordination within thedendrimers, the dendrimer : Pt2+ molar ratio was increasedfrom 1 : 70 to 1 : 700, and the results are shown in Figures5(d)–5(f) and cursors 4–6. At a higher Pt2+ ratio, the averageℎAPP of G4-PAMAM-NH
2, G4-PAMAM-6PEG
1000, and G4-
PAMAM-50PEG1000
increased to 0.51 ± 0.07 nm, 0.45 ±0.12 nm, and 0.56 ± 0.04 nm, respectively. In the case ofG4-PAMAM-NH
2, the average ℎAPP increases only 17%,
indicating that the intraparticulate Pt2+ concentration is verysimilar under the two concentrations. This is in contrast toG4-PAMAM-50PEG
1000, where the ℎAPP increases by 43%.
It is important to note here that a height increase was notobserved, as measured by AFM, for any of the dendrimerswhen the Pt2+ ratio was increased. Thus, by increasing thePt2+ concentration, the metal ions were able to penetratethe PEG coating and coordinate with the amines within thedendrimer core to a greater extent. Since the G4-PAMAM-NH2dendrimer is already nearly saturated at the lower Pt2+
concentration the effect on ℎAPP is relatively small as com-pared to the highly PEGylated dendrimer.These observationsshould shed light when using dendrimers as drug deliveryvehicles, as the coating may change the pharmacokineticbehavior.
4. Conclusions
Using AFM and STM, we have characterized themorphologyand structure of PEGylated dendrimers. AFM investigationallows for the visualization of individual dendrimers onsurfaces and provides accurate height measurements. Inaddition, AFM studies reveal that the PAMAM core andPEG shell can be visualized under tapping mode imaging toascertain the uniformity and distribution of PEGylation onindividual dendrimers. Further, the results indicate that PEGchains among adjacent dendrimers could interdigitate, incontrast to the dendrimer cores. STM imaging enables directvisualization of the PEG extensions with high-resolution.ThePEG chains at the exterior PAMAM cores adopt various con-formations including pancake,mushroom, and brush, similar
to that at the solid and flat surfaces. Unique to high coveragePEGylated dendrimers, a greater variation in PEG structureand degree of extension is observedwith the PEGpodia, up to4.5 nm from the core. To the best of our knowledge, this workis among the first to reveal high-resolution information onthe local structure of PEGylated dendrimers. Collectively, thisinvestigation provides important insight into the structureof coated dendrimers, which shall be important to guidethe design and development of better drug delivery vehicles.Work is in progress to correlate structural information withthe efficacy of drug delivery.
Conflict of Interests
All the authors of this paper declare that there is no conflictof interests with any financial organization regarding thematerial discussed in this paper.
Acknowledgments
This work is supported by NSF (CHE-0809977, DMR-1104260, and CBET-0933144), W. M. Keck Foundation, andNano@WSU Incubator.The authors thank Dr. Chris Flemingof BST NanoCarbon, Ms. Susan Stagner, and Drs. MingZhang and Jianli Zhao of UCDavis for helpful discussion andassistance in paper preparation.
References
[1] U. Gupta, H. B. Agashe, A. Asthana, and N. K. Jain,“Dendrimers: novel polymeric nanoarchitectures for solubilityenhancement,” Biomacromolecules, vol. 7, no. 3, pp. 649–658,2006.
[2] A. R. Menjoge, R. M. Kannan, and D. A. Tomalia, “Dendrimer-based drug and imaging conjugates: design considerations fornanomedical applications,”Drug Discovery Today, vol. 15, no. 5-6, pp. 171–185, 2010.
[3] S. Svenson and D. A. Tomalia, “Dendrimers in biomedicalapplications—reflections on the field,” Advanced Drug DeliveryReviews, vol. 57, no. 15, pp. 2106–2129, 2005.
[4] R. Jevprasesphant, J. Penny, R. Jalal, D. Attwood, N. B. McKe-own, and A. D’Emanuele, “The influence of surface modifica-tion on the cytotoxicity of PAMAM dendrimers,” InternationalJournal of Pharmaceutics, vol. 252, no. 1-2, pp. 263–266, 2003.
[5] S. Brocchini, A. Godwin, S. Balan, J.-W. Choi, M. Zloh, andS. Shaunak, “Disulfide bridge based PEGylation of proteins,”Advanced Drug Delivery Reviews, vol. 60, no. 1, pp. 3–12, 2008.
[6] B. A. Luxon, M. Grace, D. Brassard, and R. Bordens, “Pegylatedinterferons for the treatment of chronic hepatitis C infection,”Clinical Therapeutics, vol. 24, no. 9, pp. 1363–1383, 2002.
[7] C. D. Walkey, J. B. Olsen, H. Guo, A. Emili, andW. C. W. Chan,“Nanoparticle size and surface chemistry determine serumprotein adsorption and macrophage uptake,” Journal of theAmerican Chemical Society, vol. 134, no. 4, pp. 2139–2147, 2012.
[8] W. Li, P. Zhan, E. De Clercq, H. Lou, and X. Liu, “Current drugresearch on PEGylation with small molecular agents,” Progressin Polymer Science, vol. 38, no. 3-4, pp. 421–444, 2013.
[9] V. B. Damodaran, C. J. Fee, T. Ruckh, and K. C. Popat,“Conformational studies of covalently grafted poly(ethyleneglycol) on modified solid matrices using X-ray photoelectronspectroscopy,” Langmuir, vol. 26, no. 10, pp. 7299–7306, 2010.

10 Journal of Drug Delivery
[10] Y. Hu, J. Jin, Y. Han, J. Yin, W. Jiang, and H. Liang, “Studyof fibrinogen adsorption on poly(ethylene glycol)-modifiedsurfaces using a quartz crystal microbalance with dissipationand a dual polarization interferometry,” RSC Advances, vol. 4,no. 15, pp. 7716–7724, 2014.
[11] L. Yang and S. R. P. da Rocha, “PEGylated, NH2-terminated
PAMAM dendrimers: a microscopic view from atomistic com-puter simulations,” Molecular Pharmaceutics, vol. 11, no. 5, pp.1459–1470, 2014.
[12] C. Kojima, K. Kono, K. Maruyama, and T. Takagishi, “Synthesisof polyamidoamine dendrimers having poly(ethylene glycol)grafts and their ability to encapsulate anticancer drugs,” Biocon-jugate Chemistry, vol. 11, no. 6, pp. 910–917, 2000.
[13] Y. Kim, A. M. Klutz, and K. A. Jacobson, “Systematic investi-gation of polyamidoamine dendrimers surface-modified withpoly(ethylene glycol) for drug delivery applications: synthesis,characterization, and evaluation of cytotoxicity,” BioconjugateChemistry, vol. 19, no. 8, pp. 1660–1672, 2008.
[14] H. Lee and R. G. Larson, “Molecular dynamics study ofthe structure and interparticle interactions of polyethyleneglycol-conjugatedPAMAMdendrimers,”TheJournal of PhysicalChemistry B, vol. 113, no. 40, pp. 13202–13207, 2009.
[15] C. J. Fleming, N.-N. Yin, S. L. Riechers, G. Chu, and G.-Y.Liu, “High-resolution imaging of the intramolecular structureof indomethacin-carrying dendrimers by scanning tunnelingmicroscopy,” ACS Nano, vol. 5, no. 3, pp. 1685–1692, 2011.
[16] C. J. Fleming, Y. X. Liu, Z. Deng, and G.-Y. Liu, “Deformationand hyperfine structures of dendrimers investigated by scan-ning tunneling microscopy,” The Journal of Physical ChemistryA, vol. 113, no. 16, pp. 4168–4174, 2009.
[17] L. Shi, C. J. Fleming, S. L. Riechers et al., “High-resolutionimaging of dendrimers used in drug delivery via scanning probemicroscopy,” Journal of Drug Delivery, vol. 2011, Article ID254095, 12 pages, 2011.
[18] A. Riposan, Y. Li, Y. H. Tan, G. Galli, and G.-Y. Liu, “Structuralcharacterization of aldehyde-terminated self-assembled mono-layers,” Journal of Physical Chemistry A, vol. 111, no. 49, pp.12727–12739, 2007.
[19] G. Yang and G.-Y. Liu, “New insights for self-assembledmonolayers of organothiols on Au(111) revealed by scanningtunneling microscopy,”The Journal of Physical Chemistry B, vol.107, no. 34, pp. 8746–8759, 2003.
[20] J. P. Cleveland, S. Manne, D. Bocek, and P. K. Hansma, “Anondestructive method for determining the spring constant ofcantilevers for scanning force microscopy,” Review of ScientificInstruments, vol. 64, no. 2, pp. 403–405, 1993.
[21] V. Lulevich, T. Zink, H.-Y. Chen, F.-T. Liu, and G.-Y. Liu,“Cell mechanics using atomic force microscopy-based single-cell compression,” Langmuir, vol. 22, no. 19, pp. 8151–8155, 2006.
[22] S. Xu andG.-Y. Liu, “Nanometer-scale fabrication by simultane-ous nanoshaving and molecular self-assembly,” Langmuir, vol.13, no. 2, pp. 127–129, 1997.
[23] X.-D. Xiao, G.-Y. Liu, D. H. Charych, and M. Salmeron,“Preparation, structure, and mechanical stability of alkylsilanemonolayers on mica,” Langmuir, vol. 11, no. 5, pp. 1600–1604,1995.
[24] G. Bar, Y. Thomann, R. Brandsch, H.-J. Cantow, and M.-H. Whangbo, “Factors affecting the height and phase imagesin tapping mode atomic force microscopy. Study of phase-separated polymer blends of poly(ethene-co-styrene) andpoly(2,6-dimethyl-1,4-phenylene oxide),” Langmuir, vol. 13, no.14, pp. 3807–3812, 1997.
[25] R. Brandsch, G. Bar, and M.-H. Whangbo, “On the factorsaffecting the contrast of height and phase images in tappingmode atomic force microscopy,” Langmuir, vol. 13, no. 24, pp.6349–6353, 1997.
[26] R. Garcıa and R. Perez, “Dynamic atomic force microscopymethods,” Surface Science Reports, vol. 47, no. 6–8, pp. 197–301,2002.
[27] S. N.Magonov andD.H. Reneker, “Characterization of polymersurfaces with atomic force microscopy,” Annual Review ofMaterials Science, vol. 27, no. 1, pp. 175–222, 1997.
[28] A. Mecke, I. Lee, J. R. Baker Jr., M. M. B. Holl, and B. G.Orr, “Deformability of poly(amidoamine) dendrimers,” TheEuropean Physical Journal E, vol. 14, no. 1, pp. 7–16, 2004.
[29] Y. Gu, H. Xie, J. Gao et al., “AFM characterization of dendrimer-stabilized platinum nanoparticles,” Langmuir, vol. 21, no. 7, pp.3122–3131, 2005.
[30] R. W. J. Scott, O. M. Wilson, and R. M. Crooks, “Synthesis,characterization, and applications of dendrimer-encapsulatednanoparticles,”The Journal of Physical Chemistry B, vol. 109, no.2, pp. 692–704, 2005.
[31] I. Lee, B. D. Athey, A. W. Wetzel, W. Meixner, and J. R. BakerJr., “Structural molecular dynamics studies on polyamidoaminedendrimers for a therapeutic application: effects of pH andgeneration,”Macromolecules, vol. 35, no. 11, pp. 4510–4520, 2002.

Submit your manuscripts athttp://www.hindawi.com
PainResearch and TreatmentHindawi Publishing Corporationhttp://www.hindawi.com Volume 2014
The Scientific World JournalHindawi Publishing Corporation http://www.hindawi.com Volume 2014
Hindawi Publishing Corporationhttp://www.hindawi.com
Volume 2014
ToxinsJournal of
VaccinesJournal of
Hindawi Publishing Corporation http://www.hindawi.com Volume 2014
Hindawi Publishing Corporationhttp://www.hindawi.com Volume 2014
AntibioticsInternational Journal of
ToxicologyJournal of
Hindawi Publishing Corporationhttp://www.hindawi.com Volume 2014
StrokeResearch and TreatmentHindawi Publishing Corporationhttp://www.hindawi.com Volume 2014
Drug DeliveryJournal of
Hindawi Publishing Corporationhttp://www.hindawi.com Volume 2014
Hindawi Publishing Corporationhttp://www.hindawi.com Volume 2014
Advances in Pharmacological Sciences
Tropical MedicineJournal of
Hindawi Publishing Corporationhttp://www.hindawi.com Volume 2014
Medicinal ChemistryInternational Journal of
Hindawi Publishing Corporationhttp://www.hindawi.com Volume 2014
AddictionJournal of
Hindawi Publishing Corporationhttp://www.hindawi.com Volume 2014
Hindawi Publishing Corporationhttp://www.hindawi.com Volume 2014
BioMed Research International
Emergency Medicine InternationalHindawi Publishing Corporationhttp://www.hindawi.com Volume 2014
Hindawi Publishing Corporationhttp://www.hindawi.com Volume 2014
Autoimmune Diseases
Hindawi Publishing Corporationhttp://www.hindawi.com Volume 2014
Anesthesiology Research and Practice
ScientificaHindawi Publishing Corporationhttp://www.hindawi.com Volume 2014
Journal of
Hindawi Publishing Corporationhttp://www.hindawi.com Volume 2014
Pharmaceutics
Hindawi Publishing Corporationhttp://www.hindawi.com Volume 2014
MEDIATORSINFLAMMATION
of