research article earthquake performance of concrete slab …
TRANSCRIPT

641
Sigma J Eng & Nat Sci 37 (2), 2019, 641-674
Research Article
EARTHQUAKE PERFORMANCE OF CONCRETE SLAB ON CONCRETE
FACED ROCKFILL DAM INCLUDING HYDRODYNAMIC EFFECTS
Murat Emre KARTAL*1
1Izmir Democracy University, Department of Civil Engineering, IZMIR; ORCID: 0000-0003-3896-3438
Received: 16.01.2019 Revised: 03.05.2019 Accepted: 17.05.2019
ABSTRACT
Concrete faced rockfill (CFR) dams are usually designed ignoring hydrodynamic pressures and also friction
between the concrete slab and the rockfill. In this study, this combination is considered under seismic
excitations. The main goal of the study is to investigate earthquake performance of concrete slab on CFR dam comprehensively. For this purpose, two dimensional finite element model of Torul CFR Dam is employed.
Concrete slab-rockfill interface is considered as including welded contact (Case 1) and friction contact (Case
2) in finite element analyses. Earthquake performance of the concrete slab is determined according to empty
and full reservoir cases. Hydrodynamic pressure of reservoir water is considered using fluid finite elements
based on the Lagrangian approach. In the materially nonlinear time-history analyses, the Drucker-Prager
model is utilized for concrete slab and multi-linear kinematic hardening model is utilized for rockfill zones and foundation rock. East-west component of 1992 Erzincan earthquake is used in seismic analyses.
Earthquake record with peak ground acceleration (pga) of 0.496 g is scaled to 0.1 g, 0.2 g, 0.3 g and 0.4 g in
time-history analyses. It is seen that earthquake performance of the concrete slab is depended on the magnitude enormity of the earthquake. As the pga of the earthquake increase, earthquake performance of the
concrete slab decrease. Although hydrodynamic pressure has fairly less effect on earthquake performance of
the concrete slab in Case 1, it has apparent influence in Case 2. Keywords: Concrete faced rockfill dam, Drucker-Prager model, friction contact, lagrangian approach, multi-
linear kinematic hardening model.
1. INTRODUCTION
Concrete-faced rockfill (CFR) dams are known to be safe under seismic excitations because
they do not suffer porewater development. The main concern with CFR dams is the earthquake
performance of the concrete slab [1-8]. If friction contact in the concrete slab-rockfill interface is
considered instead of welded contact, the earthquake performance of the concrete slab can be
determined more realistically. There is little study concerning seismic analyses of CFR dams in
which friction between the concrete slab and rockfill is considered [5,9-10].
Though CFR dams involve fluid-structure-foundation interaction problems, hydrodynamic
pressures on the concrete slab have not been taken into account in the preceding studies.
However, hydrodynamic pressure effects on the dynamic response of dams have been
investigated since the 1930’s [11-21].
* Corresponding Author: e-mail: [email protected], tel: (232) 260 10 01 / 417
Sigma Journal of Engineering and Natural Sciences
Sigma Mühendislik ve Fen Bilimleri Dergisi

642
In the recent years, the r esponse of CFR dams is still research matter for the researchers. The
deformations in CFR dams are investigated according to linear and non-linear behaviour under
ground motion effect. Besides deformation behavior is also determined for various joints
including welded and friction contact for empty and full reservoir condition [22]. Abedian et al.
[23] evaluated the long-term stability of a concrete faced rockfill dam. Their study showed that
the number of construction layers used in the modeling of the dam had an important effect on the
maximum deformation. Kartal [24] also investigated the horizontal accelerations and peak
accelerations amplification coefficients occurred in a CFR dam to deconvolved ground motion
considering viscous boundary conditions. His study indicates that horizontal accelerations and
peak acceleration amplification coefficients increase when the rockfill is linear and welded
contact existed in the joints.
There is an obvious necessity to assess the earthquake performance of concrete slab on CFR
dams considering friction in the concrete slab-rockfill interface and hydrodynamic pressures
under seismic excitations. In this study, welded contact and friction contact in the concrete slab-
rockfill interface are considered in two dimensional finite element models of the Torul CFR Dam
located in Torul, Gumushane. Empty and full reservoir cases are also taken into account in the
seismic analyses. The hydrodynamic pressure of the reservoir water is considered by the
Lagrangian approach. Linear and nonlinear time-history analyses are performed to determine the
earthquake performance of the concrete slab. The Drucker-Prager model is used for the concrete
slab and multi-linear kinematic hardening model is used for rockfill and foundation rock in
nonlinear analyses. The East-West component of 1992 Erzincan earthquake acceleration record
with peak ground acceleration (pga) of 0.496 g is utilized in performance analyses by scaling the
pga to 0.1 g, 0.2 g, 0.3 g and 0.4 g.
2. FORMULATION OF FLUID-STRUCTURE-FOUNDATION INTERACTION BY THE
LAGRANGIAN APPROACH
The formulation of the fluid system based on the Lagrangian approach is presented as follows
[25]. In this approach, the fluid is assumed to be linearly elastic, inviscid and irrotational. For a
general two-dimensional fluid, the stress-strain relationships can be written in matrix form as
follows,
=z
wvε
22C0
011
C
zP
P (1)
where P, C11, and v are respectively, the pressure which is equal to the mean stress, the bulk
modulus and the volumetric strain of the fluid. Pz, is the rotational stresses; C22, is the constraint
parameter and wz is the rotation about the z Cartesian axis. Since irrotationality of the fluid is
considered like penalty methods [26,27], rotations and constraint parameters are included in the
stress-strain equation (Eq. (1)) of the fluid.
In this study, the equations of motion of the fluid system are obtained using energy principles.
Using the finite element approximation, the total strain energy of the fluid system may be written
as,
ffTf UKU
2
1eπ = (2)
where Uf and Kf are the nodal displacement vector and the stiffness matrix of the fluid
system, respectively. Kf is obtained as the sum of the stiffness matrices of the fluid elements as
follows,
M.E. Kartal / Sigma J Eng & Nat Sci 37 (2), 641-674, 2019

643
=
=
V
eeff
Tef
ef
eff
dVBCBK
KK
(3)
where Cf is the elasticity matrix consisting of the diagonal terms in Eq. (1) and e
fB is the
strain-displacement matrix of the fluid element.
If the Lagrange’s equations [28] are considered the following equations of motions are
obtained,
ff*fff RUKUM =+ (4)
where *
fK , Üf , Uf and Rf are, respectively, the system stiffness matrix including the free
surface stiffness, the nodal acceleration and displacement vectors, and nodal force vector for the
fluid system. In the formation of the fluid element matrices, reduced integration orders are used
[25].
The equations of motion of the fluid system, Eq. (4), have a form similar to those of the
structural system. To obtain the coupled equations of the fluid-structure system, the determination
of the interface condition is required. Since the fluid is assumed to be inviscid, only the
displacement in the normal direction to the interface is continuous at the interface of the system.
Assuming that the positive face corresponds to the structure and the negative face is assigned the
fluid, the boundary condition at the fluid-structure interface is,
+− = nn UU (5)
where Un is the normal component of the interface displacement [29]. Using the interface
condition, the equations of motion of the coupled system subjected to a ground motion with
damping effects included are given by,
ccccccc RUKUCUM =++ (6)
in which Mc, Cc, and Kc are the mass, damping and stiffness matrices for the coupled system,
respectively. Uc, cU , cU and Rc are the vectors of the displacements, velocities, accelerations
and external loads of the coupled system, respectively.
3. STRUCTURAL PERFORMANCE AND DAMAGE CRITERIA FOR DAMS
Linear time-history analysis is used to formulate a systematic and rational methodology for
qualitative estimate of the level of damage. In linear time-history analysis, where acceleration
time-histories are the seismic input, deformations, stresses and section forces are computed in
accordance with the elastic stiffness characteristics of various components in time domain. A
systematic evaluation of these results in terms of the demand-capacity ratios (D/C), cumulative
duration, spatial extent of overstressed regions, and consideration of possible failure modes
comprise the basis for approximation and appraisal of probable level of damage. The damage for
structural performance amounts to cracking of the concrete, opening of construction joints, and
yielding of the reinforcing steel. If the estimated level of damage falls below the acceptance curve
for a particular type of structure, the damage is considered to be low and linear time-history
analysis will be sufficient. Otherwise the damage is considered to be severe in which case
nonlinear time-history analysis would be required to estimate damage more accurately [30].
Earthquake Performance of Concrete Slab on … / Sigma J Eng & Nat Sci 37 (2), 641-674, 2019

644
3.1. Performance Criteria for Linear and Nonlinear Analysis
The dam response to the maximum design earthquake is considered to be within the linear
elastic range of behavior with little or no possibility of damage if the computed demand-capacity
ratios are less than or equal to 1.0. The stage of nonlinear response or opening and cracking of
joints is considered acceptable if demand-capacity ratio is less than 2 and the cumulative duration
falls below the performance curve given in Fig. 1. The earthquake performance curves are
developed for the concrete gravity dams and arch dams. This study considers earthquake
performance curve belong to the concrete gravity dams [31]. If the cumulative duration for the
concrete slab of the concrete faced rockfill dam is determined, the earthquake performance of the
concrete faced rockfill dams can be obtained more realistically.
3.2. Demand-Capacity Ratios
The demand-capacity ratios for CFR dams are defined as the ratio of the computed principal
tensile stresses to the tensile strength of the concrete. As discussed previously demand-capacity
ratio is limited to 2.0, thus permitting stresses double up to the static or the level of dynamic
tensile strength of the concrete. The cumulative duration beyond a certain level of demand-
capacity ratio is obtained by multiplying the number of stress values exceeding that level of
tensile strength by the time-step of the time-history analysis. The cumulative duration in Figure 1
refers to the total duration of all stress excursions beyond a certain level of demand-capacity ratio.
Although tensile strength of concrete is affected by the rate of seismic loading, the acceptance
criteria employ stable tensile strength in the computation of the demand-capacity ratios. The
reason for this is to account for the lower strength of the lift lines and to provide some level of
conservatism in the estimation of damage using the results of linear elastic analysis.
Figure 1. Assumed performance curve [31].
0
0,03
0,06
0,09
0,12
0,15
0,18
0,21
0,24
0,27
0,3
0,33
0,36
1 1,1 1,2 1,3 1,4 1,5 1,6 1,7 1,8 1,9 2
Cu
mu
lati
ve
Du
rati
on
(s)
Demand-Capacity Ratio
May require nonlinear
analysis
to estimate damage
Acceptable damage
based on linear analysis
M.E. Kartal / Sigma J Eng & Nat Sci 37 (2), 641-674, 2019

645
4. MATHEMATICAL MODEL OF THE TORUL CFR DAM
4.1. The Torul Dam
Torul CFR Dam (Fig. 2) is sited on the Harsit River and approximately 14 km northwest of
Torul, Gumushane, Turkey. Torul Dam was built by General Directorate of State Hydraulic
Works in 2007 [32]. The reservoir is used for power generation. The volume of the dam body is
4.6 hm3 and the lake area of the dam at the normal water level is 3.62 km2. The annual total power
generation capacity is 322.28 GW. The length of the dam crest and its width are 320 m and 12 m,
respectively. The maximum height and base width are 142 m and 420 m, respectively. The
thickness of the concrete slab is 0.3 m at the crest level and 0.7 m at the foundation level. The
concrete slab has high seepage resistance. The dimensions of the dam at the largest cross section
are shown in Fig. 3.
Figure 2. Torul CFR Dam.
Earthquake Performance of Concrete Slab on … / Sigma J Eng & Nat Sci 37 (2), 641-674, 2019

646
Figure 3. The two dimensional largest cross section of Torul dam body [32].
4.2. Material Properties
The Torul Dam body consists of a concrete face slab and five rockfill zones: 2A, 3A, 3B, 3C,
3D, respectively, from upstream toward downstream. These zones are arranged from thin granules
to thick particles in upstream-downstream direction. The material properties of the dam and the
reservoir water used in linear and nonlinear analyses are presented in Tab. 1. The concrete slab
has high resistance to water penetration. In addition, the tensile and compression strengths of the
concrete are 1.6 MPa and 20 MPa, respectively. Besides, the cohesion and angle of internal
friction of the concrete is 2500 kN/m² and 30°, respectively
Table 1. Material properties of Torul CFR Dam [32].
Material Material Properties
Modulus of
Elasticity
×107 kN/m2
Poisson’s Ratio
Mass per unit Vol.
kg/m3
Cohesio
n
kN/m2
Angle of
internal
friction
Concrete 2.800 0.20 2395.5 2500 30
2A (sifted rock or alluvium) 0.040 0.36 1880.0 - -
3A (filling with selected rock) 0.030 0.36 1870.0 - -
3B (filling with quarry rock) 0.025 0.32 1850.0 - -
3C (filling with quarry rock) 0.020 0.32 1850.0 - -
3D (filling with selected rock) 0.040 0.26 1800.0 - -
Foundation Soil (volcanic tufa) 1.036 0.17 - - -
Foundation Soil (limestone) 1.206 0.18 - - -
Reservoir 0.207 - 1000 - -
4.3. Finite Element Model
In this study, ANSYS program is used in the finite element analyses. ANSYS has capability
of computing non-linear response of the structures and fluid-structure-foundation interaction. The
two dimensional dam-reservoir-foundation finite element model used in analyses is shown in Fig.
4. In this model, the dam body has 592 solid finite elements (Plane42), the foundation soil has
656 solid finite elements (Plane42) and the reservoir water has 495 fluid finite elements (Fluid
M.E. Kartal / Sigma J Eng & Nat Sci 37 (2), 641-674, 2019

647
79). In addition to these elements, 16 interface elements (Inter192) are defined between the
concrete slab and the rockfill. The numbers of nodal points of the dam body, foundation soil and
reservoir water are 663, 747 and 544, respectively. The solid finite elements used in the analyses
have four nodes and 2x2 integration points and the fluid finite elements have four nodes and 1x1
integration point. The element matrices are computed using the Gauss numerical integration
technique [25]. The Rayleigh damping model is considered in all finite element analyses with a
5% damping ratio.
Foundation soil is assumed as massless and its damping effects are ignored in all analyses
since the earthquake acceleration record acquired from the ground surface. Therefore, soil affects
the earthquake response of the dam with its rigidity. The length of the reservoir and the
foundation soil in the upstream direction is taken three times of the dam height to represent
infinite reservoir condition. In addition, the total height of the soil layers and the foundation
length at downstream side are taken into account as the dam height. In the finite element models,
all degrees of freedom at boundary of the foundation soil are fixed. Besides, at the end of the
reservoir only the horizontal degrees of freedom are restrained to allow sloshing waves.
When the Lagrangian approach is used to model reservoir water, interface condition of the
fluid-structure interaction system requires a different sensitivity. At the interface of the fluid-
structure interaction system, only the displacements in normal direction to the interface are
considered to be compatible in the structure as well as in the fluid. Therefore, the displacements
in normal direction to the reservoir-dam and reservoir-soil interface are coupled. Coupling length
in these interfaces is chosen as 1 mm and 50 numbers of couplings were defined in the dam-soil-
reservoir model.
Figure 4. The two dimensional finite element model of Torul Dam.
Earthquake Performance of Concrete Slab on … / Sigma J Eng & Nat Sci 37 (2), 641-674, 2019

648
4.4. Concrete Slab - Rockfill Interface
The earthquake response of the concrete slab mostly depends upon its contact to the rockfill.
The joint can be modeled as welded contact and friction contact (Fig. 5). Because concrete slab is
not directly in contact with the rockfill, using interface elements in the finite element analysis can
produce more rational results. By means of this element, the concrete slab may slide over the
rockfill. In this study, the concrete slab and rockfill are assumed as independent deformable
bodies and they can also be considered as dependent deformable bodies by considering welded
contact. The interface element used in this study has four nodes and two integration points.
Figure 5. Schematic representations of contact types: a) welded contact and b) friction contact.
The interface element used in this study has four node and two integration points [33]. The
element width was considered only 1 mm in this study. The stable stiffness, maximum tension
stress allowed and transverse shear stiffness of the joint material were assumed as 2×10⁷ kN/m,
2×10⁸ kN/m2 and 1.8×10³ kN/m respectively.
4.5. Non-linear Response of CFR Dams
The Drucker-Prager model is used for concrete slab in the materially non-linear analysis.
Non-linear response of rockfill and foundation soil is determined by the multi-linear kinematic
hardening model. In this method, uniaxial stress-strain curve of the non-linear material is
Concrete
Slab
Concret
e Slab
Interface
Zero thickness-interface element
allowing slippage and also opening
and closure
2A
2A
3A
3B 3C
3D
2A
3A
3C
3D
3B
Concrete
Slab
Transition Zones: 2A,
3A
Rockfill Zones: 3B,
a) Welded Contact
b) Friction Contact
Su
2A
Concrete
Slab Su
M.E. Kartal / Sigma J Eng & Nat Sci 37 (2), 641-674, 2019

649
required. This curve can be determined by shear modulus-shear strain relationship for rock and
rockfill materials. Rollins et al. [34] produced the best-fit hyperbolic curve defining G/Gmax
versus cyclic shear strain relationship for gravelly soils based on testing by 15 investigators (Fig.
6). This study considers the best curve produced by Rollins et al. [34] for rockfill. In addition,
shear modulus-shear strain relation for rock soils obtained from experimental studies by Schnabel
et al. [35] is used for rock foundation (Fig. 7). Using these curves, the uniaxial stress-strain curves
for rockfill and foundation soil are determined as shown in Figs. 8 and 9.
Figure 1. Normalized shear modulus-shear strain and damping ratio relationships for gravels
[34].
Figure 2. Normalized shear modulus-shear strain and damping ratio relationships for rocks [35].
0
0.2
0.4
0.6
0.8
1
0.0001 0.001 0.01 0.1 1
Shear Strain, g (%)
G/G
max
0
4
8
12
16
20
Dam
pin
g R
atio
(%
)
G/Gmax Damping Ratio (%)
0
0.2
0.4
0.6
0.8
1
0.0001 0.0003 0.001 0.003 0.01 0.03 0.1 1
Shear Strain, g (%)
G/G
max
0
1
2
3
4
5
Dam
pin
g R
ati
o
(%)
G/Gmax Damping Ratio (%)
Earthquake Performance of Concrete Slab on … / Sigma J Eng & Nat Sci 37 (2), 641-674, 2019

650
Figure 3. The uniaxial stress-strain relationship for rockfill.
Figure 4. The uniaxial stress-strain relationship for foundation rock.
Structural connections of the finite element model built for friction contact consider
Coulomb’s friction law. Contact elements realize it. Those are the contact pairs defined mutually
as contact element and target element. Friction coefficient is used as 0.7 for concrete slab-rockfill,
rockfill-foundation and plinth-foundation. In these interfaces, “no separation” contact model is
preferred. The friction coefficient is used as 0.6 in concrete slab-plinth interface and “standard”
contact model is preferred in this interface. In the standard contact model, the structural element
behind the contact element may slide over and leaves from the structural element behind the
target element. However, though the contact surface does not separate from the target surface, it
may slide over the target surface in the no separation contact model.
0
20
40
60
80
0.0 0.1 0.2 0.3 0.4
Strain (%)
Str
ess
(kN
/m2)
2A 3A 3B 3C 3D
0
10000
20000
30000
40000
0.0 0.1 0.2 0.3 0.4 0.5
Strain (%)
Str
ess
(kN
/m2)
Volcanic Tuff Limestone Spilite
M.E. Kartal / Sigma J Eng & Nat Sci 37 (2), 641-674, 2019
651
5. EARTHQUAKE PERFORMANCE OF THE TORUL CFR DAM
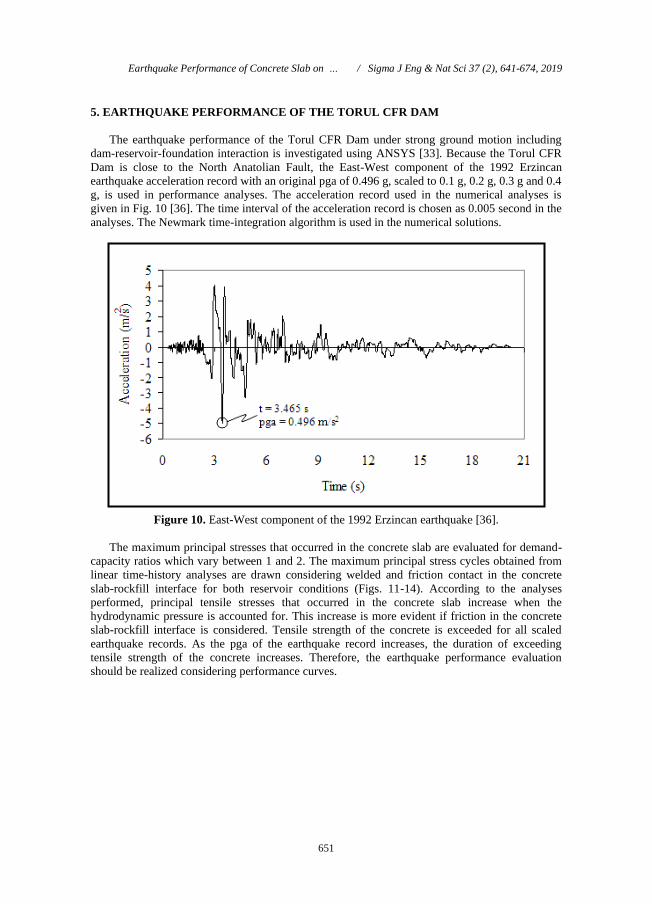
The earthquake performance of the Torul CFR Dam under strong ground motion including
dam-reservoir-foundation interaction is investigated using ANSYS [33]. Because the Torul CFR
Dam is close to the North Anatolian Fault, the East-West component of the 1992 Erzincan
earthquake acceleration record with an original pga of 0.496 g, scaled to 0.1 g, 0.2 g, 0.3 g and 0.4
g, is used in performance analyses. The acceleration record used in the numerical analyses is
given in Fig. 10 [36]. The time interval of the acceleration record is chosen as 0.005 second in the
analyses. The Newmark time-integration algorithm is used in the numerical solutions.
Figure 10. East-West component of the 1992 Erzincan earthquake [36].
The maximum principal stresses that occurred in the concrete slab are evaluated for demand-
capacity ratios which vary between 1 and 2. The maximum principal stress cycles obtained from
linear time-history analyses are drawn considering welded and friction contact in the concrete
slab-rockfill interface for both reservoir conditions (Figs. 11-14). According to the analyses
performed, principal tensile stresses that occurred in the concrete slab increase when the
hydrodynamic pressure is accounted for. This increase is more evident if friction in the concrete
slab-rockfill interface is considered. Tensile strength of the concrete is exceeded for all scaled
earthquake records. As the pga of the earthquake record increases, the duration of exceeding
tensile strength of the concrete increases. Therefore, the earthquake performance evaluation
should be realized considering performance curves.
Earthquake Performance of Concrete Slab on … / Sigma J Eng & Nat Sci 37 (2), 641-674, 2019

652
a) Earthquake record with pga = 0.1g
b) Earthquake record with pga = 0.2g
0
1600
3200
4800
6400
8000
9600
11200
12800
14400
0 3 6 9 12 15 18 21 24
Str
ess
(kN
/m2)
Time (s)
Stress D/C=1 D/C=2
0
1600
3200
4800
6400
8000
9600
11200
12800
14400
0 3 6 9 12 15 18 21 24
Str
ess
(kN
/m2)
Time (s)
Stress D/C=1 D/C=2
M.E. Kartal / Sigma J Eng & Nat Sci 37 (2), 641-674, 2019

653
c) Earthquake record with pga = 0.3g
d) Earthquake record with pga = 0.4g
Figure 11. Maximum principal stress cycles for empty reservoir case and welded contact
according to linear analyses.
0
1600
3200
4800
6400
8000
9600
11200
12800
14400
0 3 6 9 12 15 18 21 24
Str
ess
(kN
/m2)
Time (s)
Stress D/C=1 D/C=2
0
1600
3200
4800
6400
8000
9600
11200
12800
14400
0 3 6 9 12 15 18 21 24
Str
ess
(kN
/m2)
Time (s)
Stress D/C=1 D/C=2
Earthquake Performance of Concrete Slab on … / Sigma J Eng & Nat Sci 37 (2), 641-674, 2019

654
a) Earthquake record with pga = 0.1g
b) Earthquake record with pga = 0.2g
0
1600
3200
4800
6400
8000
9600
11200
12800
14400
0 3 6 9 12 15 18 21 24
Str
ess
(kN
/m2)
Time (s)
Stress D/C=1 D/C=2
0
1600
3200
4800
6400
8000
9600
11200
12800
14400
0 3 6 9 12 15 18 21 24
Str
ess
(kN
/m2)
Time (s)
Stress D/C=1 D/C=2
M.E. Kartal / Sigma J Eng & Nat Sci 37 (2), 641-674, 2019

655
c) Earthquake record with pga = 0.3g
d) Earthquake record with pga = 0.4g
Figure 12. Maximum principal stress cycles for empty reservoir case and friction contact
according to linear analyses.
0
1600
3200
4800
6400
8000
9600
11200
12800
14400
0 3 6 9 12 15 18 21 24
Str
ess
(kN
/m2)
Time (s)
Stress D/C=1 D/C=2
0
1600
3200
4800
6400
8000
9600
11200
12800
14400
0 3 6 9 12 15 18 21 24
Str
ess
(kN
/m2)
Time (s)
Stress D/C=1 D/C=2
Earthquake Performance of Concrete Slab on … / Sigma J Eng & Nat Sci 37 (2), 641-674, 2019

656
a) Earthquake record with pga = 0.1g
b) Earthquake record with pga = 0.2g
0
1600
3200
4800
6400
8000
9600
11200
12800
14400
0 3 6 9 12 15 18 21 24
Str
ess
(kN
/m2)
Time (s)
Stress D/C=1 D/C=2
0
1600
3200
4800
6400
8000
9600
11200
12800
14400
0 3 6 9 12 15 18 21 24
Str
ess
(kN
/m2)
Time (s)
Stress D/C=1 D/C=2
M.E. Kartal / Sigma J Eng & Nat Sci 37 (2), 641-674, 2019

657
c) Earthquake record with pga = 0.3g
d) Earthquake record with = 0.4g
Figure 13. Maximum principal stress cycles for full reservoir case and welded contact according
to linear analyses.
0
1600
3200
4800
6400
8000
9600
11200
12800
14400
0 3 6 9 12 15 18 21 24
Str
ess
(kN
/m2)
Time (s)
Stress D/C=1 D/C=2
0
1600
3200
4800
6400
8000
9600
11200
12800
14400
0 3 6 9 12 15 18 21 24
Str
ess
(kN
/m2)
Time (s)
Stress D/C=1 D/C=2
Earthquake Performance of Concrete Slab on … / Sigma J Eng & Nat Sci 37 (2), 641-674, 2019

658
a) Earthquake record with pga = 0.1g
b) Earthquake record with pga = 0.2g
0
1600
3200
4800
6400
8000
9600
11200
12800
14400
0 3 6 9 12 15 18 21 24
Str
ess
(kN
/m2)
Time (s)
Stress D/C=1 D/C=2
0
1600
3200
4800
6400
8000
9600
11200
12800
14400
0 3 6 9 12 15 18 21 24
Str
ess
(kN
/m2)
Time (s)
Stress D/C=1 D/C=2
M.E. Kartal / Sigma J Eng & Nat Sci 37 (2), 641-674, 2019

659
c) Earthquake record with pga = 0.3g
d) Earthquake record with pga = 0.4g
Figure 14. Maximum principal stress cycles for full reservoir case and friction contact according
to linear analyses.
The earthquake performance curves are drawn in Fig. 15 for welded and friction concrete
slab-rockfill interface and empty and full reservoirs. It can clearly be concluded from Fig. 15 that
earthquake performance of the concrete slab decreases by the effect of the hydrodynamic
pressure. This is more evident for the case of friction contact in the concrete slab-rockfill
interface. As the pga of the scaled earthquake record increases, the earthquake performance of the
dam decreases in all cases. Evaluation of the earthquake performance of the dam indicates that
crack forming seems inevitable for all the scaled earthquake records.
0
1600
3200
4800
6400
8000
9600
11200
12800
14400
0 3 6 9 12 15 18 21 24
Str
ess
(kN
/m2)
Time (s)
Stress D/C=1 D/C=2
0
1600
3200
4800
6400
8000
9600
11200
12800
14400
0 3 6 9 12 15 18 21 24
Str
ess
(kN
/m2)
Time (s)
Stress D/C=1 D/C=2
Earthquake Performance of Concrete Slab on … / Sigma J Eng & Nat Sci 37 (2), 641-674, 2019

660
a) Welded contact and empty reservoir case
b) Friction contact and empty reservoir case
0
0.3
0.6
0.9
1.2
1.5
1.8
2.1
2.4
2.7
3
1 1.1 1.2 1.3 1.4 1.5 1.6 1.7 1.8 1.9 2
Cum
ula
tive
Dura
tio
n (
s)
Demand-Capacity Ratio
0.1g 0.2g 0.3g 0.4g Performance Curve
0
0.3
0.6
0.9
1.2
1.5
1.8
2.1
2.4
2.7
3
1 1.1 1.2 1.3 1.4 1.5 1.6 1.7 1.8 1.9 2
Cu
mu
lati
ve
Du
rati
on
(s)
Demand-Capacity Ratio
0.1g 0.2g 0.3g 0.4g Performance Curve
M.E. Kartal / Sigma J Eng & Nat Sci 37 (2), 641-674, 2019

661
c) Welded contact and full reservoir case
d) Friction contact and full reservoir case
Figure 15. Earthquake performance curves of the dam according to linear analyses.
For a more rational estimation of the earthquake performance of the dam, materially nonlinear
analyses are needed. For the nonlinear analyses the Drucker-Prager constitute model is preferred
0
0.3
0.6
0.9
1.2
1.5
1.8
2.1
2.4
2.7
3
1 1.1 1.2 1.3 1.4 1.5 1.6 1.7 1.8 1.9 2
Cum
ula
tive
Dura
tion (
s)
Demand-Capacity Ratio
0.1g 0.2g 0.3g 0.4g Performance Curve
0
0.3
0.6
0.9
1.2
1.5
1.8
2.1
2.4
2.7
3
1 1.1 1.2 1.3 1.4 1.5 1.6 1.7 1.8 1.9 2
Cum
ula
tive
Dura
tion (
s)
Demand-Capacity Ratio
0.1g 0.2g 0.3g 0.4g Performance Curve
Earthquake Performance of Concrete Slab on … / Sigma J Eng & Nat Sci 37 (2), 641-674, 2019
662
for the concrete slab and multi-linear kinematic hardening model is preferred for rockfill zones
and foundation rock. Therefore, nonlinear analyses are performed to estimate the essential
performance of the dam for all the scaled ground excitations.
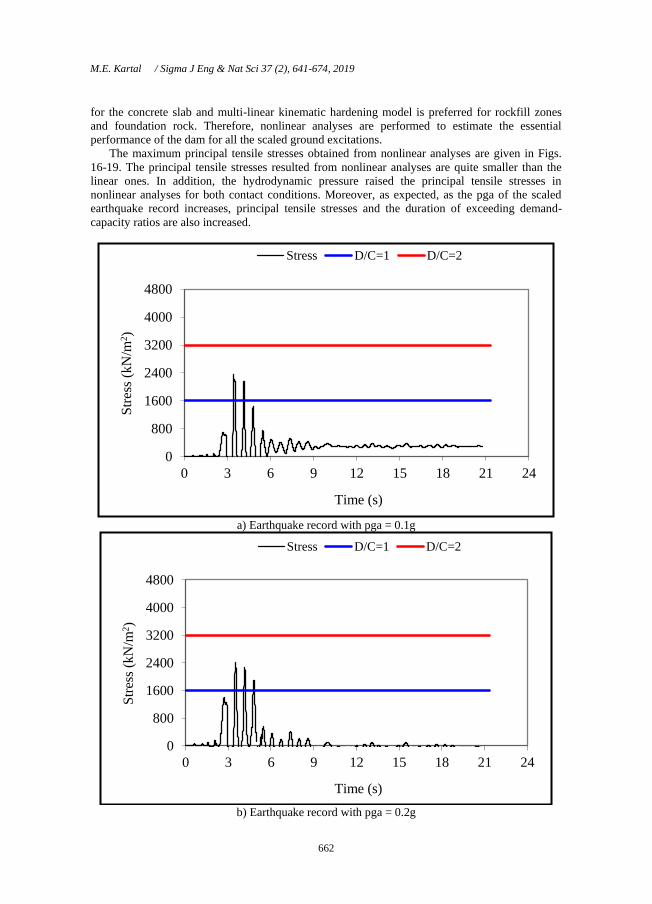
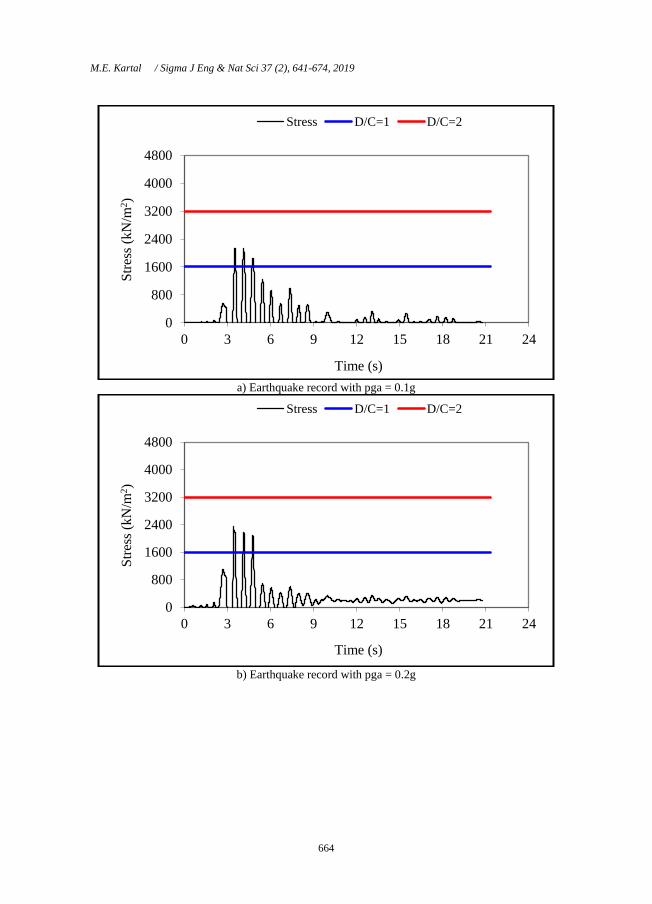
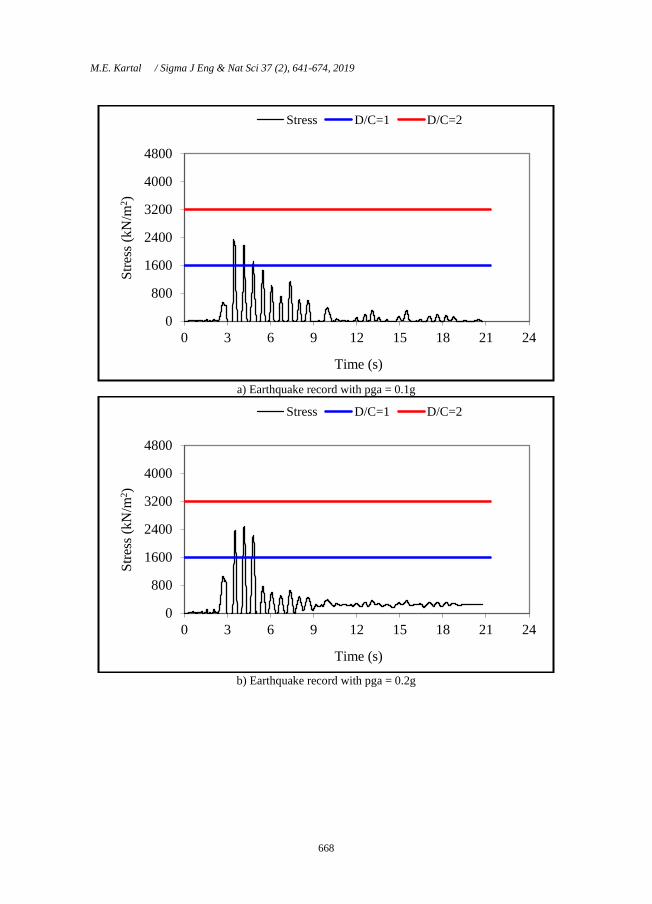
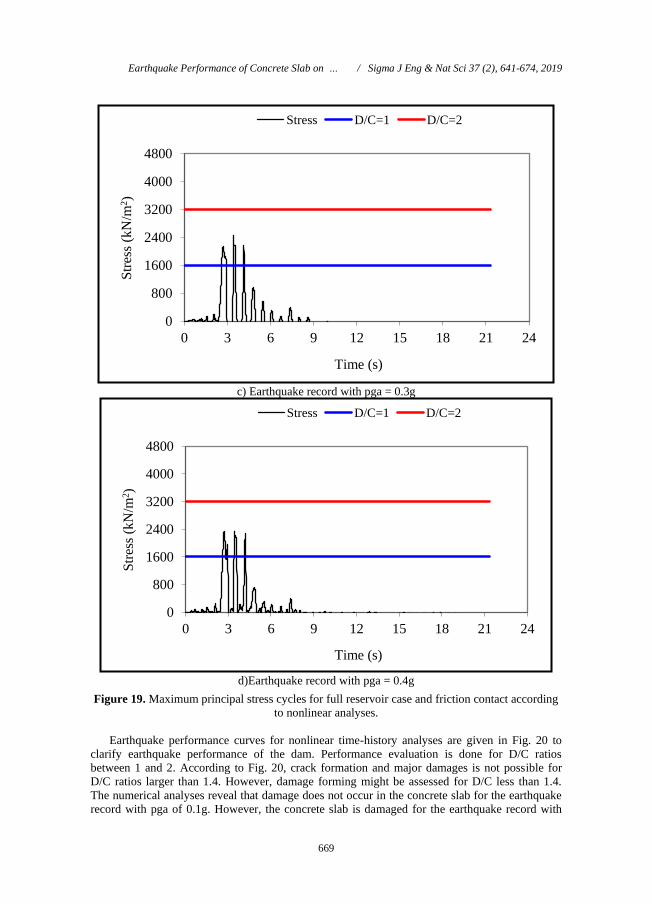
The maximum principal tensile stresses obtained from nonlinear analyses are given in Figs.
16-19. The principal tensile stresses resulted from nonlinear analyses are quite smaller than the
linear ones. In addition, the hydrodynamic pressure raised the principal tensile stresses in
nonlinear analyses for both contact conditions. Moreover, as expected, as the pga of the scaled
earthquake record increases, principal tensile stresses and the duration of exceeding demand-
capacity ratios are also increased.
a) Earthquake record with pga = 0.1g
b) Earthquake record with pga = 0.2g
0
800
1600
2400
3200
4000
4800
0 3 6 9 12 15 18 21 24
Str
ess
(kN
/m2)
Time (s)
Stress D/C=1 D/C=2
0
800
1600
2400
3200
4000
4800
0 3 6 9 12 15 18 21 24
Str
ess
(kN
/m2)
Time (s)
Stress D/C=1 D/C=2
M.E. Kartal / Sigma J Eng & Nat Sci 37 (2), 641-674, 2019

663
c) Earthquake record with pga = 0.3g
d)Earthquake record with pga = 0.4g
Figure 16. Maximum principal stress cycles for empty reservoir case and welded contact
according to nonlinear analyses.
0
800
1600
2400
3200
4000
4800
0 3 6 9 12 15 18 21 24
Str
ess
(kN
/m2)
Time (s)
Stress D/C=1 D/C=2
0
800
1600
2400
3200
4000
4800
0 3 6 9 12 15 18 21 24
Str
ess
(kN
/m2)
Time (s)
Stress D/C=1 D/C=2
Earthquake Performance of Concrete Slab on … / Sigma J Eng & Nat Sci 37 (2), 641-674, 2019
664
a) Earthquake record with pga = 0.1g
b) Earthquake record with pga = 0.2g
0
800
1600
2400
3200
4000
4800
0 3 6 9 12 15 18 21 24
Str
ess
(kN
/m2)
Time (s)
Stress D/C=1 D/C=2
0
800
1600
2400
3200
4000
4800
0 3 6 9 12 15 18 21 24
Str
ess
(kN
/m2)
Time (s)
Stress D/C=1 D/C=2
M.E. Kartal / Sigma J Eng & Nat Sci 37 (2), 641-674, 2019

665
c) Earthquake record with pga = 0.3g
d)Earthquake record with pga = 0.4g
Figure 17. Maximum principal stress cycles for empty reservoir case and friction contact
according to nonlinear analyses.
0
800
1600
2400
3200
4000
4800
0 3 6 9 12 15 18 21 24
Str
ess
(kN
/m2)
Time (s)
Stress D/C=1 D/C=2
0
800
1600
2400
3200
4000
4800
0 3 6 9 12 15 18 21 24
Str
ess
(kN
/m2)
Time (s)
Stress D/C=1 D/C=2
Earthquake Performance of Concrete Slab on … / Sigma J Eng & Nat Sci 37 (2), 641-674, 2019

666
a) Earthquake record with pga = 0.1g
b) Earthquake record with pga = 0.2g
0
800
1600
2400
3200
4000
4800
0 3 6 9 12 15 18 21 24
Str
ess
(kN
/m2)
Time (s)
Stress D/C=1 D/C=2
0
800
1600
2400
3200
4000
4800
0 3 6 9 12 15 18 21 24
Str
ess
(kN
/m2)
Time (s)
Stress D/C=1 D/C=2
M.E. Kartal / Sigma J Eng & Nat Sci 37 (2), 641-674, 2019

667
c) Earthquake record with pga = 0.3g
d) Earthquake record with pga = 0.4g
Figure 18. Maximum principal stress cycles for full reservoir case and welded contact according
to nonlinear analyses.
0
800
1600
2400
3200
4000
4800
0 3 6 9 12 15 18 21 24
Str
ess
(kN
/m2)
Time (s)
Stress D/C=1 D/C=2
0
800
1600
2400
3200
4000
4800
0 3 6 9 12 15 18 21 24
Str
ess
(kN
/m2)
Time (s)
Stress D/C=1 D/C=2
Earthquake Performance of Concrete Slab on … / Sigma J Eng & Nat Sci 37 (2), 641-674, 2019
668
a) Earthquake record with pga = 0.1g
b) Earthquake record with pga = 0.2g
0
800
1600
2400
3200
4000
4800
0 3 6 9 12 15 18 21 24
Str
ess
(kN
/m2)
Time (s)
Stress D/C=1 D/C=2
0
800
1600
2400
3200
4000
4800
0 3 6 9 12 15 18 21 24
Str
ess
(kN
/m2)
Time (s)
Stress D/C=1 D/C=2
M.E. Kartal / Sigma J Eng & Nat Sci 37 (2), 641-674, 2019
669
c) Earthquake record with pga = 0.3g
d)Earthquake record with pga = 0.4g
Figure 19. Maximum principal stress cycles for full reservoir case and friction contact according
to nonlinear analyses.
Earthquake performance curves for nonlinear time-history analyses are given in Fig. 20 to
clarify earthquake performance of the dam. Performance evaluation is done for D/C ratios
between 1 and 2. According to Fig. 20, crack formation and major damages is not possible for
D/C ratios larger than 1.4. However, damage forming might be assessed for D/C less than 1.4.
The numerical analyses reveal that damage does not occur in the concrete slab for the earthquake
record with pga of 0.1g. However, the concrete slab is damaged for the earthquake record with
0
800
1600
2400
3200
4000
4800
0 3 6 9 12 15 18 21 24
Str
ess
(kN
/m2)
Time (s)
Stress D/C=1 D/C=2
0
800
1600
2400
3200
4000
4800
0 3 6 9 12 15 18 21 24
Str
ess
(kN
/m2)
Time (s)
Stress D/C=1 D/C=2
Earthquake Performance of Concrete Slab on … / Sigma J Eng & Nat Sci 37 (2), 641-674, 2019

670
pga of 0.4g in both cases of reservoir condition. The earthquake performance of the concrete slab
calculated with nonlinear analyses decreases when the hydrodynamic pressure is considered. It
also decreases when the peak ground accelerations of the earthquake record increases and this is
more apparent for the dam with friction contact in concrete slab-rockfill interface.
a) Welded contact and empty reservoir case
b) Friction contact and empty reservoir case
0
0.15
0.3
0.45
0.6
0.75
0.9
1 1.1 1.2 1.3 1.4 1.5 1.6 1.7 1.8 1.9 2
Cum
ula
tive
Dura
tion (
s)
Demand-Capacity Ratio
0.1g 0.2g 0.3g 0.4g Performance Curve
0
0.15
0.3
0.45
0.6
0.75
0.9
1 1.1 1.2 1.3 1.4 1.5 1.6 1.7 1.8 1.9 2
Cum
ula
tive
Dura
tion (
s)
Demand-Capacity Ratio
0.1g 0.2g 0.3g 0.4g Performance Curve
M.E. Kartal / Sigma J Eng & Nat Sci 37 (2), 641-674, 2019

671
c) Welded contact and full reservoir case
d) Friction contact and full reservoir case
Figure 20. Earthquake performance curves of the dam according to nonlinear analyses.
0
0.15
0.3
0.45
0.6
0.75
0.9
1 1.1 1.2 1.3 1.4 1.5 1.6 1.7 1.8 1.9 2
Cum
ula
tive
Dura
tion (
s)
Demand-Capacity Ratio
0.1g 0.2g 0.3g 0.4g Performance Curve
0
0.15
0.3
0.45
0.6
0.75
0.9
1 1.1 1.2 1.3 1.4 1.5 1.6 1.7 1.8 1.9 2
Cum
ula
tive
Dura
tion (
s)
Demand-Capacity Ratio
0.1g 0.2g 0.3g 0.4g Performance Curve
Earthquake Performance of Concrete Slab on … / Sigma J Eng & Nat Sci 37 (2), 641-674, 2019

672
6. CONCLUSIONS
In this paper, the effect of hydrodynamic pressure on concrete face slab is investigated
considering friction contact and welded contact in concrete slab-rockfill interface. In the
numerical analyses, the East-West component with 0.496 pga of the 1992 Erzincan earthquake
record is used. This accelerogram is scaled to 0.1g, 0.2 g, 0.3g and 0.4g. For this purpose, linear
and nonlinear time-history analyses are performed. In the materially nonlinear time history
analyses, the Drucker-Prager model is used for the concrete slab and multi-linear kinematic
hardening model, rockfill zones and also the foundation soil. The, hydrodynamic effect of the
reservoir water is modeled using two dimensional fluid finite elements based on the Lagrangian
approach.
According to the earthquake performance evaluation of the Torul CFR Dam, damage
formation seems inevitable in the concrete slab based upon linear time-history analyses for empty
and full reservoir and the two interface conditions. Also, according to linear analyses the
earthquake performance decreases by considering hydrodynamic pressure on the face slab. Thus,
materially nonlinear time-history analyses are performed for a rational assessment of earthquake
performance. In this case, damage also occurs in the concrete slab but for lower degree of
demand-capacity ratio cracks occur in the concrete slab and damage level increase by increasing
pga of earthquake. On the other hand, no damage occurs in the concrete slab for the earthquake
with a 0.1 g pga. This study indicates that the lowest earthquake performance occurs for full
reservoir case. In addition, the highest earthquake performance is achieved with empty reservoir
and with friction contact in the concrete slab-rockfill interface. For the welded contact in the
concrete slab-rockfill interface, the hydrodynamic pressure effect on the earthquake performance
of the concrete slab is less important than in the friction contact case.
As a consequence of the results of the study, the following are recommendations are put
forward:
• In earthquake performance evaluation of a CFR dam, friction contact should be
considered in the concrete slab-rockfill interface.
• Hydrodynamic pressure on face slab should be considered in earthquake performance
analyses.
• Nonlinear earthquake analyses should be performed to obtain reliable earthquake
performance of a CFR dam.
• Using more than one earthquake record may provide comprehensive knowledge about
earthquake response of the CFR dam.
REFERENCES
[1] Seed H.B., Seed R.B., Lai S.S., Khamenehpour B., “Seismic Design of Concrete Faced
Rockfill Dams”, Proceedings of the Symposium on Concrete Face Rockfill Dams –
Design, Construction and Performance, ASCE, New York, 1985, 459-478.
[2] Priscu R., Popovici A., Stematiu D., Stere C., “Earthquake Engineering for Large Dams”,
New York, Editura Academiei, Bucuresti and John Wiley & Sons, NY, 1985.
[3] Sherard J.L., Cooke J.B., “Concrete-Face Rockfill Dam – I. Assessment, and II. Design”,
J.Geo.Eng., 113, 10, 1096-1132, 1987.
[4] Gazetas G., Dakoulas P., “Seismic Analysis and Design of Rockfill Dams – State of the
Art.”, Soil Dyn.Earth.Eng., 11, 27-61, 1992.
[5] Uddin N., “A Dynamic Analysis Procedure for Concrete-Faced Rockfill Dams Subjected
to Strong Seismic Excitation”, Comp.&Struct., 72, 409-421, 1999.
[6] Bayraktar A., Kartal M.E., “Linear and Nonlinear Response of Concrete Slab on CFR
Dam During Earthquake”, Soil Dyn.Earth.Eng., 30, 10, 990-1003, 2010.
M.E. Kartal / Sigma J Eng & Nat Sci 37 (2), 641-674, 2019

673
[7] Kartal M.E., Bayraktar A., Başağa H.B., “Seismic Failure Probability of Concrete Slab on
CFR Dams with Welded and Friction Contacts by Response Surface Method”, Soil
Dyn.Earth.Eng., 30, 11, 1383-1399, 2010.
[8] Bayraktar A., Kartal M.E., Adanur S., “The Effect of Concrete Slab-Rockfill Interface
Behavior on the Earthquake Performance of a CFR Dam”, Int.J.Non.Lin.Mech., 46, 1, 35-
46, 2011.
[9] Uddin N., Gazetas G., “Dynamic Response of Concrete-Face Rockfill Dams to Strong
Seismic Excitation”, J.Geo.Eng., ASCE, 121, 2, 185-197, 1995.
[10] Bayraktar A., Altunişik A.C., Sevim B., Kartal M.E., Türker T., Bilici Y., “Comparison of
Near- and Far-Fault Ground Motion Effect on the Nonlinear Response of Dam–
Reservoir–Foundation Systems”, Nonlin.Dyn., 58, 4, 655-673, 2009.
[11] Westergaard H.M., “Water Pressures on Dams During Earthquakes”, Transactions,
ASCE, 98, 418-433, 1933.
[12] Zangar C.N., Haefei R.J., “Electric Analog Indicates Effects of Horizontal Earthquake
Shock on Dams”, Civ.Eng., 54-55, 1952.
[13] Zienkiewicz O.C., Nath B., “Earthquake hydrodynamic pressures on arch dams-an
electric analogue solution”. Proceedings of International Civil Engineering Congress, 25,
165-176, 1963.
[14] Chopra A.K., “Earthquake Behavior of Reservoir-Dam Systems”, J.Eng.Mech.Div., 94,
1475-1500, 1968.
[15] Finn W.D.L., Varoglu E., “Dynamics of Gravity Dam-Reservoir Systems”.
Comp.&Struct., 3, 913-924, 1973.
[16] Saini S.S., Bettess P., Zienkiewicz O.C., “Coupled Hydrodynamic Response of Concrete
Gravity Dams Using Finite and Infinite Elements”. Earth.Eng.&Struct.Dyn., 6, 363-374,
1978.
[17] Chopra A.K., Chakrabarti P., “Earthquake Analysis of Concrete Gravity Dams Including
Dam-Water-Foundation Rock Interaction”, Earth.Eng.&Struct.Dyn., 9, 363-383, 1981.
[18] Greeves E.J., Dumanoglu A.A., “The Implementation of an Efficient Computer Analysis
for Fluid-Structure Interaction Using the Eulerian Approach Within SAP-IV”, Department
of Civil Engineering, University of Bristol, Bristol, 1989.
[19] Singhal A.C., “Comparison of Computer Codes for Seismic Analysis of Dams”,
Comp.&Struc., 38, 107-112, 1991.
[20] Calayır Y., Dumanoglu A.A., Bayraktar, A., “Earthquake Analysis of Gravity Dam–
Reservoir Systems Using the Eulerian and Lagrangian Approaches”. Comp.&Struct., 59,
877-890, 1996.
[21] Bayraktar A., Dumanoglu A.A., Calayır Y., “Asynchronous Dynamic Analysis of Dam-
Reservoir-Foundation Systems by the Lagrangian Approach”, Comp.&Struct., 58, 925-
935, 1996.
[22] Kartal M.E., “Investigation of The Deformations in a Concrete Faced Rockfill Dam
During Strong Ground Motion, Sigma J.Eng.&Nat.Sci, 36, 1, 207-230, 2018.
[23] Abedian M.A., Farrokhi F., Rasouli R., “Settlement Evaluation of a Concrete Face Rock-
Fill Dam (CFRD) Using a Back-Analysis Method Based on Measurement Results (A
Case Study of Siah-Bisheh Dam), J.Eng.&Tech.Sci., 50, 4, 516-533, 2018.
[24] Kartal M.E., “An Evaluation of Peak Acceleration Amplification Coefficients in A CFR
Dam Considering Hydrodynamic Pressure, J.Struct.Eng.&App.Mech., 1, 2, 73-94, 2018.
[25] Wilson E.L., Khalvati M., “Finite Elements for the Dynamic Analysis of Fluid-Solid
Systems”, Int.J.Num.Meth.Eng., 19, 1657-1668, 1983.
[26] Zienkiewicz O.C., Taylor R.L., “The Finite Element Method”, Mc Graw-Hill, 1989.
[27] Bathe K.J., “Finite Element Procedures in Engineering Analysis”. New Jersey,
Englewood Cliffs: Prentice-Hall, 1996.
Earthquake Performance of Concrete Slab on … / Sigma J Eng & Nat Sci 37 (2), 641-674, 2019
674
[28] Clough R.W., Penzien J. “Dynamics of Structures” 2nd Ed., Singapore, McGraw-Hill,
1993.
[29] Akkas N., Akay H.U., Yılmaz C., “Applicability of General-Purpose Finite Element
Programs in Solid-Fluid Interaction Problems”, Comp.&Struct., 10, 773-783, 1979.
[30] Ghanaat Y., “Seismic Performance and Damage Criteria for Concrete Dams”, In
Proceedings of the 3rd US-Japan Workshop on Advanced Research on Earthquake
Engineering for Dams, San Diego, California, 2002.
[31] USACE, US Army Corps of Engineers, “Time History Dynamic Analysis of Concrete
Hydraulic Structures-Engineering and Design (Engineer Manual)”, EM 1110-2-6051,
2003.
[32] DSI, General Directorate of State Hydraulic Works, 2018.
[33] ANSYS, Swanson Analysis Systems Inc., Houston PA, USA, 2017.
[34] Rollins K.M., Evans M.D., Diehl N.B., Daily III W.D., “Shear Modulus and Damping
Relationships for Gravels”. J.Geo.Geoenv.Eng., 124, 5, 396–405, 1998.
[35] Schnabel P.B,, Lysmer J., Seed H.B., “SHAKE: A Computer Program for Earthquake
Response Analysis of Horizontally Layered Sites”, Report No. EERC-72/12, Earthquake
Engineering Research Centre, University of California, Berkeley, 1972.
[36] PEER, Pacific Earthquake Engineering Research Centre, Available from
http://peer.berkeley.edu/smcat/data/ath/erzikan/ERZ-EW.AT2, [accessed May 21,2005].
M.E. Kartal / Sigma J Eng & Nat Sci 37 (2), 641-674, 2019