research article doing better but feeling...
TRANSCRIPT
Research Article
Doing Better but Feeling WorseLooking for the ‘‘Best’’ Job Undermines SatisfactionSheena S. Iyengar,1 Rachael E. Wells,1 and Barry Schwartz2
1Management Division, Graduate School of Business, Columbia University, and 2Psychology Department,
Swarthmore College
ABSTRACT—Expanding upon Simon’s (1955) seminal the-
ory, this investigation compared the choice-making strat-
egies of maximizers and satisficers, finding that maximiz-
ing tendencies, although positively correlated with objec-
tively better decision outcomes, are also associated with
more negative subjective evaluations of these decision
outcomes. Specifically, in the fall of their final year in
school, students were administered a scale that measured
maximizing tendencies and were then followed over the
course of the year as they searched for jobs. Students with
high maximizing tendencies secured jobs with 20% higher
starting salaries than did students with low maximizing
tendencies. However, maximizers were less satisfied than
satisficers with the jobs they obtained, and experienced
more negative affect throughout the job-search process.
These effects were mediated by maximizers’ greater reli-
ance on external sources of information and their fixation
on realized and unrealized options during the search and
selection process.
Success is getting what you want. Happiness is wanting what you
get.
—American proverb
Half a century ago, Simon (1955, 1956, 1957) introduced an
important distinction between maximizing and satisficing as
choice-making strategies. To maximize is to seek the best and
requires an exhaustive search of all possibilities. To satisfice is
to seek ‘‘good enough,’’ searching until encountering an option
that crosses the threshold of acceptability. For example, com-
pare the strategies of a maximizer versus a satisficer selecting a
television show from choices available on 400 cable channels.
The maximizer would channel-surf, exploring all the channels,
spending so much time deciding on a show that little time would
be left for viewing. The satisficer would most likely channel-surf
until he or she encountered the first acceptable show, put down
the remote control, and actually watch the show. Simon based his
distinction on the idea that the limited information-processing
capacities of organisms make maximizing impossible. In the
modern world of almost unimaginable choice, this distinction is
even more pertinent (see Iyengar & Lepper, 2000; Schwartz,
2004a, 2004b).
Expanding on Simon’s classic theory, Schwartz et al. (2002)
recently compared the decision-making processes of maxi-
mizers and satisficers, finding that people who exhibit maxi-
mizing tendencies, like the channel surfer just described, were
less satisfied with their decision outcomes than their satisficing
counterparts. The researchers asked participants about recent
purchasing decisions and used a ‘‘maximization scale’’ to
measure individual differences in maximizing tendencies. Their
findings suggested that the experiences of maximizers differed
from those of satisficers during the decision-making process and
also later, when they evaluated their final decision outcome.
Specifically, compared with satisficers, maximizers were more
likely to engage in an exhaustive search of all available options
and to compare their decisions with those of other people. Even
though maximizers invested more time and effort during the
decision process and explored more options than satisficers—
presumably in order to achieve greater satisfaction—they none-
theless felt worse about the outcomes that they achieved. Re-
sults showed that maximizing tendencies were positively
correlated with regret, depression, and decision difficulty, and
negatively correlated with happiness, life satisfaction, opti-
mism, and satisfaction with decision outcomes.
Such differences in the subjective choice-making experi-
ences of maximizers and satisficers are attributed to the fact that
maximizers create a more onerous choice-making process for
themselves. Initially, maximizers focus on increasing their
choice sets by exploring multiple options, presumably because
expanded choice sets allow for greater possibilities to seek
out and find the elusive ‘‘best.’’ Yet, as the number of options
Address correspondence to Sheena S. Iyengar, Management Division,Columbia University Business School, 3022 Broadway, Room 714,Uris Hall, New York, NY 10027, e-mail: [email protected].
PSYCHOLOGICAL SCIENCE
Volume 17—Number 2 143Copyright r 2006 Association for Psychological Science
proliferates, cognitive limitations prevent decision makers from
evaluating and comparing all options (Iyengar & Jiang, 2004;
Iyengar & Lepper, 2000; Miller, 1956). Identifying the best
becomes increasingly difficult, compelling maximizers to rely on
external (often social) rather than internal standards to evaluate
and select outcomes (Lyubomirsky & Ross, 1997). In addition,
the inevitability of trade-offs among attractive options intensi-
fies the sting of passing up one attractive alternative when
choosing a more attractive one, and increases expectations for
the quality and utility of the chosen alternative.
But do the very strategies that render maximizers less happy
than satisficers with their decision outcomes also enable them to
achieve decision outcomes that are objectively better? Perhaps
there is utility associated with the strategic pursuit of real and
imagined options and with the careful observation of other
people’s choice-making experiences—utility that may be re-
flected in the form of more effective deliberations and objec-
tively better outcomes. Unlike prior investigations of the
relation between maximizing tendencies and decision outcomes,
the current investigation examined the effects of maximizing
tendencies on both objective outcomes and the subjective ex-
perience of the decision maker throughout the process.
Thus, expanding on this nascent literature, the present study
allowed us to test two hypotheses. The first was about the process
of searching for choices and deciding which one to select. We
hypothesized that compared with satisficers, maximizers invest
more heavily in gathering information from external sources
(thereby incurring search costs and perhaps prioritizing exter-
nally valued criteria) and fixate more on realized and unrealized
options (thereby incurring opportunity costs). The second hy-
pothesis involved decision outcomes. We hypothesized that
these differences in the decision-making process contribute to
more successful decision outcomes among maximizers than
among satisficers, yet also result in maximizers’ experiencing
greater negative affect and reduced subjective well-being.
We chose to test these predictions within the consequential
domain of graduating college students’ job-search processes,
which allowed us to examine the influence of maximizing ten-
dencies on both actual and perceived decision outcomes, and
afforded us the opportunity to examine reactions to the decision
process as decisions were being made. Regardless of the finite
number of offers made to job seekers, maximizers who are un-
dertaking a job search face both the search costs and the raised
expectations associated with contemplating an almost limitless
set of employment possibilities. To determine how a maximizing
orientation affects both the affective experiences and the ob-
jective outcomes of the job-search process, we measured the
maximizing tendencies of participants from multiple institutions
during the fall of their final year and subsequently followed them
throughout their job search, measuring both how well they ac-
tually did and how well they thought they did. This methodology
allowed us to test the following specific predictions: that com-
pared with satisficers, maximizers would desire more options,
plan to apply for more jobs, rely more on social comparison and
other external sources of information, and obtain jobs with
higher expected returns (i.e., salary), but also experience greater
negative affect and less outcome satisfaction throughout the
process and at the conclusion of their job search.
METHOD
Participants
Graduating students (predominantly undergraduate seniors)
were recruited from 11 colleges and universities that varied in
geographical region, university rank, and school size. The
sample was 69.7% female. The median age of participants was
21 (range: 20–57), and 64% of participants were Caucasian,
26% Asian, and 10% of other racial-ethnic backgrounds. Par-
ticipants majored in the social sciences (36%), arts and hu-
manities (25%), engineering (16%), natural sciences and math
(11%), and business (15%). At the first assessment (T1), 548
participants responded; response rates were 69.5% and 56% at
the second and third assessments (T2 and T3), respectively. Five
$200 prizes were raffled off among the participants who com-
pleted all three surveys.
Procedure
In November 2001 (T1), career services at the 11 participating
institutions directed students who were just beginning their job
searches (i.e., who had used career services in September
through November) to our survey Web site. Via e-mail, we no-
tified these participants of our follow-up on-line surveys in
February 2002 (T2), as participants were completing applica-
tions, interviewing, and getting offers, and in May 2002 (T3), as
they were accepting offers. Although it is difficult to calculate
the percentage of students who chose to participate in the survey
upon encountering the on-line advertisement, consultations
with career-services staff provided us with numerical estimates
of the total number of students who utilized career services in
their job search within the given academic year. Given that the
advertisement was available only to those students who were
affiliated with career services between the months of September
and November (approximately 25%), we calculated that re-
sponse rates ranged from 17.4% to 53.2% across a sampling of
participating institutions.
Measures
Maximizing Tendencies
At T1, participants completed 11 maximization items drawn
from Schwartz et al. (2002; e.g., "When I am in the car listening
to the radio, I often check other stations to see if something
better is playing, even if I am relatively satisfied with what I’m
listening to’’ and ‘‘When shopping, I have a hard time finding
clothes that I really love’’). Each item was rated on a scale from 1
(strongly disagree) to 9 (strongly agree; a 5 .6). Scores for the
144 Volume 17—Number 2
Looking for the ‘‘Best’’ Job Undermines Satisfaction
individual items were averaged to create a composite maxi-
mizing score. Overall, men (n 5 166, M 5 5.48) and women (n 5
382, M 5 5.10) from our sample population showed significantly
higher maximizing tendencies than respondents in a recent
national adult sample (Kliger & Schwartz, 2005; men: n 5
3,261, M 5 4.9; women: n 5 4,692, M 5 4.77), t(165) 5 7.03,
p < .0001, for men and t(381) 5 6.28, p < .0001, for women.
These differences may be at least partly attributable to the age
difference between the two samples, as maximization tendencies
have been found to be negatively correlated with age (Kliger &
Schwartz, 2005). In our sample, maximizing tendencies were
also significantly positively correlated with top-15 university
rank, r(544) 5 .10, p< .05, and male gender, r(546) 5 .17, p<
.0001, but not with any other demographic or control variable
gathered.
Option Fixation
We used three measures to examine option fixation. At T1, we
measured the number of options that participants pursued: ‘‘For
approximately how many jobs do you anticipate applying?’’
Participants provided responses in numerical form. Note that
the number of anticipated applications ranged from 1 to 1,000,
exhibiting extreme right skewness (skew 5 7.5) and kurtosis
(69.0), and was therefore log-transformed. At T2, we measured
participants’ fixation on unrealized options: ‘‘I often fantasize
about jobs that are quite different from the actual job(s) that I am
pursuing.’’ Responses were made on a scale from 1 (strongly
disagree) to 9 (strongly agree). At T3, we measured participants’
regret with the size of their choice set: ‘‘I wish I had pursued
more options in my job search process.’’ Responses were made
on a scale from 1 (not at all) to 9 (to a large extent).
Reliance on External Influences
We created a single composite measure of five items (a 5 .70) to
test reliance on external influences. At T1, participants were
asked: ‘‘How much have you been using the services offered by
the career services office at your school during the job search?’’
‘‘To what extent have you consulted experts’ ranking such as ‘top
companies,’ ‘fastest growing fields,’ etc.?’’ ‘‘How much do you
seek advice from your family regarding the job search (i.e., in-
put, suggestions, etc.)?’’ and ‘‘To what extent do you compare
your own job search process and results to those of your peers?’’
The question regarding peer comparison was repeated at T2.
Participants responded on a scale from 1 (very little) to 9 (very
much).
Job-Market Performance
At T2 and T3, participants were asked how many interviews they
had received. In addition, at T3, they were asked how many job
offers they had received and the annual salary (in dollars per
year or hour) of the job offer they accepted. In the case of jobs
with hourly wages, we determined how many hours per week
participants were required to work and converted this infor-
mation into an estimated annual salary.
Negative Affect
Participants’ negative affect associated with the job-search
process was measured at all three assessments. At T1 and T2,
participants were asked, ‘‘To what extent does each of the fol-
lowing describe how you are generally feeling about the job
search process?’’ The seven emotions listed were ‘‘pessimistic,’’
‘‘stressed,’’ ‘‘tired,’’ ‘‘anxious,’’ ‘‘worried,’’ ‘‘overwhelmed,’’ and
‘‘depressed.’’ Participants rated each emotion on a scale from 1
(not at all) to 9 (extremely) (T1 a 5 .86; T2 a 5 .89). At T3, the
same question was repeated; however, three emotions were
added (T3 a 5 .92): ‘‘regretful,’’ ‘‘disappointed,’’ and ‘‘frus-
trated.’’ In addition, for participants who had accepted job of-
fers, the question was modified to read: ‘‘To what extent does
each of the following describe how you are feeling about the offer
you accepted and your upcoming new job?’’ Composite mea-
sures for T1, T2, and T3 were constructed.
Outcome Satisfaction
Two items measured participants’ satisfaction with their ac-
cepted job offers: ‘‘How satisfied are you with the offer you have
accepted?’’ and ‘‘How confident are you that you made the right
choice about where to work next year?’’ Responses were made on
a scale from 1 (not at all) to 9 (very satisfied/very confident; a 5
.88). A score was obtained for each participant by averaging the
responses to these two questions.
Demographics and Other Control Variables
We gathered information on age, sex, ethnicity, family income
level, university affiliation and rank (as measured by U.S. News
& World Report, 2001), geographic location, and academic
major at T1. At T2, we collected information on overall grade
point average (GPA). Participants were asked about their job-
related activities (i.e., current stage in the job-search process)
at all three assessments.
RESULTS
Preliminary Analysis
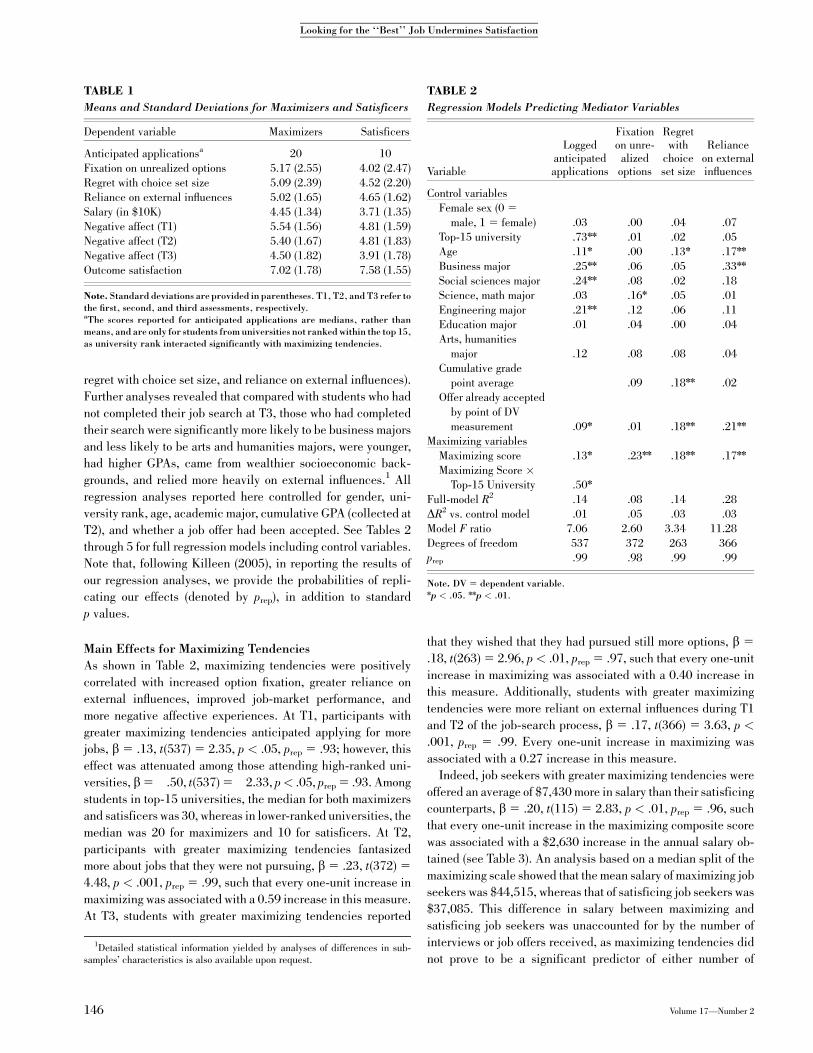
Table 1 reports the means and standard deviations as a function
of maximizing status for all dependent measures, with maxi-
mizers and satisficers separated by a median split. Attrition
analyses demonstrated that our initial sample differed demo-
graphically from the T2 and T3 samples: East Asians, children
of foreign-born parents, and older students constituted a smaller
proportion of both the T2 and T3 samples, and the proportion of
participants who did not identify themselves with one specific
ethnicity was larger at T3 than at T1. However, the T1, T2, and
T3 samples did not differ as a function of the variables critical to
our hypotheses (including maximizing score, log of the number
of anticipated applications, fixation on unrealized options,
Volume 17—Number 2 145
Sheena S. Iyengar, Rachael E. Wells, and Barry Schwartz
regret with choice set size, and reliance on external influences).
Further analyses revealed that compared with students who had
not completed their job search at T3, those who had completed
their search were significantly more likely to be business majors
and less likely to be arts and humanities majors, were younger,
had higher GPAs, came from wealthier socioeconomic back-
grounds, and relied more heavily on external influences.1 All
regression analyses reported here controlled for gender, uni-
versity rank, age, academic major, cumulative GPA (collected at
T2), and whether a job offer had been accepted. See Tables 2
through 5 for full regression models including control variables.
Note that, following Killeen (2005), in reporting the results of
our regression analyses, we provide the probabilities of repli-
cating our effects (denoted by prep), in addition to standard
p values.
Main Effects for Maximizing Tendencies
As shown in Table 2, maximizing tendencies were positively
correlated with increased option fixation, greater reliance on
external influences, improved job-market performance, and
more negative affective experiences. At T1, participants with
greater maximizing tendencies anticipated applying for more
jobs, b 5 .13, t(537) 5 2.35, p < .05, prep 5 .93; however, this
effect was attenuated among those attending high-ranked uni-
versities, b5�.50, t(537) 5�2.33, p< .05, prep 5 .93. Among
students in top-15 universities, the median for both maximizers
and satisficers was 30, whereas in lower-ranked universities, the
median was 20 for maximizers and 10 for satisficers. At T2,
participants with greater maximizing tendencies fantasized
more about jobs that they were not pursuing, b 5 .23, t(372) 5
4.48, p < .001, prep 5 .99, such that every one-unit increase in
maximizing was associated with a 0.59 increase in this measure.
At T3, students with greater maximizing tendencies reported
that they wished that they had pursued still more options, b 5
.18, t(263) 5 2.96, p< .01, prep 5 .97, such that every one-unit
increase in maximizing was associated with a 0.40 increase in
this measure. Additionally, students with greater maximizing
tendencies were more reliant on external influences during T1
and T2 of the job-search process, b 5 .17, t(366) 5 3.63, p <
.001, prep 5 .99. Every one-unit increase in maximizing was
associated with a 0.27 increase in this measure.
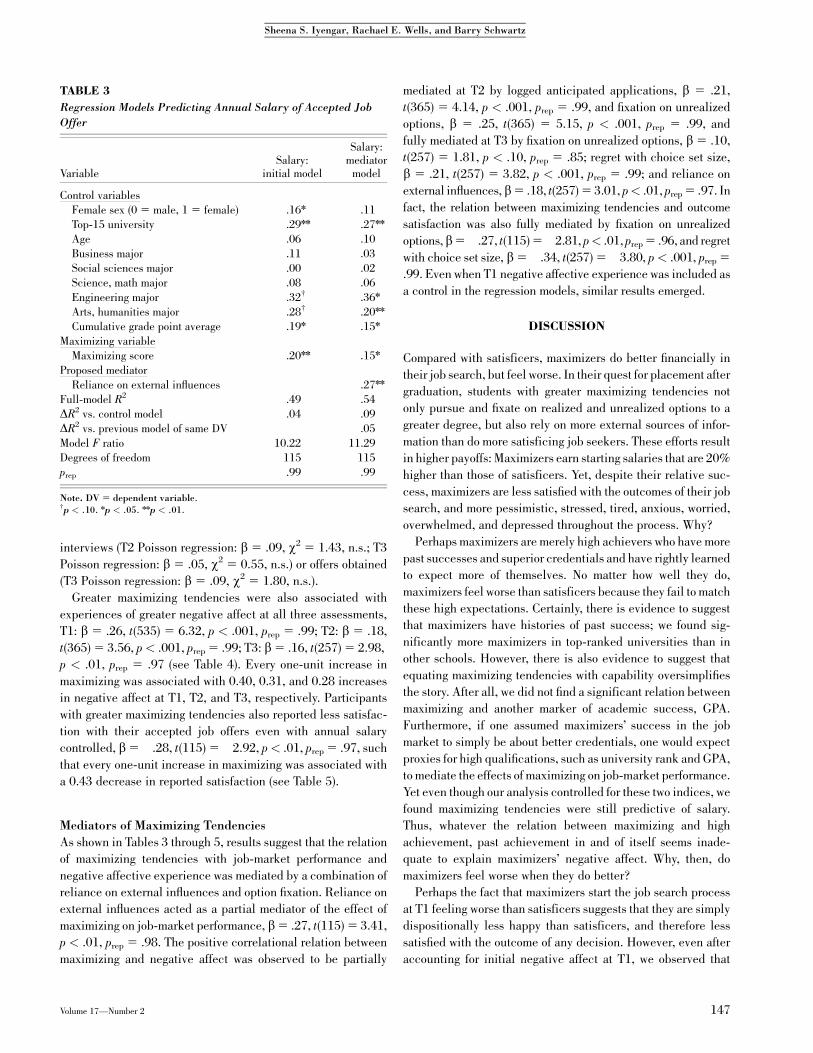
Indeed, job seekers with greater maximizing tendencies were
offered an average of $7,430 more in salary than their satisficing
counterparts, b 5 .20, t(115) 5 2.83, p < .01, prep 5 .96, such
that every one-unit increase in the maximizing composite score
was associated with a $2,630 increase in the annual salary ob-
tained (see Table 3). An analysis based on a median split of the
maximizing scale showed that the mean salary of maximizing job
seekers was $44,515, whereas that of satisficing job seekers was
$37,085. This difference in salary between maximizing and
satisficing job seekers was unaccounted for by the number of
interviews or job offers received, as maximizing tendencies did
not prove to be a significant predictor of either number of
TABLE 1
Means and Standard Deviations for Maximizers and Satisficers
Dependent variable Maximizers Satisficers
Anticipated applicationsa 20 10
Fixation on unrealized options 5.17 (2.55) 4.02 (2.47)
Regret with choice set size 5.09 (2.39) 4.52 (2.20)
Reliance on external influences 5.02 (1.65) 4.65 (1.62)
Salary (in $10K) 4.45 (1.34) 3.71 (1.35)
Negative affect (T1) 5.54 (1.56) 4.81 (1.59)
Negative affect (T2) 5.40 (1.67) 4.81 (1.83)
Negative affect (T3) 4.50 (1.82) 3.91 (1.78)
Outcome satisfaction 7.02 (1.78) 7.58 (1.55)
Note. Standard deviations are provided in parentheses. T1, T2, and T3 refer tothe first, second, and third assessments, respectively.aThe scores reported for anticipated applications are medians, rather thanmeans, and are only for students from universities not ranked within the top 15,as university rank interacted significantly with maximizing tendencies.
TABLE 2
Regression Models Predicting Mediator Variables
Variable
Loggedanticipatedapplications
Fixationon unre-alized
options
Regretwith
choiceset size
Relianceon externalinfluences
Control variables
Female sex (0 5
male, 1 5 female) .03 .00 .04 �.07
Top-15 university .73nn .01 .02 .05
Age .11n �.00 .13n �.17nn
Business major .25nn �.06 .05 .33nn
Social sciences major .24nn �.08 .02 .18
Science, math major .03 �.16n �.05 �.01
Engineering major .21nn �.12 �.06 .11
Education major �.01 �.04 .00 �.04
Arts, humanities
major .12 �.08 .08 �.04
Cumulative grade
point average �.09 �.18nn .02
Offer already accepted
by point of DV
measurement �.09n �.01 �.18nn .21nn
Maximizing variables
Maximizing score .13n .23nn .18nn .17nn
Maximizing Score �Top-15 University �.50n
Full-model R2 .14 .08 .14 .28
DR2 vs. control model .01 .05 .03 .03
Model F ratio 7.06 2.60 3.34 11.28
Degrees of freedom 537 372 263 366
prep .99 .98 .99 .99
Note. DV 5 dependent variable.np < .05. nnp < .01.
1Detailed statistical information yielded by analyses of differences in sub-samples’ characteristics is also available upon request.
146 Volume 17—Number 2
Looking for the ‘‘Best’’ Job Undermines Satisfaction
interviews (T2 Poisson regression: b 5 .09, w2 5 1.43, n.s.; T3
Poisson regression: b 5 .05, w2 5 0.55, n.s.) or offers obtained
(T3 Poisson regression: b 5 .09, w2 5 1.80, n.s.).
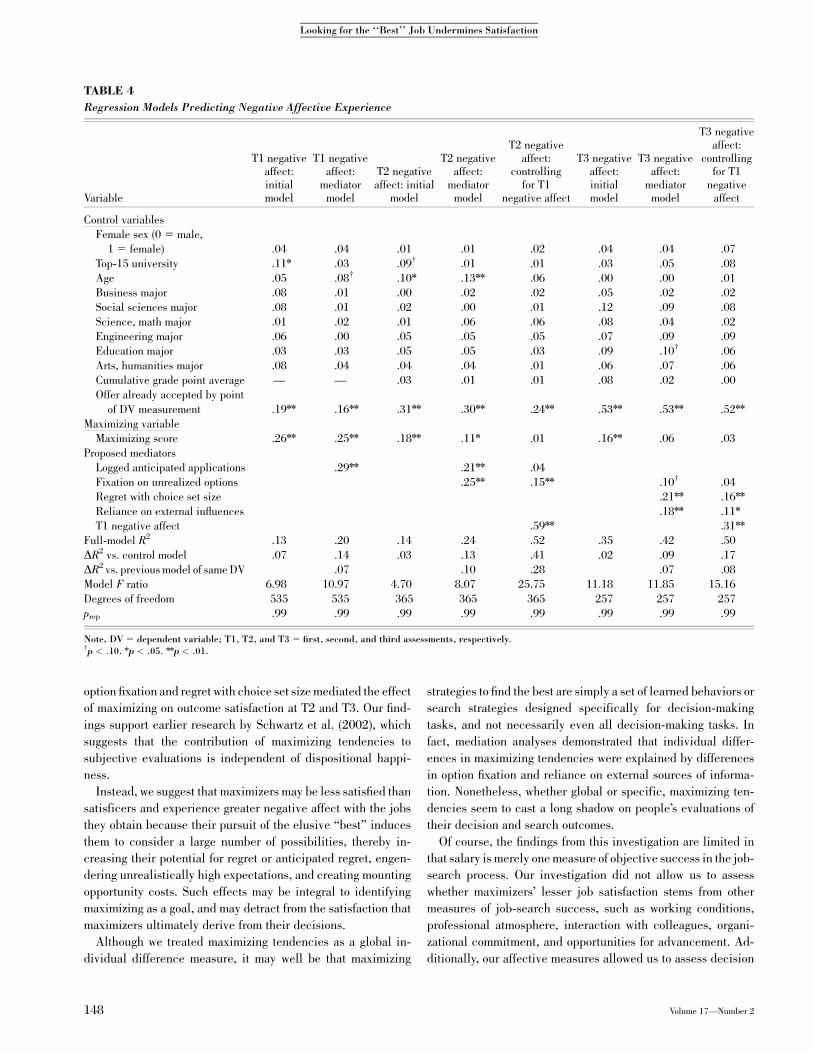
Greater maximizing tendencies were also associated with
experiences of greater negative affect at all three assessments,
T1: b 5 .26, t(535) 5 6.32, p < .001, prep 5 .99; T2: b 5 .18,
t(365) 5 3.56, p< .001, prep 5 .99; T3: b 5 .16, t(257) 5 2.98,
p < .01, prep 5 .97 (see Table 4). Every one-unit increase in
maximizing was associated with 0.40, 0.31, and 0.28 increases
in negative affect at T1, T2, and T3, respectively. Participants
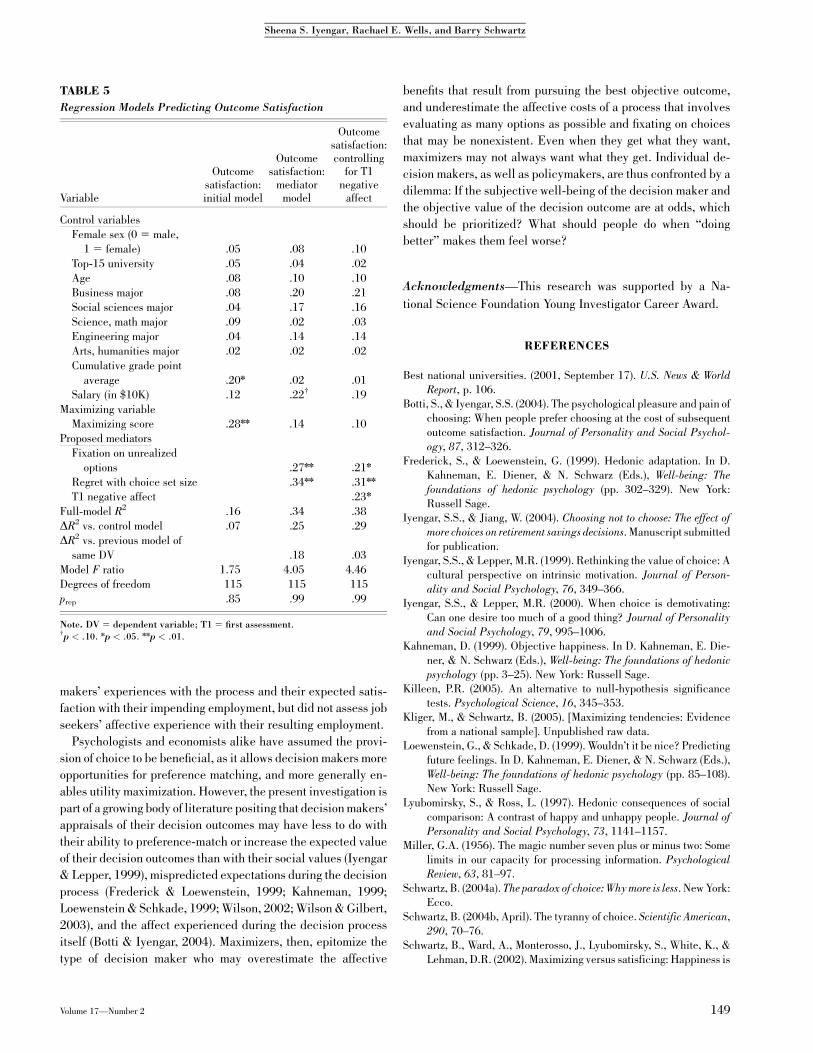
with greater maximizing tendencies also reported less satisfac-
tion with their accepted job offers even with annual salary
controlled, b 5�.28, t(115) 5�2.92, p< .01, prep 5 .97, such
that every one-unit increase in maximizing was associated with
a 0.43 decrease in reported satisfaction (see Table 5).
Mediators of Maximizing Tendencies
As shown in Tables 3 through 5, results suggest that the relation
of maximizing tendencies with job-market performance and
negative affective experience was mediated by a combination of
reliance on external influences and option fixation. Reliance on
external influences acted as a partial mediator of the effect of
maximizing on job-market performance, b 5 .27, t(115) 5 3.41,
p < .01, prep 5 .98. The positive correlational relation between
maximizing and negative affect was observed to be partially
mediated at T2 by logged anticipated applications, b 5 .21,
t(365) 5 4.14, p < .001, prep 5 .99, and fixation on unrealized
options, b 5 .25, t(365) 5 5.15, p < .001, prep 5 .99, and
fully mediated at T3 by fixation on unrealized options, b 5 .10,
t(257) 5 1.81, p < .10, prep 5 .85; regret with choice set size,
b 5 .21, t(257) 5 3.82, p < .001, prep 5 .99; and reliance on
external influences,b5 .18, t(257) 5 3.01, p< .01, prep 5 .97. In
fact, the relation between maximizing tendencies and outcome
satisfaction was also fully mediated by fixation on unrealized
options,b5�.27, t(115) 5�2.81, p< .01, prep 5 .96, and regret
with choice set size, b 5�.34, t(257) 5�3.80, p< .001, prep 5
.99. Even when T1 negative affective experience was included as
a control in the regression models, similar results emerged.
DISCUSSION
Compared with satisficers, maximizers do better financially in
their job search, but feel worse. In their quest for placement after
graduation, students with greater maximizing tendencies not
only pursue and fixate on realized and unrealized options to a
greater degree, but also rely on more external sources of infor-
mation than do more satisficing job seekers. These efforts result
in higher payoffs: Maximizers earn starting salaries that are 20%
higher than those of satisficers. Yet, despite their relative suc-
cess, maximizers are less satisfied with the outcomes of their job
search, and more pessimistic, stressed, tired, anxious, worried,
overwhelmed, and depressed throughout the process. Why?
Perhaps maximizers are merely high achievers who have more
past successes and superior credentials and have rightly learned
to expect more of themselves. No matter how well they do,
maximizers feel worse than satisficers because they fail to match
these high expectations. Certainly, there is evidence to suggest
that maximizers have histories of past success; we found sig-
nificantly more maximizers in top-ranked universities than in
other schools. However, there is also evidence to suggest that
equating maximizing tendencies with capability oversimplifies
the story. After all, we did not find a significant relation between
maximizing and another marker of academic success, GPA.
Furthermore, if one assumed maximizers’ success in the job
market to simply be about better credentials, one would expect
proxies for high qualifications, such as university rank and GPA,
to mediate the effects of maximizing on job-market performance.
Yet even though our analysis controlled for these two indices, we
found maximizing tendencies were still predictive of salary.
Thus, whatever the relation between maximizing and high
achievement, past achievement in and of itself seems inade-
quate to explain maximizers’ negative affect. Why, then, do
maximizers feel worse when they do better?
Perhaps the fact that maximizers start the job search process
at T1 feeling worse than satisficers suggests that they are simply
dispositionally less happy than satisficers, and therefore less
satisfied with the outcome of any decision. However, even after
accounting for initial negative affect at T1, we observed that
TABLE 3
Regression Models Predicting Annual Salary of Accepted Job
Offer
VariableSalary:
initial model
Salary:mediator
model
Control variables
Female sex (0 5 male, 1 5 female) �.16n �.11
Top-15 university .29nn .27nn
Age .06 .10
Business major .11 .03
Social sciences major �.00 .02
Science, math major .08 .06
Engineering major .32w .36n
Arts, humanities major �.28w .20nn
Cumulative grade point average .19n .15n
Maximizing variable
Maximizing score .20nn .15n
Proposed mediator
Reliance on external influences .27nn
Full-model R2 .49 .54
DR2 vs. control model .04 .09
DR2 vs. previous model of same DV .05
Model F ratio 10.22 11.29
Degrees of freedom 115 115
prep .99 .99
Note. DV 5 dependent variable.wp < .10. np < .05. nnp < .01.
Volume 17—Number 2 147
Sheena S. Iyengar, Rachael E. Wells, and Barry Schwartz
option fixation and regret with choice set size mediated the effect
of maximizing on outcome satisfaction at T2 and T3. Our find-
ings support earlier research by Schwartz et al. (2002), which
suggests that the contribution of maximizing tendencies to
subjective evaluations is independent of dispositional happi-
ness.
Instead, we suggest that maximizers may be less satisfied than
satisficers and experience greater negative affect with the jobs
they obtain because their pursuit of the elusive ‘‘best’’ induces
them to consider a large number of possibilities, thereby in-
creasing their potential for regret or anticipated regret, engen-
dering unrealistically high expectations, and creating mounting
opportunity costs. Such effects may be integral to identifying
maximizing as a goal, and may detract from the satisfaction that
maximizers ultimately derive from their decisions.
Although we treated maximizing tendencies as a global in-
dividual difference measure, it may well be that maximizing
strategies to find the best are simply a set of learned behaviors or
search strategies designed specifically for decision-making
tasks, and not necessarily even all decision-making tasks. In
fact, mediation analyses demonstrated that individual differ-
ences in maximizing tendencies were explained by differences
in option fixation and reliance on external sources of informa-
tion. Nonetheless, whether global or specific, maximizing ten-
dencies seem to cast a long shadow on people’s evaluations of
their decision and search outcomes.
Of course, the findings from this investigation are limited in
that salary is merely one measure of objective success in the job-
search process. Our investigation did not allow us to assess
whether maximizers’ lesser job satisfaction stems from other
measures of job-search success, such as working conditions,
professional atmosphere, interaction with colleagues, organi-
zational commitment, and opportunities for advancement. Ad-
ditionally, our affective measures allowed us to assess decision
TABLE 4
Regression Models Predicting Negative Affective Experience
Variable
T1 negativeaffect:initialmodel
T1 negativeaffect:
mediatormodel
T2 negativeaffect: initial
model
T2 negativeaffect:
mediatormodel
T2 negativeaffect:
controllingfor T1
negative affect
T3 negativeaffect:initialmodel
T3 negativeaffect:
mediatormodel
T3 negativeaffect:
controllingfor T1
negativeaffect
Control variables
Female sex (0 5 male,
1 5 female) .04 .04 �.01 �.01 �.02 �.04 �.04 �.07
Top-15 university .11n .03 .09w .01 .01 �.03 �.05 �.08
Age �.05 �.08w �.10n �.13nn �.06 .00 �.00 .01
Business major .08 .01 �.00 �.02 �.02 .05 �.02 .02
Social sciences major .08 .01 .02 .00 �.01 .12 .09 .08
Science, math major �.01 �.02 .01 .06 .06 �.08 �.04 �.02
Engineering major .06 .00 .05 .05 .05 .07 .09 .09
Education major �.03 �.03 .05 .05 .03 .09 .10w .06
Arts, humanities major .08 .04 .04 .04 .01 .06 .07 .06
Cumulative grade point average — — �.03 .01 .01 �.08 �.02 �.00
Offer already accepted by point
of DV measurement �.19nn �.16nn �.31nn �.30nn �.24nn �.53nn �.53nn �.52nn
Maximizing variable
Maximizing score .26nn .25nn .18nn .11n .01 .16nn .06 .03
Proposed mediators
Logged anticipated applications .29nn .21nn .04
Fixation on unrealized options .25nn .15nn .10w .04
Regret with choice set size .21nn .16nn
Reliance on external influences .18nn .11n
T1 negative affect .59nn .31nn
Full-model R2 .13 .20 .14 .24 .52 .35 .42 .50
DR2 vs. control model .07 .14 .03 .13 .41 .02 .09 .17
DR2 vs. previous model of same DV .07 .10 .28 .07 .08
Model F ratio 6.98 10.97 4.70 8.07 25.75 11.18 11.85 15.16
Degrees of freedom 535 535 365 365 365 257 257 257
prep .99 .99 .99 .99 .99 .99 .99 .99
Note. DV 5 dependent variable; T1, T2, and T3 5 first, second, and third assessments, respectively.wp < .10. np < .05. nnp < .01.
148 Volume 17—Number 2
Looking for the ‘‘Best’’ Job Undermines Satisfaction
makers’ experiences with the process and their expected satis-
faction with their impending employment, but did not assess job
seekers’ affective experience with their resulting employment.
Psychologists and economists alike have assumed the provi-
sion of choice to be beneficial, as it allows decision makers more
opportunities for preference matching, and more generally en-
ables utility maximization. However, the present investigation is
part of a growing body of literature positing that decision makers’
appraisals of their decision outcomes may have less to do with
their ability to preference-match or increase the expected value
of their decision outcomes than with their social values (Iyengar
& Lepper, 1999), mispredicted expectations during the decision
process (Frederick & Loewenstein, 1999; Kahneman, 1999;
Loewenstein & Schkade, 1999; Wilson, 2002; Wilson & Gilbert,
2003), and the affect experienced during the decision process
itself (Botti & Iyengar, 2004). Maximizers, then, epitomize the
type of decision maker who may overestimate the affective
benefits that result from pursuing the best objective outcome,
and underestimate the affective costs of a process that involves
evaluating as many options as possible and fixating on choices
that may be nonexistent. Even when they get what they want,
maximizers may not always want what they get. Individual de-
cision makers, as well as policymakers, are thus confronted by a
dilemma: If the subjective well-being of the decision maker and
the objective value of the decision outcome are at odds, which
should be prioritized? What should people do when ‘‘doing
better’’ makes them feel worse?
Acknowledgments—This research was supported by a Na-
tional Science Foundation Young Investigator Career Award.
REFERENCES
Best national universities. (2001, September 17). U.S. News & WorldReport, p. 106.
Botti, S., & Iyengar, S.S. (2004). The psychological pleasure and pain of
choosing: When people prefer choosing at the cost of subsequent
outcome satisfaction. Journal of Personality and Social Psychol-ogy, 87, 312–326.
Frederick, S., & Loewenstein, G. (1999). Hedonic adaptation. In D.
Kahneman, E. Diener, & N. Schwarz (Eds.), Well-being: Thefoundations of hedonic psychology (pp. 302–329). New York:
Russell Sage.
Iyengar, S.S., & Jiang, W. (2004). Choosing not to choose: The effect ofmore choices on retirement savings decisions. Manuscript submitted
for publication.
Iyengar, S.S., & Lepper, M.R. (1999). Rethinking the value of choice: A
cultural perspective on intrinsic motivation. Journal of Person-ality and Social Psychology, 76, 349–366.
Iyengar, S.S., & Lepper, M.R. (2000). When choice is demotivating:
Can one desire too much of a good thing? Journal of Personalityand Social Psychology, 79, 995–1006.
Kahneman, D. (1999). Objective happiness. In D. Kahneman, E. Die-
ner, & N. Schwarz (Eds.), Well-being: The foundations of hedonicpsychology (pp. 3–25). New York: Russell Sage.
Killeen, P.R. (2005). An alternative to null-hypothesis significance
tests. Psychological Science, 16, 345–353.
Kliger, M., & Schwartz, B. (2005). [Maximizing tendencies: Evidence
from a national sample]. Unpublished raw data.
Loewenstein, G., & Schkade, D. (1999). Wouldn’t it be nice? Predicting
future feelings. In D. Kahneman, E. Diener, & N. Schwarz (Eds.),
Well-being: The foundations of hedonic psychology (pp. 85–108).
New York: Russell Sage.
Lyubomirsky, S., & Ross, L. (1997). Hedonic consequences of social
comparison: A contrast of happy and unhappy people. Journal ofPersonality and Social Psychology, 73, 1141–1157.
Miller, G.A. (1956). The magic number seven plus or minus two: Some
limits in our capacity for processing information. PsychologicalReview, 63, 81–97.
Schwartz, B. (2004a). The paradox of choice: Why more is less. New York:
Ecco.
Schwartz, B. (2004b, April). The tyranny of choice. Scientific American,
290, 70–76.
Schwartz, B., Ward, A., Monterosso, J., Lyubomirsky, S., White, K., &
Lehman, D.R. (2002). Maximizing versus satisficing: Happiness is
TABLE 5
Regression Models Predicting Outcome Satisfaction
Variable
Outcomesatisfaction:initial model
Outcomesatisfaction:
mediatormodel
Outcomesatisfaction:controlling
for T1negative
affect
Control variables
Female sex (0 5 male,
1 5 female) .05 .08 .10
Top-15 university �.05 �.04 �.02
Age �.08 �.10 �.10
Business major �.08 �.20 �.21
Social sciences major �.04 �.17 �.16
Science, math major .09 .02 .03
Engineering major .04 �.14 �.14
Arts, humanities major �.02 �.02 �.02
Cumulative grade point
average .20n .02 .01
Salary (in $10K) .12 .22w .19
Maximizing variable
Maximizing score �.28nn �.14 �.10
Proposed mediators
Fixation on unrealized
options �.27nn �.21n
Regret with choice set size �.34nn �.31nn
T1 negative affect �.23n
Full-model R2 .16 .34 .38
DR2 vs. control model .07 .25 .29
DR2 vs. previous model of
same DV .18 .03
Model F ratio 1.75 4.05 4.46
Degrees of freedom 115 115 115
prep .85 .99 .99
Note. DV 5 dependent variable; T1 5 first assessment.wp < .10. np < .05. nnp < .01.
Volume 17—Number 2 149
Sheena S. Iyengar, Rachael E. Wells, and Barry Schwartz
a matter of choice. Journal of Personality and Social Psychology,
83, 1178–1197.
Simon, H.A. (1955). A behavioral model of rational choice. QuarterlyJournal of Economics, 59, 99–118.
Simon, H.A. (1956). Rational choice and the structure of the environ-
ment. Psychological Review, 63, 129–138.
Simon, H.A. (1957). Models of man, social and rational: Mathematicalessays on rational human behavior. New York: Wiley.
Wilson, T.D. (2002). Strangers to ourselves: Discovering the adaptiveunconscious. Cambridge, MA: Harvard University Press.
Wilson, T.D., & Gilbert, D.T. (2003). Affective forecasting. In M.P.
Zanna (Ed.), Advances in experimental social psychology (Vol. 35,
pp. 345–411). San Diego, CA: Academic Press.
(RECEIVED 6/2/04; REVISION ACCEPTED 7/25/05;FINAL MATERIALS RECEIVED 9/13/05)
150 Volume 17—Number 2
Looking for the ‘‘Best’’ Job Undermines Satisfaction