research article development of low-fat soft dough
TRANSCRIPT

Hindawi Publishing CorporationInternational Journal of Food ScienceVolume 2013, Article ID 576153, 12 pageshttp://dx.doi.org/10.1155/2013/576153
Research ArticleDevelopment of Low-Fat Soft Dough Biscuits UsingCarbohydrate-Based Fat Replacers
Bhawna Chugh,1 Gurmukh Singh,1 and B. K. Kumbhar2
1 Department of Food Science & Technology, G. B. Pant University of Agriculture and Technology,Uttarakhand, Pantnagar 263145, India
2Department of Post Harvest Process and Food Engineering, G. B. Pant University of Agriculture and Technology,Uttarakhand, Pantnagar 263145, India
Correspondence should be addressed to Bhawna Chugh; [email protected]
Received 8 January 2013; Revised 14 March 2013; Accepted 25 March 2013
Academic Editor: Marie Walsh
Copyright © 2013 Bhawna Chugh et al.This is an open access article distributed under the Creative Commons Attribution License,which permits unrestricted use, distribution, and reproduction in any medium, provided the original work is properly cited.
Experiments were conducted to develop low-fat soft dough biscuits using carbohydrate-based fat replacers (maltodextrin andguar gum). A central composite rotatable design was used to optimise the level of sugar 24–36%, composite fat (fat 10.5–24.5%,maltodextrin 10.4–24%, and guar gum 0.1–0.5%), ammonium bicarbonate 0.5–2.5%, and water 20–24% for production of low-fatbiscuits. Diameter (𝑃 < 0.01) and stress-strain ratio (𝑃 < 0.05) decreased significantly with increase in the amount of sugar. Therewas a significant decrease (𝑃 < 0.01) in spread ratio at high amount of water. Hardness was significantly affected by the interactionsof ammonium bicarbonate with sugar (𝑃 < 0.05) and fat (𝑃 < 0.1). The optimum level of ingredients obtained for low-fat biscuitswas sugar 31.7 g, fat 13.55 g, maltodextrin 21.15 g, guar gum 0.3 g, ammonium bicarbonate 2.21 g, and water 21mL based on 100 gflour. The fat level in the optimised low-fat biscuit formulation was found to be 8.48% as compared to 22.65% in control; therefore,the reduction in fat was 62.5%.
1. Introduction
The Indian bakery industry is the largest of the food pro-cessing industries, estimated to be over $1,400 million. Themajor products within this industry include bread, cakes,pastries, and biscuits. Short dough biscuits are productsmadefrom soft and weak wheat flours and are characterised bya formula high in sugar and shortening. Fat in a biscuitformulation has a multifaceted function. It is the principalingredient responsible for tenderness, keeping quality, grain,and texture, and adding richness to biscuits [1].
The food industry is primarily driven by consumer healthtrends. A present day dietary concern is the consumptionof a large amount of fat and sugar. With the growingincidence of obesity and diabetes, low calorie foods havegained immense popularity. Most well-maintained strategiesin terms of fat reduction diets involve either the use of low-fat foods or fat substitutes or modifications such as trimmingof fat from foods. So, the use of fat mimetics instead ofconventional fats and oils helps in reducing calorie intake,
whereas fat substitutes are either resistant to digestive lipasesor partially digested [2, 3]. Fat replacers are grouped broadlyinto either lipid-, carbohydrate-, or protein-based materials.Carbohydrate-based replacers incorporate water into a geltype structure, resulting in lubricant or flow propertiessimilar to those of fats in some food systems. It is likelythat desirable textures can be achieved using these types ofsubstitutes, and there are few regulatory obstacles regardingany toxicological potential [2]. Maltodextrin can be usedin a gram-for-gram fat replacement in bakery goods thatprovides 4 kcal or 16.8 kJ/g [4]. Maltodextrins generally havea DE (dextrose equivalent) between 3 and 20. The higher theDE value, the higher the solubility and sweetness. Gums arereferred to as hydrophilic colloids which can fulfil some of thebulking properties of sucrose and fat.The replacement of 50%of fat by soluble 𝛽-glucan and amylodextrins derived fromoat flour resulted in cookies not significantly different fromthe full-fat ones, but at higher substitution levels moistnessand overall quality were decreased [5]. Also tenderness ofbiscuits decreased with the increase of fat substitution by

2 International Journal of Food Science
pectin, gum, or oat-based fatmimetics [6].The previousworkon fat replacers indicated that polydextrose, maltodextrins,and Simplesse are themost appropriate as far as cookies prop-erties are concerned, but the main problem noted is the highhardness of the biscuits [7]. Gallagher et al. [8] developedlow-fat biscuits using sugar and fat replacers and reportedtheir effect on biscuit dimensions, colour, and texture. Sudhaet al. [9] also reported the effect of fat replacers, namely,maltodextrin and polydextrose, on the biscuit hardness.
Flour, sugar, fat, water, and salt are the main componentsin a biscuit formulation. Changes made to these principalcomponents have significant effects on final biscuit quality[10, 11]. Fat level and type have a significant effect onthe rheological characteristics of biscuit dough and on theproperties of the baked biscuits [12]. Replacement of thesensory properties of fat is difficult in low moisture bakeryfoods like cookies with final moisture between 3 and 4%[13]. Sugar delivers sweetness, influences the structural andtextural properties of cookies, and enhances incorporation ofair into the fat during cookie dough preparation. Increasingwater quantity produced a reduction of consistency andan increase in fluidity and in adhesiveness of dough. Thequantity of water affected the behaviour of the dough afterbaking. A slight increase in biscuit length was observedwhen the water content was increased particularly from 21%upwards [14].
The main objective of this study was to develop low-fat biscuits using combinations of carbohydrate-based fatreplacers. Moreover, to produce acceptable quality low-fatbiscuit, the level of other ingredients, namely, sugar, ammo-nium bicarbonate, and water, was varied to take into accountthe synergetic effect on the physical and sensory parameters.The response surface methodology was used to minimisethe number of baking trials while gathering all informationrelating to ingredient interactions and quality characteristics.
2. Materials and Methods
2.1. Materials. Refined wheat flour, whole wheat flour, sugar,sodium bicarbonate, ammonium bicarbonate, skim milkpowder, vanilla essence, and hydrogenated fat were pro-cured from local market. Liquid glucose was collected fromUttarakhand maize processing unit, SIDCUL, Rudrapur,Uttarakhand, India. Carbohydrate based fat replacers, mal-todextrin (DE = 16) and guar gum, were procured fromM/s Ensigns Healthcare Private Ltd., Pune, Maharashtraand Hindustan Gum and Chemicals Ltd., Bhiwani, Haryana,India.
2.2. Experimental Plan. Response surface methodologywhich involves design of experiments, selection of levelsof variables in experimental runs, fitting mathematicalmodels, and finally selecting variables’ level by optimizingthe response was employed in the study [15]. A centralcomposite rotatable design (CCRD) was used to designthe experiments comprising of four independent variables(Table 1). The parameters that influence the product qualityand acceptability were taken as responses. The statistical
software package Design-Expert 8.0.6 (Trial version), Stat-Ease Inc., Minneapolis, USA (http://www.statease.com/),was used to construct the experimental design as well asanalyze the data. The experimental design and the codes forthe processing variables have been reported in Table 1. A totalof 32 combinations were generated for the four independentvariables, and the experiments at centre point were repeatedeight times. The magnitude of the effect of independentvariables on the responses was based on magnitude ofregression coefficients.
2.3. Preparation of Biscuits. Biscuits were prepared usingtraditional creamery method given by Whitley [16]. Forpreparation of low-fat biscuits, sugar, fat, maltodextrin, guargum, ammonium bicarbonate, and water were mixed in thequantities on 100 g flour (63.7 g white flour and 36.3 g wholewheat flour) basis as per the experimental design to formdifferent formulations. In these formulations, fixed amountsof liquid glucose (3 g), skim milk powder (3 g), sodiumbicarbonate (1.18 g), and vanilla essence (4 drops)weremixed.
The control biscuit formulation contained the followingingredients at the indicated level: flour, 100 g (63.7 g whiteflour and 36.3 g whole wheat flour); liquid glucose, 3 g; skimmilk powder, 3 g; sodium bicarbonate, 1.18 g; vanilla essence(4 drops); sugar, 26.5 g; fat, 35 g; ammonium bicarbonate,1.22 g; water, 23 mL [16].
The dough was sheeted to 4mm height biscuits whichwere baked in an air circulation oven at 190 ± 2∘C for 8min.The biscuits were cooled for 30min at room temperatureand stored in low density polyethylene packs before furtheranalysis.
2.4. Physical and Chemical Evaluation of the Biscuits. Thebiscuit diameter and thickness were determined by AACC[17] methods. Spread ratio was then calculated as diameterdivided by thickness of the biscuit. Crude fat was determinedusing standard AOAC [18] method.
2.5. Texture Analysis. Hardness of biscuits was measured byStable Micro Systems Texture Analyzer (TAXT 2i). It wasmeasured in terms of maximum force used to break thebiscuit sample. The biscuits were placed under sharp bladecutting probe, 70mm long and 0.4mm thick. The analyzerwas set at a “return to start” cycle, a speed of 1mm/s anda distance of 3mm, and pretest speed 5mm/s and posttestspeed 10mm/s. The maximum force was expressed in N.Stress was calculated by dividing the maximum force by areaof blade, and strain was expressed as the maximum distancetravelled by probe to break the biscuit. All measurementswere replicated six times, and the mean values are reported.
2.6. Sensory Evaluation. Ten semitrained panelists carriedsensory evaluation of low-fat soft dough biscuits and com-pared with the control samples. Three 1-hour preliminarysessions were conducted to train the panelists so as tofamiliarize themselves with the samples. In the first session,the subjects described two very different biscuits (control andlow-fat biscuit) and mainly focussed on the texture change.
International Journal of Food Science 3
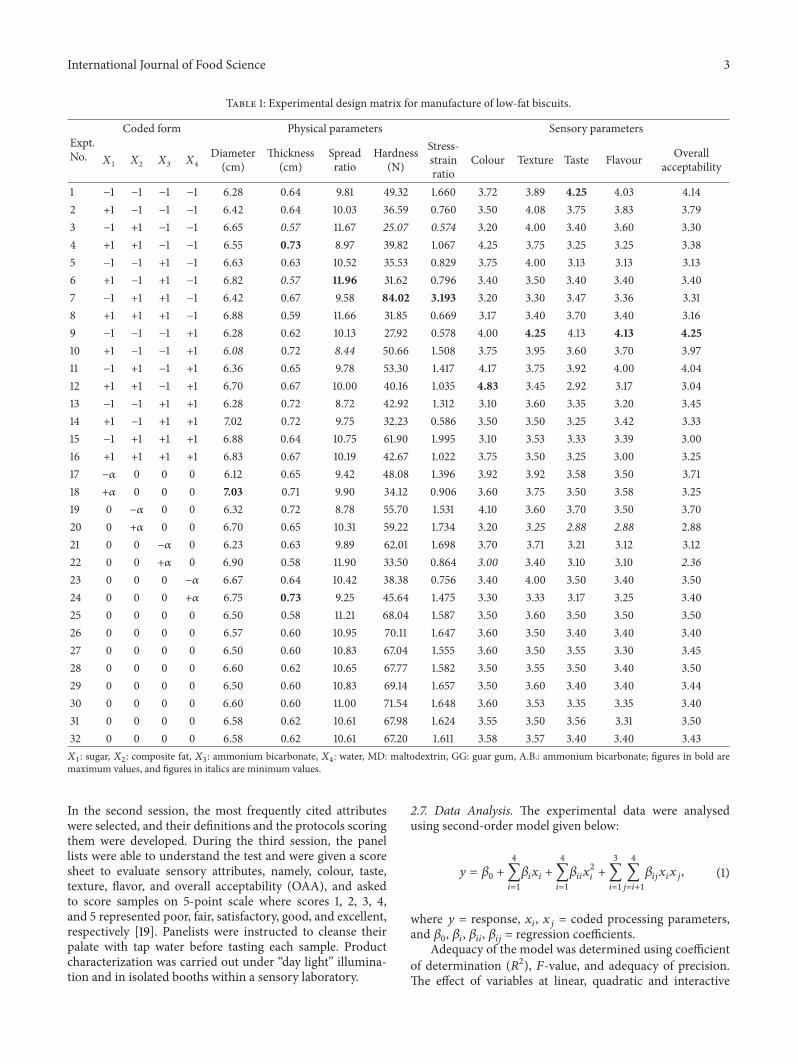
Table 1: Experimental design matrix for manufacture of low-fat biscuits.
Expt.No.
Coded form Physical parameters Sensory parameters
𝑋1
𝑋2
𝑋3
𝑋4
Diameter(cm)
Thickness(cm)
Spreadratio
Hardness(N)
Stress-strainratio
Colour Texture Taste Flavour Overallacceptability
1 −1 −1 −1 −1 6.28 0.64 9.81 49.32 1.660 3.72 3.89 4.25 4.03 4.142 +1 −1 −1 −1 6.42 0.64 10.03 36.59 0.760 3.50 4.08 3.75 3.83 3.793 −1 +1 −1 −1 6.65 0.57 11.67 25.07 0.574 3.20 4.00 3.40 3.60 3.304 +1 +1 −1 −1 6.55 0.73 8.97 39.82 1.067 4.25 3.75 3.25 3.25 3.385 −1 −1 +1 −1 6.63 0.63 10.52 35.53 0.829 3.75 4.00 3.13 3.13 3.136 +1 −1 +1 −1 6.82 0.57 11.96 31.62 0.796 3.40 3.50 3.40 3.40 3.407 −1 +1 +1 −1 6.42 0.67 9.58 84.02 3.193 3.20 3.30 3.47 3.36 3.318 +1 +1 +1 −1 6.88 0.59 11.66 31.85 0.669 3.17 3.40 3.70 3.40 3.169 −1 −1 −1 +1 6.28 0.62 10.13 27.92 0.578 4.00 4.25 4.13 4.13 4.2510 +1 −1 −1 +1 6.08 0.72 8.44 50.66 1.508 3.75 3.95 3.60 3.70 3.9711 −1 +1 −1 +1 6.36 0.65 9.78 53.30 1.417 4.17 3.75 3.92 4.00 4.0412 +1 +1 −1 +1 6.70 0.67 10.00 40.16 1.035 4.83 3.45 2.92 3.17 3.0413 −1 −1 +1 +1 6.28 0.72 8.72 42.92 1.312 3.10 3.60 3.35 3.20 3.4514 +1 −1 +1 +1 7.02 0.72 9.75 32.23 0.586 3.50 3.50 3.25 3.42 3.3315 −1 +1 +1 +1 6.88 0.64 10.75 61.90 1.995 3.10 3.53 3.33 3.39 3.0016 +1 +1 +1 +1 6.83 0.67 10.19 42.67 1.022 3.75 3.50 3.25 3.00 3.2517 −𝛼 0 0 0 6.12 0.65 9.42 48.08 1.396 3.92 3.92 3.58 3.50 3.7118 +𝛼 0 0 0 7.03 0.71 9.90 34.12 0.906 3.60 3.75 3.50 3.58 3.2519 0 −𝛼 0 0 6.32 0.72 8.78 55.70 1.531 4.10 3.60 3.70 3.50 3.7020 0 +𝛼 0 0 6.70 0.65 10.31 59.22 1.734 3.20 3.25 2.88 2.88 2.8821 0 0 −𝛼 0 6.23 0.63 9.89 62.01 1.698 3.70 3.71 3.21 3.12 3.1222 0 0 +𝛼 0 6.90 0.58 11.90 33.50 0.864 3.00 3.40 3.10 3.10 2.3623 0 0 0 −𝛼 6.67 0.64 10.42 38.38 0.756 3.40 4.00 3.50 3.40 3.5024 0 0 0 +𝛼 6.75 0.73 9.25 45.64 1.475 3.30 3.33 3.17 3.25 3.4025 0 0 0 0 6.50 0.58 11.21 68.04 1.587 3.50 3.60 3.50 3.50 3.5026 0 0 0 0 6.57 0.60 10.95 70.11 1.647 3.60 3.50 3.40 3.40 3.4027 0 0 0 0 6.50 0.60 10.83 67.04 1.555 3.60 3.50 3.55 3.30 3.4528 0 0 0 0 6.60 0.62 10.65 67.77 1.582 3.50 3.55 3.50 3.40 3.5029 0 0 0 0 6.50 0.60 10.83 69.14 1.657 3.50 3.60 3.40 3.40 3.4430 0 0 0 0 6.60 0.60 11.00 71.54 1.648 3.60 3.53 3.35 3.35 3.4031 0 0 0 0 6.58 0.62 10.61 67.98 1.624 3.55 3.50 3.56 3.31 3.5032 0 0 0 0 6.58 0.62 10.61 67.20 1.611 3.58 3.57 3.40 3.40 3.43𝑋1: sugar, 𝑋
2: composite fat, 𝑋
3: ammonium bicarbonate, 𝑋
4: water, MD: maltodextrin, GG: guar gum, A.B.: ammonium bicarbonate; figures in bold are
maximum values, and figures in italics are minimum values.
In the second session, the most frequently cited attributeswere selected, and their definitions and the protocols scoringthem were developed. During the third session, the panellists were able to understand the test and were given a scoresheet to evaluate sensory attributes, namely, colour, taste,texture, flavor, and overall acceptability (OAA), and askedto score samples on 5-point scale where scores 1, 2, 3, 4,and 5 represented poor, fair, satisfactory, good, and excellent,respectively [19]. Panelists were instructed to cleanse theirpalate with tap water before tasting each sample. Productcharacterization was carried out under “day light” illumina-tion and in isolated booths within a sensory laboratory.
2.7. Data Analysis. The experimental data were analysedusing second-order model given below:
𝑦 = 𝛽0+
4
∑𝑖=1
𝛽𝑖𝑥𝑖+
4
∑𝑖=1
𝛽𝑖𝑖𝑥2
𝑖
+
3
∑𝑖=1
4
∑𝑗=𝑖+1
𝛽𝑖𝑗𝑥𝑖𝑥𝑗, (1)
where 𝑦 = response, 𝑥𝑖, 𝑥𝑗= coded processing parameters,
and 𝛽0, 𝛽𝑖, 𝛽𝑖𝑖, 𝛽𝑖𝑗= regression coefficients.
Adequacy of the model was determined using coefficientof determination (𝑅2), 𝐹-value, and adequacy of precision.The effect of variables at linear, quadratic and interactive

4 International Journal of Food Science
levels on the response was described using various levels ofsignificance.
Numerical optimization technique of the Design-Expert(8.0.6) software was used for simultaneous optimization ofthe multiple responses, and for this some constraints hadto be decided. These constraints set the guidelines to getthe desired results. The goal seeking begins at a randomstarting point and proceeds up or down the steepest stopon the response surface for a maximum or minimum valueof a response, respectively. The response values and theanalysis of the models gave the valuable information indeciding constraints for independent variables and responses.Therefore, all the independent variables were kept withinexperimental range except composite fat which was kept atminimum as our main goal is to produce low-fat biscuit.Themultiple responses, namely, spread ratio, hardness, stress-strain ratio, and overall acceptability (OAA), were consid-ered for optimization as they represent quality attributesadequately. The numerical optimization finds a point thatmaximizes the desirability function.
3. Results and Discussion
The experimental results for physical and sensory parametersare reported in Table 1.The product with varied formulationshad diameter, thickness, spread ratio, hardness, and stress-strain ratio in the ranges of 6.08–7.03 cm, 0.57–0.73 cm,8.44–11.96, 25.07–84.02N, and 0.574–3.19, respectively. Thesensory score ranged 3.00–4.83, 3.25–4.25, 2.88–4.25, 2.88–4.13, and 2.36–4.25 for colour, texture, taste, flavor, and OAA,respectively.The corresponding values of physical parametersfor control biscuits were 5.98 cm, 0.62 cm, 9.64, 32.52N, and0.73, respectively, while for sensory parameters were 4.5, 4.0,3.33, 3.83, and 4.02, respectively. Most of the combinationswere better than the control formulation.
The Design-Expert software was used to fit the second-order response surface model (1) into the experimental dataof all responses using regression analysis, and the resultingpredictive equations are given below. All models have ade-quate precision ratio of more than 4, thus indicative of thefact that the experiments were carried out with adequateprecision, and moreover, the 𝐹-value was found significantin all models:
diameter (𝑦) = 6.5537 + 0.1391 ∗ 𝑋1
+ 0.0925 ∗ 𝑋2+ 0.1575 ∗ 𝑋
3
− 0.0025 ∗ 𝑋4− 0.0137 ∗ 𝑋
1∗ 𝑋2
+ 0.0725 ∗ 𝑋1∗ 𝑋3+ 0.0087 ∗ 𝑋
1∗ 𝑋4
− 0.058 ∗ 𝑋2∗ 𝑋3+ 0.0475 ∗ 𝑋
2∗ 𝑋4
+ 0.0462 ∗ 𝑋3∗ 𝑋4+ 0.0015 ∗ 𝑋
1∗ 𝑋1
− 0.0146 ∗ 𝑋2∗ 𝑋2− 0.0009 ∗ 𝑋
3∗ 𝑋3
+ 0.0353 ∗ 𝑋4∗ 𝑋4(𝑅2
= 79.84%) ,
thickness (𝑦) = 0.605 + 0.0120 ∗ 𝑋1
− 0.0087 ∗ 𝑋2− 0.0054 ∗ 𝑋
3
+ 0.0229 ∗ 𝑋4+ 0.0056 ∗ 𝑋
1∗ 𝑋2
− 0.0243 ∗ 𝑋1∗ 𝑋3+ 0.0081 ∗ 𝑋
1∗ 𝑋4
− 0.0043 ∗ 𝑋2∗ 𝑋3− 0.0143 ∗ 𝑋
2∗ 𝑋4
+ 0.0131 ∗ 𝑋3∗ 𝑋4+ 0.0169 ∗ 𝑋
1∗ 𝑋1
+ 0.0182 ∗ 𝑋2∗ 𝑋2− 0.0017 ∗ 𝑋
3∗ 𝑋3
+ 0.0182 ∗ 𝑋4∗ 𝑋4(𝑅2
= 79.72%) ,
spread ratio (𝑦)
= 10.8368 + 0.0424 ∗ 𝑋1
+ 0.2621 ∗ 𝑋2+ 0.3467 ∗ 𝑋
3
− 0.366 ∗ 𝑋4− 0.1224 ∗ 𝑋
1∗ 𝑋2
+ 0.4960 ∗ 𝑋1∗ 𝑋3− 0.1276 ∗ 𝑋
1∗ 𝑋4
− 0.0487 ∗ 𝑋2∗ 𝑋3+ 0.2583 ∗ 𝑋
2∗ 𝑋4
− 0.1369 ∗ 𝑋3∗ 𝑋4− 0.2708 ∗ 𝑋
1∗ 𝑋1
− 0.2998 ∗ 𝑋2∗ 𝑋2+ 0.0376 ∗ 𝑋
3∗ 𝑋3
− 0.2269 ∗ 𝑋4∗ 𝑋4(𝑅2
= 75.66%) ,
hardness (𝑦) = 68.6025 − 4.2627 ∗ 𝑋1
+ 3.2931 ∗ 𝑋2− 0.7124 ∗ 𝑋
3
+ 1.3522 ∗ 𝑋4− 4.075 ∗ 𝑋
1∗ 𝑋2
− 6.1027 ∗ 𝑋1∗ 𝑋3+ 2.1093 ∗ 𝑋
1∗ 𝑋4
+ 5.2673 ∗ 𝑋2∗ 𝑋3+ 1.037 ∗ 𝑋
2∗ 𝑋4
− 1.5337 ∗ 𝑋3∗ 𝑋4− 7.5804 ∗ 𝑋
1∗ 𝑋1
− 3.4916 ∗ 𝑋2∗ 𝑋2− 5.9171 ∗ 𝑋
3∗ 𝑋3
− 7.3353 ∗ 𝑋4∗ 𝑋4(𝑅2
= 77.71%) ,stress-strain ratio (𝑦)
= 1.6139 − 0.2123 ∗ 𝑋1
+ 0.1394 ∗ 𝑋2+ 0.0056 ∗ 𝑋
3
+ 0.0559 ∗ 𝑋4− 0.1659 ∗ 𝑋
1∗ 𝑋2
− 0.2748 ∗ 𝑋1∗ 𝑋3+ 0.1132 ∗ 𝑋
1∗ 𝑋4
+ 0.2355 ∗ 𝑋2∗ 𝑋3+ 0.0017 ∗ 𝑋
2∗ 𝑋4
− 0.0656 ∗ 𝑋3∗ 𝑋4− 0.1336 ∗ 𝑋
1∗ 𝑋1
− 0.0132 ∗ 𝑋2∗ 𝑋2− 0.1012 ∗ 𝑋
3∗ 𝑋3
− 0.1424 ∗ 𝑋4∗ 𝑋4(𝑅2
= 62.87%) ,

International Journal of Food Science 5
colour (𝑦) = 3.5537 + 0.0529 ∗ 𝑋1
+ 0.0354 ∗ 𝑋2− 0.2437 ∗ 𝑋
3
+ 0.0754 ∗ 𝑋4+ 0.1718 ∗ 𝑋
1∗ 𝑋2
− 0.0356 ∗ 𝑋1∗ 𝑋3+ 0.0631 ∗ 𝑋
1∗ 𝑋4
− 0.1256 ∗ 𝑋2∗ 𝑋3+ 0.1281 ∗ 𝑋
2∗ 𝑋4
− 0.1343 ∗ 𝑋3∗ 𝑋4+ 0.0718 ∗ 𝑋
1∗ 𝑋1
+ 0.0443 ∗ 𝑋2∗ 𝑋2− 0.0306 ∗ 𝑋
3∗ 𝑋3
− 0.0306 ∗ 𝑋4∗ 𝑋4(𝑅2
= 72.0%) ,texture (𝑦) = 3.5437 − 0.0637 ∗ 𝑋
1
− 0.1162 ∗ 𝑋2− 0.142 ∗ 𝑋
3
− 0.072 ∗ 𝑋4+ 0.0143 ∗ 𝑋
1∗ 𝑋2
+ 0.0081 ∗ 𝑋1∗ 𝑋3− 0.0168 ∗ 𝑋
1∗ 𝑋4
+ 0.0218 ∗ 𝑋2∗ 𝑋3− 0.0031 ∗ 𝑋
2∗ 𝑋4
+ 0.0156 ∗ 𝑋3∗ 𝑋4+ 0.0887 ∗ 𝑋
1∗ 𝑋1
− 0.0137 ∗ 𝑋2∗ 𝑋2+ 0.0187 ∗ 𝑋
3∗ 𝑋3
+ 0.0462 ∗ 𝑋4∗ 𝑋4(𝑅2
= 71.0%) ,
taste (𝑦) = 3.4575 − 0.08417 ∗ 𝑋1
− 0.1358 ∗ 𝑋2− 0.1066 ∗ 𝑋
3
− 0.0525 ∗ 𝑋4− 0.0087 ∗ 𝑋
1∗ 𝑋2
+ 0.1562 ∗ 𝑋1∗ 𝑋3− 0.0975 ∗ 𝑋
1∗ 𝑋4
+ 0.1787 ∗ 𝑋2∗ 𝑋3− 0.0125 ∗ 𝑋
2∗ 𝑋4
− 0.0275 ∗ 𝑋3∗ 𝑋4+ 0.05 ∗ 𝑋
1∗ 𝑋1
− 0.0125 ∗ 𝑋2∗ 𝑋2− 0.0462 ∗ 𝑋
3∗ 𝑋3
− 0.0012 ∗ 𝑋4∗ 𝑋4(𝑅2
= 79.27%) ,
flavour (𝑦) = 33.3825 − 0.0629 ∗ 𝑋1
− 0.1212 ∗ 𝑋2− 0.1437 ∗ 𝑋
3
− 0.012 ∗ 𝑋4− 0.0868 ∗ 𝑋
1∗ 𝑋2
+ 0.1218 ∗ 𝑋1∗ 𝑋3− 0.0743 ∗ 𝑋
1∗ 𝑋4
+ 0.1043 ∗ 𝑋2∗ 𝑋3− 0.0068 ∗ 𝑋
2∗ 𝑋4
− 0.0356 ∗ 𝑋3∗ 𝑋4+ 0.0742 ∗ 𝑋
1∗ 𝑋1
− 0.0132 ∗ 𝑋2∗ 𝑋2− 0.0332 ∗ 𝑋
3∗ 𝑋3
+ 0.0205 ∗ 𝑋4∗ 𝑋4(𝑅2
= 72.97%) ,
overall acceptability (𝑦)
= 3.4525 − 0.0925 ∗ 𝑋1
− 0.1925 ∗ 𝑋2− 0.225 ∗ 𝑋
3
+ 0.0216 ∗ 𝑋4− 0.0212 ∗ 𝑋
1∗ 𝑋2
+ 0.1125 ∗ 𝑋1∗ 𝑋3− 0.0625 ∗ 𝑋
1∗ 𝑋4
+ 0.1125 ∗ 𝑋2∗ 𝑋3− 0.0225 ∗ 𝑋
2∗ 𝑋4
− 0.0412 ∗ 𝑋3∗ 𝑋4+ 0.0495 ∗ 𝑋
1∗ 𝑋1
+ 0.002 ∗ 𝑋2∗ 𝑋2− 0.1354 ∗ 𝑋
3∗ 𝑋3
+ 0.042 ∗ 𝑋4∗ 𝑋4(𝑅2
= 82.65%) .(2)
Based on the regression analysis, the results are discussedbelow.
3.1. Effect of Independent Variables on Different Responses
3.1.1. Effect of Sugar. The level of sugar had a significant effecton all the responses except spread ratio. The effect of sugarwas significant on diameter (𝑃 < 0.01), thickness (𝑃 < 0.1),hardness (𝑃 < 0.1), and stress-strain ratio (𝑃 < 0.05) atlinear level. It affected thickness (𝑃 < 0.01), spread ratio(𝑃 < 0.05), and hardness (𝑃 < 0.01) at quadratic levelalso. Diameter and thickness increased with increase in sugarlevel, while hardness and stress-strain ratio decreased. Similarfindings were also reported by Pareyt et al. [20] who foundincrease in spread of biscuits with increase in the level ofsugar. Higher sucrose levels in the cookie dough recipe leadto increased sucrose dissolution during baking. This resultsin higher quantities of solvent phase, and as a consequence,spread increases.
It was observed that sugar had a significant effect ontexture (𝑃 < 0.1), taste (𝑃 < 0.05), and OAA (𝑃 < 0.05)scores. Moreover, the sugar also affected significantly texture(𝑃 < 0.05) and flavour (𝑃 < 0.1) quadratically.
The overall effect of sugar was found significant on allphysical characteristics as it affected taste, flavor, and OAAsignificantly at 𝑃 < 0.01, 𝑃 < 0.05, and 𝑃 < 0.1, respectively.
3.1.2. Effect of Composite Fat (Fat and Fat Replacers). It wasfound that combination of fat and fat replacers significantlyaffected the diameter (𝑃 < 0.01) and spread ratio (𝑃 < 0.05).Diameter and spread ratio increased with increase in the levelof fat replacer (maltodextrin and guar gum). Sudha et al. [9]also reported that replacement of fat with maltodextrin atdifferent levels had improving effect on the spread and textureof the biscuits. The quadratic term of fat was significant forthickness (𝑃 < 0.01), spread ratio (𝑃 < 0.05), and hardness(𝑃 < 0.1) while insignificant for other responses. There was asignificant (𝑃 < 0.01) effect of composite fat on all the sensoryresponses except colour.
The overall effect of composite fat was significant on allphysical responses of biscuit, namely, diameter, thickness,spread rati,o and hardness, except stress-strain ratio. Theoverall effect of composite fat was significant on all thesensory parameters except texture. The overall effect of fatwas observed to be more pronounced on OAA (𝑃 < 0.01)

6 International Journal of Food Science
Factor coding: actualdiameter
Design points above predicted valueDesign points below predicted value
7.03
6.08
Actual factorsB: fat = 0.00D: water = 0.00
0.40 1.20
2.00
0.40 1.20
2.00
6
6.32
6.64
6.96
7.28
7.6
Dia
met
er
A: sugar
= A: sugar= C: ammonium bicarbonate
C: ammonium bicarbonate
𝑋1
𝑋2
−0.40 −0.40
−1.20 −1.20
−2.00 −2.00
Figure 1: Surface plot representing the effect of sugar (𝑋1
) and ammonium bicarbonate (𝑋3
) on diameter of the biscuits.
Factor coding: actualspread ratio
11.9649
8.44444
0.40 1.20
2.00
0.40 1.20
2.00
7
8.2
9.4
10.6
11.8
13
Spr
ead
ratio
A: sugar
Design points above predicted valueDesign points below predicted value
Actual factorsB: fat = 0.00D: water = 0.00= A: sugar
= C: ammonium bicarbonate
C: ammonium bicarbonate
𝑋1
𝑋2
−0.40 −0.40
−1.20 −1.20
−2.00 −2.00
Figure 2: Surface plot representing the effect of sugar (𝑋1
) and ammonium bicarbonate (𝑋3
) on spread ratio of the biscuits.
and taste (𝑃 < 0.01) than on flavour (𝑃 < 0.05) followed bycolour (𝑃 < 0.1).
3.1.3. Effect of Ammonium Bicarbonate. Ammonium bicar-bonate had significant effect on diameter (𝑃 < 0.01) and
spread ratio (𝑃 < 0.05). With increase in the level ofammonium bicarbonate, diameter and spread ratio of prod-uct increased. Similar findings were reported by Finney et al.[21]. However, the quadratic term of ammonium bicarbonatehad significant effect on hardness (𝑃 < 0.1).

International Journal of Food Science 7
84.0238
25.0720.40
1.20 2.00
0.40 1.20
2.00
0
20
40
60
80
Har
dnes
s
Factor coding: actualhardness
Design points above predicted valueDesign points below predicted value
Actual factorsB: fat = 0.00D: water = 0.00
A: sugar
= A: sugar= C: ammonium bicarbonate
C: ammonium bicarbonate
𝑋1
𝑋2
−0.40 −0.40
−1.20 −1.20
−2.00 −2.00
−20
Figure 3: Surface plot representing the effect of sugar (𝑋1
) and ammonium bicarbonate (𝑋3
) on hardness of the biscuits.
The total effect of ammonium bicarbonate on all thesensory parameters was significant at 𝑃 < 0.01 except taste(𝑃 < 0.05). The ammonium bicarbonate affected the OAAsignificantly (𝑃 < 0.01) at quadratic level.
The overall effect of ammonium bicarbonate was foundsignificant on all the physical and textural parameters, and itwas maximum on diameter (𝑃 < 0.01). The overall effect ofammonium bicarbonate on all sensory parameters was foundto be significant at𝑃 < 0.01, except on texture, where the levelof significance was 𝑃 < 0.05.
3.1.4. Effect ofWater. Water had a significant (𝑃 < 0.01) effecton thickness and spread ratio both at linear and quadraticlevels. Maache-Rezzoug et al. [14] reported the reduction inthickness and weight of biscuits with increase in the waterconcentration. It also affected thickness (𝑃 < 0.01), hardness(𝑃 < 0.01), spread ratio (𝑃 < 0.1), and stress-strain ratio(𝑃 < 0.1) quadratically.
Amongst the sensory parameters, only texture was signif-icantly (𝑃 < 0.1) affected by water. It decreased with increasein water level. The overall effect of water on thickness wassignificant at 𝑃 < 0.01, while it was significant at 𝑃 < 0.05on spread ratio and hardness. It was found that the overalleffect of water on all the sensory responses was insignificant.
3.1.5. Synergistic Effect of Independent Variables. The inter-action of sugar and ammonium bicarbonate affected allphysical characteristics significantly, while interaction ofcomposite fat and water had a significant effect on thickness(𝑃 < 0.1) and spread ratio (𝑃 < 0.1). The interaction
between ammonium bicarbonate and water was significanton thickness. Figures 1–3 showed the effect of sugar andammonium bicarbonate on diameter, spread ratio, and hard-ness, respectively. Diameter and spread ratio increased withincrease in sugar and ammoniumbicarbonate levels as shownin Figures 1 and 2, respectively. A similar finding was alsoreported by Finney et al. [21]. Maache-Rezzoug et al. [14]also showed the positive correlation between sugar contentand length. Hardness was maximum around the centre levelof both sugar and ammonium bicarbonate (Figure 3). Stress-strain ratio was found to be significantly (𝑃 < 0.05) affectedby the interaction of ammonium bicarbonate with sugar. Theinteraction of sugar and ammonium bicarbonate was foundto be more significant for taste (𝑃 < 0.01) than flavour andOAA (𝑃 < 0.05). The interactive effect of water and sugarwas found significant on taste (𝑃 < 0.05).
Hardness (𝑃 < 0.1) and stress-strain ratio (𝑃 < 0.05) weresignificantly affected by ammonium bicarbonate and fat asshown in Figures 4 and 5. Figure 5 shows that the hardnessincreased as the level of fat in the formulation decreased. Itcan also be concluded that the hardness increased at highervalues of fat replacer (maltodextrin and guar gum). Sudhaet al. [9] also demonstrated the effect of maltodextrin on thebreaking strength of biscuit.They reported that force requiredto break biscuits containing 70% less fat was almost threetimes more than that required to break the control biscuits.Mamat et al. [22] also reported higher hardness for a biscuitwith lower-fat content than a biscuit with normal-fat content.The stress-strain ratio (𝜎max/𝜀max) is related to brittlenessof the sample [23, 24]. Zoulias et al. [25] also reported theincrease in stress-strain ratio of cookies by replacement of fat

8 International Journal of Food Science
84.0238
25.0720.00
0.67 1.33
2.00
0.00 0.67
1.33 2.00
0
20
40
60
80
Har
dnes
s
Factor coding: actualhardness
Design points above predicted valueDesign points below predicted value
Actual factorsA: sugar = 0.00D: water = 0.00
B: fat
= B: fat= C: ammonium bicarbonate
C: ammonium bicarbonate
𝑋1
𝑋2
−0.67 −0.67
−1.33 −1.33
−2.00 −2.00
−20
Figure 4: Surface plot representing the effect of fat (𝑋2
) and ammonium bicarbonate (𝑋3
) on hardness of the biscuits.
with fat mimetics which resulted in the production of brittlecookies. Cookies that present a high ratio of𝜎max/𝜀max are lesscompressible, more brittle and break easily. Brittleness can beconsidered a pleasant sensorial characteristic for the cookiesas far as it does not become extremely great.
The level of ammonium bicarbonate and fat also had asignificant effect on OAA (Figure 6). There was a decrease inOAA at higher levels of fat replacers. A similar effect of fatreplacers on cookies was reported by Zoulias et al. [7]. Theyfound that the low-fat cookies had significantly lower flavourand general acceptance scores than the control cookies. Itwas observed that the effect of interaction of ammoniumbicarbonate and composite fat was significant on colour, taste,and flavour.
The effect of interaction of fat and water was significanton thickness (𝑃 < 0.1) and spread ratio (𝑃 < 0.1).Spread ratio decreased with increase in water and fat replacerlevel (Figure 7). It was noticed that colour score decreasedsignificantly (𝑃 < 0.1) by increase in the levels of fatreplacers and water. Low-fat biscuits were found to be darkerthan the control biscuits because of the higher degree of theMaillard browning reactions which might be the result ofcarbohydrate nature of these fat replacers. A similar findingwas also reported by Sanchez et al. [26] who found highcolour intensity in biscuitsmade from carbohydrate-based fatreplacers. It was also observed that the interaction of sugarand fat significantly affected colour (𝑃 < 0.05) and flavour(𝑃 < 0.1).
The interaction between ammonium bicarbonate andwater significantly affected thickness. Goldstein andSeetharaman [27] correlated the increase in cookie height
with increasing moisture content in the samples. Also, colourwas found to be significantly (𝑃 < 0.1) affected by theinteraction of ammonium bicarbonate with water.
3.1.6. Combined Effect of Independent Variables. ANOVA(Tables 2 and 3) is used to show the total effect of vari-ables individually and combination of all variables at linear,quadratic and interactive levels. It was found that all indepen-dent variables had significant effect on diameter (𝑃 < 0.01),thickness (𝑃 < 0.01), and spread ratio (𝑃 < 0.01) at linearlevel.They affected thickness and spread ratio quadratically at𝑃 < 0.01 and 𝑃 < 0.05, respectively. At interactive level, theyaffected spread ratio (𝑃 < 0.1), hardness (𝑃 < 0.1), stress-strain ratio (𝑃 < 0.1), and thickness (𝑃 < 0.05).
The combined effect of independent variables was foundon all sensory parameters at linear, quadratic, and interactivelevels. They affected all parameters linearly at 𝑃 < 0.01. Atquadratic level, they affected texture (𝑃 < 0.1) and OAA (𝑃 <0.05). At interactive level, they significantly affected colour(𝑃 < 0.05), flavour (𝑃 < 0.05), and taste (𝑃 < 0.01).
3.2. Optimization of Independent Variables for Low-FatBiscuits. Design-Expert (8.0.6 trial version) software wasemployed to optimise ingredient level based on maximumspread ratio and OAA and minimum stress-strain ratio andcomposite fat (fat, maltodextrin, and guar gum) of biscuitsusing numerical methods of optimization. The optimumcondition for different parameters obtained was sugar of31.74 g, fat of 13.55 g, maltodextrin of 21.15 g, guar gum of0.3 g, ammonium bicarbonate of 2.21 g, and water of 21 mL.

International Journal of Food Science 9
3.19324
0.5738090.40
1.20 2.00
0.40 1.20
2.00
0
0.5
1
1.5
2
2.5
Factor coding: actual
Design points above predicted valueDesign points below predicted value
Actual factorsA: sugar = 0.00D: water = 0.00
B: fat
= B: fat= C: ammonium bicarbonate
C: ammonium bicarbonate
𝑋1
𝑋2
−0.40 −0.40
−1.20 −1.20
−2.00 −2.00
−0.5
stress-strain ratio
Stre
ss-s
trai
n ra
tio
Figure 5: Surface plots representing the effect of fat (𝑋2
) and ammonium bicarbonate (𝑋3
) on stress-strain ratio of the biscuits.
4.25
2.360.40
1.20 2.00
0.40 1.20
2.00
2
2.5
3
3.5
4
4.5
OA
A
Factor coding: actualOAA
Design points above predicted valueDesign points below predicted value
Actual factorsA: sugar = 0.00D: water = 0.00
B: fat
C: ammonium bicarbonate
= B: fat= C: ammonium bicarbonate
𝑋1
𝑋2
−0.40 −0.40
−1.20 −1.20
−2.00 −2.00
Figure 6: Surface plot representing the effect of fat (𝑋2
) and ammonium bicarbonate (𝑋3
) on overall acceptability of the biscuits.

10 International Journal of Food Science
11.9649
8.444440.40
1.20 2.00
0.40 1.20
2.00
6
7.2
8.4
9.6
10.8
12
Spr
ead
ratio
Factor coding: actualspread ratio
Design points above predicted valueDesign points below predicted value
Actual factorsA: sugar = 0.00C: ammonium bicarbonate = 0.00
B: fat D: water
= B: fat= D: water
𝑋1
𝑋2
−0.40 −0.40
−1.20 −1.20
−2.00 −2.00
Figure 7: Surface plot representing the effect of fat (𝑋2
) and water (𝑋4
) on spread ratio of the biscuits.
Table 2: ANOVA for the overall effect of processing parameters on the physical and textural responsesa.
Responses Mean squaresDiameter (cm) Thickness (cm) Spread ratio Hardness (N) Stress-strain ratio
Total individual effect of processing parametersSugar 0.1106∗∗∗ 0.0046∗∗∗ 1.3295∗∗ 613.2477∗∗∗ 0.6928∗∗
Fat 0.0612∗ 0.0031∗∗ 1.1300∗∗ 269.4439∗ 0.3601Ammonium bicarbonate 0.1537∗∗∗ 0.0026∗∗ 1.4404∗∗ 424.7674∗∗ 0.4937∗
Water 0.0217 0.0059∗∗∗ 1.2738∗∗ 353.4363∗∗ 0.1897Combined effect of all processing parameters
Linear level 0.3164∗∗∗ 0.0046∗∗∗ 1.9498∗∗∗ 188.1162 0.4062Quadratic level 0.0108 0.0070∗∗∗ 1.5964∗∗ 171.7865 0.3586Interactive level 0.0356 0.0029∗∗ 0.9737∗ 238.5898∗ 0.4685∗aSignificant at ∗10%, ∗∗5%, and ∗∗∗1%.
Table 3: ANOVA for the overall effect of processing parameters on the sensory responsesa.
Responses Mean squares
Colour Texture Taste Flavour Overallacceptability
Total individual effect of processing parametersSugar 0.1553 0.0678 0.1575∗∗∗ 0.1409∗∗ 0.1100∗
Fat 0.2152∗ 0.0681 0.1924∗∗∗ 0.1307∗∗ 0.2214∗∗∗
Ammonium bicarbonate 0.4030∗∗∗ 0.1015∗∗ 0.25∗∗∗ 0.1921∗∗∗ 0.4377∗∗∗
Water 0.1559 0.0393 0.0465 0.0251 0.0322Combined effect of all processing parameters
Linear level 0.4149∗∗∗ 0.2577∗∗∗ 0.238∗∗∗ 0.2368∗∗∗ 0.5802∗∗∗
Quadratic level 0.0665 0.0779∗ 0.0354 0.0532 0.1666∗∗
Interactive level 0.2267∗∗ 0.0034 0.1782∗∗∗ 0.107∗∗ 0.0850aSignificant at ∗10%, ∗∗5%, and ∗∗∗1%.

International Journal of Food Science 11
Table 4: Verification of the models by comparing the experimentalvalues with the predicted values.
Response Predicted value Experimental value∗
Spread ratio 11.92 10.93 ± 0.06Hardness, N 25.07 31.47 ± 1.02Stress-strain ratio 0.409 0.599 ± 0.017Overall acceptability 4.53 4.17 ± 0.41∗Average of ten experiments.
The levels were based on 100 g flour.The comparison betweenpredicted and experimental results is shown in Table 4. Itshows a good agreement between predicted and experimentalvalues.
4. Conclusions
RSM was successfully used for optimizing different ingre-dients for the manufacture of low-fat soft dough biscuits.Results of the study indicate that hardness increases withincrease in level of sugar and fat replacers and decrease infat level. With increase in ammonium bicarbonate, diameterand spread ratio increase. Interactive effect of increased fatandwater level decreases spread ratio.The optimized producthad 62.5% replacement of fat with carbohydrate-based fatreplacers, maltodextrin and guar gum.
Acknowledgment
The authors are grateful to Dr. S. K. Jha, a Senior Scientist atthe Division of Post Harvest Technology, Indian AgriculturalResearch Institute, New Delhi, for permitting the use oftexture analyzer.
References
[1] R. D. O’brien, Fats and Oils: Formulating and Processing forApplications, CRC Press, Boca Raton, Fla, USA, 2003.
[2] C.A.Hassell, “Nutritional implications of fat substitutes,”CerealFoods World, vol. 38, pp. 142–144, 1993.
[3] C. C. Akoh, “Fat replacers,” Food Technology, vol. 52, no. 3, pp.47–53, 1998.
[4] A. M. Altschul, “Low-calorie foods—a scientific status sum-mary by the Institute of Food Technologists expert panel onfood safety and nutrition,” Food Technology, vol. 43, no. 4, p. 113,1989.
[5] G. E. Inglett, K. Warner, and R. K. Newman, “Sensory andnutritional evaluations of oatrim,” Cereal Foods World, vol. 39,pp. 755–759, 1994.
[6] F. D. Conforti, S. A. Charles, and S. E. Dunkan, “Sensoryevaluation and consumer acceptance of carbohydrate-based fatreplacers in biscuits,” Journal of Consumer Studies and HomeEconomics, vol. 20, pp. 285–296, 1996.
[7] E. I. Zoulias, V. Oreopoulou, and E. Kounalaki, “Effect of fat andsugar replacement on cookie properties,” Journal of the Scienceof Food and Agriculture, vol. 82, no. 14, pp. 1637–1644, 2002.
[8] E. Gallagher, C.M.O’Brien, A.G.M. Scannell, and E. K. Arendt,“Use of response surface methodology to produce functional
short dough biscuits,” Journal of Food Engineering, vol. 56, no.2-3, pp. 269–271, 2003.
[9] M. L. Sudha, A. K. Srivastava, R. Vetrimani, and K. Leelavathi,“Fat replacement in soft dough biscuits: its implications ondough rheology and biscuit quality,” Journal of Food Engineer-ing, vol. 80, no. 3, pp. 922–930, 2007.
[10] D. Manley, Technology of Biscuits, Crackers and Cookies, Wood-head Publishing, Cambridge, UK, 2nd edition, 1996.
[11] K. Wehrle, E. Gallagher, D. P. Neville, M. K. Keogh, and E.K. Arendt, “Microencapsulated high-fat powders in biscuitproduction,” European Food Research and Technology, vol. 208,no. 5-6, pp. 388–393, 1999.
[12] R. S. Manohar and P. H. Rao, “Effect of emulsifiers, fat leveland type on the rheological characteristics of biscuit doughand quality of biscuits,” Journal of the Science of Food andAgriculture, vol. 79, no. 10, pp. 1223–1231, 1999.
[13] J. L. Vetter, “Calorie and fat modified bakery products,” Ameri-can Institute of Baking. Research Department Technical Bulletin,vol. 13, no. 5, 1991.
[14] Z. Maache-Rezzoug, J. M. Bouvier, K. Allaf, and C. Patras,“Effect of principal ingredients on rheological behaviour ofbiscuit dough and on quality of biscuits,” Journal of FoodEngineering, vol. 35, no. 1, pp. 23–42, 1998.
[15] A. I. Khuri and J. A. Cornell, Response Surfaces, Designs andAnalysis, Marcel Dekker, New York, NY, USA, 1987.
[16] P. R. Whitley, Biscuit Manufacture, Applied Science Publisher,London, UK, 1970.
[17] AACC, Approved Methods of American Association of CerealChemists, Cereal Laboratory Methods., St. Paul. Minn, USA,1967.
[18] AOAC, Official Methods of Analysis, Association of OfficialAnalytical Chemists, Washington, DC, USA, 10th edition, 1984.
[19] E. Larmond, Laboratory Methods for Sensory Evaluation ofFoods, Canada Department of Agriculture, Ottawa, Canada,1937.
[20] B. Pareyt, F. Talhaoui, G. Kerckhofs et al., “The role of sugar andfat in sugar-snap cookies: structural and textural properties,”Journal of Food Engineering, vol. 90, no. 3, pp. 400–408, 2009.
[21] K. F. Finney, W. T. Yamazaki, and V. H. Morris, “Effectsof varying quantities of sugar, shortening and ammoniumbicarbonate on the spreading and top grain of sugar-snapcookies,” Cereal Chemistry, vol. 27, pp. 30–41, 1950.
[22] H. Mamat, M. O. Abu Hardan, and S. E. Hill, “Physicochemicalproperties of commercial semi-sweet biscuit,” Food Chemistry,vol. 121, no. 4, pp. 1029–1038, 2010.
[23] C. S. Gaines, “Instrumental measurement of the hardness ofcookies and crackers,” Cereal FoodsWorld, vol. 36, pp. 989–996,1991.
[24] J. C. Jackson, M. C. Bourne, and J. Barnard, “Optimization ofblanching for crispness of banana chips using response surfacemethodology,” Journal of Food Science, vol. 61, no. 1, pp. 165–166,1996.
[25] E. I. Zoulias, V.Oreopoulou, andC. Tzia, “Textural properties oflow-fat cookies containing carbohydrate- or protein-based fatreplacers,” Journal of Food Engineering, vol. 55, no. 4, pp. 337–342, 2002.
[26] C. Sanchez, C. F. Klopfenstein, and C. E. Walker, “Use ofcarbohydrate-based fat substitutes and emulsifying agents inreduced-fat shortbread cookies,” Cereal Chemistry, vol. 72, no.1, pp. 25–29, 1995.

12 International Journal of Food Science
[27] A. Goldstein and K. Seetharaman, “Effect of a novel mono-glyceride stabilized oil in water emulsion shortening on cookieproperties,” Food Research International, vol. 44, no. 5, pp. 1476–1481, 2011.

Submit your manuscripts athttp://www.hindawi.com
Hindawi Publishing Corporationhttp://www.hindawi.com Volume 2014
Anatomy Research International
PeptidesInternational Journal of
Hindawi Publishing Corporationhttp://www.hindawi.com Volume 2014
Hindawi Publishing Corporation http://www.hindawi.com
International Journal of
Volume 2014
Zoology
Hindawi Publishing Corporationhttp://www.hindawi.com Volume 2014
Molecular Biology International
GenomicsInternational Journal of
Hindawi Publishing Corporationhttp://www.hindawi.com Volume 2014
The Scientific World JournalHindawi Publishing Corporation http://www.hindawi.com Volume 2014
Hindawi Publishing Corporationhttp://www.hindawi.com Volume 2014
BioinformaticsAdvances in
Marine BiologyJournal of
Hindawi Publishing Corporationhttp://www.hindawi.com Volume 2014
Hindawi Publishing Corporationhttp://www.hindawi.com Volume 2014
Signal TransductionJournal of
Hindawi Publishing Corporationhttp://www.hindawi.com Volume 2014
BioMed Research International
Evolutionary BiologyInternational Journal of
Hindawi Publishing Corporationhttp://www.hindawi.com Volume 2014
Hindawi Publishing Corporationhttp://www.hindawi.com Volume 2014
Biochemistry Research International
ArchaeaHindawi Publishing Corporationhttp://www.hindawi.com Volume 2014
Hindawi Publishing Corporationhttp://www.hindawi.com Volume 2014
Genetics Research International
Hindawi Publishing Corporationhttp://www.hindawi.com Volume 2014
Advances in
Virolog y
Hindawi Publishing Corporationhttp://www.hindawi.com
Nucleic AcidsJournal of
Volume 2014
Stem CellsInternational
Hindawi Publishing Corporationhttp://www.hindawi.com Volume 2014
Hindawi Publishing Corporationhttp://www.hindawi.com Volume 2014
Enzyme Research
Hindawi Publishing Corporationhttp://www.hindawi.com Volume 2014
International Journal of
Microbiology