research article determination of important parameters in
TRANSCRIPT
Hindawi Publishing CorporationJournal of ChemistryVolume 2013, Article ID 387865, 7 pageshttp://dx.doi.org/10.1155/2013/387865
Research ArticleDetermination of Important Parameters in Affectingthe Uptake of Reactive Black 5 by Chitosan Beads throughStatistical Approach
Yi-Pin Phung,1 Siew-Teng Ong,1 and Pei-Sin Keng2
1 Department of Chemical Science, Faculty of Science, Universiti Tunku Abdul Rahman, Jalan Universiti, Bandar Barat,31900 Kampar, Perak, Malaysia
2 Department of Pharmaceutical Chemistry, International Medical University, No.126, Jalan Jalil Perkasa 19, Bukit Jalil,57000 Kuala Lumpur, Malaysia
Correspondence should be addressed to Siew-Teng Ong; ongst [email protected]
Received 20 May 2013; Revised 10 July 2013; Accepted 14 July 2013
Academic Editor: Hani El-Nezami
Copyright © 2013 Yi-Pin Phung et al. This is an open access article distributed under the Creative Commons Attribution License,which permits unrestricted use, distribution, and reproduction in any medium, provided the original work is properly cited.
Chitosan which can be obtained from fishery waste was studied as an alternative source to remove pollutants in the wastewater.Theadsorption process of Reactive Black 5 (RB5) by chitosan was studied under batch experimental condition to identify the optimumcondition in which the dye can be removed at a higher rate. The best fit kinetics model was determined to be the pseudo-second-order kinetics. From the isotherm study, the experimental result was better explained by Freundlich isotherm. Plackett-Burmanwasemployed to identify the influential variables affecting the dye uptake. Response surfacemethodology (RSM)was used to determinethe interactions between the factors and their optimum levels for maximum uptake of RB5.The optimum condition for the highestpercentage uptake of RB5 dye was determined to be at pH 4, agitation rate of 200 rpm, sorbent dosage of 1.0 g, contact time of 300minutes, and initial dye concentration of 25mg/L.
1. Introduction
Dyes have been used in many different industries to inducecolours into different products such as textiles, food, plastics,glass, and more. The worldwide annual production of dyes isabout 700 thousand tons, and about 5–15% of the dyes weredischarged into the waste streams by the textile industriesalone [1]. Some researchers have also determined that somedyes, dye precursors, and their biotransformation productsare toxic, mutagenic, and carcinogenic in nature [2]. Dueto these aspects, the dyes discharged into the water streamsare actually very dangerous, and might cause health hazardsupon consumption.Thus, there has been intensive research inexploring various possibilities to overcome the environmen-tal contamination caused by various dyeing operations.
The commonly used treatment methods for dye removalfrom aqueous environment include chemical coagulation,activated sludge, trickling filter, carbon adsorption, and
photodegradation [3]. Amongst all, the adsorption processcan be viewed as one of the most promising methods as thereis no byproduct formation; it offers simplicity of the design,and the high abundance of readily available adsorbentsmakesit an inexpensive method.
Activated carbon can remove organic substances fromwaste streams at an efficient rate and is most frequently usedto remove dyes from waste waters. However, the efficiency ofthis material is shaded by its expensive treatment cost andthe difficulty faced in the regeneration process [4]. There-fore, cheaper naturally available adsorbents were studied todetermine their adsorption capacity. Some adsorbents havedemonstrated its potential to be low cost adsorbents fordye removal and these include rice husk, orange peel, andsugarcane bagasse [5–7].
Chitosan is an aminopolysaccharide which can be foundin the shells of most crustaceans. Chitosan can also besynthesized by deacylation of chitin. Chitin is one of themost

2 Journal of Chemistry
abundant biopolymerswhich are naturally biodegradable andnontoxic. The amine functional group on the chitosan isresponsible for its acid-base property, solubility, and cationicbehaviour. This functional group causes chitosan to be veryeffective in removing anionic solutes in acidic solutions [8].Chitosan is also economically cheaper than most adsorbentsas it can be obtained from fishery wastes. Therefore, thefeasibility of using chitosan as an adsorbent for anionic dyeremoval was being studied in this research.
Most of the adsorption studies performed through theconventional methods do not or are inadequate to describethe combined effect of all the factors involved. Apart fromtime consuming, this method also does not guaranteethe determination of optimal conditions [9, 10]. However,these limitations can be overcome by introducing statisticalmethodology experimental design such as Plackett-Burmanand response surfacemethodology (RSM).Through Plackett-Burman, the influential parameters that affect RB5 uptake canbe identified, whereas further optimization of the operationalcondition can be achieved through RSM.
2. Materials and Methods
2.1. Preparation of Sorbent. The chitosan used was of analyti-cal grade and in flakes form.The chitosanwasmade into beadform by dissolving the chitosan flakes into acetic acid. Themethod used to produce chitosan was extracted from pre-vious studies by other researchers with slight modifications[11, 12].
2.2. Preparation of Dye Solutions. Synthetic dye solution ofReactive Black 5 (RB5)was used as the adsorbate in this study.The dye was used without further purification. Standard dyesolution of 1000mg/L was prepared as stock solution andsubsequently diluted when necessary.
2.3. Batch Study. All the batch adsorption experiments wereperformed in duplicate by agitating a fixed amount of chi-tosan beads, 0.50 g in 20mL of 25mg/L dye solution in acentrifuge tube, and shaken at 150 rpm on an orbital shakerat room temperature (25 ± 2∘C) unless otherwise stated.The results presented are the means value. Control withoutsorbent was simultaneously carried out to demonstrate thatdye uptake was due to sorbent and not the wall of thecentrifuge tube. At the end of the adsorption process, theRB5 dye concentrations were analysed using Perkin ElmerLambda 35 double-beamUV/visible spectrophotometer with1.0 cm light path cuvette (quartz cell) at the wavelengthcorresponding to maximum absorption, 𝜆max = 654 nm.Dilutions were carried out when the measurement exceededthe linearity of the calibration curve (𝑦 = 0.0227; 𝑅2 =0.999). Various experimental factors were studied and theseincluded pH, sorbent dosage, concentration and contact time,and agitation rate. For the effect of pH, the study range wasbetween pH 3 and 12. The effect of initial dye concentrationswas studied at 25, 50, and 100mg/L. As for the effect ofsorbent dosage, it was varied from 0.1 g to 1.0 g. The effectof agitation rate was performed by varying the agitation ratefrom 100 to 150 rpm.
2.4. Statistical Analysis via Plackett-Burman and RSM Pro-gram. Plackett-Burman design was used to evaluate therelative importance of the various factors that influence thepercentage uptake of the system. The purpose of applyingthis design is to identify the significant factor(s) that willaffect the percentage uptake of RB5. In this study, there are 4assigned variables (concentration and contact times, sorbentdosage, agitation rate, and pH) which were screened in 12experimental designs. The RSM approach uses the centralcomposite design (CCD) model to study the variables usedfor the studied dye at 3 coded levels (−1, 0, and +1) for RB5dye. The cubic equation was used for the optimization of thepercentage of dye, which is shown as
𝑌 = 𝛽𝑜+
2
∑
𝑖=1
𝛽𝑖𝑋𝑖+
2
∑
𝑖=1
𝛽𝑖𝑖𝑋2
𝑖
+
2
∑
𝑖=1
𝛽𝑖𝑖𝑖𝑋3
𝑖
+
1
∑
𝑖=1
2
∑
𝑗=𝑖+1
𝛽𝑖𝑗𝑋𝑖𝑋𝑗
+
1
∑
𝑖=1
2
∑
𝑗=𝑖+1
𝛽𝑖𝑗𝑗𝑋𝑖𝑋2
𝑗
+
1
∑
𝑖=1
2
∑
𝑗=𝑖+1
𝛽𝑖𝑖𝑗𝑋2
𝑖
+ 𝑋𝑗,
(1)
where 𝛽𝑜, 𝛽𝑖, 𝛽𝑖𝑖, 𝛽𝑖𝑖𝑖, 𝛽𝑖𝑗, 𝛽𝑖𝑗𝑗, and 𝛽
𝑖𝑖𝑗are the constant
coefficients and𝑋𝑖, and𝑋
𝑗are the independent variables. All
experimental designs and statistical analyses of the data weredone by using Design Expert Version 7.1.3. All experimentswere conducted in duplicate and the mean value of theduplicates was taken as the response (percentage uptake ofdyes).
3. Results and Discussion
3.1. Results of Batch Study. From the batch study, it was deter-mined that chitosan adsorbs best under the influence of lowpH, high sorbent dosage, and low initial dye concentration.The agitation rate effect on RB5 uptake is of minimal.The pHaffects the percentage uptake of RB5 dye by protonating theamine functional group of chitosan, thus,making the bindingsites available for anionic dye. In the pH range of 4 to 6, anappreciable amount of RB5 could be sorbed by chitosan. Asthis is also the range of natural pH of RB5 dye solution, thus,no pH adjustment was carried out for the further parametersstudied. The increase in sorbent dosage leads to a higherpercentage uptake of dye by chitosan because with increasingamount of adsorbents, the availability of active binding sitesincreases proportionally. With increasing dye concentration,a lower uptake of RB5 was recorded, and this is due to higherdye concentration causing the binding sites to be saturatedwith dye molecules at a faster rate. When the available activesites are saturated with dye molecules, effective adsorptionwill be restricted, and therefore, a lower uptake is anticipated.The various operational parameters in the aforementionedsection were further studied under statistical approach to
Journal of Chemistry 3
0
0.5
1
0 50 100 150 200 250 300
Time (min)−1.5
−1
−0.5log(q
e−qt)
100mg/L50mg/L25mg/L
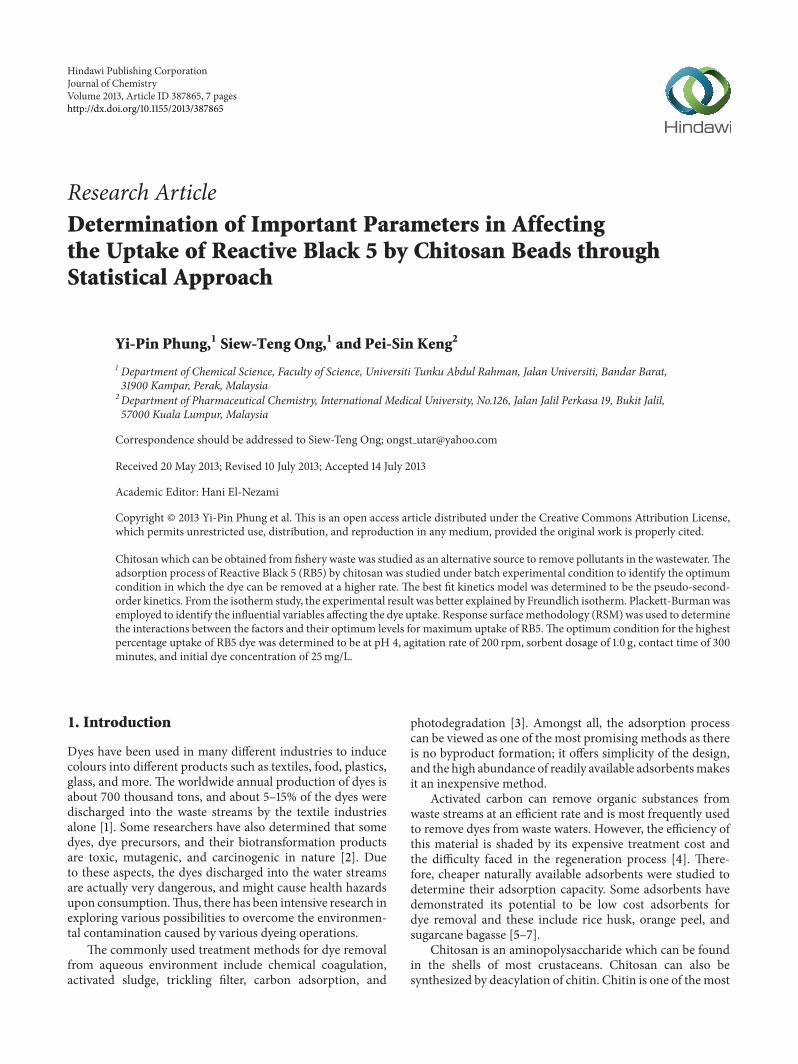
Figure 1: Pseudo-first-order graph for the effect of concentrationand contact time.
identify the influential factors and to determine the optimumcondition for RB5 uptake by chitosan.
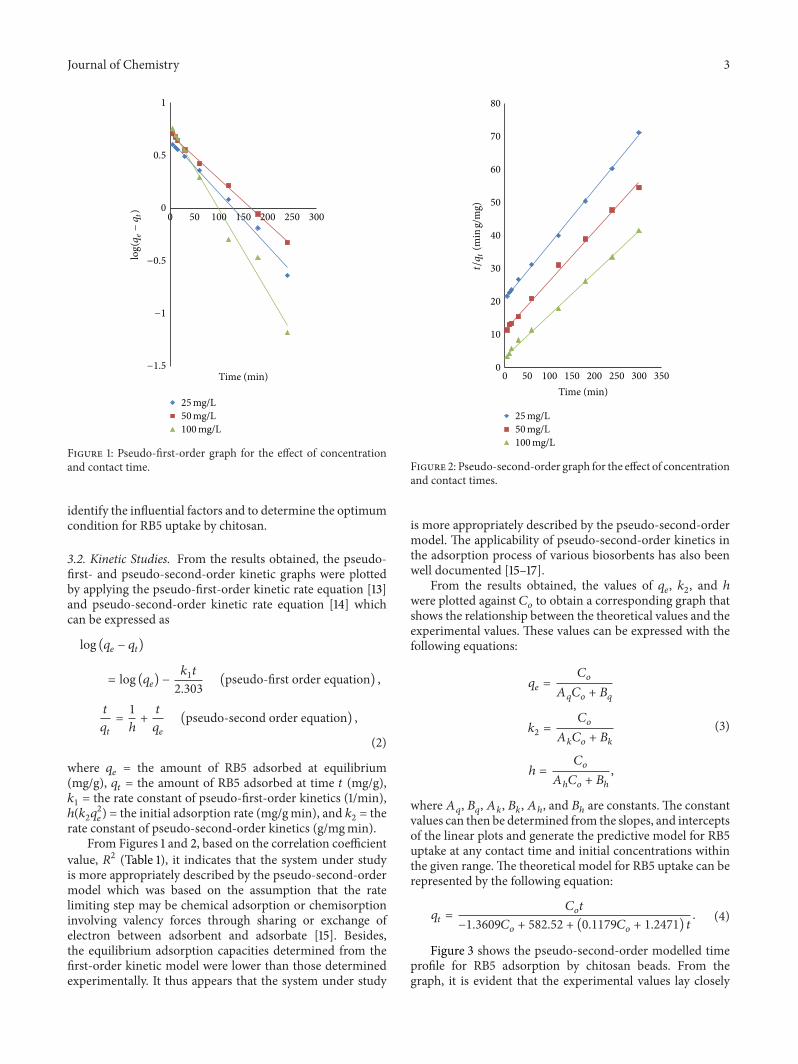
3.2. Kinetic Studies. From the results obtained, the pseudo-first- and pseudo-second-order kinetic graphs were plottedby applying the pseudo-first-order kinetic rate equation [13]and pseudo-second-order kinetic rate equation [14] whichcan be expressed as
log (𝑞𝑒− 𝑞𝑡)
= log (𝑞𝑒) −𝑘1𝑡
2.303(pseudo-first order equation) ,
𝑡
𝑞𝑡
=1
ℎ+𝑡
𝑞𝑒
(pseudo-second order equation) ,
(2)
where 𝑞𝑒= the amount of RB5 adsorbed at equilibrium
(mg/g), 𝑞𝑡= the amount of RB5 adsorbed at time 𝑡 (mg/g),
𝑘1= the rate constant of pseudo-first-order kinetics (1/min),ℎ(𝑘2𝑞2
𝑒
) = the initial adsorption rate (mg/gmin), and 𝑘2= the
rate constant of pseudo-second-order kinetics (g/mgmin).From Figures 1 and 2, based on the correlation coefficient
value, 𝑅2 (Table 1), it indicates that the system under studyis more appropriately described by the pseudo-second-ordermodel which was based on the assumption that the ratelimiting step may be chemical adsorption or chemisorptioninvolving valency forces through sharing or exchange ofelectron between adsorbent and adsorbate [15]. Besides,the equilibrium adsorption capacities determined from thefirst-order kinetic model were lower than those determinedexperimentally. It thus appears that the system under study
0
10
20
30
40
50
60
70
80
0 50 100 150 200 250 300 350Time (min)
t/qt
(min
g/m
g)
100mg/L50mg/L25mg/L
Figure 2: Pseudo-second-order graph for the effect of concentrationand contact times.
is more appropriately described by the pseudo-second-ordermodel. The applicability of pseudo-second-order kinetics inthe adsorption process of various biosorbents has also beenwell documented [15–17].
From the results obtained, the values of 𝑞𝑒, 𝑘2, and ℎ
were plotted against 𝐶𝑜to obtain a corresponding graph that
shows the relationship between the theoretical values and theexperimental values. These values can be expressed with thefollowing equations:
𝑞𝑒=𝐶𝑜
𝐴𝑞𝐶𝑜+ 𝐵𝑞
𝑘2=𝐶𝑜
𝐴𝑘𝐶𝑜+ 𝐵𝑘
ℎ =𝐶𝑜
𝐴ℎ𝐶𝑜+ 𝐵ℎ
,
(3)
where 𝐴𝑞, 𝐵𝑞, 𝐴𝑘, 𝐵𝑘, 𝐴ℎ, and 𝐵
ℎare constants. The constant
values can then be determined from the slopes, and interceptsof the linear plots and generate the predictive model for RB5uptake at any contact time and initial concentrations withinthe given range.The theoretical model for RB5 uptake can berepresented by the following equation:
𝑞𝑡=
𝐶𝑜𝑡
−1.3609𝐶𝑜+ 582.52 + (0.1179𝐶
𝑜+ 1.2471) 𝑡
. (4)
Figure 3 shows the pseudo-second-order modelled timeprofile for RB5 adsorption by chitosan beads. From thegraph, it is evident that the experimental values lay closely

4 Journal of Chemistry
Table 1: Comparison between pseudo-first-order kinetic model and pseudo-second-order kinetic model.
Initial RB5concentration (mg/L)
𝑞𝑒,exp (mg/g) Pseudo-first-order kinetic model Pseudo-second-order kinetic model
𝑞𝑒,cal (mg/g) 𝑘
1
(×10−3 1/min) 𝑅2 𝑞𝑒,cal (mg/g) 𝑘
2
(×10−3 g/mgmin) ℎ (mg/gmin) 𝑅2
25 6.22 4.41 11.52 0.990 6.07 1.29 0.05 0.99950 6.51 5.07 9.90 0.997 6.74 1.91 0.09 0.996100 7.22 5.97 18.19 0.985 7.92 4.65 0.30 0.998
Table 2: Comparison of Langmuir isotherm with Freundlich isotherm.
Sorbent Dye Langmuir Freundlich𝑁∗ (mg/g) 𝑏 (1/mg) 𝑅
2
𝐾𝑓
𝑁 𝑅2
Chitosan RB5 8.14 0.10 0.992 2.43 3.99 0.994
qt
(mg/
g)
25mg/L (theo)25mg/L (exp)50mg/L (theo)
50mg/L (exp)100mg/L (theo)100mg/L (exp)
0
1
2
3
4
5
6
7
8
0 100 200 300 400Time (min)
Figure 3: Comparison between the theoretical and experimental 𝑞𝑡
values generated by the theoretical model for RB5.
to the theoretical values regardless of their concentrations.This again indicates the applicability and reliability of thepseudo-second-order kineticmodel in describing the currentadsorption process.
3.3. Langmuir Isotherm. The equilibrium adsorption data ofRB5 on chitosan was fitted into Langmuir isotherm equation,which featured four main assumptions [18]:
(a) the adsorption process only takes place at specificsites on the surface and the saturation coverage corre-sponds to the maximum occupancy of the sites;
(b) each site can only accommodate one molecule oratoms;
(c) the surface of the adsorbent is energetically homoge-nous hence there is no interaction between the adja-cent adsorbed molecules;
(d) there are no phase transitions.
The equation of the linearised Langmuir model can bewritten as
𝐶𝑒
𝑁𝑒
=1
𝑁∗
𝑏+𝐶𝑒
𝑁∗
, (5)
where 𝐶𝑒= equilibrium concentration of dye (mg/L), 𝑁
𝑒=
amount of dye adsorbed at equilibrium (mg/g), 𝑁∗ = max-imum sorption capacity (mg/g), and 𝑏 = constant which isrelated to the energy of the sorbent (L/mg).
The coefficients of the linearised form of Langmuirisotherm model are tabulated in Table 2.
Besides, the Langmuir isotherm could also be expressedin a dimensionless constant separation factor (𝑅
𝐿) to indicate
the isotherm shape [19]. Based on the shape of the isotherm,the adsorption system can be predicted as favourable orunfavourable,
𝑅𝐿=1
1 + 𝑏𝐶𝑜
, (6)
where 𝐶𝑜= initial concentration of dye (mg/L) and 𝑏 =
constant which is related to the energy of the sorbent (L/mg).The 𝑅
𝐿values for each of the concentrations were
calculated, and based on the results obtained, it showedthat the adsorption system in this study corresponds to afavourable adsorption process. The value of 𝑅
𝐿decreases
from 0.286 to 0.091 as the concentration increases from25mg/L to 100mg/L. This decrease actually indicates that asthe concentration is increased, the isotherm tends to skewtowards the irreversible case.
3.4. Freundlich Isotherm. The Freundlich isotherm is usedto describe the adsorption over a wider range of dye con-centrations and it is accounted for nonlinear adsorptionbehaviour.The assumption of the Freundlich isotherm is thatthe uptake of dye molecules occurred on a heterogeneoussurface bywhichmultilayer adsorption and the concentrationof adsorbates on the surface will increase as concentration
Journal of Chemistry 5
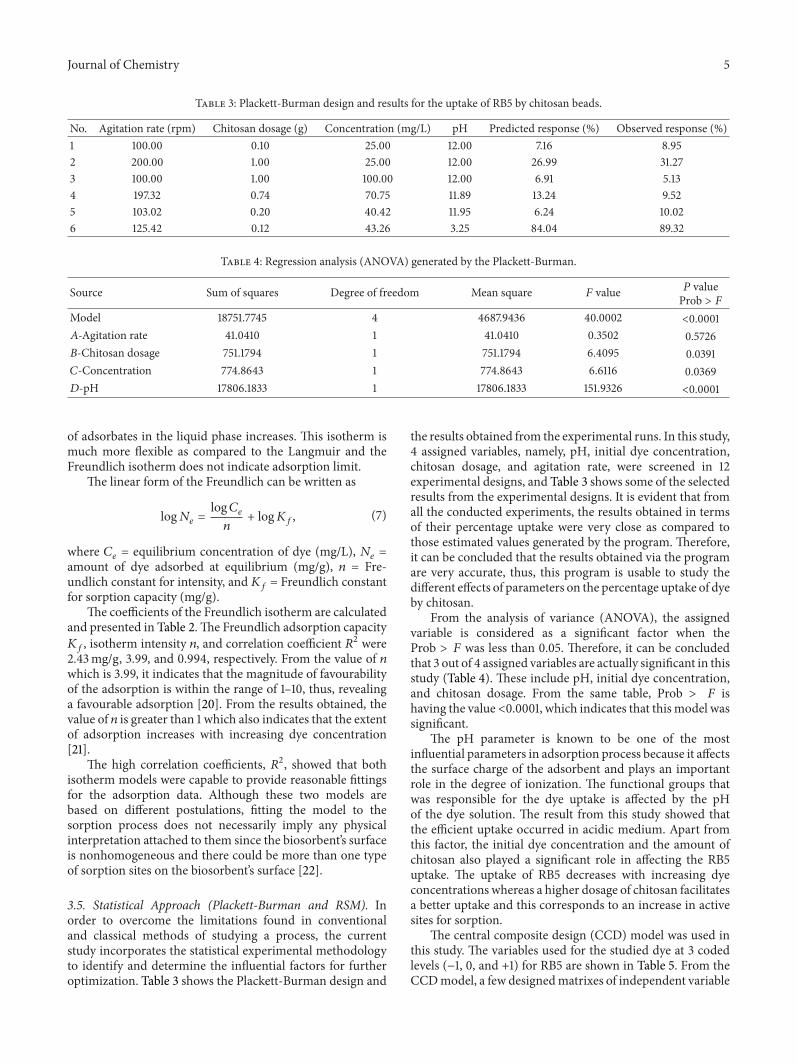
Table 3: Plackett-Burman design and results for the uptake of RB5 by chitosan beads.
No. Agitation rate (rpm) Chitosan dosage (g) Concentration (mg/L) pH Predicted response (%) Observed response (%)1 100.00 0.10 25.00 12.00 7.16 8.952 200.00 1.00 25.00 12.00 26.99 31.273 100.00 1.00 100.00 12.00 6.91 5.134 197.32 0.74 70.75 11.89 13.24 9.525 103.02 0.20 40.42 11.95 6.24 10.026 125.42 0.12 43.26 3.25 84.04 89.32
Table 4: Regression analysis (ANOVA) generated by the Plackett-Burman.
Source Sum of squares Degree of freedom Mean square 𝐹 value 𝑃 valueProb > 𝐹
Model 18751.7745 4 4687.9436 40.0002 <0.0001𝐴-Agitation rate 41.0410 1 41.0410 0.3502 0.5726𝐵-Chitosan dosage 751.1794 1 751.1794 6.4095 0.0391𝐶-Concentration 774.8643 1 774.8643 6.6116 0.0369𝐷-pH 17806.1833 1 17806.1833 151.9326 <0.0001
of adsorbates in the liquid phase increases. This isotherm ismuch more flexible as compared to the Langmuir and theFreundlich isotherm does not indicate adsorption limit.
The linear form of the Freundlich can be written as
log𝑁𝑒=log𝐶𝑒
𝑛+ log𝐾
𝑓, (7)
where 𝐶𝑒= equilibrium concentration of dye (mg/L), 𝑁
𝑒=
amount of dye adsorbed at equilibrium (mg/g), 𝑛 = Fre-undlich constant for intensity, and𝐾
𝑓= Freundlich constant
for sorption capacity (mg/g).The coefficients of the Freundlich isotherm are calculated
and presented in Table 2.The Freundlich adsorption capacity𝐾𝑓, isotherm intensity 𝑛, and correlation coefficient 𝑅2 were
2.43mg/g, 3.99, and 0.994, respectively. From the value of 𝑛which is 3.99, it indicates that the magnitude of favourabilityof the adsorption is within the range of 1–10, thus, revealinga favourable adsorption [20]. From the results obtained, thevalue of 𝑛 is greater than 1 which also indicates that the extentof adsorption increases with increasing dye concentration[21].
The high correlation coefficients, 𝑅2, showed that bothisotherm models were capable to provide reasonable fittingsfor the adsorption data. Although these two models arebased on different postulations, fitting the model to thesorption process does not necessarily imply any physicalinterpretation attached to them since the biosorbent’s surfaceis nonhomogeneous and there could be more than one typeof sorption sites on the biosorbent’s surface [22].
3.5. Statistical Approach (Plackett-Burman and RSM). Inorder to overcome the limitations found in conventionaland classical methods of studying a process, the currentstudy incorporates the statistical experimental methodologyto identify and determine the influential factors for furtheroptimization. Table 3 shows the Plackett-Burman design and
the results obtained from the experimental runs. In this study,4 assigned variables, namely, pH, initial dye concentration,chitosan dosage, and agitation rate, were screened in 12experimental designs, and Table 3 shows some of the selectedresults from the experimental designs. It is evident that fromall the conducted experiments, the results obtained in termsof their percentage uptake were very close as compared tothose estimated values generated by the program. Therefore,it can be concluded that the results obtained via the programare very accurate, thus, this program is usable to study thedifferent effects of parameters on the percentage uptake of dyeby chitosan.
From the analysis of variance (ANOVA), the assignedvariable is considered as a significant factor when theProb > 𝐹 was less than 0.05. Therefore, it can be concludedthat 3 out of 4 assigned variables are actually significant in thisstudy (Table 4). These include pH, initial dye concentration,and chitosan dosage. From the same table, Prob > 𝐹 ishaving the value <0.0001, which indicates that this model wassignificant.
The pH parameter is known to be one of the mostinfluential parameters in adsorption process because it affectsthe surface charge of the adsorbent and plays an importantrole in the degree of ionization. The functional groups thatwas responsible for the dye uptake is affected by the pHof the dye solution. The result from this study showed thatthe efficient uptake occurred in acidic medium. Apart fromthis factor, the initial dye concentration and the amount ofchitosan also played a significant role in affecting the RB5uptake. The uptake of RB5 decreases with increasing dyeconcentrations whereas a higher dosage of chitosan facilitatesa better uptake and this corresponds to an increase in activesites for sorption.
The central composite design (CCD) model was used inthis study. The variables used for the studied dye at 3 codedlevels (−1, 0, and +1) for RB5 are shown in Table 5. From theCCDmodel, a few designedmatrixes of independent variable

6 Journal of Chemistry
Table 5: Experimental range and levels of independent variables of RB5.
Dye Factors Factor code Range and levels (coded)−1 0 +1
RB5pH 𝐴 3.00 7.50 12.00
Sorbent dosage (g) 𝐵 0.10 0.55 1.00Initial dye concentration (mg/L) 𝐶 25.00 62.50 100.00
Table 6: CCD matrix for 3 independent variables and observed response for RB5.
Experimental run 𝐴 𝐵 𝐶 Observed response (%) Predicted response (%)1 +1 +1 +1 7.63 11.012 +1 −1 −1 8.94 12.423 +1 +1 −1 31.27 28.074 −1 +1 0 99.95 99.825 −1 0 −1 99.79 97.88
Table 7: Regression analysis (ANOVA) for the uptake of RB5.
Source Sum of square Degree of freedom Mean square 𝐹 value 𝑃
Model 13408.46 3 4469.49 47.58 0.0014𝐴 489.79 1 489.79 5.21 0.0845𝐵 581.91 1 581.91 6.19 0.0676𝐶 12336.76 1 12336.76 131.33 0.0003Residual 375.75 4 93.94𝑅
2: 0.973, adjusted 𝑅2: 0.952, predicted 𝑅2: 0.891, adequate precision: 16.23, and C.V.: 19.01.
with their respective responses were chosen and are shownin Table 6.The experiments were conducted twice to obtain amean value for the results.
From the RSM results, RB5 dye solution shows a percent-age uptake rate that follows the following equation which wasgenerated by the Design-Expert 7.1.3:
% uptake = 121.0827111
+ 17.38797222 × 𝐵 − 0.227432333
× 𝐶 − 8.726558333 × 𝐴,
(8)
where 𝐴 = pH, 𝐵 = sorbent dosage, and 𝐶 = concentration ofdye.
The designed model is termed as significant when theProb > 𝐹 value is lower than 0.05. Therefore, from theANOVA analysis, it was determined that the model issignificant as the Prob > 𝐹 value is 0.0014 (Table 7). The 𝑅2value for RB5 was reported to be 0.973.This value is relativelyhigh as it is close to unity, and therefore, it is estimated thatthere will be good agreement between the experimental andpredicted results.
By using the surface plot, the interactions between the twofactors and their optimum levels can be studied. From the 3Dplot, themaximumuptake should occurwhen sorbent dosagewas at maximum, whereas the initial dye concentrationwas at minimum. In order to verify the data generatedfrom the 3D plot, experiments were conducted to verify thevalue predicted from the program.The theoretical maximumuptake is 97.88%, and through the experiment, the uptake was
99.79% (under the condition: pH 4.0, sorbent dosage 1.0 g,and initial dye concentration 25mg/L). The percentage errorof the result is 1.91%. In conclusion, the model generated bythe program Design-Expert Version 7.1.3 is valid [23].
4. Conclusion
Chitosan beads can serve as a potential adsorbent for theremoval of RB5 dye from aqueous solution. The equilibriumdata conform to both Langmuir and Freundlich isothermswith the maximum sorption capacity of 8.14mg/g for RB5.For the system under examination, pseudo-second-orderkineticmodel provided a better correlation of the experimen-tal data than pseudo-first-order equation of Lagergrenmodel.From the statistical study, the results revealed that in acidicmedium, low initial dye concentration and high chitosandosage will lead to a better dye uptake. Under the optimumoperating condition, the predicted RB5 uptake can be greaterthan 99%, and this value agreed well with the experimentalresults.
Acknowledgments
This work received financial support from the Interna-tional Foundation of Science, Stockholm, Sweden, and theOrganisation for the Prohibition of Chemical Weapons,The Hague, Netherlands, via Grant no. W/4368-1, and thelaboratory facilities provided by Universiti Tunku AbdulRahman (UTAR) are acknowledged.
Journal of Chemistry 7
References
[1] J.-W. Lee, S.-P. Choi, R. Thiruvenkatachari, W.-G. Shim, andH. Moon, “Evaluation of the performance of adsorption andcoagulation processes for the maximum removal of reactivedyes,” Dyes and Pigments, vol. 69, no. 3, pp. 196–203, 2006.
[2] W. H. Cheung, Y. S. Szeto, and G. McKay, “Enhancing theadsorption capacities of acid dyes by chitosan nano particles,”Bioresource Technology, vol. 100, no. 3, pp. 1143–1148, 2009.
[3] S. Chatterjee, S. Chatterjee, B. P. Chatterjee, A. R. Das, and A.K. Guha, “Adsorption of a model anionic dye, eosin Y, fromaqueous solution by chitosan hydrobeads,” Journal of Colloidand Interface Science, vol. 288, no. 1, pp. 30–35, 2005.
[4] F. Banat, S. Al-Asheh, R. Al-Ahmad, and F. Bni-Khalid, “Bench-scale and packed bed sorption of methylene blue using treatedolive pomace and charcoal,” Bioresource Technology, vol. 98, no.16, pp. 3017–3025, 2007.
[5] A. E. Nemr, O. Abdelwahab, A. El-Sikaily, and A. Khaled,“Removal of direct blue-86 from aqueous solution by new acti-vated carbon developed fromorange peel,” Journal ofHazardousMaterials, vol. 161, no. 1, pp. 102–110, 2009.
[6] S.-T. Ong, E.-C. Khoo, P.-S. Keng et al., “Plackett-Burmandesign and response surface methodological approach to opti-mize basic dyes removal using sugarcane bagasse,”Desalinationand Water Treatment, vol. 25, no. 1–3, pp. 310–318, 2011.
[7] R. Han, D. Ding, Y. Xu et al., “Use of rice husk for theadsorption of congo red from aqueous solution in columnmode,” Bioresource Technology, vol. 99, no. 8, pp. 2938–2946,2008.
[8] E. Guibal and J. Roussy, “Coagulation and flocculation of dye-containing solutions using a biopolymer (Chitosan),” Reactiveand Functional Polymers, vol. 67, no. 1, pp. 33–42, 2007.
[9] A. Rajendran, M.Thirugnanam, and V. Thangavelu, “Statisticalevaluation of medium components by Plackett-Burman exper-imental design and kinetic modeling of lipase production byPseudomonas fluorescens,” Indian Journal of Biotechnology, vol.6, no. 4, pp. 469–478, 2007.
[10] U. K. Garg, M. P. Kaur, V. K. Garg, and D. Sud, “Removalof Nickel(II) from aqueous solution by adsorption on agricul-tural waste biomass using a response surface methodologicalapproach,” Bioresource Technology, vol. 99, no. 5, pp. 1325–1331,2008.
[11] D. Kołodynska, “Adsorption characteristics of chitosan modi-fied by chelating agents of a new generation,” Chemical Engi-neering Journal, vol. 179, pp. 33–43, 2012.
[12] S. Y. Jeong, I. C. Kwon, K. Choi, and E. Bae, “Macroporouschitosan beads and preparation method thereof,” Patent Appli-cation Publication, pp. 1–3, 2007.
[13] S. Langergren and B. K. Svenska, “Zur theorie der sogenanntenadsorption geloester stoffe,” Veternskapsakad Handlingar, vol.24, pp. 1–39, 1898.
[14] Y. S. Ho and G. McKay, “Pseudo-second order model forsorption processes,” Process Biochemistry, vol. 34, no. 5, pp. 451–465, 1999.
[15] Y. S. Ho and G. McKay, “The kinetics of sorption of divalentmetal ions onto sphagnum moss peat,”Water Research, vol. 34,no. 3, pp. 735–742, 2000.
[16] S. T. Ong, S. T. Ha, E. C. Khoo, and S. L. Hii, “Nitrilotriaceticacid modified sugarcane bagasee in the removal of basicblue 3 from aqueous environment,” International Journal ofEnvironmental Engineering, vol. 5, pp. 299–310, 2013.
[17] S. T. Ong, S. Y. Tan, E. C. Khoo, S. L. Lee, and S. T. Ha,“Equlibrium studies for Basic blue 3 adsorption onto durainpeel ∗Durio zibethinus Murray,” Desalination and Water Treat-ment Journal, vol. 45, pp. 161–169, 2012.
[18] C. Leszek, M. Balys, and K. Ewa, “Some generalization ofLangmuir adsorption isotherm,” Internet Journal of Chemistry,vol. 3, pp. 1099–8292, 2000.
[19] K.Kadirvelu, K.Thamaraiselvi, andC.Namasivayam, “Removalof heavymetals from industrial wastewaters by adsorption ontoactivated carbon prepared from an agricultural solid waste,”Bioresource Technology, vol. 76, no. 1, pp. 63–65, 2001.
[20] R. Sivaraj, C. Namasivayam, and K. Kadirvelu, “Orange peel asan adsorbent in the removal of Acid violet 17 (acid dye) fromaqueous solutions,” Waste Management, vol. 21, no. 1, pp. 105–110, 2001.
[21] T. K. Saha, N. C. Bhoumik, S. Karmaker, M. G. Ahmed, H.Ichikawa, and Y. Fukumori, “Adsorption of methyl orange ontochitosan from aqueous solution,” Journal of Water Resource andProtection, vol. 2, pp. 898–906, 2010.
[22] B. Volesky, “Biosorption and biosorbents,” in Biosorption ofHeavy Metals, B. Volesky, Ed., pp. 3–44, CRC Press, Fla, USA,1990.
[23] J.-K. Wang and C.-S. Hsieh, “Determination of optimal condi-tions for separation of metal ions through membrane dialysisusing statistical experimentalmethods,”Desalination andWaterTreatment, vol. 2, no. 1–3, pp. 240–247, 2009.

Submit your manuscripts athttp://www.hindawi.com
Hindawi Publishing Corporationhttp://www.hindawi.com Volume 2014
Inorganic ChemistryInternational Journal of
Hindawi Publishing Corporation http://www.hindawi.com Volume 2014
International Journal ofPhotoenergy
Hindawi Publishing Corporationhttp://www.hindawi.com Volume 2014
Carbohydrate Chemistry
International Journal of
Hindawi Publishing Corporationhttp://www.hindawi.com Volume 2014
Journal of
Chemistry
Hindawi Publishing Corporationhttp://www.hindawi.com Volume 2014
Advances in
Physical Chemistry
Hindawi Publishing Corporationhttp://www.hindawi.com
Analytical Methods in Chemistry
Journal of
Volume 2014
Bioinorganic Chemistry and ApplicationsHindawi Publishing Corporationhttp://www.hindawi.com Volume 2014
SpectroscopyInternational Journal of
Hindawi Publishing Corporationhttp://www.hindawi.com Volume 2014
The Scientific World JournalHindawi Publishing Corporation http://www.hindawi.com Volume 2014
Medicinal ChemistryInternational Journal of
Hindawi Publishing Corporationhttp://www.hindawi.com Volume 2014
Chromatography Research International
Hindawi Publishing Corporationhttp://www.hindawi.com Volume 2014
Applied ChemistryJournal of
Hindawi Publishing Corporationhttp://www.hindawi.com Volume 2014
Hindawi Publishing Corporationhttp://www.hindawi.com Volume 2014
Theoretical ChemistryJournal of
Hindawi Publishing Corporationhttp://www.hindawi.com Volume 2014
Journal of
Spectroscopy
Analytical ChemistryInternational Journal of
Hindawi Publishing Corporationhttp://www.hindawi.com Volume 2014
Journal of
Hindawi Publishing Corporationhttp://www.hindawi.com Volume 2014
Quantum Chemistry
Hindawi Publishing Corporationhttp://www.hindawi.com Volume 2014
Organic Chemistry International
ElectrochemistryInternational Journal of
Hindawi Publishing Corporation http://www.hindawi.com Volume 2014
Hindawi Publishing Corporationhttp://www.hindawi.com Volume 2014
CatalystsJournal of