research article determination of cefoperazone sodium in
TRANSCRIPT
Research ArticleDetermination of Cefoperazone Sodium in Presence ofRelated Impurities by Linear Support Vector Regression andPartial Least Squares Chemometric Models
Ibrahim A. Naguib,1,2 Eglal A. Abdelaleem,2 Hala E. Zaazaa,3 and Essraa A. Hussein2
1Pharmaceutical Chemistry Department, Faculty of Pharmacy, University of Tabuk, Tabuk 71491, Saudi Arabia2Pharmaceutical Analytical Chemistry Department, Faculty of Pharmacy, Beni-Suef University,Alshaheed Shehata Ahmad Hegazy Street, Beni-Suef 62514, Egypt3Analytical Chemistry Department, Faculty of Pharmacy, Cairo University, Kasr El-Aini, Cairo 11562, Egypt
Correspondence should be addressed to Ibrahim A. Naguib; [email protected]
Received 18 September 2015; Revised 1 November 2015; Accepted 3 November 2015
Academic Editor: Lukasz Komsta
Copyright © 2015 Ibrahim A. Naguib et al. This is an open access article distributed under the Creative Commons AttributionLicense, which permits unrestricted use, distribution, and reproduction in any medium, provided the original work is properlycited.
A comparison between partial least squares regression and support vector regression chemometric models is introducedin this study. The two models are implemented to analyze cefoperazone sodium in presence of its reported impurities, 7-aminocephalosporanic acid and 5-mercapto-1-methyl-tetrazole, in pure powders and in pharmaceutical formulations throughprocessing UV spectroscopic data. For best results, a 3-factor 4-level experimental design was used, resulting in a training setof 16 mixtures containing different ratios of interfering moieties. For method validation, an independent test set consisting of 9mixtures was used to test predictive ability of established models. The introduced results show the capability of the two proposedmodels to analyze cefoperazone in presence of its impurities 7-aminocephalosporanic acid and 5-mercapto-1-methyl-tetrazole withhigh trueness and selectivity (101.87 ± 0.708 and 101.43 ± 0.536 for PLSR and linear SVR, resp.). Analysis results of drug productswere statistically compared to a reported HPLCmethod showing no significant difference in trueness and precision, indicating thecapability of the suggested multivariate calibration models to be reliable and adequate for routine quality control analysis of drugproduct. SVR offers more accurate results with lower prediction error compared to PLSR model; however, PLSR is easy to handleand fast to optimize.
1. Introduction
Cefoperazone sodium (CEF), (6R,7R)-7-[[(2R)-2-[[(4-ethyl-2,3-dioxopiperazin-1-yl)carbonyl]amino]-2-(4-hydroxyphenyl)ace-tyl]amino]-3-[[(1-methyl-1H-tetrazol-5-yl) sulphanyl]methyl]-8-oxo-5-thia-1-azabicyclo[4.2.0]oct-2-ene-2-carboxylate(Figure 1(a)) [1], is a third-generation cephalosporin that actsby inhibiting bacterial cell wall biosynthesis [2]. According toB. P. [3], 7-aminocephalosporanic acid (7-ACA) (Figure 1(b)),(6R,7R)-3-[(acetyloxy)methyl]-7-amino-8-oxo-5-thia-1-aza-bicyclo[4.2.0]oct-2-ene-2-carboxylic acid, and 5-mercapto-1-methyl-tetrazole (5-MER) (Figure 1(c)), 1-methyl-1H-tetra-zole-5-thiol, are deemed as potential impurities for CEF.7-ACA is a significant and key intermediate needed for
the synthesis of semisynthetic cephalosporin antibiotics inpharmaceutical industries [4]. Additionally, 7-ACA is the corechemical structure of cephalosporins. Chemical compoundscontaining this core are known to be relatively stable tohydrolysis and tolerant to 𝛽-lactamase, the enzyme thathydrolyzes cephalosporins. Accordingly, 7-ACA is a veryimportant moiety for the activity of all cephalosporins. 5-MER is one of tetrazole derivatives that are used as intermedi-ate of cephalosporin side chains.
Literature review presents several analytical methods forassay of CEF in its pharmaceutical formulation includingspectrophotometric methods for determination of CEF [5,6], near-infrared reflectance spectroscopy [7], and deriva-tive UV spectrophotometry for determination of CEF in
Hindawi Publishing CorporationJournal of Analytical Methods in ChemistryVolume 2015, Article ID 593892, 8 pageshttp://dx.doi.org/10.1155/2015/593892

2 Journal of Analytical Methods in Chemistry
HO
N
O
HNH
N
O
N
O
O
N
S
O
ONaO
S
N
N N
NH H
CH3
CH3
H
(a)
N
SH
O
H
OHO
O
O
CH3
H2N
(b)
N
NN
N
SH
CH3
(c)
Figure 1: The chemical structure of CEF (a) and its reported impurities 7-ACA (b) and 5-MER (c).
combination with sulbactam [8]. Chromatographic methodswere applied for analysis of CEF and sulbactam [9, 10];besides, an HPLC method with 𝛽-cyclodextrin stationaryphase for determination of CEF, ampicillin, and sulbactamwas reported [11]. CEF and sulbactam were determined inplasma also by LC-MS/MS method [12]. Additionally, elec-trochemical behavior and voltammetric determination ofCEF [13, 14] were reported.
There are two main aims for the presented study. Firstly,the presented chemometric models show the ability of multi-variate models to analyze selectively CEF in ternary mixtureswith its two reported impurities using cost-effective andavailable instruments like UV spectrophotometer. Second,the presented study aims to compare two methods of mul-tivariate calibration, PLSR and linear SVR chemometricmodels, through assay of CEF, 7-ACA, and 5-MER mixturesindicating the advantages and limitations of each model. Theselected models offer better trueness and precision for quan-titative determination of CEF in pharmaceutical formulationcompared to the reported HPLC method [15].
2. Experimental
2.1. Instruments. A double beam UV-VIS spectrophotometer(SHIMADZU, Japan) model UV-1601 PC equipped with
a quartz cell of 1 cm width and connected to IBM compatiblecomputer was used. The software used was UVPC personalspectroscopy software version 3.7.
2.2. Material and Reagents
2.2.1. Pure Standard. CEF was provided by Pharco Pharma-ceuticals Co., Egypt. Both 7-ACA (CAS number 957-68-6)and 5-MER (CAS number 13183-79-4) were bought fromSigma-Aldrich through the Egyptian International Center forimport and export (EIC, Egypt).
2.2.2. Pharmaceutical Formulation. Cefobid 0.5 gm vials(batch number (2203))were produced byPfizer Pharmaceuti-cal Industries Co. and cefoperazone 1 gm vials (batch number(1240395)) were manufactured by Sigmatec PharmaceuticalIndustries Co. There are 3 concentrations available in themarket for vials: 0.5 gm, 1 gm, and 1.5 gm.
2.2.3. Chemicals and Reagents. All chemicals and solventsused in this study were of analytical grade, includingmethanol (E. Merck, Germany), water for injection B. P. 2003(Egypt Otsuka Pharmaceutical Co., S.A.E., 10th of RamadanCity, ARE), and dipotassium hydrogen phosphate (K
2HPO4)

Journal of Analytical Methods in Chemistry 3Ab
sorb
ance
250.0 300.0200.0Wavelength (nm)
0.000
0.200
0.400
0.600
0.800
1.000
Figure 2: Zero order absorption spectra of 10 𝜇gmL−1 of CEF (—),7-ACA (- - -), and 5-MER (. . . . . ..) using methanol as blank.
(El-Nasr Pharmaceutical Chemicals Co., Abu-Zaabal, Cairo,Egypt).
2.2.4. Standard Solutions. (a) Stock standard solutions of1mgmL−1 for each of CEF, 7-ACA, and 5-MERwere preparedin 3mL of 0.05M K
2HPO4solution and volume was com-
pleted with pure methanol. 7-ACA is soluble only in slightlyalkaline solvent; accordingly the solubility was achieved byaddition of fixed small volume of 0.05M K
2HPO4solution
before adding methanol. This step was carried out with allstock solutions of CEF, 7-ACA, 5-MER, and pharmaceuticalformulation as well.
(b)Working standard solution of 100 𝜇gmL−1 of CEFwasprepared in methanol. Two working standard solutions wereprepared for each impurity. Working standard solution (1) of100 𝜇gmL−1 and working standard solution (2) of 10𝜇gmL−1for both 7-ACA and 5-MER were prepared to allow prepara-tion of final mixtures with very small concentrations of theimpurities, up to 3% of CEF calculated on molar basis.
2.3. Linearity. UV spectra of a set of standards of CEF from1 to 70𝜇gmL−1 were recorded from 210 to 300 nm. CEFexhibited linearity between 5 and 50 𝜇gmL−1 at its 𝜆max is229 nm. The superimposed spectra of 10 𝜇gmL−1 of CEF, 7-ACA, and 5-MER are shown in Figure 2.
2.4. Experimental Design
2.4.1. Calibration Set. A 4-level, 3-factor calibration designwas implemented using 4 concentration levels coded as +2,+1, −1, and +1, where (−1) is the central level for each of thecomponents to be analyzed including the main drug (CEF)and its two impurities (7-ACA and 5-MER). The design aimsto span the mixture space appropriately, where 4 mixtures forevery compound at every concentration level exist, endingup with 16 mixtures for the training set [16]. The centrallevel selected for the design was 20𝜇gmL−1 for CEF and theconcentration of each level for CEF depended on its calibra-tion range. Concentration levels of impurities were based on
Table 1: Concentration design matrices in 𝜇gmL−1 for the 4-level 3-factor experimental design, showing 16 training set mixturestogether with the 9 test set mixtures.
Training set Test setCEF 7-ACA 5-MER CEF 7-ACA 5-MER18 0.13 0.065 25 0.17 0.0918 0.15 0.07 19 0.14 0.0720 0.15 0.09 22 0.18 0.07520 0.2 0.07 21 0.14 0.0826 0.15 0.065 23 0.15 0.06520 0.13 0.085 25 0.2 0.08518 0.18 0.085 19 0.13 0.0824 0.18 0.07 22 0.16 0.0724 0.15 0.085 21 0.16 0.0820 0.18 0.06524 0.13 0.0918 0.2 0.0926 0.2 0.08526 0.18 0.0924 0.2 0.06526 0.13 0.07
0 1 2 3 4
0
0.01
0.02
0.03
0.04
Scores (PC1)
Scor
es (P
C2)
Test setTraining set
−0.01
−0.02
−0.03
−1−2−3−4−5
Figure 3: Scatter plot for scores of mean centered 16 training setsamples and the 9 test set samples concentration matrices of the 4-level 3-component experimental design.
involving impurities in an amount up to 3% of CEF calculatedon molar basis to span most of the probabilities in futureanalyses. Table 1 represents the design matrix for concentra-tions. 2D scores plot of the first two PCs of the concentrationmatrixwas drawn to affirm the orthogonality, rotatability, andsymmetry of the training set mixtures (presented as circles)as shown in Figure 3. Mean centering of all types of data wasthe best preprocessing method to provide best results.

4 Journal of Analytical Methods in Chemistry
2.4.2. Test Set. To examine the validity and prediction capa-bilities of the introduced chemometric models, the indepen-dent test set mixtures were obtained by preparation of nineindependent mixtures other than the training set mixturesbut within the concentration space of the design as indicatedin Table 1. The well position of the mixtures of both trainingset and test set mixtures is shown in Figure 3.
2.4.3. Analysis of Cefobid and Cefoperazone Vials. For eachof the two dosage forms, accurately weighed aliquot equiv-alent to 100mg of CEF was transferred into 100mL vol-umetric flask. To prepare stock solution, 3mL of 0.05MK2HPO4solution was added and volume was completed
using pure methanol. The solution was then diluted to pre-pare 100 𝜇gmL−1working solution usingmethanol as solvent.Lastly, 2mL portion of the working solution was diluted to10mL with methanol. The average of three correspondingspectra was recorded. This experiment was replicated sixtimes and the produced spectra were analyzed by the sug-gested models.
2.5. Software. Codes for PLSR (PLS1 algorithm [17], boot-strap, and grid search were written using Matlab 7.5.0(R2007b)). The codes for SVR algorithm were obtained fromthe internet website http://onlinesvr.altervista.org/.
3. Chemometric Methods
Multivariate calibration models are chemometric tools thatset a relation between the spectra in data matrix X and theconcentrations in data vector c. Multiple linear regression(MLR), principal component regression (PCR), and partialleast squares regression (PLSR) are among the commonmodels used for pharmaceutical analysis. PCR and PLSRmethods are more preferable than MLR, because MLR needsfurther variable selection steps to perform optimally and toavoidmulticollinearity. Additionally, PCR andPLSR can copewith a large number of spectral variables by decomposing theX data matrix into a relatively small number of scores. Thescores matrix T then replaces the original X data matrix inthe further steps. PLSR is more developed than PCR, wherethe c data vector shares in construction of the scores as well[17, 18]. Furthermore, the compression to a small number ofscores works as a useful filter for noise [19]. Hence, PLSR isimplemented in our presented analysis.
3.1. Partial Least Squares Regression (PLSR). ThePLSRmodeldepends on the theory of existence of a linear relationbetween the X data matrix and the independent variablesin concentration vector c [20]. The data matrix X and theresponse vector c are decomposed using a given number ofPLS components (latent variable LVs) [21–24] as follows:
X = T ⋅ P + E,
c = T ⋅ q + f ,(1)
where T and P are the scores and loadings for X and q is theloading vector for c. E and f are the residuals for X and c,
respectively. PLSR is considered one of the best in multivari-ate calibration because it is reported to perform better thanMLR and PCR in several pharmaceutical applications [20].
Optimization of Number of PLS Components for PLSR Model.For prediction of optimum number of PLS components,bootstrap technique [25, 26] was used. This technique isbased on dividing the original training set to two-thirds(bootstrap training set) andone-third (bootstrap test set).ThePLSR model is then applied through building a model withthe bootstrap training set to predict concentrations in thebootstrap test set and calculating the prediction error throughthe following equation:
RMSEP = √ 1𝑁
𝑁
∑
𝑛=1
(𝑐𝑛− 𝑐𝐴
𝑛)2
, (2)
where 𝑁 is the number of bootstrap test set samples, 𝑐𝑛is
the known concentration of sample 𝑛, and 𝑐𝐴𝑛is the corre-
sponding predicted concentration at the defined number ofPLS components. Equation (2) represents just one iterationout of 1000 iterations that were implemented in the presentedstudy. The higher the number of iterations, the higher theprobability of selecting all samples in both data sets (trainingset and test set). Finally a plot was established of the averageof the 1000 root mean square error of prediction (RMSEP)values for different number of PLS components againstthe corresponding number of PLS components to choosethe optimum number of optimum PLS components. Thebootstrap training set wasmean centeredwith every iteration.
3.2. Support Vector Regression (SVR). For a data set X (𝐼 × 𝐽)of an output vector c, SVR models aim to find a multivariateregression function 𝑓(𝑥) that depends on X to predict adesired response (e.g., concentration of a chemical com-pound) from an object (e.g., a spectrum). SVR model equa-tions are illustrated in literature [26–28] and the summaryequation can be given as follows:
𝑓 (𝑥) =
𝑁
∑
𝑖,𝑗=1
(𝛼𝑖− 𝛼∗
𝑖) ⟨0 (𝑥
𝑖) ⋅ 0 (𝑥
𝑖)⟩ + 𝑏, (3)
where 𝛼𝑖and 𝛼∗
𝑖are the Lagrange multipliers that fit to the
constraint 0 ≤ 𝛼𝑖, 𝛼∗𝑖≤ 𝐶. 𝐶 is known as penalty error
or regularization constant which determines the trade-offbetweenmodel simplicity and training error.The parameter 𝑏is the offset of regression function 𝑓(𝑥). Further illustrationsof (3) and the parameters 𝛼 and 𝐶 are found in literature[27, 29, 30]. 𝜖-insensitive loss function is an additional factorcommonly applied for SVR andwill be used and optimized inthis study [31, 32]. SVRmethod can be applied for both linearand nonlinear data. Linear SVR model is used in this study,where the used spectral data exhibit linearity guaranteedthrough the well planned experimental design.
Finally, in prediction step, unknown 𝑐 value can becalculated as given below [33]:
𝑐 =
𝐼
∑
𝑖=1
(𝛼𝑖− 𝛼∗
𝑖) 𝑥𝑖𝑥𝑗+ 𝑏. (4)

Journal of Analytical Methods in Chemistry 5
2 3 4 5 6 7 8 9 101LV number
0.25
0.3
0.35
0.4
0.45
0.5
0.55
0.6
RMSE
P
Figure 4: Choice of optimum number of PLS components (latentvariables (LVs)) through plotting number of PLS componentsagainst the corresponding root mean square error of prediction(RMSEP) by using the bootstrap method.
Optimization of Number of the Linear SVRModel Parameters.Optimum 𝜖 and 𝐶 values were calculated by using a gridsearch that depends on 4-fold cross validation to give thelowest rootmean square error of cross validation (RMSECV).Primary range of valueswas set for 𝜖 (0.01–1) and𝐶 (30–1000).For each set of SVR parameters, 4 samples (𝑁 = 4) weretaken out; the linear established SVR model was applied onthe remaining 12 (𝐼−𝑁) samples. Further, RMSECVwas pre-dicted for the𝑁 samples and finally, the average of RMSECVafter removal of all samples was calculated as follows:
RMSECV = √ 1𝐼
𝐼
∑
𝑖=1
(𝑐𝑖− 𝑐𝑖)2
, (5)
where 𝑐𝑖is the true concentration for sample 𝑛 and 𝑐
𝑖is the
corresponding predicted concentration.
4. Results and Discussion
4.1. Parameters’ Optimization Results. Bootstrap techniquewas applied to choose optimum number of PLS componentsto build the best calibration model based on the training set.The optimumnumberwas “three” as shown in Figure 4. Con-cerning SVR, the grid search that gave the lowest RMSECV(5) resulted in the values (𝜖 = 0.02 and 𝐶 = 280).
4.2. Data Analysis Results. This study aims to introducea comparative study between two chemometric methodsknown as PLSR and linear SVR via analysis of CEF inpresence of its reported impurities: 7-ACA and 5-MER.The two multivariate models could handle the UV dataand overcome the overlapping difficulty of the components’spectra shown in Figure 2. Both models were successfullyable to determine the concentrations of CEF in training setand test set manifested by high recovery % with low SDas presented in Table 2. The RMSEP is a parameter used to
Table 2: Assay results for prediction of training set (autoprediction)and independent test set of CEF by PLSR and linear SVR chemomet-ric models.
Training set PLSR Linear SVR
Taken (𝜇gmL−1) Found(𝜇gmL−1) 𝑅% Found
(𝜇gmL−1) 𝑅%
18 18.577 103.21 18.629 103.5018 18.029 100.16 18.136 100.7620 19.850 99.25 19.920 99.6020 19.889 99.44 19.980 99.9026 26.114 100.44 26.110 100.4220 19.899 99.49 19.971 99.8518 17.897 99.43 17.980 99.8924 23.737 98.90 23.754 98.9724 23.997 99.99 23.980 99.9220 19.727 98.63 19.775 98.8724 24.005 100.02 23.980 99.9218 18.089 100.50 18.116 100.6526 26.236 100.91 26.143 100.5526 25.919 99.69 25.980 99.9224 24.118 100.49 24.181 100.7626 25.917 99.68 25.980 99.92Mean (%) 100.01 100.21SD 1.050 1.036RMSEC 0.2306 0.1960Test set PLSR Linear SVR
Taken (𝜇gmL−1) Found(𝜇gmL−1) 𝑅% Found
(𝜇gmL−1) 𝑅%
25 25.443 101.77 25.320 101.2819 19.069 100.36 19.067 100.3522 22.357 101.62 22.278 101.2721 21.403 101.92 21.330 101.5723 23.515 102.24 23.397 101.7325 25.630 102.52 25.440 101.7619 19.294 101.55 19.238 101.2522 22.432 101.96 22.296 101.3521 21.603 102.87 21.493 102.35Mean (%) 101.87 101.43SD 0.7082 0.5359RMSEP 0.4457 0.3386
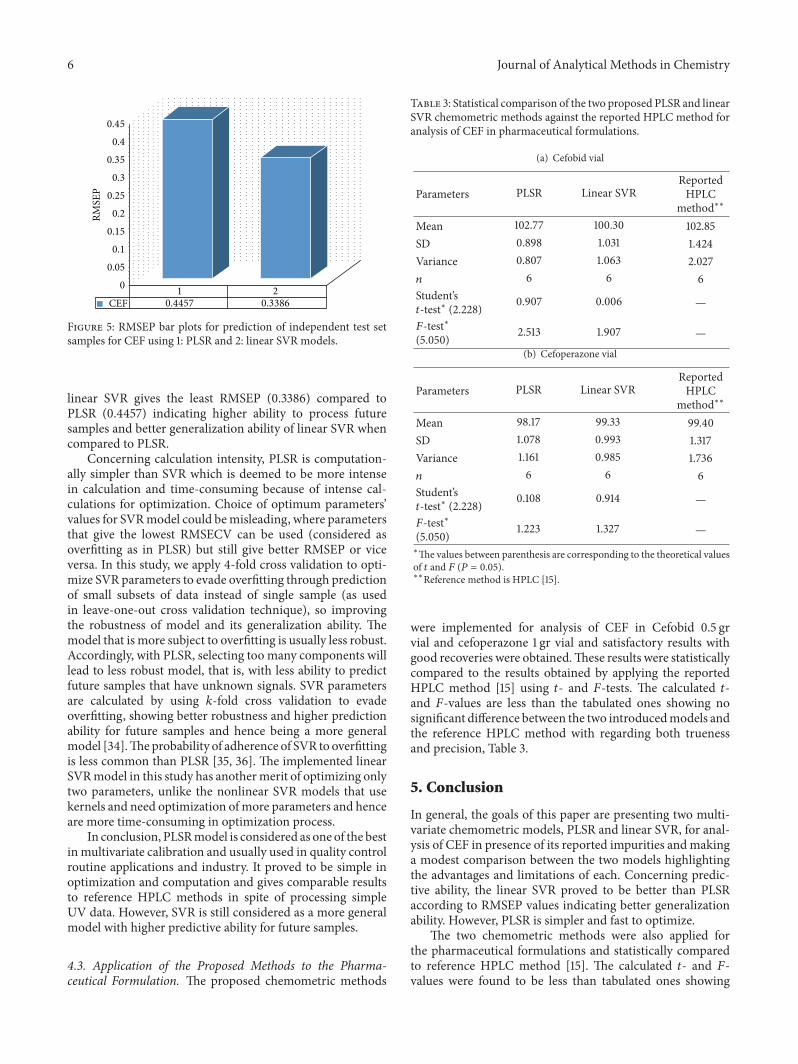
evaluate the prediction abilities of the two models, Table 2.RMSEP comparative plot between PLSR and linear SVR forprediction of test set samples is presented in Figure 5.
There aremanyways of comparison included in our studysuch as root mean square error of calibration (RMSEC), rootmean square error of prediction (RMSEP), and calculationintensity and optimization steps. First, it was observed thatlinear SVR gives the least RMSEC (0.1960) compared to PLSR(0.2306) indicating better trueness and the correspondingstandard deviation is smaller also indicating better precision.Second, the comparative bar plot in Figure 5 indicates that
6 Journal of Analytical Methods in Chemistry
0
0.05
0.1
0.15
0.2
0.25
0.3
0.35
0.4
0.45
RMSE
P
1 2
CEF 0.4457 0.3386
Figure 5: RMSEP bar plots for prediction of independent test setsamples for CEF using 1: PLSR and 2: linear SVR models.
linear SVR gives the least RMSEP (0.3386) compared toPLSR (0.4457) indicating higher ability to process futuresamples and better generalization ability of linear SVR whencompared to PLSR.
Concerning calculation intensity, PLSR is computation-ally simpler than SVR which is deemed to be more intensein calculation and time-consuming because of intense cal-culations for optimization. Choice of optimum parameters’values for SVRmodel could bemisleading, where parametersthat give the lowest RMSECV can be used (considered asoverfitting as in PLSR) but still give better RMSEP or viceversa. In this study, we apply 4-fold cross validation to opti-mize SVR parameters to evade overfitting through predictionof small subsets of data instead of single sample (as usedin leave-one-out cross validation technique), so improvingthe robustness of model and its generalization ability. Themodel that is more subject to overfitting is usually less robust.Accordingly, with PLSR, selecting too many components willlead to less robust model, that is, with less ability to predictfuture samples that have unknown signals. SVR parametersare calculated by using 𝑘-fold cross validation to evadeoverfitting, showing better robustness and higher predictionability for future samples and hence being a more generalmodel [34].Theprobability of adherence of SVR to overfittingis less common than PLSR [35, 36]. The implemented linearSVRmodel in this study has anothermerit of optimizing onlytwo parameters, unlike the nonlinear SVR models that usekernels and need optimization ofmore parameters and henceare more time-consuming in optimization process.
In conclusion, PLSRmodel is considered as one of the bestin multivariate calibration and usually used in quality controlroutine applications and industry. It proved to be simple inoptimization and computation and gives comparable resultsto reference HPLC methods in spite of processing simpleUV data. However, SVR is still considered as a more generalmodel with higher predictive ability for future samples.
4.3. Application of the Proposed Methods to the Pharma-ceutical Formulation. The proposed chemometric methods
Table 3: Statistical comparison of the two proposed PLSR and linearSVR chemometric methods against the reported HPLC method foranalysis of CEF in pharmaceutical formulations.
(a) Cefobid vial
Parameters PLSR Linear SVRReportedHPLC
method∗∗
Mean 102.77 100.30 102.85SD 0.898 1.031 1.424Variance 0.807 1.063 2.027𝑛 6 6 6Student’s𝑡-test∗ (2.228) 0.907 0.006 —
𝐹-test∗(5.050) 2.513 1.907 —
(b) Cefoperazone vial
Parameters PLSR Linear SVRReportedHPLC
method∗∗
Mean 98.17 99.33 99.40SD 1.078 0.993 1.317Variance 1.161 0.985 1.736𝑛 6 6 6Student’s𝑡-test∗ (2.228) 0.108 0.914 —
𝐹-test∗(5.050) 1.223 1.327 —∗The values between parenthesis are corresponding to the theoretical valuesof 𝑡 and 𝐹 (𝑃 = 0.05).∗∗Reference method is HPLC [15].
were implemented for analysis of CEF in Cefobid 0.5 grvial and cefoperazone 1 gr vial and satisfactory results withgood recoveries were obtained.These results were statisticallycompared to the results obtained by applying the reportedHPLC method [15] using 𝑡- and 𝐹-tests. The calculated 𝑡-and 𝐹-values are less than the tabulated ones showing nosignificant difference between the two introducedmodels andthe reference HPLC method with regarding both truenessand precision, Table 3.
5. Conclusion
In general, the goals of this paper are presenting two multi-variate chemometric models, PLSR and linear SVR, for anal-ysis of CEF in presence of its reported impurities andmakinga modest comparison between the two models highlightingthe advantages and limitations of each. Concerning predic-tive ability, the linear SVR proved to be better than PLSRaccording to RMSEP values indicating better generalizationability. However, PLSR is simpler and fast to optimize.
The two chemometric methods were also applied forthe pharmaceutical formulations and statistically comparedto reference HPLC method [15]. The calculated 𝑡- and 𝐹-values were found to be less than tabulated ones showing

Journal of Analytical Methods in Chemistry 7
no significant difference in respect to both trueness andprecision.The proposedmethods showed high selectivity andtrueness. The presented advantages of the proposed modelssuggest their use for routine quality control analysis withoutinterference of normally encountered pharmaceutical addi-tives or impurities that could be present in minor ratios.
Additionally, the obtained results affirm the possibilityof using modern chemometric approaches, especially linearSVR, for assay of different pharmaceutical dosage forms usingaccessible cheap and simple instruments like UV spectropho-tometer even in presence of large number of interferingcomponents with extremely overlapped spectra.
Disclosure
Parts of Experimental (Section 2) and Chemometric Meth-ods (Section 3) are reproduced from our previous studies onother mixtures [35–37]. The authors would like to declarethe presence of another study entitled “Determination ofCefoperazone Sodium in Presence of Related Impurities byImproved Classical Least Squares Chemometric Methods: AComparative Study” which uses the same data sets as a casestudy to establish a comparison among a set of improved CLSmodels (not published to date).
Conflict of Interests
The authors declare that there is no conflict of interestsregarding the publication of this paper.
Acknowledgment
The authors would like to acknowledge financial support forthis work from the Deanship of Scientific Research (DSR),University of Tabuk, Tabuk, Saudi Arabia, under Grant no.0054-1436-s.
References
[1] M. J. O’Neil, The Merck Index, an Encyclopedia of Chemicals,Drugs and Biologicals, Merck and Co. Inc., Whitehouse Station,NJ, USA, 2001.
[2] J. E. F. Reynolds, Martindale, The Extra Pharmacopoeia, RoyalPharmaceutica Society, London, UK, 31st edition, 1996.
[3] Her Majesty’s Stationary office, British Pharmacopoeia, HerMajesty’s Stationary Office, London, UK, 1980.
[4] Q. Tan, Q. Song, and D. Wei, “Single-pot conversion of cepha-losporin C to 7-aminocephalosporanic acid using cell-boundand support-bound enzymes,” Enzyme and Microbial Technol-ogy, vol. 39, no. 5, pp. 1166–1172, 2006.
[5] M. Senthilraja and P. N. Sanjaypai, “Spectrophotometric deter-mination of cefoperazone sodium in pharmaceutical formula-tions,” Indian Journal of Pharmaceutical Sciences, vol. 68, no. 3,pp. 384–385, 2006.
[6] L. Chen, O. Sha,W.-J. Zhai, and J.-H. Yang, “Fading spectropho-tometric determination of cefoperazone sodium in injections byFe3+-sulfosalicylic acid system,”Asian Journal of Chemistry, vol.25, no. 14, pp. 7918–7920, 2013.
[7] H.-H. Pang, Y.-C. Feng, C.-Q. Hu, and B.-R. Xiang, “Construc-tion of universal quantitative models for determination of cef-operazone sodium for injection from different manufacturersusing near infrared reflectance spectroscopy,”Guang Pu Xue YuGuang Pu Fen Xi, vol. 26, no. 12, pp. 2214–2218, 2006.
[8] A. Parra, J. Garcia-Villanova, V. Rodenas, and M. D. Gomez,“First and second derivative spectrophotometric determinationof cefoperazone and sulbactam in injections,” Journal of Phar-maceutical and Biomedical Analysis, vol. 12, no. 5, pp. 653–657,1994.
[9] F. S. Li, Z. X. Xu, H. B. Xiao, and X. M. Liang, “Simultaneousdetermination of sulbactam sodium and cefoperazone sodiumin sulperazone by high-performance liquid chromatography,”Se Pu, vol. 18, no. 6, pp. 525–526, 2000.
[10] K. Vinod Kumar, J. Dharuman, and A. Karuna Sree, “RP-HPLC method development and validation for simultaneousestimation of sulbactam and cefoperazone in dosage form andin plasma,” International Journal of Pharma and Bio Sciences,vol. 1, no. 4, 2010.
[11] T.-L. Tsou, S.-H. Chen, T.-L. Tsou et al., “Simultaneous determi-nation of ampicillin, cefoperazone and sulbactam in pharma-ceutical formulations by HPLC with 𝛽-cyclodextrin stationaryphase,” Journal of Separation Science, vol. 30, no. 15, pp. 2407–2413, 2007.
[12] Y. Zhou, J. Zhang, B. Guo et al., “Liquid chromatogra-phy/tandem mass spectrometry assay for the simultaneousdetermination of cefoperazone and sulbactam in plasma and itsapplication to a pharmacokinetic study,” Journal of Chromatog-raphy B, vol. 878, no. 30, pp. 3119–3124, 2010.
[13] E. Hammam, M. A. El-Attar, and A. M. Beltagi, “Voltammetricstudies on the antibiotic drug cefoperazone: quantificationand pharmacokinetic studies,” Journal of Pharmaceutical andBiomedical Analysis, vol. 42, no. 4, pp. 523–527, 2006.
[14] B. Dogan, A. Golcu, M. Dolaz, and S. A. Ozkan, “Electrochem-ical behaviour of the bactericidal cefoperazone and its selectivevoltammetric determination in pharmaceutical dosage formsand human serum,” Current Pharmaceutical Analysis, vol. 5, no.2, pp. 179–189, 2009.
[15] The United States Pharmacopoeial Convention, The UnitedStates Pharmacopoeia (USP30) (2007) National Formulary(NF25), The United States Pharmacopoeial Convention,Rockville, Md, USA, 2007.
[16] R. G. Brereton, “Multilevel multifactor designs for multivariatecalibration,” Analyst, vol. 122, no. 12, pp. 1521–1529, 1997.
[17] J. Gasteiger, Handbook of Chemometrics, vol. 3, Wiley-VCH,KGaA, Weinheim, Germany, 2003.
[18] S.Wold, A. Ruhe, H.Wold, andW. J. Dunn III, “The collinearityproblem in linear regression. The partial least squares (PLS)approach to generalised inverses,” SIAM Journal on Scientificand Statistical Computing, vol. 5, pp. 735–743, 1984.
[19] N. M. Faber and R. Rajko, “How to avoid over-fitting inmultivariate calibration—the conventional validation approachand an alternative,”Analytica Chimica Acta, vol. 595, no. 1-2, pp.98–106, 2007.
[20] H. W. Darwish and I. A. Naguib, “Improved partial leastsquares models for stability-indicating analysis of mebeverineand sulpiride mixtures in pharmaceutical preparation: a com-parative study,”Drug Testing and Analysis, vol. 5, no. 5, pp. 325–333, 2013.
[21] R.W. Gerlach, B. R. Kowalski, and H. O. A.Wold, “Partial least-squares pathmodellingwith latent variables,”AnalyticaChimicaActa, vol. 112, no. 4, pp. 417–421, 1979.

8 Journal of Analytical Methods in Chemistry
[22] H.Martens and T. Naes,Multivariate Calibration, JohnWiley &Sons, Chichester, UK, 1989.
[23] R. G. Brereton, “Introduction to multivariate calibration inanalytical chemistry,” Analyst, vol. 125, no. 11, pp. 2125–2154,2000.
[24] P. Geladi and B. R. Kowalski, “Partial least-squares regression: atutorial,” Analytica Chimica Acta, vol. 185, pp. 1–17, 1986.
[25] B. Efron and R. J. Tibshirani, An Introduction to the Bootstrap,Chapman & Hall, 1993.
[26] J. S. U. Hjorth, Computer Intensive Statistical Methods: Vali-dation, Model Selection and Bootstrap, Chapman & Hall, NewYork, NY, USA, 1994.
[27] J. A. K. Suykens, T. V. Gestel, J. De Brabanter, B. De Moor, andJ. Vandewalle, Least Squares Support Vector Machines, WorldScientific, Singapore, 1999.
[28] N. Cristianini and J. Shawe-Taylor, An Introduction to SupportVector Machines and Other Kernel-Based Learning Methods,Cambridge University Press, Cambridge, UK, 2000.
[29] Y. Xu, S. Zomer, and R. G. Brereton, “Support vector machines:a recent method for classification in chemometrics,” CriticalReviews in Analytical Chemistry, vol. 36, no. 3-4, pp. 177–188,2006.
[30] B. Scholkopf and A. J. Smola, Learning with Kernels, The MITPress, Cambridge, UK, 2002.
[31] S. R. Gunn, “Support vector machines for classification andregression,” Tech. Rep., University of Southampton, Southamp-ton, UK, 1998, http://users.ecs.soton.ac.uk/srg/publications/pdf/SVM.pdf.
[32] F. Parrella, Online Support Vector Regression, Thesis in Infor-mation Science,University ofGenoa, Italy, 2007, http://onlinesvr.altervista.org/.
[33] U. Thissena, M. Pepersb, B. Ustuna, W. J. Melssena, and L. M.C. Buydens, “Comparing support vector machines to PLS forspectral regression application,” Chemometrics and IntelligentLaboratory Systems, vol. 73, pp. 169–179, 2004.
[34] B. Ustun, W. J. Melssen, M. Oudenhuijzen, and L. M. C.Buydens, “Determination of optimal support vector regressionparameters by genetic algorithms and simplex optimization,”Analytica Chimica Acta, vol. 544, no. 1-2, pp. 292–305, 2005.
[35] I. A.Naguib, “Stability indicating analysis of bisacodyl by partialleast squares regression, spectral residual augmented classicalleast squares and support vector regression chemometric mod-els: a comparative study,”Bulletin of Faculty of Pharmacy—CairoUniversity, vol. 49, no. 2, pp. 91–100, 2011.
[36] I. A. Naguib, E. A. Abdelaleem, M. E. Draz, and H. E. Zaazaa,“Linear support vector regression and partial least squareschemometricmodels for determination ofHydrochlorothiazideand Benazepril hydrochloride in presence of related impurities:a comparative study,” Spectrochimica Acta Part A:Molecular andBiomolecular Spectroscopy, vol. 130, pp. 350–356, 2014.
[37] E. A. Abdelaleem, I. A. Naguib, H. E. Zaazaa, and E. A. Hussein,“Development and validation of HPLC and HPTLC methodsfor determination of cefoperazone and its related impurities,”Journal of Chromatographic Science, 2015.

Submit your manuscripts athttp://www.hindawi.com
Hindawi Publishing Corporationhttp://www.hindawi.com Volume 2014
Inorganic ChemistryInternational Journal of
Hindawi Publishing Corporation http://www.hindawi.com Volume 2014
International Journal ofPhotoenergy
Hindawi Publishing Corporationhttp://www.hindawi.com Volume 2014
Carbohydrate Chemistry
International Journal of
Hindawi Publishing Corporationhttp://www.hindawi.com Volume 2014
Journal of
Chemistry
Hindawi Publishing Corporationhttp://www.hindawi.com Volume 2014
Advances in
Physical Chemistry
Hindawi Publishing Corporationhttp://www.hindawi.com
Analytical Methods in Chemistry
Journal of
Volume 2014
Bioinorganic Chemistry and ApplicationsHindawi Publishing Corporationhttp://www.hindawi.com Volume 2014
SpectroscopyInternational Journal of
Hindawi Publishing Corporationhttp://www.hindawi.com Volume 2014
The Scientific World JournalHindawi Publishing Corporation http://www.hindawi.com Volume 2014
Medicinal ChemistryInternational Journal of
Hindawi Publishing Corporationhttp://www.hindawi.com Volume 2014
Chromatography Research International
Hindawi Publishing Corporationhttp://www.hindawi.com Volume 2014
Applied ChemistryJournal of
Hindawi Publishing Corporationhttp://www.hindawi.com Volume 2014
Hindawi Publishing Corporationhttp://www.hindawi.com Volume 2014
Theoretical ChemistryJournal of
Hindawi Publishing Corporationhttp://www.hindawi.com Volume 2014
Journal of
Spectroscopy
Analytical ChemistryInternational Journal of
Hindawi Publishing Corporationhttp://www.hindawi.com Volume 2014
Journal of
Hindawi Publishing Corporationhttp://www.hindawi.com Volume 2014
Quantum Chemistry
Hindawi Publishing Corporationhttp://www.hindawi.com Volume 2014
Organic Chemistry International
ElectrochemistryInternational Journal of
Hindawi Publishing Corporation http://www.hindawi.com Volume 2014
Hindawi Publishing Corporationhttp://www.hindawi.com Volume 2014
CatalystsJournal of