research article application of genetic algorithms for
TRANSCRIPT

Research ArticleApplication of Genetic Algorithms for Driverless Subway TrainEnergy Optimization
Morris Brenna, Federica Foiadelli, and Michela Longo
Politecnico di Milano, Department of Energy, Via La Masa 34, 20156 Milano, Italy
Correspondence should be addressed to Michela Longo; [email protected]
Received 30 July 2015; Revised 23 December 2015; Accepted 5 January 2016
Academic Editor: Sanghyun Ahn
Copyright © 2016 Morris Brenna et al. This is an open access article distributed under the Creative Commons Attribution License,which permits unrestricted use, distribution, and reproduction in any medium, provided the original work is properly cited.
After an introduction on the basic aspects of electric railway transports, focusing mainly on driverless subways and their relatedautomation systems (ATC, ATP, and ATO), a technique for energy optimization of the train movement through their controlusing genetic algorithms will be presented. Genetic algorithms are a heuristic search and iterative stochastic method used incomputing to find exact or approximate solutions to optimization problems. This optimization process has been calculated andtested on a real subway line in Milan through the implementation of a dedicated Matlab code. The so-defined algorithm providesthe optimization of the trains movement through a coast control table created by the use of a genetic algorithm that minimizes theenergy consumption and the train scheduled time. The obtained results suggest that the method is promising in minimizing theenergy consumption of the electric trains.
1. Introduction
The Europe 2020 strategy sets the objective to create 20% ofenergy consumption from renewables and increase energyefficiency by 20% by 2020 [1]. For this reason, together withsupply-side policies, there are many European initiatives toincrease the efficiency of energy use, reduce energy demand,and attempt to decouple it from economic growth. Differentinstruments and implementing measures have been set toreach and evaluate the obtained results, including the energyperformance of buildings, the promotion of cogeneration,and energy labelling for domestic appliances [2].
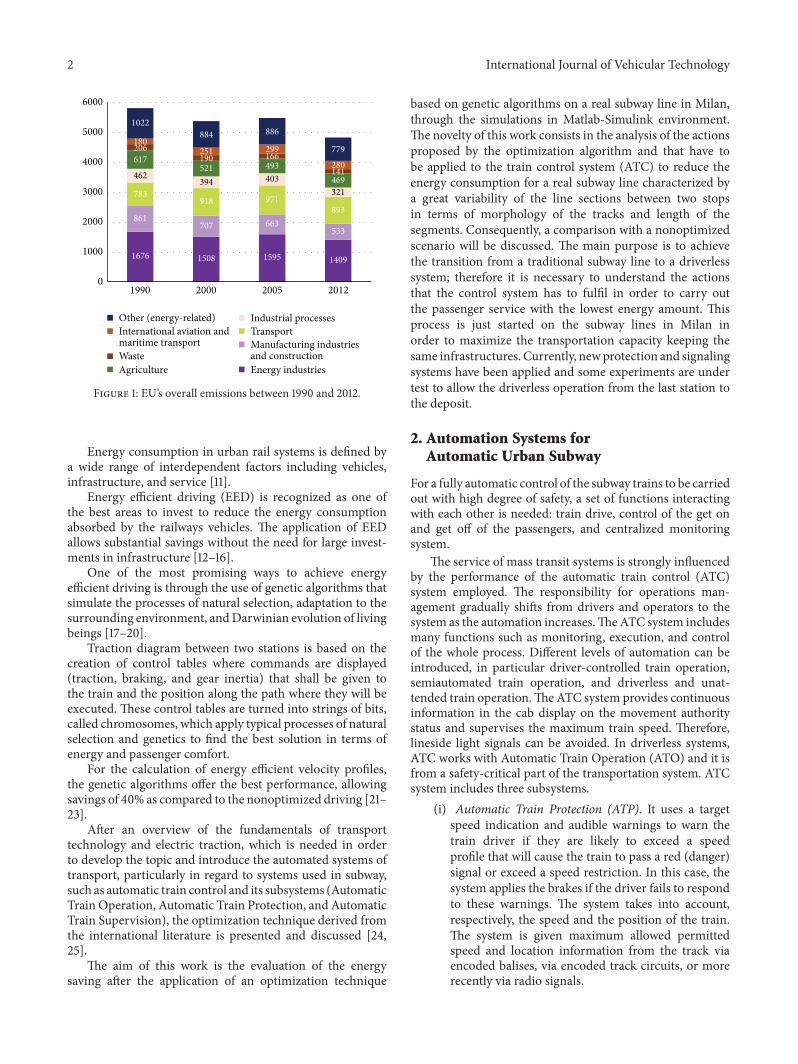
Statistics Explained, the official statistical office of theEuropean Union, assures that, except transport, all sectorshelped to reduce the EU’s overall emissions between 1990and 2012 (Figure 1) [3]. It is possible to note that the largestreduction has been obtained bymanufacturing industries andconstruction (327 million tons of CO
2equivalent), followed
by energy industries (267 million tons of CO2equivalent)
which was the sector responsible for the largest share of totalemissions.
By contrast, transport emissions were 14% above 1990levels in 2012. The sector accounted for about 19% of total
EU emissions in 2012, making it the second largest sourceafter the energy industries. However, the continual upwardtrend in transport emissions appears to have been broken.After peaking in 2007, emissions fell by 10%over the followingfive years. Both the increase between 1990 and 2007 and therecent decline might be linked to corresponding changes inthe volume of passenger and freight transport [4]. Causesfor reduced transport volumes since 2007 may include theeconomic downturn and a hike in fuel prices. Notwithstand-ing this positive trend, promoting energy efficiency, andincreasing the share of renewable energy remain crucial tolimiting the transport sector’s GHG emissions, particularlywhen economic growth picks up again.
The European Union itself does underline that energyefficiency is a major goal for any railways administrationboth economically and environmentally. For this reason anyeffort has to be done to improve this goal [5, 6]. Energyefficiency is amajor goal for any railways administration botheconomically and environmentally [7–9].
The main performance indexes of train running containsafety, punctuality, energy consumption, stop precision, andriding comfort [10].
Hindawi Publishing CorporationInternational Journal of Vehicular TechnologyVolume 2016, Article ID 8073523, 14 pageshttp://dx.doi.org/10.1155/2016/8073523
2 International Journal of Vehicular Technology
1676 1508 1595 1409
861707 663
533
783918 971
893
462394 403
321
617521 493
469
206190 166
141
180251 299
280
1022884 886
779
0
1000
2000
3000
4000
5000
6000
1990 2000 2005 2012
Other (energy-related)International aviation andmaritime transportWasteAgriculture
Industrial processesTransportManufacturing industriesand constructionEnergy industries
Figure 1: EU’s overall emissions between 1990 and 2012.
Energy consumption in urban rail systems is defined bya wide range of interdependent factors including vehicles,infrastructure, and service [11].
Energy efficient driving (EED) is recognized as one ofthe best areas to invest to reduce the energy consumptionabsorbed by the railways vehicles. The application of EEDallows substantial savings without the need for large invest-ments in infrastructure [12–16].
One of the most promising ways to achieve energyefficient driving is through the use of genetic algorithms thatsimulate the processes of natural selection, adaptation to thesurrounding environment, andDarwinian evolution of livingbeings [17–20].
Traction diagram between two stations is based on thecreation of control tables where commands are displayed(traction, braking, and gear inertia) that shall be given tothe train and the position along the path where they will beexecuted. These control tables are turned into strings of bits,called chromosomes, which apply typical processes of naturalselection and genetics to find the best solution in terms ofenergy and passenger comfort.
For the calculation of energy efficient velocity profiles,the genetic algorithms offer the best performance, allowingsavings of 40% as compared to the nonoptimized driving [21–23].
After an overview of the fundamentals of transporttechnology and electric traction, which is needed in orderto develop the topic and introduce the automated systems oftransport, particularly in regard to systems used in subway,such as automatic train control and its subsystems (AutomaticTrain Operation, Automatic Train Protection, and AutomaticTrain Supervision), the optimization technique derived fromthe international literature is presented and discussed [24,25].
The aim of this work is the evaluation of the energysaving after the application of an optimization technique
based on genetic algorithms on a real subway line in Milan,through the simulations in Matlab-Simulink environment.The novelty of this work consists in the analysis of the actionsproposed by the optimization algorithm and that have tobe applied to the train control system (ATC) to reduce theenergy consumption for a real subway line characterized bya great variability of the line sections between two stopsin terms of morphology of the tracks and length of thesegments. Consequently, a comparison with a nonoptimizedscenario will be discussed. The main purpose is to achievethe transition from a traditional subway line to a driverlesssystem; therefore it is necessary to understand the actionsthat the control system has to fulfil in order to carry outthe passenger service with the lowest energy amount. Thisprocess is just started on the subway lines in Milan inorder to maximize the transportation capacity keeping thesame infrastructures. Currently, newprotection and signalingsystems have been applied and some experiments are undertest to allow the driverless operation from the last station tothe deposit.
2. Automation Systems forAutomatic Urban Subway
For a fully automatic control of the subway trains to be carriedout with high degree of safety, a set of functions interactingwith each other is needed: train drive, control of the get onand get off of the passengers, and centralized monitoringsystem.
The service of mass transit systems is strongly influencedby the performance of the automatic train control (ATC)system employed. The responsibility for operations man-agement gradually shifts from drivers and operators to thesystem as the automation increases.TheATC system includesmany functions such as monitoring, execution, and controlof the whole process. Different levels of automation can beintroduced, in particular driver-controlled train operation,semiautomated train operation, and driverless and unat-tended train operation.TheATC system provides continuousinformation in the cab display on the movement authoritystatus and supervises the maximum train speed. Therefore,lineside light signals can be avoided. In driverless systems,ATC works with Automatic Train Operation (ATO) and it isfrom a safety-critical part of the transportation system. ATCsystem includes three subsystems.
(i) Automatic Train Protection (ATP). It uses a targetspeed indication and audible warnings to warn thetrain driver if they are likely to exceed a speedprofile that will cause the train to pass a red (danger)signal or exceed a speed restriction. In this case, thesystem applies the brakes if the driver fails to respondto these warnings. The system takes into account,respectively, the speed and the position of the train.The system is given maximum allowed permittedspeed and location information from the track viaencoded balises, via encoded track circuits, or morerecently via radio signals.
International Journal of Vehicular Technology 3
ConfigurationPlatform screen door
Automatic Train Protection
Automatic Train Supervision
(ATP) system
(ATS) system
Automatic Train Operation(ATO) system
Disaster monitoringsystem
Power supply controlsystem
Station equipment
Depot control system
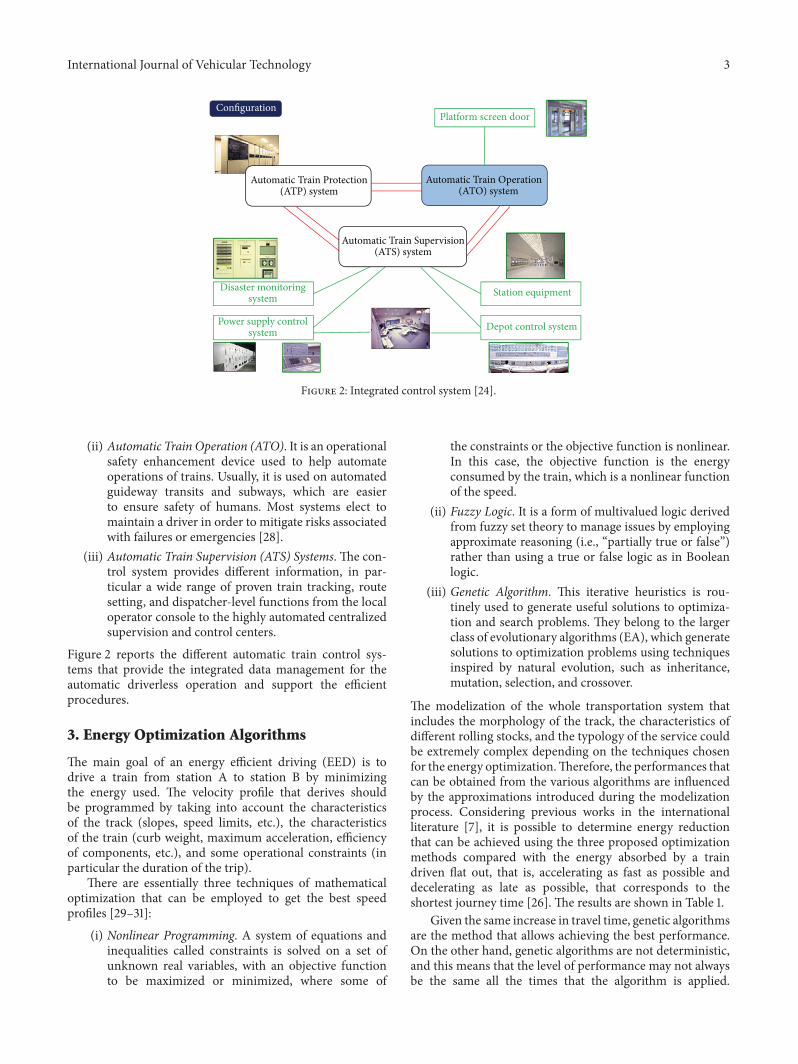
Figure 2: Integrated control system [24].
(ii) Automatic Train Operation (ATO). It is an operationalsafety enhancement device used to help automateoperations of trains. Usually, it is used on automatedguideway transits and subways, which are easierto ensure safety of humans. Most systems elect tomaintain a driver in order to mitigate risks associatedwith failures or emergencies [28].
(iii) Automatic Train Supervision (ATS) Systems. The con-trol system provides different information, in par-ticular a wide range of proven train tracking, routesetting, and dispatcher-level functions from the localoperator console to the highly automated centralizedsupervision and control centers.
Figure 2 reports the different automatic train control sys-tems that provide the integrated data management for theautomatic driverless operation and support the efficientprocedures.
3. Energy Optimization Algorithms
The main goal of an energy efficient driving (EED) is todrive a train from station A to station B by minimizingthe energy used. The velocity profile that derives shouldbe programmed by taking into account the characteristicsof the track (slopes, speed limits, etc.), the characteristicsof the train (curb weight, maximum acceleration, efficiencyof components, etc.), and some operational constraints (inparticular the duration of the trip).
There are essentially three techniques of mathematicaloptimization that can be employed to get the best speedprofiles [29–31]:
(i) Nonlinear Programming. A system of equations andinequalities called constraints is solved on a set ofunknown real variables, with an objective functionto be maximized or minimized, where some of
the constraints or the objective function is nonlinear.In this case, the objective function is the energyconsumed by the train, which is a nonlinear functionof the speed.
(ii) Fuzzy Logic. It is a form of multivalued logic derivedfrom fuzzy set theory to manage issues by employingapproximate reasoning (i.e., “partially true or false”)rather than using a true or false logic as in Booleanlogic.
(iii) Genetic Algorithm. This iterative heuristics is rou-tinely used to generate useful solutions to optimiza-tion and search problems. They belong to the largerclass of evolutionary algorithms (EA), which generatesolutions to optimization problems using techniquesinspired by natural evolution, such as inheritance,mutation, selection, and crossover.
The modelization of the whole transportation system thatincludes the morphology of the track, the characteristics ofdifferent rolling stocks, and the typology of the service couldbe extremely complex depending on the techniques chosenfor the energy optimization.Therefore, the performances thatcan be obtained from the various algorithms are influencedby the approximations introduced during the modelizationprocess. Considering previous works in the internationalliterature [7], it is possible to determine energy reductionthat can be achieved using the three proposed optimizationmethods compared with the energy absorbed by a traindriven flat out, that is, accelerating as fast as possible anddecelerating as late as possible, that corresponds to theshortest journey time [26]. The results are shown in Table 1.
Given the same increase in travel time, genetic algorithmsare the method that allows achieving the best performance.On the other hand, genetic algorithms are not deterministic,and this means that the level of performance may not alwaysbe the same all the times that the algorithm is applied.

4 International Journal of Vehicular Technology
Table 1: Energy saving achievable with different optimizationmethods [26].
Optimization methodsEnergy saving withEED as compared tononoptimized driving
Nonlinear programming Up to 25%Fuzzy logic From 25% to 30%Genetic algorithm From 30% to 40%
0
20
40
60
80
100
120
140
0 2000 4000 6000 8000 10000
Spee
d (k
m/h
)
Distance (m)
Not optimizedEEDSpeed limit
Figure 3: Comparison between a nonoptimized driving and opti-mized driving [26].
Figure 3 shows an example of traction diagram comparing atrain with nonoptimized guide with EED.
4. Optimization Methods
The optimization method proposed in [32] is based on agenetic algorithm.The genetic algorithm is a stochastic algo-rithm based on the principles of genetics, natural selection,and Darwinian evolution that allows the survival of theindividual with the genetic baggage that is more suited tosurvive in the environment in which he lives, allowing thereproduction and transmission of the best genes to the newgeneration. In this case, where the focus is not on livingbeings, the chromosomes of the genetic baggage involvedin the process will be bit strings, and the environmentalconditions to which these will have to adapt will be a fitnessfunction that will allow a close evaluation of several factors,so as to optimize the different objectives chosen.Thismethodcan also be used in other areas by appropriately adaptingobjectives and participants in the selection.
The traction control table provides indications to theATOregarding specific actions that should be taken while driving,such as accelerating, braking, or using the coasting runningmaking sure that these actions do not affect the safety or theaccuracy in the stop position of the train.
Spee
d
Distance
0001001010 010011010 1101101011 1110001010
Coast intervalCoast interval
Target speed
x1 x2 x3 x4
Figure 4: Representation of traction control table [27].
The sequence always begins with a command to coasting,proceeding with a traction drive. In this way, the commandsusually alternate between coasting and traction. The numberof commands can be even or odd. If they are even, the lastcommand sends to the train all the procedures to stop at thedesignated station. If they are odd, the last command is tokeep the coastingmarch. In this situation, theATOcan ignorethe table and take control of the brakes and bring the trainto destination with high degree of precision. In any case, thespeed limit imposed by the ATP bypasses the command ofthe roadmap in order to keep the train below the limit ofmaximum allowed speed.
Each chromosome contains all information of the controltable. Thus, each chromosome has a variable length andcontains genes with a fixed number of bits. Each generepresents the relative position between the stations wherethe command is given, as shown in Figure 4.
In this case, the chromosome consists of four genes andeach gene has a length of 10 bits. The order of the geneson chromosome indicates a specific decision of the controltable. The genes in odd position represent the command ofcoasting. Those in even position represent the command tostart the traction. If the chromosome has an even number ofgenes, the last gene represents the command to decelerate thetrain to stop at the destination. In this way, the chromosomalrepresentation is consistent with the command table.
5. Optimization Technique Proposed
The algorithm developed consists in automatically creatingthe initial 16 chromosomes derived from the same number ofcontrol tables randomly generated by the system. From these16 chromosomes, the two that maximize the fitness functionwill be selected and will be used as first parents for the nextgeneration.
For the sake of simplicity of implementation, it wasdecided to restrict the number of commands to four, includ-ing the command to stop at the station. A number higher than5 commands, however, would not allow achieving substantialimprovements in terms of energy saving, as shown in [26] andreported in Figure 5. In this way, the chromosomes have allfour genes and are composed of 10 bits each.

International Journal of Vehicular Technology 5
5 10 15 20 250Number of commands
40
50
60
70
80
90
100
110
Nor
mal
ized
ener
gy co
nsum
ptio
n
Figure 5: Energy consumption as a function of the number ofcommands.
0
50
100
150
200
250
300
350
Trac
tive e
ffort
(kN
)
10 20 30 40 50 60 70 80 90 1000Speed (km/h)
Figure 6: Example of mechanical characteristic of the train.
5.1. Description of the Simulator. To estimate the energyconsumedby the train and the travel time [33–35], a simulatorusing Matlab-Simulink has been implemented. The equiva-lent mass 𝑚
𝑒of the train is modeled by the following:
𝑚𝑒= 𝑚 ⋅ (1 + 0.06 + 0.15) , (1)
where𝑚 is the mass of the vehicle. The equivalent mass of allrotatingmasses shall be set equal to 0.06 times themass of thevehicle and it is estimated that the average mass of passengerstransported is worth 0.15 times the mass of the vehicle, assuggested in [36].
It considers the vehicle or combination of vehicles as aconcentrated mass 𝑚. Indicating with 𝐹 the resultant of alltractive or braking efforts and with 𝑅 the resultant of allresistances applied to the vehicle, the equation of motion is
𝐹 − 𝑅 = 𝑚𝑒⋅ 𝑎, (2)
where 𝐹 is given by the mechanical characteristic of themotors, shown in Figure 6.
For rolling stocks as light trams or subways, withoutparticular aerodynamics shape, given the limited runningspeed, it is possible to use the empiric expression (3) for thecalculation of the drag resistance 𝑟
0for a flat and straight way
[26].The following equation gives the drag resistance in N foreach kN of weight of the vehicle:
𝑟0= 2.7 + 0.04 ⋅ (
𝑉
10
)
2
(N/kN) . (3)
The resistance due to the grade indicated as 𝑅𝑖is given by
the component of the weight 𝐺 parallel to the slope that istraveling:
𝑅𝑖= 𝐺 ⋅ sin (𝛼) . (4)
Considering that in railway lines the maximum slope is 25–35‰, in such case the angle 𝛼 is so small as the per-unit graderesistance can be approximated as follows:
𝑟𝑖= sin (𝛼) ≅ 𝛼 ≅ tan (𝛼) = 𝑖. (5)
The resistance due to the curves 𝑅𝑐depends, in rail vehi-
cles, on several factors such as the parallelism betweenthe wheelsets and the friction between wheel flanges andrail. All these factors lead to a resistant force 𝑅
𝑐and the
corresponding unitary resistance 𝑟𝑐, but the evaluation of
these is theoretically not easy, to which reference is madeto the experimental formulas. For example, by returning theformula of Von Rockl [37],
𝑟𝑐=
𝑎
(𝜌 − 𝑏)
, (6)
where 𝜌 is the radius of the curve and the terms 𝑎 and 𝑏
assume the following values for standard gauge:
(i) 𝑎 = 0.65m,(ii) 𝑏 = 55m for 𝜌 greater than 350m,(iii) 𝑏 = 65m for 𝜌 between 250 and 350m.
Or it is possible to use a simpler formula as needed:
𝑟𝑐=
0.8
𝜌
. (7)
If it is possible to use the simplified expressions, the overallresistance to the motion can be expressed as the sum of allterms proportional to the weight 𝐺 of the vehicle, whereasthe overall per-unit resistance variable with the speed V isexpressed with the following:
𝑅 = 𝑟 (V) ⋅ 𝐺 𝑟 (V) = 𝑟0(V) ± 𝑖 + 𝑟
𝑐. (8)
Therefore, the total energy consumed by the train can beestimated from the following:
𝐸 =
∫𝐹 ⋅ V ⋅ 𝑑𝑡
𝜂𝑀
+ 𝐴 ⋅ 𝑇𝑡+ 𝜂𝐵⋅ ∫ 𝐵 ⋅ V ⋅ 𝑑𝑡, (9)
where 𝐹 is the tractive effort [N]; 𝐵 is the braking effort[N]; V is the velocity [m/s]; 𝐴 is the power required by theonboard auxiliary services [W]; 𝑇
𝑡is the travel time between
two stations [s]; 𝜂𝑀is the efficiency during the traction; and
𝜂𝐵is the efficiency during braking.

6 International Journal of Vehicular Technology
In this case, it is considered that below the speed of10 km/h regenerative braking is interrupted and replaced bythe mechanical brake and that the maximum power injectionin line is limited to 2.25MW, as proposed in [26]. It is alsoassumed in first approximation that the contact line is alwaysin condition to receive it.
Different vehicle data are required as input data to thesimulator such as
(i) the vehicle mass,(ii) the total power of the traction motors,(iii) energy efficiency in traction and braking phase,(iv) the maximum tractive effort,(v) the power absorbed by the auxiliary services.
The track data needed to the algorithm are
(i) line length,(ii) maximum speed limits,(iii) grades along the line,(iv) curves radius.
5.2. Fitness Function. The fitness function choice is of thefollowing type:
Fitness =
1
𝐸 ⋅ 𝑓 (𝜌)
, (10)
where 𝐸 is the energy consumed measured in MJ and 𝑓(𝜌)
is the penalty factor for delays. The penalty factor for jerkis not implemented, because the choice of assessment of thejerk is based on the maximum number of variations of thestates of traction, braking, and coasting. Besides, given thatthe maximum number of possible commands of the controltable is four, this guarantees an acceptable comfort to thepassengers. In fact, in other studies done [35], the jerk is notconsidered in the evaluation of the fitness function.
5.3. Penalty Factor for Delays. The 𝑐𝑝factor indicates a virtual
increase of the absorbed energy to regain one second of delay.It is set equal to 0.02, determining that one second delay ispenalized with an increase in energy of 2%. Longer delays arepenalized with exponential increases in energy consumed.For the calculation of the factor penalty for delays is usedthrough this relation:
𝑓𝜌(𝜌) = (1 + 𝑐
𝑝)
𝜌/𝜏
. (11)
The equation is modified as
𝑓𝜌(𝜌) = 1.02
𝜌, (12)
where 𝜌 is the difference in seconds between the travel timeprogrammed and the actual travel time. The travel timeprogrammed is calculated from nonoptimized travel timeincreasing it by 10%:
𝑡scheduled = 1.10 ⋅ 𝑡flatout, (13)
Table 2: Different values of the penalty factor.
Delay [s] Penalty factor1 1.022 1.043 1.064 1.085 1.18 1.1710 1.22
where 𝑡flatout is the travel time without giving coasting com-mands. Table 2 shows some penalty factor values in relationto the deviation in seconds from time planned trip.
In the case where the plano-altimetric layout of theline leads to a substantial energy saving and consequentlyto a high evaluation of the fitness (e.g., strong grades),without, however, being acceptable in the neighborhoodof the scheduled time (it has been chosen a band of 3%compared to the programmed time value), it was decided tomake more penalizing factor for the delays, elevating the 𝑐
𝑝
factor to 0.05. With this arrangement, applied only where theoptimization algorithm gives a solution with journey timesout of range, (12) is changed to the following:
𝑓𝜌(𝜌) = 1.05
𝜌. (14)
5.4. Control of Speed and Stop at the Station. To control themotion of the train two proportional-integral controllers areimplemented, one of which controls the stop position of thetrain and one controls the speed. The first controller hasthe task of bringing the train to the destination with theaid of an estimator of the braking distance, modulating thespeed reference between zero and the maximum permittedspeed. The braking distance has been estimated through thisrelation:
𝑠𝑓
=
V2
2 ⋅ 𝑎𝑓
, (15)
where 𝑎𝑓is the average constant deceleration set equal to
0.675m/s2 and V is the speed of the train before braking.The speed controller modulates between zero and its
maximum value the traction effort of the motors obtained bythe mechanical characteristic, to achieve the speed referencegiven by the control. To allow the simulation of the coastingcommands an inhibitor of the commands of the speedcontroller is placed downstream of the two controllers, whichduring the coasting phases set to zero the tractive effort 𝐹.
In the case where a control table that does not bringthe train to more or less than 1.1m from the destinationis generated, the system penalizes with a factor of 100 thefitness, so as to ensure nonsurvival of these individuals inthe population. The principle of the control system is shownschematically in Figure 7.

International Journal of Vehicular Technology 7
lengthSegment
+
Estimatedbrakingdistance
Brakingdistance
PI controller
Speed
speedReference
Speed PIcontroller
F-force−
+−
Figure 7: Block diagram of the simulated control system.
0
50
100
150
200
250
300
350
Trac
tive e
ffort
(kN
)
10 20 30 40 50 60 70 80 90 1000Speed (km/h)
0
1000
2000
3000
4000
5000
Elec
tric
pow
er (k
W)
10 20 30 40 50 60 70 80 900Speed (km/h)
Figure 8: Mechanical characteristic and electric power absorbed by the motors as a function of the train speed.
6. Case Study
To test the optimization algorithm developed, the followingassumptions have been made in terms of train and trackcharacteristics:
(i) vehicle’s mass 295,000 kg,(ii) maximum electric power 5,000 kW,(iii) total efficiency in traction 0.85,(iv) total efficiency in braking 0.65,(v) maximum tractive force 300 kN,(vi) auxiliary power 235 kW,(vii) max load: 1200 passengers.
Figure 8 reports the trend of the electric power absorbed bythe motors as a function of speed, both plotted with the useof the simulator.
6.1. Characteristics of the Track. Thesubway line is consideredto be 21.73 km long and consists of 24 stations, for a numberof routes to simulate equal to 23. The length of the sectionsbetween stations (denominated in alphabetical order, ignor-ing the letters X and Y) is shown in Table 3.
The altitude profile of the subway line is shown inFigure 9.
The speed limits are set for all routes equal to 40 km/hfor the first 100m and the last 100m and 90 km/h for therest of the route. In some segments, there are some curves;in particular for the segments G-H, H-I, and I-J the radius ofcurvature is equal to 1000m, whereas for the segment M-Nthe radius of curvature is equal to 500m.
Table 3: Length of different segments.
Segment Length [m]A-B 916B-C 1023C-D 1560D-E 1190E-F 802F-G 1085G-H 938H-I 780I-J 938J-K 591K-L 444L-M 714M-N 821N-O 743O-P 625P-Q 619Q-R 773R-S 407S-T 764T-U 936U-V 757V-W 3631W-Z 916

8 International Journal of Vehicular Technology
AB
CD
E F
G
H I J
KLMNO
PQ
RS T U
V
WZ
05
101520
0 2 4 6 8 10 12 14 16 18 20 22
Plan
o-al
timet
ric p
rofil
e (m
)
Distance (m) ×103
−5
−10
−15
−20
−25
−30
−35
−40
−45
Figure 9: Altitude profile for different segments of the subway lines.
6.2. Energy Consumption with Nonoptimized Driving. Inorder to calculate the amount of energy saved through theuse of the optimization algorithm, it must first calculatethe energy consumed during the year with nonoptimizedguidance, which corresponds to the driving style that allowsshorter travel times by using full speed and decelerating aslate as possible. Table 4 shows the energy consumption in MJand kWh and travel times for each segment.
The total travel time, equal to 28minutes, does not includethe waiting times at stops, which are assumed equal evenin the case of nonoptimized driving. Figure 10 shows threetraction diagrams’ velocity-time for different segments, inparticular for the case of short section, average section, andlong section.
6.3. Convergence of Algorithm. In order to achieve an optimalsolution it is very important to properly set the number ofgenerations that the algorithm will create and analyze.
Based on the experience developed by other items suchas [27], the proposed genetic algorithm converges to a resultbetween the eleventh and twelfth generation, in which thealgorithm has been run for 20 generations.
6.4. Energy Consumption with Optimized Driving. Table 5shows the energy consumption and the travel times obtainedwith the proposed optimization technique. In the line seg-ments F-G, J-K, and T-U, expression (14) has been used forthe penalty factor instead of (12) since its application does notproduce acceptable solutions regarding the travel time.
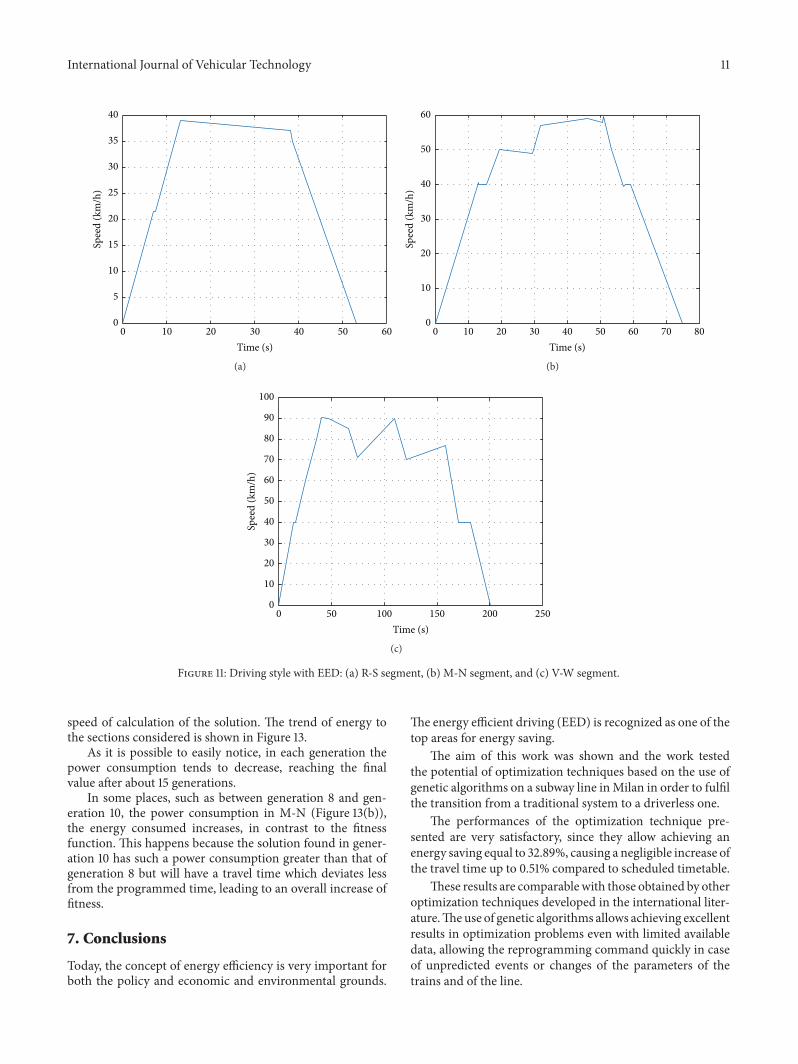
For a comparison of driving styles, Figure 11 reports thespeed-time diagram for the sections R-S, M-N, and V-Wobtained with the use of the optimization algorithm.
As it is possible to note, the optimized driving styleis strongly influenced by the morphology of the track, inparticular by its altitude profile. For example, regarding theR-S segment, characterized by a flat track, the optimizationintroduces a long coasting phase and a lowermaximum speed
Table 4: Energy consumption and travel times with nonoptimizeddriving.
Segment Energy [MJ] Energy [kWh] Time [s]A-B 102.07 28.36 72B-C 87.3 24.25 75C-D 117.18 32.55 95D-E 90.9 25.25 79E-F 78.68 21.86 68F-G 55.45 15.40 76G-H 74.39 20.67 71H-I 89.26 24.80 68I-J 93.67 26.02 73J-K 46.29 12.86 57K-L 52.5 14.58 51L-M 75.52 20.98 64M-N 81 22.50 69N-O 87.32 24.26 66O-P 61.92 17.20 60P-Q 51.51 14.31 58Q-R 97.03 26.95 69R-S 48.89 13.58 48S-T 82.59 22.94 67T-U 95.5 26.53 74U-V 95.19 26.44 67V-W 393.63 109.35 183W-Z 85.35 23.71 70Total 2143.14 595.36 1680
that allow a great energy saving since the traction motorsare off in view of a negligible increase of the traveling time(around 5 s). In the other cases, the coasting phase cannotbe too long if the train moves upward (e.g., V-W segment)or whenever the maximum speed cannot be too low notto compromise the travel time (e.g., M-N segment). It isworth noting that in cases (b) and (c) the train controlsystem has to achieve many actions, continuously changingfrom traction to coasting or from coasting to braking. Thisis an important aspect for the correct training of the trainautomation system (ATO) in order to minimize the energyconsumption compatibly with the transportation service.
6.5. Energy Saving and Travel Times. Percentage of energysaving as compared to nonoptimized guide is reported inTable 6 together with the percentage deviation between thetravel time with EED and, respectively, minimum traveltime and scheduled travel time. Also in this case in thehighlighted sections, expression (14) has been used for thepenalty factor instead of (12) since its application does notproduce acceptable solutions regarding the travel time.

International Journal of Vehicular Technology 9
30 350 20 25105 5015 40 45Time (s)
0
10
20
30
40
50
60Sp
eed
(km
/h)
(a)
30 600 5010 20 40 70Time (s)
0
10
20
30
40
50
60
70
80
90
Spee
d (k
m/h
)
(b)
0 18060 80 100 160 200120 14020 40Time (s)
0
10
20
30
40
50
60
70
80
90
100
Spee
d (k
m/h
)
(c)
Figure 10: Traction diagrams velocity-time nonoptimized: (a) R-S segment is equal to 407m, (b) M-N segment is equal to 821m, and (c)V-W segment is equal to 3631m.
Traveling times vary from 9.56% to 12.95% compared tononoptimized guidance, resulting in a total increase of traveltime on the whole of around 10.57%, equivalent to about 3minutes.
The energy saving increases from a minimum of 19% inthe V-W, which has a lengthmuch greater than the others andis the one that presents a strong positive slope, to a maximumof 66% in F-G that has on the contrary a strong negativeslope and that for which it was necessary to formulate morestringent factor penalties for delays in reaching a solutionwhich increases the total travel time to no more than 3% ofthe scheduled travel time.
Considering the totality of the line, in viewof an increasedjourney time equal to 10.57%, a decrease of the energyconsumed compared to a nonoptimized driving style is equal
to 32.89%. The total energy saved thanks to the optimizationtechnique is 195.8 kWh per trip.
The small increase in the travel time does not constitute aproblem in this case because the actual service is influencedby many other interferences, that is, time for getting on andgetting off, that tend to affect the journey. On the contrary, itis important to highlight the great energy saving achievablewith an optimized driving style.
6.6. Trend of Fitness and Energy. To verify if the choice of thenumber of generations is correct, the progress of the fitnessfunction for each generation is reported in Figure 12.
As can be noted, the fitness function reaches a stable valueafter about 15 generations; therefore, the choice to simulate20 generations is a good compromise between accuracy and
10 International Journal of Vehicular Technology
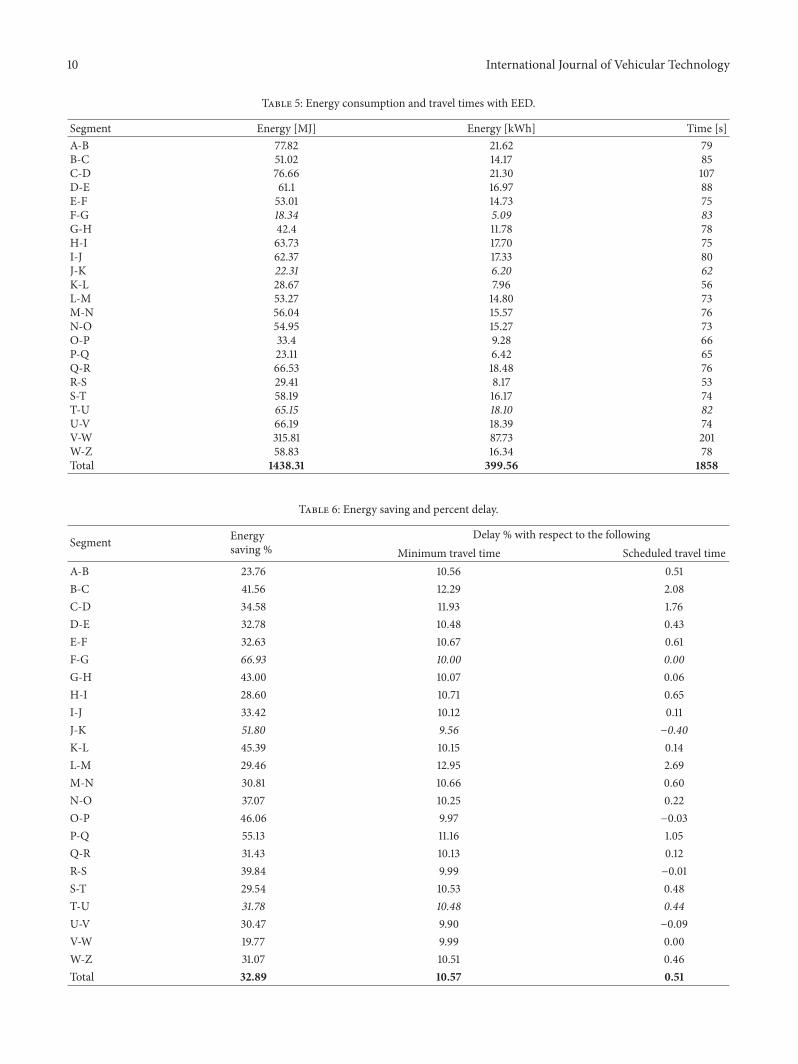
Table 5: Energy consumption and travel times with EED.
Segment Energy [MJ] Energy [kWh] Time [s]A-B 77.82 21.62 79B-C 51.02 14.17 85C-D 76.66 21.30 107D-E 61.1 16.97 88E-F 53.01 14.73 75F-G 18.34 5.09 83G-H 42.4 11.78 78H-I 63.73 17.70 75I-J 62.37 17.33 80J-K 22.31 6.20 62K-L 28.67 7.96 56L-M 53.27 14.80 73M-N 56.04 15.57 76N-O 54.95 15.27 73O-P 33.4 9.28 66P-Q 23.11 6.42 65Q-R 66.53 18.48 76R-S 29.41 8.17 53S-T 58.19 16.17 74T-U 65.15 18.10 82U-V 66.19 18.39 74V-W 315.81 87.73 201W-Z 58.83 16.34 78Total 1438.31 399.56 1858
Table 6: Energy saving and percent delay.
Segment Energysaving %
Delay % with respect to the followingMinimum travel time Scheduled travel time
A-B 23.76 10.56 0.51B-C 41.56 12.29 2.08C-D 34.58 11.93 1.76D-E 32.78 10.48 0.43E-F 32.63 10.67 0.61F-G 66.93 10.00 0.00G-H 43.00 10.07 0.06H-I 28.60 10.71 0.65I-J 33.42 10.12 0.11J-K 51.80 9.56 −0.40K-L 45.39 10.15 0.14L-M 29.46 12.95 2.69M-N 30.81 10.66 0.60N-O 37.07 10.25 0.22O-P 46.06 9.97 −0.03P-Q 55.13 11.16 1.05Q-R 31.43 10.13 0.12R-S 39.84 9.99 −0.01S-T 29.54 10.53 0.48T-U 31.78 10.48 0.44U-V 30.47 9.90 −0.09V-W 19.77 9.99 0.00W-Z 31.07 10.51 0.46Total 32.89 10.57 0.51
International Journal of Vehicular Technology 11
30 600 5010 20 40Time (s)
0
5
10
15
20
25
30
35
40Sp
eed
(km
/h)
(a)
6030 800 502010 40 70Time (s)
0
10
20
30
40
50
60
Spee
d (k
m/h
)
(b)
200100 150 2500 50Time (s)
0
10
20
30
40
50
60
70
80
90
100
Spee
d (k
m/h
)
(c)
Figure 11: Driving style with EED: (a) R-S segment, (b) M-N segment, and (c) V-W segment.
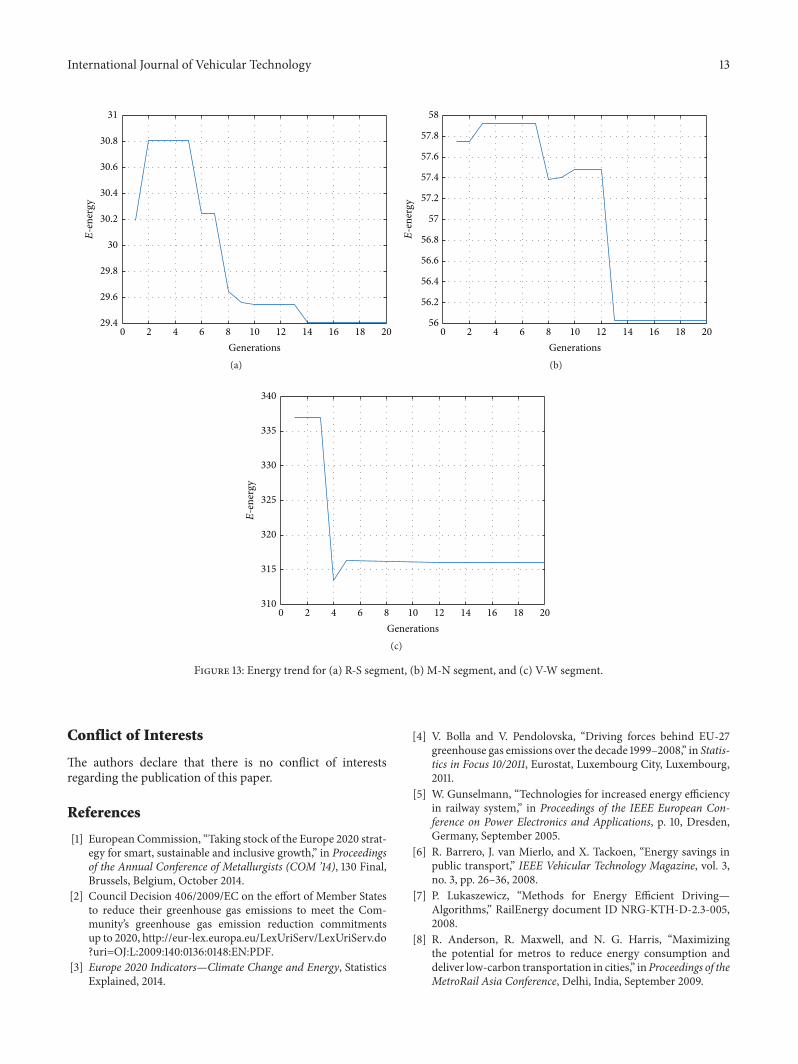
speed of calculation of the solution. The trend of energy tothe sections considered is shown in Figure 13.
As it is possible to easily notice, in each generation thepower consumption tends to decrease, reaching the finalvalue after about 15 generations.
In some places, such as between generation 8 and gen-eration 10, the power consumption in M-N (Figure 13(b)),the energy consumed increases, in contrast to the fitnessfunction. This happens because the solution found in gener-ation 10 has such a power consumption greater than that ofgeneration 8 but will have a travel time which deviates lessfrom the programmed time, leading to an overall increase offitness.
7. Conclusions
Today, the concept of energy efficiency is very important forboth the policy and economic and environmental grounds.
The energy efficient driving (EED) is recognized as one of thetop areas for energy saving.
The aim of this work was shown and the work testedthe potential of optimization techniques based on the use ofgenetic algorithms on a subway line inMilan in order to fulfilthe transition from a traditional system to a driverless one.
The performances of the optimization technique pre-sented are very satisfactory, since they allow achieving anenergy saving equal to 32.89%, causing a negligible increase ofthe travel time up to 0.51% compared to scheduled timetable.
These results are comparable with those obtained by otheroptimization techniques developed in the international liter-ature.Theuse of genetic algorithms allows achieving excellentresults in optimization problems even with limited availabledata, allowing the reprogramming command quickly in caseof unpredicted events or changes of the parameters of thetrains and of the line.

12 International Journal of Vehicular Technology
2 4 6 8 10 12 14 16 18 200Generations
0.0315
0.032
0.0325
0.033
0.0335
0.034
0.0345
Fitn
ess
(a)
6 80 2 10 12 14 16 18 204Generations
0.0169
0.017
0.0171
0.0172
0.0173
0.0174
0.0175
0.0176
0.0177
Fitn
ess
(b)
6 80 2 10 12 14 16 18 204Generations
2.95
3
3.05
3.1
3.15
3.2
Fitn
ess
×10−3
(c)
Figure 12: Fitness trend: (a) R-S segment, (b) M-N segment, and (c) V-W segment.
The travel time deviations, with respect to scheduledtimetable, are all below the threshold of 3%.This value makesit virtually negligible delay, because it is comparable with thedelays thatmay occur due to unpredictable events, such as theincrease in time spent for the passenger to get in and get off ofthe train. In case themaximumallowed delay is exceeded, it ispossible to tighten the constraints in order to let the algorithmfind a better solution.
These measures can be implemented in a driverlessmetro system, where the Automatic Train Operation (ATO)controls traction, braking, and coasting, at almost zero cost,since no investment is needed for infrastructure or additionalcomponents.
The benefits gained in economic and environmentalterms of using a good energy optimization are significant,since with the proposed technique the energy saved by atrain for each service is 195.8 kWh. On the other hand,the optimization of the energy consumption requires moreactions, for example, traction → coasting or coasting →
braking, that the control system (ATO) has to fulfil. Besides,
these actions are strongly dependent on the morphology ofthe track.This is the reasonwhy genetic algorithms have beenchosen as optimization method that has good performancesin every condition without a strong detailed modelizationof the system. The obtained results can be used during thedesign and training phases of the Automatic Train Operation(ATO).
Genetic algorithms, by their nature, make it difficult toexactly replicate the results obtained in previous optimiza-tions, because the solution is obtained by repeated iterations,which involves random parameters. This can be considereda deficit of methods based on genetic algorithms, as everybest solution found at different time is similar but it does notcoincide even with the same initial conditions used.
Finally, it is to be remembered that, in real situations, theminimum travel time driving that represents the worst con-dition from the energetic point of view is not normally set tothe ATO as driving style, except in special situations, typicallyduring the recovery of a delay, in which the achievement ofenergy efficiency is not so important.
International Journal of Vehicular Technology 13
0 2 4 6 8 10 12 14 16 18 20Generations
29.4
29.6
29.8
30
30.2
30.4
30.6
30.8
31
E-e
nerg
y
(a)
56
56.2
56.4
56.6
56.8
57
57.2
57.4
57.6
57.8
58
0 2 4 6 8 10 12 14 16 18 20Generations
E-e
nerg
y
(b)
0 2 4 6 8 10 12 14 16 18 20Generations
310
315
320
325
330
335
340
E-e
nerg
y
(c)
Figure 13: Energy trend for (a) R-S segment, (b) M-N segment, and (c) V-W segment.
Conflict of Interests
The authors declare that there is no conflict of interestsregarding the publication of this paper.
References
[1] European Commission, “Taking stock of the Europe 2020 strat-egy for smart, sustainable and inclusive growth,” in Proceedingsof the Annual Conference of Metallurgists (COM ’14), 130 Final,Brussels, Belgium, October 2014.
[2] Council Decision 406/2009/EC on the effort of Member Statesto reduce their greenhouse gas emissions to meet the Com-munity’s greenhouse gas emission reduction commitmentsup to 2020, http://eur-lex.europa.eu/LexUriServ/LexUriServ.do?uri=OJ:L:2009:140:0136:0148:EN:PDF.
[3] Europe 2020 Indicators—Climate Change and Energy, StatisticsExplained, 2014.
[4] V. Bolla and V. Pendolovska, “Driving forces behind EU-27greenhouse gas emissions over the decade 1999–2008,” in Statis-tics in Focus 10/2011, Eurostat, Luxembourg City, Luxembourg,2011.
[5] W. Gunselmann, “Technologies for increased energy efficiencyin railway system,” in Proceedings of the IEEE European Con-ference on Power Electronics and Applications, p. 10, Dresden,Germany, September 2005.
[6] R. Barrero, J. van Mierlo, and X. Tackoen, “Energy savings inpublic transport,” IEEE Vehicular Technology Magazine, vol. 3,no. 3, pp. 26–36, 2008.
[7] P. Lukaszewicz, “Methods for Energy Efficient Driving—Algorithms,” RailEnergy document ID NRG-KTH-D-2.3-005,2008.
[8] R. Anderson, R. Maxwell, and N. G. Harris, “Maximizingthe potential for metros to reduce energy consumption anddeliver low-carbon transportation in cities,” inProceedings of theMetroRail Asia Conference, Delhi, India, September 2009.

14 International Journal of Vehicular Technology
[9] R. Barrero, X. Tackoen, and J. van Mierlo, “Stationary oronboard energy storage systems for energy consumption reduc-tion in a metro network,” Proceedings of the Institution ofMechanical Engineers, Part F: Journal of Rail and Rapid Transit,vol. 224, no. 3, pp. 207–225, 2010.
[10] P.Wang, X. Lin, and Y. Li, “Optimization analysis on the energysaving control for trains with adaptive genetic algorithm,” inProceedings of the International Conference on Systems andInformatics (ICSAI ’12), pp. 439–443, Yantai, China, May 2012.
[11] A. Gonzalez-Gil, R. Palacin, and P. Batty, “Optimal energyman-agement of urban rail systems: key performance indicators,”Energy Conversion and Management, vol. 90, pp. 282–291, 2015.
[12] Y. Deng, F. Wang, and N. Helian, “EED: energy efficient diskdrive architecture,” Information Sciences, vol. 178, no. 22, pp.4403–4417, 2008.
[13] K. Li, R. Kumpf, P. Horton, and T. E. Anderson, “Quantitativeanalysis of disk drive energy management in portable comput-ers,” in Proceedings of the USENIX Winter Conference, pp. 279–291, San Francisco, Calif, USA, January 1994.
[14] D. Li and J. Wang, “EERAID: energy efficient redundant andinexpensive disk array,” in Proceedings of the 11th Workshop onACM SIGOPS European Workshop (EW ’11), Leuven, Belgium,September 2004.
[15] F. Xiaoyun,Fuzzy Predictive Control and Its ApplicationResearchin Automatic Train Operation, Southwest Jiaotong University,Chengdu, China, 2011.
[16] B. M. Wilamowski, D. Hunter, and A. Malinowsky, “Solvingparity-n problems with feed forward neural networks,” inProceedings of the IEEE International Joint Conference on NeuralNetworks (IJCNN ’03), pp. 2546–2551, Portland, Ore, USA, July2003.
[17] K. K. Wong and T. K. Ho, “Coast control of train movementwith genetic algorithm,” in Proceedings of the The Congresson Evolutionary Computation (CEC ’03), pp. 1280–1287, IEEE,December 2003.
[18] K. K. Wong and T. K. Ho, “Dynamic coast control of trainmovement with genetic algorithm,” International Journal ofSystems Science, vol. 35, no. 13-14, pp. 835–846, 2004.
[19] J.-F. Chen, R.-L. Lin, and Y.-C. Liu, “Optimization of an MRTtrain schedule: reducing maximum traction power by usinggenetic algorithms,” IEEE Transactions on Power Systems, vol.20, no. 3, pp. 1366–1372, 2005.
[20] H. J. Chuang, C. S. Chen, C. H. Lin, and S. H. Chu, “Optimiza-tion of inverter placement for mass rapid transit systems usinggenetic algoritm,” in Proceedings of the IEEE/PES Trasmissionand Distribution Conference and Exhibition: Asia and Pacific,Dalian, China, 2005.
[21] C. Mayet, L. Horrein, A. Bouscayrol et al., “Comparison ofdifferent models and simulation approaches for the energeticstudy of a subway,” IEEE Transactions on Vehicular Technology,vol. 63, no. 2, pp. 556–565, 2014.
[22] M. Domınguez, A. Fernandez-Cardador, A. P. Cucala, andR. R. Pecharroman, “Energy savings in metropolitan railwaysubstations through regenerative energy recovery and optimaldesign of ATO speed profiles,” IEEE Transactions on Automa-tion Science and Engineering, vol. 9, no. 3, pp. 496–504, 2012.
[23] M. Gallo, F. Simonelli, G. De Luca, and V. De Martinis,“Estimating the effects of energy-efficient driving profiles onrailway consumption,” in Proceedings of the 15th InternationalConference on Environment and Electrical Engineering (EEEIC’15), pp. 813–818, IEEE, Rome, Italy, June 2015.
[24] KOBELCOAutomatic Train Control: Efficient unmanned trainoperation, http://www.kobelco.co.jp/english/engineering/pro-ducts/traffic/automatic train control.html.
[25] M. A. Sandidzadeh and B. Shamszadeh, “Improvement of auto-matic train operation using enhanced predictive fuzzy controlmethod,” in Reliability and Safety in Railway, X. Perpinya, Ed.,InTech, 2012.
[26] J.-C. Jong and S. Chang, “Algorithms for generating train speedprofiles,” Journal of the Eastern Asia Society for TransportationStudies, vol. 6, pp. 356–371, 2005.
[27] C. S. Chang and S. S. Sim, “Optimising train movementsthrough coast control using genetic algorithms,” IEE Proceed-ings—Electric Power Applications, vol. 144, no. 1, pp. 65–73, 1997.
[28] A. Fernandez-Rodriguez, A. Fernandez-Cardador, A. P. Cucala,M. Dominguez, and T. Gonsalves, “Design of robust andenergy-efficient ATO speed profiles of metropolitan lines con-sidering train load variations and delays,” IEEE Transactions onIntelligent Transportation Systems, vol. 16, no. 4, pp. 2061–2071,2015.
[29] M. Domınguez, A. Fernandez, A. P. Cucala, and P. Lukaszewicz,“Optimal design of metro automatic train operation speedprofiles for reducing energy consumption,” Proceedings of theInstitution of Mechanical Engineers Part F: Journal of Rail andRapid Transit, vol. 225, no. 5, pp. 463–473, 2011.
[30] S. Su, T. Tang, X. Li, and Z. Gao, “Optimization of multitrainoperations in a subway system,” IEEE Transactions on IntelligentTransportation Systems, vol. 15, no. 2, pp. 673–684, 2014.
[31] M. Oremland and R. Laubenbacher, “Optimization of agent-based models: scaling methods and Heuristic algorithms,”Journal of Artificial Societies and Social Simulation, vol. 17, no.2, 2014.
[32] S. Acikbas and M. T. Soylemez, “Coasting point optimisationfor mass rail transit lines using artificial neural networks andgenetic algorithms,” IET Electric Power Applications, vol. 2, no.3, pp. 172–182, 2008.
[33] Y. V. Bocharnikov, A. M. Tobias, C. Roberts, S. Hillmansen,and C. J. Goodman, “Optimal driving strategy for tractionenergy saving on DC suburban railways,” IET Electric PowerApplications, vol. 1, no. 5, pp. 675–682, 2007.
[34] A. Komyakov, V. Erbes, and V. Ivanchenko, “Application ofartificial neural networks for electric load forecasting on railwaytransport,” in Proceedings of the 15th International Conference onEnvironment and Electrical Engineering (EEEIC ’15), pp. 43–46,IEEE, Rome, Italy, June 2015.
[35] N. Coviello and F. Bruno, “Energy performance in railway ser-vices: a calculationmethodology and the influence of operationparameters,” IET Intelligent Transport Systems, vol. 9, no. 5, pp.530–538, 2015.
[36] B. S. A. Lechelle and Z. S. Mouneimne, “OptiDrive: a practicalapproach for the calculation of energy-optimised operatingspeed profiles,” in Proceedings of the IET Conference on RailwayTraction Systems (RTS ’10), pp. 1–8, IET, Birmingham, UK, April2010.
[37] P. Lukascewicz, Energy consumption and running time fortrains—modelling of running resistance and driver behaviourbased on full-scale testing [Doctoral thesis], KTH Railway Tech-nology, Stockholm, Sweden, 2001, TRITA-FKT 2001:25.

International Journal of
AerospaceEngineeringHindawi Publishing Corporationhttp://www.hindawi.com Volume 2014
RoboticsJournal of
Hindawi Publishing Corporationhttp://www.hindawi.com Volume 2014
Hindawi Publishing Corporationhttp://www.hindawi.com Volume 2014
Active and Passive Electronic Components
Control Scienceand Engineering
Journal of
Hindawi Publishing Corporationhttp://www.hindawi.com Volume 2014
International Journal of
RotatingMachinery
Hindawi Publishing Corporationhttp://www.hindawi.com Volume 2014
Hindawi Publishing Corporation http://www.hindawi.com
Journal ofEngineeringVolume 2014
Submit your manuscripts athttp://www.hindawi.com
VLSI Design
Hindawi Publishing Corporationhttp://www.hindawi.com Volume 2014
Hindawi Publishing Corporationhttp://www.hindawi.com Volume 2014
Shock and Vibration
Hindawi Publishing Corporationhttp://www.hindawi.com Volume 2014
Civil EngineeringAdvances in
Acoustics and VibrationAdvances in
Hindawi Publishing Corporationhttp://www.hindawi.com Volume 2014
Hindawi Publishing Corporationhttp://www.hindawi.com Volume 2014
Electrical and Computer Engineering
Journal of
Advances inOptoElectronics
Hindawi Publishing Corporation http://www.hindawi.com
Volume 2014
The Scientific World JournalHindawi Publishing Corporation http://www.hindawi.com Volume 2014
SensorsJournal of
Hindawi Publishing Corporationhttp://www.hindawi.com Volume 2014
Modelling & Simulation in EngineeringHindawi Publishing Corporation http://www.hindawi.com Volume 2014
Hindawi Publishing Corporationhttp://www.hindawi.com Volume 2014
Chemical EngineeringInternational Journal of Antennas and
Propagation
International Journal of
Hindawi Publishing Corporationhttp://www.hindawi.com Volume 2014
Hindawi Publishing Corporationhttp://www.hindawi.com Volume 2014
Navigation and Observation
International Journal of
Hindawi Publishing Corporationhttp://www.hindawi.com Volume 2014
DistributedSensor Networks
International Journal of