research article a three-dimensional model to study human
TRANSCRIPT

ALTEX 36(1), 2019 18
#contributed equally
Received April 16, 2018; Accepted October 8, 2018; Epub October 9, 2018; © The Authors, 2018.
ALTEX 36(1), 18-28. doi:10.14573/altex.1804161 Correspondence: Fons A. J. van de Loo, PhD, Experimental Rheumatology, Department of Rheumatology, Radboud Institute for Molecular Life Sciences, Radboud University Medical Center, 6525 GA Nijmegen, The Netherlands, PO Box 9101, 6500 HB Nijmegen, The Netherlands ([email protected])
Gabalawy, 2011). The cells in the synovium can produce several pro-inflammatory cytokines and matrix-degrading enzymes. At the interface of the synovium, cartilage and bone, pannus tissue is formed, which contributes to bone destruction. An import-ant mediator of these processes is tumor necrosis factor alpha (TNF-α) (Vasanthi et al., 2007). Specific inhibitors of TNF-α are the most widely used biological therapeutics and can successful-ly inhibit the progress of RA in the majority of patients (Mewar and Wilson, 2011).
Synovial pathology is also described for OA. Although OA has traditionally been described as a wear-and-tear disease of the articular cartilage, synovitis is observed in up to 50% of the OA patients and may contribute to the disease process (Scanzello and Goldring, 2012). A second factor that contributes to the synovi-al thickening in OA is tissue fibrosis (Wenham and Conaghan, 2010). Synovial fibrosis is also associated with joint pain and stiffness (Remst et al., 2015). Although the pathogenesis of OA
1 Introduction
Rheumatoid arthritis (RA) and osteoarthritis (OA) are the most common rheumatic diseases. The global incidence of RA is estimated to be 0.5%-1% (Gabriel and Michaud, 2009) and an estimated 12.1% of the adult population has clinical symptoms of OA (Lawrence et al., 2008). RA and OA are both viewed as multi-factorial diseases involving multiple risk factors (Ala-manos and Drosos, 2005; Blagojevic et al., 2010) but their exact etiology is unknown. Both diseases cannot be cured at present, but disease-modifying drugs (DMARDs) are available for RA and non-steroidal anti-inflammatory drugs (NSAIDs) are com-monly prescribed for OA.
During the abovementioned rheumatic diseases, many pro-cesses occur in the synovium. Already in the early phase of RA, hyperplasia of the synovial lining occurs and immune cells infiltrate the sublining (Timmer et al., 2007; Hitchon and El-
Research Article
A Three-Dimensional Model to Study Human Synovial Pathology Mathijs G. A. Broeren #, Claire E. J. Waterborg #, Renske Wiegertjes, Rogier M. Thurlings, Marije I. Koenders, Peter L. E. M. van Lent, Peter M. van der Kraan and Fons A. J. van de LooExperimental Rheumatology, Department of Rheumatology, Radboud Institute for Molecular Life Sciences, Radboud University Medical Center, Nijmegen, The Netherlands
AbstractTherapeutic agents that are used by patients with rheumatic and musculoskeletal diseases were originally developed and tested in animal models, and although retrospective studies show that these models have limited predictive value, their use has continued because of a lack of good in vitro alternatives. In this study, we developed a 3-dimensional synovial membrane model made of either human primary synovial cell suspensions or a mix of primary fibroblast-like synoviocytes and CD14+ mononuclear cells. We analyzed the composition of the mature micromasses by immunohistochemical staining and flow cytometry and showed that the outer surface forms a lining layer consisting of fibroblast-like and macrophage-like cells, reflecting the in vivo naïve synovial membrane. To model the affected synovial membrane in rheu-matoid arthritis (RA), micromasses were exposed to the pro-inflammatory cytokine tumor necrosis factor alpha (TNF-α), which led to increased pro-inflammatory cytokine expression and production, and to hyperplasia of the membrane. To recreate the synovial membrane in osteoarthritis (OA), the micromasses were exposed to transforming growth factor beta (TGF-β), which led to fibrosis-like changes of the membrane, including increased alpha smooth muscle actin (α-SMA) and increased expression of fibrosis-related genes PLOD2 and COL1A1. Interestingly, the macrophages in the micromasses showed phenotypic plasticity, as prolonged TNF-α or TGF-β stimulation strongly reduced the occurrence of CD163+ M2-like macrophages. We show the plasticity of the micromasses as a synovial model for studying RA and OA pathology and propose that the synovial lining micromass system can be a good alternative for drug testing.
This is an Open Access article distributed under the terms of the Creative Commons Attribution 4.0 International license (http://creativecommons.org/licenses/by/4.0/), which permits unrestricted use, distribution and reproduction in any medium, provi-ded the original work is appropriately cited.

ALTEX 36(1), 2019 19
Broeren et al.
2016). This was performed without further isolation and purifi-cation of the synovial fibroblasts to better represent their cellular composition and interactions as present in the starting material. In the present study, we further characterize these synovial mi-cromasses to study the fate of the different cell types. We found that after lining formation, the micromass mainly consisted of synovial fibroblasts and macrophages. We therefore used micro-masses produced from primary FLS and macrophages through-out the rest of the study. Exposure of the synovial micromasses to TNF-α or TGF-β was used to mimic the inflammatory con-ditions present in RA and OA, respectively. We observed that short-term exposure to TNF-α already leads to proinflammatory gene expression and long-term exposure leads to hyperplasia. Long-term exposure to TGF-β resulted in fibrosis-like changes of the micromass lining. These results provide a detailed analy-sis of the synovial micromasses and show their suitability as a synovial membrane model for translational research on RA and OA. The micromasses may replace animal experiments to study synovial pathology. An informal survey done by us among 20 leading research groups in the arthritis field revealed that 40% are of the opinion that in vitro models may replace animal exper-imentation entirely and 60% find it a useful addition.
2 Materials and methods
Patient materialSynovial biopsies from 5 RA patients were obtained during joint replacement surgery from the orthopedics department of the Sint Maartenskliniek, Nijmegen, The Netherlands. This material was considered surgery surplus material; therefore, its use did not need to be approved by an ethical committee. All patients ad-hered to the American College of Rheumatology (ACR) criteria and were end-stage RA. Patients gave written informed consent for the use of their material for research. The patient material was pseudonymized. Procedures were performed in accordance to the code of conduct for responsible use of human tissue in medical research1. The presence of a synovial lining was determined on 7 µm cryosections stained with hematoxylin and eosin (H&E) to confirm the synovial origin of the tissue (not shown).
Human CD14+ cellsPeripheral blood mononuclear cells (PBMCs) were obtained from 3 healthy donors by density gradient centrifugation using Ficoll-Paque PLUS (GE Healthcare, Chicago, IL, USA). CD14+
cells were isolated from the PBMC fraction using the MagniSort Human CD14 Positive Selection Kit (Invitrogen, Carlsbad, CA, USA) (purity > 90%) according to the manufacturer’s protocol.
Micromass productionMicromasses were produced from either complete synovial cell suspensions from RA synovium as described previously (Broeren et al., 2016), or from a combination of primary RA fibroblast- like synoviocytes (FLS) after several passages and CD14+ mono-cytes. In short, for micromasses from complete cell suspensions,
is poorly understood, the cytokine most critically associated with processes occurring in OA is transforming growth factor beta (TGF-β) (Fang et al., 2016). TGF-β is pivotal for the develop-ment and maintenance of the articular cartilage, but excessive signaling can have detrimental results. For example, adenoviral overexpression of TGF-β in mice resulted in osteophyte forma-tion (Blaney Davidson et al., 2007). Moreover, TGF-β stimulates the differentiation of myofibroblasts and the expression of colla-gen type 1, which contribute to synovial fibrosis (Verrecchia and Mauviel, 2007; Remst et al., 2013).
Many experiments to study the initial stages of inflammation, hyperplasia, and fibrosis in the synovium have been performed in animal models of RA and OA. However, the predictive value of animal models for the screening of potential drugs in RA is variable and for OA, many therapies have been successful in treating experimental OA, but no treatment has been sufficiently effective in clinical trials in humans (Malfait and Little, 2015; McNamee et al., 2015). The translation of the animal findings to the human synovium is difficult because there is a lack of rele-vant human in vitro 3D models of synovial pathology, including hyperplasia and synovial fibrosis.
Translational arthritis research with human cells is often per-formed in monolayer culture with in vitro expanded synovial fibroblasts. Although monolayer culture with fibroblasts is easy to perform, the absence of extracellular matrix and other cell types results in alterations of cell functions and a rapid loss of phenotype (Zimmermann et al., 2001). One way to maintain the cell composition and matrix interactions of the cells is by using synovial explants instead of cultured monolayer cells. Although synovial explants better represent the original joint environment, important disease processes including hyperplasia and cartilage damage may have already taken place and can thus not be stud-ied. Moreover, there is considerable variability between biopsies from a single joint, resulting from variations in lining thickness (Smith et al., 2003), sublining composition, and an unequal dis-tribution of synoviocyte types in the synovial membrane (Shiki-chi et al., 1999; Iwanaga et al., 2000).
To circumvent these challenges and provide a relevant mod-el for the synovial membrane in which cells can interact with cellular matrix, Kiener and co-workers (2006) developed a 3-dimensional (3D) micromass model based on a mixture of fi-broblast-like synoviocytes (FLS) and Matrigel® solution. When kept on ice, the Matrigel® was liquid and could be mixed with cells to obtain a homogenous solution. Single drops were pipet-ted into a culture well and became solid at 37°C. Within weeks, the FLS formed a lining layer on the Matrigel®-medium surface that was similar to a synovial membrane (Kiener et al., 2006). Reticulin fibers on the surface of the micromasses were arranged in an orientation similar to basement membrane structures in synovial biopsies. The FLS in the micromass lining produced lubricin and showed hyperplasia after 3 weeks of stimulation with TNF-α (Kiener et al., 2010). Lining was not formed when using dermal fibroblasts.
We recently constructed synovial micromasses using the complete cell suspension after biopsy digestion (Broeren et al.,
1 https://www.federa.org/code-goed-gebruik

Broeren et al.
ALTEX 36(1), 2019 20
(v/v) (Westburg, Leusden, The Netherlands) was added. The micromasses were cultured for the time and conditions indicated in the results. In general, medium was replaced twice weekly and micromasses were cultured at 37°C and 5% CO2.
Flow cytometryMicromasses were kept on ice for 2 h and the cells were then washed to remove the liquified Matrigel®. Unspecific binding of antibodies to Fc receptors was blocked by incubation with hFc block (1:100 for 20 min at 4°C) (564220 BD Biosciences, San Jose, CA, USA). Cells were stained using mouse anti- human CD90-APC (1:20 for 30 min at 4°C), mouse anti-hu-man CD68-PE (1:20 for 60 min at 4°C) and mouse anti-human CD14-APC (1:20 for 60 min at 4°C). The samples were mea-sured on the CyAn ADP analyzer (Beckman Coulter, Woerden, The Netherlands) using an 488 nm laser in the FL7 and FL8 channels for Alexa Fluor 568/PE and APC, respectively. Gates were determined using fluorescence minus one (FMO). The gating strategy and unstained controls are shown in Figure S12.
the biopsies were digested using Liberase™ (Roche, Basel, Switzerland) for 1 h at 37°C and the cells were filtered through a 70 µm cell strainer (Corning, NY, USA). Red blood cells (RBCs) were lysed for 2 min at room temperature (RT) in 4 ml RBC lysis buffer (155 nM NH4Cl, 12 mM KHCO3, 0.1 mM EDTA, pH 7.3). The cells were mixed on ice with liq-uid Matrigel® and 25 µl droplets containing 5x10⁵ cells were pipetted on a poly-(2-hydroxyethyl methacrylate) (poly-HEMA) (Sigma-Aldrich, Zwijndrecht, The Netherlands) coated 24-well plate (Greiner Bio-one, Alphen a/d Rijn, The Netherlands). Alternatively, micromasses were produced from 2x10⁵ FLS combined with 106 CD14+ mononuclear cells. FLS were ob-tained after biopsy digestion and RBC lysis by culturing the adhering cell fraction and passaging the cells at least once. After 30 min gelation at 37°C, 500 µl Roswell Park Memorial Institute (RPMI) medium (Gibco, Thermofisher Scientific, Waltham, MA, USA) supplemented with 10% heat-inactivated fetal calf serum (FCS) (v/v) (Gibco, Thermofischer Scientific), 1 mM pyruvate (Thermofisher Scientific) and 1% penicillin/streptomycin (P/S)
2 doi:10.14573/altex.1804161s
Tab. 1: List of antibodies
Antibody Isotype Conjugate Monoclonal/ Stock Dilution Appli- Company Catalog Polyclonal concentration cation number
CD14 Mouse IgG2a, κ APC Monoclonal [M5E2] 200 µg/ml 1:20 FC Biolegend 301808
CD68 Mouse IgG2b, κ PE Monoclonal [Y1/82A] 100 µg/ml 1:20 FC eBioscience 12-0689
CD90 Mouse IgG1, κ APC Monoclonal [5E10] 50 µg/ml 1:20 FC eBioscience 17-0909
11-Fibrau Mouse IgG2a N/A Monoclonal [D7-FIB] 1 mg/ml 1:100 IHC AbD Serotec MCA1399G
α-SMA Rabbit IgG N/A Polyclonal 0.2 mg/ml 1:400 IHC Abcam ab5694
CD3 Mouse IgG1, κ N/A Monoclonal [F7.2.38] Undetermined 1:50 IHC DAKO M7254
CD20 Mouse IgG2a, κ N/A Monoclonal [L26] 18 µg/ml 1:100 IHC Cell Marque 120M-84
CD31 Rabbit IgG N/A Unspecified 100 µg/ml 1:50 IHC Genetex GTX48364
CD68 Mouse IgG1, κ N/A Monoclonal [KP1] 410 µg/ml 1:100 IHC DAKO M0814
CD163 Mouse IgG1 N/A Monoclonal [10D6] Undetermined 1:25 IHC Thermo MA5-11458 Fischer
Ki67 Rabbit IgG N/A Monoclonal [SP6] Undetermined 1:100 IHC Thermo RM-9106 Fischer
Mouse IgG1, κ N/A N/A N/A 100 µg/ml * IHC DAKO X0931
Mouse IgG2a, κ N/A N/A N/A 100 µg/ml * IHC DAKO X0943
Rabbit IgG N/A N/A N/A 15 mg/ml * IHC DAKO X0936
Anti-mouse N/A HRP N/A 1.3 mg/ml 1:200 IHC DAKO P0260 IgA/G/M
Anti-mouse N/A Biotinylated N/A 0.5 mg/ml 1:200 IHC Vector BA-2001 IgG Laboratories
Anti-rabbit IgG N/A Biotinylated N/A 1.5 mg/ml 1:400 IHC Vector PK 6101 Laboratories
APC, allophycocyanin; FC; flow cytometry, HRP; horseradish peroxidase, IHC, immunohistochemistry; N/A, not applicable; PE, phycoerythrin * Similar concentration (not dilution) to primary antibody directed to antigen of interest.

Broeren et al.
ALTEX 36(1), 2019 21
hyperplasia, Ki67, and fibrosis analysis, 3 sections were analyzed per micromass and per section up to 5 pictures were taken of the micromass lining after H&E-staining, Ki67 staining, or α-SMA staining, respectively. For CD163 analysis, pictures were taken of the complete micromass matrix. Images were analyzed using Leica Application Suite (LAS) software.
Gene expression analysisThe micromasses were dissolved in 500 µl Tri reagent (Sig-ma-Aldrich) and total RNA was isolated according to the manufacturer’s protocol. qPCR was performed as previously described (Vermeij et al., 2015). Primer sequences are listed in Table 2. Values are depicted as threshold cycle, corrected for GAPDH expression.
Multiplex ELISACytokines and chemokines in supernatants were measured on a Bio-Plex 200 system using a magnetic bead-based multiplex im-munoassay. Data analysis was performed with Bio-Plex manager software (both Bio-Rad).
Statistical analysisThe results are displayed as box plot (median) with whiskers: min to max. Statistical analysis was performed by Mann- Whitney U test using GraphPad Prism software v5.03. P-values below 0.05 were regarded as significant.
3 Results
3.1 Analysis of micromass composition and formationThe composition of the cell suspension after digestion of a synovial biopsy was determined using cell surface markers. In the cell suspension prior to micromass formation, we observed cells positive for fibroblast marker CD90 (67.6%), monocyte/macrophage marker CD68 (23.1%), and monocyte marker CD14 (CD14low 22.9% and CD14high 4.58%) (Fig. 1A, Fig. S12). This cell composition was comparable in independent replicates. No
A comprehensive overview of all antibodies used in this study is shown in Table 1.
ImmunohistochemistryMicromasses were fixed in 2% paraformaldehyde in phos-phate-buffered saline (PBS)/1 mM CaCl2 for 2 h, dehydrated and embedded in paraffin. 7 µm sections were deparaffinized, rehydrated, and stained with H&E or processed for immuno-histochemistry. For immunohistochemistry, endogenous perox-idase activity was blocked with 3% H2O2 (Merck Millipore, Amsterdam, The Netherlands) in methanol and antigen re-trieval was performed in 10 mM citrate buffer, pH 6.0 at 60°C. Subsequently, sections were stained with primary antibodies: mouse anti-human 11-Fibrau (1:100 for 60 min at RT), mouse anti-human CD68 (1:100 for 60 min at RT), mouse anti- human CD163 (1:25 for 60 min at RT), rabbit anti-human alpha smooth muscle actin (α-SMA) (1:400 overnight at 4°C), or rabbit anti-human Ki67 (1:100 for 60 min at RT). Isotype control antibodies were used at the same concentrations as the primary antibodies. Subsequently, the primary antibodies for CD68 were stained with HRP-conjugated rabbit anti-mouse IgA/G/M (1:200 for 60 min at RT), antibodies for 11-Fibrau and CD163 were stained with biotinylated anti-mouse IgG H+L (1:100 for 30 min at RT), and antibodies for α-SMA and Ki67 were stained with biotinylated anti-rabbit (1:400 for 30 min at RT). For 11-Fibrau, CD163, and α-SMA, a biotin-streptavidin detection system was used according to the manufacturer’s protocol (Vector Laboratories). Peroxidase was developed with diaminobenzidine and counterstained with hematoxylin for 60 sec. Representative pictures of all control IgGs are shown in Figure S32. A comprehensive overview of all antibodies used in this study is shown in Table 1.
Image analysisMicroscopic images for histology were taken using the VS120 slide scanner (Olympus, Leiderdorp, The Netherlands) using Panoramic Viewer (3DHISTECH, Budapest, Hungary) and for quantification pictures were taken using the Leica DMR light microscope after randomization and blinding of the samples. For
Tab. 2: Primer sequences
Gene Forward primer sequence Reverse primer sequence
ACTA2 CTGACCCTGAAGTACCCGATA GAGTGGTGCCAGATCTTTTCC
COL1A1 AGATCGAGAACATCCGGAG AGTACTCTCCACTCTTCCAG
GAPDH ATCTTCTTTTGCGTCGCCAG TTCCCCATGGTGTCTGAGC
IL1B TGGGTAATTTTTGGGATCTACACTCT AATCTGTACCTGTCCTGCGTGTT
IL6 AGCCCACCGGGAACGA GGACCGAAGGCGCTTGT
IL8 AGAAGTTTTTGAAGAGGGCTGAGA CAGACCCACACAATACATGAAGTG
PLOD2 AAGACTCCCCTACTCCGGAAA AGCAGTGGATAATAGCCTTCCAA
SERPINE1 GTCTGCTGTGCACCATCCCCCATC TTGTCATCAATCTTGAATCCCATA
TNF TCTTCTCGAACCCCGAGTGA CCTCTGATGGCACCACCAG

Broeren et al.
ALTEX 36(1), 2019 22
These results show that the mixed cell population is maintained during micromass culture. The CD14high fraction dropped to 3.38% and the CD14low fraction was not detected on day 7. The distinct CD68+/CD14low cells had lost most CD14 expression after 7 days.
The kinetics of lining formation and cell migration in the syno-vial micromasses were assessed at different time points. Immedi-ately after micromass formation, the cells had not regained their original morphology and all cells were round-shaped (Fig. 1B).
T cells (CD3), B cells (CD20), or dendritic cells (CD11c) were observed in the cell suspension (data not shown). Almost all CD68+ cells were also CD14low.
We next analyzed the composition of the mature micromass de-veloped from the synovial cell suspension after formation of the lining on day 7. The composition of the micromass was simi-lar to the cultured cell suspension at day 0 (Fig. 1A, Fig. S12). We observed cells positive for CD90 (62.0%) and CD68 (30.8%). The CD68+ cells were also CD14low, as in the cell suspension.
Fig. 1: Flow cytometry and histological analysis of synovial cell suspension and micromasses (A) A RA synovial biopsy was digested using Liberase™. Cells were cultured for < 24 hours (Fig. 1A, day 0) or mixed with Matrigel® and cultured for 7 days, after which the Matrigel® was re-liquified on ice (Fig. 1A, day 7). The cell suspensions were subsequently stained for fibroblasts (CD90), macrophages (CD68), and monocytes (CD14). Similar profiles were obtained in at least 3 experiments with unique donors. FS, forward scatter; SS, side scatter. The gating strategy and unstained controls are shown in Fig. S12. (B) Micromasses were fixed and embedded in paraffin at different time points (day 0, 4, 5, 7, 14, and 35). 7 µm sections were stained with H&E, anti-CD68, or antibodies against fibroblast marker 11-Fibrau. Pictures were taken at 200x magnification. Negative control IgG stainings are shown in Fig. S32.
Broeren et al.
ALTEX 36(1), 2019 23
Based on the observation that the synovial fibroblasts and macrophages were the two cell types that we could identify in the lining of micromasses composed of synovial cell suspen-sions and because these cells represent the two types of synov-iocytes found in the synovial lining, we switched in subsequent experiments to micromasses produced from cultured primary RA FLS and primary CD14+ cells purified from peripheral blood of healthy donors. This approach has previously been ex-plored by Kiener et al. (2006). As expected, these micromasses produced a lining in 7 days (Fig. 2A), which contained both 11- Fibrau+ FLS and CD68+ macrophages (Fig. 2B,C).
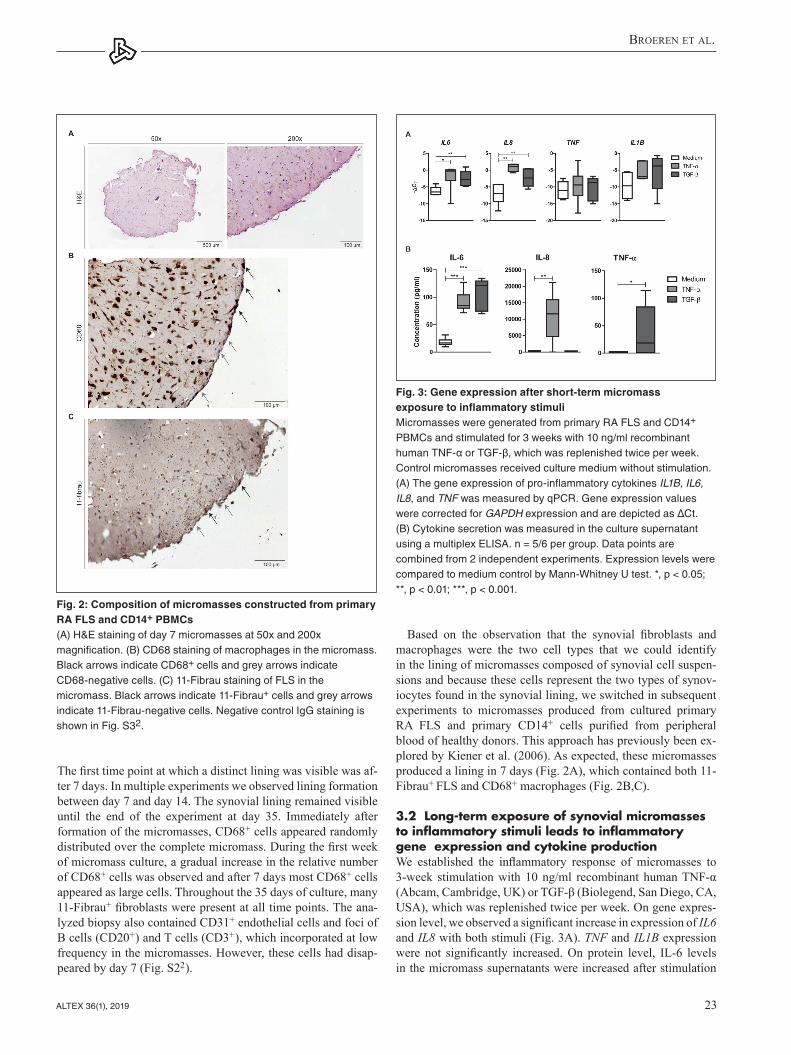
3.2 Long-term exposure of synovial micromasses to inflammatory stimuli leads to inflammatory gene expression and cytokine productionWe established the inflammatory response of micromasses to 3-week stimulation with 10 ng/ml recombinant human TNF-α (Abcam, Cambridge, UK) or TGF-β (Biolegend, San Diego, CA, USA), which was replenished twice per week. On gene expres-sion level, we observed a significant increase in expression of IL6 and IL8 with both stimuli (Fig. 3A). TNF and IL1B expression were not significantly increased. On protein level, IL-6 levels in the micromass supernatants were increased after stimulation
The first time point at which a distinct lining was visible was af-ter 7 days. In multiple experiments we observed lining formation between day 7 and day 14. The synovial lining remained visible until the end of the experiment at day 35. Immediately after formation of the micromasses, CD68+ cells appeared randomly distributed over the complete micromass. During the first week of micromass culture, a gradual increase in the relative number of CD68+ cells was observed and after 7 days most CD68+ cells appeared as large cells. Throughout the 35 days of culture, many 11-Fibrau+ fibroblasts were present at all time points. The ana-lyzed biopsy also contained CD31+ endothelial cells and foci of B cells (CD20+) and T cells (CD3+), which incorporated at low frequency in the micromasses. However, these cells had disap-peared by day 7 (Fig. S22).
Fig. 2: Composition of micromasses constructed from primary RA FLS and CD14+ PBMCs (A) H&E staining of day 7 micromasses at 50x and 200x magnification. (B) CD68 staining of macrophages in the micromass. Black arrows indicate CD68+ cells and grey arrows indicate CD68-negative cells. (C) 11-Fibrau staining of FLS in the micromass. Black arrows indicate 11-Fibrau+ cells and grey arrows indicate 11-Fibrau-negative cells. Negative control IgG staining is shown in Fig. S32.
Fig. 3: Gene expression after short-term micromass exposure to inflammatory stimuliMicromasses were generated from primary RA FLS and CD14+ PBMCs and stimulated for 3 weeks with 10 ng/ml recombinant human TNF-α or TGF-β, which was replenished twice per week. Control micromasses received culture medium without stimulation. (A) The gene expression of pro-inflammatory cytokines IL1B, IL6, IL8, and TNF was measured by qPCR. Gene expression values were corrected for GAPDH expression and are depicted as ΔCt. (B) Cytokine secretion was measured in the culture supernatant using a multiplex ELISA. n = 5/6 per group. Data points are combined from 2 independent experiments. Expression levels were compared to medium control by Mann-Whitney U test. *, p < 0.05; **, p < 0.01; ***, p < 0.001.

Broeren et al.
ALTEX 36(1), 2019 24
the complete micromass showed a hypertrophic phenotype (Fig. 4A). After stimulation with TNF-α, there was a strong reduction in cells displaying this phenotype and instead cells showed a spindle-like morphology. The large, round cells were positive-ly stained for CD163, a membrane marker associated with type 2 macrophages (Fig. 4B) (Kowal et al., 2011). These cells, which were distributed throughout the complete micromass, disap-peared upon TNF-α or TGF-β stimulation (Fig. 4E).
An additional important feature of arthritis is synovial hyper-plasia, which was also assessed after 3 weeks of repeated stim-ulation. Without TNF-α stimulation, the lining was on average 1 cell layer thick (Fig. 4C). After long-term stimulation with
with both TNF-α and TGF-β (Fig. 3B). IL-8 was only increased after stimulation with TNF-α, and TGF-β stimulation induced the release of TNF-α from the micromasses. These results show that the micromasses are sensitive to inflammatory triggers.
3.3 Long-term exposure of synovial micromasses to TNF-α leads to hyperplasia of the micromass lining and an altered macrophage phenotypeIn addition to pro-inflammatory effects, we observed striking differences in the cells residing in the micromass matrix after long-term stimulation with TNF-α. When the micromasses were not treated with TNF-α, some CD68+ cells distributed throughout
Fig. 4: Micromass lining hyperplasia and macrophage phenotype after long-term stimulationMicromasses were generated from primary RA FLS and CD14+ PBMCs and stimulated for 3 weeks with 10 ng/ml re-combinant human TNF-α or TGF-β, which was replenished twice per week. Control micromasses received culture medium without stimulation. Micromasses were stained for CD68 (A), CD163 (B) with H&E (C) and Ki67 (D). Black arrows indicate cells positive for the marker of interest. Grey arrows indicate a hyperplasic lining. (E) Quantification of CD163+ cells throughout the entire micromass. Values were corrected for the total surface area of the images analyzed and are depicted as fold change compared to the average of the unstimulated controls. (F) Quantification of H&E staining for lining hyperplasia. (G) Quantification of Ki67 staining for proliferation of the micromass lining. n = 5/6 per group and the average score of > 3 images per 3 sections of every micromass was calculated. Statistical analysis was performed by Mann-Whitney U test comparing to medium condition. *, p < 0.05; **, p < 0.01. Negative control IgG staining is shown in Fig. S32.

Broeren et al.
ALTEX 36(1), 2019 25
1996). However, after prolonged culture the disease imprint is gradually lost (Zimmermann et al., 2001; Hirth et al., 2002; Har-dy et al., 2013), making the FLS more suitable for the micromass model in which part of the disease is mimicked by stimulation with TNF-α or TGF-β. The micromass model is therefore not dependent on the original disease phenotype of the fibroblasts. This fits with the observation that no spontaneous hyperplasia was observed without stimulation with exogenous TNF-α.
The survival of FLS and macrophage-like cells was observed both by immunohistochemistry and flow cytometry. Several results indicate changes in the macrophage population. During micromass culture, the number of CD68+ cells expressing CD14
TNF-α, the lining thickness increased. The hyperplasia was as-sessed by quantifying the amount of hematoxylin staining and by the expression of the proliferation marker Ki67 in the lining in > 9 images per micromass. The cellularity and proliferation of the lining was significantly increased after TNF-α stimulation (Fig. 4D,F,G) whereas this was unaltered upon TGF-β stimulation.
3.4 TGF-β can induce fibrosis-like changes in the micromass liningThe effects of the 3-week stimulation on micromass fibrosis-as-sociated processes were first assessed on the gene expression level. TGF-β signaling marker SERPINE1 was significantly induced by recombinant TGF-β, indicating that active TGF-β signaling was induced in the micromasses (Fig. 5A). This result-ed in an increased expression of PLOD2, Alpha Smooth Muscle Actin (ACTA2), and collagen type 1 (COL1A1), which are all associated with fibrosis (Remst et al., 2014). Histological stain-ing of α-SMA showed that fibrotic-like changes had occurred in the micromass lining, which was significantly increased after stimulation with TGF-β (Fig. 5B,C). Moreover, TGF-β induced a stellate cell morphology of α-SMA+ cells, characteristic for myofibroblasts (Fig. 5B) (Bagalad et al., 2017).
4 Discussion
In this study, we further characterized the 3D synovial micromass model produced from primary human biopsies for application in both RA and OA research as an alternative to animal exper-iments. The model was first explored by Kiener and co-work-ers (2006) based on primary synovial fibroblast (FLS) culture. Those experiments were focused on cell-cell and cell-matrix interactions during the formation of the lining and the involve-ment of Cadherin-11 (Kiener et al., 2006; Lee et al., 2007). We adapted a procedure that was briefly explored in these studies to produce micromasses with both FLS and CD14+ PBMCs, which resulted in a lining that included 11-Fibrau+ fibroblasts and CD68+ macrophages (Kiener et al., 2010). These two cell types were the predominant lining cell types in the micromasses produced from the complete synovial cell suspension and cor-respond with the cell types observed in the intimal layer of the synovium, the type B synoviocyte (FLS) and type A synoviocyte (macrophage-like synoviocyte), respectively (Smith, 2011). The survival of the macrophage-like cells has previously been shown to be dependent on the presence of synovial fibroblasts (Kiener et al., 2010). The inclusion of these cells in the micromass model is important, because the macrophages produce large amounts of TNF-α and TGF-β and can activate latent TGF-β (Wahl et al., 1990; Kinne et al., 2000). Moreover, macrophages are involved in bone erosion, cartilage damage, and ectopic bone formation in RA and OA (Goldring and Gravallese, 2000; Blom et al., 2004; Bondeson et al., 2006).
For the micromasses that were generated from primary CD14+ PBMCs and primary FLS, FLS had first been cultured in vitro. It has been observed that directly after digestion of the synovium, the FLS have a disease phenotype, which includes the sponta-neous production of pro-inflammatory cytokines (Firestein,
Fig. 5: Fibrosis-like changes after long-term stimulation of micromasses Micromasses were generated from primary RA FLS and CD14+ PBMCs and stimulated for 3 weeks with 10 ng/ml recombinant human TNF-α or TGF-β, which was replenished twice per week. Control micromasses received culture medium without stimulation. (A) qPCR analysis of downstream TGF-β signaling genes and fibrosis-related genes. Gene expression values were corrected for GAPDH expression and are depicted as ΔCt. (B) Staining of α-SMA in the micromasses. Magnification 200x. (C) Digital quantification of α-SMA+ lining surface. Values are depicted as fold change compared to unstimulated micromasses. n = 5/6 per group. Statistical analysis was performed by Mann-Whitney U test comparing to medium condition. *, p < 0.05; **, p < 0.01. Negative control IgG staining is shown in Fig. S32.

Broeren et al.
ALTEX 36(1), 2019 26
interactions and several in vitro studies have aimed at recreating 3D matrix mixed with specific cells. For example, chondrocytes can be co-suspended with gelatin microspheres in an alginate solution to obtain an articular cartilage-like structure (Su et al., 2012). This can be cultured in combination with FLS and in vi-tro differentiated macrophages to mimic OA cartilage pathology (Peck et al., 2018). In addition, FLS have been cultured in sev-eral scaffolds to generate 3D structures. In one study, FLS were combined with endothelial cells in a methylcellulose sphere that was subsequently incorporated in a collagen gel (Maracle et al., 2017). This method was used to study angiogenesis into a col-lagen scaffold. These studies highlight the added value of 3D models for joint tissues and the micromass adds a model to study the synovial membrane.
We propose that the synovial micromass model can be a solu-tion for experiments that require a synovial membrane in which disease processes have not yet occurred, since the availability of healthy synovial tissue is very limited. The production of mi-cromasses will result in a uniform composition of the starting material, which can also be easily manipulated with regard to its composition. In future applications, the micromasses may be co-cultured with different cell types or scaffolds, or in co-cul-ture with cartilage explants to study effects on cartilage degen-eration. Although no 3D models that include all cell types and tissues involved are available yet, the micromass model can be a good alternative to animal experiments studying RA and OA for fundamental research, target validation, as well as pre-clin-ical treatment testing. To our knowledge, this is the first human 3D culture model to study the interplay between macrophages and fibroblast-like synoviocytes in hyperplasia and synovial fibrosis-like pathology by stimulation with TNF-α and TGF-β, respectively.
ReferencesAlamanos, Y. and Drosos, A. A. (2005). Epidemiology of
adult rheumatoid arthritis. Autoimmun Rev 4, 130-136. doi:10.1016/j.autrev.2004.09.002
Bagalad, B. S., Mohan Kumar, K. P. and Puneeth, H. K. (2017). Myofibroblasts: Master of disguise. J Oral Maxillofac Pathol 21, 462-463. doi:10.4103/jomfp.JOMFP_146_15
Blagojevic, M., Jinks, C., Jeffery, A. and Jordan, K. P. (2010). Risk factors for onset of osteoarthritis of the knee in older adults: A systematic review and meta-analysis. Osteoarthritis Cartilage 18, 24-33. doi:10.1016/j.joca.2009.08.010
Blaney Davidson, E. N., Vitters, E. L., van Beuningen, H. M. et al. (2007). Resemblance of osteophytes in experimental osteoarthritis to transforming growth factor beta-induced osteophytes: Limited role of bone morphogenetic protein in early osteoarthritic osteophyte formation. Arthritis Rheum 56, 4065-4073. doi:10.1002/art.23034
Blom, A. B., van Lent, P. L., Holthuysen, A. E. et al. (2004). Synovial lining macrophages mediate osteophyte formation during experimental osteoarthritis. Osteoarthritis Cartilage 12, 627-635. doi:10.1016/j.joca.2004.03.003
Bondeson, J., Wainwright, S. D., Lauder, S. et al. (2006). The role of synovial macrophages and macrophage-produced cyto-
decreased at day 7 compared to day 0. This can be the result of macrophage differentiation, which is associated with a decrease in CD14 expression (Ohradanova-Repic et al., 2016). During the 3-week micromass culture, we observed large CD68+ and CD163+ cells. These cells represent an M2-like anti-inflammato-ry macrophage phenotype (Vandooren et al., 2009; Kowal et al., 2011). They disappeared upon stimulation with TNF-α, which is known to polarize macrophages to a pro-inflammatory M1-like phenotype (Kennedy et al., 2011). We also observed significant down-regulation of CD163 by TGF-β, which has also been de-scribed previously (Pioli et al., 2004). Although additional mark-ers are required for more accurate and reliable identification of specific cell types and cell subsets, the results clearly indicate plasticity of the macrophage-like cell population in the synovial micromass.
Interestingly, we found that when put on ice, the Matrigel® liq-uidized and could be washed away from the cells. The resulting cell suspension could be analyzed by flow cytometry without the requirement of enzymatic digestion, which further enhances the applicability of the micromass model.
We evaluated the long-term effects of TNF-α exposure on micromasses. In addition to the well-known role of TNF-α in RA, TNF-α produced by the osteoarthritic synovium is strongly associated with systemic low-grade inflammation and produc-tion of matrix-degrading enzymes by multiple cells in the joint (Bondeson et al., 2006; Ozler et al., 2016). The observation that systemic TNF-α levels are increased prior to the most pro-nounced cartilage damage supports the hypothesis that inflam-mation in OA is a cause rather than a symptom. We observed that the pro-inflammatory effects of TNF-α can be studied in the micromasses. In addition, synovial hyperplasia is observed in the synovium of both RA and OA patients (Bondeson et al., 2010). We could re-create this pathogenic process by stimulating the micromasses for 3 weeks with TNF-α, which is a major ad-vantage compared to studies using synovial biopsies, in which hyperplasia has already occurred (Izquierdo et al., 2011).
Although both pro- and anti-inflammatory functions of TGF-β have been described for arthritic diseases, we observed a strong increase in expression of IL-6 and TNF-α after stimulation with TGF-β. IL-8 mRNA but not protein was significantly increased by TGF-β. The effects of TGF-β on IL-6 and IL-8 have been described before in PBMCs and synovial fibroblasts (Turner et al., 1990; Cheon et al., 2002). Interestingly, TGF-β stimulation resulted in increased TNF-α secretion, but an increase of mRNA level was not observed. Previous experiments with TGF-β and synovial cell cultures did not result in increased TNF-α produc-tion, which indicates that our finding of increased TNF-α might be an indirect effect (Brennan et al., 1990). The most pronounced effect of long-term TGF-β stimulation was the strong increase of an α-SMA+ lining, which was not observed after stimulation with TNF-α. The increased α-SMA was not caused by hyperpla-sia, which did not occur after TGF-β stimulation.
The joint is considered a complex organ and joint diseases like RA and OA are thought to involve several cell types and tis-sues, including the synovium, but also the articular cartilage and (subchondral) bone (Mathiessen and Conaghan, 2017). These tissues are also dependent on the extracellular matrix for proper

Broeren et al.
ALTEX 36(1), 2019 27
Kennedy, A., Fearon, U., Veale, D. J. and Godson, C. (2011). Macrophages in synovial inflammation. Front Immunol 2, 52. doi:10.3389/fimmu.2011.00052
Kiener, H. P., Lee, D. M., Agarwal, S. K. and Brenner, M. B. (2006). Cadherin-11 induces rheumatoid arthritis fibro-blast-like synoviocytes to form lining layers in vitro. Am J Pathol 168, 1486-1499. doi:10.2353/ajpath.2006.050999
Kiener, H. P., Watts, G. F., Cui, Y. et al. (2010). Synovial fibro-blasts self-direct multicellular lining architecture and synthetic function in three-dimensional organ culture. Arthritis Rheum 62, 742-752. doi:10.1002/art.27285
Kinne, R. W., Bräuer, R., Stuhlmüller, B. et al. (2000). Mac-rophages in rheumatoid arthritis. Arthritis Res 2, 189-202. doi:10.1186/ar86
Kowal, K., Silver, R., Slawinska, E. et al. (2011). CD163 and its role in inflammation. Folia Histochem Cytobiol 49, 365-374. doi:10.5603/FHC.2011.0052
Lawrence, R. C., Felson, D. T., Helmick, C. G. et al. (2008). Estimates of the prevalence of arthritis and other rheumatic conditions in the United States. Part II. Arthritis Rheum 58, 26-35. doi:10.1002/art.23176
Lee, D. M., Kiener, H. P., Agarwal, S. K. et al. (2007). Cadher-in-11 in synovial lining formation and pathology in arthritis. Science 315, 1006-1010. doi:10.1126/science.1137306
Malfait, A.-M. and Little, C. B. (2015). On the predictive utility of animal models of osteoarthritis. Arthritis Res Ther 17, 225. doi:10.1186/s13075-015-0747-6
Maracle, C. X., Kucharzewska, P., Helder, B. et al. (2017). Tar-geting non-canonical nuclear factor-kappaB signalling atten-uates neovascularization in a novel 3D model of rheumatoid arthritis synovial angiogenesis. Rheumatology (Oxford) 56, 294-302. doi:10.1093/rheumatology/kew393
Mathiessen, A. and Conaghan, P. G. (2017). Synovitis in osteo-arthritis: Current understanding with therapeutic implications. Arthritis Res Ther 19, 18. doi:10.1186/s13075-017-1229-9
McNamee, K., Williams, R. and Seed, M. (2015). Animal mod-els of rheumatoid arthritis: How informative are they? Eur J Pharmacol 759, 278-286. doi:10.1016/j.ejphar.2015.03.047
Mewar, D. and Wilson, A. G. (2011). Treatment of rheumatoid arthritis with tumour necrosis factor inhibitors. Br J Pharma-col 162, 785-791. doi:10.1111/j.1476-5381.2010.01099.x
Ohradanova-Repic, A., Machacek, C., Fischer, M. B. and Stock-inger, H. (2016). Differentiation of human monocytes and derived subsets of macrophages and dendritic cells by the HLDA10 monoclonal antibody panel. Clin Transl Immunolo-gy 5, e55. doi:10.1038/cti.2015.39
Ozler, K., Aktas, E., Atay, C. et al. (2016). Serum and knee sy-novial fluid matrixmetalloproteinase-13 and tumor necrosis factor-alpha levels in patients with late stage osteoarthritis. Acta Orthop Traumatol Turc. doi:10.1016/j.aott.2015.11.003
Peck, Y., Leom, L. T., Low, P. F. P. and Wang, D. A. (2018). Establishment of an in vitro three-dimensional model for car-tilage damage in rheumatoid arthritis. J Tissue Eng Regen Med 12, e237-e249. doi:10.1002/term.2399
Pioli, P. A., Goonan, K. E., Wardwell, K. and Guyre, P. M. (2004). TGF-beta regulation of human macrophage scavenger
kines in driving aggrecanases, matrix metalloproteinases, and other destructive and inflammatory responses in osteoarthritis. Arthritis Res Ther 8, R187. doi:10.1186/ar2099
Bondeson, J., Blom, A. B., Wainwright, S. et al. (2010). The role of synovial macrophages and macrophage-produced mediators in driving inflammatory and destructive responses in osteoarthritis. Arthritis Rheum 62, 647-657. doi:10.1002/art.27290
Brennan, F. M., Chantry, D., Turner, M. et al. (1990). Detection of transforming growth factor-beta in rheumatoid arthritis synovial tissue: Lack of effect on spontaneous cytokine pro-duction in joint cell cultures. Clin Exp Immunol 81, 278-285. doi:10.1111/j.1365-2249.1990.tb03331.x
Broeren, M. G., de Vries, M., Bennink, M. B. et al. (2016). Sup-pression of the inflammatory response by disease-inducible interleukin-10 gene therapy in a three-dimensional micromass model of the human synovial membrane. Arthritis Res Ther 18, 186. doi:10.1186/s13075-016-1083-1
Cheon, H., Yu, S. J., Yoo, D. H. et al. (2002). Increased expres-sion of pro-inflammatory cytokines and metalloproteinase-1 by TGF-β1 in synovial fibroblasts from rheumatoid arthritis and normal individuals. Clin Exp Immunol 127, 547-552. doi:10.1046/j.1365-2249.2002.01785.x
Fang, J., Xu, L., Li, Y. and Zhao, Z. (2016). Roles of TGF-beta 1 signaling in the development of osteoarthritis. Histol Histo-pathol 31, 1161-1167. doi:10.14670/hh-11-779
Firestein, G. S. (1996). Invasive fibroblast-like synoviocytes in rheumatoid arthritis. Passive responders or transformed aggressors? Arthritis Rheum 39, 1781-1790. doi:10.1002/art.1780391103
Gabriel, S. E. and Michaud, K. (2009). Epidemiological studies in incidence, prevalence, mortality, and comorbidity of the rheumatic diseases. Arthritis Res Ther 11, 229. doi:10.1186/ar2669
Goldring, S. R. and Gravallese, E. M. (2000). Pathogenesis of bone erosions in rheumatoid arthritis. Curr Opin Rheumatol 12, 195-199. doi:10.1097/00002281-200005000-00006
Hardy, R. S., Hülso, C., Liu, Y. et al. (2013). Characterisation of fibroblast-like synoviocytes from a murine model of joint inflammation. Arthritis Res Ther 15, R24-R24. doi:10.1186/ar4158
Hirth, A., Skapenko, A., Kinne, R. W. et al. (2002). Cytokine mRNA and protein expression in primary-culture and repeat-ed-passage synovial fibroblasts from patients with rheumatoid arthritis. Arthritis Res 4, 117-125. doi:10.1186/ar391
Hitchon, C. A. and El-Gabalawy, H. S. (2011). The synovi-um in rheumatoid arthritis. Open Rheumatol J 5, 107-114. doi:10.2174/1874312901105010107
Iwanaga, T., Shikichi, M., Kitamura, H. et al. (2000). Morphol-ogy and functional roles of synoviocytes in the joint. Arch Histol Cytol 63, 17-31. doi:10.1679/aohc.63.17
Izquierdo, E., Canete, J. D., Celis, R. et al. (2011). Synovial fibroblast hyperplasia in rheumatoid arthritis: Clinicopatho-logic correlations and partial reversal by anti-tumor necrosis factor therapy. Arthritis Rheum 63, 2575-2583. doi:10.1002/art.30433

Broeren et al.
ALTEX 36(1), 2019 28
Vandooren, B., Noordenbos, T., Ambarus, C. et al. (2009). Ab-sence of a classically activated macrophage cytokine signature in peripheral spondylarthritis, including psoriatic arthritis. Ar-thritis Rheum 60, 966-975. doi:10.1002/art.24406
Vasanthi, P., Nalini, G. and Rajasekhar, G. (2007). Role of tumor necrosis factor-alpha in rheumatoid arthritis: A re-view. APLAR J Rheumatol 10, 270-274. doi:10.1111/j.1479-8077.2007.00305.x
Vermeij, E. A., Broeren, M. G., Bennink, M. B. et al. (2015). Disease-regulated local IL-10 gene therapy diminishes sy-novitis and cartilage proteoglycan depletion in experimental arthritis. Ann Rheum Dis 74, 2084-2091. doi:10.1136/ann-rheumdis-2014-205223
Verrecchia, F. and Mauviel, A. (2007). Transforming growth factor-β and fibrosis. World J Gastroenterol 13, 3056-3062. doi:10.3748/wjg.v13.i22.3056
Wahl, S. M., Allen, J. B., Wong, H. L. et al. (1990). Antagonistic and agonistic effects of transforming growth factor-beta and IL-1 in rheumatoid synovium. J Immunol 145, 2514-2519.
Wenham, C. Y. and Conaghan, P. G. (2010). The role of synovi-tis in osteoarthritis. Ther Adv Musculoskelet Dis 2, 349-359. doi:10.1177/1759720X10378373
Zimmermann, T., Kunisch, E., Pfeiffer, R. et al. (2001). Iso-lation and characterization of rheumatoid arthritis synovial fibroblasts from primary culture – Primary culture cells mark-edly differ from fourth-passage cells. Arthritis Res 3, 72-76. doi:10.1186/ar142
Conflict of interestThere are no conflicts of interest to report.
AcknowledgementsWe would like to thank Miranda Bennink for her technical sup-port with flow cytometry and immunohistochemistry and Lynn Devilée for her support with the micromass production. The work was financially supported by the Dutch Arthritis Foundation (grant numbers 11-1-409 and 15-2-403) and ZonMw program “more research with less animals” (114021001).
receptor CD163 is Smad3-dependent. J Leukoc Biol 76, 500-508. doi:10.1189/jlb.1203617
Remst, D. F., Blaney Davidson, E. N., Vitters, E. L. et al. (2013). Osteoarthritis-related fibrosis is associated with both elevated pyridinoline cross-link formation and lysyl hydroxylase 2b ex-pression. Osteoarthritis Cartilage 21, 157-164. doi:10.1016/j.joca.2012.10.002
Remst, D. F., Blom, A. B., Vitters, E. L. et al. (2014). Gene expression analysis of murine and human osteoarthritis sy-novium reveals elevation of transforming growth factor be-ta-responsive genes in osteoarthritis-related fibrosis. Arthritis Rheumatol 66, 647-656. doi:10.1002/art.38266
Remst, D. F., Blaney Davidson, E. N. and van der Kraan, P. M. (2015). Unravelling osteoarthritis-related synovial fibrosis: A step closer to solving joint stiffness. Rheumatology (Oxford) 54, 1954-1963. doi:10.1093/rheumatology/kev228
Scanzello, C. R. and Goldring, S. R. (2012). The role of sy-novitis in osteoarthritis pathogenesis. Bone 51, 249-257. doi:10.1016/j.bone.2012.02.012
Shikichi, M., Kitamura, H. P., Yanase, H. et al. (1999). Three-di-mensional ultrastructure of synoviocytes in the horse joint as revealed by the scanning electron microscope. Arch Histol Cytol 62, 219-229. doi:10.1679/aohc.62.219
Smith, M. D., Barg, E., Weedon, H. et al. (2003). Microarchi-tecture and protective mechanisms in synovial tissue from clinically and arthroscopically normal knee joints. Ann Rheum Dis 62, 303-307. doi:10.1136/ard.62.4.303
Smith, M. D. (2011). The normal synovium. Open Rheumatol J 5, 100-106. doi:10.2174/1874312901105010100
Su, K., Lau, T. T., Leong, W. et al. (2012). Creating a living hy-aline cartilage graft free from non-cartilaginous constituents: An intermediate role of a biomaterial scaffold. Adv Funct Ma-ter 22, 972-978. doi:10.1002/adfm.201102884
Timmer, T. C., Baltus, B., Vondenhoff, M. et al. (2007). In-flammation and ectopic lymphoid structures in rheumatoid arthritis synovial tissues dissected by genomics technology: Identification of the interleukin-7 signaling pathway in tissues with lymphoid neogenesis. Arthritis Rheum 56, 2492-2502. doi:10.1002/art.22748
Turner, M., Chantry, D. and Feldmann, M. (1990). Transforming growth factor beta induces the production of interleukin 6 by human peripheral blood mononuclear cells. Cytokine 2, 211-216. doi:10.1016/1043-4666(90)90018-O