research article a mobile application for easy design and...
TRANSCRIPT

Research ArticleA Mobile Application for Easy Design and Testing of Algorithmsto Monitor Physical Activity in the Workplace
Susanna Spinsante,1 Alberto Angelici,1 Jens Lundström,2 Macarena Espinilla,3
Ian Cleland,4 and Christopher Nugent4
1Dipartimento di Ingegneria dell’Informazione, Universita’ Politecnica delle Marche, 60131 Ancona, Italy2School of Information Technology, Halmstad University, Kristian IV:s vag 3, 301 18 Halmstad, Sweden3Department of Computer Science, University of Jaen, Campus Las Lagunillas, s/n, A3-118, 23071 Jaen, Spain4Computer Science Research Institute, University of Ulster, Newtownabbey, Ulster BT37 0QB, UK
Correspondence should be addressed to Susanna Spinsante; [email protected]
Received 25 March 2016; Revised 19 June 2016; Accepted 10 July 2016
Academic Editor: Ivan Ganchev
Copyright © 2016 Susanna Spinsante et al. This is an open access article distributed under the Creative Commons AttributionLicense, which permits unrestricted use, distribution, and reproduction in any medium, provided the original work is properlycited.
This paper addresses approaches to Human Activity Recognition (HAR) with the aim of monitoring the physical activity of peoplein the workplace, by means of a smartphone application exploiting the available on-board accelerometer sensor. In fact, HARvia a smartphone or wearable sensor can provide important information regarding the level of daily physical activity, especially insituations where a sedentary behavior usually occurs, like inmodernworkplace environments. Increased sitting time is significantlyassociated with severe health diseases, and the workplace is an appropriate intervention setting, due to the sedentary behaviortypical of modern jobs. Within this paper, the state-of-the-art components of HAR are analyzed, in order to identify and selectthe most effective signal filtering and windowing solutions for physical activity monitoring. The classifier development process isbased upon three phases; a feature extraction phase, a feature selection phase, and a training phase. In the training phase, a publiclyavailable dataset is used to test among different classifier types and learning methods. A user-friendly Android-based smartphoneapplication with low computational requirements has been developed to run field tests, which allows to easily change the classifierunder test, and to collect new datasets ready for use withmachine learning APIs.The newly created datasets may include additionalinformation, like the smartphone position, its orientation, and the user’s physical characteristics. Using the mobile tool, a classifierbased on a decision tree is finally set up and enriched with the introduction of some robustness improvements. The developedapproach is capable of classifying six activities, and to distinguish between not active (sitting) and active states, with an accuracynear to 99%. The mobile tool, which is going to be further extended and enriched, will allow for rapid and easy benchmarking ofnew algorithms based on previously generated data, and on future collected datasets.
1. Introduction
Theubiquity of smartphones together with their ever increas-ing computing, networking, and sensing capabilities haschanged the landscape of people’s daily life. Among others,activity recognition, which takes the raw sensor readings asinput and predicts a user’s activity, has become an activeresearch area in recent years [1–3]. Activity recognition aimsto understand the actions and goals of one or more humans,from a series of observations on their actions and the envi-ronmental conditions. Indeed, Human Activity Recognition
(HAR) has become a task of great interest, especially formedical, military, and security applications. For instance,patients with diabetes, obesity, or heart disease are oftenrequested to perform a well-defined physical training as apart of their treatment.Therefore, the ability to automaticallyrecognize activities such as walking, running, or restingbecomes a powerful tool, to encourage the patients andto provide feedback on their behavior to the caregivers.Application areas for HAR include [4] daily life monitoring[5–8], personal biometric signature [9], elderly and youthcare [10–12], and localization [13, 14].
Hindawi Publishing CorporationMobile Information SystemsVolume 2016, Article ID 5126816, 17 pageshttp://dx.doi.org/10.1155/2016/5126816
2 Mobile Information Systems
A necessary prerequisite for systems aimed at stimulatingphysical activity (PA) is to have monitoring capabilitiesenabled by HAR. The importance of promoting PA amongpeople, through virtual coaching, is motivated by recentresearch outcomes that correlate sedentary behaviors with“an elevated risk of diabetes, cardiovascular disease, andall-cause mortality” [15]. Worsening of other health condi-tions, like metabolic syndrome, type-2 diabetes mellitus, andobesity, is also strongly associated with increased inactivity.Unfortunately, modern workplaces are typically populated byalmost inactive adults who spend several hours sitting [16],and a 2-hour increase of this kind of “occupational” inactivityhas been related to a 5–7% increase of the health risks high-lighted above [17]. Only a small part of the adult population(18 to 64 years old) in developed countries meets the GlobalPhysical Activity (GPA) guidelines, recommending at least150mins of “moderate to vigorous” PA per week. Weight-gaining, up to obesity, is another side effect of a lazy lifestyle:in addition to medical costs, it also causes relevant economiclosses, due to missed working hours, decreased productivity,and disability [18].
According to the previous discussion, replacing the sittingtime spent at the workplace with low-intensity PA may helppreventing chronic diseases. Some exotic solutions have beenproposed, such as workstations that allow the worker to standor walk, using a specially designed standing or treadmilldesk [19]. Stimulating PA through a virtual coach may be afeasible solution, and, to this aim, a precise monitoring ofdaily activity in the workplace is an extremely important task.
This work presents a mobile application, called Acti-monitor Android, developed as a tool for rapid and easytesting of algorithms designed to accurately monitor thedaily activity in the workplace. The accelerometer sensor on-board mainstream smartphones is used, and the feasibility ofimplementing even complex HAR systems on a smartphoneis demonstrated. The tool is first developed and tested inan offline learning phase. Afterwards, it is executed ona mobile platform. Typical smartphone-related constraints,such as available computational resources, memory, andbattery power, raise specific challenges for high-demandingmobile applications, like HAR, that requires feature extrac-tion, classification, and transmission of relevant amounts ofraw data. Moreover, current open source machine learning(ML) application programming interfaces (APIs), such as theWaikato Environment for Knowledge Analysis (WEKA) [20]and Java Data Mining (JDM), are neither designed, noroptimized, to runwith full functionality onmobile platforms.Thus, a relevant problem addressed in this work is the mobileimplementation of a HAR system, meeting response time,and energy consumption requirements.
Thepaper is organized as follows: Section 2 introduces theHAR problem, discussing the role of sensors and the state-of-the-art algorithms for activity recognition. In Section 3the datasets, tools, and methodologies used for experimentsare presented, with the mobile application developed forHAR algorithms design. Experimental results are discussedin Section 4; finally, Section 5 concludes the paper.
2. Human Activity Recognition
2.1. Review of Literature. A classic ML approach is adoptedin HAR systems, in which classification is performed uponfeatures extracted from raw sensor data, properly collected,preprocessed, and arranged into time-based segments. Fromdata to features, an abstraction process takes place, basedon which statistical or frequency-domain properties capturesensible information over each data segment, to feed aclassifier. A selection of features may be necessary to reducethe data dimension handled by the classification algorithmthat is designed on a training data subset and evaluated on atesting data subset.
Most of the research on HAR through mobile deviceshas been carried out using sensor data collected from smart-phones but subsequently processed offline by means of MLtoolboxes, such as WEKA [20]. As previously mentioned,smartphones have been traditionally considered as deviceswith limited resources, in terms of computational processingand battery lifetime [21].While it is still important to considerthese limitations when developing HAR systems for smart-phones, such devices have become increasingly capable ofrunning complex HAR in real-time. Nevertheless, challengesstill remain in the evaluation of HAR solutions, particularlyacross the wide variety of hardware and software componentsnow available. While a wide range of studies have reportedand reviewed offline HAR (e.g., [22, 23]), just a few oneshave fully implemented HAR onmobile phones for real-timeprocessing [24]. This should include sensing, preprocessing,and classification, all carried out locally on the device.
Data provided by an accelerometer and a gyroscope on-board an Android smartphone carried in a pocket have beenused by Dernbach et al. [25], to recognize simple actions (sit-ting, walking, running, and standing) and even more com-plex activities (cleaning, cooking, washing hands, and takingmedication). Recognition of simple actions has been attainedwith a 93% accuracy, by aMultilayer Perceptron classifier anda two-second time window. The inclusion of complex activ-ities in the dataset reduced accuracy to 50%, but still theseresults are promising for the current work, which seeks toidentify simple physical activities such as walking, standing,and siting in an office environment, using data from a singlesmartphone sensor. Classification for this study was howevercarried out offline using the WEKA toolkit and thereforeneeds to be implemented and tested in real-time. In the paperby Kim et al. [26] a HAR solution was developed to assessphysical activity and energy consumption in various build-ings. This solution, developed for Android devices, recog-nized walking, climbing and descending stairs, running, andno movement. A Support Vector Machine (SVM) used datafrom accelerometer, gyroscope, and magnetometer to pro-vide the classification, achieving high accuracies (98.26%).
Among the classifiers implemented and tested on mobilephones in the last few years, it is possible tomentionDecisionTrees (DT) [22, 23], SVM [27], 𝐾-Nearest Neighbor (𝑘-NN) [24], and naıve Bayes [28]. Multilayer or hierarchicalclassification are obtained combining classifiers in differentways. Reddy et al. [29] combined a DT and a DynamicHidden Markov Model (DHMM), achieving an accuracy of

Mobile Information Systems 3
93.6% over a dataset from sixteen actors. In the majorityof studies, classifiers are trained offline, using representativedata, because training is computationally expensive and doesnot match real-time requirements. Then, the classification isimplemented in real-time. Recently, Google released a real-time activity recognition API [30]; however, this is limitedto motion-related activities (walking, cycling, and driving)and does not include static activities such as standing still orsitting, which are of interest in this work.
Real-time feedback to the user is another importantaspect of both context aware and healthcare applications,particularly when trying to promote PA. However, in a largeamount of studies this feature is missing [31]. A systemdeveloped by Lane et al. [28] provided real-time feedbackthrough an animated user interface, reflecting the user’sbehavior, which is a slow motion for a static condition, anda more dynamic one for an increased activity. In this work weaim to stimulate the subject’s PA by prompting, based on PAself-monitoring through the Actimonitor Android app.
The following sections provide details of the HAR clas-sification process discussing current practices within the lit-erature. These include data collection, preprocessing, featureextraction, and classification steps.
2.2. Problem Definition. Resorting to [32] and borrowing thesame notation, the HAR problem (HARP) may be math-ematically and formally defined, starting from sensor datacollected and indexed over the time dimension and assumingnonsimultaneous activities:
Definition 1 (HARP). Given a set 𝑆 = 𝑆0, . . . , 𝑆
𝑘−1of 𝑘 time
series, each one from a particular measured attribute andall defined within time interval 𝐼 = [𝑡
𝛼, 𝑡𝜔], the goal is to
find a temporal partition ⟨𝐼0, . . . , 𝐼
𝑟−1⟩ of 𝐼, based on the data
in 𝑆, and a set of labels representing the activity performedduring each interval 𝐼
𝑗(e.g., sitting and walking). This
implies that time intervals 𝐼𝑗are consecutive, nonempty, and
nonoverlapping, such that⋃𝑟−1𝑗=0𝐼𝑗= 𝐼.
The very large (or even infinite) amount of combinationsof attribute values and activities and their generally unknownduration prevent a deterministic solution to the HARP andrequire the use of ML tools. A relaxed version of the problemis consequently introduced, in which time series are dividedinto fixed length time windows, as follows.
Definition 2 (relaxed HARP). Given a set𝑊 = 𝑊0, . . . ,𝑊
𝑚−1
of𝑚 time windows𝑊𝑖having the same size and being totally
or partially labeled, such that each𝑊𝑖contains a set of time
series 𝑆𝑖= {𝑆𝑖,0, . . . , 𝑆
𝑖,𝑘−1} from each of the 𝑘measured attrib-
utes, and a set 𝐴 = {𝑎0, . . . , 𝑎
𝑛−1} of activity labels, the goal is
to find a mapping function 𝑓 : 𝑆𝑖→ 𝐴 that can be evaluated
for all possible values of 𝑆𝑖, such that 𝑓(𝑆
𝑖) is as similar as
possible to the actual activity performed during𝑊𝑖.
The relaxation introduces some errors into the model,which are however negligible for most applications. A rele-vant approach in activity recognition is to combine the outputof different models to produce more accurate predictions.
Table 1: Main characteristics of HAR systems.
Type Characteristic
Execution OfflineOnline
GeneralizationUser independent
User specificTemporal
Recognition ContinuousIsolated
ActivitiesPeriodicSporadicStatic
System model StatelessStateful
This leads to multiclassifier systems, which are shown tobe effective, at the expense of an increase in computationalcomplexity. The formal definition of combining predictionsfrom several learners is as follows.
Definition 3 (HARP with multiclassifier). Given a classifica-tion problem with a feature space 𝑋 ∈ 𝑅
𝑛and a set of classes
Ω = {𝜔0, . . . , 𝜔
𝑛−1}, an instance𝑥 ∈ 𝑋 to be classified and a set
of predictions 𝑆 = {𝑠0, . . . , 𝑠
𝑘−1} for 𝑥, from 𝑘 classifiers, the
goal of a multiclassifier system is to return the correct label𝜔∗ iff ∃𝑠
𝑖∈ 𝑆 | 𝜔
∗= 𝑠𝑖.
Some of the challenges faced in activity recognition arecommon to other fields too, but there are several specificissues for which dedicated computational methods havebeen developed. The recognition of highly diverse humanactivities requires selecting and combining several heteroge-neous sensors that can be dynamically added or removed,based on application-driven requirements. Suitable metricsare finally defined to evaluate the HAR system performance.Table 1 summarizes the options in HAR system design andimplementation.
2.2.1. Activities. Activities recognized from sensor data canbe classified in different ways, for example, in terms of theircomplexity. A simple locomotion could be walking, jogging,walking downstairs, taking elevator, and so forth. Complexactivities are usually related to a combination of actions(e.g., taking bus and driving) but may even correspondto the movements of certain body parts (e.g., typing andwaving hand). Some activitiesmay refer to the general contextof healthcare, such as falling, exercise, and rehabilitations.Location-based activities include dining, shopping, andwatching movies. Vision-based activities include leaving orentering a place. An IR sensor could detect a user moving orbeing still, whereas a home assisting robot could understandwhen the person is sleeping, taking pills, or doing cleaning[4, 33, 34].
Solutions developed for HAR must be robust to “intr-aclass” and “interclass” variability, the former occurringwhen the same activity is performed differently by different

4 Mobile Information Systems
Table 2: The different categories and types of activities in the current literature.
Category Activity type
Simple activities Walking, jogging, sitting, standing, lying, walking upstairs, walking downstairs, jumping, taking escalatorup, taking escalator down, taking elevator up, taking elevator down
Complex activitiesShopping, taking buses, moving by walking, driving a car, living activities, brushing teeth, vacuuming,typing, eating, cooking, washing hand, meditation, clapping, watering plants, sweeping, shaving, dryblowing the hair, washing dishes, ironing, flushing the toilet
Working activities Working, relaxing, cleaning, on a break, meeting, home talking, home entertainingHealth activities Exercising, fall, rehabilitation activities, following routines
Table 3: Hardware (HW) and software (SW) sensors in Android [46].
Sensor Description
HW
Accelerometer Measures acceleration force applied to the device, including gravityAmbient temperature sensor Measures ambient room temperatureMagnetometer Measures ambient geomagnetic field along three axes (𝑥; 𝑦; 𝑧)Barometer Measures ambient air pressureGyroscope Measures device rotation along three axes (𝑥; 𝑦; 𝑧)Light sensor Measures ambient light level (illumination)Proximity sensor Measures proximity of an object relative to the screen of a deviceHumidity sensor Measures humidity of ambient environment
SWLinear acceleration Measures acceleration force applied to the device (gravity excluded)Gravity sensor Measures gravity force applied to the device, along three axes (𝑥; 𝑦; 𝑧)Rotation Measures the orientation of a device by providing the 3 elements of the devices’ rotation vector
individuals, or even by the same one in different times, andthe latter due to data showing very similar characteristicseven if belonging to fundamentally different classes. Whennot all the data in a continuous stream are relevant forHAR, the so-called NULL class problem may occur, whichis difficult to model, as it represents a theoretically infinitespace of arbitrary activities. A taxonomy of themost commonactivities targeted by HAR systems is summarized in Table 2.
2.2.2. Sensors, Data Preprocessing, and Segmentation. Sensorsare the source for raw data collection in activity recognition,and they may be classified into three categories: video,environmental, and wearable sensors.
Wearable sensors are small size mobile devices designedto beworn on human body in daily activities.They can recordusers’ physiological states, such as location changes, movingdirections, and speed. Many wearable sensors are availableon-board smartphones: Table 3 summarizes real (hardware)and virtual (software) sensors that are provided in currentmainstream mobile devices [4, 34, 35].
Due to the intrinsic characteristics of accelerometers,the sensor orientation and the way the device is carried bythe subject may heavily affect the raw data value. The mostcommon positions of worn sensors used in the literature arehand-held, on the belt, in the pants pocket, and on the pelvicarea. Sensitivity to orientation may be addressed by addinganother sensor, through an aggregation technique.
Raw data collected from sensors are preprocessed, toreduce the effects of noise by means of filtering methods, likeaverage smoothing. Additionally, preprocessing enables data
synchronization when samples arrive from multiple sensors,or artifacts removal.
Preprocessing of wearable sensors signals like accelera-tion may involve calibration, unit conversion, normalization,resampling, synchronization, or signal-level fusion [36]. Datasegmentation allows identifying segments of the prepro-cessed data streams that are likely to contain informationabout activities (activity detection or spotting). This is usuallya critical step in HAR, due to the intrinsic complexity ofseparating and identifying activities that humans typicallyperform with no separation in time.
2.3. Features and State-of-the-Art Algorithms. Activity recog-nition relies on processing features that are extracted andselected from signals, through proper operations like con-version or transformation, to and from different domains.Feature computation may be automatic or derived fromexpert knowledge. A “feature space” is composed of thetotal number of features extracted from the data. If theextraction has been well executed, features correspondingto the same activity should appear clearly clustered in thespace, and they should be clearly separated, if pertaining todifferent activities. Similarly, selected features are good if theyare robust to intraclass variability and to different subjectsperforming the same activity. A wide range of features havebeen identified in the literature, according to the data typefrom which they are extracted. Among them, it is possibleto mention the following: signal-based, body-model, event-based, and multilevel features. Another classification of thefeatures is based on the domain to which the inspected datapertain, as detailed in Table 4.

Mobile Information Systems 5
Table 4: Common features used in HAR systems classified by domain.
Type Feature
Time and statisticalMean, median, maximum, minimum, variance, standard deviation, cross-correlation, Root Mean Square(RMS), Signal Magnitude Area (SMA), Median Absolute Deviation (MAD), Time Between Peaks (TBP),max-delta between axis, skewness, kurtosis, displacement
Frequency Discrete Fourier Transform (DFT), Discrete Cosine Transform (DCT), energy, max-coefficient,mean-frequency, skewness, kurtosis, Interquartile Range (IRQ)
Structural Autoregressive (AR)Transient Trend, Magnitude Of Change (MOC)
Table 5: Taxonomy of classifiers proposed in state-of-the-art HAR systems.
Type ClassifiersDecision tree C4.5, ID3, REPTree [47]Bayesian Naıve Bayes and Bayesian networks [48]Instance based 𝑘-Nearest neighbors [49]Neural networks Multilayer Perceptron [50]Domain transform Support Vector Machines [51]Fuzzy logic Fuzzy basis function, fuzzy inference system [52, 53]Regression methods MLR, ALR [33, 54]Markov models Hidden Markov Models (HMM), conditional random fields [55]Classifier ensembles Boosting and bagging [56, 57]
In order to limit the computational complexity of theclassification process and the amount of training data neededfor parameter estimations, the feature space dimensionalityshould be kept at the minimum, by identifying the core setof features that still allows targeting the desired performance.This reduces also the memory and bandwidth requirementsfor real-time processing on embedded systems.
Once the most effective features are extracted, a funda-mental part of a HAR system is the algorithm needed toclassify new instances of recorded data [37]. The algorithmthat outputs the classification label is represented by a modelthat has to be trained. Several inference methods have beenproposed in ML and computational statistics, as listed inTable 5. In supervised ML algorithms, a function is inferredfrom a set of ground truth-labeled training examples, withthe aim of minimizing the classification error and being ableto map new examples (the testing ones).
3. Materials and Methods
3.1. Datasets. The lab and real-world recorded datasets, uponwhich thiswork is based, are taken from [38], used byKwapiszet al. in [39], which contains the accelerometer data recordedwith Android smartphones placed in the pants pocket, atan average sampling frequency of 20Hz. This dataset isactually divided into two parts: a smaller one recorded in acontrolled laboratory environment and a bigger one recordedand labeled by the users, in real-world settings.
The lab dataset was recorded using three types of smart-phones: Nexus One, HTC Hero, and Motorola Backflip. The36 volunteers performed a specific set of activities (walking,jogging, ascending and descending stairs, sitting, and stand-ing for given periods of time) while carrying an Android
0
100
200
300323
143
12 8 6 5 24 7 15 3 17
Age (years)
Num
ber o
f sub
ject
s
7065605550454035302520
Figure 1: Age distribution among the subjects for the real-worldrecorded database.
smartphone in their front pants leg pocket. The total lengthin time of the dataset recordings is ≈15 h, corresponding to anaverage of ≈25min recording for each user.
The real-world dataset was recorded and labeled freely bythe users during their everyday life and without a specificprotocol. For this dataset there is also some demographicsinformation about almost all the 563 users (372 males and191 females) involved in the test; they are summarized inFigures 1, 2, and 3. Among the users, 67 declared to havean injury affecting the way they walk. The total length intime of this dataset is ≈42 h. In this dataset, the upstairsand downstairs activities are grouped into Stairs, and a newactivity is introduced, that is, lying down
Since both datasets are recorded with a smartphone, thesampling frequency is not regular and can vary during therecordings. The main problem is that the classifier, to expressits best performances, has to work on features extracted fromtime windows with the same sampling frequency. Some ofthem can vary too much when the sampling frequency is

6 Mobile Information Systems
Table 6: Summary of the time windows and processing parameters.
Parameter SettingsSampling frequency 20 ± 2HzTime window size 128 samples (minimum 115, 90%)Discarded windows ≪1%Filter Butterworth 3rd orderHP filter at 0.3Hz
Num
ber o
f sub
ject
s
020406080
100120
40
81
9
4360
7383
108
43
181 2
Height (cm)200 205195190185180175170165160155150
Figure 2: Height distribution among the subjects for the real-worldrecorded database.
0
20
40
60
80
2
17
37
54
7361
73
45 50
2820 16 11 6 1 3 4 2 1
Weight (Kg)
Num
ber o
f sub
ject
s
135
130
125
120
115
110
105
100
95
90
85
80
75
70
65
60
55
50
45
Figure 3:Weight distribution among the subjects for the real-worldrecorded database.
different, even if calculated for the same activity. For thisreason all the time windows with a mean sampling frequencyof ±2Hz around the target value have been discarded.
Another aspect to consider is the windowing technique:since all the raw data are written sequentially on a text file,it is important to split them correctly, because the extractedtime windows have to belong to the same user and the sameactivity. Since overlapping has not been used, the designedsolution was to incrementally fill in the window during thefile reading operation (line by line, since they are orderedin time) and truncate the window when an activity or userchange is detected. All the windows with less than 90% ofthe target samples have been discarded. Table 6 summarizesthe configuration used to process the datasets.The calculatedfeatures are then written on a file ready to be used withthe WEKA toolkit. Figures 4 and 5 summarize the classdistribution of the processed datasets, once the noncomplianttime windows have been discarded.
3.2. Training and Test Methods. To train and test differentclassifiers, a commonprocedure has beenused. Each classifierwas selected through the Classify tab of the WEKA explorer,and a standard 10-fold cross-validationhas been used to obtainmore reliable results.
No particular instance filtering techniques have beenused, in fact all the windows for a certain activity havebeen used. The classifiers have been evaluated for the perfor-mances, the training time, the generatedmodel interpretabil-ity, and the model file size. This last feature is relevant tothe aim of implementing the classifier in a mobile applica-tion. In fact, once trained, the model has to be serialized,deserialized, and stored in the smartphone app. In particular,the performances have been evaluated via the most commonindexes used in ML—precision, recall, and F-score— but alsoby analysing the obtained confusion matrices, to investigatepossible classification problems and algorithm shortcomings.
3.3. Implementation of the Mobile App for the Rapid Designof Physical Activity Monitoring Algorithms in the Workplace.The main use cases for the developed Actimonitor Androidapplication are tracking the user’s PA and allowing recordingand collecting new data, with the aim of creating andpopulating a new and more complete dataset, with respectto the one retrieved from the literature [38]. The mobileapplication is just a part of a bigger intended system, designedto collect data from many users, so it has to allow the man-agement of a user profile too (setting password, email, andlogin). Moreover, the app is intended to be used also forsynchronizing the data and collected and stored in the smart-phone, to an online remote web server.
3.3.1. Data Acquisition and Manipulation. Classes dealingwith data acquisition and manipulation are the most impor-tant ones, because they are responsible for retrievingdata from sensors, calculating the features, classifying theinstance, and writing the final results on the applicationinternal database and on files. The main class that managesall the operations is theBackgroundSensorsService one, whosestructure is shown in Figure 6 that extends a regular AndroidService class. The class is created and started once theuser activates the recording, and it runs in backgroundperforming the sensors data collection and activity tracking,even once the app is closed. The class can be started orstopped only through the app. It also performs the loadingand deserialization of the WEKA trained model.
The tracking is active only when the screen is off and theproximity sensor detects a near object (i.e., the smartphoneis recognized as being in the pocket). A separate thread isin charge of writing the collected data in files (both rawand processed data), managing the creation of the directorieswhere the files will be stored, and updating the smartphonefile system.
Performance of the app is an important requirement,in particular with respect to the real-time constraint. Theproblem is solved by splitting and running the processes indifferent threads; this results in a larger real-time margin anddoes not affect the smartphone stability.
3.3.2. User Interface. The app user interface is developed fol-lowing the principle of Material Design [40]. The app allowsthe user to access functions from a top and a side selectionmenu (Figure 7). Clicking on an item in one of the twomenus

Mobile Information Systems 7
Processed lab datasetWalking 2,910 43.2%Jogging 1,724 25.6%Upstairs 743 11.1%Downstairs 618 9.2%Sitting 390 5.8%Standing 342 5.1%Total time windows 6,727 100%Users 36
43.2%
Walking
25.6%Jogging 11.1%
Upstairs
9.2%
Downstairs
5.8%Sitting
5.1%Standing
Figure 4: Class distribution for the laboratory recorded processed dataset.
Processed RW dataset
Walking 7,599 42.5%
Jogging 2,079 11.8%
Stairs 419 2.3%
Sitting 4,083 22.8%
Standing 1,947 10.9%
Lying down 1,751 9.7%
Total time windows 17,878 100%
Users 563
42.5%
Walking
11.8%
Jogging
Stairs 9.7%
Lying down
22.8%
Sitting
10.9%
Standing
2.3%
Figure 5: Class distribution for the real-world recorded processed dataset.
ScreenStateReceiver<<Java Class>>
BackgroundSensorsService<<Java Class>>
SensorEventHandling<<Java Class>>
FeaturesRecording<<Java Class>>
LoadModels<<Java Class>>
DatasetWriter<<Java Class>>
DatabaseOperator<<Java Class>>
SendDataToPC<<Java Class>>
LoadArffHeaders<<Java Class>> InitArff
<<Java Class>>WriteTask
<<Java Class>>
Figure 6: Data acquisition and manipulation classes of the background service (BackgroundSensorsService class).

8 Mobile Information Systems
Figure 7: Mobile app user interface.
Figure 8: Selection of the smartphone position setting through the application interface.
starts a new interface for the desired function or visualization.In particular, in the current implementation, the side menuis used to access the settings of the app and the top menuprovides all the actual functions. The different interfaces areimplemented through independent Android fragments thatreplace each other.
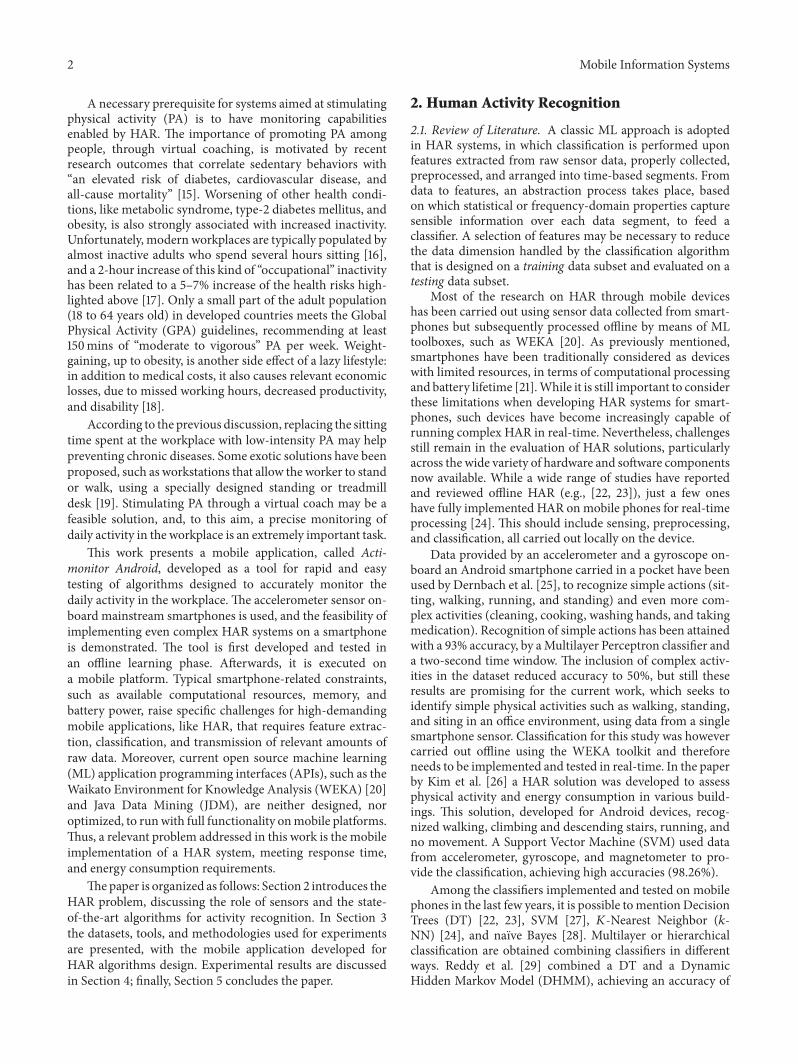
The app is capable of classifying and tracking the activityof the user, using a previously trained classifier. The classifieris trained for the case of a user placing the smartphonein the trousers pocket, with the upper part of the devicedirected to the ground and the screen facing the leg. As aconsequence, the user has to select the correct settings aboutthe smartphone position, as shown in Figure 8. Then, byaccessing the tracking section of the interface, the recordingmay be started, as shown in Figure 9. Afterwards, the usermay put the smartphone in the pocket. The app will stop
recording when it detects that the smartphone is not in apocket anymore and will restart automatically when thiscondition is detected again. Also, a notification will appearon the smartphone locked-screen.
3.3.3. Data Structures. To accomplish all the requirementsand easilymanage theworkflowof the system itwas necessaryto design some useful data structures, to hold both the datacollected from the sensors and those generated by the appitself. Moreover, also the internal database structure has tobe designed, to permanently store the tracking data in anefficient way.
The internal database is mainly used to store the trackingand the training data (raw data), in separate tables. Oneof the main problems to address was the growing size ofthe database during the everyday recordings. The database
Mobile Information Systems 9
Figure 9: Activity tracking.
has been then designed to store only the essential data. Inparticular, the table to store the tracking data contains onlythe absolute timestamp of the window, the label, and a smallset of information about it. For the raw data, every rowcontains a timestamp, the value for the three axes of the accel-erometer (optionally, also the barometric value), and a smallset of additional information; 128 of these rows are stored foreach window. So not all the features calculated are stored,since they require a huge amount of memory and can berecalculated later in a simple way, if necessary.
The size growth of the database was estimated by leavingthe app working for many hours, and it was possible to verifythat, for the activity tracking only, over a standard 8-hourworking day, the growing is of the order of hundreds of KBs,while, if saving the raw data, this value could rise to ten MBs.For these reasons it has been chosen to leave the user free tochoose to store or not the raw data, via an option in the appsettings. Moreover, this way, assuming a regular sync with aremote web server at least once a week, the database size doesnot yet represent a problem. Another problem to address isthe time required to quickly write a group of tuples at oncein the database. When using the helper classes provided byAndroid SDK, this operation is very slow (≈1.5 s). For thisreason, to store the 128 tuples of raw data per windows atonce, a low level approach based on the SQLite JDBC driverwas adopted. This way, it was possible to lower the time toonly ≈100ms.
3.3.4. Classification System Implementation. The featuresextraction phase is implemented by four classes (one foreach group of features), to easily choose only a subset ofthem if necessary. These classes are called TimeDomainFea-tureExtractor, FrequencyDomainFeatureExtractor, StructuralFeature Extractor and TransientFeatureExtractor. They allextend the abstract class FeatureExtractor. The computedfeatures are stored, progressively for each subgroup, in themain FeatureSet class instance.
The classification phase is the one for which the WEKAlibrary has been used more extensively. Once the FeatureSetfrom the target time window is obtained, it is necessaryto translate it into a WEKA Instance, which represents thesingle example to be classified. This has been done throughthe method toInstance(Instances es) of the FeatureSet class.This method takes as input a WEKA Instances class (a Javainterface for a dataset and its instances, to be not confusedwith the Instance). In particular, the idea is to provide adummy (empty) dataset with the same header of the one usedto train theWEKAmodel. This way the software can check ifthe FeatureSet contains all the features required, and throw anexception if not. The Instances class representing the dummydataset is obtained by reading a simple file stored in the appresources.
Since both the dummydataset and themodel are stored infiles, they have to be loaded at the startup of the app (precisely,at the startup or the BackgroundSensorsService). The WEKAtool provides helper classes for this kind of operations. It ispossible to obtain a representation of the dataset by meansof an Instances class. Moreover, to deserialize the model, theread method of the helper class SeralizationHelper has beenapplied: by reading the model file, it gives back the alreadytrained Classifier class implementation for the stored model.
The classification is simply done by the classifier’s methodclassifyInstance (Instance is), which takes as input the instanceto classify and gives as output a double value ranging from 0to 𝑛 − 1, where 𝑛 is the number of classes. Algorithm 1 showsa simplified implementation of the classification processadopted, which clarifies the use of the already mentionedclasses.
4. Results and Discussion
4.1. Base Classifier Selection. Afirst step in the classifier selec-tion was the choice of the base one to start from. Therefore,before moving to the implementation of the mobile app,

10 Mobile Information Systems
Data: dataset header file, serialized classifier, unclassified time windowResult: classified time windowload dataset header;get attributes position and properties;deserialize WEKA trained model;while true docollect data from sensors;if time window ready to process then
create valid instance from feature set data;classify instance;set corrisponding label;
endend
Algorithm 1: Simplified classification process in the smartphone app implementation.
Table 7: Deafult parameters for base classifiers: 𝑘-NN, NN, and DT.
Classifier Parameters
𝑘-NNSearch algorithm: linear search with Euclidean
distanceNumber of neighbors: 25
NN
Number of hidden layers: (# attributes + #classes)/2
Learning rate: 0.3Momentum: 0.2
Maximum number of epochs to train through:500
Attributes normalized between −1 and 1
DT (REPTree)
No depth restrictionsMinimum total weight of the instances in a leaf: 2Minimum variance on all the data needed for
splitting: 0.01Pruning
Number of folds used for pruning: 3
three of the most common algorithms used in the literaturehave been tested: DT, 𝑘-NN, and NN. In particular, the onesimplemented in the WEKA classes have been used, all ofthem with the default parameters, summarized in Table 7. Totrain the classifier, all the time windows extracted from thelaboratory recorded dataset (see Figure 4) have been used.
Performance evaluation considering theweighted averageF-score shows that the NN classifier is the best among thethree, with an index of 0.996. The difference in performanceis mostly due to the misclassification of only a subset ofactivities. In particular, the most problematic ones are theupstairs and downstairs activities, often classified as simplewalking. Even if the overall performance indexes are good forall the classifiers, as given in Table 8, the DT shows the worstperformance for these two activities, with an F-score equal to0.712 and 0.7, respectively. Also the confusionmatrices givenin Table 9 show a frequentmisclassification among this subsetof activities.
Table 8: Base classifiers accuracy by class.
(a) DT
Precision Recall 𝐹-score Class0.938 0.942 0.94 Walking0.969 0.971 0.97 Jogging0.72 0.705 0.712 Upstairs0.7 0.699 0.7 Downstairs0.984 0.972 0.978 Sitting0.98 0.988 0.984 Standing0.905 0.905 0.905 Weighted average
(b) 𝑘-NN
Precision Recall 𝐹-score Class0.959 0.993 0.976 Walking0.99 0.992 0.991 Jogging0.911 0.855 0.882 Upstairs0.915 0.833 0.872 Downstairs0.995 0.979 0.987 Sitting0.988 0.991 0.99 Standing0.961 0.962 0.961 Weighted average
(c) NN
Precision Recall 𝐹-score Class0.981 0.987 0.984 Walking0.991 0.988 0.989 Jogging0.896 0.913 0.904 Upstairs0.906 0.869 0.887 Downstairs0.99 0.982 0.986 Sitting0.985 0.991 0.988 Standing0.968 0.968 0.968 Weighted average
About the time required to train the models, the faster is𝑘-NN with only 0.1 s, because it is a lazy classifier. The DT isalso fast, with 2.88 s needed to train the classifier.The trainingprocess of the NN is much slower, as it needs 967.16 s. Themodel interpretability is another aspect to consider, in viewof the mobile application tool development.
Mobile Information Systems 11
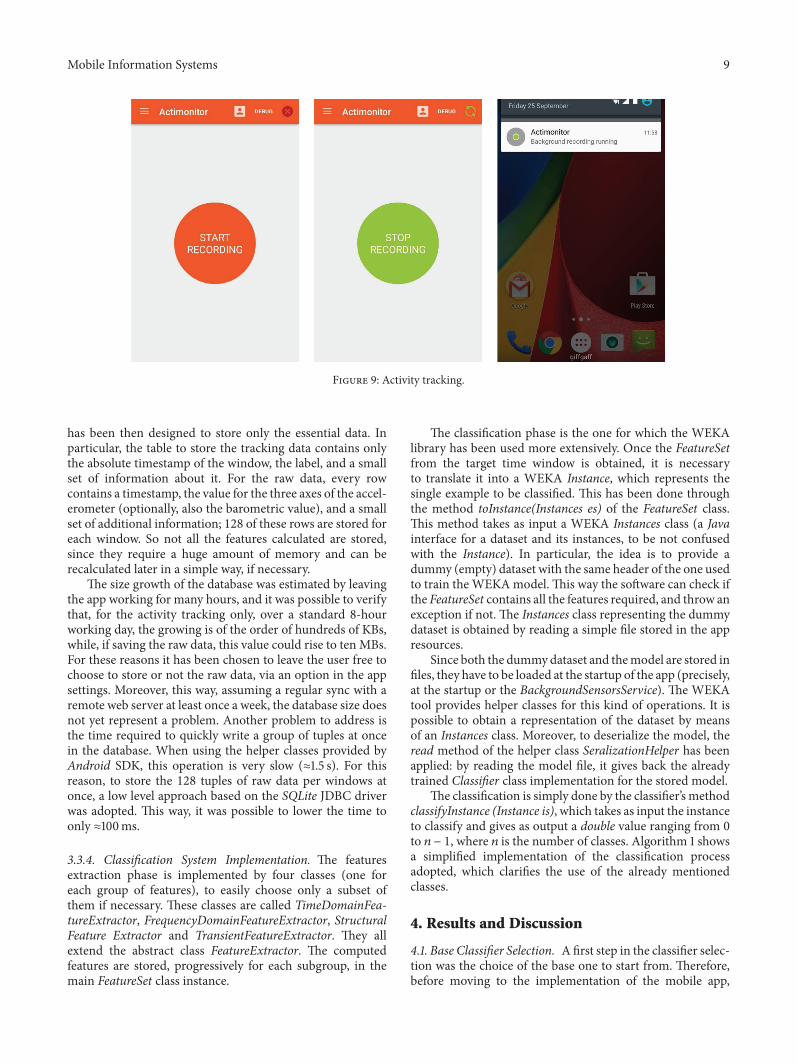
Table 9: Base classifiers confusion matrices.
(a) DT
Classified asWalking Jogging Upstairs Downstairs Sitting Standing
Walking 2742 15 84 68 1 0Jogging 27 1674 18 5 0 0Upstairs 75 32 524 112 0 0Downstairs 80 7 96 432 3 0Sitting 0 0 4 0 379 7Standing 0 0 2 0 2 338
(b) 𝑘-NN
Classified asWalking Jogging Upstairs Downstairs Sitting Standing
Walking 2890 2 14 4 0 0Jogging 4 1710 7 3 0 0Upstairs 54 14 635 40 0 0Downstairs 63 2 38 515 0 0Sitting 0 0 3 1 382 4Standing 1 0 0 0 2 339
(c) NN
Classified asWalking Jogging Upstairs Downstairs Sitting Standing
Walking 2871 6 15 17 1 0Jogging 12 1703 6 3 0 0Upstairs 20 10 678 35 0 0Downstairs 24 0 57 537 0 0Sitting 0 0 1 1 383 5Standing 0 0 0 0 3 339
Finally, since the selected model has to be serialized andstored in a smartphone app, also the file size is an importantcharacteristic. Both the DT and the NN produce a model of≈1MB size, with a slightly bigger one for theNN. 𝑘-NNgives amodel of≈10MB. In fact, the disadvantageswith lazy learninginclude the large space required to store the entire trainingdataset.Moreover, particularly noisy data increase the neededset unnecessarily, because no abstraction is made during thetraining phase.
Figure 10 shows a summary of the characteristics of thethree classifiers. The DT gives a good compromise for allthe considered characteristics, traded off with performance.Then, this is the base classifier chosen to build up the finalPA monitoring system, to be implemented in the mobile apptool.
4.2. Activities Misclassification Problem. As stated above, themain performance loss is due to the wrong classification ofsome activities. Classes in this subset will be called small dis-placement activities, in contrast with the static activities (sit-ting and standing) and the big displacement activity (jogging).Activities in this subset feature very similar characteristicsand movements; then also the extracted features have similarvalues, leading to a weak and error prone model.
PerformancesTraining
time
Interpretability File size
Neural networkk-Nearest NeighborsDecision tree
Figure 10: Summary of the characteristics shown by each base clas-sifier.
Another problem, which comes out mainly in the testphase, is the wrong classification of the slow walking activity.This is probably due to the fact that the walking data was

12 Mobile Information Systems
Standing
Sitting
Walking
Upstairs
Downstairs
Jogging
C1
C2 C5
C3
C4
(a) Model 1
Standing
Sitting
Walking
Upstairs
Downstairs
Jogging
C1
C2 C4
C3
(b) Model 2
Figure 11: Hierarchical models used to solve the misclassification problem.
recorded in a controlled setup, that is, on a treadmill at a fixedpace, and then a walking activity with a different or irregularpace sometimes is misclassified as upstairs or downstairs.
For these reasons, the need for a more accurate andstronger model not only to better distinguish between thesmall displacement activities but also to generalize thewalkingdata and to recognize a larger range of paces clearly emerges.To produce a better classifier two solutions have been tested,a hierarchical approach and a generalized data approach, andone of them has been chosen.
4.2.1. Hierarchical Approach. The first approach tested is thehierarchical one, which allows splitting the original probleminmultiple, smaller subproblems.The idea is to create simplerbut stronger classifiers to select between few activities. InFigure 11, the two hierarchical schemes proposed and testedare shown, but only the results of Figure 11(b) are reported,because it performs better than Figure 11(a). The selectedhierarchical classifier is based on simple DTs, the dimensionsof which are related to the difficulty in classifying the targetactivities. As an example, the model used forwalking-upstairshas an average number of nodes equal to 90,while the jogging-standing has only 3 nodes.
Considering that the main impact on performance wasgiven only by the small displacement activities, the modelthat involves these three activities is the most important one,which affects the overall performance. Tables 10(a), 10(b),and 10(c) show the performance of this smaller classifier but,considering the F-score values, it is clear that there is not animprovement with a “smaller” model. The real problem is inthe data chosen to train the classifier and not in the classifica-tion scheme used. In particular, they have to be generalized.
Table 10: Small displacement subclassifier performances.
(a) Performance by cumulative indexes
Correctly classified instances 86.65%Incorrectly classified instances 13.35%Kappa statistic 0.719Mean absolute error 0.116Root mean squared error 0.269Relative absolute error 35.91%Root relative squared error 66.92%
(b) Confusion matrix
Classified asWalking Upstairs Downstairs
Walking 2787 65 58Upstairs 105 515 123Downstairs 96 123 399
(c) Detailed accuracy by class
Precision Recall 𝐹-score Class0.933 0.958 0.945 Walking0.733 0.693 0.712 Upstairs0.688 0.646 0.666 Downstairs0.862 0.867 0.864 Weighted average
4.2.2. Data Generalization Approach. One of the solutions togeneralize the training data is to use also the data from thereal-world dataset, since they are collected by the users inreal life conditions and can give a better and comprehensivemodel of the activities. Assuming the most problematic
Mobile Information Systems 13
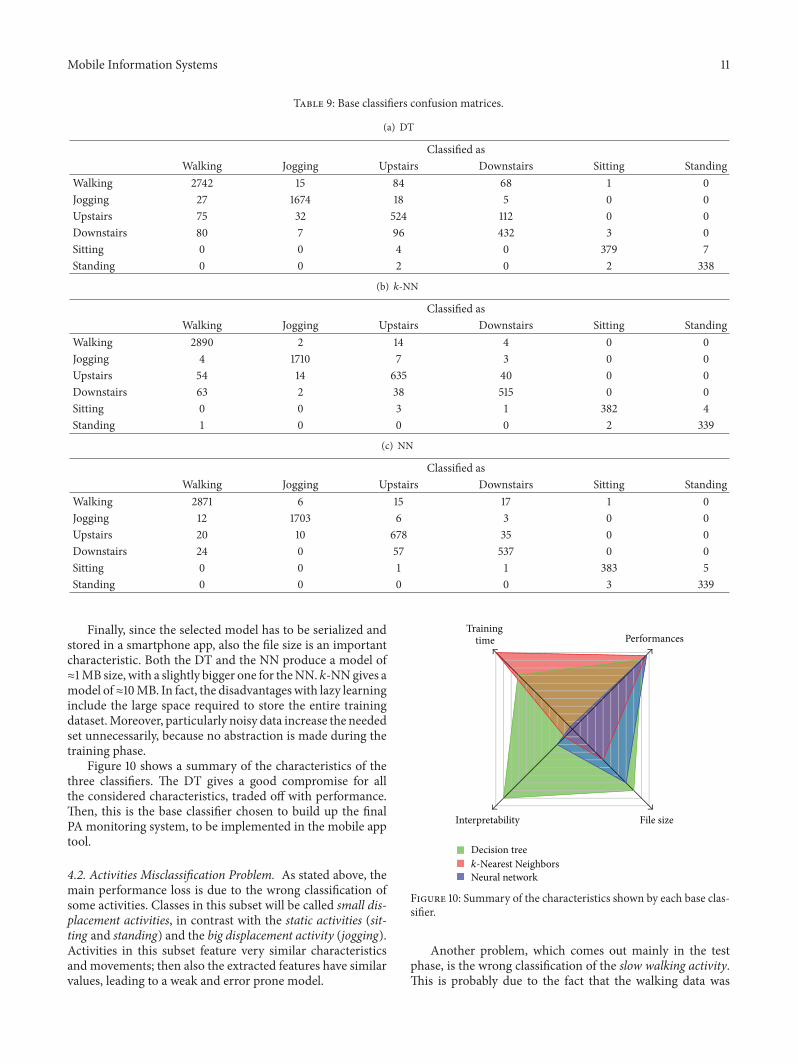
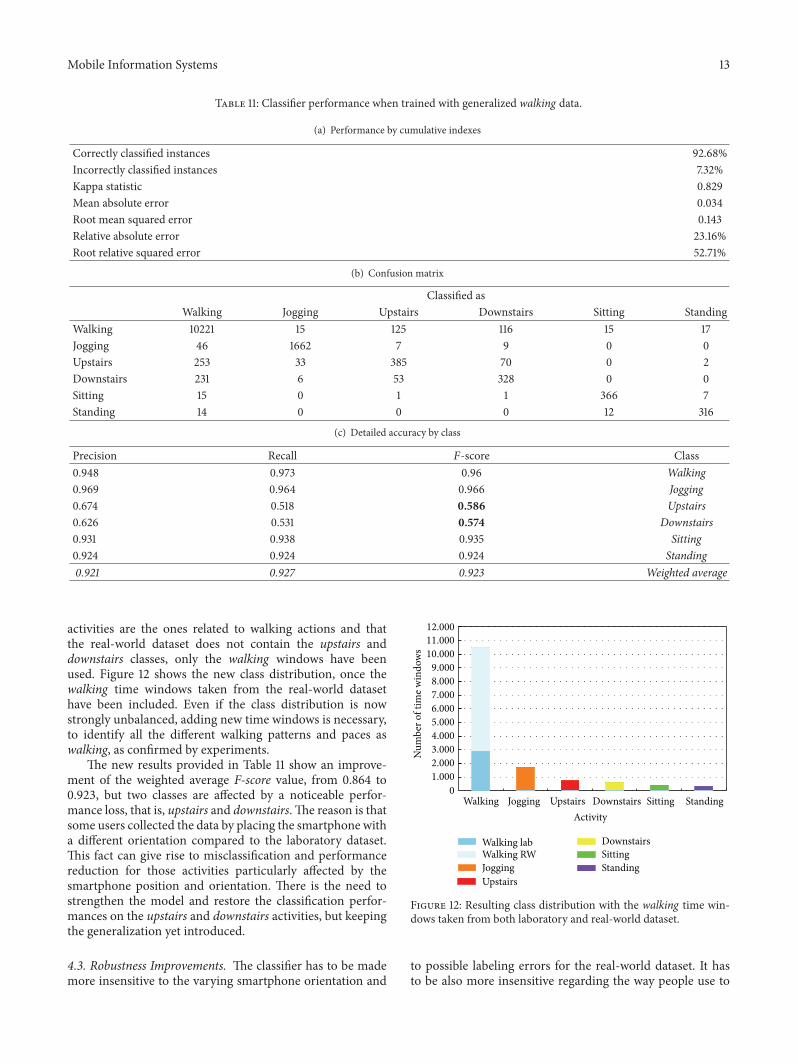
Table 11: Classifier performance when trained with generalized walking data.
(a) Performance by cumulative indexes
Correctly classified instances 92.68%Incorrectly classified instances 7.32%Kappa statistic 0.829Mean absolute error 0.034Root mean squared error 0.143Relative absolute error 23.16%Root relative squared error 52.71%
(b) Confusion matrix
Classified asWalking Jogging Upstairs Downstairs Sitting Standing
Walking 10221 15 125 116 15 17Jogging 46 1662 7 9 0 0Upstairs 253 33 385 70 0 2Downstairs 231 6 53 328 0 0Sitting 15 0 1 1 366 7Standing 14 0 0 0 12 316
(c) Detailed accuracy by class
Precision Recall 𝐹-score Class0.948 0.973 0.96 Walking0.969 0.964 0.966 Jogging0.674 0.518 0.586 Upstairs0.626 0.531 0.574 Downstairs0.931 0.938 0.935 Sitting0.924 0.924 0.924 Standing0.921 0.927 0.923 Weighted average
activities are the ones related to walking actions and thatthe real-world dataset does not contain the upstairs anddownstairs classes, only the walking windows have beenused. Figure 12 shows the new class distribution, once thewalking time windows taken from the real-world datasethave been included. Even if the class distribution is nowstrongly unbalanced, adding new time windows is necessary,to identify all the different walking patterns and paces aswalking, as confirmed by experiments.
The new results provided in Table 11 show an improve-ment of the weighted average F-score value, from 0.864 to0.923, but two classes are affected by a noticeable perfor-mance loss, that is, upstairs and downstairs.The reason is thatsome users collected the data by placing the smartphone witha different orientation compared to the laboratory dataset.This fact can give rise to misclassification and performancereduction for those activities particularly affected by thesmartphone position and orientation. There is the need tostrengthen the model and restore the classification perfor-mances on the upstairs and downstairs activities, but keepingthe generalization yet introduced.
4.3. Robustness Improvements. The classifier has to be mademore insensitive to the varying smartphone orientation and
Activity
Walking labWalking RWJoggingUpstairs
DownstairsSittingStanding
12.000
11.00010.0009.0008.0007.0006.0005.0004.0003.0002.0001.000
0
Num
ber o
f tim
e win
dow
s
StandingSittingDownstairsUpstairsJoggingWalking
Figure 12: Resulting class distribution with the walking time win-dows taken from both laboratory and real-world dataset.
to possible labeling errors for the real-world dataset. It hasto be also more insensitive regarding the way people use to

14 Mobile Information Systems
perform the same activity but still retain the class separationproperties. To this aim, bootstrap aggregating and pairwiseclassification have been used. The former identifies ensemblelearning techniques, among which the bagging one was usedand applied to DT classifiers. The latter decomposes theclassifier into several two-class problems and combines theiroutputs through voting techniques (as for bagging). If theclasses are evenly populated, a pairwise classifier is at least asquick to train as any other multiclass method [41, 42]. More-over, since the DT performs an intrinsic feature selectionand taking into account the difficulty of distinguishing thetwo selected activities, having a simpler two-class classifierallows creatingmodels of acceptable complexity.The numberof nodes in the DTs has the same order of magnitude asdiscussed before.
4.4. Final Results on the Dataset. Once the described meth-ods and techniques are applied, it is possible to appreciate anoverall performance improvement of the weighted average F-score, up to a value of 0.988. In particular, it changes from0.712 and 0.7 to 0.676 and 0.71, for upstairs and downstairs,respectively.
An important perspective to analyse is the sensitivity ofthe algorithm to the smartphone orientation. To test thisaspect, both datasets have been processed inverting the axisof the accelerometer and simulating the smartphone in adifferent orientation (upside down). Then the trained modelhas been tested with this data. As expected, the performancedropped down to an F-score of 0.729, due to upstairs anddownstairs, but in particular for the standing class, where theorientation highly affects the classification.
For these reasons it was useful to create a reduced modelwith only two activities. Considering the goal of monitoringthe PA in a workplace, the minimum target is to distinguishbetween not active (sitting) and active (all the other activities).Since the class distribution would become even too unbal-anced, the sitting instances from the real-world dataset havebeen also added to the test and training set; the new classdistribution is shown in Figure 13.This setup shows improvedperformances, according to Table 12, and achieves an averageweighted F-score of 0.988, even for the test done with theupside down smartphone orientation. Given these results, themodel is suitable to be implemented even when the smart-phone orientation is not fixed, or there is no informationabout the orientation at all. A further solution could be toestimate the orientation from features that are not affectedby orientation, like the acceleration magnitude [43–45], andthen use a different classifier for each relevant position.
5. Conclusion
The aim of this research was to address the easy and rapiddevelopment and testing of classifiers to be used in physicalactivity monitoring systems, targeted at individuals in theirworkplaces. Such a result has been obtained through thedesign of an Android-based mobile application, which alsodemonstrates the feasibility of implementing even complexHAR solutions on amainstreamdevice like smartphones.The
12.000
11.00010.0009.0008.0007.0006.0005.0004.0003.0002.0001.000
0
Num
ber o
f tim
e win
dow
s
ActivityStandingSittingDownstairsUpstairsJoggingWalking
Walking labWalking RWJoggingUpstairs
DownstairsSitting labSitting RWStanding
Figure 13: Resulting class distribution with the walking and thesitting time windows taken from both laboratory and real-worlddataset.
Table 12: Final bagging active/not active classifier performance, alsoconsidering the same classifier with a different smartphone position(upside down).
(a) Performance by cumulative indexes
Correctly classified instances 98.82% (98.83%)Incorrectly classified instances 1.18% (1.17%)Kappa statistic 0.969 (0.968)Mean absolute error 0.019 (0.023)Root mean squared error 0.09 (0.1)Relative absolute error 5.26% (6.17%)Root relative squared error 21.94% (23.18%)
(b) Confusion matrix
Classified asActive Not active
Active 13853 (13825) 83 (111)Not active 134 (105) 4339 (4368)
(c) Detailed accuracy by class
Precision Recall 𝐹-score Class0.99 (0.992) 0.994 (0.992) 0.992 (0.992) Active0.981 (0.975) 0.97 (0.977) 0.976 (0.976) Not active0.988 (0.988) 0.988 (0.988) 0.988 (0.988) Weighted average
paper offered a complete overview of the activities classifica-tion problem from multiple points of view, starting from thetypes of sensors to use and their position to a taxonomy ofthe most used techniques in this field. A mobile app for HARalgorithms design has been presented, using state-of-the-arttools formachine learning, like theWEKA toolkit. It was thenpossible to offer an extensive performance evaluation of someof themost common classifiers. Afterwards, an analysis of themain problems which occurred was carried out. This led to

Mobile Information Systems 15
the design of a system capable of overcoming these problemsin a simple and effective way.
In particular, the implementedHAR systemwas designedto be used in a workplace environment to monitor thephysical activity of the workers, equipped with the capabilityto distinguish between six activities. The chosen classifier isbased on a hierarchy of DTs to which some improvements,like boosting andpairwise classification, have been applied, toincrease the average performance. The final classifier reachesa weighted average F-score of around 92%. A simplifiedapproach capable of distinguishing between active and notactive states was studied, which provides much reducedsensitivity to the device orientation; it is capable of an F-scoreup to 99%. This last approach could be used, for example, inan elderly monitoring system, since it guarantees very highperformance on the classification of simple activities, usefulto detect the state of the patient in a room.
The final algorithm has been tuned by exploiting rapidtest and development through an Android smartphone appli-cation developed ad hoc. All the software components in theapp have been implemented following the Android designpatterns and using the WEKA API as the core of the classifi-cation system. Such an app sets the basis for the design of newalgorithms, since it allows a very easy replacement of the clas-sifiers, only by changing the file in which they have been seri-alized. It could be a practical and easy tool for benchmarkingnew algorithms, even applicable and extensible to differentdomains compared to PA monitoring. The app is even pro-vided with the capability of recording the collected sensorsdata, to create future new and richer datasets for HAR.
Competing Interests
The authors of this paper declare that they have no conflict ofinterests.
Acknowledgments
This work was supported by the COST Action IC1303AAPELE, Architectures, Algorithms and Platforms forEnhanced Living Environments. The experimental part ofthe work was carried out in the framework of an Erasmus+Traineeship between Italy and Ulster.
References
[1] D. J. Cook and N. C. Krishnan, Activity Learning: Discovering,Recognizing, and Predicting Human Behavior from Sensor Data,John Wiley and Sons, 2015.
[2] J. Aggarwal and M. Ryoo, “Human activity analysis: a review,”ACMComputing Surveys, vol. 43, no. 3, article 16, 43 pages, 2011.
[3] F. Attal, S. Mohammed, M. Dedabrishvili, F. Chamroukhi, L.Oukhellou, andY.Amirat, “Physical human activity recognitionusing wearable sensors,” Sensors, vol. 15, no. 12, pp. 31314–31338,2015.
[4] X. Su, H. Tong, and P. Ji, “Activity recognition with smartphonesensors,”Tsinghua Science andTechnology, vol. 19, no. 3, pp. 235–249, 2014.
[5] H. Alemdar, C. Tunca, and C. Ersoy, “Daily life behaviour mon-itoring for health assessment using machine learning: bridgingthe gap between domains,” Personal and Ubiquitous Computing,vol. 19, no. 2, pp. 303–315, 2015.
[6] B. Bruno, F. Mastrogiovanni, and A. Sgorbissa, “A publicdomain dataset for ADL recognition using wrist-placed accel-erometers,” in Proceedings of the 23rd IEEE International Sym-posium on Robot and Human Interactive Communication (IEEERO-MAN ’14), pp. 738–743, Edinburgh, UK, August 2014.
[7] T. R. Bennett, J. Wu, N. Kehtarnavaz, and R. Jafari, “Inertialmeasurement unit-based wearable computers for assisted liv-ing applications: a signal processing perspective,” IEEE SignalProcessing Magazine, vol. 33, no. 2, pp. 28–35, 2016.
[8] N. Roy, A. Misra, and D. Cook, “Ambient and smartphone sen-sor assisted adl recognition in multi-inhabitant smart environ-ments,” Journal of Ambient Intelligence and Humanized Com-puting, vol. 7, no. 1, pp. 1–19, 2016.
[9] T. Takeda, K. Kuramoto, S. Kobashi, and Y. Hata, “Biometricspersonal identification by wearable pressure sensor,” in Proceed-ings of the 5th International Conference on Emerging Trends inEngineering and Technology (ICETET ’12), pp. 120–123, IEEE,Himeji, Japan, November 2012.
[10] S. Patel, H. Park, P. Bonato, L. Chan, and M. Rodgers, “Areview of wearable sensors and systems with application inrehabilitation,” Journal of NeuroEngineering and Rehabilitation,vol. 9, no. 1, pp. 1–17, 2012.
[11] P. Bonato, “Wearable sensors and systems,” IEEE Engineering inMedicine and Biology Magazine, vol. 29, no. 3, pp. 25–36, 2010.
[12] J. Merilahti, P. Viramo, and I. Korhonen, “Wearable monitor-ing of physical functioning and disability changes, circadianrhythms and sleep patterns in nursing home residents,” IEEEJournal of Biomedical and Health Informatics, vol. 20, no. 3, pp.856–864, 2016.
[13] G. A. Farulla, L. O. Russo, S. Rosa, and M. Indaco, “ORIEN-TOMA: a novel platform for autonomous and safe navigationfor blind and visually impaired,” in Proceedings of the 10th IEEEInternational Conference on Design and Technology of IntegratedSystems in Nanoscale Era (DTIS ’15), pp. 1–6, Naples, Italy, April2015.
[14] Y. Li, M. Liu, and W. Sheng, “Indoor human tracking andstate estimation by fusing environmental sensors and wearablesensors,” in Proceedings of the IEEE International Conferenceon Cyber Technology in Automation, Control, and IntelligentSystems (CYBER ’15), pp. 1468–1473, Shenyang, China, June2015.
[15] C. Tudor-Locke, J. M. Schuna Jr., L. J. Frensham, and M.Proenca, “Changing the way we work: elevating energy expen-diture with workstation alternatives,” International Journal ofObesity, vol. 38, no. 6, pp. 755–765, 2014.
[16] J. Y. Chau, M. Daley, S. Dunn et al., “The effectiveness of sit-stand workstations for changing office workers’ sitting time:results from the Stand@Work randomized controlled trialpilot,” International Journal of Behavioral Nutrition and PhysicalActivity, vol. 11, article127, 2014.
[17] F. B. Hu, T. Y. Li, G. A. Colditz, W. C. Willett, and J. E. Manson,“Television watching and other sedentary behaviors in relationto risk of obesity and type 2 diabetesmellitus inwomen,” Journalof the American Medical Association, vol. 289, no. 14, pp. 1785–1791, 2003.
[18] X. Song, R. G. W. Quek, S. R. Gandra, K. A. Cappell, R. Fowler,and Z. Cong, “Productivity loss and indirect costs associated

16 Mobile Information Systems
with cardiovascular events and related clinical procedures,”BMC Health Services Research, vol. 15, no. 1, article 245, 2015.
[19] B. T. MacEwen, D. J. MacDonald, and J. F. Burr, “A systematicreview of standing and treadmill desks in the workplace,”Preventive Medicine, vol. 70, pp. 50–58, 2015.
[20] WEKA (Waikato Environment for Knowledge Analysis), 2015,http://www.cs.waikato.ac.nz/ml/weka.
[21] A. Carroll and G. Heiser, “An analysis of power consumptionin a smartphone,” in Proceedings of the USENIX Conference onUSENIX Annual Technical Conference (USENIXATC ’10), p. 21,USENIX Association, Boston, Mass, USA, June 2010, http://dl.acm.org/citation.cfm?id=1855840.1855861.
[22] H. Martın, A. M. Bernardos, J. Iglesias, and J. R. Casar, “Activitylogging using lightweight classification techniques in mobiledevices,” Personal and Ubiquitous Computing, vol. 17, no. 4, pp.675–695, 2013.
[23] A. Anjum and M. U. Ilyas, “Activity recognition using smart-phone sensors,” in Proceedings of the IEEE 10th ConsumerCommunications and Networking Conference (CCNC ’13), pp.914–919, Las Vegas, Nev, USA, January 2013.
[24] M. Kose, O. Incel, and C. Ersoy, “Online human activityrecognition on smart phones,” inProceedings of theWorkshop onMobile Sensing: From Smartphones and Wearables to Big Data,pp. 11–15, Beijing, China, April 2012.
[25] S. Dernbach, B. Das, N. C. Krishnan, B. L. Thomas, and D. J.Cook, “Simple and complex activity recognition through smartphones,” in Proceedings of the 8th International Conference onIntelligent Environments (IE ’12), pp. 214–221, Guanajuato, Mex-ico, June 2012.
[26] T.-S. Kim, J.-H. Cho, and J. T. Kim, Sustainability in Energyand Buildings: Proceedings of the 4th International Conferencein Sustainability in Energy and Buildings (SEB ’12), vol. 22 ofSmart Innovation, Systems and Technologies, Springer, Berlin,Germany, 2013.
[27] A. M. Khan, A. Tufail, A. M. Khattak, and T. H. Laine, “Activityrecognition on smartphones via sensor-fusion and KDA-basedSVMs,” International Journal of Distributed Sensor Networks,vol. 2014, Article ID 503291, 14 pages, 2014.
[28] N. D. Lane, M. Lin, M. Mohammod et al., “BeWell: sensingsleep, physical activities and social interactions to promotewellbeing,”Mobile Networks and Applications, vol. 19, no. 3, pp.345–359, 2014.
[29] S. Reddy, M. Mun, J. Burke, D. Estrin, M. Hansen, and M.Srivastava, “Using mobile phones to determine transportationmodes,”ACMTransactions on Sensor Networks, vol. 6, no. 2, pp.13:1–13:27, 2010.
[30] Google Activity Recognition API, 2016, https://developers.goo-gle.com/android/reference/com/google/android/gms/location/ActivityRecognitionApi.
[31] M. Shoaib, S. Bosch, O. D. Incel, H. Scholten, and P. J. M.Havinga, “A survey of online activity recognition using mobilephones,” Sensors, vol. 15, no. 1, pp. 2059–2085, 2015.
[32] M. A. Labrador and O. D. L. Yejas, Human Activity Recogni-tion: Using Wearable Sensors and Smart-Phones, Chapman &Hall/CRC, 2013.
[33] A. Bulling, U. Blanke, and B. Schiele, “A tutorial on humanactivity recognition using body-worn inertial sensors,” ACMComputing Surveys, vol. 46, no. 3, article 33, 2014.
[34] J. Lester, T. Choudhury,N.Kern,G. Borriello, andB.Hannaford,“A hybrid discriminative/generative approach for modelinghuman activities,” in Proceedings of the 19th International Joint
Conference on Artificial Intelligence (IJCAI ’05), L. P. Kaelblingand A. Saffiotti, Eds., pp. 766–772, Professional Book Center,Edinburgh, UK, July-August 2005.
[35] J. Parkka, M. Ermes, P. Korpipaa, J. Mantyjarvi, J. Peltola, andI. Korhonen, “Activity classification using realistic data fromwearable sensors,” IEEETransactions on Information Technologyin Biomedicine, vol. 10, no. 1, pp. 119–128, 2006.
[36] D. Figo, P. C.Diniz, D. R. Ferreira, and J.M. P. Cardoso, “Prepro-cessing techniques for context recognition from accelerometerdata,” Personal and Ubiquitous Computing, vol. 14, no. 7, pp.645–662, 2010.
[37] N. C. Krishnan and D. J. Cook, “Activity recognition on stream-ing sensor data,” Pervasive and Mobile Computing B, vol. 10, pp.138–154, 2014.
[38] WISDM Dataset, Department of Computer and InformationScience, Fordham University, New York, NY, USA, 2012, http://www.cis.fordham.edu/wisdm/dataset.php.
[39] J. R. Kwapisz, G. M. Weiss, and S. A. Moore, “Activity recog-nition using cell phone accelerometers,” ACM SIGKDD Explo-rations Newsletter, vol. 12, no. 2, pp. 74–82, 2010.
[40] “Material design for android,” 2016, https://developer.android.com/design/material/index.html.
[41] S.-H. Park and J. Furnkranz, “Efficient pairwise classification,”in Machine Learning: ECML 2007, pp. 658–665, Springer,Berlin, Heidelberg, 2007.
[42] C. Brunner, A. Fischer, K. Luig, and T.Thies, “Pairwise supportvector machines and their application to large scale problems,”Journal of Machine Learning Research, vol. 13, pp. 2279–2292,2012.
[43] N. Yadav and C. Bleakley, “Accurate orientation estimationusing ahrs under conditions of magnetic distortion,” Sensors,vol. 14, no. 11, pp. 20008–20024, 2014.
[44] A. M. Khan, M. H. Siddiqi, and S.-W. Lee, “Exploratory dataanalysis of acceleration signals to select light-weight and accu-rate features for real-time activity recognition on smartphones,”Sensors, vol. 13, no. 10, pp. 13099–13122, 2013.
[45] E.M. Shakshuki, A. Bayat,M. Pomplun, andD.A.Tran, “A studyon human activity recognition using accelerometer data fromsmartphones,” Procedia Computer Science, vol. 34, pp. 450–457,2014.
[46] Sensors Overview in Android, 2016, https://developer.android.com/guide/topics/sensors/sensors overview.html.
[47] I. H. Witten, E. Frank, and M. A. Hall, Data Mining: PracticalMachine Learning Tools and Techniques, Elsevier, Amsterdam,The Netherlands; Morgan Kaufmann, Boston, Mass, USA, 3rdedition, 2011.
[48] J. Cheng and R. Greiner, Advances in Artificial Intelligence: 14thBiennial Conference of the Canadian Society for ComputationalStudies of Intelligence, AI 2001 Ottawa, Canada, June 7–9, 2001Proceedings, vol. 2056 of Lecture Notes in Computer Science,Springer, Berlin, Germany, 2001.
[49] O. Sutton, “Introduction to k nearest neighbour classificationand condensed nearest neighbour data reduction,” 2012.
[50] J. Mantyjarvi, J. Himberg, and T. Seppanen, “Recognizinghuman motion with multiple acceleration sensors,” in Pro-ceedings of the IEEE International Conference on Systems, Manand Cybernetics, vol. 2, pp. 747–752, IEEE, Tucson, Ariz, USA,October 2001.
[51] D. Anguita, A. Ghio, L. Oneto, X. Parra, and J. L. Reyes-Ortiz,“Human activity recognition on smartphones using a mul-ticlass hardware-friendly support vector machine,” in Ambient

Mobile Information Systems 17
Assisted Living and Home Care, pp. 216–223, Springer, Berlin,Heidelberg, 2012.
[52] M. Helmi and S. M. T. AlModarresi, “Human activity recogni-tion using a fuzzy inference system,” in Proceedings of the 2009IEEE International Conference on Fuzzy Systems (FUZZ-IEEE’09), pp. 1897–1902, Jeju Island, Republic of Korea, August 2009.
[53] J. A. Iglesias, P. Angelov, A. Ledezma, and A. Sanchis, “Humanactivity recognition based on evolving fuzzy systems,” Interna-tional Journal of Neural Systems, vol. 20, no. 5, pp. 355–364, 2010.
[54] B. Minor and D. J. Cook, “Regression tree classification foractivity prediction in smart homes,” in Proceedings of the ACMInternational Joint Conference on Pervasive and UbiquitousComputing (UbiComp ’14), pp. 441–450, ACM, September 2014.
[55] D. L. Vail, M. M. Veloso, and J. D. Lafferty, “Conditionalrandom fields for activity recognition,” in Proceedings of the 6thACM International Joint Conference on Autonomous Agents andMultiagent Systems (AAMAS ’07), pp. 235:1–235:8, Honolulu,Hawaii, USA, May 2007.
[56] A. Jurek, C. Nugent, Y. Bi, and S.Wu, “Clustering-based ensem-ble learning for activity recognition in smart homes,” Sensors,vol. 14, no. 7, pp. 12285–12304, 2014.
[57] A. Dalton and G. Olaighin, “Comparing supervised learningtechniques on the task of physical activity recognition,” IEEEJournal of Biomedical and Health Informatics, vol. 17, no. 1, pp.46–52, 2013.

Submit your manuscripts athttp://www.hindawi.com
Computer Games Technology
International Journal of
Hindawi Publishing Corporationhttp://www.hindawi.com Volume 2014
Hindawi Publishing Corporationhttp://www.hindawi.com Volume 2014
Distributed Sensor Networks
International Journal of
Advances in
FuzzySystems
Hindawi Publishing Corporationhttp://www.hindawi.com
Volume 2014
International Journal of
ReconfigurableComputing
Hindawi Publishing Corporation http://www.hindawi.com Volume 2014
Hindawi Publishing Corporationhttp://www.hindawi.com Volume 2014
Applied Computational Intelligence and Soft Computing
Advances in
Artificial Intelligence
Hindawi Publishing Corporationhttp://www.hindawi.com Volume 2014
Advances inSoftware EngineeringHindawi Publishing Corporationhttp://www.hindawi.com Volume 2014
Hindawi Publishing Corporationhttp://www.hindawi.com Volume 2014
Electrical and Computer Engineering
Journal of
Journal of
Computer Networks and Communications
Hindawi Publishing Corporationhttp://www.hindawi.com Volume 2014
Hindawi Publishing Corporation
http://www.hindawi.com Volume 2014
Advances in
Multimedia
International Journal of
Biomedical Imaging
Hindawi Publishing Corporationhttp://www.hindawi.com Volume 2014
ArtificialNeural Systems
Advances in
Hindawi Publishing Corporationhttp://www.hindawi.com Volume 2014
RoboticsJournal of
Hindawi Publishing Corporationhttp://www.hindawi.com Volume 2014
Hindawi Publishing Corporationhttp://www.hindawi.com Volume 2014
Computational Intelligence and Neuroscience
Industrial EngineeringJournal of
Hindawi Publishing Corporationhttp://www.hindawi.com Volume 2014
Modelling & Simulation in EngineeringHindawi Publishing Corporation http://www.hindawi.com Volume 2014
The Scientific World JournalHindawi Publishing Corporation http://www.hindawi.com Volume 2014
Hindawi Publishing Corporationhttp://www.hindawi.com Volume 2014
Human-ComputerInteraction
Advances in
Computer EngineeringAdvances in
Hindawi Publishing Corporationhttp://www.hindawi.com Volume 2014