research article a geometric fuzzy-based …downloads.hindawi.com/journals/afs/2014/201243.pdf · a...
TRANSCRIPT

Research ArticleA Geometric Fuzzy-Based Approach for Airport Clustering
Maria Nadia Postorino and Mario Versaci
Department of Civil Engineering Energy Environment and Materials Mediterranea University of Reggio Calabria89122 Reggio Calabria Italy
Correspondence should be addressed to Mario Versaci marioversaciunircit
Received 11 March 2014 Accepted 19 May 2014 Published 17 July 2014
Academic Editor Francesco Carlo Morabito
Copyright copy 2014 M N Postorino and M Versaci This is an open access article distributed under the Creative CommonsAttribution License which permits unrestricted use distribution and reproduction in any medium provided the original work isproperly cited
Airport classification is a commonneed in the air transport field due to several purposesmdashsuch as resource allocation identificationof crucial nodes and real-time identification of substitute nodesmdashwhich also depend on the involved actorsrsquo expectations In thispaper a fuzzy-based procedure has been proposed to cluster airports by using a fuzzy geometric point of view according to theconcept of unit-hypercube By representing each airport as a point in the given reference metric space the geometric distanceamong airportsmdashwhich corresponds to a measure of similaritymdashhas in fact an intrinsic fuzzy nature due to the airport specificcharacteristics The proposed procedure has been applied to a test case concerning the Italian airport network and the obtainedresults are in line with expectations
1 Introduction
Airports are crucial nodes of the air transport networksboth as air terminals and as interchange nodes As airterminals they represent a starting and ending point of flightsAs interchange nodes they are the place where passengerstransfer from one transport mode to another (surfaceair andvice versa) The role of interchange nodes also depends onthe existence of a well-developed surface network that linksan airport to a given geographical region
According to Eurocontrol figures [1] 170000 links of theEuropean air traffic network rely on some 2000 airportsmdashamong more than 2100mdashwhich can be considered funda-mental nodes of the airport network As stated in thatreport ldquounderstanding the variety of airports in Europe theirdistribution their traffic patterns their aircraft mix theirstrengths and their weaknesses is essential to understandingthe strengths of the air traffic network as a wholerdquo
The classification of elements is a common rule to identifysome ldquotypesrdquo according to specific goals As an examplethe above Eurocontrol report highlights the importance ofldquounderstanding the variety of airportsrdquo to understand thestrengths of the whole air traffic network Still in EU fourairport categories (community national large regional and
small regional) are identified (see [2]) with the specific aimto identify similar airports and particularly regional airportsthat are supposed to play an important role in supportingmany Union policies [3]
Airports can be classified according to their size func-tions and ownership As for size and functions the Inter-national Civil Aviation Organisation (ICAO) provides clas-sifications not only based on the geometric characteristicsof both runways and aircraft but also based on the airportfunction measured by the airport traffic density [4] Similarclassifications are also made by the Federal Aviation Admin-istration (FAA)
As for ownership here the classification can be fainter dueto different opportunities defined by specific laws at countrylevel However according to a recent study by ICAO [5]autonomous airports are themost common form accountingfor 40 of the sampled airports (80 of them state ownedand the remaining privately owned) Governmental ownedandor managed airports and airports operated under aconcession or leasing agreement represent the other twomaingroups while a further group includes other peculiar forms ofownershipmanagement
The identification of similar airports on the basis of somecriteria and according to some specific goals can be used for
Hindawi Publishing CorporationAdvances in Fuzzy SystemsVolume 2014 Article ID 201243 12 pageshttpdxdoiorg1011552014201243
2 Advances in Fuzzy Systems
various purposes Although criteria and purposes can bevery different however two important aims are (1) theidentification of potential substitute nodes in the air networkand (2) the identification of crucial nodes in the airportnetwork to invest or allocate resources In the first case alsoreal time features may be relevant For example if unexpectedevents such as volcanic eruptions or severe meteorologicalconditions prevent using one or more airports potentialsubstitute nodes having similar characteristics should beidentified in very short time In the second case uncertaintyaspects may play a significant role because whatever the clas-sification procedures are one airport cannot be consideredabsolutely similar to another one but only similar to a givenextent
In the literature some studies dealt with airport classifica-tion to select categories with comparable passenger terminalsystems [6] to examine alternative slot allocation strategies[7] or operational efficiency [8] to study the evolution of theEuropean aviation network [9] to identify strategic groupssharing common attributesroles or to identify airport rank-ings [10 11]
In the above works traditional clustering techniques havebeen used however they have a high computational com-plexity and are unsuitable for real time applications Fur-thermore they do not fully consider imprecision due to theinherent difficulty in gathering entities that differ amongthem because of the context and the peculiarity of eachof them independently of the data used to identify theirsimilarities
The goal of this paper is to propose a general procedureto cluster airportsmdashaccording to one or more factors mea-suring their characteristicsmdashby using a fuzzy approach [12ndash14] In fact if real time and imprecision features representkey factors fuzzy systems could help to identify the bettermethodology with short computing time [15ndash17]
The common characteristics of groups of airports haveto be set but the features of each airport have to be definedso as to verify which group it belongs to This problem canbe defined as a classification issue where the key factor isthe distance from the airport cluster centres Here the clas-sification problem is in fact defined from a fuzzy geometricpoint of view where each airport is represented by a fuzzyset depending on some parameters The fuzzy nature of theproblem however is not identified in the airport in itselfbut mainly in the distance among similar airports In otherwords similarities among airports can be measured by adistance that have an intrinsic fuzzy nature In fact eachairport has different characteristics and can develop differentlevels which make it a unique entity Then the similaritymeasure among such entities is not a crisp value
The fuzzy cluster approach proposed here as alternativemethod with respect to other crisp approaches is based onthe potentiality it can offer when two aspects of fuzzinessare considered The first one concerns the identification ofan airport as a fuzzy set then not only numerical values butalso linguistic variables can be used to describe itThe secondaspect concerns the distancemdashconsidered as fuzzy quantitymdashthat measures the similarity between couples of airports
Finally it is worthwhile to note that the goal of this paper isnot to discuss the implications of clusters obtained by usingone or more specific criteria but to set the fuzzy procedureand then test it on a real case However since different criteriacan give very different clusters some of the most relevantcriteria are briefly described in the next section in order togive an overview according to several points of view
The paper is organized as follows Section 2 and its sub-sections describe the role of airports and the way to deal withit an overview of the proposed fuzzy geometric approachdeveloped in terms of fuzzy subsethood operator and itsformalization for the examined problem Section 3 describesthe results obtained on a test case and Section 4 summarizessome conclusions
2 Materials and Methods
21 Airport Roles and Clustering Criteria In densely popu-lated areas such as the EU many airports are located at arelatively short distance among them Particularly regionalairports are often close to each other and are faced with eithercooperationintegration or competition strategies amongthem Hubs or community airports too are not exempt fromthis challenge and the evolution of airport networks is also anindirect effect of different strategies [18 19]
In these situations classifications are important to iden-tify similar airports from some points of view Generallyspeaking airports are complex entities due to the severalinvolved actors whose needs and expectations could bedifferent The interaction among actors produces the airportoutcome often identified as the number of yearly handledpassengers or movements
Travellers and airlines are two important actors and alsousers of the airport managed by an airport operator Accord-ing to the distinction between landside and airside airportservices and facilities for travellers and airlines have to bedistinguished (Figure 1)
For travellers services mainly refer to (i) airport-relatedservices (eg waiting time to check-in and for security con-trols baggage delivery airport commercial activities and carparking area availability) (ii) services offered as the result ofairport operators and local authoritiestransport companiesagreements (eg busrail services fromto main cities) and(iii) services resulting from the interaction between airportoperators and airlines (eg served destinations flight fre-quency and hub connection) For airlines services mainlyrefer to (i) navigation aid services (eg ILS VOR) and(ii) handling (eg refuelling cabin cleaning and baggageservices among the most relevant services)
Finally facilities mainly refer to parking areas and pas-senger terminal (landside) and runways taxiway and aprons(airside)
While the list above cannot be considered complete how-ever there are several points of view to cluster airports onthe basis of some criteria such as level-of-service variablestravellersrsquo preferences and airport facilities
Travellers perceive similar airports according to theirtravel experiences The main key factors are level-of-service
Advances in Fuzzy Systems 3
Travellers
Traveller services
Landside
Airportoperators
Airport
Airline servicesAirlines
Airside
Served destinations
Air services
Figure 1 Relationships linking airport operators airlines and travellers with respect to the airport
variables as described before involving both airports andairlines and services offered by local transport companiesClusters based on travellersrsquo preferences can be usefulfor airport development policies in competitive marketsFurthermore public plannersmdashas governments and localauthoritiesmdashmay also represent the travellersrsquo point of viewto some extent because they guarantee social wellness andthe interests of their communities In this light they areinterested in classifying and ranking airports to identifynationalinternational airport network strategic nodes thatguarantee accessibility to people also living in decentralizedregions (EU TEN-T Policy review) Finally airlines chooseairports for their network according to the services andfacilities they offer with respect to their fleet compositionrequirements the network type (eg hub-and-spoke versuspoint-to-point types) and the expected travel demand in theairport catchment areas [20 21]
The key factors to identify similar airports are then dif-ferent according to the point of view although in some casestheymay lead to similar clusters As an example community-airport clusters obtained on the basis of the yearly passengertrafficmdashmore than 10 million according to the EU [2]mdashprobably correspond to hub-airport clusters where servicesand facilities are the discriminating factors
To express formally the problem the vector X119894(X119894=
119909119894119895) characterizes the airport 119894 with respect to a given point
of view so that the performances of 119894 are represented by119860119894= 119860(X
119894) where 119860(X
119894) is a scalar function of some chara-
cteristics X119894defined in R In the simplest case X
119894is a 1 times 1
vector and corresponds to a single key factorClassifications can be realized in two ways (1) by fixing
themaximumnumber of clusters119870 that have to be identifiedaccording to some compulsory classes or identified categories(eg as in official classifications by ICAO and EU) and (2)without fixing the maximum number of classes that can beobtained
In both cases each cluster should gather ldquosimilarrdquo entitieswhosemembership could not be unique if they lie on the clus-ter frontierThere are some reasons thatmake the use of fuzzyapproaches attractive as alternative methods with respect tocrisp ones First ldquosimilarityrdquo between airports does not cor-respond to ldquoidentityrdquo and then the problem can be well rep-resented by using a fuzzy approach particularly a geometric
one where ldquosimilarityrdquo is translated in terms of distance ina certain space Shortly by using fuzzy logic each airportcan be thought of as a fuzzy set Further a fuzzy setmdashandthen an airportmdashcan be represented by a point in a given119899-dimensional metric spacemdashnot necessarily Euclideanmdashwhere 119899 is the number of features extractable from an airportldquoSimilaritiesrdquo among airports are assessable by distancesamongpoints For a given couple of airports themore the dis-tance between them the more the differences and vice versaGenerally each airport has some specific characteristics thatmake it a unique entity Furthermore most of the airportcharacteristics have not fixed reference threshold values andthey may vary within some undefined limits Then distancemeasures vary continuously in the given space for eachcouple of airports and can be identified by a fuzzy quantityrepresented by fuzzy values Finally while the membershipof airports close to each othermdashand then close to the clustercentremdashis clear the same cannot be said for airports lying onthe frontier and whose membership is more uncertain Thefuzzy approach can well represent such situations
The next section describes the mathematical aspect of thefuzzy geometric approach applied to cluster similar entities
22 Geometric Point of View of Fuzzy Classification Prob-lem It is known that a fuzzy set 119860 can be considered asan abstract quantity containing other ones Membershipfunctions which characterize a fuzzy set are consideredthe kernel of mapping between objects and point elementsbelonging to [0 1] However in another perspective a fuzzyset can be viewed from a geometric point of view In otherwords a fuzzy set119860 can be considered a point in a given space(Figure 2) whose metric is defined as
1198891199042= 119892119894119896119889119909119894119889119909119896 (1)
119892119894119896being the so-called metrical tensor Then in the given
space the distance among points can be calculated as
119889119904 = radic119892119894119896119889119909119894119889119909119896
119904 = int119889119904 = intradic119892119894119896119889119909119894119889119909119896
(2)
4 Advances in Fuzzy Systems
00
02
04
06
08
10
00 00
02
0406
0805
A
10
10
Figure 2 Representation of a fuzzy set119860within the unit-hypercube
Since 1198891199042 is invariant as regards changes of the coordinatesystemmdashfrom 119909119894 to 1199091015840119894mdashsuch that 1198891199042 = 119889119904
10158402 then the 119899-dimensional Euclidean space R119899 can be used to computedistances Since it occurs that
119892119894119896= 120575119894119896= (
1 sdot sdot sdot 0 d
0 sdot sdot sdot 1
) (3)
then (1) can be written as
1198891199042= (119889119909
1)2
+ (1198891199092)2
+ sdot sdot sdot + (119889119909119899)2 (4)
By using the Einstein convention (4) can also be written as
1198891199042= (119889119909
119894)2
119894 = 1 119899 (5)
Then the distance between two fuzzy sets (or points) 119860 and119861 119889(119860 119861) in the 119899-dimensional Euclidean space is given bythe length of the line connecting119860 and 119861 When the problemunder study is characterized bymany variables a fuzzy set canbe thought of as a point inside a unit-hypercube inwhich eachside is an unitary intervalmdashsince fuzzified point elementsbelong to [0 1]
If 119899 is the number of variables 2119899 corners of the unit-hypercube represents crisp subsets fuzzy subsets are locatedinside the unit-hypercube
In particular Cartesian coordinates of each point inthe unit-hypercube are computed as fuzzified quantities119891119860(119909119895) The geometric formulation of fuzzy sets together
with subsethood operators [22 23] can play a crucial role asregards detection and classification problems The basic ideais that a fuzzy set119860may be to some extent a subset of a fuzzyset 119861 When dealing with classification problems subsethoodoperators can identify howmuch a fuzzy set119860 is belonging tothe class represented by the fuzzy set 119861 in the unit-hypercubeThis geometric fuzzy approach has been already applied tosome classification problems and compared with some otherfuzzy clustering approaches [24] However it has not been
applied in the field of transportation yet In addition withrespect to canonical fuzzy approaches already tested in theliterature the proposed geometrical approach is formulated ina space sized on features extracted directly from the airportcharacteristics leading to the graphic translation of the clus-tering problem easily perceived even by nonexperts (pointsinside unit-hypercube) Obviously appropriate choices ofadditional space (non-Euclidean) otherwise defined hereinmay help in the study of sets of airports with a high degreeof overlap of features
In this study the points in the unit-hypercube are airportsthat have to be classifiedThe airport classification is obtainedby identifying if and how much the fuzzy set 119860mdashunclassifiedairportmdashbelongs to the fuzzy set 119861 representing a referencecategory of airports
To describe the mathematical formulation let 119878(119860 119861) bethe subsethood operator 119878(119860 119861) can be computed as follows
119878 (119860 119861) = 1 minussum119899
119895=1max [0 119891119860 (119909
119895) minus 119891119861 (119909
119895)]
119872 (119860) (6)
where119872(119860) is the distance 119889(119860 119861) Three types of distancesare considered here
(a) the Euclidean distance 119889euclidean(119860 119861)
119872(119860)2= 119889euclidean(119860 119861)
2= (119909119894)2
= (119891119860(119909119894) minus 119891119861(119909119894))2
(7)
(b) the fuzzy-Hamming distance 119889Hamming(119860 119861)
119872(119860) = 119889Hamming (119860 119861) =119899
sum119894=1
119909119894=
119899
sum119894=1
10038161003816100381610038161003816119891119860(119909119894) minus 119891119861(119909119894)10038161003816100381610038161003816
(8)
(c) the Kacprzyk distance 119889Kacprzyk(119860 119861)
119872(119860) = 119889Kacprzyk (119860 119861) =119899
sum119894=1
119909119894=
119899
sum119894=1
10038161003816100381610038161003816119891119860(119909119894) minus 119891119861(119909119894)10038161003816100381610038161003816
2
(9)
It is easy to see that 119878(119860 119861) le 1 and 119878(119861 119860) = 1 minus 119878(119860 119861)Since 119878(119860 119861) measures how much 119860 is contained in 119861
119878(119861 119860)measures how much 119861 is contained in119860To summarize reference categories of airports are points
in the unit-hypercube and the positions of unclassified air-ports are identified as distance measures with respect to eachknown class of airports by using the subsethood operatorThe following section explains in detail the classificationprocedure
23 The Proposed Classification Procedure According to thefirst classification criterion that is by fixing the maximumnumber of clusters the basic idea of the proposed procedurestarts from the consideration that the airport class 119896 isdescribed by some parameters ranges As showed by dataairports with fixed characteristics have parameters values
Advances in Fuzzy Systems 5
(average standard deviation skewness and kurtosis) fallinginto particular ranges Then for each class 119896 the averagestandard deviation skewness and kurtosis values (labeled asAv119896 St119896 Sk119896 andKu119896 resp) are computed and the followingtridimensional matrix 119885 is obtained
119885 =
[[[[[
[
Av1 (119895) St1 (119895) Sk1 (119895) Ku1 (119895)sdot sdot sdot sdot sdot sdot sdot sdot sdot sdot sdot sdot
sdot sdot sdot sdot sdot sdot sdot sdot sdot sdot sdot sdot
Av119896 (119895) St119896 (119895) Sk119896 (119895) Ku119896 (119895)
]]]]]
]
(10)
The number of rows119870 is equal to the number of classes thenumber of columns is equal to the number of parametersThethird dimension refers to the number of values available foreach parameter and for each class 119896 for example yearly orseasonal values To describe the fuzzy clustering procedurewhen the number of classes is fixed a priori 119870 = 4 hasbeen chosen because it is the same number of classes adoptedby the EU to classify airports as regards the yearly handledpassengers Note that the choice of119870 = 4must be consideredonly an example although it refers to a real case and it does
not affect the generality of the procedure Then the matrix 119885is specified as
119885 =[[[
[
Av1 (119895) St1 (119895) Sk1 (119895) Ku1 (119895)Av2 (119895) St2 (119895) Sk2 (119895) Ku2 (119895)Av3 (119895) St3 (119895) Sk3 (119895) Ku3 (119895)Av4 (119895) St4 (119895) Sk4 (119895) Ku4 (119895)
]]]
]
(11)
Two matrices min(119885) and max(119885) which represent respec-tively the matrices with the max and min values of theparameters are also defined
119885 =[[[
[
minAv1 (119895) min St1 (119895) min Sk1 (119895) minKu1 (119895)minAv2 (119895) min St2 (119895) min Sk2 (119895) minKu2 (119895)minAv3 (119895) min St3 (119895) min Sk3 (119895) minKu3 (119895)minAv4 (119895) min St4 (119895) min Sk4 (119895) minKu4 (119895)
]]]
]
119885 =[[[
[
maxAv1 (119895) max St1 (119895) max Sk1 (119895) maxKu1 (119895)maxAv2 (119895) max St2 (119895) max Sk2 (119895) maxKu2 (119895)maxAv3 (119895) max St3 (119895) max Sk3 (119895) maxKu3 (119895)maxAv4 (119895) max St4 (119895) max Sk4 (119895) maxKu4 (119895)
]]]
]
(12)
Finally the matrix 1198851015840 whose generic element is the interval[min(119885) max(119885)] is computed as follows
119885 =
[[[[[[[[[
[
[minAv1 (119895) maxAv1 (119895)] [min St1 (119895) max St1 (119895)] [min Sk1 (119895) max Sk1 (119895)] [minKu1 (119895) maxKu1 (119895)]
[minAv2 (119895) maxAv2 (119895)] [min St2 (119895) max St2 (119895)] [min Sk2 (119895) max Sk2 (119895)] [minKu2 (119895) maxKu2 (119895)]
[minAv3 (119895) maxAv3 (119895)] [min St3 (119895) max St3 (119895)] [min Sk3 (119895) max Sk3 (119895)] [minKu3 (119895) maxKu3 (119895)]
[minAv4 (119895) maxAv4 (119895)] [min St4 (119895) max St4 (119895)] [min Sk4 (119895) max Sk4 (119895)] [minKu4 (119895) maxKu4 (119895)]
]]]]]]]]]
]
(13)
The fuzzification step leads to treating eachelement of 1198851015840[min(Statistical Parameter119896(119895)) max(Statistical Parameter119896(119895))] by means of a suitable shapedfunction into the interval [0 1] Here a sigmoid function hasbeen chosen because of its very good smooth propertiesHowever other typologies of functions can also beconsidered
Definitively (14) shows the formulation of the fuzzifi-cation step Each range of possible values of the statisticalparameters is ldquotranslatedrdquo into a fuzzified range
119891 (1198851015840(119903 119904))
= [1
1 + 119890minus119885119896(inf(119885119896(119903119904))minus119867119896)
1
1 + 119890minus119885119896(sup(119885119896(119903119904))minus119867119896)
]
(14)
with 119903 119904 generic row and column of matrix 1198851015840 and 119878119896 119867119896suitable sigmoidal parameters (referred to as each 119896th airport
class) located as a fuzzy range inside the 4-dimensional unit-hypercube
If some satellite subclasses belong to a given class 119896then the subclasses have to be included into the macroclassrepresenting all the others Then the fuzzified range iscomputed as
[minsub-classes (119891 (min (119885 (119903 119904))))
maxsub-classes (119891 (min (119885 (119903 119904))))] (15)
If 119884 is a new airport that has to be classified the vector Y ofits parameters is
Y = lfloorAv119896 St119896 Sk119896Ku119896rfloor (16)
and it is fuzzified by using a sigmoid function as
119891 (Y (ℎ)) = 1
1 + 119890minus119904(Y(ℎ)) ℎ = 1 2 3 4 (17)
where 119891(Y(ℎ)) is a point inside the 4-dimensional unit-hypercube Then the quantity
119878 (119891 (Y (ℎ)) 119891 (maxsub classes (119891 (min (119885 (119903 119904)))))) (18)
6 Advances in Fuzzy Systems
Table 1 Commercial airports in Italy (reference year 2012 source httpwwwassaeroportiitcategorystatistiche)
1 Alghero AHO 2 Ancona AOI 3 Bari BRI 4 Bergamo BGY 5 Bologna BLQ 6 Bolzano BZO
7 Brescia VBS 8 Brindisi BDS 9 Cagliari CAG 10 Catania CTA 11 Crotone CRV 12 Cuneo CUF
13 Firenze FLR 14 Foggia FOG 15 Forlı FRL 16 Genova GOA 17 Lamezia Terme SUF 18 Milano Linate LIN
19 MilanoMalpensa MXP
20 Napoli NAP 21 Olbia OLB 22 Palermo PMO 23 Parma PMF 24 Perugia PEG
25 Pescara PSR 26 Pisa PSA 27 Reggio Calabria REG 28 Rimini RMI 29 Roma Ciampino CIA 30 Roma Fiumicino FCO
31 Siena SAY 32 Torino TRN 33 Trapani TS 34 Treviso TSF 35 Trieste TRS 36 Venezia VCE
37 Verona VRN 38 Grosseto GRS
is computed as explained in (3) If the above quantity is closerto unity the new airport likely belongs to the class 119896 and
max119896119878 (119891 (Y (ℎ)) 119891 (maxsub classes (119891 (min (119885 (119903 119904))))))
(19)
identifies the membership class In this case there are threesubsethood operators [25] each one defined by a differentmetric
The same procedure can be used to identify clusterswithout fixing a priori their maximum numbers In fact
(1) If 119884 is the first examined airport its vector Y ofparameters is
Y = lfloorAv119896 St119896 Sk119896Ku119896rfloor (20)
Y is fuzzified by using a sigmoid function (17)
119891 (Y (ℎ)) = 1
1 + 119890minus119904(Y(ℎ)) ℎ = 1 2 119870 (21)
and the airport 119884 is a single point inside the unit-hypercube (cluster I)
(2) If 1198841015840 is the second examined airport its vector Y1015840 ofparameters is
Y1015840 = lfloorAv1198961015840
St1198961015840
Sk1198961015840
Ku1198961015840
rfloor (22)
Y1015840 is fuzzified by using a sigmoid function (17)
119891 (Y1015840 (ℎ)) = 1
1 + 119890minus119904(Y1015840(ℎ)) ℎ = 1 2 119870 (23)
and the airport 1198841015840 is another point inside the unit-hypercube (cluster II)
(3) If 11988410158401015840 is the third examined airport its vector Y10158401015840 ofparameters is
Y10158401015840 = lfloorAv11989610158401015840
St11989610158401015840
Sk11989610158401015840
Ku11989610158401015840
rfloor (24)
Y10158401015840 is fuzzified by using a sigmoid function (17)
119891 (Y10158401015840 (ℎ)) = 1
1 + 119890minus119904(Y10158401015840(ℎ)) ℎ = 1 2 119870 (25)
and the airport 11988410158401015840 is another point inside the unit-hypercube
(4) The values of 119878(11988410158401015840 119884) and 119878(1198841015840 119884) are then com-puted If their values are greater than a prefixedthreshold a third cluster is identified otherwisethe minimum value between those ones identifiesthe airport membership to its class The procedurecontinues until the last airport has been examined
3 Application to a Test Case
The procedure described in the previous sections has beenapplied to the Italian airport system According to theNational Authority forCivil Aviation [26] in Italy there are 45certified commercial airports However at year 2013 only 38are included in the official figures (Table 1) because the othershandle an insufficient number of passengers In Table 1 theairports are identified with a numerical label the name of themain city they serve and the IATA code
As discussed in Section 2 the criteria to classify airportscan vary according to both the point of view and the goal to beachieved It is worthwhile to note that the aim of the paper isto present and then test the airport clustering fuzzy geometricapproach based on the concept of ldquosimilarityrdquo as fuzzy dis-tance rather than providing specific policy recommendationson the basis of the application to the test case In this lightamong the several and various criteria that can be identifiedthe ones considered here are based on data available atnational level and provided by the Association of Italian Air-ports (Assaeroporti httpwwwassaeroportiit) The choiceof such data to cluster airports has also beenmotivated by thecurrent policy adopted by the Italian government to identifythe relevant airports for the Italian airport network Particu-larly the official data used here as classification criteria referto the yearly number of movements and handled passengersThe chosen criteria take into account the airport dimensionsIf data are available other criteria such as served destinationsor airport connectivity could take into account the airportattractiveness
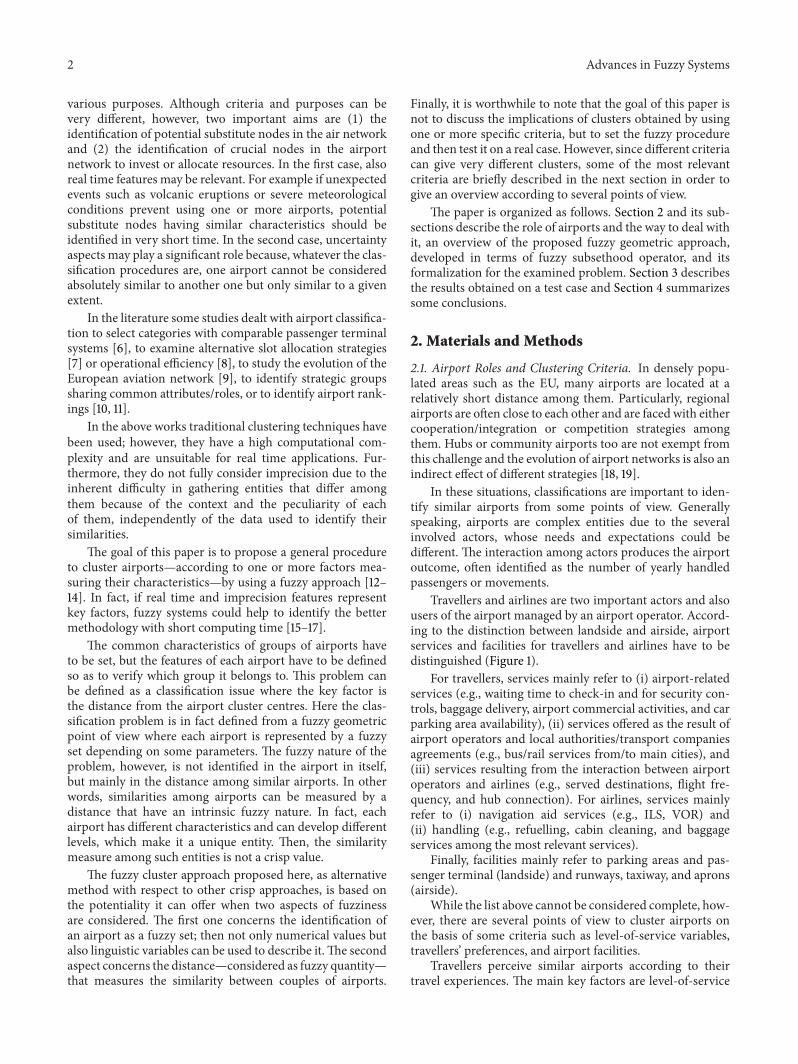
According to the procedure described in Section 4the airport is represented by a fuzzy set and then yearlypassengers and movements values have been fuzzified(Table 2) The number in the first row corresponds to theairport numerical label as in Table 1 The ranges reported in
Advances in Fuzzy Systems 7
Table 2 Yearly ranges (15) for each airport coded as in Table 1
Airport Criterion 1movements
Criterion 2passengers
1 0ndash0461 0ndash06422 0ndash0481 0ndash03873 0ndash0559 0ndash05444 0ndash0388 0ndash03725 0ndash0421 0ndash04396 0ndash0313 0ndash03457 0ndash0291 0ndash03098 0ndash0297 0ndash03449 0ndash0355 0ndash039010 0ndash0581 0ndash061411 0ndash0142 0ndash013412 0ndash0172 0ndash017713 0ndash0422 0ndash042914 0ndash0296 0ndash029815 0ndash0219 0ndash024516 0ndash0381 0ndash040117 0ndash0237 0ndash024918 0ndash0538 0ndash053419 0ndash0804 0ndash081020 0ndash0632 0ndash065421 0ndash0415 0ndash039022 0ndash0458 0ndash046523 0ndash0312 0ndash034124 0ndash0311 0ndash028625 0ndash0388 0ndash038626 0ndash0387 0ndash039927 0ndash0314 0ndash038728 0ndash0465 0ndash043229 0ndash0481 0ndash051130 0ndash0801 0ndash084331 0ndash0180 0ndash020832 0ndash0625 0ndash060733 0ndash0219 0ndash021834 0ndash0230 0ndash020135 0ndash0314 0ndash031836 0ndash0514 0ndash048337 0ndash0415 0ndash042938 0ndash0172 0ndash0194
Table 2 have been obtained by using (15) here reported forclarity
ranges [minsubclasses (119891 (min gt (119885 (119903 119904))))
maxsubclasses (119891 (min (119885 (119903 119904))))] (26)
Although the used data could not be considered intrinsicallyfuzzy however other kinds of data could be such as travellersrsquo
preferences also expressed as linguistic variables or level-of-service variables As already stated the goal of the paper is totest the proposed approach by using available datamdashin thiscase the ones available from the above official sources
According to the general relationship 119860119894= 119860(X
119894) des-
cribed in Section 2 the experiments realized here refer to thesimplest case where X
119894is a single key factor (or criterion)
particularly the yearly number of passengers and the yearlynumber of movements
8 Advances in Fuzzy Systems
Table 3 Clustering results with prefixed number of clusters Criterion yearly passengers
Metrics ED FHD KDCluster 1 (centre Roma FCO)
le20 30 19 18 4 36 30 19 18 4 30 19 18 420ndash40 10 20 29 5 22 26 9 36 10 20 29 5 22 26 36 10 20 29 5 22
gt40 32 37 3 34 21 13 17 1 16 8 35 33 152 27 25 28 23 7 12 24 6 14 11 38 31
9 32 37 3 34 21 13 17 1 16 8 35 3315 2 27 25 28 23 7 12 24 6 14 11 38
31
9 26 32 37 3 34 21 13 17 1 16 8 3533 15 2 27 25 28 23 7 12 24 6 14 11
38 31Cluster 2 (centre Napoli Capodichino)
le20 20 10 20 10 20 1020ndash40 9 32 36 37 4 26 36 3 29 22 9 32 36 37 4 26 36 3 29 22 9 32 36 37 4 26 36 3 29 22
gt4018 30 19 26 5 21
17 8 1 33 13 15 16 27 14 35 12 7 112 28 31 23 38 24 6
18 30 19 26 521 17 8 1 33 13 15 16 27 14 35 12 7
11 2 28 31 23 38 24 6
18 30 19 26 521 8 1 33 13 15 16 27 14 35 12 7 11
2 28 31 23 38 24 6Cluster 3 (centre Lamezia Terme)
le20 17 8 34 17 8 34 17 8 3420ndash40 33 9 15 26 22 1 33 9 15 26 22 33 9 15 26 22
gt4029 37 21 3 5 20 32 10 4 14 27 36 1718 30 19 7 12 13 11 25 16 31 38 35
28 23 2 6 34
1 29 37 21 3 5 20 32 10 4 14 27 3617 18 30 19 7 12 13 11 25 16 31 38
35 28 23 2 6 34
1 29 37 21 3 5 20 32 10 4 14 27 3617 18 30 19 7 12 13 11 25 16 31 38
35 28 23 2 6 34Cluster 4 (centre Reggio Calabria)
le20 27 7 12 27 7 12 27 7 1220ndash40 25 11 15 31 38 14 25 11 15 31 38 25 11 15 31 38
gt4033 16 13 8 17 28 23 35 34 26 9 2229 2 6 24 1 21 5 20 3 32 10 4 36
18 30 19
14 33 16 13 8 17 28 23 35 34 26 922 29 2 6 24 1 21 5 20 3 32 10 4
36 18 30 19
14 33 16 13 8 17 28 23 35 34 26 922 29 2 6 24 1 21 5 20 3 32 10 4
36 18 30 19
As regards the two classification procedures described inSection 4 the airport clusters have been obtained by fixingthemaximumnumber of classes (Tables 3 and 5) and withoutfixing the number of classes (Tables 4 and 6) Furthermorethe three distance metrics (Euclidean ED fuzzy-HammingFHD and Kacprzyk KD) have been used to identify theclusters
In Tables 3 and 4 for each cluster and for each metric thefirst list (in row) of airports refers to the closest airports asregards the cluster centre Particularly they are in the rangeof 20of themax-min intervalThe second list refers to thoseairports that are farther from the cluster centre and are in therange between 20 and 40 of themax-min interval Finallythe third list refers to airports that are quite far from the centreand outside the range of 40 of the max-min interval
From Tables 3ndash6 it can be seen that the three metricsprovide rather similar results in terms of group membershipalthough as expected some differences can be seen in termsof distance from the centre clusters In fact according tothe metrics the same elements may be farther or closer tothe cluster centre but the group composition is practicallyidentical
Figure 3 summarizes the group composition with refer-ence to passengers and movements with Euclidean distance(see Tables 3 and 5 first column) and provides an overview ofthe cluster overlaps
For each cluster identified by a circle the two areas ineach circle identify the first two subsets within the cluster
(Tables 3ndash6) In other words they reproduce the airport listsas regards the distance from the centre (le20of themax-mininterval between 20 and 40 of themax-min interval)Theelements outside the circles represent those whose distanceis greater than 40 of the max-min interval The elementsclosest to the cluster centre are in the grey circle while theothers are located inside the black circle (and outside the greyone) or outside the black circle according to their distancefrom the centre
Elements in shared areas represent airports that couldbe located in more clusters according to a crisp distancethreshold In other words the cluster membership obtainedas a result of a fuzzy approach makes it possible to identifyclustering uncertainty for elements farther from the centre
The airports outside the black circles can be consideredmarginal within each cluster and significantly different fromthe cluster centre while the ones between the grey and blackcircles do not belong undoubtedly to the cluster but at thesame time are not so different from the ones in the grey circle
Shared areas among clusters are the consequence of thethree subsets identified within each cluster In fact someairports can belong to different clusters with different mem-bership values This is one of the fuzzy approach advantageswhen grouping complex entities like airports In fact itis practically impossible to build homogeneous clusters ofairports that have exactly the same characteristics or are justslightly different but it is possible to find similarities to acertain extent As regards the goal to identify the relevant
Advances in Fuzzy Systems 9
Table 4 Clustering results without prefixing the number of clusters Criterion yearly passengers
Metrics ED FHD KDCluster 1 (centre Roma FCO)
le20 30 19 18 36 30 19 18 36 30 19 18 36
20ndash40 4 10 20 29 5 22 26 9 4 10 20 29 5 22 9 26 4 10 20 29 5 9 22 26
gt40 37 32 3 34 21 13 17 1 16 8 35 33 152 27 25 28 23 7 12 24 6 14 11 31 38
37 32 3 34 21 13 17 1 16 8 35 33 152 27 25 28 23 7 12 24 6 14 11 38 31
37 32 3 34 21 13 17 1 16 8 35 33 1527 2 25 28 23 7 12 24 6 14 38 11 31
Cluster 2 (centre Bologna)
le20 5 29 22 5 29 22 5 29 22
20ndash40 26 4 18 9 13 30 10 19 20 26 4 18 9 13 30 10 20 19 26 4 18 9 13 30 20 10 19
gt40 36 34 16 17 8 32 15 37 3 27 12 1 1621 7 25 35 14 12 28 2 23 31 38 24 6
36 34 16 8 17 32 15 37 3 27 12 1 1621 7 25 35 12 14 28 2 23 31 38 6 24
36 34 8 16 17 32 15 37 3 27 12 1 1621 25 7 35 12 14 28 2 23 31 6 38 24
Cluster 3 (centre Alghero)
le20 1 1 1
20ndash40 21 34 37 3 17 8 32 20 9 15 10 21 34 37 3 17 8 32 20 9 15 21 34 37 3 17 8 32 20 9 15
gt4036 26 29 4 22 18 15 14 30 19 5 1112 27 7 13 16 25 31 35 38 28 23 2 6
24
10 36 26 29 4 22 18 15 14 30 19 511 12 27 7 13 16 25 31 35 38 28 23
2 24 6
10 36 29 26 4 22 18 15 30 14 19 511 12 27 7 13 16 25 31 35 38 28 23
24 2 6Cluster 4 (centre Reggio Calabria)
le20 27 7 12 27 7 12 27 7 12
20ndash40 25 11 15 31 38 14 25 11 15 31 14 38 25 11 15 31 38 14
gt4033 16 13 8 17 28 23 35 34 26 9 2229 2 6 24 1 21 5 20 3 32 10 4 36
18 30 19
16 33 13 8 17 28 23 35 34 26 9 2229 2 6 24 1 21 5 20 3 32 10 4 36
18 19 30
33 16 1317 8 28 23 35 34 26 9 2229 2 6 24 1 21 5 20 3 32 10 4 18
30 30 19Cluster 5 (centre Siena)
le20 31 31 31
20ndash40 38 7 12 11 25 27 38 7 12 11 25 38 7 12 11 25 27
gt4014 15 28 6 24 23 33 2 16 8 13 17 3534 26 22 5 1 9 29 20 21 37 3 32 10
4 18 36 30 19
27 14 15 28 6 24 23 33 2 16 8 13 1735 34 26 5 22 1 9 20 29 21 37 3 32
10 4 18 36 19 30
14 15 28 24 6 23 33 2 16 8 13 17 3534 26 5 22 1 9 20 29 21 37 3 32 10
4 18 19 36 30
airports for the Italian airport network airports in sharedareas can be rightly examined within the national context bysuitably taking into account their characteristics within oneor more clusters
As for the two classification proceduresmdashwith and with-out prefixed number of clustersmdashas expected the secondone provides more homogeneous results in terms of thesimilarity of airports belonging to the same cluster In factwhen themaximumnumber of clusters is not fixed the groupsare formed by entities that are more homogeneous At theextreme case there are as many clusters as objects to begrouped then each entity is considered different from theother ones
The use of two clustering criteria (yearly passengers andmovements) in this case provides similar results (Figure 3) Infact generally there is a direct relationship between carriedpassengers and number of movements although in somesituations the number of airport movements can also be dueto other general aviation segments (eg military operationscargo movements) Then these results are in line with what
is expected in principle because of the relationship betweenpassengers and movements
4 Conclusions and Perspectives
In this work a fuzzy-based cluster procedure has been pro-posed to classify airports Particularly the concept of unit-hypercube has been used to recognize the airport clustermembership on the basis of some airport statistical parame-ters computed by using official data As discussed the choiceof criteria depends on the classification goal and this is animportant aspect However the paper focuses on the fuzzyclustering approach rather than on the choice of criteriathese latter depend on several points of view and have severalpolicy implications The main goal of the paper was in factto test the fuzzy geometric approach as alternative methodwith respect to crisp ones rather than providing specificpolicy recommendations for airport selection or discussingclassification implications by using different criteria
10 Advances in Fuzzy Systems
Table 5 Clustering results with prefixed number of clusters Criterion yearly movements
Metrics ED FHD KDCluster 1 (centre Roma FCO)
le20 30 19 18 36 30 19 18 36 30 19 18 3620ndash40 4 10 20 29 5 22 26 4 10 20 29 5 22 26 4 10 20 29 5 22 26
gt409 37 32 3 34 21 13 17 1 16 8 35 3315 2 27 25 28 23 7 12 24 6 14 11 31
38
37 9 32 3 34 21 13 17 1 16 8 35 3315 2 27 25 28 23 7 12 24 6 14 11 38
31
9 32 37 3 34 21 13 17 1 16 8 35 3315 2 27 25 28 23 7 12 24 6 14 38 11
31Cluster 2 (centre Napoli Capodichino)
le20 20 10 20 10 20 10
20ndash40 32 9 36 37 4 26 36 3 29 22 18 3019 26 5 17
32 9 36 37 4 26 36 3 29 22 18 3019 26 17 5 21
9 32 36 37 4 26 36 3 29 22 18 3019 26 17 5 21 8
gt40 21 8 1 33 13 15 16 27 14 35 12 7 112 28 31 23 38 24 6
8 1 33 13 15 16 27 14 35 12 7 11 228 31 23 38 6 24
1 33 13 15 16 27 14 35 12 7 11 2 2831 23 38 6 24
Cluster 3 (centre Lamezia Terme)le20 17 8 34 17 8 34 17 8 3420ndash40 33 9 15 26 22 1 29 33 9 15 26 22 1 29 33 9 15 26 22 1 29
gt4021 37 3 5 20 32 10 4 14 27 36 17 3018 19 7 12 13 11 25 16 31 38 35 28
23 2 34 6
21 37 3 5 20 32 10 4 14 27 36 17 3018 19 7 12 11 13 25 16 31 38 35 28
23 34 2 6
37 21 3 5 20 32 10 4 14 27 36 17 3018 19 7 12 11 13 25 16 31 38 35 28
23 34 6 2Cluster 4 (centre Reggio Calabria)
le20 27 7 12 27 7 12 27 7 1220ndash40 25 11 15 31 38 14 25 11 15 31 38 14 25 11 15 31 38 14
gt4016 33 13 8 17 28 23 35 34 26 9 2229 2 24 6 1 21 5 20 3 32 10 4 36
18 19 30
33 16 13 8 17 28 23 35 34 26 9 2229 2 6 24 1 21 5 20 3 32 10 4 36
18 30 19
16 33 13 8 17 28 23 35 34 26 9 2229 2 6 24 1 21 5 20 3 32 10 4 18
36 30 19
37
36
35
3433
32
31
3029
28
27
26
25
2423
22
21
20
1918
17
16
1514
13
12
11
109
8
7
6
5
4
3
2
1
(a)
38
37
36
35
3433
32
31
3029
28
27
26
25
24
23
22
21
20
1918
17
16
15
14
13
1211
109
8
7
6
4
3
2
1
5
(b)
Figure 3 Representation of clusters (Tables 3 and 5mdashpassengers and movements criteria with Euclidean distance)
According to the methodological features presented inthe previous sections the fuzzy procedure proposed heremakes it possible to take into account uncertainty andimprecision of the similarity measures by using a geometricfuzzy representation The fuzzy approach is here particularly
desirable because of the nature of the problem In factairports are complex elements and their potential cluster-ing in crisp classification procedures is not as clear asit could appear particularly when they lie on the clusterfrontier
Advances in Fuzzy Systems 11
Table 6 Clustering results without prefixing the number of clusters Criterion yearly movements
Metrics ED FHD KDCluster 1 (centre Roma FCO)
le20 30 19 18 36 30 19 18 36 30 19 18 3620ndash40 4 10 20 29 5 22 4 10 20 29 5 22 4 10 20 29 5 22
gt4026 9 37 32 3 34 21 13 17 1 16 8 3533 15 2 27 28 25 23 7 12 24 6 14 11
38 31
26 9 37 32 3 34 21 13 17 1 16 8 3533 15 2 27 28 25 23 7 12 24 6 14
38 11 31
26 9 37 32 3 34 21 13 17 1 16 8 3533 15 2 27 28 25 23 7 12 24 6 14
38 11 31Cluster 2 (centre Torino)
le20 32 3 37 32 3 37 32 3 3720ndash40 20 10 36 9 34 4 20 10 36 9 34 20 10 36 9 34
gt401 26 19 30 18 29 22 5 17 8 33 15 1316 27 14 16 12 7 11 25 35 31 38 28
2 23 24 6
4 1 26 19 18 30 29 22 5 17 8 33 1513 16 27 14 16 12 7 11 25 35 31 38
28 2 23 6 24
4 1 26 19 18 30 29 22 5 17 8 33 1513 16 14 27 16 12 7 11 25 35 31 38
28 2 23 6 24Cluster 3 (centre Lamezia Terme)
le20 17 8 34 17 8 34 17 8 3420ndash40 33 9 15 26 22 1 29 33 9 15 26 22 1 29 33 9 15 26 22 1 29
gt4021 37 3 5 20 32 10 4 14 27 36 17 3018 19 7 13 12 11 25 16 31 38 35 28
23 2 6 34
21 37 3 5 20 32 10 4 14 27 36 17 3018 19 7 13 12 11 25 16 38 31 35 28
23 6 2 34
21 37 5 3 20 32 10 4 14 27 36 17 3018 19 7 13 12 11 25 16 38 31 35 28
23 2 6 34Cluster 4 (centre Pescara)
le20 25 25 2520ndash40 7 27 38 12 31 7 27 38 12 31 7 27 38 12 31
gt4028 16 11 23 13 6 14 15 24 2 33 35 817 5 22 26 34 9 29 1 20 37 21 4 3
32 10 18 30 36 19
28 16 11 13 23 6 14 15 24 2 33 35 817 5 22 26 9 34 29 1 20 37 21 4 3
32 10 18 30 19 36
28 16 11 13 23 6 14 15 24 2 33 35 817 5 22 26 9 34 29 1 20 37 21 4 3
32 10 30 18 19 36Cluster 5 (centre Crotone)
le20 11 11 1120ndash40 32 14 31 7 27 15 32 14 31 7 27 15 32 14 31 7 27 15
gt4038 25 33 8 17 16 28 13 23 6 24 234 35 26 1 22 9 5 29 21 37 20 3 32
4 10 18 36 30 19
38 25 8 33 17 16 28 13 23 6 24 234 35 26 22 1 9 5 29 21 37 20 3 32
4 10 18 36 19 30
38 25 8 33 17 16 28 13 23 6 24 234 35 26 22 1 9 29 5 21 37 20 3 4
32 10 18 36 19 30
The second element of fuzziness concerns the representa-tion of an airport as fuzzy set In the application discussed inSection 3 only available official data have been used whichare not intrinsically fuzzy as they refer to passengers andmovements In any case the application to the test caseshowed that the fuzzy proposed procedure provides resultsin line with expectations then specific data surveys canbe further realized to test the potentiality of the proposedapproach for other clustering goals Particularly linguisticvariables representing travellersrsquo preferences can be collectedto test how users cluster airports from their point of view
To summarize the obtained clusters are coherent withthe expectations and the fuzzy clustering procedure identifiesthe airport membership uncertainty by helping planners tobetter recognize the role of an airport The two chosencriteriamdashyearly passengers andmovementsmdashin this case leadto similar results in terms of cluster composition and confirmthe relationship between carried passengers and number ofmovements
Further developments concern the use of some differentcombined criteria to verify if and how the cluster compositionmay vary and to verify the use of linguistic variables
Conflict of Interests
The authors declare that there is no conflict of interestsregarding the publication of this paper
References
[1] EUROCONTROL Trends in Air Traffic A Place to StandAirports in the European Air Network Volume 3mdashSTATFORthe EUROCONTROL Statistics and Forecast Service BrusselsBelgium 2007
[2] European Union Communication from the Commission Com-munity Guidelines on Financing of Airports and Start-Up Aid toAirlines Departing fromRegional Airports Official Journal of theEuropean Union Brussels Belgium 2005
[3] M N Postorino ldquoDevelopment of regional airports in EUrdquo inDevelopment of Regional Airports M N Postorino Ed pp 27ndash51 WIT Press (GBR) 2010
[4] ICAO Annex 14 Volume I Aerodrome Design and Operations5th edition 2009
[5] ICAO ldquoOwnership organization and regulatory practices ofairports and Air Navigation Service Providers 2007rdquo Reportdocuments 2008
12 Advances in Fuzzy Systems
[6] V Adikariwattage A G de Barros S C Wirasinghe and JRuwanpura ldquoAirport classification criteria based on passengercharacteristics and terminal sizerdquo Journal of Air TransportManagement vol 24 pp 36ndash41 2012
[7] M A Madas and K G Zografos ldquoAirport capacity vs demandmismatch or mismanagementrdquo Transportation Research PartA vol 42 no 1 pp 203ndash226 2008
[8] J Sarkis and S Talluri ldquoPerformance based clustering forbenchmarking of US airportsrdquo Transportation Research Part Avol 38 no 5 pp 329ndash346 2004
[9] G Burghouwt and J Hakfoort ldquoThe evolution of the Europeanaviation network 1990ndash1998rdquo Journal of Air Transport Manage-ment vol 7 no 5 pp 311ndash318 2001
[10] P Malighetti S Paleari and R Redondi ldquoConnectivity of theEuropean airport network ldquoSelf-help hubbingrdquo and businessimplicationsrdquo Journal of Air Transport Management vol 14 no2 pp 53ndash65 2008
[11] M N Postorino and F G Pratico ldquoAn application of the multi-criteria decision-making analysis to a regional multi-airportsystemrdquo Research in Transportation Business amp Managementvol 4 pp 44ndash52 2012
[12] SMiyamoto H Ichihashi and K Honda ldquoBasicmethods for c-means clusteringrdquo Studies in Fuzziness and Soft Computing vol229 pp 9ndash42 2008
[13] L Bai J Liang C Dang and F Cao ldquoA novel fuzzy clusteringalgorithm with between-cluster information for categoricaldatardquo Fuzzy Sets and Systems vol 215 pp 55ndash73 2013
[14] A Ghosh D K Pratihar M V V Amarnath G Dittrich andJ Mueller ldquoFuzzy clustering of mechanismsrdquo Sadhana vol 37no 5 pp 539ndash556 2012
[15] Y H Kim S C Ahn and W H Kwon ldquoComputational com-plexity of general fuzzy logic control and its simplification for aloop controllerrdquo Fuzzy Sets and Systems vol 111 no 2 pp 215ndash224 2000
[16] I Perfilieva and V Kreinovich ldquoFuzzy transform as a newparadigm in fuzzy modelingrdquo Fuzzy Sets and Systems vol 180no 1 pp 1ndash2 2011
[17] M Versaci S Calcagno F La Foresta and B Cammaroto ldquoPathloss prediction using fuzzy inference system and ellipsoidalrulesrdquo American Journal of Applied Sciences vol 9 no 12 pp1940ndash1943 2012
[18] R Redondi P Malighetti and S Paleari ldquoHub competitionand travel times in the world-wide airport networkrdquo Journal ofTransport Geography vol 19 no 6 pp 1260ndash1271 2011
[19] E Gegov M N Postorino M Atherton and F Gobet ldquoCom-munity structure detection in the evolution of the United Statesairport networkrdquo Advances in Complex Systems vol 16 no 12013
[20] D Warnock-Smith and A Potter ldquoAn exploratory study intoairport choice factors for European low-cost airlinesrdquo Journalof Air Transport Management vol 11 no 6 pp 388ndash392 2005
[21] W K Li C Miyoshi and R Pagliari ldquoDual-hub network con-nectivity an analysis of all Nippon Airwaysuse of TokyosHaneda and Narita airportsrdquo Journal of Air Transport Manage-ment vol 23 pp 12ndash16 2012
[22] J T Rickard J Aisbett G Gibbon andDMorgenthaler ldquoFuzzysubsethood for type-n fuzzy setsrdquo in Proceedings of the AnnualMeeting of the North American Fuzzy Information ProcessingSociety (NAFIPS rsquo08) New York NY USA May 2008
[23] J T Rickard J Aisbett and G Gibbon ldquoFuzzy subsethood forfuzzy sets of type-2 and generalized type-nrdquo IEEE Transactionson Fuzzy Systems vol 17 no 1 pp 50ndash60 2009
[24] F C Morabito M Versaci G Pautasso and C TichmannldquoFuzzy-neural approaches to the prediction of disruptions inASDEX upgraderdquo Nuclear Fusion vol 41 no 11 pp 1715ndash17232001
[25] B Kosko Fuzzy Engineering Prentice Hall International Edi-tions 1997
[26] ENAC httpwwwenacgovitrepositoryContentManage-mentnodeN8911329Aeroporti certificati 120927pdf
Submit your manuscripts athttpwwwhindawicom
Computer Games Technology
International Journal of
Hindawi Publishing Corporationhttpwwwhindawicom Volume 2014
Hindawi Publishing Corporationhttpwwwhindawicom Volume 2014
Distributed Sensor Networks
International Journal of
Advances in
FuzzySystems
Hindawi Publishing Corporationhttpwwwhindawicom
Volume 2014
International Journal of
ReconfigurableComputing
Hindawi Publishing Corporation httpwwwhindawicom Volume 2014
Hindawi Publishing Corporationhttpwwwhindawicom Volume 2014
Applied Computational Intelligence and Soft Computing
thinspAdvancesthinspinthinsp
Artificial Intelligence
HindawithinspPublishingthinspCorporationhttpwwwhindawicom Volumethinsp2014
Advances inSoftware EngineeringHindawi Publishing Corporationhttpwwwhindawicom Volume 2014
Hindawi Publishing Corporationhttpwwwhindawicom Volume 2014
Electrical and Computer Engineering
Journal of
Journal of
Computer Networks and Communications
Hindawi Publishing Corporationhttpwwwhindawicom Volume 2014
Hindawi Publishing Corporation
httpwwwhindawicom Volume 2014
Advances in
Multimedia
International Journal of
Biomedical Imaging
Hindawi Publishing Corporationhttpwwwhindawicom Volume 2014
ArtificialNeural Systems
Advances in
Hindawi Publishing Corporationhttpwwwhindawicom Volume 2014
RoboticsJournal of
Hindawi Publishing Corporationhttpwwwhindawicom Volume 2014
Hindawi Publishing Corporationhttpwwwhindawicom Volume 2014
Computational Intelligence and Neuroscience
Industrial EngineeringJournal of
Hindawi Publishing Corporationhttpwwwhindawicom Volume 2014
Modelling amp Simulation in EngineeringHindawi Publishing Corporation httpwwwhindawicom Volume 2014
The Scientific World JournalHindawi Publishing Corporation httpwwwhindawicom Volume 2014
Hindawi Publishing Corporationhttpwwwhindawicom Volume 2014
Human-ComputerInteraction
Advances in
Computer EngineeringAdvances in
Hindawi Publishing Corporationhttpwwwhindawicom Volume 2014
2 Advances in Fuzzy Systems
various purposes Although criteria and purposes can bevery different however two important aims are (1) theidentification of potential substitute nodes in the air networkand (2) the identification of crucial nodes in the airportnetwork to invest or allocate resources In the first case alsoreal time features may be relevant For example if unexpectedevents such as volcanic eruptions or severe meteorologicalconditions prevent using one or more airports potentialsubstitute nodes having similar characteristics should beidentified in very short time In the second case uncertaintyaspects may play a significant role because whatever the clas-sification procedures are one airport cannot be consideredabsolutely similar to another one but only similar to a givenextent
In the literature some studies dealt with airport classifica-tion to select categories with comparable passenger terminalsystems [6] to examine alternative slot allocation strategies[7] or operational efficiency [8] to study the evolution of theEuropean aviation network [9] to identify strategic groupssharing common attributesroles or to identify airport rank-ings [10 11]
In the above works traditional clustering techniques havebeen used however they have a high computational com-plexity and are unsuitable for real time applications Fur-thermore they do not fully consider imprecision due to theinherent difficulty in gathering entities that differ amongthem because of the context and the peculiarity of eachof them independently of the data used to identify theirsimilarities
The goal of this paper is to propose a general procedureto cluster airportsmdashaccording to one or more factors mea-suring their characteristicsmdashby using a fuzzy approach [12ndash14] In fact if real time and imprecision features representkey factors fuzzy systems could help to identify the bettermethodology with short computing time [15ndash17]
The common characteristics of groups of airports haveto be set but the features of each airport have to be definedso as to verify which group it belongs to This problem canbe defined as a classification issue where the key factor isthe distance from the airport cluster centres Here the clas-sification problem is in fact defined from a fuzzy geometricpoint of view where each airport is represented by a fuzzyset depending on some parameters The fuzzy nature of theproblem however is not identified in the airport in itselfbut mainly in the distance among similar airports In otherwords similarities among airports can be measured by adistance that have an intrinsic fuzzy nature In fact eachairport has different characteristics and can develop differentlevels which make it a unique entity Then the similaritymeasure among such entities is not a crisp value
The fuzzy cluster approach proposed here as alternativemethod with respect to other crisp approaches is based onthe potentiality it can offer when two aspects of fuzzinessare considered The first one concerns the identification ofan airport as a fuzzy set then not only numerical values butalso linguistic variables can be used to describe itThe secondaspect concerns the distancemdashconsidered as fuzzy quantitymdashthat measures the similarity between couples of airports
Finally it is worthwhile to note that the goal of this paper isnot to discuss the implications of clusters obtained by usingone or more specific criteria but to set the fuzzy procedureand then test it on a real case However since different criteriacan give very different clusters some of the most relevantcriteria are briefly described in the next section in order togive an overview according to several points of view
The paper is organized as follows Section 2 and its sub-sections describe the role of airports and the way to deal withit an overview of the proposed fuzzy geometric approachdeveloped in terms of fuzzy subsethood operator and itsformalization for the examined problem Section 3 describesthe results obtained on a test case and Section 4 summarizessome conclusions
2 Materials and Methods
21 Airport Roles and Clustering Criteria In densely popu-lated areas such as the EU many airports are located at arelatively short distance among them Particularly regionalairports are often close to each other and are faced with eithercooperationintegration or competition strategies amongthem Hubs or community airports too are not exempt fromthis challenge and the evolution of airport networks is also anindirect effect of different strategies [18 19]
In these situations classifications are important to iden-tify similar airports from some points of view Generallyspeaking airports are complex entities due to the severalinvolved actors whose needs and expectations could bedifferent The interaction among actors produces the airportoutcome often identified as the number of yearly handledpassengers or movements
Travellers and airlines are two important actors and alsousers of the airport managed by an airport operator Accord-ing to the distinction between landside and airside airportservices and facilities for travellers and airlines have to bedistinguished (Figure 1)
For travellers services mainly refer to (i) airport-relatedservices (eg waiting time to check-in and for security con-trols baggage delivery airport commercial activities and carparking area availability) (ii) services offered as the result ofairport operators and local authoritiestransport companiesagreements (eg busrail services fromto main cities) and(iii) services resulting from the interaction between airportoperators and airlines (eg served destinations flight fre-quency and hub connection) For airlines services mainlyrefer to (i) navigation aid services (eg ILS VOR) and(ii) handling (eg refuelling cabin cleaning and baggageservices among the most relevant services)
Finally facilities mainly refer to parking areas and pas-senger terminal (landside) and runways taxiway and aprons(airside)
While the list above cannot be considered complete how-ever there are several points of view to cluster airports onthe basis of some criteria such as level-of-service variablestravellersrsquo preferences and airport facilities
Travellers perceive similar airports according to theirtravel experiences The main key factors are level-of-service
Advances in Fuzzy Systems 3
Travellers
Traveller services
Landside
Airportoperators
Airport
Airline servicesAirlines
Airside
Served destinations
Air services
Figure 1 Relationships linking airport operators airlines and travellers with respect to the airport
variables as described before involving both airports andairlines and services offered by local transport companiesClusters based on travellersrsquo preferences can be usefulfor airport development policies in competitive marketsFurthermore public plannersmdashas governments and localauthoritiesmdashmay also represent the travellersrsquo point of viewto some extent because they guarantee social wellness andthe interests of their communities In this light they areinterested in classifying and ranking airports to identifynationalinternational airport network strategic nodes thatguarantee accessibility to people also living in decentralizedregions (EU TEN-T Policy review) Finally airlines chooseairports for their network according to the services andfacilities they offer with respect to their fleet compositionrequirements the network type (eg hub-and-spoke versuspoint-to-point types) and the expected travel demand in theairport catchment areas [20 21]
The key factors to identify similar airports are then dif-ferent according to the point of view although in some casestheymay lead to similar clusters As an example community-airport clusters obtained on the basis of the yearly passengertrafficmdashmore than 10 million according to the EU [2]mdashprobably correspond to hub-airport clusters where servicesand facilities are the discriminating factors
To express formally the problem the vector X119894(X119894=
119909119894119895) characterizes the airport 119894 with respect to a given point
of view so that the performances of 119894 are represented by119860119894= 119860(X
119894) where 119860(X
119894) is a scalar function of some chara-
cteristics X119894defined in R In the simplest case X
119894is a 1 times 1
vector and corresponds to a single key factorClassifications can be realized in two ways (1) by fixing
themaximumnumber of clusters119870 that have to be identifiedaccording to some compulsory classes or identified categories(eg as in official classifications by ICAO and EU) and (2)without fixing the maximum number of classes that can beobtained
In both cases each cluster should gather ldquosimilarrdquo entitieswhosemembership could not be unique if they lie on the clus-ter frontierThere are some reasons thatmake the use of fuzzyapproaches attractive as alternative methods with respect tocrisp ones First ldquosimilarityrdquo between airports does not cor-respond to ldquoidentityrdquo and then the problem can be well rep-resented by using a fuzzy approach particularly a geometric
one where ldquosimilarityrdquo is translated in terms of distance ina certain space Shortly by using fuzzy logic each airportcan be thought of as a fuzzy set Further a fuzzy setmdashandthen an airportmdashcan be represented by a point in a given119899-dimensional metric spacemdashnot necessarily Euclideanmdashwhere 119899 is the number of features extractable from an airportldquoSimilaritiesrdquo among airports are assessable by distancesamongpoints For a given couple of airports themore the dis-tance between them the more the differences and vice versaGenerally each airport has some specific characteristics thatmake it a unique entity Furthermore most of the airportcharacteristics have not fixed reference threshold values andthey may vary within some undefined limits Then distancemeasures vary continuously in the given space for eachcouple of airports and can be identified by a fuzzy quantityrepresented by fuzzy values Finally while the membershipof airports close to each othermdashand then close to the clustercentremdashis clear the same cannot be said for airports lying onthe frontier and whose membership is more uncertain Thefuzzy approach can well represent such situations
The next section describes the mathematical aspect of thefuzzy geometric approach applied to cluster similar entities
22 Geometric Point of View of Fuzzy Classification Prob-lem It is known that a fuzzy set 119860 can be considered asan abstract quantity containing other ones Membershipfunctions which characterize a fuzzy set are consideredthe kernel of mapping between objects and point elementsbelonging to [0 1] However in another perspective a fuzzyset can be viewed from a geometric point of view In otherwords a fuzzy set119860 can be considered a point in a given space(Figure 2) whose metric is defined as
1198891199042= 119892119894119896119889119909119894119889119909119896 (1)
119892119894119896being the so-called metrical tensor Then in the given
space the distance among points can be calculated as
119889119904 = radic119892119894119896119889119909119894119889119909119896
119904 = int119889119904 = intradic119892119894119896119889119909119894119889119909119896
(2)
4 Advances in Fuzzy Systems
00
02
04
06
08
10
00 00
02
0406
0805
A
10
10
Figure 2 Representation of a fuzzy set119860within the unit-hypercube
Since 1198891199042 is invariant as regards changes of the coordinatesystemmdashfrom 119909119894 to 1199091015840119894mdashsuch that 1198891199042 = 119889119904
10158402 then the 119899-dimensional Euclidean space R119899 can be used to computedistances Since it occurs that
119892119894119896= 120575119894119896= (
1 sdot sdot sdot 0 d
0 sdot sdot sdot 1
) (3)
then (1) can be written as
1198891199042= (119889119909
1)2
+ (1198891199092)2
+ sdot sdot sdot + (119889119909119899)2 (4)
By using the Einstein convention (4) can also be written as
1198891199042= (119889119909
119894)2
119894 = 1 119899 (5)
Then the distance between two fuzzy sets (or points) 119860 and119861 119889(119860 119861) in the 119899-dimensional Euclidean space is given bythe length of the line connecting119860 and 119861 When the problemunder study is characterized bymany variables a fuzzy set canbe thought of as a point inside a unit-hypercube inwhich eachside is an unitary intervalmdashsince fuzzified point elementsbelong to [0 1]
If 119899 is the number of variables 2119899 corners of the unit-hypercube represents crisp subsets fuzzy subsets are locatedinside the unit-hypercube
In particular Cartesian coordinates of each point inthe unit-hypercube are computed as fuzzified quantities119891119860(119909119895) The geometric formulation of fuzzy sets together
with subsethood operators [22 23] can play a crucial role asregards detection and classification problems The basic ideais that a fuzzy set119860may be to some extent a subset of a fuzzyset 119861 When dealing with classification problems subsethoodoperators can identify howmuch a fuzzy set119860 is belonging tothe class represented by the fuzzy set 119861 in the unit-hypercubeThis geometric fuzzy approach has been already applied tosome classification problems and compared with some otherfuzzy clustering approaches [24] However it has not been
applied in the field of transportation yet In addition withrespect to canonical fuzzy approaches already tested in theliterature the proposed geometrical approach is formulated ina space sized on features extracted directly from the airportcharacteristics leading to the graphic translation of the clus-tering problem easily perceived even by nonexperts (pointsinside unit-hypercube) Obviously appropriate choices ofadditional space (non-Euclidean) otherwise defined hereinmay help in the study of sets of airports with a high degreeof overlap of features
In this study the points in the unit-hypercube are airportsthat have to be classifiedThe airport classification is obtainedby identifying if and how much the fuzzy set 119860mdashunclassifiedairportmdashbelongs to the fuzzy set 119861 representing a referencecategory of airports
To describe the mathematical formulation let 119878(119860 119861) bethe subsethood operator 119878(119860 119861) can be computed as follows
119878 (119860 119861) = 1 minussum119899
119895=1max [0 119891119860 (119909
119895) minus 119891119861 (119909
119895)]
119872 (119860) (6)
where119872(119860) is the distance 119889(119860 119861) Three types of distancesare considered here
(a) the Euclidean distance 119889euclidean(119860 119861)
119872(119860)2= 119889euclidean(119860 119861)
2= (119909119894)2
= (119891119860(119909119894) minus 119891119861(119909119894))2
(7)
(b) the fuzzy-Hamming distance 119889Hamming(119860 119861)
119872(119860) = 119889Hamming (119860 119861) =119899
sum119894=1
119909119894=
119899
sum119894=1
10038161003816100381610038161003816119891119860(119909119894) minus 119891119861(119909119894)10038161003816100381610038161003816
(8)
(c) the Kacprzyk distance 119889Kacprzyk(119860 119861)
119872(119860) = 119889Kacprzyk (119860 119861) =119899
sum119894=1
119909119894=
119899
sum119894=1
10038161003816100381610038161003816119891119860(119909119894) minus 119891119861(119909119894)10038161003816100381610038161003816
2
(9)
It is easy to see that 119878(119860 119861) le 1 and 119878(119861 119860) = 1 minus 119878(119860 119861)Since 119878(119860 119861) measures how much 119860 is contained in 119861
119878(119861 119860)measures how much 119861 is contained in119860To summarize reference categories of airports are points
in the unit-hypercube and the positions of unclassified air-ports are identified as distance measures with respect to eachknown class of airports by using the subsethood operatorThe following section explains in detail the classificationprocedure
23 The Proposed Classification Procedure According to thefirst classification criterion that is by fixing the maximumnumber of clusters the basic idea of the proposed procedurestarts from the consideration that the airport class 119896 isdescribed by some parameters ranges As showed by dataairports with fixed characteristics have parameters values
Advances in Fuzzy Systems 5
(average standard deviation skewness and kurtosis) fallinginto particular ranges Then for each class 119896 the averagestandard deviation skewness and kurtosis values (labeled asAv119896 St119896 Sk119896 andKu119896 resp) are computed and the followingtridimensional matrix 119885 is obtained
119885 =
[[[[[
[
Av1 (119895) St1 (119895) Sk1 (119895) Ku1 (119895)sdot sdot sdot sdot sdot sdot sdot sdot sdot sdot sdot sdot
sdot sdot sdot sdot sdot sdot sdot sdot sdot sdot sdot sdot
Av119896 (119895) St119896 (119895) Sk119896 (119895) Ku119896 (119895)
]]]]]
]
(10)
The number of rows119870 is equal to the number of classes thenumber of columns is equal to the number of parametersThethird dimension refers to the number of values available foreach parameter and for each class 119896 for example yearly orseasonal values To describe the fuzzy clustering procedurewhen the number of classes is fixed a priori 119870 = 4 hasbeen chosen because it is the same number of classes adoptedby the EU to classify airports as regards the yearly handledpassengers Note that the choice of119870 = 4must be consideredonly an example although it refers to a real case and it does
not affect the generality of the procedure Then the matrix 119885is specified as
119885 =[[[
[
Av1 (119895) St1 (119895) Sk1 (119895) Ku1 (119895)Av2 (119895) St2 (119895) Sk2 (119895) Ku2 (119895)Av3 (119895) St3 (119895) Sk3 (119895) Ku3 (119895)Av4 (119895) St4 (119895) Sk4 (119895) Ku4 (119895)
]]]
]
(11)
Two matrices min(119885) and max(119885) which represent respec-tively the matrices with the max and min values of theparameters are also defined
119885 =[[[
[
minAv1 (119895) min St1 (119895) min Sk1 (119895) minKu1 (119895)minAv2 (119895) min St2 (119895) min Sk2 (119895) minKu2 (119895)minAv3 (119895) min St3 (119895) min Sk3 (119895) minKu3 (119895)minAv4 (119895) min St4 (119895) min Sk4 (119895) minKu4 (119895)
]]]
]
119885 =[[[
[
maxAv1 (119895) max St1 (119895) max Sk1 (119895) maxKu1 (119895)maxAv2 (119895) max St2 (119895) max Sk2 (119895) maxKu2 (119895)maxAv3 (119895) max St3 (119895) max Sk3 (119895) maxKu3 (119895)maxAv4 (119895) max St4 (119895) max Sk4 (119895) maxKu4 (119895)
]]]
]
(12)
Finally the matrix 1198851015840 whose generic element is the interval[min(119885) max(119885)] is computed as follows
119885 =
[[[[[[[[[
[
[minAv1 (119895) maxAv1 (119895)] [min St1 (119895) max St1 (119895)] [min Sk1 (119895) max Sk1 (119895)] [minKu1 (119895) maxKu1 (119895)]
[minAv2 (119895) maxAv2 (119895)] [min St2 (119895) max St2 (119895)] [min Sk2 (119895) max Sk2 (119895)] [minKu2 (119895) maxKu2 (119895)]
[minAv3 (119895) maxAv3 (119895)] [min St3 (119895) max St3 (119895)] [min Sk3 (119895) max Sk3 (119895)] [minKu3 (119895) maxKu3 (119895)]
[minAv4 (119895) maxAv4 (119895)] [min St4 (119895) max St4 (119895)] [min Sk4 (119895) max Sk4 (119895)] [minKu4 (119895) maxKu4 (119895)]
]]]]]]]]]
]
(13)
The fuzzification step leads to treating eachelement of 1198851015840[min(Statistical Parameter119896(119895)) max(Statistical Parameter119896(119895))] by means of a suitable shapedfunction into the interval [0 1] Here a sigmoid function hasbeen chosen because of its very good smooth propertiesHowever other typologies of functions can also beconsidered
Definitively (14) shows the formulation of the fuzzifi-cation step Each range of possible values of the statisticalparameters is ldquotranslatedrdquo into a fuzzified range
119891 (1198851015840(119903 119904))
= [1
1 + 119890minus119885119896(inf(119885119896(119903119904))minus119867119896)
1
1 + 119890minus119885119896(sup(119885119896(119903119904))minus119867119896)
]
(14)
with 119903 119904 generic row and column of matrix 1198851015840 and 119878119896 119867119896suitable sigmoidal parameters (referred to as each 119896th airport
class) located as a fuzzy range inside the 4-dimensional unit-hypercube
If some satellite subclasses belong to a given class 119896then the subclasses have to be included into the macroclassrepresenting all the others Then the fuzzified range iscomputed as
[minsub-classes (119891 (min (119885 (119903 119904))))
maxsub-classes (119891 (min (119885 (119903 119904))))] (15)
If 119884 is a new airport that has to be classified the vector Y ofits parameters is
Y = lfloorAv119896 St119896 Sk119896Ku119896rfloor (16)
and it is fuzzified by using a sigmoid function as
119891 (Y (ℎ)) = 1
1 + 119890minus119904(Y(ℎ)) ℎ = 1 2 3 4 (17)
where 119891(Y(ℎ)) is a point inside the 4-dimensional unit-hypercube Then the quantity
119878 (119891 (Y (ℎ)) 119891 (maxsub classes (119891 (min (119885 (119903 119904)))))) (18)
6 Advances in Fuzzy Systems
Table 1 Commercial airports in Italy (reference year 2012 source httpwwwassaeroportiitcategorystatistiche)
1 Alghero AHO 2 Ancona AOI 3 Bari BRI 4 Bergamo BGY 5 Bologna BLQ 6 Bolzano BZO
7 Brescia VBS 8 Brindisi BDS 9 Cagliari CAG 10 Catania CTA 11 Crotone CRV 12 Cuneo CUF
13 Firenze FLR 14 Foggia FOG 15 Forlı FRL 16 Genova GOA 17 Lamezia Terme SUF 18 Milano Linate LIN
19 MilanoMalpensa MXP
20 Napoli NAP 21 Olbia OLB 22 Palermo PMO 23 Parma PMF 24 Perugia PEG
25 Pescara PSR 26 Pisa PSA 27 Reggio Calabria REG 28 Rimini RMI 29 Roma Ciampino CIA 30 Roma Fiumicino FCO
31 Siena SAY 32 Torino TRN 33 Trapani TS 34 Treviso TSF 35 Trieste TRS 36 Venezia VCE
37 Verona VRN 38 Grosseto GRS
is computed as explained in (3) If the above quantity is closerto unity the new airport likely belongs to the class 119896 and
max119896119878 (119891 (Y (ℎ)) 119891 (maxsub classes (119891 (min (119885 (119903 119904))))))
(19)
identifies the membership class In this case there are threesubsethood operators [25] each one defined by a differentmetric
The same procedure can be used to identify clusterswithout fixing a priori their maximum numbers In fact
(1) If 119884 is the first examined airport its vector Y ofparameters is
Y = lfloorAv119896 St119896 Sk119896Ku119896rfloor (20)
Y is fuzzified by using a sigmoid function (17)
119891 (Y (ℎ)) = 1
1 + 119890minus119904(Y(ℎ)) ℎ = 1 2 119870 (21)
and the airport 119884 is a single point inside the unit-hypercube (cluster I)
(2) If 1198841015840 is the second examined airport its vector Y1015840 ofparameters is
Y1015840 = lfloorAv1198961015840
St1198961015840
Sk1198961015840
Ku1198961015840
rfloor (22)
Y1015840 is fuzzified by using a sigmoid function (17)
119891 (Y1015840 (ℎ)) = 1
1 + 119890minus119904(Y1015840(ℎ)) ℎ = 1 2 119870 (23)
and the airport 1198841015840 is another point inside the unit-hypercube (cluster II)
(3) If 11988410158401015840 is the third examined airport its vector Y10158401015840 ofparameters is
Y10158401015840 = lfloorAv11989610158401015840
St11989610158401015840
Sk11989610158401015840
Ku11989610158401015840
rfloor (24)
Y10158401015840 is fuzzified by using a sigmoid function (17)
119891 (Y10158401015840 (ℎ)) = 1
1 + 119890minus119904(Y10158401015840(ℎ)) ℎ = 1 2 119870 (25)
and the airport 11988410158401015840 is another point inside the unit-hypercube
(4) The values of 119878(11988410158401015840 119884) and 119878(1198841015840 119884) are then com-puted If their values are greater than a prefixedthreshold a third cluster is identified otherwisethe minimum value between those ones identifiesthe airport membership to its class The procedurecontinues until the last airport has been examined
3 Application to a Test Case
The procedure described in the previous sections has beenapplied to the Italian airport system According to theNational Authority forCivil Aviation [26] in Italy there are 45certified commercial airports However at year 2013 only 38are included in the official figures (Table 1) because the othershandle an insufficient number of passengers In Table 1 theairports are identified with a numerical label the name of themain city they serve and the IATA code
As discussed in Section 2 the criteria to classify airportscan vary according to both the point of view and the goal to beachieved It is worthwhile to note that the aim of the paper isto present and then test the airport clustering fuzzy geometricapproach based on the concept of ldquosimilarityrdquo as fuzzy dis-tance rather than providing specific policy recommendationson the basis of the application to the test case In this lightamong the several and various criteria that can be identifiedthe ones considered here are based on data available atnational level and provided by the Association of Italian Air-ports (Assaeroporti httpwwwassaeroportiit) The choiceof such data to cluster airports has also beenmotivated by thecurrent policy adopted by the Italian government to identifythe relevant airports for the Italian airport network Particu-larly the official data used here as classification criteria referto the yearly number of movements and handled passengersThe chosen criteria take into account the airport dimensionsIf data are available other criteria such as served destinationsor airport connectivity could take into account the airportattractiveness
According to the procedure described in Section 4the airport is represented by a fuzzy set and then yearlypassengers and movements values have been fuzzified(Table 2) The number in the first row corresponds to theairport numerical label as in Table 1 The ranges reported in
Advances in Fuzzy Systems 7
Table 2 Yearly ranges (15) for each airport coded as in Table 1
Airport Criterion 1movements
Criterion 2passengers
1 0ndash0461 0ndash06422 0ndash0481 0ndash03873 0ndash0559 0ndash05444 0ndash0388 0ndash03725 0ndash0421 0ndash04396 0ndash0313 0ndash03457 0ndash0291 0ndash03098 0ndash0297 0ndash03449 0ndash0355 0ndash039010 0ndash0581 0ndash061411 0ndash0142 0ndash013412 0ndash0172 0ndash017713 0ndash0422 0ndash042914 0ndash0296 0ndash029815 0ndash0219 0ndash024516 0ndash0381 0ndash040117 0ndash0237 0ndash024918 0ndash0538 0ndash053419 0ndash0804 0ndash081020 0ndash0632 0ndash065421 0ndash0415 0ndash039022 0ndash0458 0ndash046523 0ndash0312 0ndash034124 0ndash0311 0ndash028625 0ndash0388 0ndash038626 0ndash0387 0ndash039927 0ndash0314 0ndash038728 0ndash0465 0ndash043229 0ndash0481 0ndash051130 0ndash0801 0ndash084331 0ndash0180 0ndash020832 0ndash0625 0ndash060733 0ndash0219 0ndash021834 0ndash0230 0ndash020135 0ndash0314 0ndash031836 0ndash0514 0ndash048337 0ndash0415 0ndash042938 0ndash0172 0ndash0194
Table 2 have been obtained by using (15) here reported forclarity
ranges [minsubclasses (119891 (min gt (119885 (119903 119904))))
maxsubclasses (119891 (min (119885 (119903 119904))))] (26)
Although the used data could not be considered intrinsicallyfuzzy however other kinds of data could be such as travellersrsquo
preferences also expressed as linguistic variables or level-of-service variables As already stated the goal of the paper is totest the proposed approach by using available datamdashin thiscase the ones available from the above official sources
According to the general relationship 119860119894= 119860(X
119894) des-
cribed in Section 2 the experiments realized here refer to thesimplest case where X
119894is a single key factor (or criterion)
particularly the yearly number of passengers and the yearlynumber of movements
8 Advances in Fuzzy Systems
Table 3 Clustering results with prefixed number of clusters Criterion yearly passengers
Metrics ED FHD KDCluster 1 (centre Roma FCO)
le20 30 19 18 4 36 30 19 18 4 30 19 18 420ndash40 10 20 29 5 22 26 9 36 10 20 29 5 22 26 36 10 20 29 5 22
gt40 32 37 3 34 21 13 17 1 16 8 35 33 152 27 25 28 23 7 12 24 6 14 11 38 31
9 32 37 3 34 21 13 17 1 16 8 35 3315 2 27 25 28 23 7 12 24 6 14 11 38
31
9 26 32 37 3 34 21 13 17 1 16 8 3533 15 2 27 25 28 23 7 12 24 6 14 11
38 31Cluster 2 (centre Napoli Capodichino)
le20 20 10 20 10 20 1020ndash40 9 32 36 37 4 26 36 3 29 22 9 32 36 37 4 26 36 3 29 22 9 32 36 37 4 26 36 3 29 22
gt4018 30 19 26 5 21
17 8 1 33 13 15 16 27 14 35 12 7 112 28 31 23 38 24 6
18 30 19 26 521 17 8 1 33 13 15 16 27 14 35 12 7
11 2 28 31 23 38 24 6
18 30 19 26 521 8 1 33 13 15 16 27 14 35 12 7 11
2 28 31 23 38 24 6Cluster 3 (centre Lamezia Terme)
le20 17 8 34 17 8 34 17 8 3420ndash40 33 9 15 26 22 1 33 9 15 26 22 33 9 15 26 22
gt4029 37 21 3 5 20 32 10 4 14 27 36 1718 30 19 7 12 13 11 25 16 31 38 35
28 23 2 6 34
1 29 37 21 3 5 20 32 10 4 14 27 3617 18 30 19 7 12 13 11 25 16 31 38
35 28 23 2 6 34
1 29 37 21 3 5 20 32 10 4 14 27 3617 18 30 19 7 12 13 11 25 16 31 38
35 28 23 2 6 34Cluster 4 (centre Reggio Calabria)
le20 27 7 12 27 7 12 27 7 1220ndash40 25 11 15 31 38 14 25 11 15 31 38 25 11 15 31 38
gt4033 16 13 8 17 28 23 35 34 26 9 2229 2 6 24 1 21 5 20 3 32 10 4 36
18 30 19
14 33 16 13 8 17 28 23 35 34 26 922 29 2 6 24 1 21 5 20 3 32 10 4
36 18 30 19
14 33 16 13 8 17 28 23 35 34 26 922 29 2 6 24 1 21 5 20 3 32 10 4
36 18 30 19
As regards the two classification procedures described inSection 4 the airport clusters have been obtained by fixingthemaximumnumber of classes (Tables 3 and 5) and withoutfixing the number of classes (Tables 4 and 6) Furthermorethe three distance metrics (Euclidean ED fuzzy-HammingFHD and Kacprzyk KD) have been used to identify theclusters
In Tables 3 and 4 for each cluster and for each metric thefirst list (in row) of airports refers to the closest airports asregards the cluster centre Particularly they are in the rangeof 20of themax-min intervalThe second list refers to thoseairports that are farther from the cluster centre and are in therange between 20 and 40 of themax-min interval Finallythe third list refers to airports that are quite far from the centreand outside the range of 40 of the max-min interval
From Tables 3ndash6 it can be seen that the three metricsprovide rather similar results in terms of group membershipalthough as expected some differences can be seen in termsof distance from the centre clusters In fact according tothe metrics the same elements may be farther or closer tothe cluster centre but the group composition is practicallyidentical
Figure 3 summarizes the group composition with refer-ence to passengers and movements with Euclidean distance(see Tables 3 and 5 first column) and provides an overview ofthe cluster overlaps
For each cluster identified by a circle the two areas ineach circle identify the first two subsets within the cluster
(Tables 3ndash6) In other words they reproduce the airport listsas regards the distance from the centre (le20of themax-mininterval between 20 and 40 of themax-min interval)Theelements outside the circles represent those whose distanceis greater than 40 of the max-min interval The elementsclosest to the cluster centre are in the grey circle while theothers are located inside the black circle (and outside the greyone) or outside the black circle according to their distancefrom the centre
Elements in shared areas represent airports that couldbe located in more clusters according to a crisp distancethreshold In other words the cluster membership obtainedas a result of a fuzzy approach makes it possible to identifyclustering uncertainty for elements farther from the centre
The airports outside the black circles can be consideredmarginal within each cluster and significantly different fromthe cluster centre while the ones between the grey and blackcircles do not belong undoubtedly to the cluster but at thesame time are not so different from the ones in the grey circle
Shared areas among clusters are the consequence of thethree subsets identified within each cluster In fact someairports can belong to different clusters with different mem-bership values This is one of the fuzzy approach advantageswhen grouping complex entities like airports In fact itis practically impossible to build homogeneous clusters ofairports that have exactly the same characteristics or are justslightly different but it is possible to find similarities to acertain extent As regards the goal to identify the relevant
Advances in Fuzzy Systems 9
Table 4 Clustering results without prefixing the number of clusters Criterion yearly passengers
Metrics ED FHD KDCluster 1 (centre Roma FCO)
le20 30 19 18 36 30 19 18 36 30 19 18 36
20ndash40 4 10 20 29 5 22 26 9 4 10 20 29 5 22 9 26 4 10 20 29 5 9 22 26
gt40 37 32 3 34 21 13 17 1 16 8 35 33 152 27 25 28 23 7 12 24 6 14 11 31 38
37 32 3 34 21 13 17 1 16 8 35 33 152 27 25 28 23 7 12 24 6 14 11 38 31
37 32 3 34 21 13 17 1 16 8 35 33 1527 2 25 28 23 7 12 24 6 14 38 11 31
Cluster 2 (centre Bologna)
le20 5 29 22 5 29 22 5 29 22
20ndash40 26 4 18 9 13 30 10 19 20 26 4 18 9 13 30 10 20 19 26 4 18 9 13 30 20 10 19
gt40 36 34 16 17 8 32 15 37 3 27 12 1 1621 7 25 35 14 12 28 2 23 31 38 24 6
36 34 16 8 17 32 15 37 3 27 12 1 1621 7 25 35 12 14 28 2 23 31 38 6 24
36 34 8 16 17 32 15 37 3 27 12 1 1621 25 7 35 12 14 28 2 23 31 6 38 24
Cluster 3 (centre Alghero)
le20 1 1 1
20ndash40 21 34 37 3 17 8 32 20 9 15 10 21 34 37 3 17 8 32 20 9 15 21 34 37 3 17 8 32 20 9 15
gt4036 26 29 4 22 18 15 14 30 19 5 1112 27 7 13 16 25 31 35 38 28 23 2 6
24
10 36 26 29 4 22 18 15 14 30 19 511 12 27 7 13 16 25 31 35 38 28 23
2 24 6
10 36 29 26 4 22 18 15 30 14 19 511 12 27 7 13 16 25 31 35 38 28 23
24 2 6Cluster 4 (centre Reggio Calabria)
le20 27 7 12 27 7 12 27 7 12
20ndash40 25 11 15 31 38 14 25 11 15 31 14 38 25 11 15 31 38 14
gt4033 16 13 8 17 28 23 35 34 26 9 2229 2 6 24 1 21 5 20 3 32 10 4 36
18 30 19
16 33 13 8 17 28 23 35 34 26 9 2229 2 6 24 1 21 5 20 3 32 10 4 36
18 19 30
33 16 1317 8 28 23 35 34 26 9 2229 2 6 24 1 21 5 20 3 32 10 4 18
30 30 19Cluster 5 (centre Siena)
le20 31 31 31
20ndash40 38 7 12 11 25 27 38 7 12 11 25 38 7 12 11 25 27
gt4014 15 28 6 24 23 33 2 16 8 13 17 3534 26 22 5 1 9 29 20 21 37 3 32 10
4 18 36 30 19
27 14 15 28 6 24 23 33 2 16 8 13 1735 34 26 5 22 1 9 20 29 21 37 3 32
10 4 18 36 19 30
14 15 28 24 6 23 33 2 16 8 13 17 3534 26 5 22 1 9 20 29 21 37 3 32 10
4 18 19 36 30
airports for the Italian airport network airports in sharedareas can be rightly examined within the national context bysuitably taking into account their characteristics within oneor more clusters
As for the two classification proceduresmdashwith and with-out prefixed number of clustersmdashas expected the secondone provides more homogeneous results in terms of thesimilarity of airports belonging to the same cluster In factwhen themaximumnumber of clusters is not fixed the groupsare formed by entities that are more homogeneous At theextreme case there are as many clusters as objects to begrouped then each entity is considered different from theother ones
The use of two clustering criteria (yearly passengers andmovements) in this case provides similar results (Figure 3) Infact generally there is a direct relationship between carriedpassengers and number of movements although in somesituations the number of airport movements can also be dueto other general aviation segments (eg military operationscargo movements) Then these results are in line with what
is expected in principle because of the relationship betweenpassengers and movements
4 Conclusions and Perspectives
In this work a fuzzy-based cluster procedure has been pro-posed to classify airports Particularly the concept of unit-hypercube has been used to recognize the airport clustermembership on the basis of some airport statistical parame-ters computed by using official data As discussed the choiceof criteria depends on the classification goal and this is animportant aspect However the paper focuses on the fuzzyclustering approach rather than on the choice of criteriathese latter depend on several points of view and have severalpolicy implications The main goal of the paper was in factto test the fuzzy geometric approach as alternative methodwith respect to crisp ones rather than providing specificpolicy recommendations for airport selection or discussingclassification implications by using different criteria
10 Advances in Fuzzy Systems
Table 5 Clustering results with prefixed number of clusters Criterion yearly movements
Metrics ED FHD KDCluster 1 (centre Roma FCO)
le20 30 19 18 36 30 19 18 36 30 19 18 3620ndash40 4 10 20 29 5 22 26 4 10 20 29 5 22 26 4 10 20 29 5 22 26
gt409 37 32 3 34 21 13 17 1 16 8 35 3315 2 27 25 28 23 7 12 24 6 14 11 31
38
37 9 32 3 34 21 13 17 1 16 8 35 3315 2 27 25 28 23 7 12 24 6 14 11 38
31
9 32 37 3 34 21 13 17 1 16 8 35 3315 2 27 25 28 23 7 12 24 6 14 38 11
31Cluster 2 (centre Napoli Capodichino)
le20 20 10 20 10 20 10
20ndash40 32 9 36 37 4 26 36 3 29 22 18 3019 26 5 17
32 9 36 37 4 26 36 3 29 22 18 3019 26 17 5 21
9 32 36 37 4 26 36 3 29 22 18 3019 26 17 5 21 8
gt40 21 8 1 33 13 15 16 27 14 35 12 7 112 28 31 23 38 24 6
8 1 33 13 15 16 27 14 35 12 7 11 228 31 23 38 6 24
1 33 13 15 16 27 14 35 12 7 11 2 2831 23 38 6 24
Cluster 3 (centre Lamezia Terme)le20 17 8 34 17 8 34 17 8 3420ndash40 33 9 15 26 22 1 29 33 9 15 26 22 1 29 33 9 15 26 22 1 29
gt4021 37 3 5 20 32 10 4 14 27 36 17 3018 19 7 12 13 11 25 16 31 38 35 28
23 2 34 6
21 37 3 5 20 32 10 4 14 27 36 17 3018 19 7 12 11 13 25 16 31 38 35 28
23 34 2 6
37 21 3 5 20 32 10 4 14 27 36 17 3018 19 7 12 11 13 25 16 31 38 35 28
23 34 6 2Cluster 4 (centre Reggio Calabria)
le20 27 7 12 27 7 12 27 7 1220ndash40 25 11 15 31 38 14 25 11 15 31 38 14 25 11 15 31 38 14
gt4016 33 13 8 17 28 23 35 34 26 9 2229 2 24 6 1 21 5 20 3 32 10 4 36
18 19 30
33 16 13 8 17 28 23 35 34 26 9 2229 2 6 24 1 21 5 20 3 32 10 4 36
18 30 19
16 33 13 8 17 28 23 35 34 26 9 2229 2 6 24 1 21 5 20 3 32 10 4 18
36 30 19
37
36
35
3433
32
31
3029
28
27
26
25
2423
22
21
20
1918
17
16
1514
13
12
11
109
8
7
6
5
4
3
2
1
(a)
38
37
36
35
3433
32
31
3029
28
27
26
25
24
23
22
21
20
1918
17
16
15
14
13
1211
109
8
7
6
4
3
2
1
5
(b)
Figure 3 Representation of clusters (Tables 3 and 5mdashpassengers and movements criteria with Euclidean distance)
According to the methodological features presented inthe previous sections the fuzzy procedure proposed heremakes it possible to take into account uncertainty andimprecision of the similarity measures by using a geometricfuzzy representation The fuzzy approach is here particularly
desirable because of the nature of the problem In factairports are complex elements and their potential cluster-ing in crisp classification procedures is not as clear asit could appear particularly when they lie on the clusterfrontier
Advances in Fuzzy Systems 11
Table 6 Clustering results without prefixing the number of clusters Criterion yearly movements
Metrics ED FHD KDCluster 1 (centre Roma FCO)
le20 30 19 18 36 30 19 18 36 30 19 18 3620ndash40 4 10 20 29 5 22 4 10 20 29 5 22 4 10 20 29 5 22
gt4026 9 37 32 3 34 21 13 17 1 16 8 3533 15 2 27 28 25 23 7 12 24 6 14 11
38 31
26 9 37 32 3 34 21 13 17 1 16 8 3533 15 2 27 28 25 23 7 12 24 6 14
38 11 31
26 9 37 32 3 34 21 13 17 1 16 8 3533 15 2 27 28 25 23 7 12 24 6 14
38 11 31Cluster 2 (centre Torino)
le20 32 3 37 32 3 37 32 3 3720ndash40 20 10 36 9 34 4 20 10 36 9 34 20 10 36 9 34
gt401 26 19 30 18 29 22 5 17 8 33 15 1316 27 14 16 12 7 11 25 35 31 38 28
2 23 24 6
4 1 26 19 18 30 29 22 5 17 8 33 1513 16 27 14 16 12 7 11 25 35 31 38
28 2 23 6 24
4 1 26 19 18 30 29 22 5 17 8 33 1513 16 14 27 16 12 7 11 25 35 31 38
28 2 23 6 24Cluster 3 (centre Lamezia Terme)
le20 17 8 34 17 8 34 17 8 3420ndash40 33 9 15 26 22 1 29 33 9 15 26 22 1 29 33 9 15 26 22 1 29
gt4021 37 3 5 20 32 10 4 14 27 36 17 3018 19 7 13 12 11 25 16 31 38 35 28
23 2 6 34
21 37 3 5 20 32 10 4 14 27 36 17 3018 19 7 13 12 11 25 16 38 31 35 28
23 6 2 34
21 37 5 3 20 32 10 4 14 27 36 17 3018 19 7 13 12 11 25 16 38 31 35 28
23 2 6 34Cluster 4 (centre Pescara)
le20 25 25 2520ndash40 7 27 38 12 31 7 27 38 12 31 7 27 38 12 31
gt4028 16 11 23 13 6 14 15 24 2 33 35 817 5 22 26 34 9 29 1 20 37 21 4 3
32 10 18 30 36 19
28 16 11 13 23 6 14 15 24 2 33 35 817 5 22 26 9 34 29 1 20 37 21 4 3
32 10 18 30 19 36
28 16 11 13 23 6 14 15 24 2 33 35 817 5 22 26 9 34 29 1 20 37 21 4 3
32 10 30 18 19 36Cluster 5 (centre Crotone)
le20 11 11 1120ndash40 32 14 31 7 27 15 32 14 31 7 27 15 32 14 31 7 27 15
gt4038 25 33 8 17 16 28 13 23 6 24 234 35 26 1 22 9 5 29 21 37 20 3 32
4 10 18 36 30 19
38 25 8 33 17 16 28 13 23 6 24 234 35 26 22 1 9 5 29 21 37 20 3 32
4 10 18 36 19 30
38 25 8 33 17 16 28 13 23 6 24 234 35 26 22 1 9 29 5 21 37 20 3 4
32 10 18 36 19 30
The second element of fuzziness concerns the representa-tion of an airport as fuzzy set In the application discussed inSection 3 only available official data have been used whichare not intrinsically fuzzy as they refer to passengers andmovements In any case the application to the test caseshowed that the fuzzy proposed procedure provides resultsin line with expectations then specific data surveys canbe further realized to test the potentiality of the proposedapproach for other clustering goals Particularly linguisticvariables representing travellersrsquo preferences can be collectedto test how users cluster airports from their point of view
To summarize the obtained clusters are coherent withthe expectations and the fuzzy clustering procedure identifiesthe airport membership uncertainty by helping planners tobetter recognize the role of an airport The two chosencriteriamdashyearly passengers andmovementsmdashin this case leadto similar results in terms of cluster composition and confirmthe relationship between carried passengers and number ofmovements
Further developments concern the use of some differentcombined criteria to verify if and how the cluster compositionmay vary and to verify the use of linguistic variables
Conflict of Interests
The authors declare that there is no conflict of interestsregarding the publication of this paper
References
[1] EUROCONTROL Trends in Air Traffic A Place to StandAirports in the European Air Network Volume 3mdashSTATFORthe EUROCONTROL Statistics and Forecast Service BrusselsBelgium 2007
[2] European Union Communication from the Commission Com-munity Guidelines on Financing of Airports and Start-Up Aid toAirlines Departing fromRegional Airports Official Journal of theEuropean Union Brussels Belgium 2005
[3] M N Postorino ldquoDevelopment of regional airports in EUrdquo inDevelopment of Regional Airports M N Postorino Ed pp 27ndash51 WIT Press (GBR) 2010
[4] ICAO Annex 14 Volume I Aerodrome Design and Operations5th edition 2009
[5] ICAO ldquoOwnership organization and regulatory practices ofairports and Air Navigation Service Providers 2007rdquo Reportdocuments 2008
12 Advances in Fuzzy Systems
[6] V Adikariwattage A G de Barros S C Wirasinghe and JRuwanpura ldquoAirport classification criteria based on passengercharacteristics and terminal sizerdquo Journal of Air TransportManagement vol 24 pp 36ndash41 2012
[7] M A Madas and K G Zografos ldquoAirport capacity vs demandmismatch or mismanagementrdquo Transportation Research PartA vol 42 no 1 pp 203ndash226 2008
[8] J Sarkis and S Talluri ldquoPerformance based clustering forbenchmarking of US airportsrdquo Transportation Research Part Avol 38 no 5 pp 329ndash346 2004
[9] G Burghouwt and J Hakfoort ldquoThe evolution of the Europeanaviation network 1990ndash1998rdquo Journal of Air Transport Manage-ment vol 7 no 5 pp 311ndash318 2001
[10] P Malighetti S Paleari and R Redondi ldquoConnectivity of theEuropean airport network ldquoSelf-help hubbingrdquo and businessimplicationsrdquo Journal of Air Transport Management vol 14 no2 pp 53ndash65 2008
[11] M N Postorino and F G Pratico ldquoAn application of the multi-criteria decision-making analysis to a regional multi-airportsystemrdquo Research in Transportation Business amp Managementvol 4 pp 44ndash52 2012
[12] SMiyamoto H Ichihashi and K Honda ldquoBasicmethods for c-means clusteringrdquo Studies in Fuzziness and Soft Computing vol229 pp 9ndash42 2008
[13] L Bai J Liang C Dang and F Cao ldquoA novel fuzzy clusteringalgorithm with between-cluster information for categoricaldatardquo Fuzzy Sets and Systems vol 215 pp 55ndash73 2013
[14] A Ghosh D K Pratihar M V V Amarnath G Dittrich andJ Mueller ldquoFuzzy clustering of mechanismsrdquo Sadhana vol 37no 5 pp 539ndash556 2012
[15] Y H Kim S C Ahn and W H Kwon ldquoComputational com-plexity of general fuzzy logic control and its simplification for aloop controllerrdquo Fuzzy Sets and Systems vol 111 no 2 pp 215ndash224 2000
[16] I Perfilieva and V Kreinovich ldquoFuzzy transform as a newparadigm in fuzzy modelingrdquo Fuzzy Sets and Systems vol 180no 1 pp 1ndash2 2011
[17] M Versaci S Calcagno F La Foresta and B Cammaroto ldquoPathloss prediction using fuzzy inference system and ellipsoidalrulesrdquo American Journal of Applied Sciences vol 9 no 12 pp1940ndash1943 2012
[18] R Redondi P Malighetti and S Paleari ldquoHub competitionand travel times in the world-wide airport networkrdquo Journal ofTransport Geography vol 19 no 6 pp 1260ndash1271 2011
[19] E Gegov M N Postorino M Atherton and F Gobet ldquoCom-munity structure detection in the evolution of the United Statesairport networkrdquo Advances in Complex Systems vol 16 no 12013
[20] D Warnock-Smith and A Potter ldquoAn exploratory study intoairport choice factors for European low-cost airlinesrdquo Journalof Air Transport Management vol 11 no 6 pp 388ndash392 2005
[21] W K Li C Miyoshi and R Pagliari ldquoDual-hub network con-nectivity an analysis of all Nippon Airwaysuse of TokyosHaneda and Narita airportsrdquo Journal of Air Transport Manage-ment vol 23 pp 12ndash16 2012
[22] J T Rickard J Aisbett G Gibbon andDMorgenthaler ldquoFuzzysubsethood for type-n fuzzy setsrdquo in Proceedings of the AnnualMeeting of the North American Fuzzy Information ProcessingSociety (NAFIPS rsquo08) New York NY USA May 2008
[23] J T Rickard J Aisbett and G Gibbon ldquoFuzzy subsethood forfuzzy sets of type-2 and generalized type-nrdquo IEEE Transactionson Fuzzy Systems vol 17 no 1 pp 50ndash60 2009
[24] F C Morabito M Versaci G Pautasso and C TichmannldquoFuzzy-neural approaches to the prediction of disruptions inASDEX upgraderdquo Nuclear Fusion vol 41 no 11 pp 1715ndash17232001
[25] B Kosko Fuzzy Engineering Prentice Hall International Edi-tions 1997
[26] ENAC httpwwwenacgovitrepositoryContentManage-mentnodeN8911329Aeroporti certificati 120927pdf
Submit your manuscripts athttpwwwhindawicom
Computer Games Technology
International Journal of
Hindawi Publishing Corporationhttpwwwhindawicom Volume 2014
Hindawi Publishing Corporationhttpwwwhindawicom Volume 2014
Distributed Sensor Networks
International Journal of
Advances in
FuzzySystems
Hindawi Publishing Corporationhttpwwwhindawicom
Volume 2014
International Journal of
ReconfigurableComputing
Hindawi Publishing Corporation httpwwwhindawicom Volume 2014
Hindawi Publishing Corporationhttpwwwhindawicom Volume 2014
Applied Computational Intelligence and Soft Computing
thinspAdvancesthinspinthinsp
Artificial Intelligence
HindawithinspPublishingthinspCorporationhttpwwwhindawicom Volumethinsp2014
Advances inSoftware EngineeringHindawi Publishing Corporationhttpwwwhindawicom Volume 2014
Hindawi Publishing Corporationhttpwwwhindawicom Volume 2014
Electrical and Computer Engineering
Journal of
Journal of
Computer Networks and Communications
Hindawi Publishing Corporationhttpwwwhindawicom Volume 2014
Hindawi Publishing Corporation
httpwwwhindawicom Volume 2014
Advances in
Multimedia
International Journal of
Biomedical Imaging
Hindawi Publishing Corporationhttpwwwhindawicom Volume 2014
ArtificialNeural Systems
Advances in
Hindawi Publishing Corporationhttpwwwhindawicom Volume 2014
RoboticsJournal of
Hindawi Publishing Corporationhttpwwwhindawicom Volume 2014
Hindawi Publishing Corporationhttpwwwhindawicom Volume 2014
Computational Intelligence and Neuroscience
Industrial EngineeringJournal of
Hindawi Publishing Corporationhttpwwwhindawicom Volume 2014
Modelling amp Simulation in EngineeringHindawi Publishing Corporation httpwwwhindawicom Volume 2014
The Scientific World JournalHindawi Publishing Corporation httpwwwhindawicom Volume 2014
Hindawi Publishing Corporationhttpwwwhindawicom Volume 2014
Human-ComputerInteraction
Advances in
Computer EngineeringAdvances in
Hindawi Publishing Corporationhttpwwwhindawicom Volume 2014
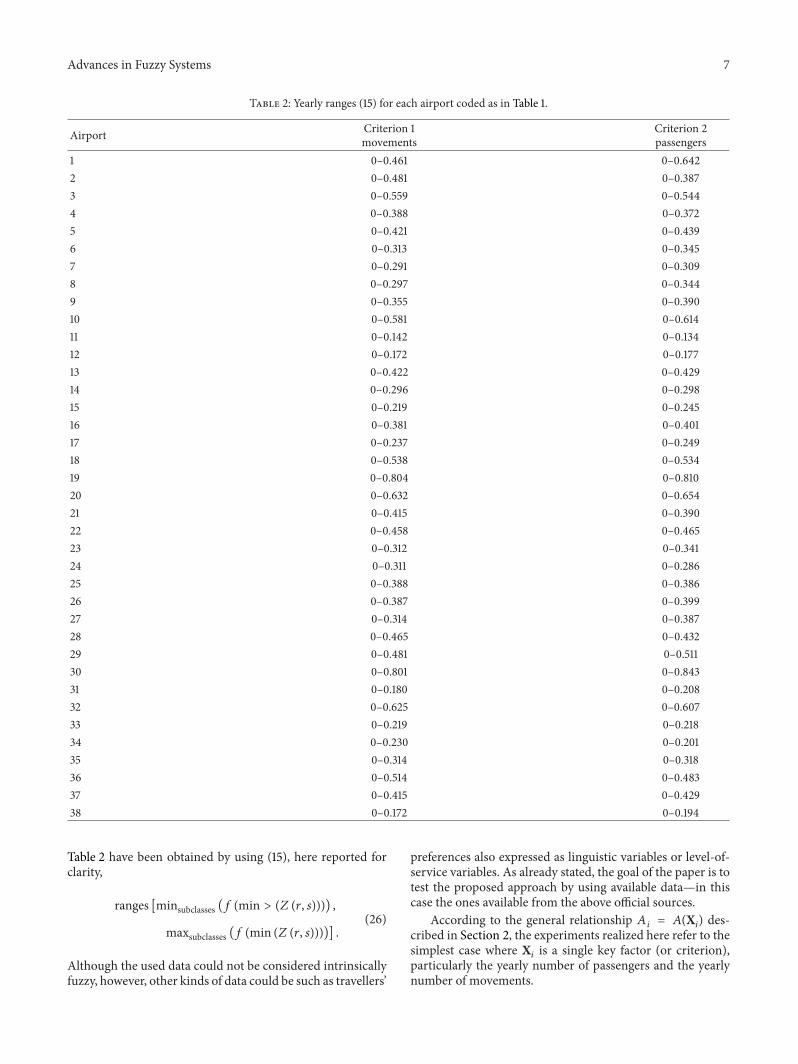
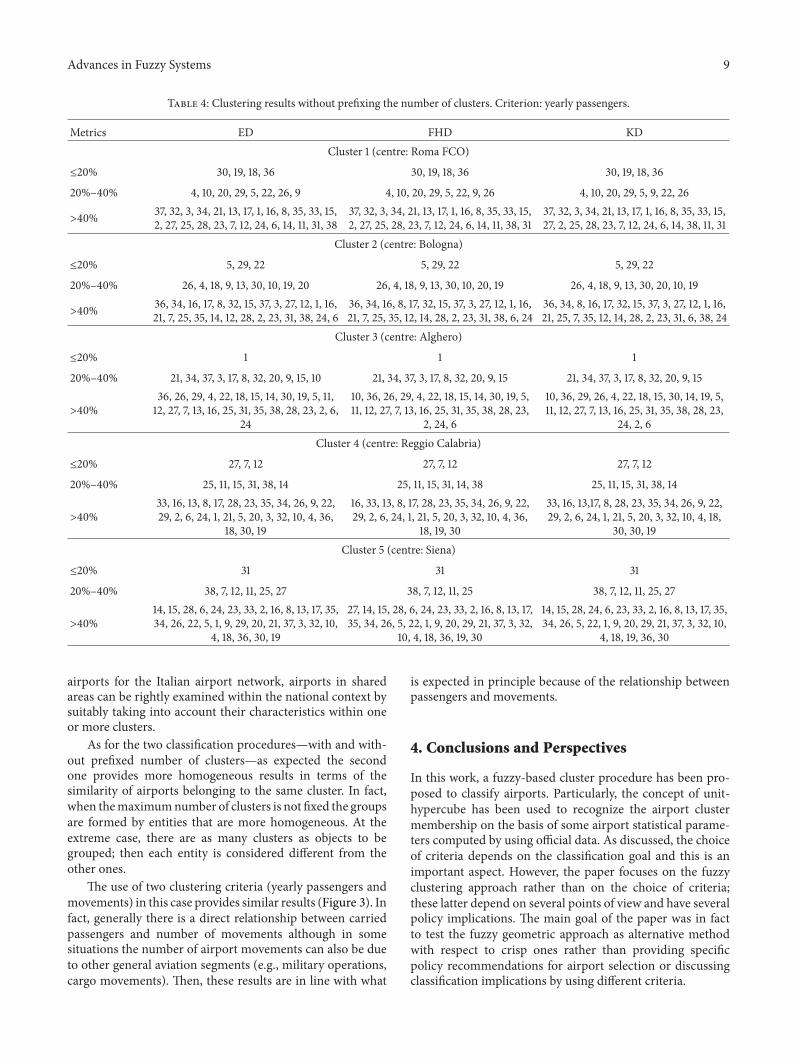
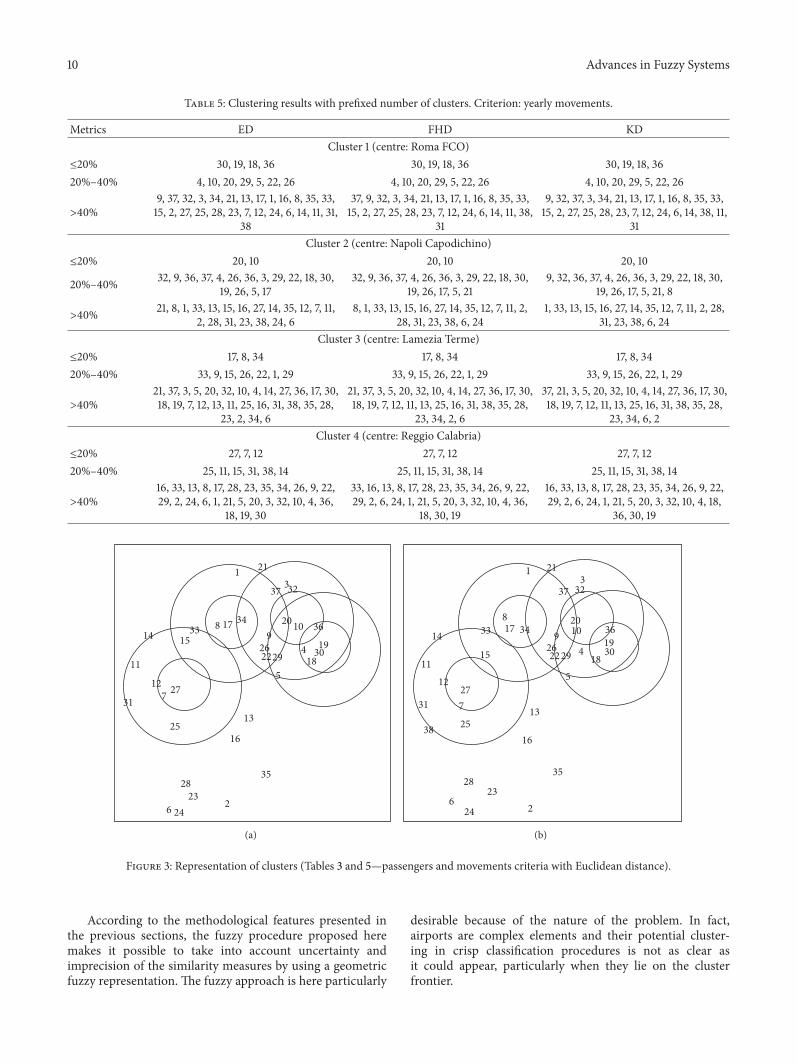