research and working paper lb,
TRANSCRIPT
:; f ) (
j I
.. 1-i���1 ·i1.: .. 'l . .;
.. �·
.,,
! Innis ' ....... : . ......
HB ·: 74; .. 5 . .. R47
no.324
i '=--·--�...- .,,.: ... -
I !
FACULTY OF BUSINESS RESEARCH AND
WORKING PAPER SERIES · s\�� \);•i�;�;trp
, .,,�-o. lb,��-: v�\ ·�A\
��·� .. 'J;\
� JUN l':5 1990 J \, . ,� ��/
CANADA'S AGING POPULATION AND PROJECTED CHANGES IN VALUE ORIENTATIONS AND THE DEMAND
FOR URBAN SERVICES
by Thomas E. Muller
McMaster University Faculty of Business Hamilton, Ontario
Marketing Area
WORKING PAPER NO. 324
'E:i:: UNIVERSITY !�fc�bt at'iq).'tanada L8S 4M4 >}S�5.�9 l 4o
.··· ·: ·:i
March 1989
;•
INNIS I mo�td\ oy · I :: lJ b-t�i'1 n ·
1nrnu r�l�fliUti\TlN� HiH\q"·\JWfl�l� · tU D. . �

CANADA'S AGING POPULATION AND PROJECTED CHANGES IN VALUE ORIENTATIONS AND THE DEMAND
FOR URBAN SERVICES
by
Thomas E. Muller
McMaster University Faculty of Business Hamilton, Ontario
Marketing Area
WORKING PAPER NO. 324
March 1989
. �ersity Libr.
��"A Q�.
� ---�
�
� u �
..

Canada's Aging Population and Projected Changes
in Value Orientations and the Demand for Urban Services
by
Thomas E. Muller*
This cross-sectional survey of 12 age groups in the Canadian
urban population detected age differences in consumers' value
orientations. Thus, Canada's changing age structure will
likely be accompanied by a shift in value orientations - the
collective result of value orientational changes as a person
ages. Because personal values determine the types of services
that are important to a consumer, this shift in values will
alter the demand for several kinds of urban services and faci-
lities in the next 20 years--in particular, fine restaurants,
movie theatres and family theme parks, as well as for many
kinds of health-care facilities.
THE CHANGING AGE STRUCTURE OF THE POPULATION
The average age of the Canadian population has been increasing monotoni-
cally for the past 28 years. Since 1961, Statistics Canada's demographic
portrait has shown a nation becoming collectively older than it was in
each previous census. Whereas in 1961 the mean age of the population was
below 30, by the year 2001 it is projected to reach 37. This trend is a
reflection of major changes in the population's age structure--due
primarily to the aging of Canada's post-World War II baby boomers.
Figure 1 shows the projected rates of growth and decline, between the
*Associate Professor, Faculty of Business, McMaster University, Hamilton, Ontario LBS 4M4, Canada

- 2 -
years 1986 and 2006, for four selected age groups. The population of
young adults (ages 15 to 24) and 25-to-39-year-olds is projected to shrink.
The number of 40-to-64-year-olds will grow from 6.5 million to 10.5 million
in this same 20-year period-- a 60 per cent increase in middle-aged con
sumers and the volume of goods they will likely require. Because this 20-
year period is well within the long-term planning horizon of many marketers,
it marks a transition in the consumption needs of adulthood to the needs of
middle-aged persons that a marketer cannot afford to overlook. Even in the
shorter planning periods of five, ten and 15 years hence, the projected
population changes in the middle-aged group are substantial.
Changes of a similar magnitude will occur in Canada's population in the
retirement years. The 1986 projection of. 2.7 million people aged 65 and
over increases to 4.2 million by 2006--a growth of 55 per cent in the number
of consumers who are earning pensions, have no nine-to-five job awaiting them
each day, _have much more discretionary time on their hands, and are healthier
than their counterparts in the previous generation. These people have a
strong incentive to consume what are termed time-using goods [Engel,
Blackwell and Miniard, 1986: 261] such as tours, travel packages, galleries
and museums, visits with relatives and friends, do-it-yourself kits, sports
and games, novels and libraries--and are,less inclined to use time-saving
goods such as automated teller machines, instant foods, prepared dinners,
labour-saving appliances, home maintenance services, take-out and delivery
foods, and rapid-transit services.
Figure 1 about here

- 3 -
THE EFFECT OF AGING ON PERSONAL VALUES
A review of the literature on life-span research and developmental
psychology reveals that much research had initially centred on the detection
of personality changes (including changes in motives) in aging adults. In
these studies, personality is treated as a dependent variable to be explained
by changes in age. More recently, however, there is an emerging consensus
among many life-span developmental researchers that personality is essential
ly stable over the course of life, and should be treated as an independent
variable in studies of adult development [Costa and Mccrae, 1986; Erdwins
and Mellinger, 1984; Nesselroade and Baltes, 1974; Veroff, Reuman and Feld,
1984].
Furthermore, Mccrae and Costa [1982] argue that a fruitful model for
future research on adult development is to ·•view personality dimensions as
independent variables which function jointly with age and stage to influence
some of the outcomes of life' • In other words, with personality remaining
more or less fixed throughout life, there are outcomes of the aging process
which do undergo change over time. Such outcomes would most certainly
include peoples' values and resulting lifestyles--as reflected in their
activities, interests and opinions.
The combined effects of aging and a,relatively stable personality on
value orientations have so far received little attention in the literature
on life-span development, and even less attention in the marketing literature.
Y�t, indications are that age differences in personal value are greater than
age differences in individual personality traits [Crosby, Gill and Lee, 1984;
Felton, 1987. Lowenthal, Thurnher and Chiriboga, ' 1975].

4 -
THE EFFECT OF PERSONAL VALUES ON CONSUMPTION �
Values are cognitive representations of various human needs, · tempered by
societal demands [�okeach, 1973]. Values are guiding principles, and their
relative importance to a person reveal what the person deems worthwhile in
life-- what things are worth striving for, possessing, achieving, supporting
and nurturing. People have terminal values, that is, desirable end-states
of existence that could be labelled, for example, a sense of accomplishment,
self-respect, security, an exciting life; people also have instrumental
values--desirable modes of conduct conveyed by adjectives like ambitious,
cheerful, courageous, honest, imaginative, polite, and so on, that enable
people to achieve their terminal values. People typically possess a system
of values, or value hierarchy, within which individual values have been
prioritised or assigned a relative importance. Hence, the term value
orientation denotes the importance attached to a specific type of value.
The term personal value is used so as to distinguish a consumer's individual
value from the broader societal values of a culture.
One aspect of personal values is their indirect impact on preferences
for products, services and even brands. In search of value fulfilment,
consumers seek out, identify with and consume products and services that
can deliver attributes and 'consequence.s' related to specific personal
values [Perkins and Reynolds, 1988; Reynolds and Gutman, 1988]. Similarly,
certain everyday activities [Garling, Lindberg and Montgomery, 1987] and
leisure/recreational alternatives [Pitts and Woodside, 1986] are cherished
or pursued by consumers trying to fulfil their value orientations.
Changes in value orientation across the life cycle are likely to have
important practical consequences on consumer demand and marketing activities.

- 5 -
For example, the direction and velocity of personal value change in the
population--as varying numbers of consumers are projected to pass through
the different life stages (young adulthood, bachelorhood, married full
nesters, married empty-nesters, etc. )--will determine what material and
psychic goods will be demanded in the Canadian marketplace in the years
ahead. With 80 per cent of Canada's population living in urban areas, an
important problem is to determine the future demand for urban services and
facilities. If a relationship between aging and value change can be
empirically established, then this will mean that changes in the population
age structure will translate into value shifts at the aggregate (societal)
level that are in proportion to the projected size of each distinct age
group in the population. These value shifts would likely result in changing
demand for urban facilities and services, which were the focus of this study.
The purpose of this empirical study was threefold:
1) To detect age differences in value orientations;
2) To identify which specific values differ across the adult life span;
3) To postulate a few of the future service marketing implications of
these value orientational changes, in the context of urban services
and facilities.
In this cross-sectional study, a survey sample of 1,200 urban Canadians was
divided into 12 age groups. The aim was to see whether the priorities
people attach to nine terminal (end-state) values differ by age, and to
assess the magnitude of value orientational changes from one age group to
another. Also examined was the relationship between specific personal values
and the priority a person piaces on various urban services and facilities.

METHOD
Survey I:esign ..
- 6 -
A probability sample of 400 adults living in each of Canada's three largest
metropolitan areas--Toronto, Montreal, and Vancouver--was questioned via
computer-assisted telephone interviewing from a central research facility
in each city. Households were contacted by using an incremental random
telephone sampling technique which allowed new listings and unlisted numbers
to be included in the sample frame. Within each household contacted, one
respondent was slelected randomly using a modification [Bryant, 1975] of
the Troldahl and Carter [1964] procedure, in order to balance the sexes and
ages of persons, 18 years and over, chosen for the interview. The respondent's
·age was obtained by asking for year of birth. The findings are based on
completed interviews with a total of 1, 197 urban residents during April and
May of 1987.
Value Measures
Respondents were asked to rate the importance they attached to each of
nine personal values: self-respect, security, warm relationships with others,
a sense of accomplishment, fun and enjoyment in life, self-fulfilment, being
well respected, a sense of belonging, excitement. This List of Values is a
typology of terminal values developed at the University of Michigan Survey
Research Center [Veroff, Douvan and Kulka, 1981: 142-146] and based on the
theoretic contributions of Maslow [1954], Rokeach [1973] and Feather [1975].
The List of Values was derived in the context of life-span developmental
psychology and can be systematised to closely correspond with the human need
categories in Maslow's hierarchy. Also, this value typology relates more
closely to major roles in life (consumption, work, leisure, marriage,
parenting) than do the widely known Rokeach [1973] Value Survey's 18 terminal
values [Kahle, Beatty and Homer, 1986].

- 7 -
The value-importance question was put as follows:
I'm now going to name some things that people might look for
or want out of life, such as (the list of nine values was read
out). One a scale of one to ten, where 'one' is 'not important'
and 'ten' is 'extremely important', please tell me how important
each one is to you as a guiding principle in your own life.
To negate any response set due to order, the presentation order of the
values was rotated from interview to interview.
Measures of Importance of City Services/Facilities
Respondents were also asked, on the same one-to-ten scale, the imi;>ortance
'to your satisfaction with your life in a city' of various services and
facilities that characterise a large city. A list of services and
amenities was adapted from urban livability measures included in Boyer and
Savageau's [ 1985] Places Rated Almanac. This part of the questionnaire
revealed what priority a respondent assigned to 58 services and facilities
such as low housing costs, a high job growth rate, no air pollution, many
hospitals, low property crime rate, many daily airline flights, many
college and university courses and programs, a professional opera company,
many movie theatres, many public golf courses, a zoo and so forth. The
object was to determine which personal Vqlues best predict the importance
people attach to specific urban facilities and services.
Analysis of Age Effects
The sample was divided into 12 age groups (Figure 2) in order to take
advantage of the sample size and to obtain a large number of groups across
the adult life span so that multiple comparisons could be made and age
related trends detected, while satisfying certain constraints: achieving

- 8 -
group sample sizes that were large enough to be statistically meaningful
( n·· ranged between 45 and 194) ; preserving the normative age break of 65.;
it also seemed natural to partition the sample so that the baby-boom
generation (1946-1964 birth cohort) remained intact within four groups--
23-26 to 37-41. Except for the very oldest group (70-85), each group
spanned either four or five years.
Since the focus of this study is age diffeLences in value orientations,
one-way ANOVAs were performed, with value scores serving as the nine
dependent measures and age as the independent variable. Prior to these
analyses a check was made for any interaction effects due to sex and
location of interview (city) which might confound the findings on age.
Nine, separate 12 (Age) x 2 (Sex) x 3 (City) ANOVAs were performed on the
value scores. No two-way or three-way interactions were detected. Also,
before grouping both sexes into each age group, a check was made that the
frequency distributions of males and females, across the 12 age groups,
were matched fairly closely. A chi-square analysis showed no significant
distributional qifference between sexes.
RESULTS
Values and Aging
The results of the one-way ANOVAs are reported in Table 1. Significant age
differences showed up in four out of nine value orientations. Figure 2
shows the mean importance given to the value excitement, across the adult
life span. The 95 per cent confidence intervals about each point are
included to identify groups that differ significantly from one another. The
ANOVA reveals a highly significant age effect (F11,1185 � 10. 71; p <.0001).
- 9 -
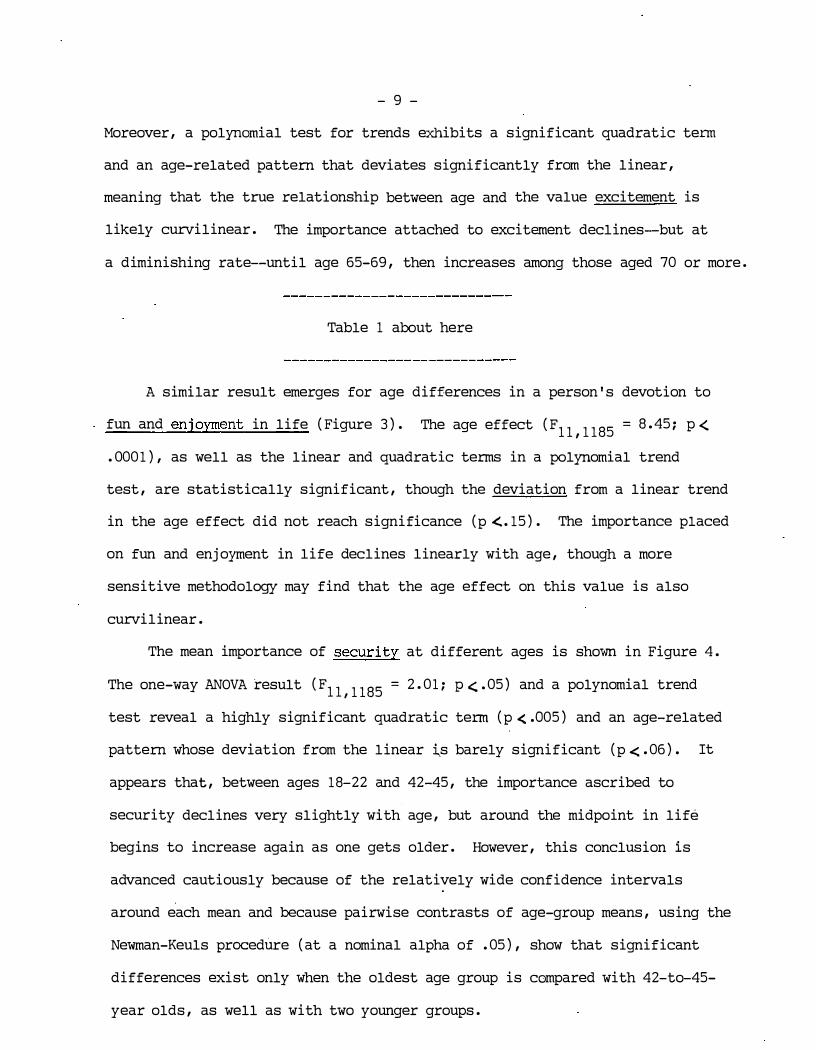
Moreover, a polynomial test for trends exhibits a significant quadratic tenn
and an age-related pattern that deviates significantly from the linear,
meaning that the true relationship between age and the value excitement is
likely curvilinear. The importance attached to excitement declines--but at
a diminishing rate--until age 65-69, then increases among those aged 70 or more.
Table 1 about here
A similar result emerges for age differences in a person's devotion to
fun and enjoyment in life (Figure 3). The age effect (F11,1185 = 8.45; P<
. 0001), as well as the linear and quadratic terms in a polynomial trend
test, are statistically significant, though the deviation from a linear trend
in the age effect did not reach significance (p<..15). The importance placed
on fun and enjoyment in life declines linearly with age, though a more
sensitive methodology may find that the age effect on this value is also
curvilinear.
The mean importance of security at different ages is shown in Figure 4.
The one-way ANOVA result (F1111185 = 2. 01; P<-05) and a polynomial trend
test reveal a highly significant quadratic tenn (p<.005) and an age-related
pattern whose deviation from the linear �s barely significant (p<. 06). It
appears that, between ages 18-22 and 42-45, the importance ascribed to
security declines very slightly with age, but around the midpoint in life
begins to increase again as one gets older. However, this conclusion is
advanced cautiously because of the relatively wide confidence intervals
around each mean and because pairwise contrasts of age-group means, using the
Newman-Keuls procedlire (at a nominal alpha of . 05), show that significant
differences exist only when the oldest age group is compared with 42-to-45-
year olds, as well as with two younger groups.

- 10 -
Figure 5 shows_ how the importance o� the value a sense of belonging
varies with age. The age effect (F11,1184 = 1.98; p < .05), as well as the
linear and quadratic terms in a ploynomial trend test, are statistically
significant, though the deviation from a linear trend in the age effect is
not significant (p < .10). Post hoe pairwise contrasts disclosed that value
importance differences appear only when the oldest age group (70-85) is
compared to each of the six groups from 18-22 to 42-45�-the midpoint in life.
Figure 2, Figure 3, Figure 4 and Figure 5
about here
Values and the Importance of Urban Services
Since the importance of excitement and fun and enjoyment in life decreases
markedly with age, while the importance of security and a sense of
belonging increases in late life, the analysis next focused on importance
ratings for urban facilities that were correlated with these four personal
values. A matrix of Pearson product-moment corr�lations showed that
excitement and fun and enjoyment in life were associated almost exclusively
with the importance people attach to a city's various recreational facili�
ties. Security and a sense of belonging,were, without exception, the values
which correlated most strongly with the importance attached to a city's
various healthcare facilities. Therefore, with the four personal values
always serving as predictor variables, 25 separate multiple regressions
were performed, using each of the 15 recreational-services variables and ten
healthcare-services variables as dependent measures. The reported results
include only recreational-services equations with an adjusted R2 of at least

- 11 -
.OS, and healthcare-services equations with an adjusted R2 of at least . 10,
and are shown in Table 2. Due to large sample sizes, only personal values
having coefficients significant at p < . 005 are reported in the table. In
general, though the observed effects are reliable, the explained variance
in these equations is very low. For example, the values fun and enjoyment
in life, excitement, and security together explain 11 per cent of the
variance in the importance people attach to having many good restaurants
in the city. The values security and a sense of belonging explain six per
cent of the variance in importance attached to many ten-pin bowling lanes.
A discussion of the more interesting relationships among those shown in
Table 2 is presented next.
Table 2 about here
DISCUSSION
In this cross-sectional study using a typology of nine terminal values,
age-related differences were found in the importance people attach to four
such values: excitement, fun and enjoyment in life, security, and a sense
of belonging. The first two can be described as hedonistic values; the
latter two as values concerned respectively with safety and security, and
sociability [Veroff, Douvan and Kulka, 1981: 144-145].
The relationship between age and priority given to excitement is
curvilinear, its relative importance decreasing--but at a slower rate in
each succeeding five�year period--until the late sixties. Its importance
as a value then apparently increases among people aged 70 or older. Also,
people's devotion to fun and enjoyment in life declines linearly with age,

- 12 -
though a more sensitive replication of this study may detect that this value
'bottoms out' during the preretirement decade, then increases in importance
in later years. Given that these two hedonistic values are associated with
a higher personal priority for fine restaurants and movie theatres, the
aging data and the statistics in Figure 1 suggest that the demand for these
two services in their present form will likely diminish over the next 20
years._ The challenge, therefore, is to revise these two services to make
them appeal to segments which place a progressively lower value on excitement.
It is also likely that as Canada's population collectively lowers its priori
tisation of excitement, there will be progressively less interest in auto
racing events. The promotional value of auto racing as a sport will diminish,
as this sport appeals to a progressively smaller proportion of the population,
mostly young adults, since the importance of excitement is highest among this
age·group.
Somewhat smaller and fewer age differences were also found for the
values security and a sense of belonging. People aged 70 to 85 placed a
higher importance on security than people at the midpoint in life (ages 42-
45)--when security may be at or near its lowest importance in the adult life
span. Across the life span, a sense of belonging was most important to the
group aged 70-85, and least important to, the six groups aged 18-22 to 42-45.
In between these two age extremes, the priority given to either security or
a sense of belonging apparently changes little with age. By implication,
therefore, the effects of aggregate changes in these two value orientations
will come almost entirely from the 65-and-older age group which is growing
considerably as a market segment. People who value security and a sense of
belonging place a higher priority than others on healthcare facilities and

- 13 -
services. The industry comprised of medical services, hospitals, cancer and
cardiac clinics and hospices will greatly expand--not only because people in
that stage of life need healthcare as their health deteriorates, but also
because they find security in knowing that such facilities exist. They will
likely support, lobby and vote for efforts to enlarge the healthcare industry.
Recreationally, the higher priority placed on security among the retirement
age group should make family theme parks attractive to them as visitors with
their grandchildren. However, these theme parks will need to become reorient
ed toward, and equipped for, the physically less capable older visitor.
Interestingly, out of nine value measures, the values whose importance
varied significantly with age correspond to the three lowest human need
categories in Maslow's [1954] hierarchy. Excitement and fun and enjoyment
in life are value orientations that are expressive of physiological needs;
security is the value driven by safety needs; and a sense of belonging is
expressive of belongingness and love needs. Furthermore, considering the
significance results in nine ANOVAs of the effect of age on a value orienta
tion (see third column of Table 1), the magnitude of significance is
inversely related to that value's position in Maslow's hierarchy. Values
expressive of physiological needs differed most significantly across the life
span; values expressive of belongingness,and love needs (warm relationships
with others, as well as a sense of belonging) differed least significantly;
values expressive of esteem needs (being well respected.and self-respect) and
self-actualisation needs (seif-fulfilment and a sense of accomplishment) did
not differ significantly by even the most liberal of scientific standards.
To conclude,this article is meant to stimulate discussion about the
related issues of population aging, value change and the future demand for
- 14 -
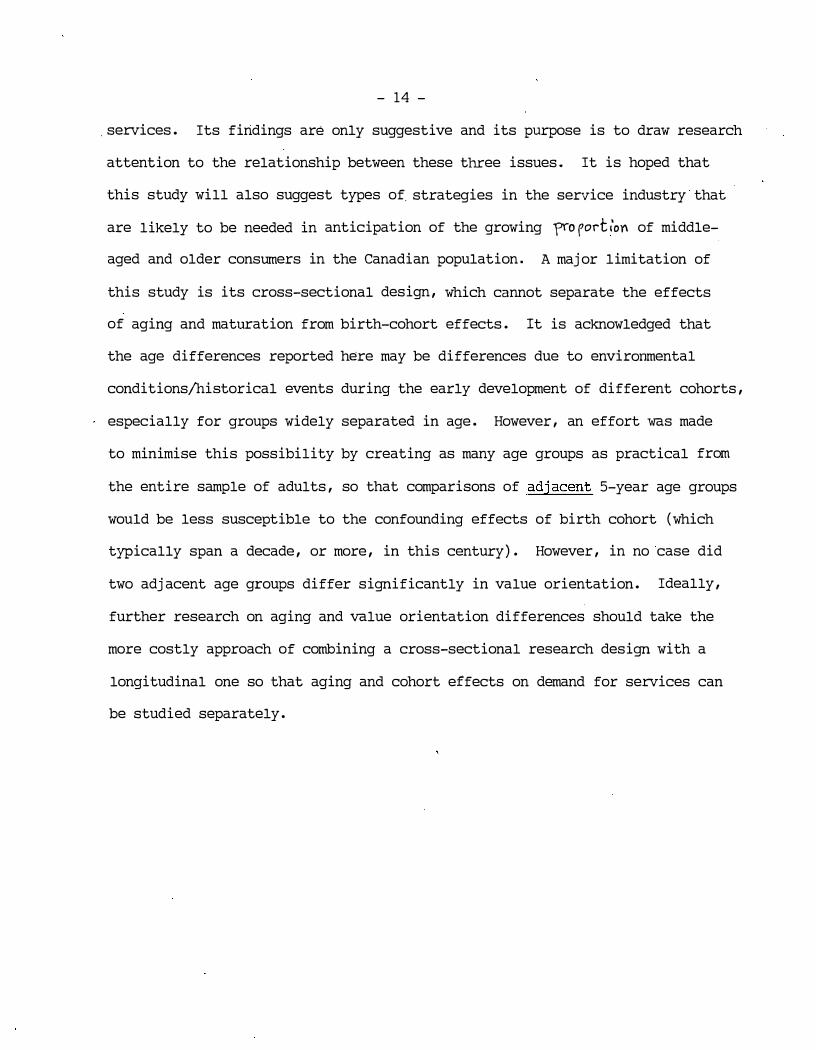
.services. Its findings are only suggestive and its purpose is to draw research
attention to the relationship between these three issues. It is hoped that
this study will also suggest types of. strategies in the service industry that
are likely to be needed in anticipation of the growing ffOfort:on of middle
aged and older consumers in the Canadian population. A major limitation of
this study is its cross-sectional design, which cannot separate the effects
of aging and maturation from birth-cohort effects. It is acknowledged that
the age differences reported here may be differences due to environmental
conditions/historical events during the early development of different cohorts,
especially for groups widely separated in age. However, an effort was made
to minimise this possibility by creating as many age groups as practical from
the entire sample of adults, so that comparisons of adjacent 5-year age groups
would be less susceptible to the confounding effects of birth cohort (which
typically span a decade, or more, in this century). However, in no case did
two adjacent age groups differ significantly in value orientation. Ideally,
further research on aging and value orientation differences should take the
more costly approach of combining a cross-sectional research design with a
longitudinal one so that aging and cohort effects on demand for services can
be studied separately.

- 15 -
NOTE
This study was supported by a grant from the Social Sciences and Humanities
Research Council of Canada.

- 16 -
REFERENCES
Boyer, R. and D. Savageau, 1985, Places Rated Almanac, Chicago: Rand McNally.
Bryant, B. E. , 1975, 'Respondent Selection in a Time of Changing Household
Composition', Journal of Marketing Research, 12, pp. 129-35.
Costa, P. T. Jr. and R. R. Mccrae, 1986, 'Age, Personality, and the Holtzman
Inkblot Technique', International Journal of Aging and Human Development,
23, pp. 115-25.
Crosby, L. A. , J. D. Gill and R. E. Lee, 1984, 'Life Status and Age as
Predictors of Value Orientation', in Personal Values and Consumer
Psychology, R. E. Pitts Jr. and A. G. Woodside (eds. ), Lexington, MA:
D. C. Health.
Engel, J. F. , R. D. Blackwell and P. W. Miniard, 1986, Consumer Behavior,
Fifth Ed. , Chicago: Dryden Press.
Erdwins, C. J. and J. C. Mellinger, 1984, 'Mid-Life Women: Relation of Age
and Role to Personality', Journal of Personality and Social Psychology,
47, pp. 390-95.
Feather, N. T., 1975, Values in Education and Society, New York: Free Press.
Felton, B. J. , 1987, 'Cohort Variation in Happiness: Some Hypotheses and
Exploratory Analyses', International Journal of Aging and Human
Development, 25, pp. 25-41.
Garling, T. , E. Lindberg and H. Montgomery, 1987, 'Beliefs About Attainment
of Life Satisfaction as Detenninants of Preferences for Everyday
Activities', in Understanding Economic Behaviour, Vol. 3, Proceedings
of the 12th Annual Colloquium of IAREP, Aarhus, Denmark: Handelshojskolen,
pp. 821-30.

- 17 -
Kahle, L.R., S. E. Beatty and P. Horner, 1986, 'Alternative Measurement
Approaches to Consumer Values: The List of Values (LOV) and Values
and Life Style (VALS) ', Journal of Consumer Research, 13, pp.405-9.
Lowenthal, M.F., M. Thurnher and D. Chiriboga, 1975, Four Stages of Life,
San Francisco: Jossey-Bass.
Maslow, A.H., 1954, Motivation and Personality, New York, Harper.
Mccrae, R.R. and P. T. Costa Jr., 1982, 'Aging, The Life Course, and Models
of Personality', in Review of Human Development, T. M. Field (ed.),
New York: Wiley.
Nesselroade, J.R. and P. B. Baltes, 1974, 'Adolescent Personality Development
and Historical Change: 1970-1976', Monograph of the Society for Research
in Child Development, 39, pp.1-80.
Perkins, W.S. and T. J. Reynolds, 1988, 'The Explanatory Power of Values in
Preference Judgements: Validation of the Means-End Perspective', in
Advances in Consumer Research, Vol.15, Michael J. Houston (ed.), Provo
UT: Association for Consumer Research, pp.122-26.
Pitts, R.E., Jr. and�- G. Woodside, (Summer 1986), 'Personal Values and
Travel Decisions', Journal of Travel Research, 25, pp.20-25.
Reynolds, T.J. and J. Gutman, (Feb/March 1988), 'Laddering Theory, Method,
Analysis, and Interpretation', Journal of Advertising Research, 28,
pp.11-31.
Rokeach, M., 1973, The Nature of Human Values, New York, Free Press.
Statistics Canada, (November 1984), Market Research Handbook 1984, Revised
Edition, Catalogue 63-224, Table 3-42.
Troldahl, V.C. and R. E. Carter Jr., 1964, 'Random Selection of Respondents
Within Households in Phone Surveys', Journal of Marketing Research_, 1,
pp.71-76.

- 18 -
Veroff, J., E. Douvan and R. A. Kulka, 1981, The inner American: A Self-
Portrait from 1957 to 1976, New York: Basic Books.
Veroff, J., D. Ret:nnan and s. Fe'id, 1984, 'Motives in American Men and
Women Across the Adult Life Span', Developmental Psychology, 20,
pp .1142-58.

TABLE
1
RESUL
TS O
F N
INE
ANOV
AS O
F AG
E EF
FECT
S ON
VALUE
IMP
ORTA
NCE
Pers
onal
Val
ue
Masl
ow's
(1
954)
(B
lock
ed a
nd O
rder
ed t
o Co
rres
pond
Si
gnif
ican
ce o
f Di
ffer
ence
s
Need
Cat
egor
y wi
th Ma
slow
's N
eed
Hier
arch
y)
Amon
g 12
Age
Gro
ups
Self
-act
uali
sati
on n
eeds
Se
lf-f
ulfi
lmen
t .7
49
A se
nse
of a
ccom
plis
hmen
t .3
69
I-'
<.D I
Este
em n
eeds
,
Bein
g we
ll r
espe
cted
.6
56
Self
-res
pect
.5
76
Belo
ngin
gnes
s an
d Lo
ve n
eeds
Wa
rm r
elat
ions
hips
wit
h ot
hers
.0
90
A se
nse
of be
long
ing
.049
Safe
ty n
eeds
Se
curi
ty
.049
Phys
iolo
gica
l ne
eds
Fun a
nd e
njoym
ent
in l
ife
<
.001
Exci
temen
t <
.0
01

- 20 -
TABLE 2
PERSONAL VALUES WHICH PREDICT URBAN FACILITY PRIORITIES
Standardised Adj. R2 Urban Facility Personal Values Regression
Coefficient (Be.ta)
Many good restaurants Fun and enjoyment in life . 17 Excitement .15 Security . 08 . 11
Many 10-pin bowling lanes Security . 16 A sense of belonging . 12 . 06
Many movie theatres Fun and enjoyment in life . 19 Excitement . 12 . 07
A family theme park Security . 21 nearby, such as Canada's Excitement . 10 . 09 Wonderland
An auto-racing track Excitement . 20 . 06
Professional sports teams, Fun and enJoyment in life . 11 such as hockey, football, Security . 11 . 06 baseball
Many physicians or Security . 21 medical doctors A sense of belonging . 17 . 13
Many teaching hospitals A sense of belonging . 21 where doctors are Security . 19 . 12 trained
Several medical schools A sense of belonging . 19 Security . 17 .10
Many cardiac-rehabilita- Security . 27 tion clinics for heart A sense of belonging . 16 . 13 patients
Many cancer-treatment Security . 26 clinics A sense of belonging . 17 . 13
Many facilities providing Security . 22 long-tenn care for A sense of belonging .17 . 10 tenninally ill

Figure 1. Population projections for each of four age groups, 1986-2006
Millions of persons
11
I 10
9
8
7 I 6 I
I
, I 4 !"" I I
: t I
� ·-----------
Young Adulthood 115-24)
Retirement Years (65 and over)
1986 1991 1996 2001 Year
Data Source: Statistics Canada [1984]
Middle Age 140-64)
/
Adulthood (25-39)
2006

Figure 2. Mean importance rating given to the value excitement by 12
age groups.
Mean for Excitement 10--�������������������--.
9
8 ._ __ .. ·-·--·---·---·-·------·--·--···--···-·-·----·---·-··--·---·---··-·-··-·--··-·······-·-·---·--·------·--··-··-------
7
6
5 -- ----· ··--------·· ·----------4--···---1-----··---·-·
4
3
2
18 23 27 32 37 42 46 50 55 60 65 70 22 26 31 36 41 45 49" 54 59 64 69 85
Lower and Upper Bounds of Age Groups _

Figure 3. Mean importance rating given to the value fun and enjoyment in
life by 12 age groups.
Mean for Fun and Enjoyment in Life 10..----��������������-----'-�����
9 --.. -•••--••• •--··-···---·-·-•--•••••••••'"-•••••••••••••'"'""••••"•••••••'"•••••-·•-•••••••••n•••••n•-••••••••o•••••-·-•••••••••--•-••••••-'"••••n••••••••••••••-••••'"'""'""•'""--•••••••--••••••-••••-•••••-•-----
8
7
6
5
4
3
2
18 23 27 32 37 42 46 50 55 60 65 70 22 26 31 36 41 45 49 54 59 64 69 85
Lower and Upper Bounds of Age Groups

Figure 4. Mean importance rating given to the value security by 12 age
groups.
Mean for Security 10.-
-�������������������----,
9
8
7
6
5
4
3
2
18 23 27 32 37 42 46 50 55 60 65 70 22 26 31 36 4 t 45 49 54 59 64 69 85
Lower and Upper Bounds of Age Groups

Figure 5. Mean importance rating given to the value a sense of belonging -'
by 12 age groups.
Mean for A Sense of ·Belonging 10.--��������������������
9 !---··---·----·---------·--·----·
8
7
6
5
4
3 ,,
2
18 23 27 32 37 42 46 50 55 60 65 70 22 26 31 36 41 45 49 54 59 64 69 85
Lower and Upper Bounds of Age Groups

295.
296.
297.
298.
299.
300.
301.
302.
303.
304.
305.
306.
307.
308.
309.
Faculty of Business McMaster University
WORKING PAPERS - RECENT RELEASES
John W. Medcof, "Need for Dominance Scale of the Manifest Needs Questionnaire: Its Reliability and Validity", April, 1988.
John W. Medcof and Michael J. Stahl; "Job-Motive Compatibility: A Test of Chusrnir's Model", April, 1988.
Zvi Goldstein, Shaul P. Ladany and Abraham Mehrez, "A Replacement Model With An Expected Breakthrough in an Improving Technological Environment", April, 1988.
Norman Archer, "A Comparison of Computer Conferences with Face-toFace Meetings for Small Group Business Decisions", May, 1988.
Joseph Rose, "New Measures of Union Organizing Effectiveness", June, 1988.
Min Basadur, "Application of a Complete Process of Applied Creative Problem Solving to Union-Management Bargaining", June, 1988.
Rick D. Hackett, "Age, Tenure, and Employee Absenteeism", June, 1988.
A. William Richardson and Abraham Mehrez, "Investigation of Large Scale Multi-Echelon Service Systems", June, 1988.
Min Basadur, "The New Creative Thinking Skills Todays Purchasing Professionals Must Have to Be Successful", June 1988.
George Steiner, "On the Complexity of Dynamic Programming for Sequencing Problems with Precedence Constraints", July, 1988.
Isik Zeytinoglu, "Gender Divisions in Turkey's Labour Market", August, 1988.
Torn Muller, "Value Orientations in Urban Canadians Across the Adult Life Span", July, 1988.
Roy J. Adams, "North American Industrial Relations: Divergent Trends in Canada and the United States", August, 1988.
Roy J. Adams, "The "Old Industrial Relations" and Corporate Competitiveness: A Canadian Case", August, 1988
Gary N. Chaison and Joseph B. Rose, "Continental Divide: The Direction and Fate of North American Unions", August, 1988.

310.
311.
312.
313.
314.
315.
316.
317.
318.
319.
320.
321.
322.
323.
2
Thomas E. Muller, "Using Consumers' Value Orientations to Segment the Canadian Marketplace", September, 1988 . ..
Yufei Yuan, Abraham Mehrez, Amiram Gafni, "A Statistical Analysis of Bias in a Personnel Assignment Problem: Stable Solutions Vs. Multiplicative Utility Solutions", October, 1988.
Yufei Yuan and Abraham Mehrez, "Refueling Strategies to Maximize The Operational Range With A Non Identical Vehicle Fleet", October, 1988.
Thomas E. Muller, "The Role of Personal Values in Segmenting an International Tourism Market", November 1988.
Harish C. Jain and Rick D. Hackett, "Employment Equity in Canada: Public Policy and a Survey", November, 1988.
Harish C. Jain, "The Recruitment and Selection of Visible Minorities in Canadian Police Organizations: 1985-1987", November, 1988.
Thomas E. Muller, "The Two Nations of Canada vs. The Nine Nations of North America: A Cross-Cultural Analysis of Consumers' Personal Values", November, 1988.
Min S. Basadur, Mitsuru Wakabayashi and George B. Graen, "Identifying Creative Problem Solving Style", December, 1988.
Robert G. Cooper and Elko J. Kleinschmidt, "New Product Success Factors: A Comparison of "Kills" versus Successes and Failures", December, 1988.
P. Ho and Ali R. Montazemi, "Evaluating Decision Strategies For Stock Market Investment", January, 1989.
Isik Zeytinoglu, "Part-Time and Occasional Teachers In ·Ontario's Elementary School System", January, 1989.
G. John Miltenburg and T. Goldstein, "Developing Production Schedules Which Balance Part Usage and Smooth Production Loads In Just-In-Time Production Systems", February, 1989.
Winston H. Mahatoo, "Background Information for Marketing Visitors to the People's Republic of China", February, 1989.
Min Basadur, Mitsuru Wakabayashi, George B. Graen, "Attitudes Towards Divergent Thinking Before and After Training: Focusing Upon the Effect of Individual Problem Solving Styles, March, 1989.

I I
I I r I
( �··
':, .. r
' L t:, �
' (
lhv.�s ��J. !-\�
. 1-<t. 5 if� lfl
�o. 32...t.f