research and development statistics at a · pdf fileresearch and development statistics at a...
TRANSCRIPT

September 2013
DEPARTMENT OF SCIENCE & TECHNOLOGYMINISTRY OF SCIENCE &TECHNOLOGY
GOVERNMENT OF INDIANEW DELHI - 110016 (INDIA)
RESEARCH AND DEVELOPMENT STATISTICS
AT A GLANCE
2011-12
R&D RESEARCH AND DEVELOPMENTSTATISTICS AT A GLANCE 2011-12
1
FOREWORD
The Department of Science & Development (DST) is primarily a policy body for S&T sector. New STI Policy 2013 of the
government lays special emphasis on scientifically derived and evidence-based policy formulation for a strong and viable
Science, Research and Innovation System for India. The role and criticality of data in the formulation of evidence-based
policies are widely appreciated. National Science and Technology Management Information System(NSTMIS),DST has been
continuously engaged in generating Databases for S&T sector since 1973 and for convenience of comparisons with
databases of other countries, guidelines of UNESCO / OECD have been adopted for statistics on S&T related information.
Salient findings of the survey launched in the year 2011 for compilation of Research and Development Statistics, 2011-12 are
presented here mainly in the form of graphical presentations. Scope and coverage of data on R&D expenditure and human
resources has been enlarged this time to include multi-national companies and companies not covered by the Department of
Scientific and Industrial Research (DSIR) under its recognition scheme. Further the survey analysis has been complemented
and enriched by the secondary sources such as Higher Education in S&T, Patents etc. including Bibliometric analysis of
Scientific Publications.
Planning and execution of the National Survey is an in-house exercise of DST. It is a culmination of the NSTMIS, DST team
effort comprising Dr. Parveen Arora, Dr. A.N. Rai and Mrs. Namita Gupta.
I thank all scientific agencies and in-house R&D labs for providing data / inputs contained in this compilation. It is hoped that
this publication would be useful for evidence based planning for Indian Science Sector.
(Dr. T. Ramasami) Secretary
Department of Science & Technology Government of India
September, 2013

R&D RESEARCH AND DEVELOPMENTSTATISTICS AT A GLANCE 2011-12
3
MAJOR HIGHLIGHTS
vfrom Rs.24,117.24 crores in 2004-05 to Rs. 53,041.30 crores in 2009-10. It is estimated to be Rs. 62,053.47 crores in 2010-11 and Rs.72, 620.44 crores in 2011-12.
The Gross expenditure on R&D (GERD) in the country has been consistently increasing over the years and has doubled
vfrom 0.81% in 2004-05 to 0.87% in 2009-10.
India’s R&D/GDP ratio has hovered around 0.88% during XI Five Year Plan period. However, it increased significantly
* Estimated
Source: Department of Science & Technology, Government of India.
*Estimated

R&D RESEARCH AND DEVELOPMENTSTATISTICS AT A GLANCE 2011-12
4
v India’s per capita R&D expenditure has increased to Rs. 451/- (US$ 9.5) in 2009-10 from Rs. 217/- (US$ 4.8) in 2004-05.
v In terms of PPP$, India’s GERD increased from 16.6 billions PPP$ in 2004-05 to 30.8 billions PPP$ in 2009-10. It is estimated to be 33.3 billions PPP$ in 2010-11 and 36.7 billions PPP$ in 2011-12.
v World GERD increased from 851.6 billions PPP$ in 2004-05 to 1276.9 billions PPP$ in 2009-10. It is estimated to be 1366.3 billions PPP$ in 2010-11 and 1461.9 billions PPP$ in 2011-12.
v India’s share in World GERD increased to 2.4% in 2009-10 from 1.9% in 2004-05. It is estimated to increase to 2.5% in 2011-12.
v54.4%, State Governments 7.3%, Higher Education 4.1% and Public Sector Industries 5.3% with Private Sector Industries contributing 28.9% during 2009-10.
Gross Expenditure on R&D (GERD) is mainly driven by the Government sector comprising of Central Government
Source: Department of Science & Technology, Government of India.
54.4%

R&D RESEARCH AND DEVELOPMENTSTATISTICS AT A GLANCE 2011-12
5
v
v During the year 2009-10, 84.6% of the R&D expenditure (Plan+Non-Plan) incurred by Central Government sources came from 12 major scientific agencies.
Plan R&D expenditure by scientific agencies has shown an increasing trend over the years
vDAE (14.4%), ICAR (10.8%), CSIR (10.0%) and DST (8.3%) etc.
Amongst the major scientific agencies, DRDO accounted for the maximum share of 31.6% followed by DOS (15.5%),
Note: 1.excludes Non-Plan R&D expenditure. 2. DSIR includes CSIR Source: Department of Science & Technology, Government of India.
Note: DRDO’s R&D mainly comprises of Non-Plan expenditure
R&D RESEARCH AND DEVELOPMENTSTATISTICS AT A GLANCE 2011-12
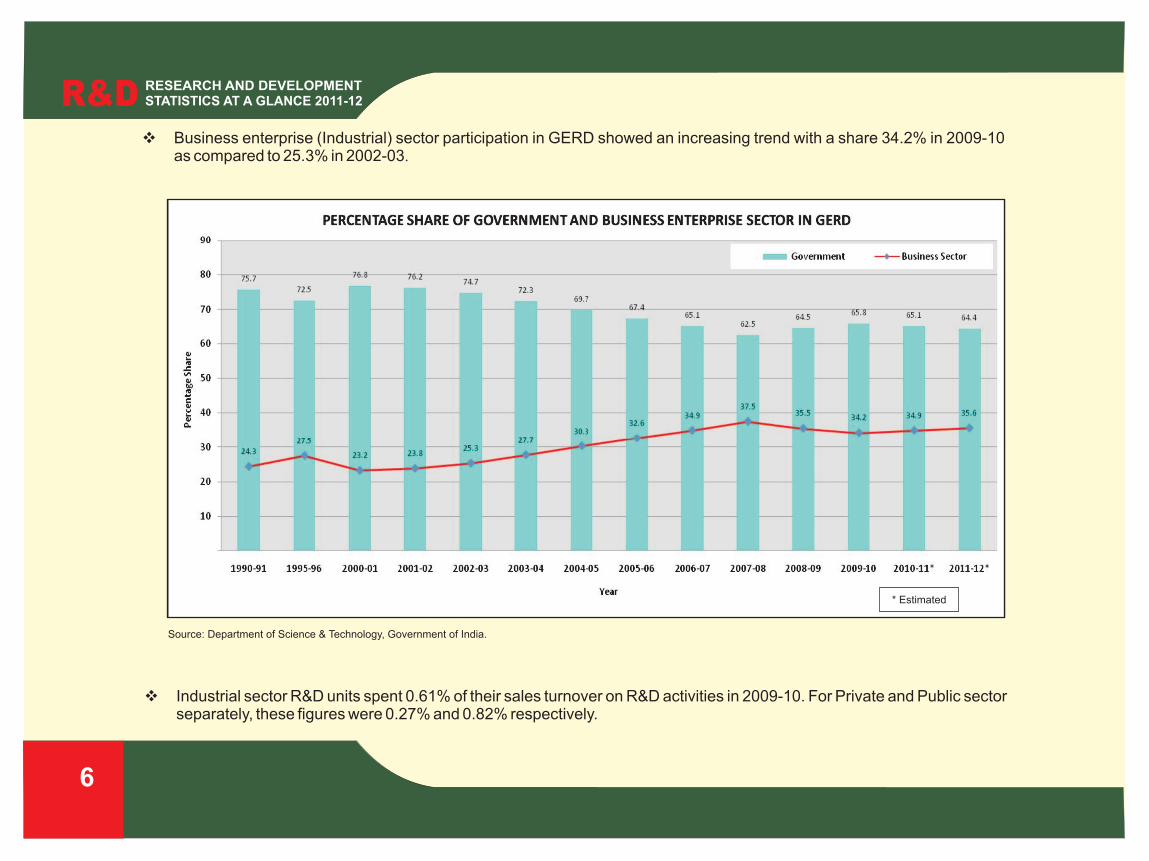
6
vas compared to 25.3% in 2002-03.
Business enterprise (Industrial) sector participation in GERD showed an increasing trend with a share 34.2% in 2009-10
Source: Department of Science & Technology, Government of India.
vseparately, these figures were 0.27% and 0.82% respectively.
Industrial sector R&D units spent 0.61% of their sales turnover on R&D activities in 2009-10. For Private and Public sector
* Estimated

R&D RESEARCH AND DEVELOPMENTSTATISTICS AT A GLANCE 2011-12
7
v14.0%, Information Technology 13.6%, and Defence Industries 6.1% respectively during 2009-10.
In Industrial R&D, Drugs and Pharmaceutical occupied the first place with a share of 27.7% followed by Transportation
Source: Department of Science & Technology, Government of India.
vDrugs and Pharma, Transportation, Information Technology etc dominated the Private Sector R&D.
During 2009-10, Public Sector R&D was led by Defence Industries followed by Fuels and Metallurgical Industries while
R&D Expenditure (Rs. Crores)

R&D RESEARCH AND DEVELOPMENTSTATISTICS AT A GLANCE 2011-12
8
v Extramural R&D support by Central Government Agencies has increased from Rs. 286.71 crores in 2000-01 to Rs. 1,358.04 crores in 2009-10. Its share in the national GERD was 2.6% during 2009-10.
v The Department of Science and Technology (DST) and Department of Biotechnology (DBT) were the two major players contributing nearly 50% of the extramural R&D support in the country.
v Academic sector received 64% of the total extramural R&D support during the year 2009 -10.
Source: Department of Science & Technology, Government of India.
Number of Projects : 4828 Total approved Cost : Rs. 1358.04 Crores

R&D RESEARCH AND DEVELOPMENTSTATISTICS AT A GLANCE 2011-12
9
v Women participation in extramural R&D projects has increased significantly to 31% in 2009-10 from 13% in 2000-01 due to various initiatives undertaken by the Government in S&T sector. In absolute terms, 1,324 women Principal Investigators (PI) during 2009-10 availed extramural R&D support as against 232 in 2000-01.
v As on 1st April 2010, nearly 4.41 lakhs personnel were employed in the R&D establishments in the country including in-house R&D units of public and private sector industries. 1.93 lakhs (43.7%) were performing R&D activities while 1.24 lakhs (28.2%) each were engaged in auxiliary and administrative / non-technical support activities.
v As on 1st April 2010, there were 27,532 (14.3%) women out of total 1.93 lakhs R&D personnel directly engaged in R&D activities.
v Out of the total 16,093 Doctorates in the country, 8,302 (51.6%) Doctorates were from the S&T discipline during 2010-11.
Source: Department of Science & Technology, Government of India.

R&D RESEARCH AND DEVELOPMENTSTATISTICS AT A GLANCE 2011-12
10
v India spent 0.87% of its GDP on R&D in 2009-10, while the same among other developing BRICS countries was Brazil 1.17%, Russian Federation 1.25%, China 1.70% and South Africa 0.93%. This ratio was less than 0.5% for countries like Pakistan, Sri Lanka and Mexico.
Source: Department of Science & Technology, Government of India.
v Most of the developed countries spent more than 2% of their Gross Domestic Product (GDP) on R&D.

R&D RESEARCH AND DEVELOPMENTSTATISTICS AT A GLANCE 2011-12
11
Source: Department of Science & Technology, Government of India.
v The number of researchers per million population in India increased from 110 in the year 2000 to 164 in 2009.
v Among the other developed countries, Finland topped the list having more than 7,500 researchers per million population in the world followed by Denmark and Singapore with 6,500 and 6,000 respectively during 2009.
v India’s R&D expenditure per researcher was 159.9 ‘000 PPP$ during 2009-10, which was far ahead of Russian Federation, Hungry, China, Mexico etc.
R&D RESEARCH AND DEVELOPMENTSTATISTICS AT A GLANCE 2011-12
12
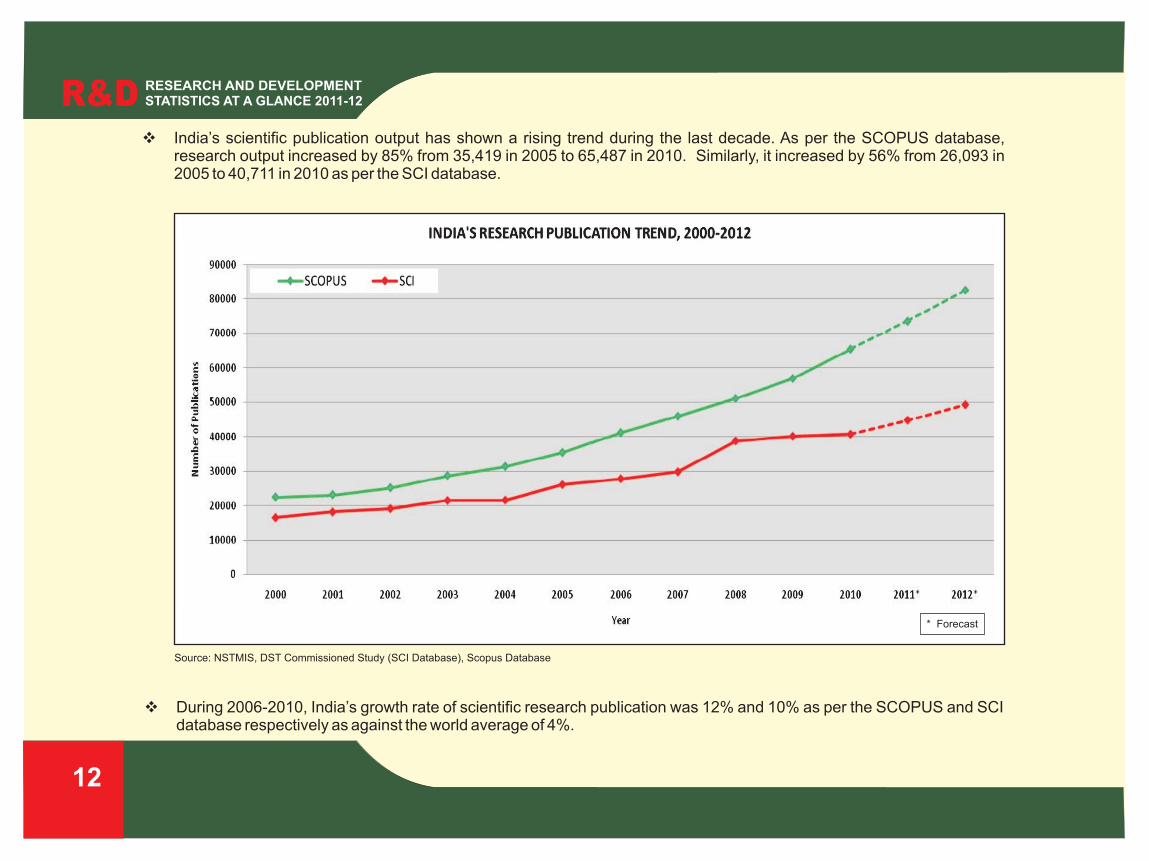
v India’s scientific publication output has shown a rising trend during the last decade. As per the SCOPUS database, research output increased by 85% from 35,419 in 2005 to 65,487 in 2010. Similarly, it increased by 56% from 26,093 in 2005 to 40,711 in 2010 as per the SCI database.
Source: NSTMIS, DST Commissioned Study (SCI Database), Scopus Database
v During 2006-2010, India’s growth rate of scientific research publication was 12% and 10% as per the SCOPUS and SCI database respectively as against the world average of 4%.
* Forecast

R&D RESEARCH AND DEVELOPMENTSTATISTICS AT A GLANCE 2011-12
13
v India’s share in global research publication increased from 2.2% in 2000 to 3.5% in 2010 as per the SCI database. In 2010, India’s largest shares of global research publication were in Chemistry (6.5%), Material Science (6.4%), Agricultural Sciences (6.2%), Pharmacology and Toxicology (6.1%), Micro biology (4.9%), Physics (4.6%) and Engineering (4.2%).
Source: NSTMIS, DST Commissioned Study (SCI ; SCOPUS Database)
v India’s volume of scientific publication remained far ahead of BRICS countries except China during last decade as per SCI database. It surpassed Russia in 2005 and Australia and Korea in 2007. According to UNESCO Science Report 2010, India ranks 9th globally in terms of scientific publication output.
Year

R&D RESEARCH AND DEVELOPMENTSTATISTICS AT A GLANCE 2011-12
14
v During 2010-11 a total of 39,400 patents were filed in India. Out of which 8,312 (21.1%) patents were filed by Indians. Patent applications filed in India are dominated by Computer/Electronics, Mechanical and Chemical fields.
Source: Controller General of Patents, Design and Trade Marks-Annual reports
v Nearly 60% of the foreign patents filed in India during 2010-11 were from three countries viz USA(33.5%), Japan (13.2%) and Germany (11.8%).
Year

R&D RESEARCH AND DEVELOPMENTSTATISTICS AT A GLANCE 2011-12
15
v Total 4,533 R&D institutions were surveyed as a part of the national R&D survey exercised in 2011. 50% of the R&D institutions surveyed were in the private sector.
Source: Department of Science & Technology, Government of India.
SALIENT FEATURES
The forthcoming edition of the Research & Development Statistics 2011-12 will contain detailed Chapters supported by Statistical Tables on the following themes:
Ø National Resources for Research and Development Ø Scientific and Technical Manpower Ø Research and Development in the Central Sector Ø Research and Development in the State Sector Ø Research and Development in the Industrial Sector Ø Higher Education and Scientific Research Ø Research and Development Output Indicators Ø International Comparison of Research and Development Ø Extramural Research and Development Projects by Central Government Department/Agencies

R&D RESEARCH AND DEVELOPMENTSTATISTICS AT A GLANCE 2011-12
16
The present publication is uploaded at
www.nstmis-dst.org
Statistical tables, based on the primary sources data are:
Ø National R&D expenditure and break-up of this into various sectors; Ø National R&D expenditure and percentage of Gross National Product Ø National R&D expenditure at current and constant prices Ø R&D expenditure by Major Scientific Departments/Agencies. Ø R&D expenditure by socio-economic Ministries Ø R&D expenditure by various State Governments Ø S&T expenditure by categories of research – basic, applied, experimental development and Other research related
activities Ø Sector-wise R&D expenditure by objectives defined by UNESCO Ø Sector-wise R&D expenditure by field of research Ø R&D expenditure by Public/Joint Sector companies Ø Sector-wise R&D Manpower Ø R&D manpower by level of qualifications/income/gender Ø Process and products developed and commercialized, Publication data etc.
Research & Development Statistics 2011-12 will also provide information from secondary sources on Enrolment and Outturn of S&T personnel, selected socio-economic statistics, Education expenditure by Central and State Governments, Patents as well as International S&T comparisons. The report is referred as a source book on S&T by the policy makers, planners, researchers, scientists and technologists both nationally and internationally.
NSTMIS Survey Team: Dr. Parveen Arora, Dr. A.N. Rai, Mrs. Namita Gupta,
Acronym: AICTE: All India Council of Technical Education DoC: Department of Coal ISRO: Indian Space Research Organisation MoP: Ministry of Power
AYUSH: Dept. of Ayurveda, Yoga, Naturopathy, Unani, Siddha & DRDO: Defence Research & Development MoCIT: Ministry of Communications & MoWR: Ministry of Water Resources Homoeopathy Organisation Information Technology
CSIR: Council of Scientific & Industrial Research DSIR: Dept. of Scientific & Industrial Research MNRE: Ministry of New & Renewable Energy PCRA: Petroleum Conservation Research Association
DAE: Department of Atomic Energy DST: Department of Science & Technology MoEF: Ministry of Environment & Forest UGC: University Grants Commission
DBT: Department of Biotechnology ICMR: Indian Council of Medical Research MoES: Ministry of Earth Sciences
Unit: 1 Crore = 10 million; 1 million = 10 lakhs
[email protected]@nic.in

DEPARTMENT OF SCIENCE & TECHNOLOGYMINISTRY OF SCIENCE & TECHNOLOGY
GOVERNMENT OF INDIANEW DELHI - 110016 (INDIA)
Prin
ted
at W
este
rn P
rintin
g G
rou
p, S
urve
y of In
dia