research and development (r&d) satellite accounts
TRANSCRIPT
Report on Developing a Satellite Account
for Research and Development in Finland
30 June 2009
Eurostat Grants for 2007 - Theme: 40
Title: Improvement of quality of National Accounts
Grant agreement 40100.2007.001-2007.315

2
RESEARCH AND DEVELOPMENT (R&D) SATELLITE ACCOUNTS ........................................................................ 3
1. BACKGROUND TO THE CHANGE IN TREATMENT OF R&D ................................................................................................... 3 2. INTERNATIONAL GUIDELINES ON TREATMENT OF R&D ..................................................................................................... 3
2.1. R&D treatment principles and practice according to SNA93 and ESA95 ................................................................. 3 2.2. Capitalisation of R&D in core national accounts ...................................................................................................... 5 2.3. Capitalisation of R&D in EU countries’ satellite accounts ..................................................................................... 8
3. R&D CAPITALISATION IN FINLAND’S SATELLITE ACCOUNTS ........................................................................................... 12 3.1. Organisation, data sources and calculation process ............................................................................................... 12 3.2. Private sector R&D calculation method ................................................................................................................. 14 3.3. Calculation method for general government R&D .................................................................................................. 15 3.4. R&D capital stock and consumption of fixed capital ............................................................................................... 16 3.5. Deflators used for R&D in constant prices .............................................................................................................. 17
4. MAIN RESULTS FROM THE CAPITALISATION OF R&D ...................................................................................................... 18 5. CONCLUSIONS .................................................................................................................................................................. 23
REFERENCES ...................................................................................................................................................................... 25
REFERENCES ...................................................................................................................................................................... 25
ANNEX TABLES .................................................................................................................................................................... 26
3
Research and development (R&D) satellite accounts
1. Background to the change in treatment of R&D
The treatment of research and development activities in the UN guidelines on the compi-
lation of national accounts (SNA2008) is changing: R&D output will for the most part be
capitalised, that is, treated as fixed capital formation. The investment character of R&D
as a key factor in economic growth was recognised already in the SNA93 revision but due
to lacking unanimity the timetable did not allow for the change to be implemented. By
contrast, at that time treatment changes were implemented in many other intellectual
property products: inputs to computer software, original works of art, literature and enter-
tainment as well as exploration of minerals are treated as investments already in national
accounts according to SNA93.
In the ESA revision based on SNA2008 introduced in the EU countries the change in
treatment of R&D will not be included in core national accounts. Instead plans foresee
mandatory production of R&D satellite accounts. In order to develop and test a capitalisa-
tion method of R&D suitable for EU countries, plans have been made to launch experi-
mental calculations in 2011. Introducing R&D satellites into regular production is
planned for 2014 in connection with the ESA revision. The long-term goal is to develop,
in connection with the R&D satellite, a sufficiently reliable and comparable R&D capi-
talisation method suitable for EU countries which could be included in core national ac-
counts.
A R&D satellite compiled separately from national accounts will obviously not have di-
rect GDP impacts. However, as the long-term goal is to include the R&D treatment
change in the core national accounts, it is necessary to monitor the impacts of R&D capi-
talisation on key aggregates of national accounts already in the experimental calculations.
The change in methodology will increase GDP mostly as regards R&D produced for the
own use of market producers. As regards general government and other non-market pro-
ducers, the change would not have much of a GDP impact as the R&D output formed as
the sum of non-market producers’ costs would be moved from final consumption to a dif-
ferent category of final use, i.e. gross fixed capital formation. In such a case only the con-
sumption of fixed capital would increase the GDP of non-market producers.
R&D satellites have already been compiled or are currently being compiled in several
OECD and EU countries. Eurostat has encouraged EU Member States to develop R&D
satellites. The development work is also supported by the EU in form of financial grants.
At Statistics Finland a R&D satellite development project was launched in 2008 and its
task was to compile R&D supply and use tables from 1995 onwards and to report the re-
sults and compilation methods to Eurostat in summer 2009.
2. International guidelines on treatment of R&D
2.1. R&D treatment principles and practice according to SNA93 and ESA95
In SNA93 (6.142) R&D activity is defined in the following way: “Research and devel-
opment is creative work undertaken on a systematic basis to increase the stock of knowl-

4
edge, and use this stock of knowledge for the purpose of discovering or developing new
products, including improved versions or qualities of existing products, or discovering or
developing new or more efficient processes of production.”
R&D activity is to be separated from the other activities of the unit and treated as a sepa-
rate establishment. If an establishment cannot be separated, R&D activity should be
treated as a secondary activity of the unit. By contrast, R&D may not be treated as ancil-
lary activity, as R&D is not connected with current but future production. The method
complies with the standard industrial classification1 and the Business Register
2.
The value of R&D deliveries between the establishments (local KAUs) of a single institu-
tional unit, e.g. a non-financial corporation, must be recorded both as output of the pro-
ducing establishment and intermediate consumption of the user establishments. By con-
trast, goods and services produced and consumed within the same establishment and the
same accounting period are not entered as the establishment’s output or intermediate con-
sumption (ESA 3.14-3.15).
In the source statistics of Finnish national accounts only institutional units specialised in
research activities are in practice classified in R&D industry, as the output and expendi-
ture of R&D activities of other institutional units can, with the available information, not
be separated into their own R&D establishments and treated as secondary activities. In
these cases a non-financial corporation’s R&D activity is, contrary to the above princi-
ples, treated as ancillary activity. Thus, the R&D it produces is not recorded as a separate
R&D product used as an intermediate product in the non-financial corporation’s manufac-
turing or other activity.
In case the information basis is missing, the separation of the R&D activities of institu-
tional units would in national accounts require a large quantity of imputation. At the same
time the level of detail in the compilation of the accounts would need to be significantly
reduced. The current practice has been justified with avoiding imputations and maintain-
ing a detailed link to the basic data of the source statistics.
Treatment of multinationals is a special case as the parent company of an enterprise group
merchants products manufactured by its subsidiaries located in other countries, the large
surplus it receives from this activity according to Structural Business Statistics has been
seen as compensation for the R&D, administrative, marketing, etc., services produced by
the parent to its subsidiaries free of charge. Most of the merchanting surplus (70%) has
been interpreted as compensation for using R&D. Merchanting takes place between third
countries and the products traded are not included in Finland’s goods imports or exports.
According to the new Balance of Payments manual (BPM6)3 connected with SNA2008
(10.41-10.49), merchanting must be entered into a country’s goods exports first as a nega-
tive item and then as a positive item larger in value. In this way the merchanting margin
remains in the output of the country engaged in merchanting as compensation for R&D
and other services.
1 TOL2002 section 1.3.1 and TOL 2008 section 1.4.2. (TOL2002 and TOL2008 are Finnish industrial classifications
based on NACE Rev. 1 and NACE Rev. 2) The revised industrial classification NACE Rev.2 will be introduced in na-
tional accounts in 2011. 2 Business Register Decree 177/2008 and respective previous Decree 696/93. 3 Balance of Payments and International Investments Position Manual, Sixth Edition (BPM6) International Monetary
Fund, March 2008

5
Alternatively, the revenue to the group parent company from the merchanting of a sub-
sidiary’s products could be treated as property income from direct investment. This would
require a recalculation of national accounts series and a checking of foreign trade in ser-
vices to ensure consistency.
The output of R&D services is valued, according to producer type, in the following way
(ESA 3.64):
– R&D by specialised market producers is valued at the revenues from R&D sales, etc.,
in the usual way.
– Output of R&D for own use should, in principle, be valued on the basis of the esti-
mated basic prices that would be paid if the research were sub-contracted commer-
cially. However, in practice, output of R&D for own use is likely to have to be calcu-
lated on the basis of total production costs.
– R&D from non-market producers (general government and non-profit institutions) is
valued on the basis of production costs. They can also have sales revenues from
commercial R&D production as a secondary activity.
R&D does not include software development as primary or subsidiary activity.
No changes are to be introduced to the definition of R&D activity production and calcula-
tion rules in the SNA/ESA revision, but their content is to remain in line with current rec-
ommendations. This is defined in SNA2008 section 6.207 and paragraph 3 of the ESA re-
vision.
2.2. Capitalisation of R&D in core national accounts
SNA2008
In SNA2008 the change in the treatment of R&D and its justifications are presented rather
concisely and as regards practical instructions, reference is made to OECD Handbook
(Draft Handbook on Deriving Capital of Intellectual Property Products, May 2009) to be
published separately.
According to SNA2008 only such R&D output should be treated as investment which
creates future economic benefits to the owner of the R&D asset. After capitalisation of
R&D, patents are no longer assets, but the acquisition of user rights to the R&D asset is
treated (10.105) depending on the agreement, either as an acquisition of a R&D asset or as
a R&D service (operating leasing). The general criteria for treating the use licenses (cop-
ies) of similar intellectual property rights as investments is explained under 10.100 of the
SNA revision. According to it the annual fees based on a long-term use license agreement
are seen as acquisition of asset by the licensee, that is, as investments.
Annex 4 to SNA 2008 Volume 2. (A.52-A4.55) examines the extension of the concept of
assets to include other assets (intellectual property assets) where future revenue is ex-
pected from investment. R&D assets are a part of the innovation process which comprises
in addition to R&D also investments in market research, sales promotion, branding, etc.,
related to new products. In the new SNA these expenses are treated as non-produced as-
sets, whose development is recorded as operating costs. They are recorded into balance
sheets as marketing assets only when they are sold. Marketing assets are excluded from
fixed assets simply because it is difficult to determine their value.
6
Human capital is not included in the SNA concept of assets, even though the key impor-
tance of human knowledge capital in most production processes is recognised. Including
human capital in the SNA framework has been repeatedly called for despite the large con-
ceptual and practical problems associated with it.
OECD practical guidelines and Eurostat statements
Guidelines related to the practical implementation of R&D capitalisation have been pre-
pared in an OECD Task Force, and a manual is being drafted.4 The task of the Eurostat
working group, which has been working simultaneously and in collaboration with the
OECD working group, has been to prepare during 2008-2009 the contents of the manda-
tory R&D satellite accounts.
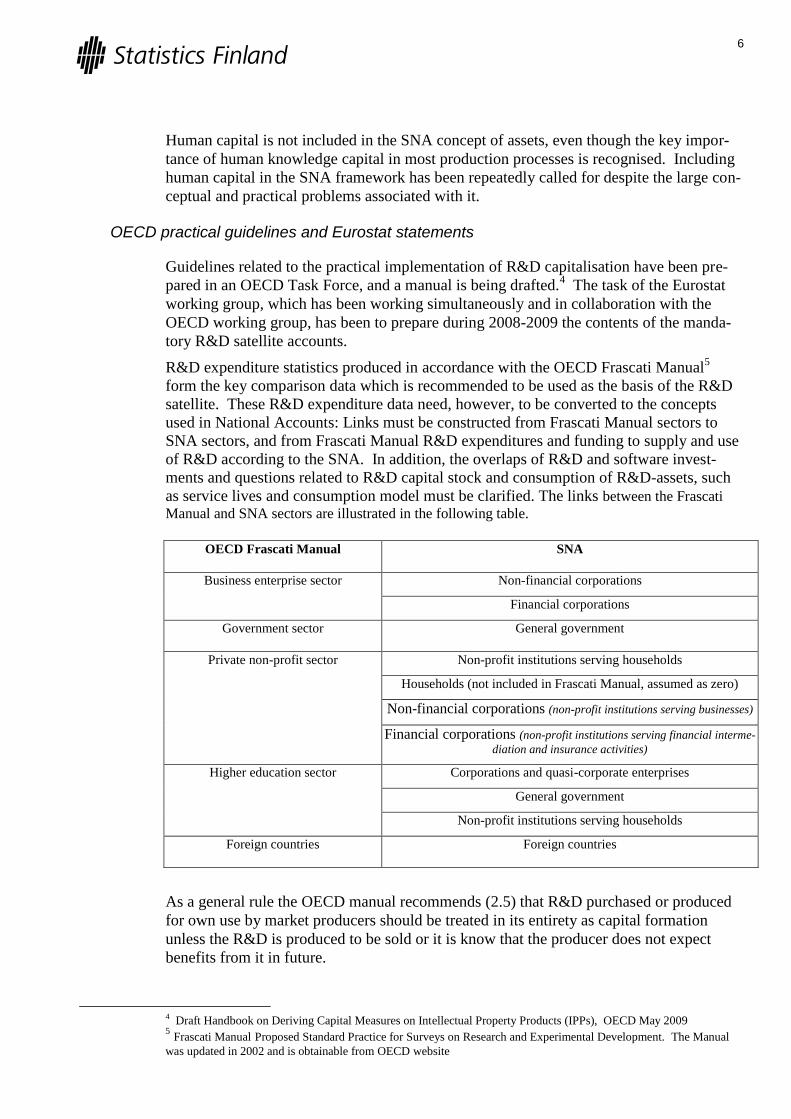
R&D expenditure statistics produced in accordance with the OECD Frascati Manual5
form the key comparison data which is recommended to be used as the basis of the R&D
satellite. These R&D expenditure data need, however, to be converted to the concepts
used in National Accounts: Links must be constructed from Frascati Manual sectors to
SNA sectors, and from Frascati Manual R&D expenditures and funding to supply and use
of R&D according to the SNA. In addition, the overlaps of R&D and software invest-
ments and questions related to R&D capital stock and consumption of R&D-assets, such
as service lives and consumption model must be clarified. The links between the Frascati
Manual and SNA sectors are illustrated in the following table.
OECD Frascati Manual SNA
Business enterprise sector Non-financial corporations
Financial corporations
Government sector General government
Private non-profit sector Non-profit institutions serving households
Households (not included in Frascati Manual, assumed as zero)
Non-financial corporations (non-profit institutions serving businesses)
Financial corporations (non-profit institutions serving financial interme-
diation and insurance activities)
Higher education sector Corporations and quasi-corporate enterprises
General government
Non-profit institutions serving households
Foreign countries Foreign countries
As a general rule the OECD manual recommends (2.5) that R&D purchased or produced
for own use by market producers should be treated in its entirety as capital formation
unless the R&D is produced to be sold or it is know that the producer does not expect
benefits from it in future.
4 Draft Handbook on Deriving Capital Measures on Intellectual Property Products (IPPs), OECD May 2009 5 Frascati Manual Proposed Standard Practice for Surveys on Research and Experimental Development. The Manual
was updated in 2002 and is obtainable from OECD website
7
According to the recommendation (2.8), R&D acquisition costs in the industry of research
and development (Nace Rev.1: 72 Scientific research and development) should be treated
as intermediate consumption to avoid a double entry into investments. This approach is
based on the assumption that R&D produced by units specialised in research and devel-
opment activities is intended for sale and R&D acquisition costs are included in the prod-
ucts sold. R&D acquisitions are entered as investments only if it is known that e.g. patents
or user licenses have been acquired.
When examining double counting, Eurostat finds that the special character of R&D should
be taken into account: R&D is knowledge which is not lost during the production process.
Hence R&D should not be entered as intermediate consumption. Eurostat’s position is,
however, in conflict with the practical recommendations (2.8) of the OECD manual based
on SNA. Support has been expressed in the Eurostat working group for both the gross en-
try recommended by OECD and the net entry recommended by Eurostat, in which sub-
contracting of R&D would not be entered into the output of the enterprise nor in interme-
diate consumption, but it would be entered directly as final use in investments. The choice
of method, however, does not have a GDP impact. In practical calculation the risk of dou-
ble counting must be taken into account especially when the party subcontracting R&D is
also a producer of R&D.
According to SNA2008, freely available R&D does not fulfil the criterion of a capitalis-
able asset, as the owner does not expect benefit from it in the form of e.g. improved pro-
ductivity or lower costs. The OECD Task Force group proposed first a division by type of
research, according to which basic research performed by general government and univer-
sities would not be capitalised. The proposal did not get sufficient support, however, as it
was seen as an overly rough method. Finland’s R&D expenditure statistics do not include
data by type of research and according to the Regulation6, such data are not included in
the data to be delivered obligatory to Eurostat.
The draft OECD manual recommends (2.5) as the best alternative to find out the R&D in-
vestments of non-market producers that they be asked if they expect economic benefit
from R&D. If this information is missing, it is recommended that the FM classification
according to socio-economic objectives (SEO) is used to divide the R&D costs of non-
market producers into R&D capitalised for their own service production and freely avail-
able R&D. The last mentioned group excluded from capitalisation would include mostly
research serving market producers, for which SEO classed 6, 7, 9 and 10 have been pro-
posed.
The SEO classification comprises 12 main groups of R&D: 1) Exploration and exploitation of the Earth
2) Infrastructure and general planning of land use
3) Control and care of the environment
4) Protection and improvement of human health
5) Production, distribution and rational utilisation of energy
6) Agricultural production and technology
7) Industrial production and technology
8) Social structures and relationships
9) Exploration and exploitation of space
10) Non-oriented research
6 Commission Regulation (EC) No 753/2004 implementing decision No 1608/2003/EC of the European Parliament and
of the Council as regards statistics on science and technology.
8
11) Other civil research
12) Defence
In most OECD countries R&D expenditures are, however, not available with the SEO
classification and the R&D expenditures according to the classification are not included in
the mandatory data to be delivered to Eurostat as set out in the above-mentioned regula-
tion. Finland does not produce R&D expenditures with the SEO classification.
If R&D expenditures are not available with the SEO classification, the draft OECD man-
ual recommends (2.6) that they be imputed on the basis of Government Budget Appro-
priations of Outlays for R&D by Socio-economic Objectives (GBAORD) data or other
available data (2.7). Public financing of R&D according to the GBAORD classification as
a source of SEO data is available in all OECD countries, but it usually covers only the
central government budget.
In contrast to OECD guidelines, in earlier meetings of the Eurostat working group the
treatment of non-market producers of R&D entirely as formation of fixed capital has re-
ceived wide support, as
– in practice it is difficult to define from which R&D government and non-profit insti-
tutions do not expect economic benefit in the future,
– when R&D is produced, it is generally not known if it will become freely available or
not, and
– the R&D assets of government and non-profit institutions can be interpreted as pro-
ducing capital services to their users (society) in a way similar to investments in in-
frastructure.
The position of the Eurostat working group has been justified with the interpretation of
the SNA. Basic research by general government is, indeed, expected to produce gains in
future. As the objective is to increase general knowledge in society, freely available re-
search is a tool with which this objective can be reached. Government produces the R&D
asset and remains as its owner. The freely available research is not seen as the asset; in-
stead the asset consists of the R&D services produced by government.
In the final meeting of the Eurostat working group in May 2009, the SNA interpretation
according to the OECD manual of how to treat freely available R&D received strong sup-
port. The different positions adopted by the OECD and Eurostat were seen as regrettable,
as the objective is to produce a unanimous recommendation on practical applications. Eu-
rostat will prepare a new paper to be discussed in the joint meeting of national and finan-
cial accounts in November.
2.3. Capitalisation of R&D in EU countries’ satellite accounts
The following set of six tables to be filled by member states were accepted in the last
meeting of R&D Task Force in May 2009.
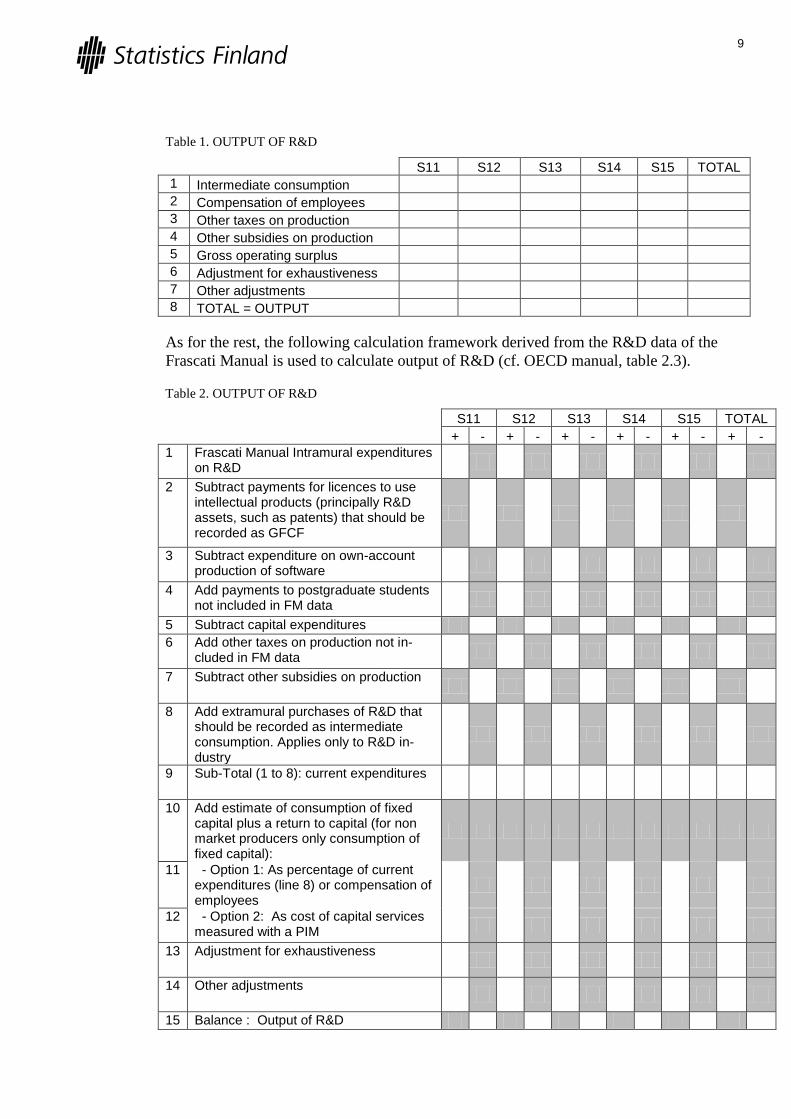
The first table based on direct data sources can be used in EU countries to calculate the
output of R&D in sectors for which a sufficient data set is available, e.g. general gover-
ment (S13).
9
Table 1. OUTPUT OF R&D
S11 S12 S13 S14 S15 TOTAL
1 Intermediate consumption
2 Compensation of employees
3 Other taxes on production
4 Other subsidies on production
5 Gross operating surplus
6 Adjustment for exhaustiveness
7 Other adjustments
8 TOTAL = OUTPUT
As for the rest, the following calculation framework derived from the R&D data of the
Frascati Manual is used to calculate output of R&D (cf. OECD manual, table 2.3).
Table 2. OUTPUT OF R&D
S11 S12 S13 S14 S15 TOTAL
+ - + - + - + - + - + -
1 Frascati Manual Intramural expenditures on R&D
2 Subtract payments for licences to use intellectual products (principally R&D assets, such as patents) that should be recorded as GFCF
3 Subtract expenditure on own-account production of software
4 Add payments to postgraduate students not included in FM data
5 Subtract capital expenditures
6 Add other taxes on production not in-cluded in FM data
7 Subtract other subsidies on production
8 Add extramural purchases of R&D that should be recorded as intermediate consumption. Applies only to R&D in-dustry
9 Sub-Total (1 to 8): current expenditures
10 Add estimate of consumption of fixed capital plus a return to capital (for non market producers only consumption of fixed capital):
11 - Option 1: As percentage of current expenditures (line 8) or compensation of employees
12 - Option 2: As cost of capital services measured with a PIM
13 Adjustment for exhaustiveness
14 Other adjustments
15 Balance : Output of R&D

10
National Accounts should contain the value of R&D produced by postgraduate students
(4) which is not included in the FM R&D expenditure. In Option 1 the consumption of
fixed capital can be calculated either as a percentage of current expenditures or compensa-
tion of employees. The total output of R&D services is formed as a sum of the outputs in
these two tables (8 + 15) depending on available data basis by sectors.
According to Table 3 R&D investments are calculated in the following way (cf. OECD
manual table 2.5)
Table 3. GFCF OF R&D
S11 S12 S13 S14 S15 TOTAL
- + - + - + - + - + - +
1 R&D output
2 Add Imports of R&D
3 Add trade margins
4 Add taxes on products
5 Subtract subsidies on products
6 Subtract extramural purchases of R&D that should be recorded as intermediate consumption. Applies only to R&D in-dustry
7 Subtract Acquisitions of R&D not ex-pected to provide a benefit
8 Subtract changes in inventories of fin-ished R&D
9 Subtract Exports of R&D
10 Add Net purchases of R&D between domestic sectors
11 Sub-Total
12 Balance: Total GFCF of R&D
13 Add/subtract capital transfers of R&D assets between sectors in capital ac-count
Table 4 contains the stock of fixed R&D assets and their consumption by sector.
Table 4. R&D ASSETS AND CONSUMPTION OF FIXED CAPITAL
1 2
R&D assets CFC
1 S11
2 S12
3 S13
4 S14
5 S15
6 TOTAL
When calculating consumption of fixed capital, it is necessary to share experiences and
take advantage of the development work of other countries on service lives and the meth-

11
ods used. It has also been proposed that the OECD Task Force would develop average
service lives for use by countries without their own estimates.
A R&D satellite compiled separately from national accounts will naturally not have a di-
rect impact on GDP. However, as the long-term objective is to include the capitalisation
of R&D into the core national accounts, it is necessary to look at the GDP impact due the
change of R&D treatment as presented in Table 5 by components before and after capi-
talisation of R&D.
Table 5. IMPACT OF RECLASSIFICATION OF R&D ON THE VALUE ADDED BY INDUSTRIES
Market producers
of R&D (by NACE)
Non-market pro-ducers of R&D
(by NACE) TOTAL
1 Output before R&D capitalisation
2 Changes in output because of own account production of R&D
3 Changes in output because of government consumption of fixed capital of R&D
4 Output after R&D capitalisation
5 Intermediate consumption before R&D capitalisation
6 Changes in intermediate consump-tion because of capitalisation of R&D purchases previously in-cluded in IC
7 Intermediate consumption after R&D capitalisation
8 Value added before R&D capitali-sation
9 Changes in value added
10 Value added after R&D capitalisa-tion
In addition it was agreed that the table describing the impact on GDP will be extended to
cover all three approaches (production, income and expenditure) as presented in Table 7.
Concerning production approach and expenditure approach the table will also be calcu-
lated at constant prices in order to examine the impact of capitalisation on the develop-
ment of GDP volume with sufficiently long time series.

12
Table 6. IMPACT OF RECLASSIFICATION OF R&D ON THE GROSS DOMESTIC PRODUCT
Before R&D capi-talisation
After R&D capi-talisation
FROM THE OUTPUT
Output (basic prices)
Intermediate consumption (excl. deductible VAT) (-)
Value added (gross, basic prices)
Taxes less subsidies on products
Taxes on products
Subsidies on products (-)
Difference imputed and paid VAT
Domestic product (gross, market prices)
FROM THE GENERATION OF INCOME
Compensation of employees
Wages and salaries
Employers’ social contributions
Taxes on production and imports less subsidies
Taxes on production and imports
Subsidies (-)
Operating surplus/mixed income (gross)
Consumption of fixed capital
Operating surplus/mixed income (net)
Domestic product (gross, market prices)
FROM THE FINAL EXPENDITURE
Final consumption expenditure
Fixed capital formation (gross)
Changes in inventories 1)
Exports of goods and services
Imports of goods and services (-)
Domestic product (gross, market prices)
1) Including acquisitions less disposals of valuables.
The final decision on the treatment of freely available R&D produced by non-market pro-
ducers will be postponed to a later time in 2009 and the detailed contents of the spread-
sheets will be clarified by the end of the year.
It was proposed in the last meeting that the transmission of the R&D tables could be im-
plemented in 2012 for the first time.
3. R&D capitalisation in Finland’s satellite accounts
3.1. Organisation, data sources and calculation process
Statistics Finland started in January 2008 a project for developing a satellite account
on R&D by June 2009. Eurostat admitted grant financing for the project. The work
was carried out by experts of national accounts in co-operation with those of
source statistics. Project leader and three other members in the project group were
from national accounts, one from R&D expenditure statistics and one from interna-
13
tional trade in services statistics. The steering group of the project consisted of two
persons from national accounts and one from R&D expenditure statistics. Project
leader participated in both groups.
Main data sources used for R&D satellite at detailed level are following:
– National accounts,
– R&D expenditure statistics,
– Statistics of international trade in services,
– Structural business statistics,
– Structural earnings statistics.
The project was intended to be implemented in successive phases, but in practice
the progress was not so straightforward due to conceptual ambiguities and different
interpretations of Eurostat and OECD parallel groups, learning process as well as
other duties and priorities of the participants. The project consisted of following
working phases:
1) drawing a plan for the whole project, definition of successive tasks and timetable for
their implementation
2) conceptual delineation, clarification of the exercise based on international manuals
and guidelines, finding out former experience on R&D satellites in other countries,
investigation problematic areas and alternative treatments
3) finding out available data sources and their deviations from of national accounts con-
ceptually as well as in respect of coverage
4) construction of capital stock for consumption of fixed capital needed for calcula-
tion of R&D output
5) developing a method for estimating return to capital (net operating surplus) of
R&D for market producers, remarkable surplus generated from merchanting of mul-
tinational enterprises is presented as a different item under operating surplus
6) tracing of developers of software and their compensations by linking R&D expendi-
ture data with structural earnings statistics for eliminating the overlapping the soft-
ware capitalised in present national accounts from FM based R&D expenditure
7) linking source data with register identity codes, checking and correcting results
8) clarification of other subsidies on production based on data of R&D expenditure sta-
tistics
9) bridge tables from FM expenditure data to supply and use of R&D of national ac-
counts separately for market and non-market producers by industry and by sector
1995-2006
10) evaluation of available price indexes for calculation of R&D value components in
previous year’s prices; volumes and changes in time for capitalised R&D by indus-
try and by sector 1995-2006
11) definition of service lives and construction of capital stock for capitalised R&D as-
sets by industry and by sector;
12) information for Finnish users in three phases: articles on capitalisation R&D in Octo-
ber 2008, a presentation on the issue in SNA-ESA revision seminar in January 2009
and a seminar on preliminary results from the project in May 2009
14
13) analysis of outcomes incl. impacts to GDP, critical points and proposals for im-
provements R&D satellite accounts to be produced annually in the near future
14) reporting of the project for Eurostat
3.2. Private sector R&D calculation method
Corporations’ R&D calculations are compiled the 2-digit level of the industrial classifica-
tion (TOL2002), apart from primary production for which the 1-digit level is used. The
calculations cover the years 1995-2006. As the available data are deficient, the results for
the 90s are not wholly comparable with later years.
Corporations’ supply and use of R&D is derived from data on R&D expenditure as fol-
lows:
R&D expenditure (BERD)
minus capital expenditure (investments)
plus consumption of fixed capital
plus operating surplus (return on capital)
plus operating surplus from merchanting (separate)
minus other subsidies on production
minus software development expenditure
plus intermediate consumption
= OUTPUT of R&D
plus imports
minus exports
= R&D INVESTMENTS (FIXED CAPITAL FORMATION)
In statistics on R&D expenditure (BERD) research and development expenditure have
been raised to the level of the whole economy with a turnover coefficient. The missing
data for 1996 have been intrapolated on the basis of data for 1995-1997. A corresponding
raising and intrapolation has been performed on the investments in the R&D expenditure
statistics (machinery, equipment, buildings and other acquisition costs of fixed assets).
The annual investments in the R&D expenditure statistics are replaced with consumption
of fixed capital, that is, in the calculations investments are deducted and consumption is
added.
For determining consumption of fixed capital for R&D activity, the stock of capital used
in R&D production in 1994 has been assessed. The calculations have used the national
accounts ratio of the net stock of fixed capital to investments by industry in the following
way:
CS_new=NCS_Na/GFCF_Na*GFCF_BERD-GFCF_BERD
in which NCS_Na represents the value of the net capital stock in the industry in 1995,
GFCF_Na represents investments in the industry in 1995 and GFCF_BERD represents the
acquisition costs of the industry in R&D expenditure statistics. After that consumption is
calculated for 1995: investments (GFCF_BERD) are added to the capital stock of the pre-
vious year and the result is multiplied with the rate of depreciation:
15
Dep=(CS_new+ GFCF_BERD)*Dep_rate
where Dep represents depreciation for the current year, CS_new represents the capital
stock for the previous year, GFCF_BERD represents gross fixed capital formation in-
cluded in BERD and Dep_rate represents the rate of depreciation for each industry.
The net stock of the year is accrued so that investments are added to the previous years'
capital stock and consumption is deducted:
CS_new(t)=CS_new(t-1)+ GFCF_BERD- Dep
Operating surplus (return on capital) has been obtained by multiplying investments by in-
dustry with the net return rates by industry of the productivity review. Merchanting sur-
plus is given as a separate component of operating surplus. Its calculation method is ex-
plained in paragraph 2.1.
Other subsidies on production have been calculated as the weighted sum of external fi-
nancing (subsidies, chargeable research) in R&D expenditure statistics.
Data from the structural earnings statistics concerning the ration of software developers
to all researchers was used to eliminate software overlaps. Missing data for 1996 have
been linearly intrapolated on the basis of data for 1995-1997. All the required data are
available from the structural earnings statistics as from 2003. Earlier years’ missing data
by industry on software developers have been imputed with the assumption that software
developers in relation to employees in the industry follow the same development as all re-
searches in relation to employees in the industry.
Intermediate consumption has been calculated as the sum weighted with the turnover co-
efficient of the R&D ordered by an enterprise from its home country and from abroad ob-
tained from the statistics on R&D expenditure. Data for 1997-1999 have been adjusted
separately and a different method has been used for industry 32 (Manufacture of radio,
television and communication equipment and apparatus).
R&D export and import data are based on data by industry on research and development
services as well as royalties and license fees obtained from statistics on international trade
in services. As there are no data available on R&D user licence agreements, it has been
justified that such agreements have, as a rule, been presumed to be long-term agreements
and have been treaded entirely as an investment in an R&D asset by the licensee.
3.3. Calculation method for general government R&D
The calculation method for general government (incl. other non-profit institutions) based
on R&D expenditure (GERD) is much simpler than that for the private sector. This is due
to a different calculation principle, the characteristics of non-market producers’ R&D and
the data available. As a general rule, capital income is not calculated for non-market pro-
ducers’ R&D and they are not paid any subsidies. As separate data were not available for
the sector's foreign trade in R&D and it was assessed as being of minor significance, it has
not been taken into account in the calculations.
The calculation of general government and non-profit institutions serving households
(S13, S15) is based on R&D expenditure (GERD) as follows:

16
R&D expenditure (GERD)
minus capital expenditure (investments)
plus consumption of fixed capital
minus software development expenditure
= OUTPUT of R&D
= R&D INVESTMENTS (FIXED CAPITAL FORMATION)
Investments comprise the R&D expenditure statistics (GERD) acquisition costs on ma-
chinery, equipment and buildings as well as other fixed assets required in the production
of R&D. Missing data for 1996 have been linearly intrapolated on the basis of data for
1995-1997.
The consumption of fixed capital of the R&D production of general government and non-
profit institutions has been calculated in a similar fashion as for the private sector. A de-
tailed description is included in paragraph 4.2. Structural earnings statistics have been
used in eliminating software overlaps in the same way as for the non-financial corpora-
tions sector. By definition, non-market producers do not have operating surplus.
3.4. R&D capital stock and consumption of fixed capital
We apply in the construction of capital stock the most commonly used approach in capital
stock measurement, the Perpetual Inventory Method (PIM)7. The PIM generates an esti-
mate of the capital stock by accumulating past investments over their estimated service
lives. We use the geometric pattern which implies that a given vintage of investment
loses a fixed percentage of its productive capacity each year. The net capital stock (A) can
be obtained by subtracting accumulated capital consumption from the previous capital
stock and adding current year’s investments (I):
ttt IAA 1)1( ,
where is the depreciation rate. Directly from the estimation of the capital stock we also
obtain the consumption of fixed capital (CFC). CFC is the first part of the formula. Be-
cause the investment series for R&D starts from 1995 an initial capital stock was esti-
mated using average service lives, depreciation rates and 1995 investment data.
Industry-specific depreciation rates for R&D assets where estimated on basis of other
countries’ experiences and used depreciation rates are presented in Table 7.
7 OECD (2001): Measuring Capital – OECD Manual: Measurement of Capital Stocks, Consumption of Fixed Capital
and Capital Services, Paris: OECD.

17
Table 7. Industry-specific depreciation rates for R&D assets
Industry Depreciation
rate
Average ser-
vice life
Chemical and pharmaceutical industry (NACE 23,24)
Communications equipment etc., telecommunications (NACE 30,31,32,33,64)
Software industries (NACE 72)
Other industries
Government sector including non-profit institutions (S13, S15)
0,1
0,2
0,3
0,15
0,1
20
10
7
10
15
3.5. Deflators used for R&D in constant prices
So far there are no special price indices for R&D services in current production of Sta-
tistics Finland. Therefore the substitutes used for deflating components of R&D supply
and use in current prices cannot be in many cases very suitable for describing actual
prices of R&D. However, cost based wage indices can be reasoned as a second best so-
lution since production costs of R&D consist mainly of compensation of employees and
production of R&D for own use is normally significant. In any case it is a challenging
task in practice to develop good price indices for R&D products based on the fact that in
general the R&D product is an unique one without any market price when produced.
3.5.1 Enterprises by components
R&D expenditures of business enterprise sector (BERD) are deflated by indexed labour
costs (LC) per personnel in full time equivalents (FTE):
(LC(t)/FTE(t))/(LC(t-1)/FTE(t-1)).
Prices of gross fixed capital formation is assumed to follow implicit prices of total in-
vestments of current national accounts of R&D industry (73):
(NA_P51_73_CP(t)) / (NA_P51_73_FP(t))
Prices of consumption of fixed capital of is assumed to change according to prices of
gross fixed capital formation.
Volume of other subsidies on production is presumed to follow volume of output of
R&D industry:
(NA_P1R_73_FP(t)) / (NA_P1R_73_CP(t-1))
Intermediate consumption is assumed to follow prices of output of R&D industry in
private sector:
(NA_P1R_73_S11_CP(t)) / (NA_P1R_73_S11_FP(t))
Prices of software follow prices of output in software industry (72) of private sector:

18
(NA_P1R_72_S11_CP(t)) / (NA_P1R_72_S11_FP(t))
Gross operating surplus and surplus from merchanting are assumed to follow same
prices as R&D expenditure of business enterprise sector (BERD)
For imports and exports are used deflators of R&D product (731000) from supply and use
tables
3.5.2 General government and non-profit institutions by components
Deflators used for R&D of non-profit producers are analogous with those of private sec-
tor but more simple consisting only four components.
R&D expenditures of government and non-profit sectors (GERD) are deflated by in-
dexed labour costs of government R&D expenditure (LC) per personnel in full time
equivalents (FTE):
(LC(t)/FTE(t))/(LC(t-1)/FTE(t-1)).
Prices of gross fixed capital formation is assumed to follow implicit prices of total in-
vestments of current national accounts of R&D industry (73):
(NA_P51_73_CP(t)) / (NA_P51_73_FP(t))
Prices of consumption of fixed capital of is assumed to change according to prices of
gross fixed capital formation.
Prices of software follow prices of output in software industry (72) of government:
(NA_P1R_72_S13_CP(t)) / (NA_P1R_72_S13_FP(t))
4. Main results from the capitalisation of R&D
The results are first presented by phases in form of the tables included in the draft min-
utes of the last meeting of Eurostat TF on R&D held in May 2009. However, the rows
and columns which would have left totally empty are deleted for practical reasons.
Then main results covering the years from 2000 onwards are illustrated by diagrams. The
calculations are produced from 1995 onwards but it is sensible to concentrate to the later
part of time period due to quality of data. More extensive figures are presented as annex
tables.

19
Table 2 OUTPUT OF R&D
Year :2006
million € S11 S13 S15 TOTAL
+ - + - + - + -
1 Frascati Manual Intramural expenditures on R&D 4108 1616 35 5759
3 Subtract expenditure on own-account production of software -425 -14 -2 -441
5 Subtract capital expenditures -228 - 45 -1 -274
7 Subtract other subsidies on produc-tion -170 -170
8 Sub-Total (1 to 7): current expendi-tures 4108 -823 1616 - 59 35 - 3 5759 -885
11 - Option 2: As cost of capital ser-vices measured with a PIM
354
40 0 398
- surplus from merchanting of mul-tinationals based on SBS 3455 3455
12 Add extramural purchases of R&D that should be recorded as interme-diate consumption. Applies only to R&D industry
523 523
15 Balance : Output of R&D 7617 1597 32 9246
In Table 2 a new line for surplus generated from merchanting of multinationals is intro-
duced. Payments for licences to use R&D assets included in FM expenditures could not
be subtracted (deleted line 2) due to lacking specified data for direct recording in GFCF,
but finally those are treated as GFCF after first included in output of R&D and then
used as GFCF.
Surplus from merchanting of multinationals accounts for nearly half of R&D output of
enterprises in 2006. The item introduced as a separate part of operating surplus in order to
Chart 1. Output of R&D 2000 - 2006
0
1000
2000
3000
4000
5000
6000
7000
8000
2000 2001 2002 2003 2004 2005 2006
millio
n S11
S13
S15

20
present its dominance in calculation of R&D output. Background of the treatment is cla-
rified in chapter 2. Private enterprise sector accounted for 82.4, government sector
17.3 and non-profit institutions only 0.3 per cent of total output of R&D. Value of R&D
output by sector during this decade is described in the following chart 1. R&D of en-
terprises (S11) has increased all the time whereas R&D of government sector (S13)
has been nearly at the same level as in the beginning of the period. Contribution of non-
profit institutes (S15) has been quite negligible to the total output of R&D.
Transition from output to gross fixed capital formation (GFCF) of R&D is presented in
Table 3. Imports and exports exist only in enterprise sector obtained from statistics of in-
ternational trade in services based on enterprise survey. There are available no corre-
sponding data of non-market sectors (S13, S15) and on the other hand their importance
is assumed insignificant.
Table 3. GFCF OF R&D
Year: 2006
S11 S13 S15 TOTAL
- + - + - + - +
1 R&D output 7617 1597 32 9246
2 Add Imports of R&D 2978 2978
9 Subtract Exports of R&D 4493 4493
13 Balance: Total GFCF of R&D 6101 1597 32 7730
Chart 2. describes foreign trade of R&D. Export of R&D has systematically exceeded
import of R&D. On average, the value of export has been 1.5 times as big as that of
import during 2000-06.
Chart 2. Import and export of R&D
0
500
1000
1500
2000
2500
3000
3500
4000
4500
5000
2000 2001 2002 2003 2004 2005 2006
millio
n Import
Export
net export
21
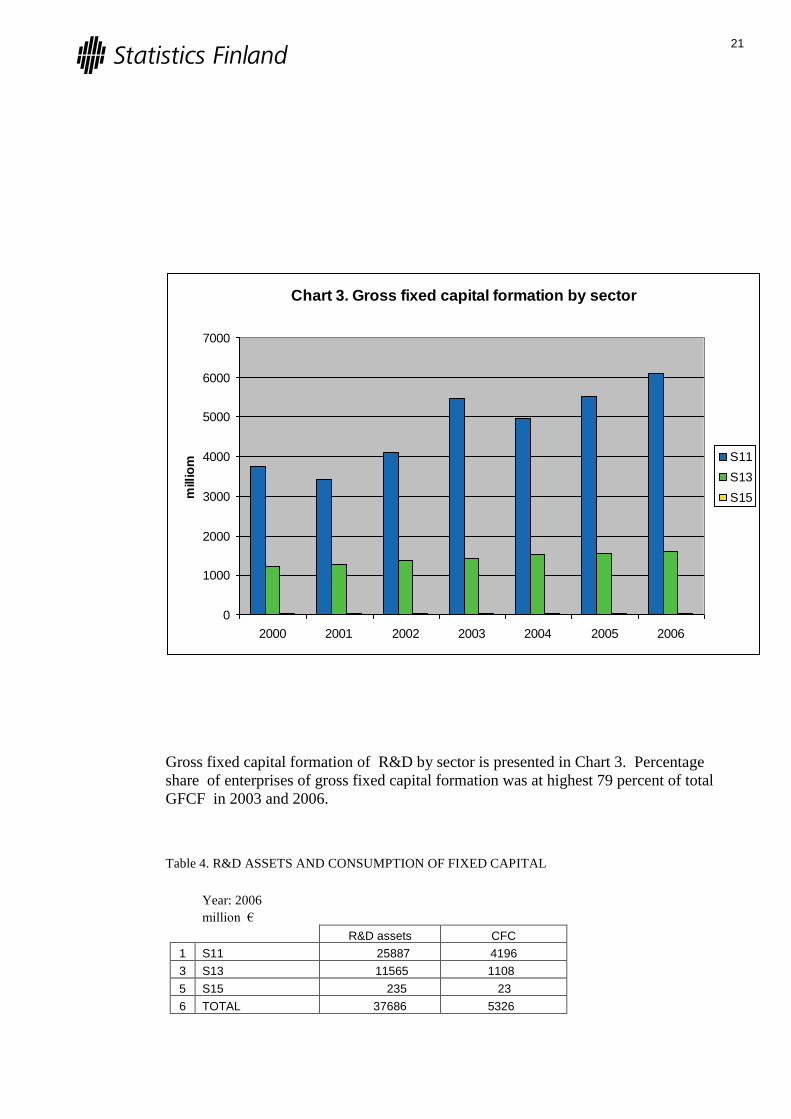
Gross fixed capital formation of R&D by sector is presented in Chart 3. Percentage
share of enterprises of gross fixed capital formation was at highest 79 percent of total
GFCF in 2003 and 2006.
Table 4. R&D ASSETS AND CONSUMPTION OF FIXED CAPITAL
Year: 2006
million €
R&D assets CFC
1 S11 25887 4196
3 S13 11565 1108
5 S15 235 23
6 TOTAL 37686 5326
Chart 3. Gross fixed capital formation by sector
0
1000
2000
3000
4000
5000
6000
7000
2000 2001 2002 2003 2004 2005 2006
mill
iom
S11
S13
S15

22
In government sector the share of the accumulated assets is relatively large and con-
sumption of fixed capital respectively smaller than in enterprise sector due to longer ser-
vice lives.
Provisional impacts of the capitalisation of R&D according to Table 5 (without break-
down by NACE) would increase GDP of the present national accounts 3.5 percent in
2006, of which 3.1 is originated from own account production and intermediate con-
Chart 4. Stock of R&D assets 2000 - 2006
0
5000
10000
15000
20000
25000
30000
2000 2001 2002 2003 2004 2005 2006
mil
lio
n S11
S13
S15
Chart 5. Consumption of R&D capital
0
500
1000
1500
2000
2500
3000
3500
4000
4500
2000 2001 2002 2003 2004 2005 2006
mil
lio
n S11
S13
S15

23
sumption of market producers and 0.4 percent from consumption of fixed capital of
non-market producers.
Table 5. IMPACT OF RECLASSIFICATION OF R&D ON THE VALUE ADDED BY PRODUCER
TYPE
Year: 2006
Market producers of
R&D (by NACE)
Non-market pro-ducers of R&D (by
NACE) TOTAL
1 Output before R&D capitalisation 3883 916 4799
2 Changes in output because of own account production of R&D
3734 3734
3 Changes in output because of gov-ernment consumption of fixed capital of R&D
713 713
4 Output after R&D capitalisation 7617 1629 9246
5 Intermediate consumption before R&D capitalisation
1952 339 2291
6 Changes in intermediate consump-tion because of capitalisation of R&D purchases previously included in IC
1429 1429
7 Intermediate consumption after R&D capitalisation
523 339 862
8 Value added before R&D capitalisa-tion
3360 577 3937
9 Changes in value added 5163 713 5876
10 Value added after R&D capitalisation 7094 1290 8384
Since output of non-market producers is already included in final consumption of present
national accounts, the capitalisation of R&D of non-market producers means transferring
the R&D expenditure to an other component of final uses. Therefore, only consumption
of fixed capital of R&D assets increases value added of non-market producers. The capi-
talisation of R&D would increase value added of market producers (S1) 5.3 percent and
that of non-market producers (S13+S15) 2.4 percent in 2006.
5. Conclusions
The calculations of the first R&D satellite account of Finland can be considered quite ex-
tensive as regards the coverage and the time period. They were carried out by industry,
by producer type and by sector in current and in constant previous year’s prices for years
1995-2006. All available source statistics and other data relevant for developing the R&D
satellite were utilised, but it was not possible to lean on wider separate clarifications or
inquiries within the resources and time available.
It was aimed in the project to take into account the latest guidelines on capitalising R&D.
In some issues those were more or less open due to different interpretations and opinions
of Eurostat and OECD parallel working groups. As regards the most disputable question
on the capitalisation of freely available R&D of government, for the time being it was
agreed to treat the whole R&D of non-market producers as investment in the Finnish
24
R&D satellite. The adopted treatment is in any case of minor importance concerning
GDP impacts, since in Finland R&D is concentrated on market producers.
Even through the calculations of the R&D satellite are quite extensive there are a lot of
components in detail which could not taken into account due to lacking data. On the
other hand, the inclusion of all detailed components was in practice impossible as the ta-
bles to be filled were shaped in their present form until in the summer 2009. The situa-
tion is verified in Chapter 4 where the tables include the filled parts of the complete ta-
bles presented in Chapter 2.3 and the empty lines are excluded. Many lines of Table 2
(Output of R&D) and most of Table 3 (GFCF of R&D output) are missing from the re-
sulted tables whereas none from other tables. Some missing components are not relevant
like R&D not expected to provide benefit in case of capitalisation of all R&D of govern-
ment or excluded by intention as changes in inventories which basically was not taken
into account at all.
A lot of additional detailed data would be needed for improving the present source data of
R&D satellite. This would require a large set of consolidated questions to be asked by
R&D performers and respondents of international trade in services as proposed in the
OECD Handbook 8. However, new surveys or additional questions would be against the
generally accepted principle in EU: avoiding to burden respondents with additional ques-
tionnaires but sooner to decrease less important present ones.
At present it could be possible to carry out more estimations and specifications by experts
of national accounts in co-operation with those of source statistics in order to improve re-
sulted aggregates and to have lacking components of the R&D satellite. International
guidelines, handbooks and templates should provide an unique framework for compiling
comparable R&D satellite accounts by countries. Besides, for common interpretation and
applying of those in practice it is important to co-operate with compilers of R&D satel-
lites in other countries for changing opinions and learning from others’ experience. Per-
haps a common e-forum would be useful for this purpose.
In the long run it would be reasonable to develop recording principles in national accounts
and business bookkeeping closer with each other, if possible. Accounting principles are
in many cases changed closer to business accounting rules in the SNA2008, but unfortu-
nately the treatment of R&D expenditures has been developed to opposite direction in In-
ternational Accounting Standards (IAS) with respect to SNA. According to IAS38 capi-
talising of research expenditures is not allowed at all and that of development expendi-
tures is possible only if specific requirements are fulfilled.
Compared to other studies made on R&D capitalisation and statistics on R&D expendi-
tures, results from the Finnish study seems to be on the correct level as the present GDP
would increase 3.5 percent as consequence of the capitalisation.
8 Annexes 2.1.- 2.3 of Draft Handbook on Deriving Capital Measures on Intellectual Property Products (IPPs), OECD
May 2009
25
References
United Nations: System of National Accounts 1993 (SNA 1993)
United Nations: System of National Accounts 2008 (SNA 2008), Volume 1 (2008) and Draft ver-
sion of volume 2 ( February 2009)
Eurostat: European System of Accounts 1995 (ESA95), 1996
Eurostat: Draft chapters of ESA revision 2008 - 2009
Eurostat: Minutes of the meetings the Task Force on Research and Development 2008 - 2009
OECD: Draft Handbook on Deriving Capital Measures on Intellectual Property Products (IPPs),
May 2009
OECD (2001): Measuring Capital – OECD Manual: Measurement of Capital Stocks, Consump-
tion of Fixed Capital and Capital Services
OECD: Frascati Manual Proposed Standard Practice for Surveys on Research and Experimental
Development (2002).
IMF: Balance of Payments and International Investments Position Manual, Sixth Edition (BPM6),
March 2008
Commission Regulation (EC) No 753/2004 implementing decision No 1608/2003/EC of the
European Parliament and of the Council as regards statistics on science and technology.
26
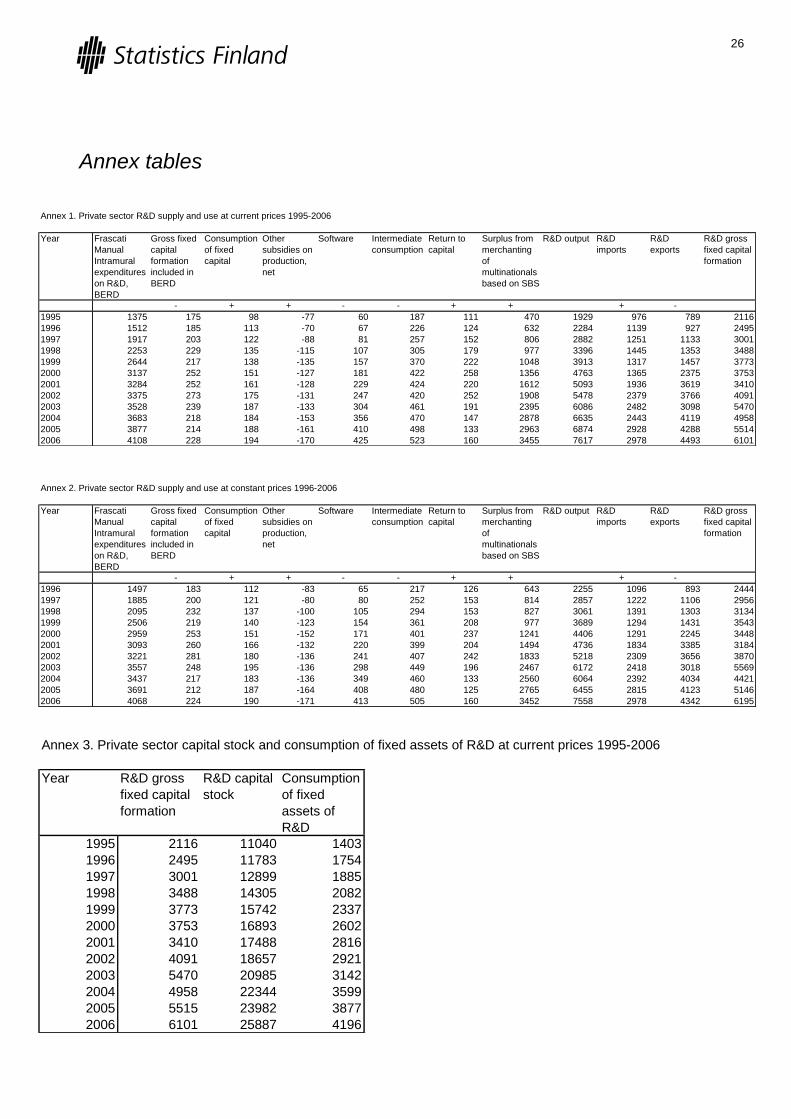
Annex tables
Annex 1. Private sector R&D supply and use at current prices 1995-2006
Year Frascati
Manual
Intramural
expenditures
on R&D,
BERD
Gross fixed
capital
formation
included in
BERD
Consumption
of fixed
capital
Other
subsidies on
production,
net
Software Intermediate
consumption
Return to
capital
Surplus from
merchanting
of
multinationals
based on SBS
R&D output R&D
imports
R&D
exports
R&D gross
fixed capital
formation
- + + - - + + + -
1995 1375 175 98 -77 60 187 111 470 1929 976 789 2116
1996 1512 185 113 -70 67 226 124 632 2284 1139 927 2495
1997 1917 203 122 -88 81 257 152 806 2882 1251 1133 3001
1998 2253 229 135 -115 107 305 179 977 3396 1445 1353 3488
1999 2644 217 138 -135 157 370 222 1048 3913 1317 1457 3773
2000 3137 252 151 -127 181 422 258 1356 4763 1365 2375 3753
2001 3284 252 161 -128 229 424 220 1612 5093 1936 3619 3410
2002 3375 273 175 -131 247 420 252 1908 5478 2379 3766 4091
2003 3528 239 187 -133 304 461 191 2395 6086 2482 3098 5470
2004 3683 218 184 -153 356 470 147 2878 6635 2443 4119 4958
2005 3877 214 188 -161 410 498 133 2963 6874 2928 4288 5514
2006 4108 228 194 -170 425 523 160 3455 7617 2978 4493 6101
Annex 2. Private sector R&D supply and use at constant prices 1996-2006
Year Frascati
Manual
Intramural
expenditures
on R&D,
BERD
Gross fixed
capital
formation
included in
BERD
Consumption
of fixed
capital
Other
subsidies on
production,
net
Software Intermediate
consumption
Return to
capital
Surplus from
merchanting
of
multinationals
based on SBS
R&D output R&D
imports
R&D
exports
R&D gross
fixed capital
formation
- + + - - + + + -
1996 1497 183 112 -83 65 217 126 643 2255 1096 893 2444
1997 1885 200 121 -80 80 252 153 814 2857 1222 1106 2956
1998 2095 232 137 -100 105 294 153 827 3061 1391 1303 3134
1999 2506 219 140 -123 154 361 208 977 3689 1294 1431 3543
2000 2959 253 151 -152 171 401 237 1241 4406 1291 2245 3448
2001 3093 260 166 -132 220 399 204 1494 4736 1834 3385 3184
2002 3221 281 180 -136 241 407 242 1833 5218 2309 3656 3870
2003 3557 248 195 -136 298 449 196 2467 6172 2418 3018 5569
2004 3437 217 183 -136 349 460 133 2560 6064 2392 4034 4421
2005 3691 212 187 -164 408 480 125 2765 6455 2815 4123 5146
2006 4068 224 190 -171 413 505 160 3452 7558 2978 4342 6195
Annex 3. Private sector capital stock and consumption of fixed assets of R&D at current prices 1995-2006
Year R&D gross
fixed capital
formation
R&D capital
stock
Consumption
of fixed
assets of
R&D
1995 2116 11040 1403
1996 2495 11783 1754
1997 3001 12899 1885
1998 3488 14305 2082
1999 3773 15742 2337
2000 3753 16893 2602
2001 3410 17488 2816
2002 4091 18657 2921
2003 5470 20985 3142
2004 4958 22344 3599
2005 5515 23982 3877
2006 6101 25887 4196

27
Annex 4. Private sector capital stock and consumption of fixed assets of R&D at constant prices 1996-2006
Year R&D gross
fixed capital
formation
R&D capital
stock
Consumption
of fixed
assets of
R&D
1996 2444 12438 0
1997 2956 13360 2033
1998 3134 14300 2194
1999 3543 15489 2354
2000 3448 16365 2572
2001 3184 16816 2733
2002 3870 17874 2812
2003 5569 20434 3009
2004 4421 21343 3511
2005 5146 22789 3699
2006 6195 25008 3976
Annex 5. Public sector R&D supply and use at current prices 1995-2006
Year Frascati
Manual
Intramural
expenditures
on R&D,
GERD
Gross fixed
capital
formation
included in
BERD
Consumption
of fixed
capital
Software R&D output R&D gross
fixed capital
formation
- + -
1995 881 39 36 5 873 873
1996 1023 38 37 6 1016 1016
1997 1124 38 39 6 1119 1119
1998 1099 38 38 7 1091 1091
1999 1217 40 38 9 1206 1206
2000 1269 41 38 11 1255 1255
2001 1321 46 37 13 1299 1299
2002 1433 46 39 13 1412 1412
2003 1477 44 38 13 1458 1458
2004 1570 48 39 14 1546 1546
2005 1599 47 40 14 1577 1577
2006 1651 47 40 15 1629 1629
28
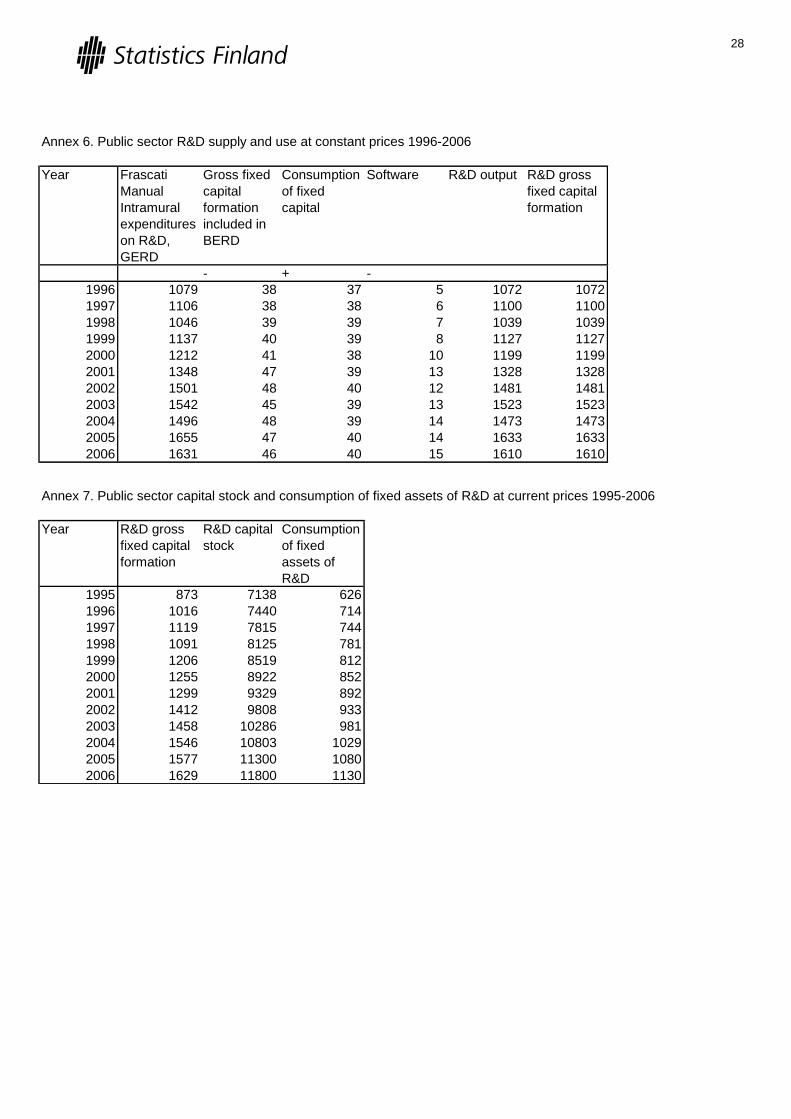
Annex 6. Public sector R&D supply and use at constant prices 1996-2006
Year Frascati
Manual
Intramural
expenditures
on R&D,
GERD
Gross fixed
capital
formation
included in
BERD
Consumption
of fixed
capital
Software R&D output R&D gross
fixed capital
formation
- + -
1996 1079 38 37 5 1072 1072
1997 1106 38 38 6 1100 1100
1998 1046 39 39 7 1039 1039
1999 1137 40 39 8 1127 1127
2000 1212 41 38 10 1199 1199
2001 1348 47 39 13 1328 1328
2002 1501 48 40 12 1481 1481
2003 1542 45 39 13 1523 1523
2004 1496 48 39 14 1473 1473
2005 1655 47 40 14 1633 1633
2006 1631 46 40 15 1610 1610
Annex 7. Public sector capital stock and consumption of fixed assets of R&D at current prices 1995-2006
Year R&D gross
fixed capital
formation
R&D capital
stock
Consumption
of fixed
assets of
R&D
1995 873 7138 626
1996 1016 7440 714
1997 1119 7815 744
1998 1091 8125 781
1999 1206 8519 812
2000 1255 8922 852
2001 1299 9329 892
2002 1412 9808 933
2003 1458 10286 981
2004 1546 10803 1029
2005 1577 11300 1080
2006 1629 11800 1130

29
Annex 8. Public sector capital stock and consumption of fixed assets of R&D at constant prices 1996-2006
Year R&D gross
fixed capital
formation
R&D capital
stock
Consumption
of fixed
assets of
R&D
1996 1072 8140 785
1997 1100 10762 1074
1998 1039 10627 1065
1999 1127 11032 1100
2000 1199 11768 1174
2001 1328 12853 1281
2002 1481 14369 1432
2003 1523 15042 1502
2004 1473 14833 1485
2005 1633 15891 1584
2006 1610 16162 1617