requirements and sample format for school board...
TRANSCRIPT

Authority: 9018 St. Matthew Evangelical Lutheran Church of Stony Plain, Alberta
Combined 3-Year Education Plan and Annual Education Results Report (AERR) for School Authorities
November 2017
Page 1

Authority: 9018 St. Matthew Evangelical Lutheran Church of Stony Plain, Alberta
Message from the School Jurisdiction President
The Board is pleased to present the 2017-2020 Combined Three Year Education Plan and AERR for St. Matthew Lutheran (SML) Christian Academy.
SML has continued to bring a quality education to the students of the Stony Plain area. During these last years we have experienced much change and growth brought about by our tuition-free status and our high quality of education. We look forward to future renovations that will make better use of our existing space and enable us to continue to serve our community.
We look forward to the year ahead, anticipating the joys and the challenges that new students and staff will bring to our school family. What a great opportunity we have to share the good news of salvation in Christ to the people of our community.
____________________________________Dennis Woolsey School Jurisdiction President
Page 2

Authority: 9018 St. Matthew Evangelical Lutheran Church of Stony Plain, Alberta
Accountability Statement
Three Year Educational PlanAccountability Statement for the Three-Year Education Plan The Education Plan for St. Matthew Lutheran Christian Academy (SML) for the three years commencing September 1, 2017 was prepared under the direction of the School Board in accordance with the responsibilities under the Private Schools Regulation and the Education Grants Regulation. This Education Plan was developed in the context of the provincial government’s business and fiscal plans. The Board has used its performance results to develop the Plan, and is committed to implementing the strategies contained within the Plan to improve student learning and results. The Board approved the Education Plan for 2017/2020 on November 14, 2017.
Annual Educational Results ReportThe Annual Education Results Report for SML the 2016/17 school year was prepared under the direction of the board in accordance with the responsibilities under the Private Schools Regulation and the Education Grants Regulation. The board is committed to using the results in this report, to the best of its abilities, to improve outcomes for students and to ensure that all students in the private school authority can acquire the knowledge, skills and attitudes they need to be self-reliant, responsible, caring and contributing members of society. This Annual Education Results Report for 2016/2017 was approved by the Board on November 15, 2017.
PublicationThis document can be found online at: www.smlacademy.ca
Copies of the report will also be available from the school upon request. The availability of the report will be communicated to the parents via the school newsletter.
Page 3

Authority: 9018 St. Matthew Evangelical Lutheran Church of Stony Plain, Alberta
Foundation Statements (optional)
STATEMENT OF PRINCIPLES AND BELIEFSSML Christian Academy is an independent Christian School that is an integral part of, and operated by, St. Matthew Evangelical Lutheran Church of Stony Plain. The School Board believes that:
1. The overarching goal of Christian Education is to help children know and trust in Jesus Christ as their Saviour.
2. Christian Education is primarily the responsibility of faithful parents.3. Our main task is to assist parents in forming their children’s spiritual life and values by offering a high standard of educational opportunities for all students through
the use of available resources. 4. Our school is open to all children and families who desire the benefits of Lutheran
education, regardless of race, religion or social and economic standing. Each person possesses inherent worth and dignity and is deserving of respect.
5. It is essential for SML to promote a school environment of respect for God’s Word, those in authority, for classmates and other people, for their bodies and God given talents, for the learning process and the classroom environment and for our school, personal property, and the property of others.
6. As a successful school, to provide a safe, caring and orderly environment for learning.
THE MISSIONThe mission of SML Christian Academy is to teach and model the saving Gospel of Jesus Christ.
VISIONThe vision of SML is to provide an education that will develop the whole child; Spiritually, Physically, Intellectually and Psychologically. Our purpose will be:
* To provide a Christ-centered education.* To equip children and families for eternity.* To provide a safe, caring, loving and encouraging atmosphere.* To engage students in the learning process.* To equip students with skills for life.* To provide a Christian/Biblical point of view in all curriculum.* To equip students to boldly confess the faith.* To equip students to be respectful citizens in their communities.* To provide all students confidence based on their saving relationship with the
Lord and their God-given abilities.* To encourage supportive parents to assist in the mission of the school.* To provide training for children in the usage of technology in an ever changing
environment.* For teachers to stimulate learning, excite students to learn, motivate students to
grow spiritually and academically and to engage students in non-threatening interaction with teachers and fellow students.
Page 4

Authority: 9018 St. Matthew Evangelical Lutheran Church of Stony Plain, Alberta
THE MANDATEThe mandate of SML is to provide educational programs that respond to the learning needs of its students based on a Christian foundation while maintaining the goals and objectives of the Alberta Program of Studies.
Page 5
Authority: 9018 St. Matthew Evangelical Lutheran Church of Stony Plain, Alberta
A Profile of the School Authority (optional)
PROFILE
SML Christian Academy, operating as part of the ministry of St. Matthew Evangelical Lutheran Church of Stony Plain, is situated in Stony Plain, a community of 17,000 residents. Our school also serves the residents of Spruce Grove (34,000 residents), and Parkland County (32,000 residents). As our school was officially registered in 1905, we are currently celebrating our 112th
year of education. Our academic program is inclusive from Kindergarten through Grade Nine.
The eight member board meets monthly at the school. All board members are elected by congregational members of St. Matthew Lutheran Church.
Our program of studies consists of the full Alberta Curriculum along with a strong Christ-centered Christian Studies Program, a strong sports program with students participating in the West Central Junior High Athletic Association in Cross Country Running, Volleyball, Basketball, Badminton, Soccer and Track and Field. We offer mobile technology labs, and Smart Boards, iPads and Document Cameras complement each of our classrooms, engaging students in the learning process. In the 2017/18 year our complementary courses include Advanced Art, Rocket Design, Foods, Ted Ed, Outdoor Ed, Maker Project, Fit for Life, Computer Technology, and Yearbook Design.
Our K-9 staff consists of 10 full time equivalent teachers, one full time teacher/administrator, one administrator, two half time education assistants, a full time custodian, and one full time administrative assistant.
This year the student enrollment is 204 students. The enrollment policy is an open policy to all students regardless of race, colour or religious backgrounds. However, families who enroll their children at SML must comply with the vision and policies of the school.
We cap our classes at 24 students so our low student/teacher ratio allows us to effectively meet the needs of all students, including those with learning difficulties and those requiring enrichment activities.
Page 6

Authority: 9018 St. Matthew Evangelical Lutheran Church of Stony Plain, Alberta
Trends and Issues (optional)
TRENDS AND ISSUES1. In past years enrollment has been an issue for the school, but in May of 2014, St.
Matthew Lutheran Church decided to back the Board in its decision to remove tuition. This had resulted in a 50% increase in student enrollment over the 2013/14 year. Enrollment grew to 165 the following year, and 180 for the 2015/16 year. Now that the school is more crowded we are looking into ways to improve our existing space.
2. In 2014 we completed a rebranding which gave the school a new operating name and a new logo. The new name abbreviated our existing name (St. Matthew Lutheran) into SML and we added the words Christian Academy because we realized that the word “Lutheran” had little meaning to the general public. We continue to enjoy the positive effects of the rebranding.
3. We have many more students with special needs, and a continued issue is to provide quality education for these students that often have little or no additional government funding other than the base instructional grant.
4. Last year we implemented Sycamore which is a Student Information System. Sycamore allows us to better communicate with our school families, allowing parents and students to view grades, homework, events, and news items using a computer or a mobile device. The system also allows parents to contact teachers and it lets the school, as well as the individual classroom teacher, send batch emails and batch texts to parents and students. While there was a significant learning curve for parents and staff last year, we are beginning to reap the benefits of the system this year.
Page 7
Authority: 9018 St. Matthew Evangelical Lutheran Church of Stony Plain, Alberta
Summary of Accomplishments (optional)
Summary of Accomplishments1. We know from the daily interactions with parents that they are very happy with the
school, but we were please to see from the Pillar of Accountability that 96.3% of them view SML as a safe and caring environment.
2. Furthermore, 97.8% are happy with the basic quality of education their child is receiving at SML.
3. Renovations in our kitchen facility were completed this summer which make the room much more conductive to teaching our Foods Class, as well as providing for our Hot Lunch Program.
4. Our sports teams have continued to have another exceptional year with the boys team bringing home a championship banner in basketball and both boys and girls taking the championship in volleyball. In November 2016 our staff was also certified as archery instructors and we were able to add the National Archery in the School Program (NASP) to our compliment of sports options.
5. The increase of enrollment to 204 students demonstrates the desire parents have in the community to place their children in our school. We are honoured that they have entrusted us with the education of their children.
Page 8

Authority: 9018 St. Matthew Evangelical Lutheran Church of Stony Plain, Alberta
Combined 2017 Accountability Pillar Overall Summary (Required for Public/Separate/Francophone/Charter School Authorities and Level 2 Private Schools)
Measure Category MeasureSt. Matthew Luthern Alberta Measure Evaluation
Current Result
Prev Year Result
Prev 3 Year Average
Current Result
Prev Year Result
Prev 3 Year Average Achievement Improvement Overall
Safe and Caring Schools Safe and Caring 94.7 94.0 96.4 89.5 89.5 89.3 Very High Maintained Excellent
Student Learning Opportunities
Program of Studies 83.6 81.6 84.7 81.9 81.9 81.5 Very High Maintained Excellent
Education Quality 95.9 94.7 96.8 90.1 90.1 89.6 Very High Maintained Excellent
Drop Out Rate 0.0 * 0.0 3.0 3.2 3.3 Very High Maintained Excellent
High School Completion Rate (3 yr) n/a n/a n/a 77.9 76.5 76.1 n/a n/a n/a
Student Learning Achievement (Grades K-9)
PAT: Acceptable 82.6 76.0 76.8 73.4 73.6 73.2 High Maintained Good
PAT: Excellence 14.6 10.4 22.7 19.5 19.4 18.8 Intermediate Maintained Acceptable
Student Learning Achievement (Grades 10-12)
Diploma: Acceptable n/a n/a n/a 83.0 82.7 83.1 n/a n/a n/a
Diploma: Excellence n/a n/a n/a 22.2 21.2 21.5 n/a n/a n/a
Diploma Exam Participation Rate (4+ Exams) n/a n/a n/a 54.9 54.6 53.1 n/a n/a n/a
Rutherford Scholarship Eligibility Rate n/a n/a n/a 62.3 60.8 60.8 n/a n/a n/a
Preparation for Lifelong Learning, World of Work, Citizenship
Transition Rate (6 yr) n/a n/a n/a 57.9 59.4 59.3 n/a n/a n/a
Work Preparation 91.9 95.0 95.1 82.7 82.6 81.9 Very High Maintained Excellent
Citizenship 91.8 90.9 94.3 83.7 83.9 83.6 Very High Maintained Excellent
Parental Involvement Parental Involvement 96.8 93.2 91.6 81.2 80.9 80.7 Very High Improved Excellent
Continuous Improvement School Improvement 91.9 88.6 91.6 81.4 81.2 80.2 Very High Maintained Excellent
Notes:1. Data values have been suppressed where the number of respondents/students is fewer than 6. Suppression is marked with an asterisk (*).2. Overall evaluations can only be calculated if both improvement and achievement evaluations are available.3. Results for the ACOL measures are available in the detailed report: see "ACOL Measures" in the Table of Contents.4. Survey results for the province and school authorities were impacted by the changes in the number of students responding to the survey through the introduction of the OurSCHOOL/TTFM (Tell Them From
Me) survey in 2014.5. Aggregated PAT results are based upon a weighted average of percent meeting standards (Acceptable, Excellence). The weights are the number of students enrolled in each course. Courses included:
English Language Arts (Grades 6, 9, 9 KAE); Français (Grades 6, 9); French Language Arts (Grades 6, 9); Mathematics (6, 9, 9 KAE); Science (Grades 6, 9, 9 KAE); and Social Studies (Grades 6, 9, 9 KAE).
6. Participation in Provincial Achievement Tests was impacted by the flooding in June 2013 (Grade 9 only) and by the fires in May to June 2016. Caution should be used when interpreting trends over time for the province and those school authorities affected by these events.
7. Aggregated Diploma results are a weighted average of percent meeting standards (Acceptable, Excellence) on Diploma Examinations. The weights are the number of students writing the Diploma Examination for each course. Courses included: English Language Arts 30-1; English Language Arts 30-2; French Language Arts 30-1; Français 30-1; Mathematics 30-1; Mathematics 30-2; Chemistry 30; Physics 30; Biology 30; Science 30; Social Studies 30-1; and Social Studies 30-2.
8. Caution should be used when interpreting evaluations and results over time for Mathematics 30-1/30-2, as equating was not in place until the 2016/17 school year. Alberta Education does not comment on province wide trends until it has five years of equated examination data.
9. Participation in Diploma Examinations was impacted by the flooding in June 2013 and by the fires in May to June 2016. Caution should be used when interpreting trends over time for the province and those school authorities affected by these events.
10. Weighting of school-awarded marks in diploma courses increased from 50% to 70% in the 2015/2016 school year. Caution should be used when interpreting trends over time. 11. Due to the change from previous data source systems to Provincial Approach to Student Information (PASI), Rutherford Scholarship Eligibility Rate results prior to 2015 are not available.
Page 9

Authority: 9018 St. Matthew Evangelical Lutheran Church of Stony Plain, Alberta
Combined 2017 Accountability Pillar First Nations, Métis and Inuit Summary (Required for Public/Separate/Francophone School Authorities)
[No Data for Overall Summary - FNMI]
Notes:1. Data values have been suppressed where the number of respondents/students is fewer than 6. Suppression is marked with an asterisk (*).2. Overall evaluations can only be calculated if both improvement and achievement evaluations are available.3. Aggregated PAT results are based upon a weighted average of percent meeting standards (Acceptable, Excellence). The weights are the number of students enrolled in each course. Courses included:
English Language Arts (Grades 6, 9, 9 KAE); Français (Grades 6, 9); French Language Arts (Grades 6, 9); Mathematics (6, 9, 9 KAE); Science (Grades 6, 9, 9 KAE); and Social Studies (Grades 6, 9, 9 KAE).
4. Participation in Provincial Achievement Tests was impacted by the flooding in June 2013 (Grade 9 only) and by the fires in May to June 2016. Caution should be used when interpreting trends over time for the province and those school authorities affected by these events.
5. Aggregated Diploma results are a weighted average of percent meeting standards (Acceptable, Excellence) on Diploma Examinations. The weights are the number of students writing the Diploma Examination for each course. Courses included: English Language Arts 30-1; English Language Arts 30-2; French Language Arts 30-1; Français 30-1; Mathematics 30-1; Mathematics 30-2; Chemistry 30; Physics 30; Biology 30; Science 30; Social Studies 30-1; and Social Studies 30-2.
6. Caution should be used when interpreting evaluations and results over time for Mathematics 30-1/30-2, as equating was not in place until the 2016/17 school year. Alberta Education does not comment on province wide trends until it has five years of equated examination data.
7. Participation in Diploma Examinations was impacted by the flooding in June 2013 and by the fires in May to June 2016. Caution should be used when interpreting trends over time for the province and those school authorities affected by these events.
8. Weighting of school-awarded marks in diploma courses increased from 50% to 70% in the 2015/2016 school year. Caution should be used when interpreting trends over time. 9. Due to the change from previous data source systems to Provincial Approach to Student Information (PASI), Rutherford Scholarship Eligibility Rate results prior to 2015 are not available.10. Student demographic data used when calculating Student Outcome Measures and Provincial Achievement Tests results was updated in October 2016. This impacted results based on enrolment (e.g.,
self-identified First Nations, Metis and Inuit), exception (e.g., learning disability) and grant program codes (e.g., English as Second Language students) reported in previous years.
Page 10
Authority: 9018 St. Matthew Evangelical Lutheran Church of Stony Plain, Alberta
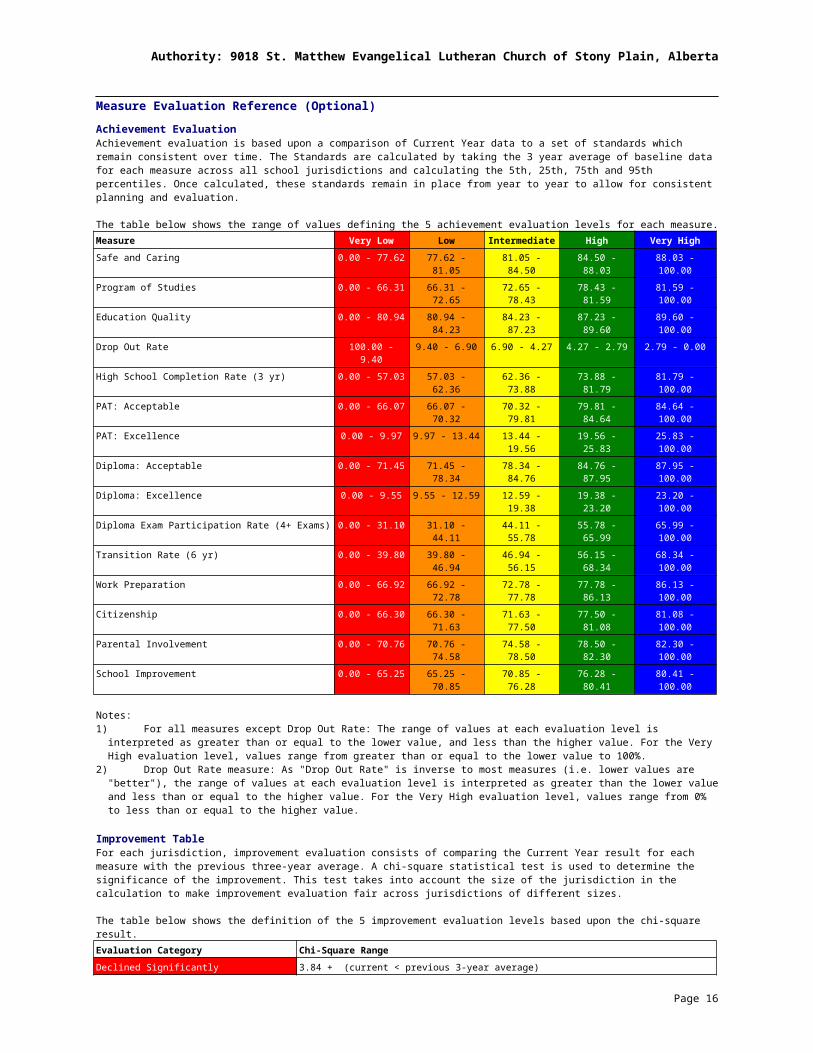
Measure Evaluation Reference (Optional)Achievement EvaluationAchievement evaluation is based upon a comparison of Current Year data to a set of standards which remain consistent over time. The Standards are calculated by taking the 3 year average of baseline data for each measure across all school jurisdictions and calculating the 5th, 25th, 75th and 95th percentiles. Once calculated, these standards remain in place from year to year to allow for consistent planning and evaluation.
The table below shows the range of values defining the 5 achievement evaluation levels for each measure.Measure Very Low Low Intermediate High Very HighSafe and Caring 0.00 - 77.62 77.62 - 81.05 81.05 - 84.50 84.50 - 88.03 88.03 - 100.00
Program of Studies 0.00 - 66.31 66.31 - 72.65 72.65 - 78.43 78.43 - 81.59 81.59 - 100.00
Education Quality 0.00 - 80.94 80.94 - 84.23 84.23 - 87.23 87.23 - 89.60 89.60 - 100.00
Drop Out Rate 100.00 - 9.40 9.40 - 6.90 6.90 - 4.27 4.27 - 2.79 2.79 - 0.00
High School Completion Rate (3 yr) 0.00 - 57.03 57.03 - 62.36 62.36 - 73.88 73.88 - 81.79 81.79 - 100.00
PAT: Acceptable 0.00 - 66.07 66.07 - 70.32 70.32 - 79.81 79.81 - 84.64 84.64 - 100.00
PAT: Excellence 0.00 - 9.97 9.97 - 13.44 13.44 - 19.56 19.56 - 25.83 25.83 - 100.00
Diploma: Acceptable 0.00 - 71.45 71.45 - 78.34 78.34 - 84.76 84.76 - 87.95 87.95 - 100.00
Diploma: Excellence 0.00 - 9.55 9.55 - 12.59 12.59 - 19.38 19.38 - 23.20 23.20 - 100.00
Diploma Exam Participation Rate (4+ Exams) 0.00 - 31.10 31.10 - 44.11 44.11 - 55.78 55.78 - 65.99 65.99 - 100.00
Transition Rate (6 yr) 0.00 - 39.80 39.80 - 46.94 46.94 - 56.15 56.15 - 68.34 68.34 - 100.00
Work Preparation 0.00 - 66.92 66.92 - 72.78 72.78 - 77.78 77.78 - 86.13 86.13 - 100.00
Citizenship 0.00 - 66.30 66.30 - 71.63 71.63 - 77.50 77.50 - 81.08 81.08 - 100.00
Parental Involvement 0.00 - 70.76 70.76 - 74.58 74.58 - 78.50 78.50 - 82.30 82.30 - 100.00
School Improvement 0.00 - 65.25 65.25 - 70.85 70.85 - 76.28 76.28 - 80.41 80.41 - 100.00
Notes:1) For all measures except Drop Out Rate: The range of values at each evaluation level is interpreted as greater than or equal to the lower
value, and less than the higher value. For the Very High evaluation level, values range from greater than or equal to the lower value to 100%.
2) Drop Out Rate measure: As "Drop Out Rate" is inverse to most measures (i.e. lower values are "better"), the range of values at each evaluation level is interpreted as greater than the lower value and less than or equal to the higher value. For the Very High evaluation level, values range from 0% to less than or equal to the higher value.
Improvement TableFor each jurisdiction, improvement evaluation consists of comparing the Current Year result for each measure with the previous three-year average. A chi-square statistical test is used to determine the significance of the improvement. This test takes into account the size of the jurisdiction in the calculation to make improvement evaluation fair across jurisdictions of different sizes.
The table below shows the definition of the 5 improvement evaluation levels based upon the chi-square result.Evaluation Category Chi-Square RangeDeclined Significantly 3.84 + (current < previous 3-year average)
Declined 1.00 - 3.83 (current < previous 3-year average)
Maintained less than 1.00
Improved 1.00 - 3.83 (current > previous 3-year average)
Improved Significantly 3.84 + (current > previous 3-year average)
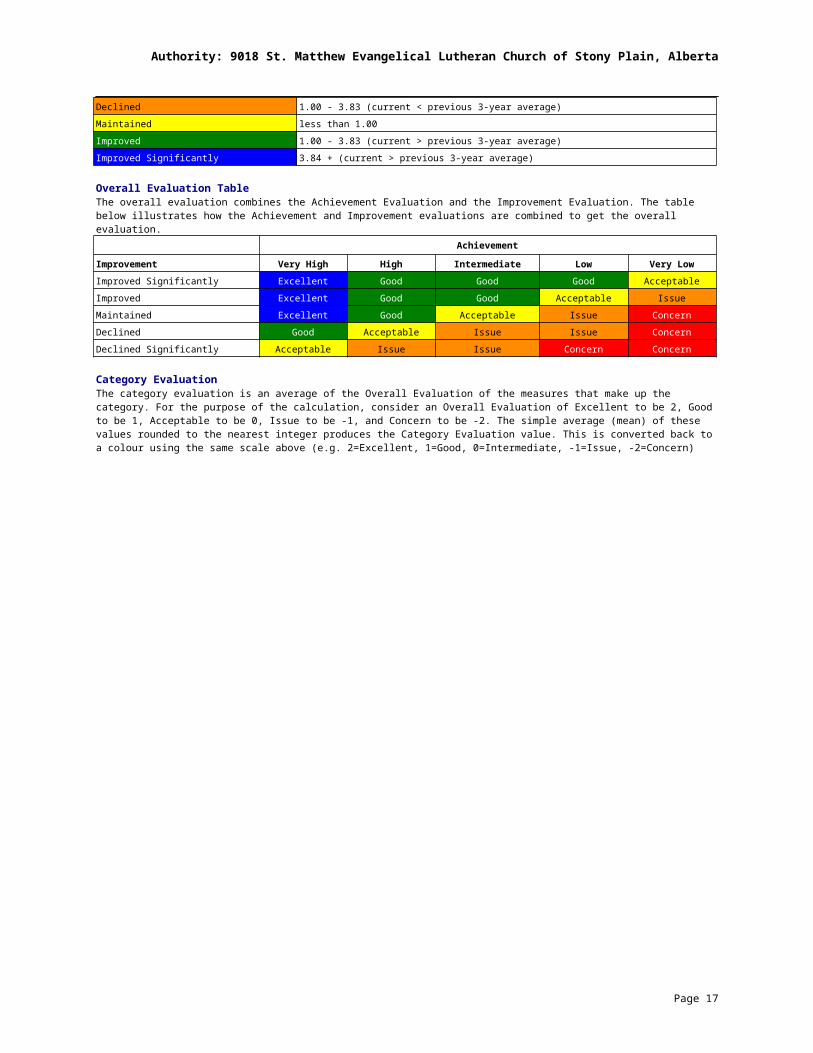
Overall Evaluation TableThe overall evaluation combines the Achievement Evaluation and the Improvement Evaluation. The table below illustrates how the Achievement and Improvement evaluations are combined to get the overall evaluation.
Achievement
Improvement Very High High Intermediate Low Very LowImproved Significantly Excellent Good Good Good Acceptable
Improved Excellent Good Good Acceptable Issue
Maintained Excellent Good Acceptable Issue Concern
Declined Good Acceptable Issue Issue Concern
Declined Significantly Acceptable Issue Issue Concern Concern
Category EvaluationThe category evaluation is an average of the Overall Evaluation of the measures that make up the category. For the purpose of the calculation, consider an Overall Evaluation of Excellent to be 2, Good to be 1, Acceptable to be 0, Issue to be -1, and Concern to be -2. The simple average (mean) of these values rounded to the nearest integer produces the Category Evaluation value. This is converted back to a colour using the same scale above (e.g. 2=Excellent, 1=Good, 0=Intermediate, -1=Issue, -2=Concern)
Page 11

Authority: 9018 St. Matthew Evangelical Lutheran Church of Stony Plain, Alberta
Outcome One: Alberta’s students are successful
Performance Measure
Results (in percentages) Target
Evaluation Targets
2013
2014
2015
2016
2017
2017 Achievement
Improvement
Overall 2018
2019
2020
Overall percentage of students in Grades 6 and 9 who achieved the acceptable standard on Provincial Achievement Tests (overall cohort results).
86.5 74.0 80.4 76.0 82.6 80.0 High Maintained Good83.0 84.0 85.0
Overall percentage of students in Grades 6 and 9 who achieved the standard of excellence on Provincial Achievement Tests (overall cohort results).
7.7 22.9 34.8 10.4 14.6 25.0 Intermediate Maintained Acceptable
15.0 16.0 17.0
Comment on Results (OPTIONAL)We are glad to see our PAT marks rise from the previous year, but we recognize that in a small school likes ours it is not unusual to see fluctuations from one year to the next.
StrategiesWe will continue to offer a quality education to the students of our school. In this next year we will focus on math and literacy professional development for our teachers to better equip them in their vocation. We have also devoted extra staff time toward early literacy. It is our hope that we will see some long-term benefits from this initiative.
Notes:1. Data values have been suppressed where the number of respondents/students is fewer than 6. Suppression is marked with an asterisk (*).2. Overall evaluations can only be calculated if both improvement and achievement evaluations are available.3. Aggregated PAT results are based upon a weighted average of percent meeting standards (Acceptable, Excellence). The weights are the
number of students enrolled in each course. Courses included: English Language Arts (Grades 6, 9, 9 KAE); Français (Grades 6, 9); French Language Arts (Grades 6, 9); Mathematics (6, 9, 9 KAE); Science (Grades 6, 9, 9 KAE); and Social Studies (Grades 6, 9, 9 KAE).
4. Participation in Provincial Achievement Tests was impacted by the flooding in June 2013 (Grade 9 only) and by the fires in May to June 2016. Caution should be used when interpreting trends over time for the province and those school authorities affected by these events.
Page 12

Authority: 9018 St. Matthew Evangelical Lutheran Church of Stony Plain, Alberta
Outcome One: Alberta’s students are successful (continued)
[No Data for Diploma Exam Results]
Performance Measure
Results (in percentages) Target
Evaluation Targets
2012
2013
2014
2015
2016
2017 Achievement
Improvement
Overall 2018
2019
2020
High School Completion Rate - Percentage of students who completed high school within three years of entering Grade 10.
n/a n/a n/a n/a n/a n/a n/a n/a
Drop Out Rate - annual dropout rate of students aged 14 to 18 0.0 0.0 * * 0.0 Very High Maintained Excellen
t 0.0 0.0 0.0High school to post-secondary transition rate of students within six years of entering Grade 10.
n/a n/a n/a n/a n/a n/a n/a n/a
Percentage of Grade 12 students eligible for a Rutherford Scholarship.
n/a n/a n/a n/a n/a n/a n/a n/a
Percentage of students writing four or more diploma exams within three years of entering Grade 10.
n/a n/a n/a n/a n/a n/a n/a n/a
Comment on Results (OPTIONAL)We are very glad that we continue to have a drop out rate of 0%.
StrategiesWe will continue to provide a safe and caring environment where students enjoy coming to school and are engaged in learning.
Notes:
Page 13

Authority: 9018 St. Matthew Evangelical Lutheran Church of Stony Plain, Alberta
1. Data values have been suppressed where the number of respondents/students is fewer than 6. Suppression is marked with an asterisk (*).2. Overall evaluations can only be calculated if both improvement and achievement evaluations are available.3. Diploma Examination Participation, High School Completion and High school to Post-secondary Transition rates are based upon a cohort of
grade 10 students who are tracked over time. 4. Aggregated Diploma results are a weighted average of percent meeting standards (Acceptable, Excellence) on Diploma Examinations. The
weights are the number of students writing the Diploma Examination for each course. Courses included: English Language Arts 30-1; English Language Arts 30-2; French Language Arts 30-1; Français 30-1; Mathematics 30-1; Mathematics 30-2; Chemistry 30; Physics 30; Biology 30; Science 30; Social Studies 30-1; and Social Studies 30-2.
5. Caution should be used when interpreting evaluations and results over time for Mathematics 30-1/30-2, as equating was not in place until the 2016/17 school year. Alberta Education does not comment on province wide trends until it has five years of equated examination data.
6. Participation in Diploma Examinations was impacted by the flooding in June 2013 and by the fires in May to June 2016. Caution should be used when interpreting trends over time for the province and those school authorities affected by these events.
7. Weighting of school-awarded marks in diploma courses increased from 50% to 70% in the 2015/2016 school year. Caution should be used when interpreting trends over time.
8. Due to the change from previous data source systems to Provincial Approach to Student Information (PASI), Rutherford Scholarship Eligibility Rate results prior to 2015 are not available.
Page 14

Authority: 9018 St. Matthew Evangelical Lutheran Church of Stony Plain, Alberta
Outcome One: Alberta’s students are successful (continued)
Performance Measure
Results (in percentages) Target
Evaluation Targets
2013
2014
2015
2016
2017
2017 Achievement
Improvement
Overall 2018
2019
2020
Percentage of teachers, parents and students who are satisfied that students model the characteristics of active citizenship.
92.3 96.6 95.4 90.9 91.8 97.0 Very High Maintained Excellent
92.0 92.5 93.0
Percentage of teachers and parents who agree that students are taught attitudes and behaviours that will make them successful at work when they finish school.
94.7 93.1 97.3 95.0 91.9 94.0 Very High Maintained Excellent
92.0 92.5 93.0
Comment on Results (OPTIONAL)
As a Christ-centred school we are continually reminded by the scriptures to “love your neighbour as yourself.” (Matthew 22:39) This certainly has a positive effect on the culture and climate of our school.
StrategiesWe will continue to model and teach attitudes and behaviours that model positive
citizenship, looking to Christ who showed perfect love for those around Him, and was willing to give up His life for the sins of the world.
Notes: 1. Data values have been suppressed where the number of respondents/students is fewer than 6. Suppression is marked with an asterisk (*).2. Survey results for the province and school authorities were impacted by the changes in the number of students responding to the survey through
the introduction of the OurSCHOOL/TTFM (Tell Them From Me) survey in 2014.
Page 15
Authority: 9018 St. Matthew Evangelical Lutheran Church of Stony Plain, Alberta
Outcome One: Alberta’s students are successful (continued)
Performance Measure
Results (in percentages) Target
Evaluation Targets
2013
2014
2015
2016
2017
2017 Achievement
Improvement
Overall
2018
2019
2020
Percentage of teacher and parent satisfaction that students demonstrate the knowledge, skills and attitudes necessary for lifelong learning.(This measure is required for charter and private school authorities with only K-9 schools)
68.2 69.6 79.0 73.4 70.1 80.0 n/a n/a n/a75.0 80.0 85.0
Comment on Results (OPTIONAL)We continue to take issue with these results. This category always contains our lowest numbers. This is due to a confusing question on the Pillar of Accountability Survey, and the way the results are statistically presented.
The parents are asked to respond to the following, “High school students demonstrate the knowledge, skills and attitudes necessary for learning throughout their lifetime.” Since our school only goes to grade 9 many parents don’t know what to do with this question. As a result, many of them respond by choosing the “Don’t Know” option. This year 58% of our parents chose “Don’t Know.”
Unfortunately Alberta Ed categorizes the “Don’t Know” results with the negative results: “Dissatisfied,” and “Very Dissatisfied.” When the results are compiled under a category, as they are in the table above, it makes it seem like our school is not as competent in the area of “students demonstrate the knowledge, skills, and attitudes necessary for lifelong learning.”
If one is to look at the very next question (which is similar in nature, but much more clear), “Your child is taught the knowledge, skills, and attitudes necessary for learning throughout his or her lifetime,” the data is very different. This year 92% of our parents answered “Very Satisfied” or “Satisfied” to that question.
Strategies
We will continue to raise our concern with Alberta Education in the hope that they rewrite the question to be less confusing, and then report the data in a way that better conveys the actual thoughts of the parents.
Notes:1. Data values have been suppressed where the number of respondents/students is fewer than 6. Suppression is marked with an asterisk (*).2. Survey results for the province and school authorities were impacted by the changes in the number of students responding to the survey through
the introduction of the OurSCHOOL/TTFM (Tell Them From Me) survey in 2014.
Page 16
Authority: 9018 St. Matthew Evangelical Lutheran Church of Stony Plain, Alberta
Outcome Two: The systemic education achievement gap between First Nations, Métis and Inuit students and all other students is eliminated
(Results and evaluations for First Nations, Métis and Inuit measures are required for Public/Separate/Francophone School Authorities only)
[No Data for Overall FNMI Results]
Comment on Results (OPTIONAL)While SML has no self-identified FNMI students, and therefore eliminating the achievement gap between FNMI students and other students simply does not in a daily practical way apply to this school, we do recognize point 3 of the 63rd Call to Action of the Truth and Reconciliation Commission of Canada which states:
We call upon the Council of Ministers of Education, Canada to maintain an annual commitment to Aboriginal education issues, including: …Building student capacity for intercultural understanding, empathy, and mutual respect.StrategiesWe will accomplish this by teaching in our devotions, our Christian Studies classes, and in our chapel services that all people have been created by God, and all are loved and cherished by Him (so much so that He was willing to sacrifice His Son on their behalf), and that we should love and cherish all peoples just as God Himself does.
Notes:1. Data values have been suppressed where the number of respondents/students is fewer than 6. Suppression is marked with an asterisk (*).2. Overall evaluations can only be calculated if both improvement and achievement evaluations are available.3. Aggregated PAT results are based upon a weighted average of percent meeting standards (Acceptable, Excellence). The weights are the
number of students enrolled in each course. Courses included: English Language Arts (Grades 6, 9, 9 KAE); Français (Grades 6, 9); French Language Arts (Grades 6, 9); Mathematics (6, 9, 9 KAE); Science (Grades 6, 9, 9 KAE); and Social Studies (Grades 6, 9, 9 KAE).
4. Participation in Provincial Achievement Tests was impacted by the flooding in June 2013 (Grade 9 only) and by the fires in May to June 2016. Caution should be used when interpreting trends over time for the province and those school authorities affected by these events.
5. Aggregated Diploma results are a weighted average of percent meeting standards (Acceptable, Excellence) on Diploma Examinations. The weights are the number of students writing the Diploma Examination for each course. Courses included: English Language Arts 30-1; English Language Arts 30-2; French Language Arts 30-1; Français 30-1; Mathematics 30-1; Mathematics 30-2; Chemistry 30; Physics 30; Biology 30; Science 30; Social Studies 30-1; and Social Studies 30-2.
6. Caution should be used when interpreting evaluations and results over time for Mathematics 30-1/30-2, as equating was not in place until the 2016/17 school year. Alberta Education does not comment on province wide trends until it has five years of equated examination data.
7. Participation in Diploma Examinations was impacted by the flooding in June 2013 and by the fires in May to June 2016. Caution should be used when interpreting trends over time for the province and those school authorities affected by these events.
8. Weighting of school-awarded marks in diploma courses increased from 50% to 70% in the 2015/2016 school year. Caution should be used when interpreting trends over time.
Page 17

Authority: 9018 St. Matthew Evangelical Lutheran Church of Stony Plain, Alberta
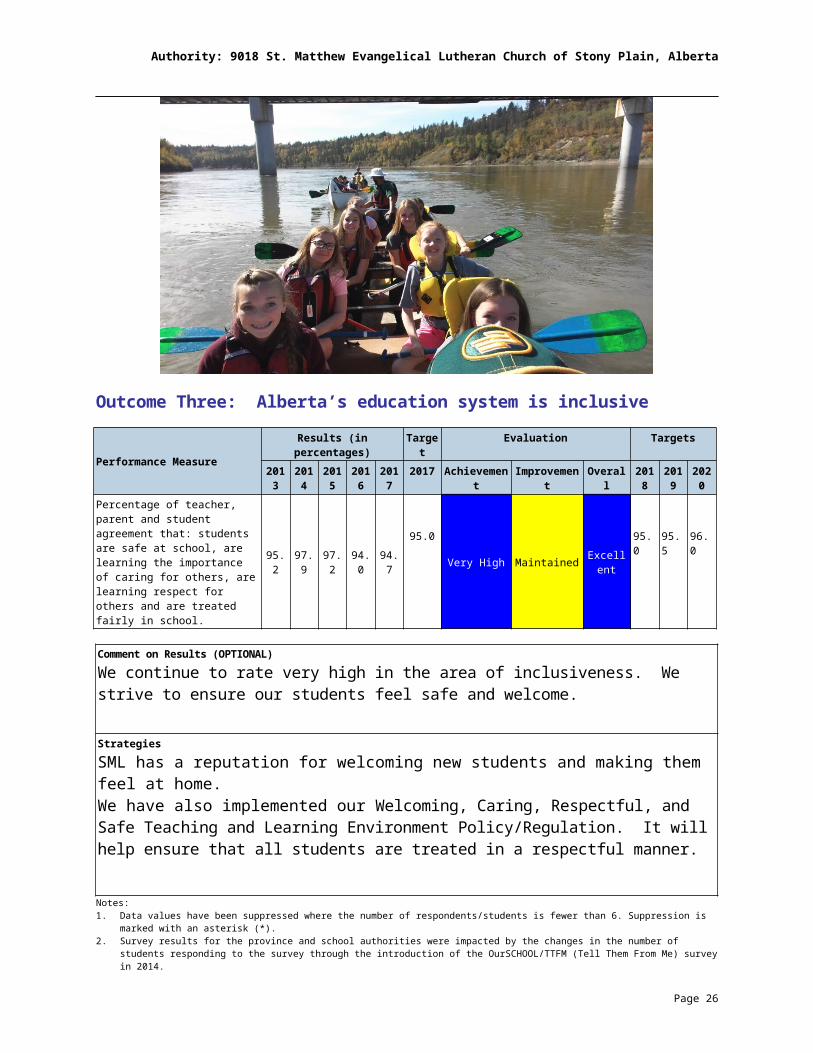
Outcome Three: Alberta’s education system is inclusive
Performance Measure
Results (in percentages) Target
Evaluation Targets
2013
2014
2015
2016
2017
2017 Achievement
Improvement
Overall 2018
2019
2020
Percentage of teacher, parent and student agreement that: students are safe at school, are learning the importance of caring for others, are learning respect for others and are treated fairly in school.
95.2 97.9 97.2 94.0 94.795.0
Very High Maintained Excellent
95.0 95.5 96.0
Comment on Results (OPTIONAL)We continue to rate very high in the area of inclusiveness. We strive to ensure our students feel safe and welcome.
StrategiesSML has a reputation for welcoming new students and making them feel at home.We have also implemented our Welcoming, Caring, Respectful, and Safe Teaching and Learning Environment Policy/Regulation. It will help ensure that all students are treated in a respectful manner.
Notes: 1. Data values have been suppressed where the number of respondents/students is fewer than 6. Suppression is marked with an asterisk (*).2. Survey results for the province and school authorities were impacted by the changes in the number of students responding to the survey through
the introduction of the OurSCHOOL/TTFM (Tell Them From Me) survey in 2014.
Page 18

Authority: 9018 St. Matthew Evangelical Lutheran Church of Stony Plain, Alberta
Page 19

Authority: 9018 St. Matthew Evangelical Lutheran Church of Stony Plain, Alberta
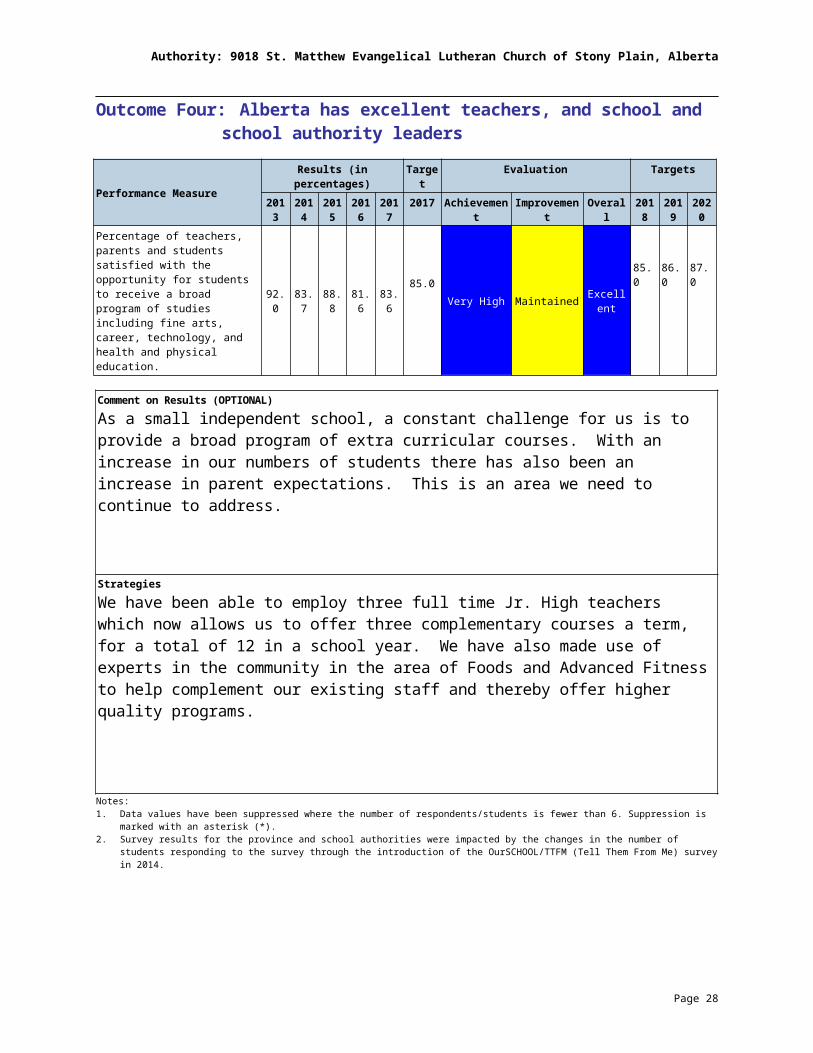
Outcome Four: Alberta has excellent teachers, and school and school authority leaders
Performance Measure
Results (in percentages) Target
Evaluation Targets
2013
2014
2015
2016
2017
2017 Achievement
Improvement
Overall 2018
2019
2020
Percentage of teachers, parents and students satisfied with the opportunity for students to receive a broad program of studies including fine arts, career, technology, and health and physical education.
92.0 83.7 88.8 81.6 83.6 85.0 Very High Maintained Excellent
85.0 86.0 87.0
Comment on Results (OPTIONAL)As a small independent school, a constant challenge for us is to provide a broad program of extra curricular courses. With an increase in our numbers of students there has also been an increase in parent expectations. This is an area we need to continue to address.
StrategiesWe have been able to employ three full time Jr. High teachers which now allows us to offer three complementary courses a term, for a total of 12 in a school year. We have also made use of experts in the community in the area of Foods and Advanced Fitness to help complement our existing staff and thereby offer higher quality programs.
Notes: 1. Data values have been suppressed where the number of respondents/students is fewer than 6. Suppression is marked with an asterisk (*).2. Survey results for the province and school authorities were impacted by the changes in the number of students responding to the survey through
the introduction of the OurSCHOOL/TTFM (Tell Them From Me) survey in 2014.
Page 20

Authority: 9018 St. Matthew Evangelical Lutheran Church of Stony Plain, Alberta
Outcome Five: Alberta’s education system is well governed and managed
Performance Measure
Results (in percentages) Target
Evaluation Targets
2013
2014
2015
2016
2017
2017 Achievement
Improvement
Overall 2018
2019
2020
Percentage of teachers, parents and students indicating that their school and schools in their jurisdiction have improved or stayed the same the last three years.
86.2 93.1 93.0 88.6 91.9 95.0 Very High Maintained Excellent
93.0 94.0 96.0
Percentage of teachers and parents satisfied with parental involvement in decisions about their child's education.
98.4 86.1 95.4 93.2 96.895.0
Very High Improved Excellent 97.0 98.0 99.0
Percentage of teachers, parents and students satisfied with the overall quality of basic education.
96.9 98.8 96.8 94.7 95.9 95.0 Very High Maintained Excellent 96.0 97.0 98.0
Comment on Results (OPTIONAL)The management of our school continues to be held in high regard by parents, teachers, and students.
StrategiesThe personnel committee of our school board will meet with the school principal to both
evaluate and find ways to support him. As the school has experienced rapid growth in the last three years, there is a need to continually assess the changing management needs of the school.
Notes: 1. Data values have been suppressed where the number of respondents/students is fewer than 6. Suppression is marked with an asterisk (*).2. Survey results for the province and school authorities were impacted by the changes in the number of students responding to the survey through
the introduction of the OurSCHOOL/TTFM (Tell Them From Me) survey in 2014.
Page 21
Authority: 9018 St. Matthew Evangelical Lutheran Church of Stony Plain, Alberta
Note:
Future Challenges (Optional)Since we have grown so much in the past few years we need to begin to look at additional space. Currently we have no room for extra-curricular activities, since every single space that can be used for a classroom is now being used as such. Plans are in the works for a Commons Area that could be used for multiple purposes. There is also a desire to create one or two rooms as “flex space.”
Page 22

Authority: 9018 St. Matthew Evangelical Lutheran Church of Stony Plain, Alberta
Summary of Financial ResultsFinancial Results Snapshot for the 2016-2017 School Year at SML Christian Academy
Through exercising another year of fiscal responsibility, the SML management team ended the school year with a very modest surplus amounting to $708.00. This was accomplished without the benefit of a very major fundraising event not proceeding.The 2016-17 year-end revenues and expenses are illustrated as follows:
Revenue
AB EducationMaterial FeesFundraising & DonationsChurchOther(Incl. Investments)
Expenses
Salaries & BenefitsBuilding & OperationsTeaching SuppliesTechnologyProfessional Development
Page 23
Authority: 9018 St. Matthew Evangelical Lutheran Church of Stony Plain, Alberta
Budget SummaryThe 2017-2018 School Year has projected revenues and expenses which, with continued fiscal restraint and solid team management, will result in another modest surplus. A continued growth in student numbers has been realized again this year. A snapshot of the current year’s revenue and expenses is illustrated as follows:
Revenue
AB EducationMaterial FeesFundraising & DonationsChurchOther
Expenses
Salaries & BenefitsBuilding & OperationsTeaching SuppliesTechnologyProfessional Development
Page 24

Authority: 9018 St. Matthew Evangelical Lutheran Church of Stony Plain, Alberta
Capital and Facilities ProjectsIn the summer of 2017 we completed the renovation of our kitchen. It now has modern
stainless steel counter tops, an industrial sink, new islands with steel tops, four ovens, two fridges and two freezers. The updated room is now much more useful to our Foods Class, and our hot lunch program.
Summary of Facility and Capital PlansVery early plans are being made for a commons area for the staff and students of the
school. Right now we are in need of some “flex space” in the school. These plans would reconfigure some areas to made better use of some underutilized space. This may also include some additional class space and a new administrative/front office area. It is possible thatan overhaul of the HVAC system would be part of this upgrade.
Parental InvolvementOur school has traditionally enjoyed a strong parental involvement, both in daily circumstances and with special events. We will continue to foster this relationship and ensure that communication remains strong between staff and parents. Our Parent Advisory Committee meets 5-6 times a year and the Principal and a teacher representative sit in on those meetings.
We also use a variety of tools to communicate with our parent body. These include regular memos, pertinent emails, Facebook, Instagram, and Sycamore Student Information System.
Timelines and CommunicationThis document can be found online at www.smlacademy.ca
Copies of this report will also be available from the school office upon request. The availability of the report will be communicated to the parents via the school newsletter.
Page 25
Authority: 9018 St. Matthew Evangelical Lutheran Church of Stony Plain, Alberta
Whistleblower ProtectionNo disclosures were made this year.
Page 26

Authority: 9018 St. Matthew Evangelical Lutheran Church of Stony Plain, Alberta
APPENDIX – Measure Details (OPTIONAL)
The following pages include tables and graphs that provide detailed data for the performance measures. Authorities may include these under each measure/outcome to provide context and help in interpreting the results.
Page 27
Authority: 9018 St. Matthew Evangelical Lutheran Church of Stony Plain, Alberta
Drop Out Rate – Measure Details (OPTIONAL)
Drop Out Rate - annual dropout rate of students aged 14 to 18Authority Province
2012 2013 2014 2015 2016 2012 2013 2014 2015 2016Drop Out Rate 0.0 0.0 * * 0.0 3.6 3.3 3.5 3.2 3.0Returning Rate n/a n/a n/a n/a n/a 22.8 20.7 20.9 18.2 18.9
Graph of Authority Results (optional) Graph of Authority Results (optional)
Notes: 1. Data values have been suppressed where the number of respondents/students is fewer than 6. Suppression is marked with an asterisk (*).
Page 28

Authority: 9018 St. Matthew Evangelical Lutheran Church of Stony Plain, Alberta
Citizenship – Measure Details (OPTIONAL)
Percentage of teachers, parents and students who are satisfied that students model the characteristics of active citizenship.Authority Province
2013 2014 2015 2016 2017 2013 2014 2015 2016 2017Overall 92.3 96.6 95.4 90.9 91.8 83.4 83.4 83.5 83.9 83.7Teacher 97.8 n/a 100.0 100.0 100.0 93.6 93.8 94.2 94.5 94.0Parent 100.0 96.6 98.9 97.6 96.8 80.3 81.9 82.1 82.9 82.7Student 79.2 n/a 87.2 75.1 78.4 76.2 74.5 74.2 74.5 74.4
Graph of Overall Authority Results (optional) Graph of Detailed Authority Results (optional)
Notes: 1. Data values have been suppressed where the number of respondents/students is fewer than 6. Suppression is marked with an asterisk (*).2. Survey results for the province and school authorities were impacted by the changes in the number of students responding to the survey through the
introduction of the OurSCHOOL/TTFM (Tell Them From Me) survey in 2014.Work Preparation – Measure Details (OPTIONAL)
Percentage of teachers and parents who agree that students are taught attitudes and behaviours that will make them successful at work when they finish school.
Authority Province2013 2014 2015 2016 2017 2013 2014 2015 2016 2017
Overall 94.7 93.1 97.3 95.0 91.9 80.3 81.2 82.0 82.6 82.7Teacher 100.0 n/a 100.0 90.0 100.0 89.4 89.3 89.7 90.5 90.4Parent 89.5 93.1 94.6 100.0 83.8 71.1 73.1 74.2 74.8 75.1
Graph of Overall Authority Results (optional) Graph of Detailed Authority Results (optional)
Notes: 1. Data values have been suppressed where the number of respondents/students is fewer than 6. Suppression is marked with an asterisk (*).
Page 29

Authority: 9018 St. Matthew Evangelical Lutheran Church of Stony Plain, Alberta
Lifelong Learning – Measure Details (OPTIONAL)
Percentage of teacher and parent satisfaction that students demonstrate the knowledge, skills and attitudes necessary for lifelong learning.
Authority Province2013 2014 2015 2016 2017 2013 2014 2015 2016 2017
Overall 68.2 69.6 79.0 73.4 70.1 68.5 69.5 70.0 70.7 71.0Teacher 66.7 n/a 90.9 70.0 68.8 75.7 76.0 76.0 77.3 77.3Parent 69.7 69.6 67.2 76.8 71.4 61.2 63.0 64.0 64.2 64.8
Graph of Overall Authority Results (optional) Graph of Detailed Authority Results (optional)
Notes: 1. Data values have been suppressed where the number of respondents/students is fewer than 6. Suppression is marked with an asterisk (*).
Page 30

Authority: 9018 St. Matthew Evangelical Lutheran Church of Stony Plain, Alberta
Provincial Achievement Test Results – Measure Details (OPTIONAL)
PAT Course by Course Results by Number Enrolled.Results (in percentages) Target
2013 2014 2015 2016 2017 2017A E A E A E A E A E A E
English Language Arts 6Authority 100.0 18.2 100.0 15.4 89.5 42.1 90.9 9.1 90.9 9.1Province 82.5 16.3 81.9 17.6 82.8 19.5 82.9 20.4 82.5 18.9
French Language Arts 6Authority n/a n/a n/a n/a n/a n/a n/a n/a n/a n/aProvince 88.6 16.3 88.0 15.6 87.5 13.6 87.7 14.2 85.1 13.5
Français 6Authority n/a n/a n/a n/a n/a n/a n/a n/a n/a n/aProvince 94.0 21.6 90.6 17.1 89.0 15.0 91.4 17.2 92.1 21.6
Mathematics 6Authority 90.9 9.1 92.3 23.1 89.5 47.4 81.8 0.0 77.3 4.5Province 73.0 16.4 73.5 15.4 73.2 14.1 72.2 14.0 69.4 12.6
Science 6Authority 90.9 9.1 69.2 30.8 89.5 52.6 90.9 27.3 90.9 13.6Province 77.5 25.9 75.9 24.9 76.3 25.3 78.0 27.1 76.9 29.0
Social Studies 6Authority 90.9 0.0 76.9 15.4 84.2 47.4 81.8 18.2 77.3 4.5Province 72.7 19.0 70.4 16.6 69.8 18.1 71.4 22.0 72.9 21.7
English Language Arts 9Authority * * 63.6 9.1 66.7 0.0 76.9 0.0 92.9 21.4Province 76.7 14.8 76.3 15.0 75.6 14.4 77.0 15.2 76.8 14.9
English Lang Arts 9 KAEAuthority n/a n/a n/a n/a n/a n/a n/a n/a n/a n/aProvince 62.4 4.3 62.8 3.5 63.0 4.5 59.8 6.2 58.8 5.9
French Language Arts 9Authority n/a n/a n/a n/a n/a n/a n/a n/a n/a n/aProvince 87.2 13.9 86.5 11.1 85.8 10.1 83.0 10.8 83.1 11.2
Français 9Authority n/a n/a n/a n/a n/a n/a n/a n/a n/a n/aProvince 84.0 14.5 86.1 17.8 88.5 20.2 86.4 26.8 88.9 26.1
Mathematics 9Authority * * 54.5 27.3 44.4 11.1 53.8 7.7 78.6 21.4Province 66.8 18.3 67.1 17.3 65.3 17.9 67.8 17.5 67.2 19.0
Mathematics 9 KAEAuthority n/a n/a n/a n/a n/a n/a n/a n/a n/a n/aProvince 65.8 14.7 63.4 14.5 60.9 14.4 61.2 13.0 57.5 13.3
Science 9Authority * * 63.6 27.3 66.7 11.1 84.6 7.7 71.4 21.4Province 72.9 20.0 73.2 22.1 74.1 22.8 74.2 22.4 74.0 21.4
Science 9 KAEAuthority n/a n/a n/a n/a n/a n/a n/a n/a n/a n/aProvince 68.4 17.1 64.1 14.9 64.5 15.1 63.8 14.3 63.9 13.3
Social Studies 9Authority * * 63.6 36.4 77.8 11.1 53.8 15.4 78.6 35.7Province 65.5 18.8 65.5 19.9 65.1 19.8 64.7 18.0 67.0 20.2
Social Studies 9 KAEAuthority n/a n/a n/a n/a n/a n/a n/a n/a n/a n/aProvince 64.6 13.0 61.8 10.7 57.3 11.2 58.0 11.6 56.3 12.7
Notes:1. Data values have been suppressed where the number of respondents/students is fewer than 6. Suppression is marked with an asterisk (*).2. “A” = Acceptable; “E” = Excellence — the percentages achieving the acceptable standard include the percentages achieving the standard of
excellence.3. Participation in Provincial Achievement Tests was impacted by the flooding in June 2013 (Grade 9 only) and by the fires in May to June 2016.
Caution should be used when interpreting trends over time for the province and those school authorities affected by these events.
Page 31

Authority: 9018 St. Matthew Evangelical Lutheran Church of Stony Plain, Alberta
Graph of Overall Provincial Achievement Test Results (optional)
Notes:1. Data values have been suppressed where the number of respondents/students is fewer than 6. Suppression is marked with an asterisk (*).2. Participation in Provincial Achievement Tests was impacted by the flooding in June 2013 (Grade 9 only) and by the fires in May to June 2016.
Caution should be used when interpreting trends over time for the province and those school authorities affected by these events.
Page 32

Authority: 9018 St. Matthew Evangelical Lutheran Church of Stony Plain, Alberta
Graph of Provincial Achievement Test Results by Course (optional)
[No Data for French Language Arts 6]
[No Data for Français 6]
Notes:1. Data values have been suppressed where the number of respondents/students is fewer than 6. Suppression is marked with an asterisk (*).2. Participation in Provincial Achievement Tests was impacted by the flooding in June 2013 (Grade 9 only) and by the fires in May to June 2016.
Caution should be used when interpreting trends over time for the province and those school authorities affected by these events.
Page 33

Authority: 9018 St. Matthew Evangelical Lutheran Church of Stony Plain, Alberta
Graph of Provincial Achievement Test Results by Course (optional)
[No Data for English Lang Arts 9 KAE]
[No Data for French Language Arts 9] [No Data for Français 9]
[No Data for Mathematics 9 KAE]
Notes:1. Data values have been suppressed where the number of respondents/students is fewer than 6. Suppression is marked with an asterisk (*).2. Participation in Provincial Achievement Tests was impacted by the flooding in June 2013 (Grade 9 only) and by the fires in May to June 2016.
Caution should be used when interpreting trends over time for the province and those school authorities affected by these events.
Page 34

Authority: 9018 St. Matthew Evangelical Lutheran Church of Stony Plain, Alberta
Graph of Provincial Achievement Test Results by Course (optional)
[No Data for Science 9 KAE]
[No Data for Social Studies 9 KAE]
Notes:1. Data values have been suppressed where the number of respondents/students is fewer than 6. Suppression is marked with an asterisk (*).2. Participation in Provincial Achievement Tests was impacted by the flooding in June 2013 (Grade 9 only) and by the fires in May to June 2016.
Caution should be used when interpreting trends over time for the province and those school authorities affected by these events.
Page 35
Authority: 9018 St. Matthew Evangelical Lutheran Church of Stony Plain, Alberta
PAT Results Course By Course Summary By Enrolled With Measure Evaluation (optional)
St. Matthew Luthern Alberta
Achievement Improvement Overall 2017 Prev 3 Year Average 2017 Prev 3 Year Average
Course Measure N % N % N % N %
English Language Arts 6Acceptable Standard High Maintained Good 22 90.9 14 93.5 49,572 82.5 46,989 82.5
Standard of Excellence Low Declined Issue 22 9.1 14 22.2 49,572 18.9 46,989 19.2
French Language Arts 6Acceptable Standard n/a n/a n/a n/a n/a n/a n/a 3,185 85.1 2,864 87.7
Standard of Excellence n/a n/a n/a n/a n/a n/a n/a 3,185 13.5 2,864 14.4
Français 6Acceptable Standard n/a n/a n/a n/a n/a n/a n/a 542 92.1 524 90.3
Standard of Excellence n/a n/a n/a n/a n/a n/a n/a 542 21.6 524 16.5
Mathematics 6Acceptable Standard Intermediate Maintained Acceptable 22 77.3 14 87.9 49,507 69.4 46,906 73.0
Standard of Excellence Very Low Declined Concern 22 4.5 14 23.5 49,507 12.6 46,906 14.5
Science 6Acceptable Standard Very High Maintained Excellent 22 90.9 14 83.2 49,501 76.9 46,914 76.7
Standard of Excellence Low Declined Issue 22 13.6 14 36.9 49,501 29.0 46,914 25.8
Social Studies 6Acceptable Standard High Maintained Good 22 77.3 14 81.0 49,485 72.9 46,903 70.5
Standard of Excellence Very Low Declined Concern 22 4.5 14 27.0 49,485 21.7 46,903 18.9
English Language Arts 9Acceptable Standard Very High Improved Excellent 14 92.9 11 69.1 45,487 76.8 43,746 76.3
Standard of Excellence Very High Improved Excellent 14 21.4 11 3.0 45,487 14.9 43,746 14.9
English Lang Arts 9 KAEAcceptable Standard n/a n/a n/a n/a n/a n/a n/a 1,428 58.8 1,576 61.9
Standard of Excellence n/a n/a n/a n/a n/a n/a n/a 1,428 5.9 1,576 4.8
French Language Arts 9Acceptable Standard n/a n/a n/a n/a n/a n/a n/a 2,763 83.1 2,625 85.1
Standard of Excellence n/a n/a n/a n/a n/a n/a n/a 2,763 11.2 2,625 10.7
Français 9Acceptable Standard n/a n/a n/a n/a n/a n/a n/a 379 88.9 392 87.0
Standard of Excellence n/a n/a n/a n/a n/a n/a n/a 379 26.1 392 21.6
Mathematics 9Acceptable Standard Very High Improved Excellent 14 78.6 11 50.9 45,020 67.2 43,295 66.7
Standard of Excellence High Maintained Good 14 21.4 11 15.4 45,020 19.0 43,295 17.6
Mathematics 9 KAEAcceptable Standard n/a n/a n/a n/a n/a n/a n/a 1,848 57.5 2,026 61.8
Standard of Excellence n/a n/a n/a n/a n/a n/a n/a 1,848 13.3 2,026 14.0
Science 9Acceptable Standard Intermediate Maintained Acceptable 14 71.4 11 71.6 45,445 74.0 43,808 73.8
Standard of Excellence Very High Maintained Excellent 14 21.4 11 15.4 45,445 21.4 43,808 22.4
Science 9 KAEAcceptable Standard n/a n/a n/a n/a n/a n/a n/a 1,440 63.9 1,547 64.1
Standard of Excellence n/a n/a n/a n/a n/a n/a n/a 1,440 13.3 1,547 14.8
Social Studies 9Acceptable Standard High Maintained Good 14 78.6 11 65.1 45,484 67.0 43,722 65.1
Standard of Excellence Very High Maintained Excellent 14 35.7 11 21.0 45,484 20.2 43,722 19.2
Social Studies 9 KAEAcceptable Standard n/a n/a n/a n/a n/a n/a n/a 1,393 56.3 1,533 59.0
Standard of Excellence n/a n/a n/a n/a n/a n/a n/a 1,393 12.7 1,533 11.2Notes:1. Data values have been suppressed where the number of respondents/students is fewer than 6. Suppression is marked with an asterisk (*).2. Achievement Evaluation is not calculated for courses that do not have sufficient data available, either due to too few jurisdictions offering the
course or because of changes in tests. 3. Participation in Provincial Achievement Tests was impacted by the flooding in June 2013 (Grade 9 only) and by the fires in May to June 2016.
Caution should be used when interpreting trends over time for the province and those school authorities affected by these events.
Page 36

Authority: 9018 St. Matthew Evangelical Lutheran Church of Stony Plain, Alberta
Measure Evaluation Reference - Achievement Evaluation
Achievement evaluation is based upon a comparison of Current Year data to a set of standards which remain consistent over time. The Standards are calculated by taking the 3 year average of baseline data for each measure across all school jurisdictions and calculating the 5th, 25th, 75th, and 95th percentiles. Once calculated, these standards remain in place from year to year to allow for consistent planning and evaluation.
The table below shows the range of values defining the 5 achievement evaluation levels for each measure.
Course Measure Very Low Low Intermediate High Very High
English Language Arts 6Acceptable Standard 0.00 - 67.95 67.95 - 78.40 78.40 - 86.09 86.09 - 91.37 91.37 - 100.00
Standard of Excellence 0.00 - 6.83 6.83 - 11.65 11.65 - 17.36 17.36 - 22.46 22.46 - 100.00
French Language Arts 6Acceptable Standard 0.00 - 41.69 41.69 - 73.54 73.54 - 92.32 92.32 - 97.93 97.93 - 100.00
Standard of Excellence 0.00 - 2.72 2.72 - 8.13 8.13 - 15.29 15.29 - 23.86 23.86 - 100.00
Mathematics 6Acceptable Standard 0.00 - 63.91 63.91 - 70.73 70.73 - 79.61 79.61 - 88.67 88.67 - 100.00
Standard of Excellence 0.00 - 8.53 8.53 - 11.31 11.31 - 18.13 18.13 - 25.17 25.17 - 100.00
Science 6Acceptable Standard 0.00 - 60.36 60.36 - 78.51 78.51 - 86.46 86.46 - 90.64 90.64 - 100.00
Standard of Excellence 0.00 - 11.74 11.74 - 17.42 17.42 - 25.34 25.34 - 34.31 34.31 - 100.00
Social Studies 6Acceptable Standard 0.00 - 58.97 58.97 - 68.15 68.15 - 76.62 76.62 - 83.55 83.55 - 100.00
Standard of Excellence 0.00 - 7.30 7.30 - 12.45 12.45 - 19.08 19.08 - 30.09 30.09 - 100.00
English Language Arts 9Acceptable Standard 0.00 - 63.55 63.55 - 75.66 75.66 - 83.70 83.70 - 90.27 90.27 - 100.00
Standard of Excellence 0.00 - 5.96 5.96 - 9.43 9.43 - 14.72 14.72 - 20.46 20.46 - 100.00
English Lang Arts 9 KAEAcceptable Standard 0.00 - 29.97 29.97 - 53.86 53.86 - 76.19 76.19 - 91.85 91.85 - 100.00
Standard of Excellence 0.00 - 0.00 0.00 - 0.30 0.30 - 10.00 10.00 - 20.31 20.31 - 100.00
French Language Arts 9Acceptable Standard 0.00 - 67.59 67.59 - 81.33 81.33 - 92.06 92.06 - 97.26 97.26 - 100.00
Standard of Excellence 0.00 - 1.67 1.67 - 6.81 6.81 - 17.11 17.11 - 28.68 28.68 - 100.00
Mathematics 9Acceptable Standard 0.00 - 52.42 52.42 - 60.73 60.73 - 73.88 73.88 - 78.00 78.00 - 100.00
Standard of Excellence 0.00 - 8.18 8.18 - 12.49 12.49 - 18.10 18.10 - 24.07 24.07 - 100.00
Mathematics 9 KAEAcceptable Standard 0.00 - 28.14 28.14 - 53.85 53.85 - 75.83 75.83 - 94.44 94.44 - 100.00
Standard of Excellence 0.00 - 0.00 0.00 - 6.07 6.07 - 20.43 20.43 - 31.67 31.67 - 100.00
Science 9Acceptable Standard 0.00 - 50.57 50.57 - 60.14 60.14 - 72.50 72.50 - 76.89 76.89 - 100.00
Standard of Excellence 0.00 - 3.39 3.39 - 6.71 6.71 - 11.81 11.81 - 15.85 15.85 - 100.00
Science 9 KAEAcceptable Standard 0.00 - 38.75 38.75 - 59.30 59.30 - 78.33 78.33 - 87.58 87.58 - 100.00
Standard of Excellence 0.00 - 0.00 0.00 - 7.47 7.47 - 21.41 21.41 - 40.82 40.82 - 100.00
Social Studies 9Acceptable Standard 0.00 - 56.26 56.26 - 62.27 62.27 - 74.04 74.04 - 79.85 79.85 - 100.00
Standard of Excellence 0.00 - 10.03 10.03 - 12.78 12.78 - 19.76 19.76 - 24.03 24.03 - 100.00
Social Studies 9 KAEAcceptable Standard 0.00 - 38.79 38.79 - 53.82 53.82 - 72.42 72.42 - 84.88 84.88 - 100.00
Standard of Excellence 0.00 - 0.00 0.00 - 5.71 5.71 - 17.19 17.19 - 36.26 36.26 - 100.00
Notes:1. The range of values at each evaluation level is interpreted as greater than or equal to the lower value, and less than the higher value. For the
Very High evaluation level, values range from greater than or equal to the lower value to 100%.2. Participation in Provincial Achievement Tests was impacted by the flooding in June 2013 (Grade 9 only) and by the fires in May to June 2016.
Caution should be used when interpreting trends over time for the province and those school authorities affected by these events.3. Achievement Evaluation is not calculated for courses that do not have sufficient data available, either due to too few jurisdictions offering the
course or because of changes in tests.
Improvement TableFor each jurisdiction, improvement evaluation consists of comparing the Current Year result for each measure with the previous three-year average. A chi-square statistical test is used to determine the significance of the improvement. This test takes into account the size of the jurisdiction in the calculation to make improvement evaluation fair across jurisdictions of different sizes.
The table below shows the definition of the 5 improvement evaluation levels based upon the chi-square result.
Evaluation Category Chi-Square RangeDeclined Significantly 3.84 + (current < previous 3-year average)
Declined 1.00 - 3.83 (current < previous 3-year average)
Maintained less than 1.00
Improved 1.00 - 3.83 (current > previous 3-year average)
Improved Significantly 3.84 + (current > previous 3-year average)
Page 37

Authority: 9018 St. Matthew Evangelical Lutheran Church of Stony Plain, Alberta
Overall Evaluation TableThe overall evaluation combines the Achievement Evaluation and the Improvement Evaluation. The table below illustrates how the Achievement and Improvement evaluations are combined to get the overall evaluation.
Achievement
Very High High Intermediate Low Very Low
Improved Significantly Excellent Good Good Good Acceptable
Improved Excellent Good Good Acceptable Issue
Maintained Excellent Good Acceptable Issue Concern
Declined Good Acceptable Issue Issue Concern
Declined Significantly Acceptable Issue Issue Concern Concern
Page 38

Authority: 9018 St. Matthew Evangelical Lutheran Church of Stony Plain, Alberta
Program of Studies – Measure Details (OPTIONAL)
Percentage of teachers, parents and students satisfied with the opportunity for students to receive a broad program of studies including fine arts, career, technology, and health and physical education.
Authority Province2013 2014 2015 2016 2017 2013 2014 2015 2016 2017
Overall 92.0 83.7 88.8 81.6 83.6 81.5 81.3 81.3 81.9 81.9Teacher 97.2 n/a 100.0 97.5 93.7 87.9 87.5 87.2 88.1 88.0Parent 92.0 83.7 83.8 82.4 81.1 78.9 79.9 79.9 80.1 80.1Student 86.7 n/a 82.6 65.0 76.0 77.8 76.6 76.9 77.5 77.7
Graph of Overall Authority Results (optional) Graph of Detailed Authority Results (optional)
Notes: 1. Data values have been suppressed where the number of respondents/students is fewer than 6. Suppression is marked with an asterisk (*).2. Survey results for the province and school authorities were impacted by the changes in the number of students responding to the survey through the
introduction of the OurSCHOOL/TTFM (Tell Them From Me) survey in 2014.
Parental Involvement – Measure Details (OPTIONAL)
Percentage of teachers and parents satisfied with parental involvement in decisions about their child's education.Authority Province
2013 2014 2015 2016 2017 2013 2014 2015 2016 2017Overall 98.4 86.1 95.4 93.2 96.8 80.3 80.6 80.7 80.9 81.2Teacher 100.0 n/a 100.0 98.0 100.0 88.5 88.0 88.1 88.4 88.5Parent 96.8 86.1 90.8 88.4 93.6 72.2 73.1 73.4 73.5 73.9
Graph of Overall Authority Results (optional) Graph of Detailed Authority Results (optional)
Notes: 1. Data values have been suppressed where the number of respondents/students is fewer than 6. Suppression is marked with an asterisk (*).
Page 39

Authority: 9018 St. Matthew Evangelical Lutheran Church of Stony Plain, Alberta
Education Quality – Measure Details (OPTIONAL)
Percentage of teachers, parents and students satisfied with the overall quality of basic education.Authority Province
2013 2014 2015 2016 2017 2013 2014 2015 2016 2017Overall 96.9 98.8 96.8 94.7 95.9 89.8 89.2 89.5 90.1 90.1Teacher 100.0 n/a 100.0 98.3 100.0 95.7 95.5 95.9 96.0 95.9Parent 96.8 98.8 95.9 97.1 97.8 84.9 84.7 85.4 86.1 86.4Student 94.0 n/a 94.5 88.7 90.0 88.7 87.3 87.4 88.0 88.1
Graph of Overall Authority Results (optional) Graph of Detailed Authority Results (optional)
Notes: 1. Data values have been suppressed where the number of respondents/students is fewer than 6. Suppression is marked with an asterisk (*).2. Survey results for the province and school authorities were impacted by the changes in the number of students responding to the survey through the
introduction of the OurSCHOOL/TTFM (Tell Them From Me) survey in 2014.
Safe and Caring – Measure Details (OPTIONAL)
Percentage of teacher, parent and student agreement that: students are safe at school, are learning the importance of caring for others, are learning respect for others and are treated fairly in school.
Authority Province2013 2014 2015 2016 2017 2013 2014 2015 2016 2017
Overall 95.2 97.9 97.2 94.0 94.7 89.0 89.1 89.2 89.5 89.5Teacher 100.0 n/a 100.0 100.0 100.0 95.0 95.3 95.4 95.4 95.3Parent 96.2 97.9 100.0 97.7 96.3 87.8 88.9 89.3 89.8 89.9Student 89.4 n/a 91.7 84.4 87.9 84.2 83.1 83.0 83.4 83.3
Graph of Overall Authority Results (optional) Graph of Detailed Authority Results (optional)
Notes: 1. Data values have been suppressed where the number of respondents/students is fewer than 6. Suppression is marked with an asterisk (*).2. Survey results for the province and school authorities were impacted by the changes in the number of students responding to the survey through the
introduction of the OurSCHOOL/TTFM (Tell Them From Me) survey in 2014.
Page 40

Authority: 9018 St. Matthew Evangelical Lutheran Church of Stony Plain, Alberta
School Improvement – Measure Details (OPTIONAL)
Percentage of teachers, parents and students indicating that their school and schools in their jurisdiction have improved or stayed the same the last three years.
Authority Province2013 2014 2015 2016 2017 2013 2014 2015 2016 2017
Overall 86.2 93.1 93.0 88.6 91.9 80.6 79.8 79.6 81.2 81.4Teacher 87.5 n/a 88.9 90.0 100.0 80.9 81.3 79.8 82.3 82.2Parent 85.7 93.1 97.3 97.1 91.7 77.9 77.0 78.5 79.7 80.8Student 85.4 n/a 92.9 78.5 84.0 82.9 81.2 80.7 81.5 81.1
Graph of Overall Authority Results (optional) Graph of Detailed Authority Results (optional)
Notes: 1. Data values have been suppressed where the number of respondents/students is fewer than 6. Suppression is marked with an asterisk (*).2. Survey results for the province and school authorities were impacted by the changes in the number of students responding to the survey through the
introduction of the OurSCHOOL/TTFM (Tell Them From Me) survey in 2014.
Page 41