request for comment adjustments to us state and local ... filethis request for comment requests...
TRANSCRIPT
REQUEST FOR COMMENT
U.S. PUBLIC FINANCE JULY 2, 2012
Table of Contents:
SUMMARY 1 SUBSTANTIAL DIFFERENCES IN PENSION DISCLOSURE AND ACCOUNTING METHODS HIGHLIGHT THE DESIRE FOR COMPARABILITY 2 IMPACT OF PROPOSED ADJUSTMENTS ON AGGREGATE PENSION FUNDING LEVELS 2 IMPACT OF PROPOSED ADJUSTMENTS ON RATINGS 2 THE ROLE OF PENSIONS IN STATE AND LOCAL GOVERNMENT RATING ANALYSIS 3 REASONS TO ADJUST REPORTED PENSION DATA 3 MOODY’S ADJUSTMENTS TO REPORTED STATE AND LOCAL GOVERNMENT PENSION DATA 4 ADJUSTED FISCAL 2010 STATE AND LOCAL UNFUNDED PENSION LIABILITIES TOTAL $2.2 TRILLION, A THREE-FOLD INCREASE OVER REPORTED LIABILITIES 9 LIKELY IMPACT OF PROPOSED CHANGES ON STATE AND LOCAL GOVERNMENT RATINGS 10 ADDITIONAL PENSION ADJUSTMENTS POSSIBLE, BUT NOT CURRENTLY PROPOSED 12 APPENDICES 13
Analyst Contacts:
NEW YORK +1.212.553.1653
Marcia Van Wagner +1.212.553.2952 Vice President – Senior Analyst [email protected]
Timothy Blake +1.212.553.0849 Managing Director – Public Finance [email protected]
» contacts continued on the last page
Adjustments to US State and Local Government Reported Pension Data
Summary
This Request for Comment requests feedback on our proposal to implement several adjustments to the pension liability and cost information reported by state and local governments and their pension plans. While our methodologies for rating state and local government debt already incorporate an analysis of pension obligations, we seek comment on whether the proposed adjustments would improve the comparability of pension information across governments and facilitate the calculation of combined measures of bonded debt and unfunded pension liabilities in our credit analysis.
We are considering four principal adjustments to as-reported pension information:
1. Multiple-employer cost-sharing plan liabilities will be allocated to specific government employers based on proportionate shares of total plan contributions
1
2. Accrued actuarial liabilities will be adjusted based on a high-grade long-term corporate bond index discount rate (5.5% for 2010 and 2011)
3. Asset smoothing will be replaced with reported market or fair value as of the actuarial reporting date
4. Annual pension contributions will be adjusted to reflect the foregoing changes as well as a common amortization period
This proposal is part of our ongoing efforts to bring greater transparency and consistency to the analysis of pension liabilities, which have driven a number of downgrades and outlook changes for states and cities. In 2011, we began using consolidated debt and pension metrics in our state government credit analysis.2
1 These adjustments do not apply to the non-profit sector, including hospitals and higher education, which must meet uniform accounting and funding standards set by
the Financial Accounting Standards Board.
We propose these adjustments to address the fact that government accounting guidelines allow for significant differences in key actuarial and financial assumptions, which can make statistical comparisons across plans very challenging. While we do not expect any state ratings to change based on these adjustments alone, we will take rating actions for those local governments whose adjusted liability is outsized relative to their rating category.
2 See “Combining Debt and Pension Liabilities of U.S. States Enhances Comparability”.
U.S. PUBLIC FINANCE
2 JULY 2, 2012
REQUEST FOR COMMENT: ADJUSTMENTS TO US STATE AND LOCAL GOVERNMENT REPORTED PENSION DATA
Substantial differences in pension disclosure and accounting methods highlight the desire for comparability
Growth of reported unfunded pension liabilities during the past decade and the associated budgetary burden of pension contributions have increased the impact of underfunded pensions on state and local government credit analysis. Our current methodologies for state and local government debt incorporate an assessment of unfunded pension liabilities and costs based on current reported pension disclosure, including key actuarial and financial assumptions. However, we are requesting input on whether a more systematic approach to adjusting the reported data and comparing pensions with bonded debt will make our analysis more robust and transparent.
We are specifically seeking feedback from market participants on the following items:
» The usefulness of the adjustments in enhancing the comparability of pension obligations among state and local government entities
» The efficacy of treating pension liabilities similarly to debt to improve the analysis of the long-term liabilities of these governmental entities
We invite market participants to provide feedback on this proposal by sending comments by August 31, 2012 to [email protected]. We will consider comments received during this period and would finalize the adjustment approach shortly thereafter in a Rating Implementation Guidance document that will supplement our US state and local government general obligation methodologies.
Impact of proposed adjustments on aggregate pension funding levels
The proposed adjustments described in this Request for Comment would nearly triple fiscal 2010 reported unfunded actuarial accrued liability (“UAAL”) for the 50 states and our rated local governments, increasing UAAL to $2.2 trillion from $766 billion. The adjusted UAAL is divided almost equally between the state and local government sectors. For the state sector, we constructed hypothetical annual contribution amounts that would cause state pension plans to reach full funding within a 17-year period. By this measure of cost, fiscal 2010 state pension contributions would be $128.8 billion, compared to the $36.6 billion states actually contributed.
Impact of proposed adjustments on ratings
While only one element of Moody’s credit analysis of governments, credit pressures related to pensions have been a driving factor in a number of high profile rating downgrades in the past two years and they continue to exert significant credit pressure for select issuers. Several recent rating actions on US states have resulted from the negative impact of both persistent pension underfunding and below-forecast pension investment performance. While the proposed adjustments, if implemented, would further highlight the well-known weakest funded pensions, the adjustments alone are not expected to result in rating changes for US states.
The proposed pension adjustments likely would result in rating actions for those local governments where the adjusted liability is outsized for the rating category and without mitigating factors such as demonstrated flexibility to respond to higher fixed costs. We are still evaluating the full impact of the proposed pension adjustments on local government ratings.
U.S. PUBLIC FINANCE
3 JULY 2, 2012
REQUEST FOR COMMENT: ADJUSTMENTS TO US STATE AND LOCAL GOVERNMENT REPORTED PENSION DATA
The role of pensions in state and local government rating analysis
We consider unfunded pension liabilities as debt-like obligations that can create a significant burden on government operating budgets. In most states, accrued benefits are protected under constitutional or statutory contract clauses that make it difficult to reduce these liabilities, although recent actions taken by states to do so demonstrate that this issue is rapidly evolving.
Moody’s credit analysis has always included consideration of potential credit pressure placed on government obligors by their pension liabilities based on reported liabilities and examination of the underlying assumptions on which the reporting is based.. Not only do pension liabilities impinge on budgetary and financial flexibility, but an issuer’s approach to managing pension obligations also informs our view of management strength.
While the funded ratio (ratio of assets to liabilities) is a highly visible measure of pension condition, it does not relate the size of unfunded pension obligations to the scale of an issuer’s resources. Our evaluation of government credit pressure from pension liabilities considers the unfunded actuarial accrued liability (UAAL) relative to ability-to-pay measures such as government revenues and economic base. Typical economic base measures are full property value for local governments and gross domestic product for states.
In addition to separate consideration of pension metrics such as UAAL as a percent of revenues, combining debt and pensions can improve transparency and peer comparisons. Combined metrics facilitate comparisons among issuers whose long-term obligations are split differently between bonded debt and pension liability. For example, our 2011 publication “Combining Debt and Pension Liabilities of U.S. States Enhances Comparability” introduced a new metric combining outstanding net tax-supported debt (NTSD) and unfunded actuarial accrued liabilities to reflect the long-term obligations of state governments. At the time, we acknowledged some of the limitations of the pension portion of these metrics due to differences in reporting methods among the states.
Reasons to adjust reported pension data
Historically, we have relied on pension data reported by pension systems in their annual financial reports and typically summarized in governmental financial disclosures. While the reported data typically reflect standard accounting practice, reporting requirements can hinder the ability to make meaningful peer comparisons.
Pension information as reported in annual financial reports usually is prepared by third-party actuarial firms, which use the individual benefit structures and demographics of each plan to project the value of future benefits and determine the accrued portion of those benefits on a present-value basis. Professional standards and common procedures ensure that most actuarial studies meet certain thresholds of quality.
However, latitude granted by the current standards set out in the Governmental Accounting Standards Board’s (GASB) Statement No. 27, Accounting for Pensions by State and Local Government Employers (“GASB 27”) has resulted in inconsistency in actuarial methods and variability in assumptions across plans. For example, currently governments may choose among six different actuarial cost attribution methods, are allowed significant latitude when estimating rates of return that are also used to calculate the present value of pension liabilities, and choose the amortization period over which to pay for their pension systems’ unfunded liabilities.
In addition, many governmental employers participate in multiple-employer cost-sharing plans (CSPs), creating an additional layer of opacity when interpreting the credit impacts of pension
U.S. PUBLIC FINANCE
4 JULY 2, 2012
REQUEST FOR COMMENT: ADJUSTMENTS TO US STATE AND LOCAL GOVERNMENT REPORTED PENSION DATA
liabilities. Because CSPs pool both assets and liabilities, they often do not calculate, and are not required to report, liabilities attributable to specific participating governments. This is a significant issue in the public sector, where we estimate that CSPs accounted for nearly three-quarters of total pension plan liabilities as of 2010. This estimate is based on our database covering 162 CSPs and over 3,400 single employer and agent plans sponsored by Moody’s-rated governments. Approximately 8,000 of our rated governments participate in one or more CSPs. (See Appendix A.)
GASB recently voted to approve GASB Statement no. 68, which it believes will substantially improve the accounting and financial reporting of public employee pensions by state and local governments. However, GASB 68 will not be in effect for all governments until fiscal 2015, although earlier adoption is encouraged. Once it is in effect, we believe differences in some key financial assumptions, such as determination of investment rates of return and discount rates will persist across the public plan landscape.
Moody’s adjustments to reported state and local government pension data
We seek comment on whether adjusting four aspects of reported pension data would improve comparability and enhance credit analysis of rated entities. Given the multiplicity of assumptions that enter into actuarial calculations, these proposed adjustments would affect only the most important shortcomings in pension reporting. This proposal is not intended to provide an alternate or replacement actuarial valuation of public pension liabilities. We believe that our proposed adjustments are material, feasible and practical given current disclosures, and in many respects similar to some of the requirements that are expected to be contained in GASB 68.
We propose these adjustments for the purpose of providing greater clarity and comparability to investors, and to assess the scale of pension liabilities in a way comparable to debt obligations. We are not suggesting that they be a guide, standard or requirement for a state or local governments to fund these obligations.
3
1. Allocate cost-sharing plan liabilities by share of total contribution
Because multiple-employer cost-sharing pension plans pool both assets and liabilities, the value of individual liabilities typically is not computed for individual participating employers. Some states report in the “schedule of funding progress” in their financial statements the liabilities, assets, funded ratios and UAAL for the entirety of cost-sharing plans of which they are sponsors. In addition to the amount they actually contribute, participating local governments report only their required annual contribution—as determined by the plan and typically based on active covered payroll.
We propose to allocate to state and rated local governments their proportionate shares of CSP unfunded liabilities based on the share of total plan contributions represented by each participating government’s reported contribution. For example, a local government reporting a $1 million net contribution to a CSP that reports $100 million of total employer contributions and an unfunded liability of $750 million would be allocated 1% of the CSP’s unfunded liability, or $7.5 million.
This approach is similar to GASB 68, which will require CSP employers to record a liability and expense equal to their proportionate share of the collective net pension liability. The employer’s proportionate share of the liability will be based on expected long-term contributions to the plan. In the interim, however, the only information available relates to current contributions.
3 GASB 68 is expected to be published in August 2012.
U.S. PUBLIC FINANCE
5 JULY 2, 2012
REQUEST FOR COMMENT: ADJUSTMENTS TO US STATE AND LOCAL GOVERNMENT REPORTED PENSION DATA
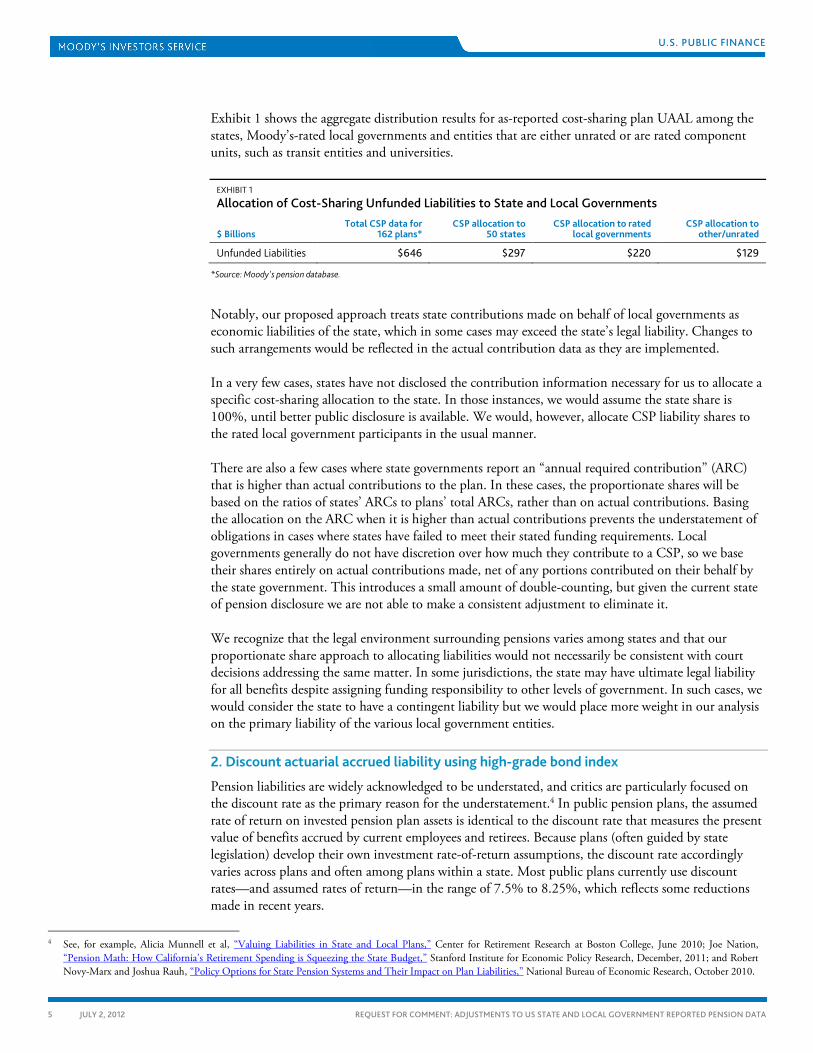
Exhibit 1 shows the aggregate distribution results for as-reported cost-sharing plan UAAL among the states, Moody’s-rated local governments and entities that are either unrated or are rated component units, such as transit entities and universities.
EXHIBIT 1
Allocation of Cost-Sharing Unfunded Liabilities to State and Local Governments
$ Billions Total CSP data for
162 plans* CSP allocation to
50 states CSP allocation to rated
local governments CSP allocation to
other/unrated
Unfunded Liabilities $646 $297 $220 $129
*Source: Moody's pension database.
Notably, our proposed approach treats state contributions made on behalf of local governments as economic liabilities of the state, which in some cases may exceed the state’s legal liability. Changes to such arrangements would be reflected in the actual contribution data as they are implemented.
In a very few cases, states have not disclosed the contribution information necessary for us to allocate a specific cost-sharing allocation to the state. In those instances, we would assume the state share is 100%, until better public disclosure is available. We would, however, allocate CSP liability shares to the rated local government participants in the usual manner.
There are also a few cases where state governments report an “annual required contribution” (ARC) that is higher than actual contributions to the plan. In these cases, the proportionate shares will be based on the ratios of states’ ARCs to plans’ total ARCs, rather than on actual contributions. Basing the allocation on the ARC when it is higher than actual contributions prevents the understatement of obligations in cases where states have failed to meet their stated funding requirements. Local governments generally do not have discretion over how much they contribute to a CSP, so we base their shares entirely on actual contributions made, net of any portions contributed on their behalf by the state government. This introduces a small amount of double-counting, but given the current state of pension disclosure we are not able to make a consistent adjustment to eliminate it.
We recognize that the legal environment surrounding pensions varies among states and that our proportionate share approach to allocating liabilities would not necessarily be consistent with court decisions addressing the same matter. In some jurisdictions, the state may have ultimate legal liability for all benefits despite assigning funding responsibility to other levels of government. In such cases, we would consider the state to have a contingent liability but we would place more weight in our analysis on the primary liability of the various local government entities.
2. Discount actuarial accrued liability using high-grade bond index
Pension liabilities are widely acknowledged to be understated, and critics are particularly focused on the discount rate as the primary reason for the understatement.4
4 See, for example, Alicia Munnell et al,
In public pension plans, the assumed rate of return on invested pension plan assets is identical to the discount rate that measures the present value of benefits accrued by current employees and retirees. Because plans (often guided by state legislation) develop their own investment rate-of-return assumptions, the discount rate accordingly varies across plans and often among plans within a state. Most public plans currently use discount rates—and assumed rates of return—in the range of 7.5% to 8.25%, which reflects some reductions made in recent years.
“Valuing Liabilities in State and Local Plans,” Center for Retirement Research at Boston College, June 2010; Joe Nation, “Pension Math: How California’s Retirement Spending is Squeezing the State Budget,” Stanford Institute for Economic Policy Research, December, 2011; and Robert Novy-Marx and Joshua Rauh, “Policy Options for State Pension Systems and Their Impact on Plan Liabilities,” National Bureau of Economic Research, October 2010.
U.S. PUBLIC FINANCE
6 JULY 2, 2012
REQUEST FOR COMMENT: ADJUSTMENTS TO US STATE AND LOCAL GOVERNMENT REPORTED PENSION DATA
We propose replacing the differing discount rates with a common rate based on a high-grade bond index because:
» Investment return assumptions in use by public plans today are inconsistent with actual return experience over the past decade (when total returns on the S&P 500 index grew at about 4.1% annually) and today’s low fixed-income yield environment. According to Wilshire Associates, public plans in the aggregate allocate roughly one-third of assets to fixed income
» The approach is consistent with our net tax-supported debt (NTSD) figures, which are implicitly discounted at their weighted average bond yield since they are based on par value
» A high-grade bond index is a reasonable proxy for government’s cost of financing portions of its pension liability with additional bonded debt
» High-grade bonds are an available investment that could be used in a low-risk strategy to “match-fund” pension assets and liabilities.
For adjustments to 2010 and 2011 pension data, the proposed discount rate is 5.5%, which is based on Citibank’s Pension Discount Curve. Based on high-quality (Aa or better) corporate bonds, this curve is duration-weighted by Citibank for purposes of creating a discount rate for a typical pension plan in the private sector. The 5.5% rate is a rounded average of the rates published for May, June, and July of 2010 and 2011. This proposed approach to the discount rate is similar to that used in the private sector, where Financial Accounting Standards Board (FASB) regulations require pension systems to discount assets at a rate consistent with the yield on high-quality corporate bonds. We propose to revisit the discount rate annually.
To implement the discount rate adjustment, we propose using a common 13-year duration estimate for all plans. This is a measure of the time-weighted average life of benefit payments. Each plan’s reported actuarial accrued liability (“AAL”) is projected forward for 13 years at the plan’s reported discount rate, and then discounted back at 5.5%. This calculation results in an increase in AAL of roughly 13% for each one percentage point difference between 5.5% and the plan’s discount rate. For example, a plan with a $10 billion reported AAL based on a discount rate of 8% would have an adjusted AAL of $13.56 billion, or 35.6% greater than reported..
We recognize this duration estimate may be higher than warranted for some plans and lower than warranted for others. Each pension plan has a unique benefit structure and demographic profile that affects the time-weighted profile (duration) of future benefit payment liabilities. However, plan durations are not reported, and calculating duration individually for each plan is not feasible. Our proposed 13-year duration is the median calculated from a sample of pension plans whose durations ranged from about 10 to 17 years. Plans with shorter durations usually are closed or have a preponderance of older or retired members.
3. Eliminate asset valuation smoothing
For purposes of reporting and funding, most public pension plans “smooth” market values by averaging in pension asset gains and losses over multiple years. While reducing the volatility of required contributions, this practice can distort the size of unfunded liabilities and limit comparability, particularly when there have been wide swings in investment performance. Smoothing periods range from zero to 15 years, with three- to- five-year smoothing periods most common. Some plans change their smoothing periods–both up and down–in response to large swings in market values.
U.S. PUBLIC FINANCE
7 JULY 2, 2012
REQUEST FOR COMMENT: ADJUSTMENTS TO US STATE AND LOCAL GOVERNMENT REPORTED PENSION DATA
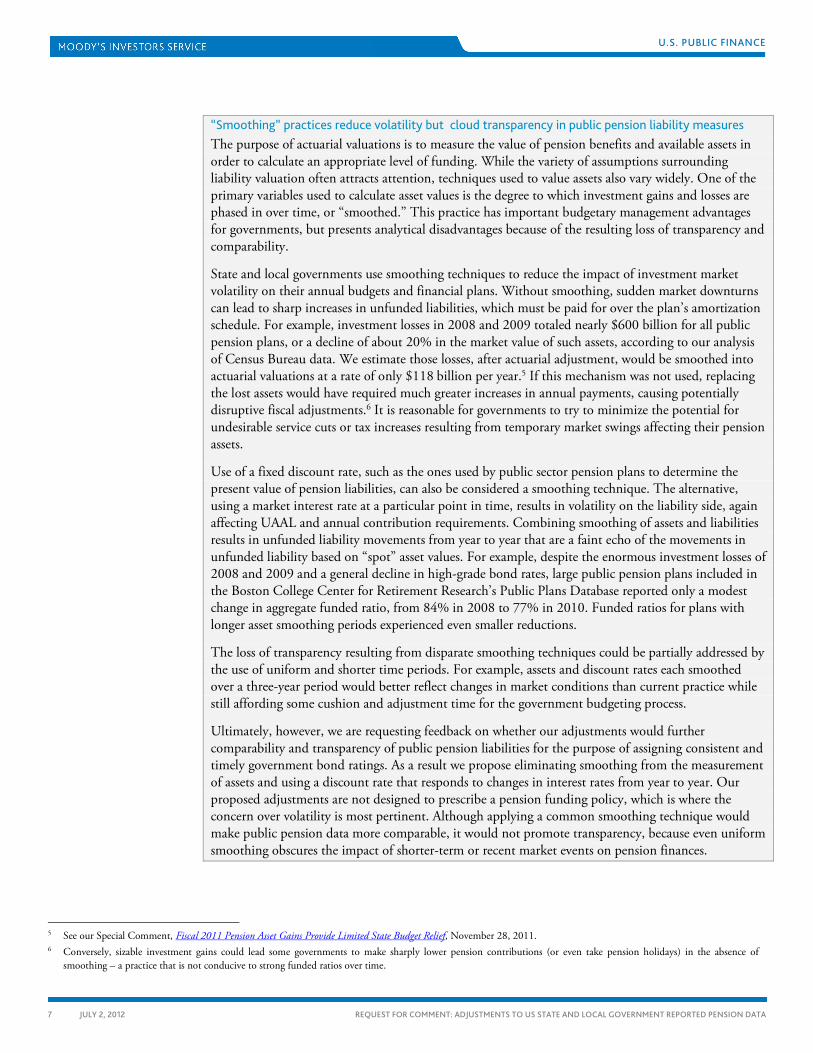
“Smoothing” practices reduce volatility but cloud transparency in public pension liability measures The purpose of actuarial valuations is to measure the value of pension benefits and available assets in order to calculate an appropriate level of funding. While the variety of assumptions surrounding liability valuation often attracts attention, techniques used to value assets also vary widely. One of the primary variables used to calculate asset values is the degree to which investment gains and losses are phased in over time, or “smoothed.” This practice has important budgetary management advantages for governments, but presents analytical disadvantages because of the resulting loss of transparency and comparability.
State and local governments use smoothing techniques to reduce the impact of investment market volatility on their annual budgets and financial plans. Without smoothing, sudden market downturns can lead to sharp increases in unfunded liabilities, which must be paid for over the plan’s amortization schedule. For example, investment losses in 2008 and 2009 totaled nearly $600 billion for all public pension plans, or a decline of about 20% in the market value of such assets, according to our analysis of Census Bureau data. We estimate those losses, after actuarial adjustment, would be smoothed into actuarial valuations at a rate of only $118 billion per year.5 If this mechanism was not used, replacing the lost assets would have required much greater increases in annual payments, causing potentially disruptive fiscal adjustments.6
Use of a fixed discount rate, such as the ones used by public sector pension plans to determine the present value of pension liabilities, can also be considered a smoothing technique. The alternative, using a market interest rate at a particular point in time, results in volatility on the liability side, again affecting UAAL and annual contribution requirements. Combining smoothing of assets and liabilities results in unfunded liability movements from year to year that are a faint echo of the movements in unfunded liability based on “spot” asset values. For example, despite the enormous investment losses of 2008 and 2009 and a general decline in high-grade bond rates, large public pension plans included in the Boston College Center for Retirement Research’s Public Plans Database reported only a modest change in aggregate funded ratio, from 84% in 2008 to 77% in 2010. Funded ratios for plans with longer asset smoothing periods experienced even smaller reductions.
It is reasonable for governments to try to minimize the potential for undesirable service cuts or tax increases resulting from temporary market swings affecting their pension assets.
The loss of transparency resulting from disparate smoothing techniques could be partially addressed by the use of uniform and shorter time periods. For example, assets and discount rates each smoothed over a three-year period would better reflect changes in market conditions than current practice while still affording some cushion and adjustment time for the government budgeting process.
Ultimately, however, we are requesting feedback on whether our adjustments would further comparability and transparency of public pension liabilities for the purpose of assigning consistent and timely government bond ratings. As a result we propose eliminating smoothing from the measurement of assets and using a discount rate that responds to changes in interest rates from year to year. Our proposed adjustments are not designed to prescribe a pension funding policy, which is where the concern over volatility is most pertinent. Although applying a common smoothing technique would make public pension data more comparable, it would not promote transparency, because even uniform smoothing obscures the impact of shorter-term or recent market events on pension finances.
5 See our Special Comment, Fiscal 2011 Pension Asset Gains Provide Limited State Budget Relief, November 28, 2011. 6 Conversely, sizable investment gains could lead some governments to make sharply lower pension contributions (or even take pension holidays) in the absence of
smoothing – a practice that is not conducive to strong funded ratios over time.
U.S. PUBLIC FINANCE
8 JULY 2, 2012
REQUEST FOR COMMENT: ADJUSTMENTS TO US STATE AND LOCAL GOVERNMENT REPORTED PENSION DATA
To adjust for the inconsistent calculation of asset values, we propose replacing smoothed values with the reported fair value of assets as of the valuation date. We recognize that valuation dates also may be inconsistent and that this inconsistency could be addressed by bringing valuations to a common date with the use of an average growth factor. However, this adjustment itself may introduce another layer of inconsistency given variability of actual investment returns across pension plans. For example, according to data for 126 public pension plans collected by the Boston College Center for Retirement Research, the one-year investment return reported in fiscal 2010 financial statements ranged from about 1% to nearly 26%. The reported three-year returns were within a narrower , but still significant, range of 5.5% to -8.6%.
This adjustment, which is consistent with GASB 68, would be applied to fiscal 2010 pension data for states. For local governments, gaps in reporting of market or fair value for multiple-employer agent plans may prevent this adjustment in some cases. We are evaluating whether adequate data is available to make this adjustment for the local government sector starting with fiscal 2011. For states, fiscal 2010 market values were, in aggregate, about 15% lower than reported smoothed values, with this differential cut roughly in half in 2011, based on a sample of 2011 financial reports. Our sample of local government pension data reveals similar differentials between smoothed and unsmoothed values.
For a hypothetical example of the impacts of cost-sharing, discount rate and asset valuation smoothing adjustments on individual governments, see Appendix B.
4. State annual pension contributions calculated based on new discount rate and uniform UAAL amortization
Ideally, participating government employers make annual contributions to their pension plans that result in those plans becoming fully funded over a reasonable time horizon. We propose to adjust annual contributions to reflect the adjustments we have made to pension liabilities. We believe this adjustment would function as a more accurate indicator of fiscal burden. We would not intend it to be a prescriptive funding strategy. Current disclosures allow us to propose making the adjustment only for states at this time.
The annual contribution can be divided into two components: (1) employer normal cost (ENC), which is the present value of the employer’s share of liabilities accrued in a given year net of annual employee contributions, and (2) amortization payment, which is equal to the amount necessary to eliminate the unfunded liability over a given amortization period, typically calculated as a level percent of payroll.
We will adjust the ENC to reflect our common discount rate, and the amortization payment to reflect our adjusted unfunded liability, a common amortization period, and a level-dollar funding approach.
» New discount rate applied to normal cost. The ENC adjustment reflects the lower assumed discount rate and the use of a 17-year active employee duration estimate for all plans – i.e., each plan’s normal cost is projected forward for 17 years at the plan’s reported discount rate, and then discounted back at 5.5%, after which employee contributions are deducted to determine the adjusted ENC. The 17-year duration assumption reflects our estimate of the average remaining service life of employees based on a sample of public pension plans. We acknowledge that this is a simplifying assumption that may be too long or too short for different plans. Using this approach, a reported ENC payment of $100 million based on an 8% discount rate would grow to $149 million based on a 5.5% discount rate.

U.S. PUBLIC FINANCE
9 JULY 2, 2012
REQUEST FOR COMMENT: ADJUSTMENTS TO US STATE AND LOCAL GOVERNMENT REPORTED PENSION DATA
» Uniform amortization of UAAL. The proposed amortization payment adjustment uses our adjusted unfunded liability for each plan to construct a simple 17-year level dollar amortization payment (also based on average remaining service life). The remaining service life adjustment is similar to a new GASB standard. For an issuer with $2 billion of adjusted unfunded liability, for example, our approach would yield annual amortization payments of $174 million. In contrast, the common practice of amortizing UAAL over a 30-year amortization schedule with payments based on a level percent of payroll would yield payments that grow from about $92 million in the first year to $218 million in the last year (assuming 5.5% interest and 3% annual payroll growth).
For a hypothetical example of an issuer with a $2 billion UAAL and a $100 million employer normal cost payment, our normal cost and amortization adjustments would increase the annual contribution to $323 million from $192 million in the first year of the amortization schedule.
Adjusted fiscal 2010 state and local unfunded pension liabilities total $2.2 trillion, a three-fold increase over reported liabilities
Our database of more than 3,500 pension plans indicates an aggregate fiscal 2010 reported unfunded liability for the 50 states and about 8,500 rated local governments of $766 billion, divided almost equally between the two sectors, as shown in Exhibit 2. This division reflects our allocation of CSP liabilities between the sectors, as described herein (in which some CSP liabilities are allocated to entities other than the states and rated local governments).
State government sector. After adjusting for the discount rate alone, the state sector’s UAAL grows 129% to $894 billion from $391 billion. This change decreases the funded ratio to 55%. With the additional adjustment of asset valuation, the sector’s UAAL grows to $1.056 trillion, or 74% of total annual state revenues, from $391 billion, or 28% of revenues, an increase of 170%. This further decreases the funded ratio to 46%. Our adjustments to state sector annual pension contributions result in an increase of 252%, from $36.6 billion to $128.8 billion, or from 2.6% of revenues to 9.1% of revenues. About three-fourths of adjusted annual contributions consist of amortization of the adjusted UAAL.
Local government sector. For the local government sector, our discount rate adjustment increases UAAL 158%, to $967 billion from $375 billion, and reduces the funded ratio to 59% from 79%. With incomplete data on asset market value for local government pension plans, we estimate that the asset value adjustment results in an additional increase in UAAL to $1.135 trillion and a further reduction in the funded ratio to 52%. The asset value adjustment for local governments is an estimate based on a sample. As noted above, we have not made adjustments to reported annual contributions for local governments because the necessary data is not uniformly disclosed.
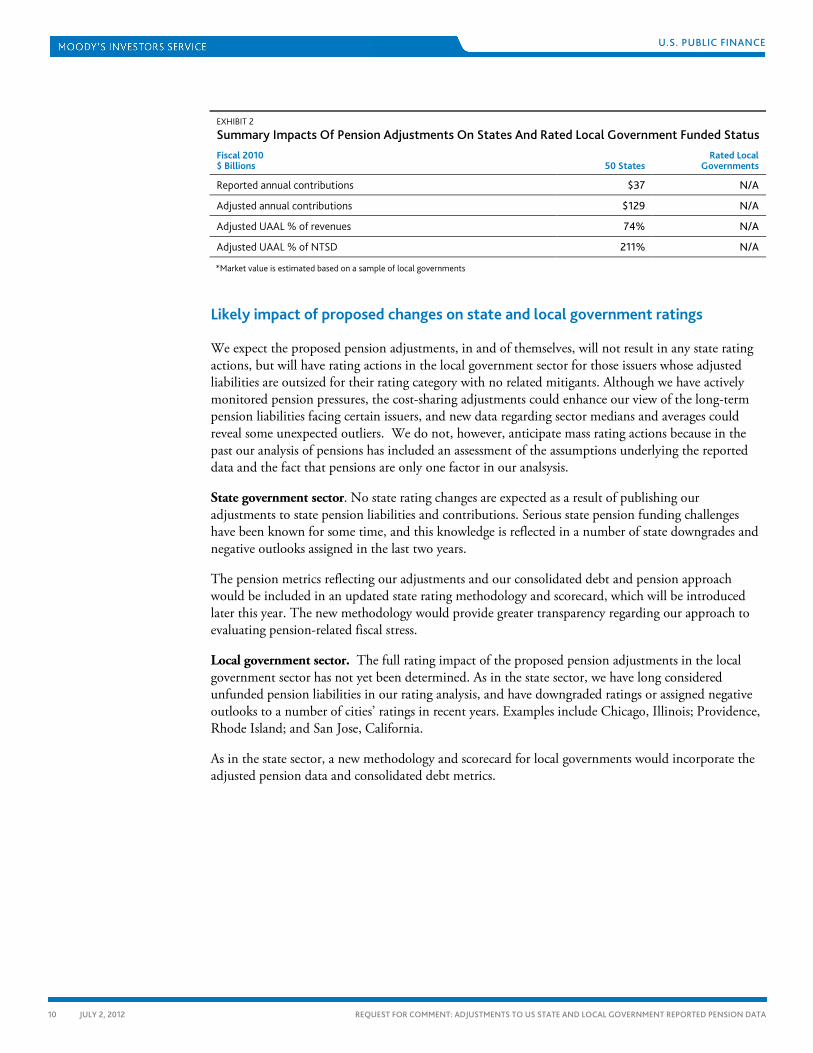
EXHIBIT 2
Summary Impacts Of Pension Adjustments On States And Rated Local Government Funded Status Fiscal 2010 $ Billions 50 States
Rated Local Governments
Reported UAAL, adjusted for CSP shares $391 $375
Adjusted UAAL, 5.5% discount rate & reported smoothed asset value $894 $967
Adjusted UAAL, 5.5% discount rate & market value of assets $1,056 $1,135*
Reported funded ratio 73% 79%
Adjusted funded ratio (smoothed value of assets) 55% 59%
Adjusted funded ratio (market value of assets) 46% 52%
U.S. PUBLIC FINANCE
10 JULY 2, 2012
REQUEST FOR COMMENT: ADJUSTMENTS TO US STATE AND LOCAL GOVERNMENT REPORTED PENSION DATA
EXHIBIT 2
Summary Impacts Of Pension Adjustments On States And Rated Local Government Funded Status Fiscal 2010 $ Billions 50 States
Rated Local Governments
Reported annual contributions $37 N/A
Adjusted annual contributions $129 N/A
Adjusted UAAL % of revenues 74% N/A
Adjusted UAAL % of NTSD 211% N/A
*Market value is estimated based on a sample of local governments
Likely impact of proposed changes on state and local government ratings
We expect the proposed pension adjustments, in and of themselves, will not result in any state rating actions, but will have rating actions in the local government sector for those issuers whose adjusted liabilities are outsized for their rating category with no related mitigants. Although we have actively monitored pension pressures, the cost-sharing adjustments could enhance our view of the long-term pension liabilities facing certain issuers, and new data regarding sector medians and averages could reveal some unexpected outliers. We do not, however, anticipate mass rating actions because in the past our analysis of pensions has included an assessment of the assumptions underlying the reported data and the fact that pensions are only one factor in our analsysis.
State government sector. No state rating changes are expected as a result of publishing our adjustments to state pension liabilities and contributions. Serious state pension funding challenges have been known for some time, and this knowledge is reflected in a number of state downgrades and negative outlooks assigned in the last two years.
The pension metrics reflecting our adjustments and our consolidated debt and pension approach would be included in an updated state rating methodology and scorecard, which will be introduced later this year. The new methodology would provide greater transparency regarding our approach to evaluating pension-related fiscal stress.
Local government sector. The full rating impact of the proposed pension adjustments in the local government sector has not yet been determined. As in the state sector, we have long considered unfunded pension liabilities in our rating analysis, and have downgraded ratings or assigned negative outlooks to a number of cities’ ratings in recent years. Examples include Chicago, Illinois; Providence, Rhode Island; and San Jose, California.
As in the state sector, a new methodology and scorecard for local governments would incorporate the adjusted pension data and consolidated debt metrics.
U.S. PUBLIC FINANCE
11 JULY 2, 2012
REQUEST FOR COMMENT: ADJUSTMENTS TO US STATE AND LOCAL GOVERNMENT REPORTED PENSION DATA
Recent pension reforms in some states show accrued liabilities more malleable than bonded debt States have responded to rapid increases in pension costs by implementing changes to benefits, requiring increased contributions from employees and enabling local governments to make similar changes to their pension plans. The ability to change certain benefits distinguishes pension liabilities from bonded debt, which governments may refinance but cannot usually renegotiate apart from circumstances such as bankruptcy or other insolvency.
The degree to which states and local governments are able to make these changes depends on state-specific statutory and constitutional constraints, some of which have not been fully tested in court. A key issue is the degree to which the benefits of current employees and retirees are protected, including the question of whether benefit protections extend to unearned benefits of vested members or only to benefits accrued to date. Since the current AAL is calculated based on projections of future benefits, these issues are central to the degree to which a particular reform will translate into significant reductions in accrued liabilities and contribution requirements in the near term.
Automatic cost-of-living adjustments (COLAs) have a significant impact on pension liabilities, as each one percentage point COLA can raise the present value of accrued liabilities as much as 10%. In some states, because COLAs do not have the clearly protected contractual status of other benefits and they have been targeted for reduction, postponement or elimination. Such actions, however, typically invite litigation. In the 2011 legislative session, Maine, New Jersey, Oklahoma and Washington enacted changes to COLAs that affect current retirees as well as current employees. Maryland, Arizona and Florida have enacted reforms affecting current employees, but not current retirees. The changes in Arizona and Florida have been blocked by initial court decisions against the states, though the states are weighing potential appeals. Meanwhile, courts in Minnesota and Colorado have ruled in favor of state efforts to reduce or eliminate COLAs.
Other reforms, such as adjustments to benefit formulas and higher age or service requirements, generally apply to new hires. The exception is higher employee contribution requirements, which were enacted in 16 states in the 2011 legislative session, according to the National Conference of State Legislatures (NCSL).
In the fall of 2011, Rhode Island enacted the most far-reaching pension reforms of recent years, although ongoing litigation will determine whether those reforms will be upheld. The state suspended COLAs, including those for retirees, until the system achieves an 80% funded level, established a hybrid defined benefit/defined contribution plan which all state employees and teachers must join, and increased the retirement age to the Social Security age (currently 67). These changes reduced accrued and unfunded liabilities an estimated $2.7 billion, raised the system’s funded ratio to 59% from 48%, and significantly reduced projected annual pension costs for the state and local governments participating in the system going forward. The state’s capital city, Providence, recently made similarly far-reaching changes to its own locally-administered pension plan through negotiation with labor and retiree groups. According to the city’s actuarial consultants, suspending its generous automatic COLA provision for 10 years will result in a 27% reduction of its unfunded liabilities to $659 million from $901 million.
7
Because of efforts to contain pension liabilities and the possibility of better-than-expected investment performance, we will continue to evaluate and report separate metrics for each government issuer’s bonded debt and unfunded pension liabilities, in addition to calculating a consolidated debt metric.
7 See Ron Snell, Pensions and Retirement Plan Enactments in 2011 State Legislatures, published January 31, 2012 by the National Conference of State Legislatures.

U.S. PUBLIC FINANCE
12 JULY 2, 2012
REQUEST FOR COMMENT: ADJUSTMENTS TO US STATE AND LOCAL GOVERNMENT REPORTED PENSION DATA
Additional pension adjustments possible, but not currently proposed
There are many assumptions layered into actuarial valuations beyond those we have proposed to adjust. While further analysis could lead us to propose additional adjustments in future years, we believe that the candidates for such adjustments – mortality tables, wage growth assumptions, cost-of-living adjustments, and actuarial cost methods – are not as pertinent to improved comparability.
Mortality tables. Actuaries base their estimates of the longevity of pension members on industry mortality tables, which are developed from time to time based on experience. More recent mortality tables reflect longer life spans. While some plans may not have adopted the most recent mortality tables, most public plans periodically update their mortality assumptions and make modifications to the industry tables. These practices both complicate and narrow the influence of mortality assumption differences among public plans.
Wage growth assumptions. Wage growth assumptions affect both projected future benefits as well as the funding schedule for those plans whose contributions are determined as a percent of payroll. These assumptions reflect input from independent actuaries, which narrows the differences in assumptions across plans. Most are now in the 3.5%-to-4.5% range, which includes a component for inflation as well as real wage growth. The impacts on comparability of variation in this component are further muted because the assumption affects only the active component of plan membership.
COLAs. Because cost-of-living adjustments (COLAs) for retirees have a large impact on the value of future benefits, differences in COLAs affect the relative size of the liabilities of different pension plans. However, those differences are due to benefit structure rather than assumptions. We expect differences in COLAs to narrow as more governments revise their benefit structures in response to pension cost pressures.
Cost methods. Actuarial cost methods determine how the future value of benefits is spread across the working life of employees, and therefore affect the accrued liability at a given point in time. While GASB currently allows public plans to choose among six cost methods, the two most common are entry age normal (EAN) and projected unit credit (PUC). The influence of different cost methods cannot be easily generalized: EAN may result in faster accrual in some cases, and PUC in others. EAN is the most common method among public plans, and recent GASB actions will make it the single standard for pension reporting purposes in the future.

U.S. PUBLIC FINANCE
13 JULY 2, 2012
REQUEST FOR COMMENT: ADJUSTMENTS TO US STATE AND LOCAL GOVERNMENT REPORTED PENSION DATA
Appendix A
Moody’s state and local pension database
We compiled key pension data for the 50 states and more than 8,500 Moody’s-rated local governments, which participate in more than 3,500 pension plans. Of these plans, 162 multiple-employer cost-sharing plans account for about three-quarters of the reported aggregate liabilities (see Exhibit 3).
EXHIBIT 3
Moody’s Pension Database –Summary of Reported Data
Multiple-employer cost-sharing plans
Multiple-employer
agent plans Single
employer plans
Number of plans 162 1,769 1,700
Actuarial Accrued Liabilities ($000s) 2,901,615,566 215,923,283 610,405,343
Actuarial Value of Assets ($000s) 2,255,054,754 161,619,028 416,263,903
Unfunded Actuarial Accrued Liabilities ($000s) 608,221,598 54,304,256 194,141,440
Funded Ratio 78% 75% 68%
Source: Moody’s pension database
Because of uneven disclosure and disparate actuarial, accounting and reporting practices among issuers, we encountered numerous challenges while collecting, organizing and interpreting the data. However, the data did provide some level of comparability across plans and the general magnitude of the assessment is reliable. The challenges included:
» Identifying consistent disclosure years. The pension data are keyed to the issuers’ 2010 fiscal year and as a result do not all refer to the same year. Issuers may have reported pension data from pension plan financial or actuarial reports from fiscal 2010, 2009 or as early as 2008. In some cases, a single issuer participating in multiple pension systems could report pension data from multiple years.
» Excluding small plans. We excluded plans that individually account for less than five percent of an issuer’s total liabilities (for states) or pension contributions (for local governments) because the financial conditions of those plans would not have a material impact on the issuers and doing so streamlined our data gathering efforts. These small plans may be added into the database in the future.
» Variance in fiscal years. Just as we did not attempt to “true up” the differences in pension reporting years, we also made no adjustments for different pension plan fiscal years. Most, but not all, pension plan fiscal years are aligned with the issuers’ fiscal years. However, these vary–most operate on a June-July fiscal year, but some operate on a calendar year and others on a federal fiscal year (October 1-September 30) or something else (New York State’s fiscal year begins April 1).
» Excluding retiree health plans. Retiree health plans are sometimes managed by pension systems. In those cases, the retiree health portion of assets and liabilities is not always broken out from the portion dedicated to pensions. Where we were able to make such a distinction, we did.
U.S. PUBLIC FINANCE
14 JULY 2, 2012
REQUEST FOR COMMENT: ADJUSTMENTS TO US STATE AND LOCAL GOVERNMENT REPORTED PENSION DATA
» Hunting for ENC. We collected employer normal cost data to construct our adjusted state annual contribution figures. ENC is reported by a subset of pension systems and typically only in the plan’s actuarial valuation report. Some systems report total normal cost, from which we derived employer normal cost by subtracting employee contributions. To further complicate matters, some plans report costs on a dollar basis and others report on a percent of payroll basis.
» Allocation of cost-sharing plans. In principle, our approach to allocating cost sharing plans should have led to simple implementation: divide each participating employer’s required contribution by the plan’s total required contribution to derive the proportional share of unfunded liabilities. However, matching the concepts in the numerator and denominator of this ratio proved challenging. Issuers might report their actuarially required contribution, which meets certain existing GASB standards for the time period within which the unfunded liability must be amortized, a statutorily required contribution, which may or may not be adequate to ensure funding progress, or an actual contribution, the nature of which may not be identified. The pension plan’s financial reports may also fail to include the total required contribution (either actuarial or statutory). However, plans almost invariably report total actual contributions and in many cases this was the concept upon which our proportionate share approach was built.
» Handling “on-behalf” payments. Several states make full or partial annual pension contributions on behalf of local entities such as school districts. We chose to treat those contributions as an economic liability of the state making them and to include those amounts when calculating a state’s share of pension liability. However, we also need to note that a local government whose parent state makes on-behalf pension contributions is subject to a contingent liability if the state ceases to make on-behalf payments, a contingency that was realized when Maryland legislature agreed this year to phase in a shift of teacher pension contributions from the state to school districts. We calculate both a gross and net pension liability. The gross liability assumes the responsibility for pension liabilities rests with the local government, while the net liability reflects the state’s assumption of costs.
CalPERS presented special data challenges
In some cases, the degree of complication pertaining to a pension plan is so great that it is challenging to determine the financial relationship of individual issuers to large plans. The California Public Employees’ Retirement System (CalPERS) is the nation’s largest public pension system, comprising more than 1,500 local government agencies, with each participating in some combination of agent plans and the system’s ten “risk pool” plans. The system also includes a cost-sharing plan for school districts and nine plans for different categories of state employees. Our rated local governments that participate in CalPERS typically have one or more agent plans. Many smaller groups of local government employees are bundled into the CalPERS risk pools (which function as cost-sharing plans) noted above. It is not unusual for a local government to have employees in both agent and cost-sharing plans within CalPERS. However, participation in a risk-pool plan is not always disclosed in the entity’s audited financial report and contributions to the different plans are not identified separately. Furthermore, sometimes local governments report the liabilities for the entire risk pool instead of for their share of the pool, resulting in distortion of their liabilities as presented in the notes to their audited financial statements.
Because CalPERS discloses actuarial valuations for each public agency participating in the system, we used that data to allocate shares of local government obligations, although this often required tracking several plans or risk pools. We used covered payroll and contribution rates as a weight to allocate shares to many local governments that participate in multiple risk pools.

U.S. PUBLIC FINANCE
15 JULY 2, 2012
REQUEST FOR COMMENT: ADJUSTMENTS TO US STATE AND LOCAL GOVERNMENT REPORTED PENSION DATA
The complexity of constructing a public pension database highlights the need for improved disclosure and transparency. However, our adjustments are made for the limited purpose of improving comparability for the purposes of assessing credit risks and assigning bond ratings and not to resolve all of the various issues surrounding public pensions.
U.S. PUBLIC FINANCE
16 JULY 2, 2012
REQUEST FOR COMMENT: ADJUSTMENTS TO US STATE AND LOCAL GOVERNMENT REPORTED PENSION DATA
Appendix B
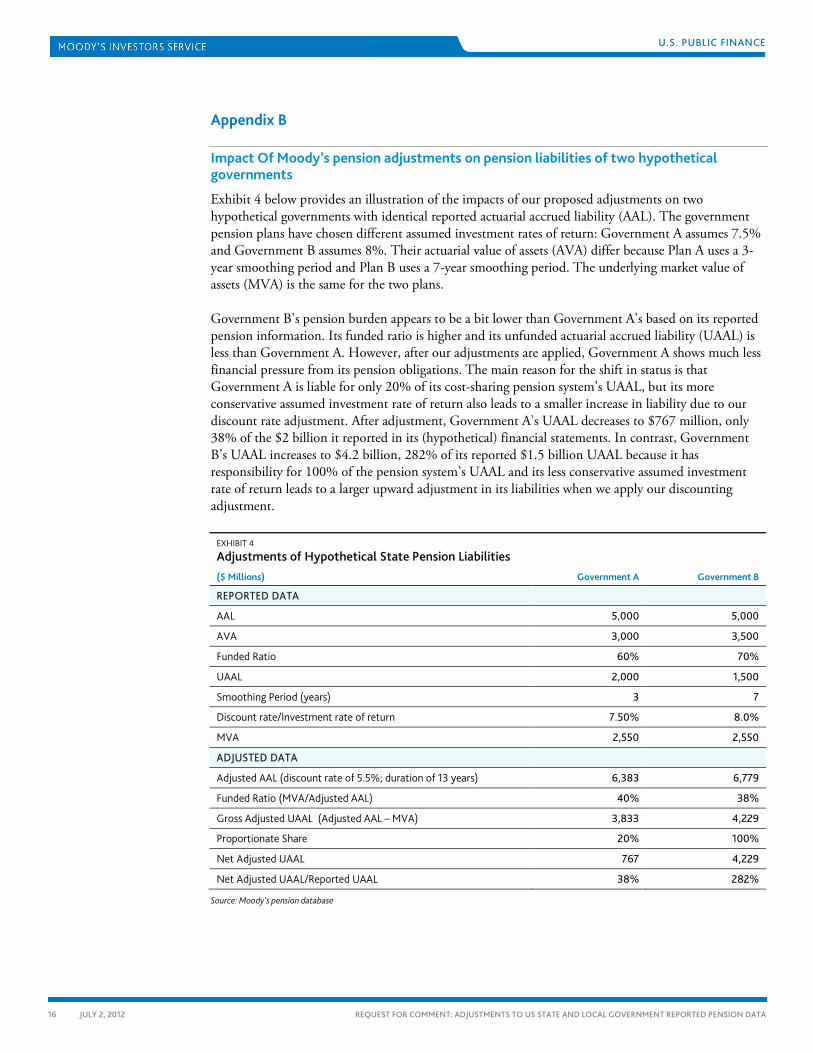
Impact Of Moody’s pension adjustments on pension liabilities of two hypothetical governments
Exhibit 4 below provides an illustration of the impacts of our proposed adjustments on two hypothetical governments with identical reported actuarial accrued liability (AAL). The government pension plans have chosen different assumed investment rates of return: Government A assumes 7.5% and Government B assumes 8%. Their actuarial value of assets (AVA) differ because Plan A uses a 3-year smoothing period and Plan B uses a 7-year smoothing period. The underlying market value of assets (MVA) is the same for the two plans.
Government B’s pension burden appears to be a bit lower than Government A’s based on its reported pension information. Its funded ratio is higher and its unfunded actuarial accrued liability (UAAL) is less than Government A. However, after our adjustments are applied, Government A shows much less financial pressure from its pension obligations. The main reason for the shift in status is that Government A is liable for only 20% of its cost-sharing pension system’s UAAL, but its more conservative assumed investment rate of return also leads to a smaller increase in liability due to our discount rate adjustment. After adjustment, Government A’s UAAL decreases to $767 million, only 38% of the $2 billion it reported in its (hypothetical) financial statements. In contrast, Government B’s UAAL increases to $4.2 billion, 282% of its reported $1.5 billion UAAL because it has responsibility for 100% of the pension system’s UAAL and its less conservative assumed investment rate of return leads to a larger upward adjustment in its liabilities when we apply our discounting adjustment.
EXHIBIT 4
Adjustments of Hypothetical State Pension Liabilities ($ Millions) Government A Government B
REPORTED DATA
AAL 5,000 5,000
AVA 3,000 3,500
Funded Ratio 60% 70%
UAAL 2,000 1,500
Smoothing Period (years) 3 7
Discount rate/Investment rate of return 7.50% 8.0%
MVA 2,550 2,550
ADJUSTED DATA
Adjusted AAL (discount rate of 5.5%; duration of 13 years) 6,383 6,779
Funded Ratio (MVA/Adjusted AAL) 40% 38%
Gross Adjusted UAAL (Adjusted AAL – MVA) 3,833 4,229
Proportionate Share 20% 100%
Net Adjusted UAAL 767 4,229
Net Adjusted UAAL/Reported UAAL 38% 282%
Source: Moody’s pension database
U.S. PUBLIC FINANCE
17 JULY 2, 2012
REQUEST FOR COMMENT: ADJUSTMENTS TO US STATE AND LOCAL GOVERNMENT REPORTED PENSION DATA
» contacts continued from page 1
Analyst Contacts:
NEW YORK +1.212.553.1653
Robert Kurtter +1.212.553.4453 Managing Director-Public Finance [email protected]
Naomi Richman +1.212.553.0014 Managing Director-Public Finance [email protected]
Jack Dorer +1.212.553.1332 Managing Director-Public Finance [email protected]
Alfred Medioli +1.212.553.4173 Vice President – Senior Credit Officer [email protected]
Wesley Smyth +1.212.553.2733 Vice President – Senior Accounting Analyst [email protected]
Report Number: 143254
Author Marcia Van Wagner
Production Associate Sarah Warburton
© 2012 Moody’s Investors Service, Inc. and/or its licensors and affiliates (collectively, “MOODY’S”). All rights reserved.
CREDIT RATINGS ISSUED BY MOODY'S INVESTORS SERVICE, INC. (“MIS”) AND ITS AFFILIATES ARE MOODY’S CURRENT OPINIONS OF THE RELATIVE FUTURE CREDIT RISK OF ENTITIES, CREDIT COMMITMENTS, OR DEBT OR DEBT-LIKE SECURITIES, AND CREDIT RATINGS AND RESEARCH PUBLICATIONS PUBLISHED BY MOODY’S (“MOODY’S PUBLICATIONS”) MAY INCLUDE MOODY’S CURRENT OPINIONS OF THE RELATIVE FUTURE CREDIT RISK OF ENTITIES, CREDIT COMMITMENTS, OR DEBT OR DEBT-LIKE SECURITIES. MOODY’S DEFINES CREDIT RISK AS THE RISK THAT AN ENTITY MAY NOT MEET ITS CONTRACTUAL, FINANCIAL OBLIGATIONS AS THEY COME DUE AND ANY ESTIMATED FINANCIAL LOSS IN THE EVENT OF DEFAULT. CREDIT RATINGS DO NOT ADDRESS ANY OTHER RISK, INCLUDING BUT NOT LIMITED TO: LIQUIDITY RISK, MARKET VALUE RISK, OR PRICE VOLATILITY. CREDIT RATINGS AND MOODY’S OPINIONS INCLUDED IN MOODY’S PUBLICATIONS ARE NOT STATEMENTS OF CURRENT OR HISTORICAL FACT. CREDIT RATINGS AND MOODY’S PUBLICATIONS DO NOT CONSTITUTE OR PROVIDE INVESTMENT OR FINANCIAL ADVICE, AND CREDIT RATINGS AND MOODY’S PUBLICATIONS ARE NOT AND DO NOT PROVIDE RECOMMENDATIONS TO PURCHASE, SELL, OR HOLD PARTICULAR SECURITIES. NEITHER CREDIT RATINGS NOR MOODY’S PUBLICATIONS COMMENT ON THE SUITABILITY OF AN INVESTMENT FOR ANY PARTICULAR INVESTOR. MOODY’S ISSUES ITS CREDIT RATINGS AND PUBLISHES MOODY’S PUBLICATIONS WITH THE EXPECTATION AND UNDERSTANDING THAT EACH INVESTOR WILL MAKE ITS OWN STUDY AND EVALUATION OF EACH SECURITY THAT IS UNDER CONSIDERATION FOR PURCHASE, HOLDING, OR SALE.
ALL INFORMATION CONTAINED HEREIN IS PROTECTED BY LAW, INCLUDING BUT NOT LIMITED TO, COPYRIGHT LAW, AND NONE OF SUCH INFORMATION MAY BE COPIED OR OTHERWISE REPRODUCED, REPACKAGED, FURTHER TRANSMITTED, TRANSFERRED, DISSEMINATED, REDISTRIBUTED OR RESOLD, OR STORED FOR SUBSEQUENT USE FOR ANY SUCH PURPOSE, IN WHOLE OR IN PART, IN ANY FORM OR MANNER OR BY ANY MEANS WHATSOEVER, BY ANY PERSON WITHOUT MOODY’S PRIOR WRITTEN CONSENT.
All information contained herein is obtained by MOODY’S from sources believed by it to be accurate and reliable. Because of the possibility of human or mechanical error as well as other factors, however, all information contained herein is provided “AS IS” without warranty of any kind. MOODY'S adopts all necessary measures so that the information it uses in assigning a credit rating is of sufficient quality and from sources MOODY'S considers to be reliable including, when appropriate, independent third-party sources. However, MOODY’S is not an auditor and cannot in every instance independently verify or validate information received in the rating process. Under no circumstances shall MOODY’S have any liability to any person or entity for (a) any loss or damage in whole or in part caused by, resulting from, or relating to, any error (negligent or otherwise) or other circumstance or contingency within or outside the control of MOODY’S or any of its directors, officers, employees or agents in connection with the procurement, collection, compilation, analysis, interpretation, communication, publication or delivery of any such information, or (b) any direct, indirect, special, consequential, compensatory or incidental damages whatsoever (including without limitation, lost profits), even if MOODY’S is advised in advance of the possibility of such damages, resulting from the use of or inability to use, any such information. The ratings, financial reporting analysis, projections, and other observations, if any, constituting part of the information contained herein are, and must be construed solely as, statements of opinion and not statements of fact or recommendations to purchase, sell or hold any securities. Each user of the information contained herein must make its own study and evaluation of each security it may consider purchasing, holding or selling.
NO WARRANTY, EXPRESS OR IMPLIED, AS TO THE ACCURACY, TIMELINESS, COMPLETENESS, MERCHANTABILITY OR FITNESS FOR ANY PARTICULAR PURPOSE OF ANY SUCH RATING OR OTHER OPINION OR INFORMATION IS GIVEN OR MADE BY MOODY’S IN ANY FORM OR MANNER WHATSOEVER.
MIS, a wholly-owned credit rating agency subsidiary of Moody’s Corporation (“MCO”), hereby discloses that most issuers of debt securities (including corporate and municipal bonds, debentures, notes and commercial paper) and preferred stock rated by MIS have, prior to assignment of any rating, agreed to pay to MIS for appraisal and rating services rendered by it fees ranging from $1,500 to approximately $2,500,000. MCO and MIS also maintain policies and procedures to address the independence of MIS’s ratings and rating processes. Information regarding certain affiliations that may exist between directors of MCO and rated entities, and between entities who hold ratings from MIS and have also publicly reported to the SEC an ownership interest in MCO of more than 5%, is posted annually at www.moodys.com under the heading “Shareholder Relations — Corporate Governance — Director and Shareholder Affiliation Policy.”
Any publication into Australia of this document is by MOODY’S affiliate, Moody’s Investors Service Pty Limited ABN 61 003 399 657, which holds Australian Financial Services License no. 336969. This document is intended to be provided only to “wholesale clients” within the meaning of section 761G of the Corporations Act 2001. By continuing to access this document from within Australia, you represent to MOODY’S that you are, or are accessing the document as a representative of, a “wholesale client” and that neither you nor the entity you represent will directly or indirectly disseminate this document or its contents to “retail clients” within the meaning of section 761G of the Corporations Act 2001.
Notwithstanding the foregoing, credit ratings assigned on and after October 1, 2010 by Moody’s Japan K.K. (“MJKK”) are MJKK’s current opinions of the relative future credit risk of entities, credit commitments, or debt or debt-like securities. In such a case, “MIS” in the foregoing statements shall be deemed to be replaced with “MJKK”. MJKK is a wholly-owned credit rating agency subsidiary of Moody's Group Japan G.K., which is wholly owned by Moody’s Overseas Holdings Inc., a wholly-owned subsidiary of MCO.
This credit rating is an opinion as to the creditworthiness of a debt obligation of the issuer, not on the equity securities of the issuer or any form of security that is available to retail investors. It would be dangerous for retail investors to make any investment decision based on this credit rating. If in doubt you should contact your financial or other professional adviser.