reputation & value - oxford metricaoxfordmetrica.com/public/cms/files/488/01repcomaig.pdf ·...
TRANSCRIPT

Reputation & Value
Reputation & Valuethe case of corporate catastrophes
Rory F Knight and Deborah J Pretty

A c k n o w l e d g e m e n t s
What is the relationship between reputation and value? This paper is theculmination of five years’ work into providing insights to this question. Werealise that this is an ongoing project and that this is likely to be the first ofmany research papers we write on the topic. We have benefited greatly frominteracting with companies affected by reputation crises, with colleagues inthe academic world, and with leaders in the field of insurance.
In particular, we should like to acknowledge AIG Europe’s contribution tothe debate on reputation risk, its potential impact on companies and how theprotection of this risk will develop in future.
C o n t e n t s
Information and data used in this study are taken exclusively from public sources.
Executive Summary 5
1 Reputation Equity and Shareholder Value 7
2 Measuring Reputation Equity 10
3 Managing Reputation Risk 12
4 The Impact on Strategic Stakeholders 16
5 Perception and Reality 22
6 The Core of Brand Value 29
7 Data and Methods 34
Authors 35

E x e c u t i v e S u m m a r y
1
2
3
4
➤
➤
➤
➤
➤
➤
➤
➤
➤
➤
5
This report has four key objectives:
To explore the relationship between corporate reputation and shareholder value,
To measure the contribution of reputation equity to shareholder value performance,
To evaluate patterns of stock market reaction to reputation damage and todetermine the drivers of reputation recovery, and
To analyse the roles of strategic stakeholders, public perception and brand value.
A conceptual exposition of reputation and value addresses the first objective.The second objective is met through conducting a value analysis of thelargest 500 European companies. The relationship between intangible assetsand share performance is explored, and the market premium credited tofirms with strong intangibles is measured. The third objective is achieved bymodelling a portfolio of 25 reputation crises and identifying the significantvariables that drive recovery. Finally, the value reactions to selected crises aremodelled individually and presented with associated commentary.
Key results:
Firms with strong reputation equity can outperform the market by over 100%.
Catastrophe insurance alone is insufficient to protect shareholder value.
Reputation and value recovery appear to be a function of managerial ability.
In the event of a crisis, reputation equity and value can be enhanced withcareful management.
The influence of strategic stakeholders, public perception and brand valueare considerable.
Policy implications:
Reputation requires active management.
Reputation management is not PR.
Crises are an opportunity for CEOs to build substantive reputation equity.
Reputation is the single most important variable in value creation or destruction.
Reputation management requires focused attention on strategic stakeholders,risk perception and brand value.

R e p u t a t i o n E q u i t y a n dS h a r e h o l d e r V a l u e
7
1
1 Knight, RF & Pretty, DJ,(2000), A Survey of BrandRisk Management, The Journal of BrandManagement, Volume 7, number 5.
2 Biennial Risk Manage-ment & Risk FinancingSurvey by Aon (2001)
Wor
ld’s
top
bran
ds
-100 0 100 200 300 400 500 600
US$ billions
tangible brand
General Electric
Intel
Microsoft
Nokia
IBM
Coca Cola
AT&T
Disney
Ford
McDonald’s
It is generally believed that a strong corporate reputation will create value forshareholders. A high profile corporate name is more likely to generate sales,customer loyalty and sustained market share than a generic name recognisedby few. These value drivers translate into improved cash flow performanceand, ultimately, value for the firm’s shareholders. Shown in Figure 1 are theworld’s most valuable corporate brands.
Figure 1: The World’s Top 10 BrandsSource: Interbrand/Citibank
Eighty-five per cent of firms consider brands (corporate or product) to betheir most important asset, according to an international survey
1of senior
executives. This mirrors the results of a UK survey2
where respondentsranked ‘loss of reputation’ as the greatest risk facing their organisation.
There exist several measures of firm performance, but shareholder value isthe most comprehensive. It is the only metric which reflects inherently a long-term view and, therefore, requires the most complete information. Earningsper share, for example, tends to be myopic in nature and neglects balance-sheet management. In addition, discounted cash flows (or ‘value’) arecorrelated strongly with the actual market value of companies, sinceinvestors evaluate management decisions based on estimated long-term cashflows, rather than on estimates of short-term earnings.
The stakeholders of a firm include all those with an economic claim againstthe firm’s assets. As residual claimants, shareholders hold the strongestincentive to maximise the long-term value of those assets. In order to assessthe effect of a management decision on shareholders’ claims, the mostcomplete information is required (as to the effects on all the otherstakeholders’ claims). Shareholders, therefore, represent the only stakeholderfor whom maximisation of return is in the best interests of all stakeholders

8
3 Taken on 21 July, 2000.
Future Cash FlowsValue = + Growth Opportunities + Latent Value
Cost of Capital
Finally, value is an appropriate measure of performance since it isshareholder returns which attract capital. Investors require a reward tocompensate them for taking risk. If this reward proves inadequate (less thantheir opportunity cost of capital) in the long-run, investors will employ theircapital elsewhere in search of better returns.
The pursuit of shareholder value represents a long-term and comprehensiveapproach to maximising claims for all stakeholders in the firm, and toattracting capital for future value creation. Shareholder value could bethought of as having three components: tangible value, premium value andlatent value. These components are illustrated in the equation below.
[Tangible Value] [Premium Value] [Latent Value]
Tangible value reflects the bedrock of real and tangible assets, and ismeasured usually as book value. Premium value represents the value in excessof book value at which the firm trades in the open market. This element ofvalue is the source of a firm’s competitive advantage. The value drivers hereinclude, for example, the firm’s reputation, its brands, intellectual property,innovation, potential growth, global reach, managerial expertise, and theskills and experience of the workforce. These intangible assets are a source ofsustainable competitive advantage for a firm and enhance shareholder value.Latent value represents the potential or ‘hidden’ value within a firm. Sourcesof hidden value might include under-leveraged assets, operating efficienciesyet to be realised, under-promoted brands, an unmotivated workforce,innovation without patents, or misallocated resources.
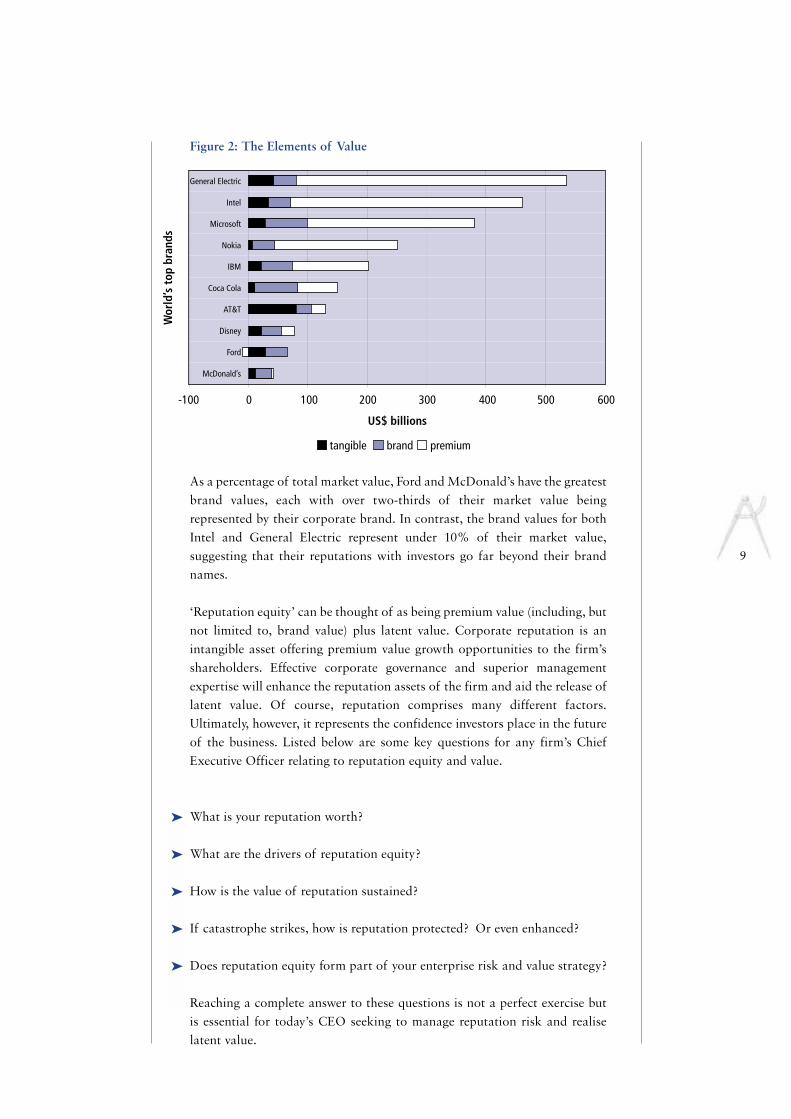
Presented in Figure 2 are the elements of the value equation as they relate tothe world’s top ten brands. ‘Tangible’ value represents the book value of thecorporation. ‘Brand’ value is that measured by Interbrand/Citibank in theirbrand survey of July 2000. ‘Premium’ value in the chart is that element ofpremium value from the equation above (market value3 minus book value)which is not represented by the brand. Latent value is not shown as, bydefinition, it has yet to be realised.
It can be seen, in the majority of cases, that there is considerable reputationequity beyond that generated by the corporate brand. An exception is FordMotor Company whose brand has been valued such that it appears greaterthan the excess of market value over book value. This highlights the necessityfor caution when interpreting results from survey-derived brand values andfrom within a current stock market valuation context.
➤
➤
➤
➤
➤
9
Wor
ld’s
top
bran
ds
-100 0 100 200 300 400 500 600
US$ billions
tangible brand premium
General Electric
Intel
Microsoft
Nokia
IBM
Coca Cola
AT&T
Disney
Ford
McDonald’s
Figure 2: The Elements of Value
As a percentage of total market value, Ford and McDonald’s have the greatestbrand values, each with over two-thirds of their market value beingrepresented by their corporate brand. In contrast, the brand values for bothIntel and General Electric represent under 10% of their market value,suggesting that their reputations with investors go far beyond their brandnames.
‘Reputation equity’ can be thought of as being premium value (including, butnot limited to, brand value) plus latent value. Corporate reputation is anintangible asset offering premium value growth opportunities to the firm’sshareholders. Effective corporate governance and superior managementexpertise will enhance the reputation assets of the firm and aid the release oflatent value. Of course, reputation comprises many different factors.Ultimately, however, it represents the confidence investors place in the futureof the business. Listed below are some key questions for any firm’s ChiefExecutive Officer relating to reputation equity and value.
What is your reputation worth?
What are the drivers of reputation equity?
How is the value of reputation sustained?
If catastrophe strikes, how is reputation protected? Or even enhanced?
Does reputation equity form part of your enterprise risk and value strategy?
Reaching a complete answer to these questions is not a perfect exercise but is essential for today’s CEO seeking to manage reputation risk and realiselatent value.
M e a s u r i n g R e p u t a t i o n E q u i t y
10
2
4 Tobin (1969), “A General EquilibriumApproach to MonetaryTheory”, Journal of Money,Credit, and Banking, Volume 1, February
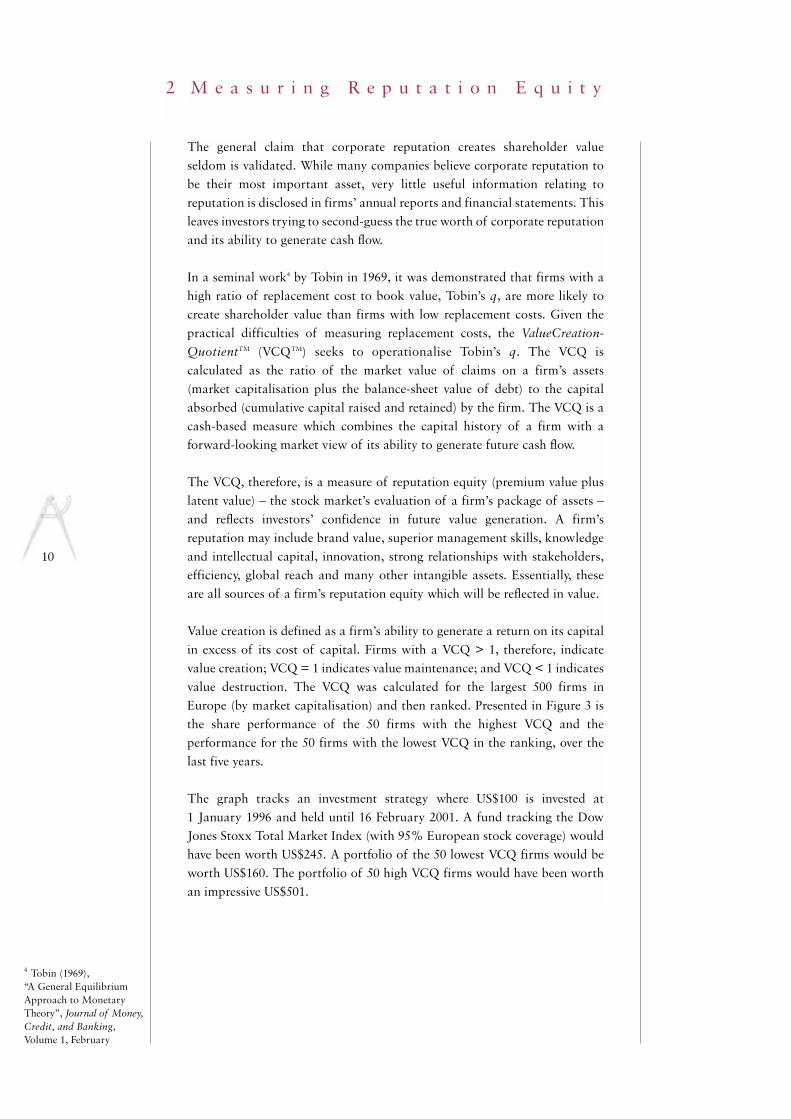
The general claim that corporate reputation creates shareholder valueseldom is validated. While many companies believe corporate reputation tobe their most important asset, very little useful information relating toreputation is disclosed in firms’ annual reports and financial statements. Thisleaves investors trying to second-guess the true worth of corporate reputationand its ability to generate cash flow.
In a seminal work4 by Tobin in 1969, it was demonstrated that firms with ahigh ratio of replacement cost to book value, Tobin’s q, are more likely tocreate shareholder value than firms with low replacement costs. Given thepractical difficulties of measuring replacement costs, the ValueCreation-QuotientTM (VCQTM) seeks to operationalise Tobin’s q. The VCQ iscalculated as the ratio of the market value of claims on a firm’s assets(market capitalisation plus the balance-sheet value of debt) to the capitalabsorbed (cumulative capital raised and retained) by the firm. The VCQ is acash-based measure which combines the capital history of a firm with aforward-looking market view of its ability to generate future cash flow.
The VCQ, therefore, is a measure of reputation equity (premium value pluslatent value) – the stock market’s evaluation of a firm’s package of assets –and reflects investors’ confidence in future value generation. A firm’sreputation may include brand value, superior management skills, knowledgeand intellectual capital, innovation, strong relationships with stakeholders,efficiency, global reach and many other intangible assets. Essentially, theseare all sources of a firm’s reputation equity which will be reflected in value.
Value creation is defined as a firm’s ability to generate a return on its capitalin excess of its cost of capital. Firms with a VCQ > 1, therefore, indicatevalue creation; VCQ = 1 indicates value maintenance; and VCQ < 1 indicatesvalue destruction. The VCQ was calculated for the largest 500 firms inEurope (by market capitalisation) and then ranked. Presented in Figure 3 isthe share performance of the 50 firms with the highest VCQ and theperformance for the 50 firms with the lowest VCQ in the ranking, over thelast five years.
The graph tracks an investment strategy where US$100 is invested at 1 January 1996 and held until 16 February 2001. A fund tracking the DowJones Stoxx Total Market Index (with 95% European stock coverage) wouldhave been worth US$245. A portfolio of the 50 lowest VCQ firms would beworth US$160. The portfolio of 50 high VCQ firms would have been worthan impressive US$501.

11
Hi VCQ 50 DJ STOXX TMI Lo VCQ 50
Dec 95 Dec 96 Dec 97 Dec 98 Dec 99 Dec 00
1000900800700600500400300200100
0
Figure 3: The Reputation Equity Premium
It is clear that the share performance of firms with the highest VCQs farexceeds the index. Those firms with low VCQs, in contrast, underperformthe market. Similar results have been found both in country-specific analysesand other regional analyses. The results are not significantly affected whenthe returns are risk-adjusted.
These results are consistent with the assertion that a strong corporatereputation creates value for the firm’s shareholders. High reputation equitygives investors confidence in the firm’s ability to generate cash flow. Thisexpectation is reflected in a higher share price which, in turn, reaffirms thereputation equity position. Thus, a virtuous cycle results through thegeneration of reputation equity and value. This raises a question as towhether investors reach an accurate assessment of the value of reputationequity. The corollary, however, is that should a firm’s reputation be eroded ordamaged, shareholder value is destroyed. The management of reputationrisk is crucial to the maintenance of the value advantage.

M a n a g i n g R e p u t a t i o n R i s k
12
3
1
2
3
4
Corporate catastrophes often carry tragic consequences in terms of humanlives lost, social damage and environmental cost. It is important to keepfocused on this reality. Catastrophes also provide a unique opportunity toevaluate financial markets’ response to major events which carryimplications for a firm’s reputation. Do such catastrophes always reducereputation equity? From the research summarised below, it appears thatcatastrophes appear to affect returns in rather complex ways which seem toresult in a re-evaluation of management – which may be positive or negative.In addition, the findings indicate that the impact of catastrophes onshareholder value is not strongly influenced by the existence of catastropheinsurance cover.
The research summarised here aims to identify the value impact ofcatastrophes by focusing on 25 major corporate catastrophes withreputational implications and tracing their impact on stock returns5. Theselection of catastrophes is based on four criteria:
The disasters are man-made as opposed to natural.
Each involves a publicly-quoted company.
Each has received headline coverage in world news.
Each has occurred since 1980.
A full list of the crises selected for analysis is presented in Table 1. Seven ofthe crises studied are from the oil/gas/chemical industries and eleven areproduct-related incidents. Overall, five events are attributable to deliberateacts of tamper or terrorism and, in a further three, sabotage was suspected.Thirteen of the firms are American, one is Japanese and the remaining elevenare European; British, Dutch, French, German, Swedish and Swiss. Thus,whilst relatively small, the catastrophe portfolio is international andconstitutes a reasonably representative sample across industry sectors andmajor classes of loss.
5 The opening stage of thisresearch project, based on aportfolio of 15 catastrophes,was published in RiskFinancing Strategies – TheImpact on Shareholder Valueby DJ Pretty (RIRG, 1999).The larger portfolio of 25events produces a consistentbut more pronounced set of results.

13
Table 1: Selected Reputation Crises
Date Company Crisis Industry Parent Country
07/08/00 Bridgestone Firestone tyres automotive parts Japan
25/07/00 Air France Concorde crash airlines France
10/06/99 Coca Cola Health scare beverages USA
01/03/99 Bank of Scotland Robertson deal banking UK
29/10/97 Daimler-Benz Mercedes A-class automobiles Germany
29/04/96 Astra Sexual harassment pharmaceuticals Sweden
26/05/95 Philip Morris Filter contamination tobacco USA
30/04/95 Royal Dutch/Shell Brent Spar oil Neth./ UK
22/11/94 Intel Pentium flaw electronics USA
25/08/93 Heineken Defective glass beverages Netherlands
06/08/92 Maytag Hoover promotion appliances USA
10/04/92 Commercial Union IRA bomb insurance UK
17/07/90 Eli Lilly Prozac fears pharmaceuticals USA
10/02/90 Source Perrier Benzene contamination beverages France
23/10/89 Phillips Petroleum Pasadena explosion oil USA
19/09/89 Upjohn Halcion allegations pharmaceuticals USA
24/03/89 Exxon Valdez oil spill oil USA
21/12/88 Pan Am Lockerbie air crash airlines USA
06/07/88 Occidental Piper Alpha explosion oil USA
05/05/88 Shell Oil Norco explosion oil Neth./UK
06/03/87 P&O Herald of Free Enterprise transport UK
01/11/86 Sandoz Rhine pollution chemicals Switzerland
11/02/86 Johnson & Johnson Tylenol poisoning pharmaceuticals USA
03/12/84 Union Carbide Bhopal gas leak chemicals USA
30/09/82 Johnson & Johnson Tylenol poisoning pharmaceuticals USA
14
6 Regarding the Firestoneand Concorde cases, whereone calendar year has yet to pass, the average figuresare adjusted accordingly.
1 51 101
Event Trading Days
151 201 251
Valu
eRea
ctio
n™ (%
)
4
2
0
-2
-4
-6
-8
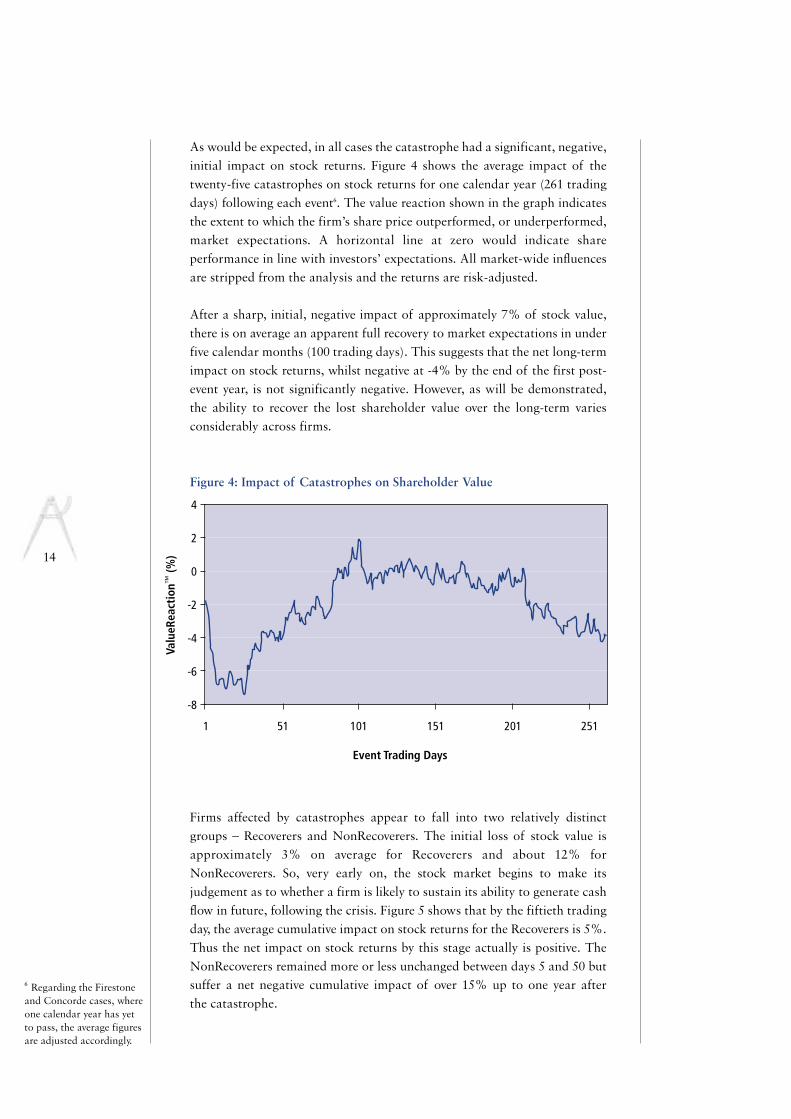
As would be expected, in all cases the catastrophe had a significant, negative,initial impact on stock returns. Figure 4 shows the average impact of thetwenty-five catastrophes on stock returns for one calendar year (261 tradingdays) following each event6. The value reaction shown in the graph indicatesthe extent to which the firm’s share price outperformed, or underperformed,market expectations. A horizontal line at zero would indicate shareperformance in line with investors’ expectations. All market-wide influencesare stripped from the analysis and the returns are risk-adjusted.
After a sharp, initial, negative impact of approximately 7% of stock value,there is on average an apparent full recovery to market expectations in underfive calendar months (100 trading days). This suggests that the net long-termimpact on stock returns, whilst negative at -4% by the end of the first post-event year, is not significantly negative. However, as will be demonstrated,the ability to recover the lost shareholder value over the long-term variesconsiderably across firms.
Figure 4: Impact of Catastrophes on Shareholder Value
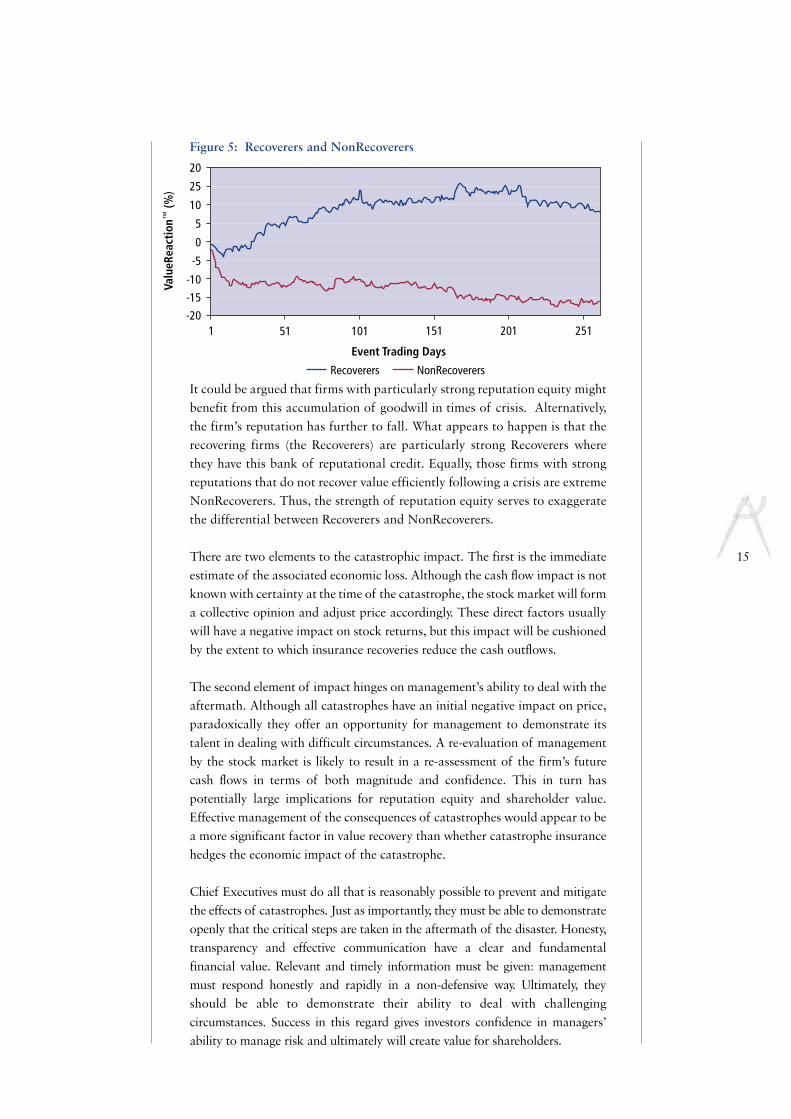
Firms affected by catastrophes appear to fall into two relatively distinctgroups – Recoverers and NonRecoverers. The initial loss of stock value isapproximately 3% on average for Recoverers and about 12% forNonRecoverers. So, very early on, the stock market begins to make itsjudgement as to whether a firm is likely to sustain its ability to generate cashflow in future, following the crisis. Figure 5 shows that by the fiftieth tradingday, the average cumulative impact on stock returns for the Recoverers is 5%.Thus the net impact on stock returns by this stage actually is positive. TheNonRecoverers remained more or less unchanged between days 5 and 50 butsuffer a net negative cumulative impact of over 15% up to one year after the catastrophe.
15
1 51 101
Event Trading Days
151 201 251
Valu
eRea
ctio
n™ (%
)20
25
10
5
0
-5
-10-15-20
Recoverers NonRecoverers
Figure 5: Recoverers and NonRecoverers
It could be argued that firms with particularly strong reputation equity mightbenefit from this accumulation of goodwill in times of crisis. Alternatively,the firm’s reputation has further to fall. What appears to happen is that therecovering firms (the Recoverers) are particularly strong Recoverers wherethey have this bank of reputational credit. Equally, those firms with strongreputations that do not recover value efficiently following a crisis are extremeNonRecoverers. Thus, the strength of reputation equity serves to exaggeratethe differential between Recoverers and NonRecoverers.
There are two elements to the catastrophic impact. The first is the immediateestimate of the associated economic loss. Although the cash flow impact is notknown with certainty at the time of the catastrophe, the stock market will forma collective opinion and adjust price accordingly. These direct factors usuallywill have a negative impact on stock returns, but this impact will be cushionedby the extent to which insurance recoveries reduce the cash outflows.
The second element of impact hinges on management’s ability to deal with theaftermath. Although all catastrophes have an initial negative impact on price,paradoxically they offer an opportunity for management to demonstrate itstalent in dealing with difficult circumstances. A re-evaluation of managementby the stock market is likely to result in a re-assessment of the firm’s futurecash flows in terms of both magnitude and confidence. This in turn haspotentially large implications for reputation equity and shareholder value.Effective management of the consequences of catastrophes would appear to bea more significant factor in value recovery than whether catastrophe insurancehedges the economic impact of the catastrophe.
Chief Executives must do all that is reasonably possible to prevent and mitigatethe effects of catastrophes. Just as importantly, they must be able to demonstrateopenly that the critical steps are taken in the aftermath of the disaster. Honesty,transparency and effective communication have a clear and fundamentalfinancial value. Relevant and timely information must be given: managementmust respond honestly and rapidly in a non-defensive way. Ultimately, theyshould be able to demonstrate their ability to deal with challengingcircumstances. Success in this regard gives investors confidence in managers’ability to manage risk and ultimately will create value for shareholders.
T h e I m p a c t o n S t r a t e g i cS t a k e h o l d e r s
16
4
7 Harbison, JR & Pekar, P Jnr, (1998), Smart Alliances: A practicalguide to repeatable success,San Francisco: Jossey-Bass.
The impact of a corporate catastrophe on reputation equity seldom is limitedto the directly crisis-struck firm. In many cases, there is a strategicstakeholder – a key supplier or key customer, a strategic ally or partner –whose business is affected as a direct consequence of the crisis. Reputationloss travels. This section of the report considers this phenomenon explicitlyby analysing cases involving strategic alliances and supply chainmanagement.
An increasing amount of business is conducted through strategic alliancesbetween firms. It is estimated that the alliance activities of the largest 1,000US firms will account for 35% of their total revenue by 2002 – up from 21%in 1997 and less than 2% in 19807. Some industries are more used to strategicalliances and joint ventures than others. The airline industry is well-knownfor its structure of alliances whilst the oil industry has significant jointventuring activities in offshore drilling, for example. The Piper Alphadisaster of 1988, representing the largest offshore oil disaster, affected all fourfirms involved; Occidental (the operator), Texaco, Union Texas Petroleumand Thomson North Sea.
Within supply chain management, there are numerous examples wherevulnerable links in the supply chain have ruptured with significantconsequences for the supplier and the supplied. Last year, Ericsson stocksuffered a tumble following a fire at one of its key supplier’s semiconductorplants. The case almost mirrors the events of three years earlier when Toyotasuffered a sustained halt in production after a weekend fire broke out at itskey supplier of brake valves. Aggressive cost-cutting at many firms hasconcentrated the supply chain into fewer and fewer hands; in some cases, intoa single source of supply. This associated increase in reputation risk requirescareful management.
Profiled below are two cases from last year where a strategic stakeholder’sreputation was affected by a corporate crisis. The first case evaluates thereputation impact on both Air France and British Airways following thetragic crash of Concorde. The second case describes the recall of Firestonetyres and the associated impact on Ford Motor Company, whose sportsutility vehicles are fitted with Firestone tyres.
Burst Tyres and Deflated Reputations
In the summer of the year 2000, we witnessed two tyre-related crises withintwo weeks. Each had tragic consequences. On 25 July, a Concorde of AirFrance crashed with the loss of 113 lives. It is now believed that the cause ofthe disaster was a piece of scrap metal from a previous aeroplane that hadstrayed on to the runway, bursting one of Concorde’s tyres as it took off fromCharles de Gaulle airport, just outside Paris.
On 7 August, Firestone tyres were withdrawn from sale in the US by retailerSears, Roebuck and Company. Under investigation by US safety authorities,

1
2
3
4
1
2
3
4
17
the tyres have been implicated now in 174 deaths and hundreds of injuries.The accidents involved tyres which had separated from their casings and losttheir tread, resulting from “a direct correlation between heat andperformance”. Two days later, Firestone announced a voluntary recall of6.5 million tyres in the US.
The two cases display four clear similarities:
Each case is associated with large loss of life.
Each involves tyres – a technical, safety failure as opposed to, for example, ahealth-related crisis such as benzene-contaminated Perrier water in 1990 orCoca Cola’s beverages perceived to be contaminated (but not) in northernEurope in 1999.
Each involves a strong product brand – Concorde and Firestone – for parentcompanies Air France and Bridgestone, respectively.
And in each case, the crisis involves a second company with an economicinterest in the outcome of the case. Like Air France, British Airways operatesConcorde jets, whilst the majority of Firestone tyres recalled were fitted toFord Explorer sports utility vehicles (SUVs).
However, four key differences separate the cases:
The Concorde crash was a sudden and unexpected loss, whereas the allegedlydefective Firestone tyres had produced complaints for several years.
Concorde crashed on home soil, whereas the Firestone accidents occurredmany thousands of miles away from Bridgestone’s domicile in Japan.
There is no close substitute for Concorde travellers; there are numeroussuppliers of quality tyres.
The post-loss communications and crisis management initiatives embarkedupon by the respective companies, Air France and Bridgestone, werestrikingly different.

18
1 21 41 61 81 101
35
30
25
20
15
10
5
0
-5
-10
-15
1,400
1,200
1,000
800
600
400
200
0
-200
-400
-600
Event Trading Days
US$
mill
ions
Valu
eRea
ctio
n™ (%
)
Case Study 1
Strategic Co-operation
The attention of the world’s media on the Concorde tragedy exceeded thatafforded to other aviation disasters. The 30-year old supersonic jetrepresented a triumph of aviation engineering. The spotlight was firmly onJean-Cyril Spinetta, chairman of Air France, to deal effectively with the crisis.
Monsieur Spinetta reacted effectively in the aftermath of the crash. First,Spinetta was visible at the crash site in Gonesse, signalling that he wasinvolved personally. Second, M. Spinetta grounded Air France’s fleet ofConcordes immediately, stating that safety was his overriding concern.Evidence of a rapid, credible response is a mark of successful crisismanagement. Third, Spinetta handled the families of the victims sensitivelyby attending services for the victims in France and Germany. Fourth, AirFrance was not defensive about compensation and volunteered an interimpayment to the victims’ families ahead of any compensation deal.
Shown in Figure 6 is the shareholder value reaction to Air France, followingthe crash of Concorde. As in the previous section, market-wide factors areremoved from the analysis and the returns are risk-adjusted.
Figure 6: Air France
The horizontal line where abnormal returns equal zero indicates investors’pre-loss expectations of share performance. Performance above zero,therefore, represents unexpectedly good performance; below zero indicatesunderperformance. Air France drops 5% approximately in the first fewtrading days following the loss and proceeds to outperform marketexpectations.
Where abnormal returns start to fall slightly (trading day 31), the adverseprice movement is reflecting the growing fuel crisis in France when road hauliers

19
1 21 41 61 81 101
1510
50
-5-10-15-20-25-30-35
1,000
500
0
-500
-1,000
-1,500
-2,000
Event Trading DaysUS
$ m
illio
ns
Valu
eRea
ctio
n™ (%
)
blockaded fuel supplies. As this second crisis deepened, Air France wasforced to suspend many of its domestic flights. The second, steeper fall(trading day 58) reflects also the rising price of fuel. Despite the continued(perceived as) high oil price, the immediate crisis is averted and Air France’sshares respond positively once more.
The corporate impact of the Concorde crash was not restricted to Air France.As British Airways also operates a Concorde fleet, safety concerns and lackof consumer confidence affected this company too as a direct consequence ofthe crisis, even though the firm was not involved in the accident itself. Figure 7illustrates the value reaction.
Figure 7: British Airways
The air crash had a detrimental effect on British Airways stock. BA did notground its Concorde fleet immediately after the crash. This may have been acontributory factor to the sharper fall in British Airways’ share value and thelonger period required for the price to recover. It is estimated thatmaintaining the grounded fleet of seven Concordes has cost BA over US$60million and a further US$16 million in proposed modifications. Hence thereverse in trend (trading day 71) with the news that Concordes could be backin operation by summer 2001. The first test flight following the tragedy tookplace on 18 July 2001.
Case Study 2
Supply Chain Management
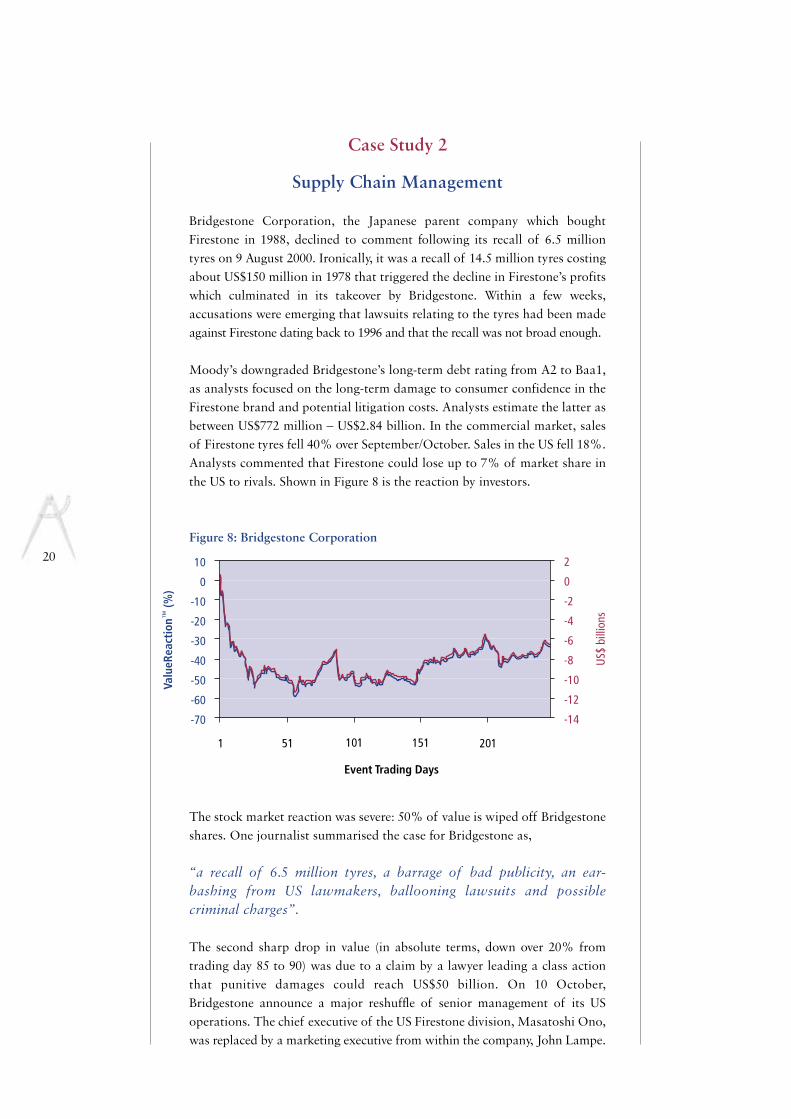
Bridgestone Corporation, the Japanese parent company which boughtFirestone in 1988, declined to comment following its recall of 6.5 milliontyres on 9 August 2000. Ironically, it was a recall of 14.5 million tyres costingabout US$150 million in 1978 that triggered the decline in Firestone’s profitswhich culminated in its takeover by Bridgestone. Within a few weeks,accusations were emerging that lawsuits relating to the tyres had been madeagainst Firestone dating back to 1996 and that the recall was not broad enough.
Moody’s downgraded Bridgestone’s long-term debt rating from A2 to Baa1,as analysts focused on the long-term damage to consumer confidence in theFirestone brand and potential litigation costs. Analysts estimate the latter asbetween US$772 million – US$2.84 billion. In the commercial market, salesof Firestone tyres fell 40% over September/October. Sales in the US fell 18%.Analysts commented that Firestone could lose up to 7% of market share inthe US to rivals. Shown in Figure 8 is the reaction by investors.
Figure 8: Bridgestone Corporation
The stock market reaction was severe: 50% of value is wiped off Bridgestoneshares. One journalist summarised the case for Bridgestone as,
“a recall of 6.5 million tyres, a barrage of bad publicity, an ear-bashing from US lawmakers, ballooning lawsuits and possiblecriminal charges”.
The second sharp drop in value (in absolute terms, down over 20% fromtrading day 85 to 90) was due to a claim by a lawyer leading a class actionthat punitive damages could reach US$50 billion. On 10 October,Bridgestone announce a major reshuffle of senior management of its USoperations. The chief executive of the US Firestone division, Masatoshi Ono,was replaced by a marketing executive from within the company, John Lampe.
20
1 51 101 151 201
10
0
-10
-20
-30
-40
-50
-60
-70
2
0
-2
-4
-6
-8
-10
-12
-14
Event Trading Days
Valu
eRea
ctio
n™ (%
)
US$
billi
ons
This was viewed by industry analysts that a more consumer-orientatedexecutive was required to improve communications with customers and USfederal agencies. President Yoichiro Kaizaki resigned 11 January 2001.
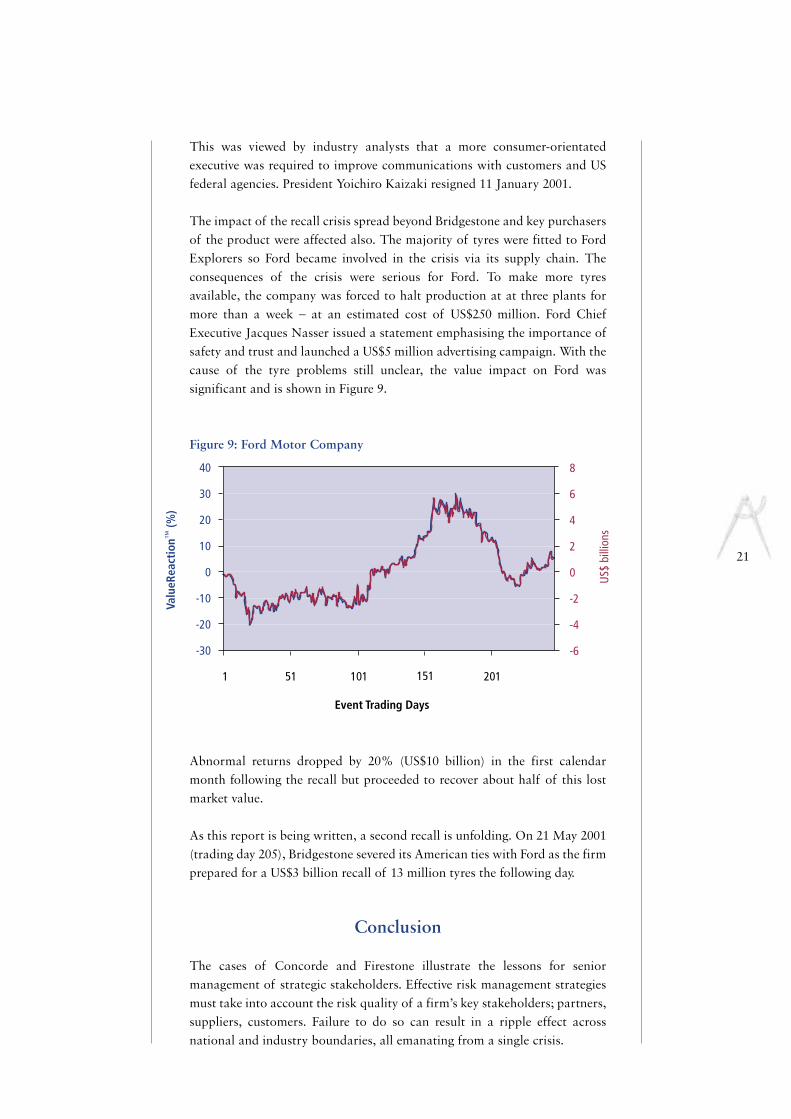
The impact of the recall crisis spread beyond Bridgestone and key purchasersof the product were affected also. The majority of tyres were fitted to FordExplorers so Ford became involved in the crisis via its supply chain. Theconsequences of the crisis were serious for Ford. To make more tyresavailable, the company was forced to halt production at at three plants formore than a week – at an estimated cost of US$250 million. Ford ChiefExecutive Jacques Nasser issued a statement emphasising the importance ofsafety and trust and launched a US$5 million advertising campaign. With thecause of the tyre problems still unclear, the value impact on Ford wassignificant and is shown in Figure 9.
Figure 9: Ford Motor Company
Abnormal returns dropped by 20% (US$10 billion) in the first calendarmonth following the recall but proceeded to recover about half of this lostmarket value.
As this report is being written, a second recall is unfolding. On 21 May 2001(trading day 205), Bridgestone severed its American ties with Ford as the firmprepared for a US$3 billion recall of 13 million tyres the following day.
Conclusion
The cases of Concorde and Firestone illustrate the lessons for seniormanagement of strategic stakeholders. Effective risk management strategiesmust take into account the risk quality of a firm’s key stakeholders; partners,suppliers, customers. Failure to do so can result in a ripple effect acrossnational and industry boundaries, all emanating from a single crisis.
21
1 51 101 151 201
40
30
20
10
0
-10
-20
-30
8
6
4
2
0
-2
-4
-6
Event Trading Days
US$
billi
ons
Valu
eRea
ctio
n™ (%
)

P e r c e p t i o n a n d R e a l i t y
22
5
Through social interaction, people reveal a sense of how they perceive theworld. Our perception of risk is formed by our personal experiences and thoseto whom we listen, by both our formal and informal education, and by broadercultural influences of communication around us. Whilst different people willperceive different levels of danger from the same risk exposure, and indeed willreact in different ways even when the perception coincides, when a groupdynamic is introduced, these disparate views tend to converge and then amplify.These views may or may not bear a strong relation to the physical reality of thesituation. This simply is human nature.
When managing reputation risk, it is essential that a firm’s strategyencompasses the potency of public perception. Presented in this section arethree well-known reputation crises which each had a severe and negative effecton the respective firm’s share price, despite each firm’s original statements beingvindicated by the experts.
Case Study 3
Perceived Health Risk
Belgium was recovering from a food scandal over carcinogenic dioxin inanimal feed when a second food scare erupted. The first scare resulted in aban on poultry, eggs, pork and beef after they were found to be contaminatedwith dioxin. The integrity of food was high in Belgians’ consciousness.
On 10 June, the second health scare hit when 39 Belgian schoolchildren weresent to hospital with symptoms of headaches, nausea, vomiting and stomachcramps. One common denominator was the consumption of Coke. Coca Colaconfirmed that a strange odour was associated with their bottles of Coke andwithdrew 2.5 million of them from Belgian shelves. The company maintainedthat the quality of the beverage was beyond reproach and posed no health riskand, further, that the incident was isolated and restricted to Belgium.
Within a week, the Belgian recall was extended to include 15 million cans andbottles of Coca Cola’s branded drinks; Coke, Diet Coke, Fanta and Sprite.By this stage, approximately 100 Belgian schoolchildren had been affected.On 16 June, it was reported that 80 people in northern France had beenaffected by the illness. The French government withdrew 50 million cans andbottles from the country’s shelves and the Luxembourg government alsoordered a recall. Analysis by Coca Cola revealed two separate problems: an‘off-taste’ produced by defective carbon dioxide that had been used in theAntwerp plant in Belgium, and an offensive odour arising from fungicide-impregnated wooden pallets that had been used in Dunkirk, France.
Saudi Arabia banned the import of all Coca Cola drinks manufactured inBelgium, Switzerland issued a warning on how to recognise those fromBelgium, and the Netherlands, Spain, Germany, Latvia and the Ivory Coastrecalled Coca Cola products shipped from Belgium.
23
1 51 101 151 201 251
50
-5-10-15-20-25-30-35-40-45
10
0
-10
-20
-30
-40
-50
-60
-70
-80
Event Trading Days
US$
billi
ons
Valu
eRea
ctio
n™ (%
)
Provided a causal link could be made between consumption of Coca Cola’sproducts and the symptoms of the illness, the company was willing to refundBelgians’ medical costs. Coca Cola’s Chairman, Doug Ivester, previously hadissued a statement from Atlanta expressing regret for the problems and on 22June a full page apology appeared in the Belgian Press:
“To all Belgians, I want to say that I am personally sorry for anydiscomfort and uneasiness that have occurred. My colleagues and Iare working without interruption to regain your confidence. To thosewho have suffered, particularly children, we express our sincereapologies”.
Ivester said later in an interview that it was under the Belgian HealthMinister’s guidance that Press interviews were not given at the start of thecrisis. Coca Cola released a review by a Dutch toxicologist of threelaboratory analyses which concluded that the fungicide was not present insufficient quantities to make people sick.
On 24 June, a group of Belgian toxicologists concluded in a letter to TheLancet that the crisis was the result of “a collective psychosomatic reaction”or “mass sociogenic illness”, induced not least by the recent dioxin scare inBelgium which broke people’s trust in food quality.
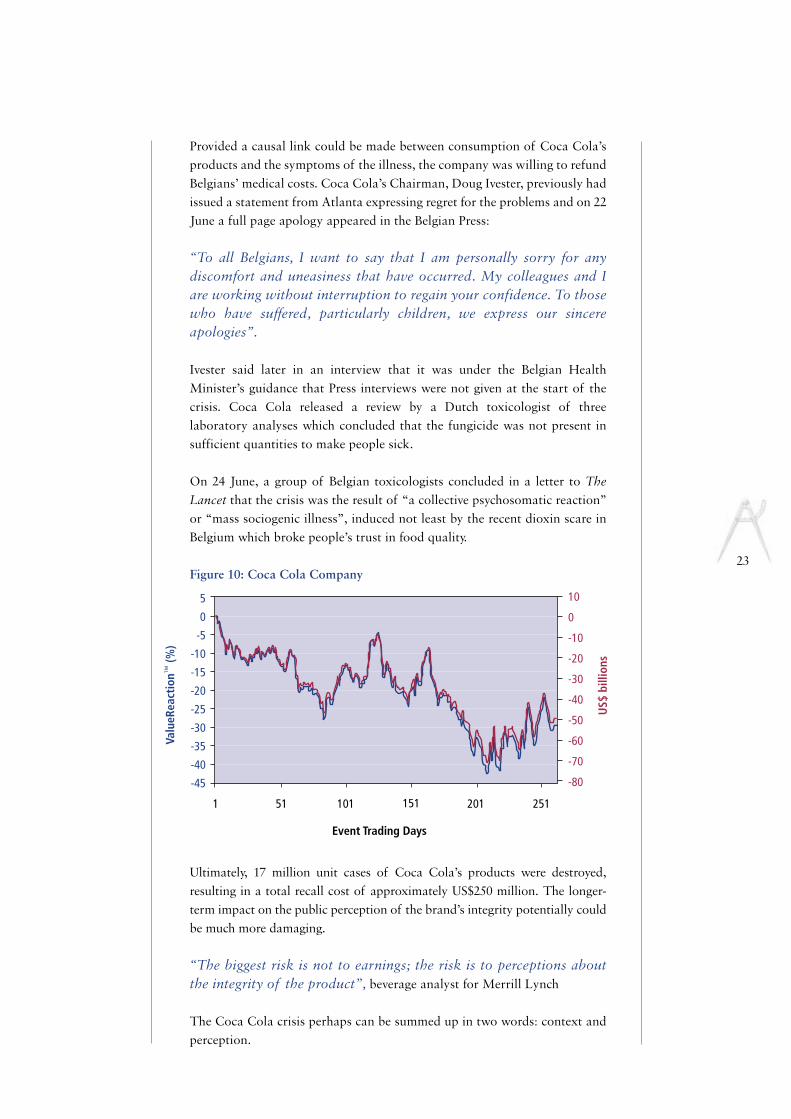
Figure 10: Coca Cola Company
Ultimately, 17 million unit cases of Coca Cola’s products were destroyed,resulting in a total recall cost of approximately US$250 million. The longer-term impact on the public perception of the brand’s integrity potentially couldbe much more damaging.
“The biggest risk is not to earnings; the risk is to perceptions aboutthe integrity of the product”, beverage analyst for Merrill Lynch
The Coca Cola crisis perhaps can be summed up in two words: context andperception.
24
Case Study 4
Perceived Environmental Threat
On 30 April 1995, environmental activists from the pressure group,Greenpeace, scaled and occupied the disused Brent Spar oil platform in theNorth Sea. The platform, operated by Shell UK Exploration and Production(Shell) and owned jointly with Exxon, was due for deep sea disposal later inthe year, following permission from the UK Government. The Brent Spar – a19-year-old, 14,500 tonne floating oil storage system – had beendecommissioned since 1991 and was the first of 400 North Sea facilities to beabandoned.
Greenpeace demanded that Shell revoke its decision to dispose of thestructure at sea, asserting that it contained over 5,000 tonnes of oil, over 100tonnes of toxic sludge and more than 30 tonnes of radioactive scale, harmfulto the marine environment, and that the decision had been made on the basisof cost alone. Shell responded by stating that Government permission hadbeen granted only after, “extensive studies over several years” had confirmedthat disposal at sea “would have negligible environmental impact” and after“a full evaluation of the technical, environmental, safety and cost factors”had been undertaken. Indeed, 3 years of investigation and 30 independentscientific studies established deep-sea disposal as the preferred environmentalchoice.
Within days, despite having known of the impending decision for monthsand having signed up to the Oslo-Paris Convention which allowed deep-seadumping, European politicians were pressing the UK Government to make aU-turn. Following a 23-day occupation of the rig, police and Shell employeeswere able to remove the twenty-two protestors, whereupon their leadercommented,
“It’s nice to hit one of the multinationals which has a big public image”.
Six weeks following the original occupation by Greenpeace – a few minoroccupations followed – a German Shell petrol station was firebombed, andanother torched, in protest against deep-sea disposal. Boycotting of Shellpetrol stations is estimated to have cost the company between £10 millionand £15 million per day.
On 20 June 1995, still maintaining that deep sea disposal was the mostenvironmentally-friendly option, Shell announced it would dismantle theBrent Spar on land. The U-turn was seen as a triumph for Europeanenvironmentalists, pressure groups and consumer power. On 29 June, thescience journal, Nature, published an article in which geologists claimed thatdisposal in deep water would have caused negligible environmental damage,if any, and marine life even may have been enriched. By contrast,dismantlement on land could cause severe damage to the local ecosystem.
251 51 101 151 201 251
6
4
2
0
-2
-4
-6
-8
-10
6
4
2
0
-2
-4
-6
-8
-10
-12
Event Trading Days
Greenpeace apologises, andShell given go-ahead forNigerian LNG project
US$
billi
ons
Valu
eRea
ctio
n™ (%
)
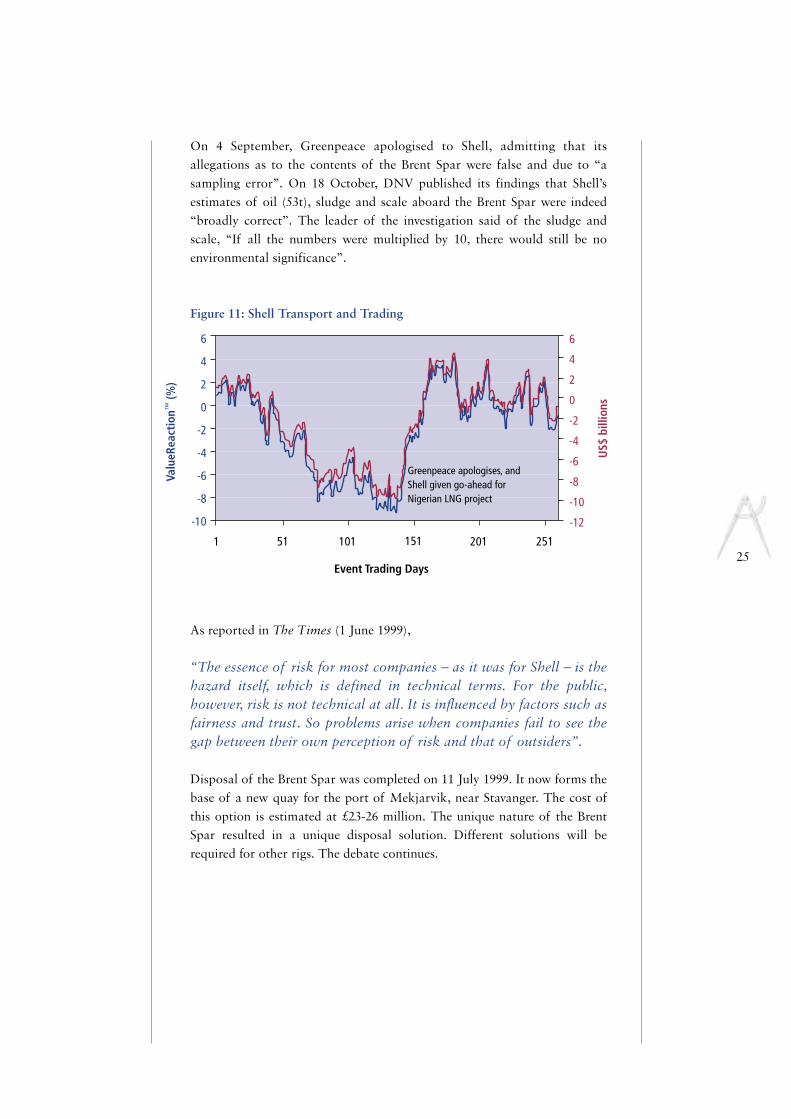
On 4 September, Greenpeace apologised to Shell, admitting that itsallegations as to the contents of the Brent Spar were false and due to “asampling error”. On 18 October, DNV published its findings that Shell’sestimates of oil (53t), sludge and scale aboard the Brent Spar were indeed“broadly correct”. The leader of the investigation said of the sludge andscale, “If all the numbers were multiplied by 10, there would still be noenvironmental significance”.
Figure 11: Shell Transport and Trading
As reported in The Times (1 June 1999),
“The essence of risk for most companies – as it was for Shell – is thehazard itself, which is defined in technical terms. For the public,however, risk is not technical at all. It is influenced by factors such asfairness and trust. So problems arise when companies fail to see thegap between their own perception of risk and that of outsiders”.
Disposal of the Brent Spar was completed on 11 July 1999. It now forms thebase of a new quay for the port of Mekjarvik, near Stavanger. The cost ofthis option is estimated at £23-26 million. The unique nature of the BrentSpar resulted in a unique disposal solution. Different solutions will berequired for other rigs. The debate continues.
26
Case Study 5
Perceived Breach of Contract
It began with a £500,000 national TV campaign on 6 August 1992. Hooverpublicised to UK consumers its promotional offer of two free flights toEurope for any customer who spent more than £100 on one of its products.More than 100,000 people registered for the offer. This initial promotion,which ran between August and October, was followed by a similar offer (anda £1 million TV campaign) for November and December, this time with freeflights to Orlando or New York.
By early December, allegations against Hoover as to the viability of the offerwere appearing in the national Press. Hoover responded by reiterating thatthe offer was genuine and was,
“fully funded by Hoover – we have our reputation to think of ”.
It was estimated that between 20,000 and 30,000 customers were disappointedin their quest for free flights. In addition, customers issued complaints that thecost of accommodation, which they were to organise themselves, wassubstantially higher than under the equivalent package deal. The UKGovernment Department of Trade and Industry turned down a request for aninquiry into Hoover, since the small print in the offer stated clearly that theflights were “subject to availability . . . and cannot be guaranteed”.
On 30 March 1993, Hoover admitted that the promotion had resulted in“tremendous difficulties in administration and implementation, plus significantunanticipated costs”. The US parent company, Maytag, established a £20 millionrescue provision and sacked three senior Hoover executives: the Europeanpresident, the vice-president of UK marketing and the director of marketingservices. Fears were expressed, particularly in Scotland, over extensive job losses.
In early August, an individual case against Hoover for breach of contract waslost in Court. On 29 September, British trading standards officers ruled outany legal action against Hoover under the Trade Descriptions Act. It wasargued that there was no intention to defraud customers and that,
“once the scale of the marketing debacle became apparent, Hoover tookvigorous action to redeem the situation. But it has been a costly exercise,both in financial terms and in the long-term damage to their reputationand credibility”.
Hoover acknowledged that “a gigantic and costly mistake” had been made.Full financial statements for the Maytag Corporation disclosed in April 1994,revealed the cost to date as £48 million, nearly half of 1993 group profits,used to purchase flight tickets for an estimated 220,000 customers. Anadditional £7 million was spent on an image-building campaign commencingon 6 January 1995.
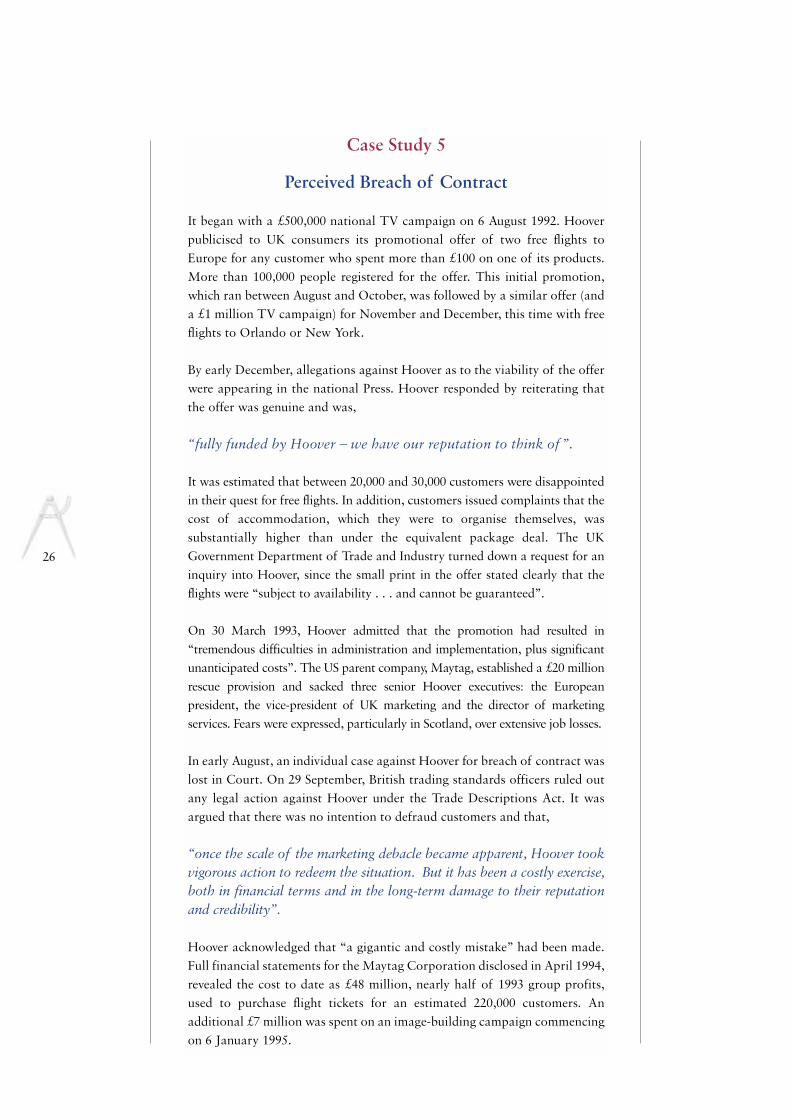
27
1 51 101 151 201 251
0
-5
-10
-15
-20
-25
0
-50
-100
-150
-200
-250
-300
-350
-400
-450
Event Trading Days
Rescue provision
Allegations appearing
US$
mill
ions
Valu
eRea
ctio
n™ (%
)
Figure 12: Maytag Corporation
On 30 May 1995, Maytag sold Hoover Europe to Italian white goodscompany Candy for US$170 million. The price represents a US$130 millionloss for Maytag. Maytag insisted that the divestment was unrelated to thepromotion and reflected only a desire to concentrate on the North Americanmarket. Journalists focused on the plunge in Hoover’s market share – dropsof 12% and 30% in the key upright and premium upright marketsrespectively, over one year – and commented that, “the long-term effect to theHoover name is difficult to calculate”.
Conclusion
These cases illustrate graphically the inordinate effect public perception canhave on reputation equity in times of crisis. The public responds not only tothe perceived physical threat and its potential consequences, but also to theperceived credibility and trustworthiness of senior corporate management.Any betrayal, real or perceived, sensed by the public will translate into lowerexpectations of future cash flow by investors. It is these expectations thatCEOs must seek to manage effectively.
T h e C o r e o f B r a n d V a l u e6
29
8 Knight & Pretty, op.cit.
Where a crisis strikes at the heart of a firm’s brand, the value impact – eitherpositive or negative - can be particularly acute. This was illustrated clearlywhen Perrier water, promoted on the basis of its natural purity, becamecontaminated with benzene in 1990. The firm lost 40% of its shareholdervalue and was bought by Nestlé. In contrast, Commercial Union stock faredwell following the terrorist bomb explosion in 1992. The CU demonstratedits skill in crisis management and efficient claims handling, and investorswere impressed. It is important, therefore, for a firm to know how variousstakeholders perceive its brand and reputation, and to be prepared forspecific erosion or damage to the key drivers of brand value.
Previous international survey research8 measures the core qualities of brandvalue across different geographic regions and industry sectors. The resultsreveal some striking contrasts. On average, the emphasis on trust in UK firmsis greater than that in either Continental Europe or the United States. Inmainland Europe, firms focus more on their internal expertise which is drivenlargely by technical excellence and design. In contrast, the Americans focusmost on responding to the customer with high quality service; the qualitiesof convenience, enabling and empowerment drive the weighting.
Across industry sectors, there also emerge stark contrasts. For example,brand values in the banking sector appear to be driven by ethics, integrity andsecurity, whereas telecom and utility firms tend to reflect values of reliability,performance, efficacy and consistency in service. Unsurprisingly, the corebrand value dominating the retail sector reflects a customer focus; service,convenience, value-for-money and support.
It is vital that businesses identify the key drivers of brand values in their ownparticular industry sector so managers are able to recognise and assess therelative threat to reputation posed by crises that may occur.
This section of the report focuses on two reputation crises which strike at thecore of the firm’s reputation equity. The first involves a UK bank, the Bank ofScotland, where the ethical stance adopted by the bank was in direct oppositionto that held by its customers. The second case relates to an American technologyfirm, Intel Corporation, whose microprocessor was found to be flawed.
Case Study 6
A Breakdown in Trust
Following its success in establishing Sainsbury’s Bank with the supermarketin 1997, the Bank of Scotland (BoS) intended to extend its direct bankingexpertise to the US markets. On 1 March 1999, the bank announced a jointventure with Robertson Financial Services of the US, owned by the televisionevangelist Pat Robertson. Support and processing services would be providedby Marshall & Illsley, a Wisconsin bank holding company, and Robertsonwould hold “a substantial minority” interest in the new venture, the NewFoundation Bank. The oldest bank in Scotland, the BoS was established in1695 by the former Scottish Parliament.
Within days of the announcement, equity analysts expressed doubt over thedeal and Scottish newspapers voiced concern with headlines such as:
Robertson’s loud and hostile views on homosexuals, liberals, Hindus,Muslims, abortion, and the role of women, and his conspiracy theoriesbecame public knowledge in Scotland. Meanwhile, some of his past businessventures were under investigation by the US Internal Revenue Service. Manyindividuals and organisations threatened to withdraw their accounts fromthe BoS, and “ethical investors” threatened to sell their shares.
In its first public response to criticism against the deal, the BoS stated on 23 March that there would be no reversal in its decision to form a jointventure with Robertson; “his religious and moral stance is a personal matterfor him and not the bank”. On 22 April, the BoS continued to defend its jointventure with Robertson but made explicit the risk to the bank’s reputation.Peter Burt, Chief Executive of the BoS, commented,
“There’s a reputational risk to almost every area we do business, suchas some building projects. It is a question of trying to behaveresponsibly and in a way that society as a whole accepts. Most newinitiatives upset some special interest groups. It would be almostimpossible to run a business if you tried to please everyone”.
30
Bank’s Venture With Far-Right Zealot Sets Alarm Bells Ringing
The Scotsman, 3 March
Heaven Can Wait While Profits Build Scotland on Sunday, 7 March
Unions And Kirk Join Clamour Over Bank’s Deal With Preacher
The Scotsman, 9 March

31
1 51 101 151 201 251
10
0
-10
-20
-30
-40
-50
0
0
-2
-4
-6
-8
-10
Event Trading Days
US$
billi
ons
Valu
eRea
ctio
n™ (%
)
On 4 June, senior BoS executives met with Robertson in Boston,Massachusetts. The official termination of the proposed venture wasannounced the following day. The Board of the BoS told shareholders at itsannual meeting on 16 June, “Our judgement was wrong and for that theboard apologises”.
Figure 13: Bank of Scotland
At the time, Press comment suggested it was “difficult to quantify the impactof protest on a company’s bottom line” and the bank “had a lot of work todo in terms of rebuilding confidence and trust”. Although the BoS assertedin March that it had undertaken “due diligence in all respects”, the duediligence failed to take into account sufficiently the reputation risk to the BoSand its shareholders.

32
Case Study 7
A Breakdown in Reliability
A subtle flaw in Intel’s Pentium microprocessor was discovered by amathematics professor when conducting a theoretical analysis of primenumbers. Responding to a CNN report on the defective chips on 22 November 1994, Intel stated that the problem, “would pop up once everynine billion times”, when conducting complex divisional equations.
Computer users were quick to accuse Intel of irresponsibility in failing toissue a general notice when the flaw was discovered. Such accusations weremade on the Internet, and its computer-related newsgroups becameincreasingly heated on the subject. This prompted Intel, on 29 November, toissue a public statement on the Internet, followed by a personal statementfrom the company’s Chief Executive, and to establish various hotlines tohandle queries. As Intel’s Chief Operating Officer, Craig Barrett, observed,
“The Internet is a very effective communications vehicle among thetechnical community in the US. You combine the Internet with thepopular Press and you get instantaneous exposure”.
One crisis management expert commented,
“What’s at stake here is their [Intel’s] credibility. What people thinkabout your company is based on how you handled your last crisis”.
Meanwhile, Intel planned to manufacture the flawed chip into the followingyear whilst the modified version was phased into circulation. By mid-December, American lawyers had filed suits against Intel. Intel continued todeny the charges strongly. On 20 December, Intel announced its replacementof all Pentium microprocessors for any consumer wishing to swap for amodified chip, and the company’s Chief Executive, Andrew Grove, issued apublic apology:
“Our previous policy was to talk with users to determine whethertheir needs required replacement of the processor. To some people,this policy seemed arrogant and uncaring. We apologise”.

33
1 51 101 151 201 251
80
60
40
20
0
-20
25
20
15
10
5
0
-5
Event Trading Days
Recall announced
Disappointing Q2results
US$
billi
ons
Valu
eRea
ctio
n™ (%
)
Figure 14: Intel Corporation
Analysts reacted favourably to the decision to replace the chip. The ultimatecharge against Intel’s fourth-quarter earnings for replacing the faulty chipwas US$475 million. Intel announced that, in future, it would launch anearly-testing programme which would enable sophisticated users toexperiment with the new product prior to its market debut.
Intel was the first manufacturer of microprocessors to brand (using the namePentium) rather than number its product. In addition, the company had spentmillions of dollars since 1991 on its ‘Intel Inside’ marketing campaign. Thesebranding efforts generate both substantial rewards for the firm’s shareholdersand yet also significant reputation risk from the associated high visibility.
Conclusion
It is vital for businesses to be aware of how stakeholders perceive the valueswhich drive the firm’s brand. This insight allows firms to assess the sensitivityof an event which potentially may damage brand integrity. In such caseswhere the fundamental values of a firm are brought into doubt, seniormanagement must be especially vigilant in protecting reputation equity. Thefuture of the firm depends on it.

D a t a a n d M e t h o d s7
34
The ValueCreationQuotientTM (VCQTM)The VCQ is calculated as the ratio of the market value of claims on a firm’sassets (market capitalisation plus the balance-sheet value of debt) to thecapital absorbed (cumulative capital raised and retained) by the firm. Allgoodwill write-offs and other negative reserves were reinstated. The metricthus combines the capital history of the firm with market expectations offuture cash flow. It is assumed that a firm’s market value represents areasonable approximation of the net present value of a firm’s future cashflows. The VCQ is a decisive measure of corporate success since it gauges thecompetitive advantage of a corporation over time by measuring its ability togenerate and realise cash flows at a rate exceeding its cost of capital.
On first glance, it may appear that those firms with the oldest capital willtend to have a spuriously high VCQ. This potential bias is offset by twofactors. Firstly, these older firms have had longer to accumulate retainedearnings and secondly, the value of these older firms will tend to be moreadversely affected by the need to raise new capital sooner than other firms.
ValueReactionTM
In order to measure the value reaction to an event, it is necessary first to extractthe effect of other events that may impact shareholder value simultaneously.This is accomplished in two phases. The first phase is at the individualcompany level and involves filtering out from share price movements the effectsof market-wide factors. The result of this process is the estimation of so-calledabnormal returns for a period immediately following the event. Theseabnormal returns are presented on a risk-adjusted basis. In the second phase,these abnormal returns are aligned on the event day (trading day 0) and thenaccumulated over what is now event time, resulting in a value reaction fromtrading day 0 known as cumulative abnormal returns.
The raw data on share prices and market indices underlying the study wereobtained from Datastream financial database. The market index chosenvaries according to the stock market in which the shares are traded. Themarket index selected for each country is presented in Table 2.
Table 2: Selected Market Index
Country Market Index
France SBF 250Germany DAX CompositeJapan Nikkei All StocksThe Netherlands CBS All Share GeneralSweden Affarsvarlden GeneralSwitzerland SBC GeneralUnited Kingdom FTSE All ShareUnited States S&P 500 Composite
Press information relating to the case profiles was obtained from ReutersTextline, the international newspaper and newswire archive.

Rory F Knight, MA (Oxon), MCom, PhD, CAChairman, Oxford Metrica
Rory Knight has extensive experience of working andconsulting in the financial and corporate sectors. He isDirector of a number of technology companies. For fiveyears, he was Dean of Templeton College, University ofOxford, where he was responsible for Templeton’s overallstrategy and direction. He is Dean Emeritus at Templeton
and Fellow in Finance and is co-author of Financial Performance(Butterworth-Heinemann, 2000).
Dr Knight’s work on shareholder value has been published internationally withparticular acclaim given to his extensive public company quantitative analysisbased on the ValueCreationQuotientTM (VCQTM). Previously a Deputy Directorin the Swiss National Bank (SNB), his role included providing policy advice oninternational financial matters and he retains significant links with centralbanks around the world. He acts as an advisor to a number of multinationalsand is on the board of an international investment fund. He was formerly aProfessor of Finance in IMD, Lausanne and IMI, Geneva. He has been and iscurrently a visiting professor at a number of institutions worldwide includingthe Amos Tuck School (Dartmouth), the Australian Management School, theDrucker School; Ecole Nationale des Ponts et Chaussées (Paris), EOI (Madrid),HEC, INSEAD, the Singapore Institute of Management, Stanford, TongjiUniversity (Shanghai), UCLA, and the University of Cape Town.
Deborah J Pretty, BA (Hons), DPhil (Oxon), AIRM, ARMPrincipal, Oxford Metrica
Deborah Pretty has worked for several years in finance andcorporate risk management, establishing integrativeframeworks and connections between risk and value formany major multinationals. For three years, she was MarshResearch Fellow at Templeton College, University ofOxford, where she undertook extensive empirical research
in strategic risk and finance. She is author of Risk Financing Strategies – TheImpact on Shareholder Value (RIRG, 1999).
Dr Pretty has written widely for academic and professional journals andpresents her research regularly at international conferences and corporatesymposia worldwide. Her prior experience as an Assistant Director inSedgwick Energy (risk advisors and insurance brokers to the oil industry)included advising on risk retention strategies; risk finance and alternative risktransfer; insurance economics; financial modelling; and involvement instrategic planning. She was concerned primarily with developing corporatestrategy, new business and new products, and was responsible forcontributing to the risk finance reviews of several major corporations.Previously, she was a risk finance analyst with Tillinghast-Towers Perrin(actuarial consultants) in London and the United States, conductingquantitative analysis for many of the large reinsurers and insurers worldwide.
A u t h o r s
35
36
Oxford Metrica is an independent strategic advisor. The firm has beenestablished to serve the needs of corporations to develop policies andprocedures that deal with risk, value, reputation and governance – the strategicaspects of financial performance. The firm provides analytical, advisory andtransactional services to financial and corporate clients worldwide.
© Oxford Metrica 2001

Oxford MetricaThe Old RectoryRowleigh LaneOxford OX13 5QAEngland
T +44 (0)1865 390825F +44 (0)1865 390281E [email protected] www.oxfordmetrica.com

www.oxfordmetrica.com