reputation risk in the insurance industry - · pdf filedr rory knight chairman the financial...
TRANSCRIPT

REPUTATION RISK IN THE INSURANCE INDUSTRY

Private and Confidential
Copyright © Oxford Metrica
REPUTATION RISK IN THE INSURANCE INDUSTRY
Dr Rory KnightChairman
The Financial Crisis and Reputation Risk in the Insurance Industry
FOREWORD
I am pleased to present this briefing which explores the impact of reputation risk on shareholder value in the insurance sector during and since the financial crisis. We define reputation risk as the potential to increase or decrease significantly the intangible asset of reputation in a company’s market value.
The last five years since the outbreak of the financial crisis have been characterised by increasing volatility in global markets and a slow recovery of the value lost in 2008. However, the results presented here demonstrate that the financial sector, and insurers in particular, have suffered a massive loss of value and that recovery in this sector lags considerably the market as a whole. The scope for recovery is substantial as the sector is at a significant discount to the highs of 2007.
The analysis reveals that, during the crisis, insurance companies were more susceptible than other sectors to one-off shifts in value and to specific reputation crises, both in terms of frequency and magnitude of value lost. Furthermore, insurers showed less capacity for recovery from such events. Share prices of banks and corporates generally recovered over the year following a sudden drop in value whereas the share prices of insurers generally did not. The monetary environment of low interest rates has been unfavourable to insurance companies as returns on their investment portfolios have been diminished. The briefing identifies policy responses that seem most appropriate. The problem has been demonstrably compounded in the insurance sector by a pronounced and negative transmittal effect. That is, insurer-specific events tend to be transmitted to other insurers, in a way not evident in non-financial sectors.
On a separate note, the briefing presents clear counter-evidence on the myth that reputation fall-out from insured corporates affects insurers. There is no evidence to suggest that the negative impact from a reputation event at a corporate client has any impact on the insurer or reinsurer. In contrast, losses to corporates from natural disasters do impact the value of insurers.
This briefing is based on a rich set of data and empirical analysis, and provides some new insights into the impact of crises on reputation and contagion within the insurance sector. It provides policy advice to both investors and insurers in the light of the evidence presented.
We thank Swiss Re for their support of the project.
Dr Rory Knight is Chairman of Oxford Metrica. He was previously Dean of Templeton College, Oxford University’s business College.
3

EXECUTIVE SUMMARY
The aim of this briefing is to provide an independent and robust analysis of the value impact on insurers from reputation risk. For the purposes of this paper, reputation risk is defined as the potential to increase or decrease significantly the intangible asset of reputation in a company’s market value.
The research is based on evidence across the last five years - from 1 January 2008 to 31 December 2012 - and includes, therefore, the highly volatile period of the financial crisis.
The study encompasses 200 reputation events across banks, insurers and corporates. Reputation events are critical events which have the potential to change substantially the value of a company’s reputation. These events may trigger a positive or negative change to the value of the company’s reputation asset; its “reputation equity”.
In this study, the events include incidents relating to earnings performance and governance failures, in addition to the more traditionally insurable perils. Over a different time period, one would expect a different composition of events.
Key results
1. The value destroyed in the banking sector over the last five years has been mirrored in the insurance sector. In contrast with the corporate sector, when a bank or insurer experiences a reputation event, the value impact often is similar for others in the sector.
2. Insurers appear to struggle more than banks or corporates to recover lost value following reputation events that affect insurers directly. The slow recovery response of insurers over this time period to reputation events is consistent with the low interest rate environment. The current monetary policy is intended to benefit the economy and stimulate lending by banks through low borrowing rates for banks. However, the same policy reduces the prospects for investment returns for insurers and reinsurers, dampening their share price prospects.
3. Financial institutions experience both greater likelihood and greater value impact from reputation events than do corporates, which may be expected considering the period under review.
4. The reputation impact on an insured corporate following a crisis does not generally transmit to the insurer. The immediate value impact on an insurer from a reputation crisis at an insured corporate is strongly related to the size of loss to which the insurer is exposed.
5. In contrast with the effect of a corporate reputation crisis on insurers, the average value impact on insurers following a natural disaster is negative over the post-event year. However, as with corporate reputation crises, there is some association between the immediate value impact on insurers from a natural disaster and the size of loss exposure.
From the evidence underpinning this study, it is clear that insurers are affected by reputation events in different ways from corporates.
A transmittal effect exists within the financial sector whereby reputation effects of events experienced by some in the sector are transmitted to others. This applies to both positive and negative reputation events. This transmittal across the financial sector affects the incidence, impact and recovery from reputation events for insurers. In contrast, the reputation effects on an insured corporate from a reputation event generally are not transmitted to the insurer.
4

INTRODUCTION
The period of the last five years has been one of unprecedented crisis for the financial services industry to which the insurance industry has not been immune. In addition to the expected incidence of crises across insureds, the market context has been one of extreme volatility, affecting both capital requirements and investment returns.
The global banking crisis of 2007-2009, prompted by rising defaults on subprime mortgages in the United States, has led to extensive collateral damage. It is the assets of credibility and trust which have been damaged most severely, and confidence in financial institutions has yet to recover. These assets are fundamental to a company’s reputation, and the liquidity crisis serves as a reminder that reputation is both fragile and a powerful driver of shareholder value.
The aim of this paper is to evaluate the relationship between reputation risk and shareholder value performance in the insurance industry. This includes events which affect a company’s reputation equity and market value significantly, either in a positive or negative direction, and events which affect insurers directly or indirectly via insured corporates. In addition, for benchmarking purposes, the study includes reputation events which have affected banks directly.
The analysis is methodologically robust and is based on empirical evidence on 200 events from the five-year period, 1 January 2008 to 31 December 2012. Table 1 provides a framework for the research.
Table 1 The research framework
The paper seeks first to understand the market context in which these companies are experiencing crisis. Second, the biggest shifts in shareholder value (positive and negative) are identified and their triggers analysed for each of the largest 25 companies in the banking, insurance and corporate sectors. Third, the ten most prominent reputation crises from each of the last five years are identified and analysed. Finally, the impact on the insurance industry of corporate reputation crises is assessed.
Portfolio Analysis
MarketsReview of share price performance and volatility over the last 5 years; insurance and banking sectors
Top 25 banks Top 25 insurers Top 25 corporates
Analysis of the biggest shifts in value (positive and negative) for banks, insurers and corporates over the last 5 years
Top 50 crises Analysis of the Top 10 reputation crises in each of the last 5 years
Insurance sector Evaluation of the impact on insurers from reputation crises across insureds
5

THE MARKET CONTEXT
Presented in this section is a review of market conditions over the last five years. The overview provides a context within which to analyse companies experiencing sudden and unexpected reputation events or struggling to recover from a reputation crisis.
Figure 1 illustrates the indexed performance of the MSCI World Index (dominated by non-financials or “corporates”), the MSCI World Insurance Index and the MSCI World Bank Index over the last five years.
Figure 1 Indexed performance over the last 5 years
The dramatic slide in global share prices following the collapse of US investment bank Lehman Brothers on 15 September 2008 is apparent. Since the trough in early March 2009, the MSCI World Index has largely recovered. It should be noted that the return data presented in Figure 1 are based in US dollars and, therefore, the effects of the bilateral currency movements between the dollar and the local currency for the constituent companies that make up the various indices will have an effect on performance.
Since the weighting of the US-based constituents is not constant across these three indices, an element of currency bias is likely to be present in the raw returns. For example, US banks constitute a larger proportion of the MSCI World Bank Index than the proportion of US insurance companies in the insurance index counterpart. This results in the latter being more significantly affected by currency movements. These currency effects are largely removed in the subsequent risk-adjustment process that follows.
It is a much gloomier picture, however, for insurers and banks which have yet to recover their value. Shown in Figure 2 is the risk-adjusted, excess performance of the MSCI World Insurance Index and the MSCI World Bank Index against the MSCI World Index. The Insurance and Bank indices are highly correlated.1 There is negligible difference to the results when calculated on an unadjusted basis; when no account is taken of the sensitivity of the Insurance or Bank indices to the broader MSCI World Index. The risk-adjustment procedure2 is well-established and produces a more refined result and it is this which is reported in Figure 2.
20
40
60
80
100
120
1-Jan-08 22-Jul-08 10-Feb-09 1-Sep-09 23-Mar-10 12-Oct-10 3-May-11 22-Nov-11 12-Jun-12 1-Jan-13
Inde
xed
perfo
rman
ce (1
00 =
1 Ja
nuar
y 20
08)
MSCI World Index MSCI World Insurance Index MSCI World Bank Index
1 R = 97% 2 Based on the Capital Asset Pricing Model (CAPM)
6

Figure 2 Underperformance by financials
By risk-adjusting the returns and calculating them excess to the market, this graph removes the market noise from the performance of the insurance and banking sectors. The underperformance of financial institutions relative to the broader market over the last five years has been massive.
Presented in Table 2 are the risk and return characteristics for the three indices over the five-year period under review and, for comparison, over the previous five-year period.
Table 2 Risk and return characteristics
Positive returns have disappeared and volatility has doubled (trebled in the case of banks) from the first five-year period to the second. It is important to recognise that it is against this backdrop that companies are seeking to manage their reputation events. In particular, it is clear that the value destroyed in the banking sector over the last five years has been mirrored in the insurance sector.
1 January 2003 - 31 December 2007
MSCI World Index
MSCI World Insurance Index
MSCI World Bank Index
Annualised volatility 11% 14% 12%
Annualised return 15% 14% 12%
1 January 2008 - 31 December 2012
Annualised volatility 22% 30% 32%
Annualised return -1% -4% -6%
7
-80
-70
-60
-50
-40
-30
-20
-10
0
10
Risk
-adj
uste
d re
turn
s (%
)
MSCI World Insurance Index MSCI World Bank Index
1-Jan-08 22-Jul-08 10-Feb-09 1-Sep-09 23-Mar-10 12-Oct-10 3-May-11 22-Nov-11 12-Jun-12 1-Jan-13

SUDDEN SHIFTS IN SHAREHOLDER VALUE
Reported in this section are the results of an extensive study of sudden shifts in share price experienced by banks, insurers and corporates over the last five years, and of the reputation events which trigger them. A portfolio of the largest (by market capitalisation3) 25 banks, 25 insurers and 25 corporates was constructed, thus generating an aggregate portfolio of 75 companies evenly distributed across the three broad sectors under examination.4
For each company in the portfolio, the biggest single jump in value and the biggest single drop in value was calculated. These sudden shifts in shareholder value were measured excess to the market return and were adjusted for risk.5 In order to exclude transitory pricing movements, a value shift was cumulated over a period of 20 trading days (approximately one calendar month) and calculated on a rolling daily basis. In this way, the best and the worst trading months were identified for each company, generating a portfolio of 75 positive reputation events and 75 negative reputation events.
Severity of value impact
Depicted in Figure 3 is the value impact of these reputation events over the course of one calendar year. The Value ReactionTM metric6 captures the firm-specific impact on shareholder value with all market-wide factors removed and returns risk-adjusted. The effective dates on which the events occurred have been aligned such that Event Day 0 is the start date for all events.
Figure 3 Value impact of reputation events
An average 40% of value is generated by the positive reputation events in the first twenty trading days; an average of 30% of value is destroyed by the
-40
-20
0
20
40
60
80
0 20 40 60 80 100 120 140 160 180 200 220 240 260
Valu
e Re
actio
n™ (%
)
Event Trading Days
Positives Negatives
3 21 January 2013 4 see Appendix 1 for constituents5 Returns are adjusted for beta, the sensitivity of a firm’s share price to broader market movements6 Value ReactionTM is a proprietary metric of Oxford Metrica which measures the impact on share price
performance of an event or portfolio of events. It is a modelled share price reaction, where market-wide influences have been removed and returns have been risk-adjusted. It is an excess return, adjusted for beta, and captures a firm-specific measurement of impact.
8

negative reputation events. In total, US$1,787 billion of value is added by the positive reputation events over the first twenty trading days; US$1,527 billion is added over the post-event year. A total of US$1,728 billion in value is destroyed by the negative reputation events over the first twenty trading days; US$359 billion over the post-event year.
Figure 4 shows the aggregate result by sector; banks, insurers and corporates. Firstly, it can be seen that insurers appear to struggle most during this time period to recover lost value following reputation events that affect them directly. On average, banks and corporates return to market expectations by the end of the post-event year whereas insurers remain underperforming by almost 15%.
The slow recovery response of insurers over this time period to reputation events is consistent with the low interest rate environment. The current monetary policy is intended to benefit the economy and stimulate lending by banks through low borrowing rates for banks. However, the same policy reduces the prospects for investment returns for insurers and reinsurers, dampening their share price prospects.
Figure 4 Insurers struggle to recover lost value
The dominant reputation risk triggering insurers’ negative reputation events in the period has been disappointing earnings performance. This is unsurprising as insurers have been managing their underwriting business and their investment portfolios in a highly volatile market in the context of a gloomy economy.
The evidence suggests that, for insurers in a continually competitive market, a turnaround in business performance has been the catalyst for sustained recovery; impressive premium growth, improved investment returns, and with demonstrable strength in reserves.
Secondly, it appears that financial institutions experience greater value impact (both positive and negative) from reputation events than do corporates. Although one would expect financials to be more leveraged than non-financials, the systematic element of these leveraged returns has been removed through application of the capital asset pricing model (CAPM). The results suggest, therefore, that there is an additional, non-systematic leverage effect which remains.
-40
-20
0
20
40
60
80
100
Valu
e Re
actio
n™ (%
)
Event Trading Days
Corporates +Banks –Banks +
Insurers –Insurers +
Corporates –
0 20 40 60 80 100 120 140 160 180 200 220 240 260
9
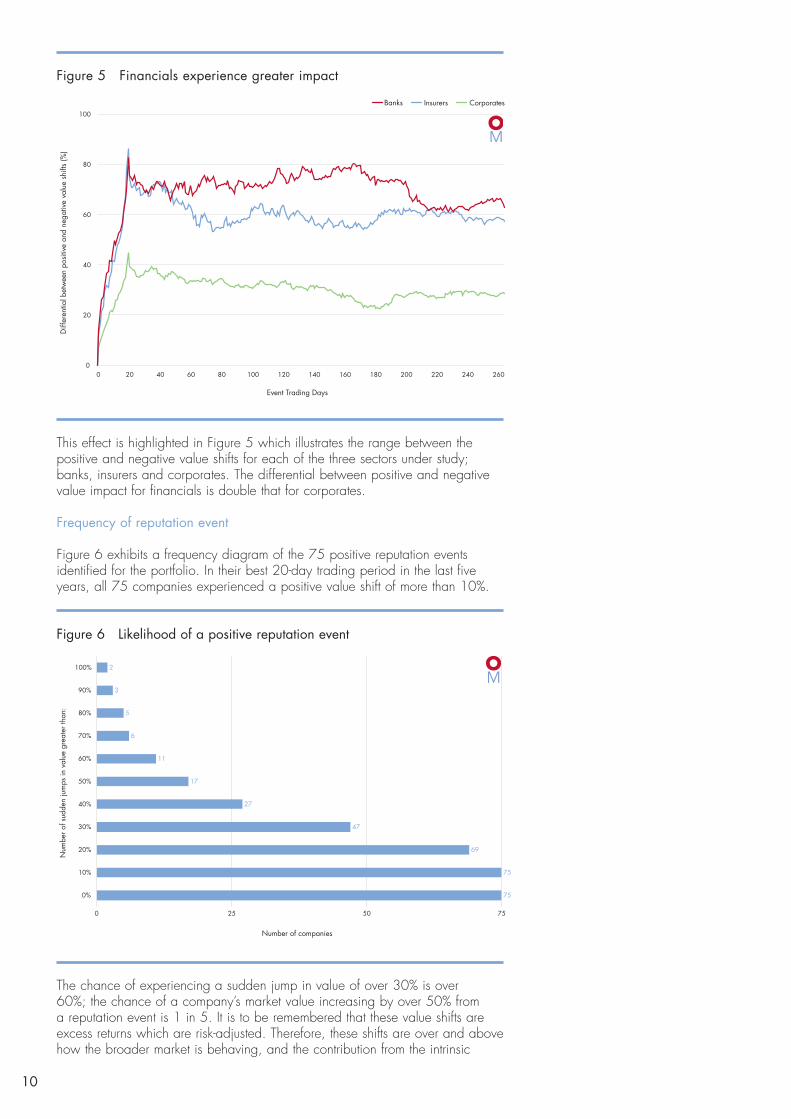
Figure 5 Financials experience greater impact
This effect is highlighted in Figure 5 which illustrates the range between the positive and negative value shifts for each of the three sectors under study; banks, insurers and corporates. The differential between positive and negative value impact for financials is double that for corporates.
Frequency of reputation event
Figure 6 exhibits a frequency diagram of the 75 positive reputation events identified for the portfolio. In their best 20-day trading period in the last five years, all 75 companies experienced a positive value shift of more than 10%.
Figure 6 Likelihood of a positive reputation event
The chance of experiencing a sudden jump in value of over 30% is over 60%; the chance of a company’s market value increasing by over 50% from a reputation event is 1 in 5. It is to be remembered that these value shifts are excess returns which are risk-adjusted. Therefore, these shifts are over and above how the broader market is behaving, and the contribution from the intrinsic
10
0
20
40
60
80
100
Diff
eren
tial b
etw
een
posit
ive
and
nega
tive
valu
e sh
ifts
(%)
Event Trading Days
CorporatesInsurersBanks
0 20 40 60 80 100 120 140 160 180 200 220 240 260
100%
90%
80%
70%
60%
50%
40%
30%
20%
10%
0%
0 25 50 75
75
75
69
47
27
17
11
6
5
3
2
Number of companies
Num
ber o
f sud
den
jum
ps in
val
ue g
reat
er th
an:

volatility of the stock has been removed by adjusting the returns for a firm’s beta; the firm’s stock price sensitivity to market movements.
Figure 7 shows a frequency diagram of the 75 negative reputation events. In their worst 20-day trading period in the last five years, all but one of the 75 companies experienced a negative value shift of more than 10%.
Figure 7 Likelihood of a negative reputation event
The chance of experiencing a sudden drop in value of over 30% is almost 40%; the chance of a company losing more than half its value from a reputation event is 1 in 10.
It is to be expected that there is a greater likelihood associated with the corresponding positive value impacts since of course there is a strict lower bound in effect for the value impact from negative reputation events; a company can increase by more than its value but it cannot lose more than its total value. Figures 8 and 9 show the distributions by sector.
Figure 8 Financials more likely to add value...
11
0%
-10%
-20%
-30%
-40%
-50%
-60%
-70%
-80%
-90%
-100%
0 25 50 75
0
0
1
2
5
7
13
29
52
74
75
Number of companies
Num
ber o
f sud
den
drop
s in
val
ue g
reat
er th
an:
100%
90%
80%
70%
60%
50%
40%
30%
20%
10%
0%
0 5 10 15 20 25
Number of companies
Num
ber o
f sud
den
jum
ps in
val
ue g
reat
er th
an:
Banks Insurers Corporates

Consistent with the results in Figures 4 and 5, the research indicates that there is a greater likelihood that financial institutions will experience more extreme reputation events; positive or negative. Therefore, both the frequency and severity of reputation events is more extreme for financial companies than for non-financial companies.
There is an 80% chance that banks or insurers will increase their value suddenly by more than 30% from a positive reputation event; the corresponding likelihood for corporates is 28%.
From a negative reputation event, the likelihood that a company will lose suddenly more than 30% of its value is 60% for insurers, 44% for banks and 12% for corporates.
Figure 9 ...and more likely to lose value
Notwithstanding the fact that the value shifts are calculated over and above any broader market movements, Figure 10 reveals a clustering of reputation events around the height of the financial crisis.
Figure 10 Clustering of reputation events
12
0%
-10%
-20%
-30%
-40%
-50%
-60%
-70%
-80%
-90%
-100%
0 5 10 15 20 25
Number of companies
Num
ber o
f sud
den
drop
s in
val
ue g
reat
er th
an:
Banks Insurers Corporates
0
10
20
30
40
50
2008 2009 2010 2011 2012
0
6
1
22
46
10
1
29
44
Num
ber o
f sud
den
valu
e sh
ifts
Positives Negatives

This should not be interpreted as an absence of reputation events since then, as the analysis is capturing simply the biggest positive and the biggest negative reputation event for each company during the period. Instead, the result is consistent with a market behaving with heightened reactions during a particularly volatile and critical period for the financial services sector.
Underlying triggers of reputation events
From detailed examination of public disclosures surrounding each of the 75 positive value shifts and each of the 75 negative value shifts, it is possible to identify the underlying reputation event which triggered the sudden shift in shareholder value.
The 150 reputation events identified have been classified into three risk categories: performance, external factors and restructuring. Performance risks comprise predominantly earnings results. External factors include actions by others which affect the company; government intervention, results reported by a competitor, changes in commodity prices, the release of new economic data. Restructuring risks include those relating to mergers and acquisitions, a change in stock repurchase or dividend policy, corporate or capital restructuring.
The vast majority of reputation events fell into one of these three categories. The positive value shifts were distributed thus: performance (35), external factors (26) and restructuring (13). The negative value shifts were distributed thus: performance (45), external factors (17) and restructuring (9).
Shown in Figure 11 is the value impact of the three risk categories for both positive and negative reputation events.
Figure 11 Value impact not explained by event type
The type of reputation event is clearly not a major driver in explaining the variation in the value impact or recovery. The evidence suggests that there is more explanatory power for impact and incidence in the sector from which the reputation event emanates; financials or non-financials. There appears also to be some contagion effect within the financial sector that is not present in the corporate sector. So, when a bank or insurer suffers a reputation event, the response from investors can be to assign the same expectation to others in the sector. The next section of the report will examine the reputation effects on value recovery from a portfolio of known reputation crises.
13
-40
-20
0
20
40
60
80
Valu
e Re
actio
n™ (%
)
Event Trading Days
External factors +Performance –Performance +
External factors – Restructuring –Restructuring +
0 20 40 60 80 100 120 140 160 180 200 220 240 260

REPUTATION CRISIS AND VALUE RECOVERY
Complementing the analysis of sudden value shifts - where the biggest jumps and drops in share price are identified for a portfolio of companies and their underlying triggers established - is a study of known reputation crises. Here, the analysis starts with a portfolio of prominent crises and models their impact on shareholder value.
Keeping to the same study period, a portfolio is constructed of the Top 10 reputation crises in each of the last five years, thereby generating a crisis portfolio of 50 events.
By chance, the portfolio is fairly evenly distributed across financial institutions (24) and non-financial companies (26). Five of the crises identified appear also in the portfolio of negative value shifts analysed in the previous section. A further nine companies which appear in the crisis portfolio appear also in the portfolio of negative value shifts but for a different event. In other words, the company experiences a reputation crisis and, in addition, another reputation event for which the value impact was worse but the headlines perhaps were less severe. A classic example would be a bank embroiled in scandal but which suffered a worse hit to value from reporting poor earnings results.
Figure 12 demonstrates the value impact from the portfolio of 50 reputation crises over the post-event year. As in the previous section, the dates on which the crises occurred have been aligned such that Event Day 0 is the start date for all. Market-wide influences are removed and returns are risk-adjusted to provide a clean measurement of impact.
Figure 12 Reputation crises yield winners and losers
Despite all companies losing value in the initial aftermath of a crisis, there emerges a divergent pattern of Winners and Losers where the former proceed to add value over the post-event year and the latter struggle to return to market expectations. In this portfolio, there are 12 Winners and 38 Losers.
Previous Oxford Metrica research7 has demonstrated that, at times of crisis, the market is exposed to new information about a company and, in particular, about the capabilities of its senior management to deal with the unexpected
14
7 The impact of catastrophes on shareholder value (1996), OM research commissioned by the Sedgwick Group
20
Winners Losers
-50
-40
-30
-20
-10
0
10
30
Valu
e Re
actio
n™ (%
)
Event Trading Days
0 20 40 60 80 100 120 140 160 180 200 220 240 260

under pressure. Investors use this new information to adjust their expectations of future performance and, consequently, the firm’s share price tends to experience a significant shift either upwards or downwards accordingly.
The distribution of Winners and Losers by sector (financial or corporate) is illustrated in Figure 13. The dispersion indicates some consistency with the results reported in the previous section; reputation crises experienced by financial institutions appear, on average, to generate greater value impact (positive or negative) than do those incurred by non-financial companies.
Figure 13 Impact on financials is more extreme
Illustrated in Figure 14 is the portfolio of 50 reputation crises distributed by event type. The crises are classified easily into three risk categories: performance (17), business practices (16) and insurable (17).
Figure 14 Reputation crises by type
15
-60
-40
-20
0
20
40
60
Valu
e Re
actio
n™ (%
)
Event Trading Days
Corporate WinnersFinancial Losers Corporate LosersFinancial Winners
0 20 40 60 80 100 120 140 160 180 200 220 240 260
Business practicesPerformance Insurable
-50
-40
-30
-20
-10
0
Valu
e Re
actio
n™ (%
)
Event Trading Days
0 20 40 60 80 100 120 140 160 180 200 220 240 260

Performance crises relate directly to the financial performance of the company; write-downs and bad debts, revelation of hidden losses and lawsuits. Business practices relate to inadequate governance of corporate behaviour; accounting irregularities, fraud, price-fixing, corruption, and other governance failures. Insurable risks are defined as those for which there is commercial insurance available; aviation loss, oil spills, fires, explosions, product recall or failure, service disruption and operational risk.
Whilst Figure 14 shows that performance crises in this portfolio tend to disappoint investors the most, there is little explanatory power in the type of crisis to explain the value recovery pattern. Oxford Metrica research8 9 10 demonstrates the following to be key drivers of value recovery following a corporate reputation crisis:
• Preparation - Effective loss prevention and control techniques always should be the first port of call to minimise risk and mitigate potential loss.
• Leadership - Strong leadership is essential to navigate a crisis well and inspire confidence in stakeholders.
• Action - Rapid, decisive and efficient action demonstrates managerial credibility and puts a company on the path to recovery.
• Communication - Communication must be accurate, frequent, well-coordinated and two-way. It should recognise the need to regain trust.
• Sensitivity - An honest, sensitive and compassionate response signals awareness of the severity of the situation and an understanding of the right priorities.
At times of great uncertainty (over the cause, scale or consequences of a loss), confidence is shaken. Strong leadership, credible action and effective communication are essential to the restoration of corporate reputation and value recovery.
REPUTATION EFFECTS ON INSURERS
In addition to experiencing a reputation event directly, an insurer or reinsurer may be involved vicariously as the insurer of a company which is experiencing a reputation crisis. Reported in this section are the results of a study of these indirect effects of reputation risk on insurers.
Illustrated in Figure 15 is the value impact of two portfolios. Shown in red is the average value impact of the portfolio of 17 insurable reputation crises (present also in Figure 14) for those companies incurring the crisis; the insured corporates. These insurable, corporate reputation crises are distributed as follows: product quality issues (6), operational risk (5), service disruption (3), aviation loss (1), explosion and oil spill (1) and natural disaster (1).
Shown in blue is the average impact on the MSCI World Insurance Index for those same events. It is seldom possible to glean from public information the specific insurers and their exposures to specific reputation events, hence the use of the Index to represent the industry as a whole. It is equally difficult for the market to discern this information and so, by using the Index, the research places itself in the same position as the market.
16
8 Reputation and Value: the case of corporate catastrophes (2001), OM research commissioned by AIG 9 Protecting Value in the Face of Mass Fatality Events (2005), OM research commissioned by Kenyon International 10 Reputation Review, 2011 and 2012, OM research commissioned by Aon
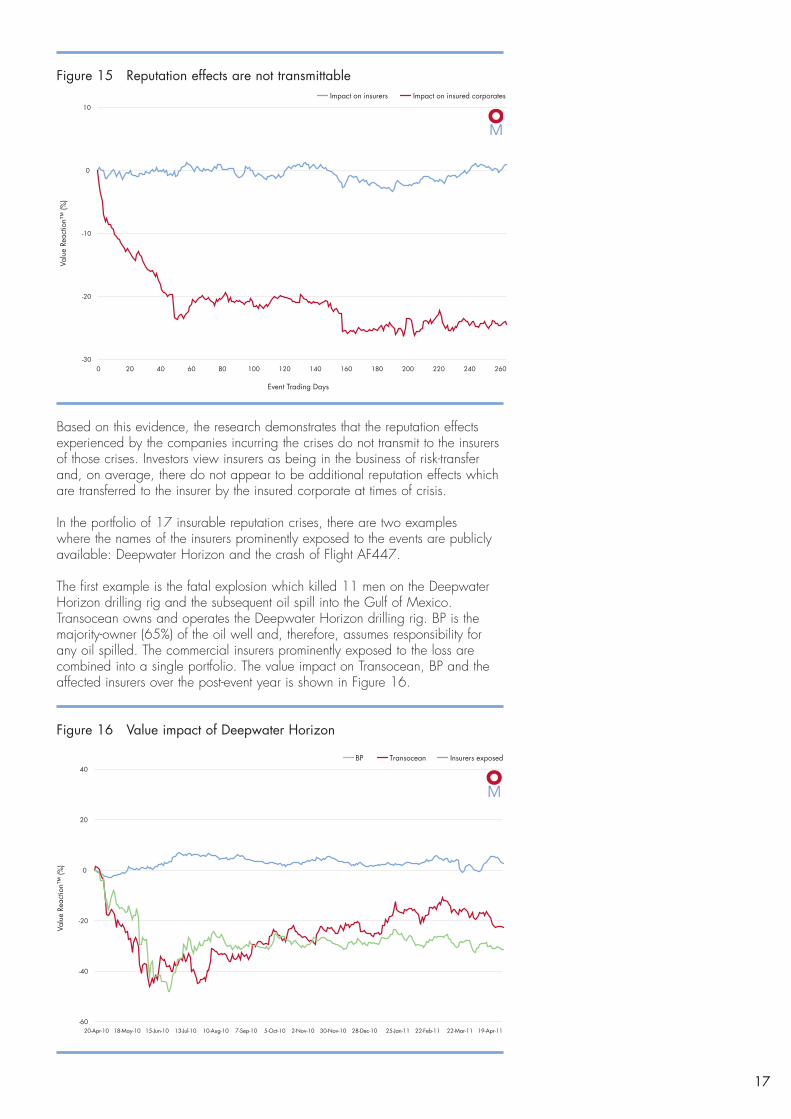
Figure 15 Reputation effects are not transmittable
Based on this evidence, the research demonstrates that the reputation effects experienced by the companies incurring the crises do not transmit to the insurers of those crises. Investors view insurers as being in the business of risk-transfer and, on average, there do not appear to be additional reputation effects which are transferred to the insurer by the insured corporate at times of crisis.
In the portfolio of 17 insurable reputation crises, there are two examples where the names of the insurers prominently exposed to the events are publicly available: Deepwater Horizon and the crash of Flight AF447.
The first example is the fatal explosion which killed 11 men on the Deepwater Horizon drilling rig and the subsequent oil spill into the Gulf of Mexico. Transocean owns and operates the Deepwater Horizon drilling rig. BP is the majority-owner (65%) of the oil well and, therefore, assumes responsibility for any oil spilled. The commercial insurers prominently exposed to the loss are combined into a single portfolio. The value impact on Transocean, BP and the affected insurers over the post-event year is shown in Figure 16.
Figure 16 Value impact of Deepwater Horizon
Impact on insurers Impact on insured corporates
-30
-20
-10
0
10
Valu
e Re
actio
n™ (%
)
Event Trading Days
0 20 40 60 80 100 120 140 160 180 200 220 240 260
17
-60
-40
-20
0
20
40
20-Apr-10 18-May-10 15-Jun-10 13-Jul-10 10-Aug-10 7-Sep-10 5-Oct-10 2-Nov-10 30-Nov-10 28-Dec-10 25-Jan-11 22-Feb-11 22-Mar-11 19-Apr-11
Valu
e Re
actio
n™ (%
)
BP Insurers exposedTransocean
The exposure of the commercial insurance market to losses arising from the Deepwater Horizon spill would be considerably greater if BP had purchased liability insurance. Instead, BP self-insures its clean-up costs through its captive insurance programme.
Statistical analysis reveals that the value impact on insurers at 20 days is strongly related to the size of loss to which they are exposed.11 Beyond that immediate impact, the strength of the correlation disappears and insurers recover well over the post-event year, unlike the corporates in the eye of the storm struggling to restore their reputations.
The case serves as an exemplar of the aggregate result; that, on average, reputation effects are not transmitted from the insured corporate to the insurer. Beyond the initial impact on insurers which is driven by the size of their loss exposure, the longer-term impact on insurers from corporate reputation crises is mildly positive. This is likely to reflect an anticipated hardening of premium rates in the wake of disaster.
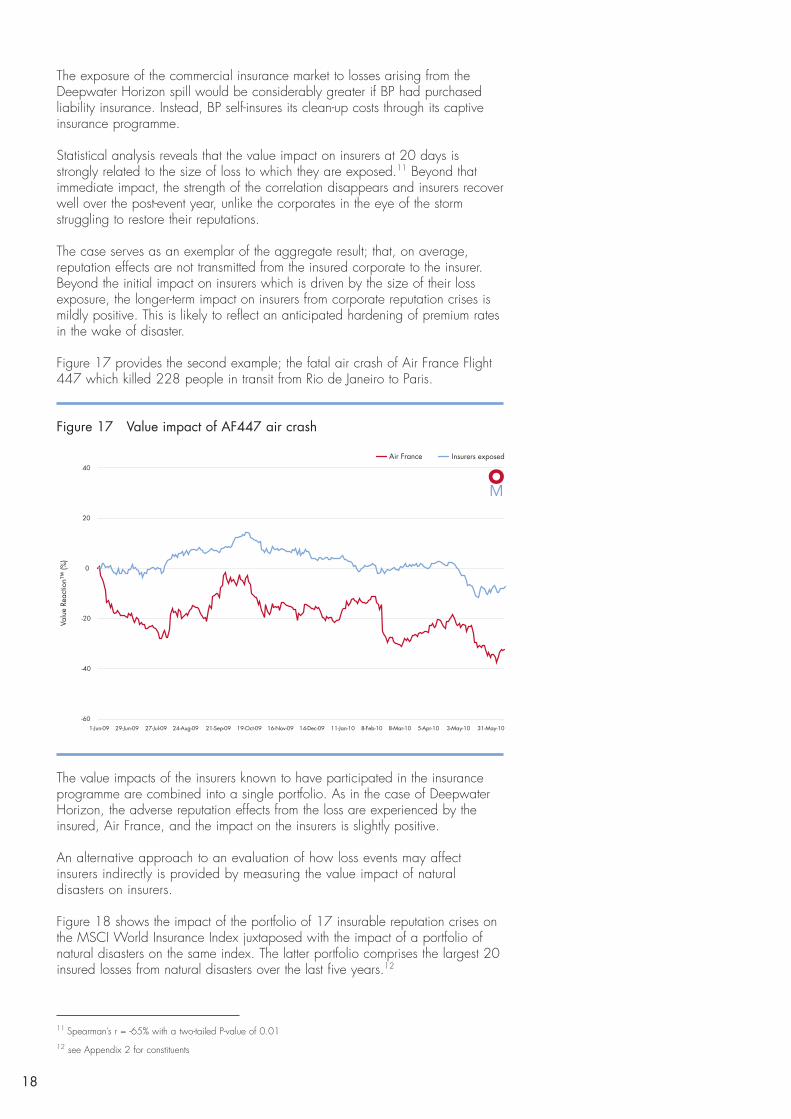
Figure 17 provides the second example; the fatal air crash of Air France Flight 447 which killed 228 people in transit from Rio de Janeiro to Paris.
Figure 17 Value impact of AF447 air crash
The value impacts of the insurers known to have participated in the insurance programme are combined into a single portfolio. As in the case of Deepwater Horizon, the adverse reputation effects from the loss are experienced by the insured, Air France, and the impact on the insurers is slightly positive.
An alternative approach to an evaluation of how loss events may affect insurers indirectly is provided by measuring the value impact of natural disasters on insurers.
Figure 18 shows the impact of the portfolio of 17 insurable reputation crises on the MSCI World Insurance Index juxtaposed with the impact of a portfolio of natural disasters on the same index. The latter portfolio comprises the largest 20 insured losses from natural disasters over the last five years.12
-60
-40
-20
0
20
40
1-Jun-09 29-Jun-09 27-Jul-09 24-Aug-09 21-Sep-09 19-Oct-09 16-Nov-09 14-Dec-09 11-Jan-10 8-Feb-10 8-Mar-10 5-Apr-10 3-May-10 31-May-10
Valu
e Re
actio
n™ (%
)
Insurers exposedAir France
18
11 Spearman’s r = -65% with a two-tailed P-value of 0.0112 see Appendix 2 for constituents

Figure 18 Value impact of natural disasters on insurers
The results show a gradual but distinct negative impact on insurers’ shareholder value from the incidence of natural disasters. A single natural disaster of course can affect multiple insureds whereas a reputation crisis generally is affecting a single insured. For the insurer, therefore, losses from a natural disaster are less diversifiable than is a specific loss from a single insured. There is a moderate correlation between the size of insured loss and the value impact at 20 days13, an association which disappears over the post-event year.
In the case of corporate reputation crisis, the research results demonstrate that the reputation effects do not appear to be transmitted to the insurer. In the case of natural disasters, there are no reputation effects to consider but, rather, the adverse impact of financial losses would appear for the observation period to outweigh the positive expectation of higher rates after the event. In both cases, there is some evidence to suggest a relationship in the immediate aftermath of an event between the size of loss exposure and the value impact on insurers.
SUMMARY AND CONCLUSIONS
The purpose of this paper is to evaluate the value impact on insurers from reputation risk events. These events may impact a company’s reputation positively or negatively, and they may affect insurers either directly or indirectly via the insured corporates. In this study, reputation risk is defined as the potential to increase or decrease significantly the reputation equity in a company’s market value.
200 reputation events are identified and analysed across banks, insurers and corporates over the last five years. The market context in which these companies have been managing their reputation risk is one of extreme volatility and poor returns. The share price performances of the banking sector and the insurance sector during this period of financial crisis have been strongly correlated.
This period since the outbreak of the financial crisis has been characterised by increasing volatility in global markets and a slow recovery of the value lost in
19
-20
-15
-10
-5
0
5
10
Valu
e Re
actio
n™ (%
)
Event Trading Days
Impact of natural disasters on insurersImpact of insurable crises on insurers
0 20 40 60 80 100 120 140 160 180 200 220 240 260
13 Spearman’s r = -30% with a two-tailed P-value of 0.19
2008. The results presented demonstrate that the financial sector, and insurers in particular, have suffered a massive loss of value and that recovery in this sector lags considerably the market as a whole. This is consistent with the prevailing low interest rate environment that is unfavourable to insurers.
The market context in which these companies have been managing their reputation risk, therefore, is one of extreme volatility and poor returns. The share price performances of the banking sector and the insurance sector during this period of financial crisis have been strongly correlated.
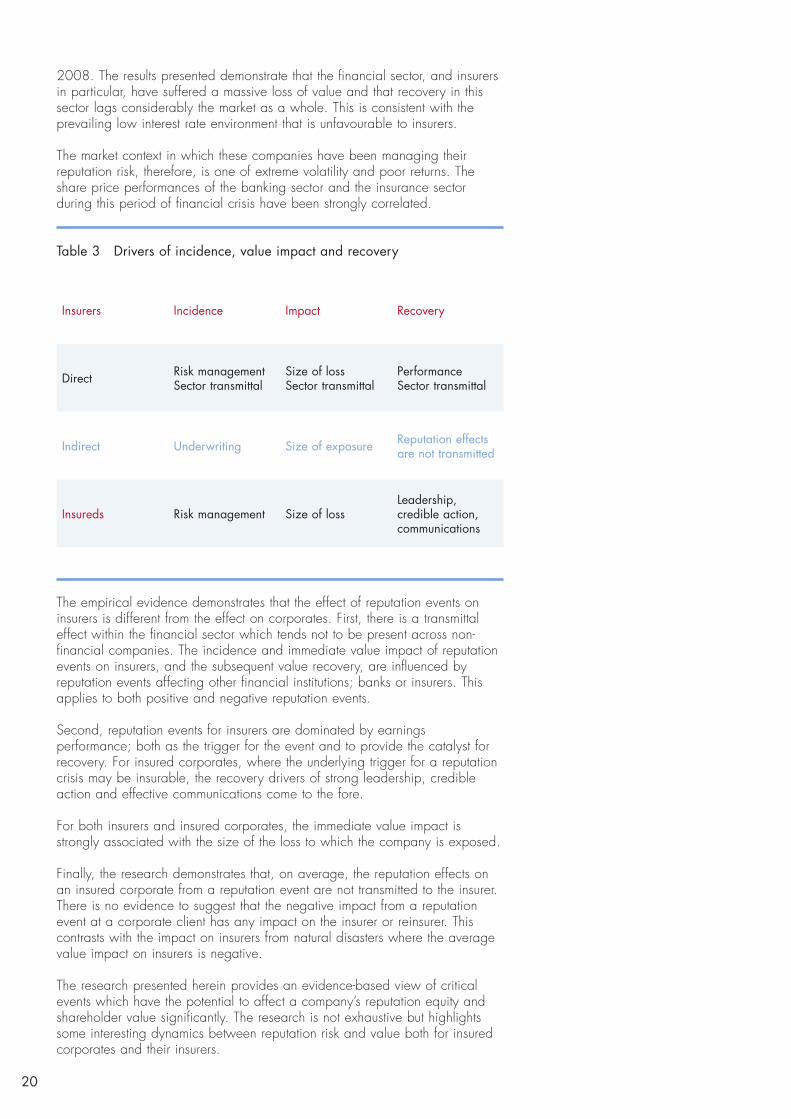
Table 3 Drivers of incidence, value impact and recovery
The empirical evidence demonstrates that the effect of reputation events on insurers is different from the effect on corporates. First, there is a transmittal effect within the financial sector which tends not to be present across non-financial companies. The incidence and immediate value impact of reputation events on insurers, and the subsequent value recovery, are influenced by reputation events affecting other financial institutions; banks or insurers. This applies to both positive and negative reputation events.
Second, reputation events for insurers are dominated by earnings performance; both as the trigger for the event and to provide the catalyst for recovery. For insured corporates, where the underlying trigger for a reputation crisis may be insurable, the recovery drivers of strong leadership, credible action and effective communications come to the fore.
For both insurers and insured corporates, the immediate value impact is strongly associated with the size of the loss to which the company is exposed.
Finally, the research demonstrates that, on average, the reputation effects on an insured corporate from a reputation event are not transmitted to the insurer. There is no evidence to suggest that the negative impact from a reputation event at a corporate client has any impact on the insurer or reinsurer. This contrasts with the impact on insurers from natural disasters where the average value impact on insurers is negative.
The research presented herein provides an evidence-based view of critical events which have the potential to affect a company’s reputation equity and shareholder value significantly. The research is not exhaustive but highlights some interesting dynamics between reputation risk and value both for insured corporates and their insurers.
Insurers Incidence Impact Recovery
Direct Risk management Sector transmittal
Size of loss Sector transmittal
Performance Sector transmittal
Indirect Underwriting Size of exposure Reputation effects are not transmitted
Insureds Risk management Size of lossLeadership, credible action, communications
20

APPENDIX 1A: TOP 25 BANKS
1 Market capitalisation on 21 January 2013
Rank Company Parent country Portfolio MCap1
(USDm)
1 Industrial & Commercial Bank of China China Banks 246,389
2 China Construction Bank China Banks 213,990
3 HSBC UK Banks 202,530
4 Wells Fargo USA Banks 183,952
5 JPMorgan Chase USA Banks 176,613
6 Bank of China China Banks 134,216
7 Bank of America USA Banks 120,068
8 Citigroup USA Banks 126,184
9 Commonwealth Bank of Australia Australia Banks 106,339
10 Banco Santander Spain Banks 90,185
11 Royal Bank of Canada Canada Banks 90,191
12 Westpac Banking Australia Banks 86,875
13 Itau Unibanco Brazil Banks 78,569
14 Toronto-Dominion Bank Canada Banks 77,149
15 Mitsubishi UFJ Japan Banks 75,376
16 Australia & New Zealand Bank Australia Banks 74,389
17 BNP Paribas France Banks 75,876
18 Sberbank Russia Banks 73,068
19 Bradesco Brazil Banks 69,942
20 Bank of Nova Scotia Canada Banks 69,706
21 Goldman Sachs USA Banks 70,002
22 UBS Switzerland Banks 65,420
23 National Australia Bank Australia Banks 65,807
24 Standard Chartered UK Banks 62,996
25 Royal Bank of Scotland UK Banks 63,824
21

Rank Company Parent country Portfolio MCap1
(USDm)
1 Berkshire Hathaway USA Insurers 236,577
2 China Life China Insurers 94,644
3 Ping An Insurance China Insurers 64,061
4 Allianz Germany Insurers 62,339
5 AIG USA Insurers 51,804
6 AXA France Insurers 42,700
7 Zurich Insurance Switzerland Insurers 40,537
8 MetLife USA Insurers 39,616
9 Prudential UK Insurers 37,389
10 China Pacific China Insurers 33,222
11 Munich Re Germany Insurers 31,798
12 Generali Italy Insurers 28,961
13 Travelers USA Insurers 29,108
14 ACE USA Insurers 28,286
15 Swiss Re Switzerland Insurers 27,425
16 Prudential Financial USA Insurers 26,893
17 Manulife Canada Insurers 26,491
18 Aflac USA Insurers 24,135
19 Great-West Lifeco Canada Insurers 24,624
20 Tokio Marine Japan Insurers 22,844
21 Allstate USA Insurers 20,818
22 Chubb USA Insurers 20,701
23 Power Financial Canada Insurers 20,470
24 PICC Property & Casualty China Insurers 19,158
25 Sampo Finland Insurers 19,016
1 Market capitalisation on 21 January 2013
22
APPENDIX 1B: TOP 25 INSURERS

Rank Company Parent country Portfolio MCap1
(USDm)
1 Apple USA Corporate 469,519
2 Exxon Mobil USA Corporate 413,988
3 Petrochina China Corporate 264,891
4 Google USA Corporate 231,498
5 Wal-Mart Stores USA Corporate 231,490
6 Microsoft USA Corporate 229,349
7 China Mobile Hong Kong Corporate 224,761
8 Royal Dutch Shell Netherlands Corporate 224,526
9 Chevron USA Corporate 225,546
10 General Electric USA Corporate 231,118
11 IBM USA Corporate 219,738
12 Nestlé Switzerland Corporate 219,498
13 Samsung Electronics South Korea Corporate 205,044
14 Johnson & Johnson USA Corporate 202,940
15 Pfizer USA Corporate 195,403
16 BHP Billiton Australia Corporate 193,230
17 Procter & Gamble USA Corporate 191,232
18 AT&T USA Corporate 189,939
19 Roche Switzerland Corporate 182,708
20 Novartis Switzerland Corporate 175,321
21 Coca-Cola USA Corporate 169,091
22 Oracle USA Corporate 166,221
23 Toyota Motor Japan Corporate 164,862
24 Philip Morris USA Corporate 150,316
25 Anheuser-Busch Belgium Corporate 143,801
1 Market capitalisation on 21 January 2013
23
APPENDIX 1C: TOP 25 CORPORATES

4 Source: Swiss Re sigma reports. Includes the largest insured losses from natural disasters over the last 5 years for which there is a full year’s price data. Insured losses include property and business interruption losses.
APPENDIX 2: LARgEST INSURED LOSSES FROM NATURAL DISASTERS
Event date Disaster Insured loss (USDm)4
Value impact 20-day (%)
Value impact 1-year (%)
11-Mar-11 Tsunami, Japan 35,000 1.8 -8.5
6-Sep-08 Hurricane Ike 20,000 -15.5 -23.2
27-Jul-11 Floods, Thailand 12,000 -13.0 -10.4
22-Feb-11 Earthquake, NZ 12,000 -4.4 -12.5
27-Feb-10 Earthquake, Chile 8,000 6.1 12.2
22-Apr-11 Severe storms, Alabama 7,300 -2.0 -11.9
20-May-11 Severe storms, Missouri 7,050 -5.3 -17.3
22-Aug-11 Hurricane Irene 5,300 -3.2 12.0
4-Sep-10 Earthquake, NZ 4,453 1.6 -7.1
26-Aug-08 Hurricane Gustav 4,000 -1.1 -23.2
24-Jan-09 Winter storm Klaus 3,372 -15.9 33.5
27-Feb-10 Winter storm Xynthia 2,754 6.1 12.2
9-Jan-11 Floods, Australia 2,255 7.3 -12.2
4-Oct-10 Thunderstorms, US 2,165 2.9 -13.6
23-Dec-10 Tropical cyclone Tasha 2,050 1.9 -13.6
13-Jun-11 Earthquakes, NZ 2,000 -1.0 -14.6
3-Apr-11 Thunderstorms, US 2,000 3.7 -9.5
12-May-10 Storms, US 2,000 -8.7 12.0
8-Apr-11 Thunderstorms, US 1,510 0.4 -13.0
14-Apr-11 Storms, US 1,400 -0.4 -12.6
24


Disclaimer
This document has been prepared for the exclu-
sive use of the intended recipient(s) only. Whilst
every effort has been made to ensure the ac-
curacy of the information contained in this
document, neither Oxford Metrica nor any of
its members past present or future warrants
its accuracy or will, regardless of its or their
negligence, assume liability for any foreseeable
or unforeseeable use made thereof, which liabi-
lity is hereby excluded. Consequently, such use
is at the recipient’s own risk on the basis that
any use by the recipient constitutes agreement
to the terms of this disclaimer. The recipient is
obliged to inform any subsequent recipient of
such terms. The information contained in this
document is not a recommendation or solicita-
tion to buy or sell securities. This document is
a summary presented for general informational
purposes only. It is not a complete analysis of
the matters discussed herein and should not be
relied upon as legal advice.

About Oxford Metrica
Oxford Metrica is a strategicadvisory firm, offering informedcounsel to boards.Our advisory services are anchoredon evidence-based research in riskand financial performance.Our work includes statistical analysisand index construction for banksand insurers, risk and performanceanalytics for asset managers,due diligence support in mergersand highly customised servicesfor corporate boards.
oxfordmetrica.com