reputation effects in trading on the new york stock...
TRANSCRIPT
This Draft: March 22, 2005.
Reputation Effects in Trading on the New York Stock Exchange
by
Robert Battalio Andrew Ellul Robert Jennings†
Mendoza College of Business Kelley School of Business Kelley School of Business University of Notre Dame Indiana University Indiana University
Abstract: Theory suggests that reputations, developed in repeated face-to-face interactions, allow non-anonymous, floor-based trading venues to attenuate adverse selection in the trading process. We identifyinstances when stocks listed on the New York Stock Exchange (NYSE) experience a non-trivial relocationon the trading floor for reasons unrelated to execution quality. Although the specialist follows the stock toits new location, most floor brokers do not. We use this natural experiment to determine whether reputationappears to affect trading costs. We find a discernable increase in the cost of liquidity in the days surroundinga stock’s relocation. The increase is more pronounced for stocks with higher adverse selection and greaterbroker turnover. Using NYSE audit-trail data, we find that the floor brokers relocating with the stock obtainlower trading costs than those brokers who do not move and those that begin trading post-move in the dayssurrounding the move. Together, these results suggest that reputation plays an important role in the liquidityprovision process on the floor of the NYSE.
Notes: We thank the New York Stock Exchange for providing data. We thank Markus Brunnermeier, Shane Corwin, ThierryFoucault, Frank Hatheway, Christian Lundblad, Thomas McInish, Marco Pagano, Tavy Ronen, Katherine Ross, Duane Seppi, IngridWerner and participants in seminars at Indiana University, London School of Economics, University of Kansas, University ofMemphis, University of Notre Dame, Rutgers University, University of Utah and participants at the Financial Economics andAccounting Conference at the University of Southern California. The opinions expressed in the paper do not necessarily reflect thoseof the employees, members, or officers of the New York Stock Exchange.
†Corresponding author: Robert Jennings, 1309 E. 10th Street, Bloomington, IN 47405; (812) 855-2696.
JEL Classification: G10; G20; G24

1 Cohen (2003) notes that Dimensional Fund Advisors (DFA) “reduced adverse selection problems both by dealing withparties that had shown themselves to be trustworthy and by taking steps to encourage greater trustworthiness in trading partners. DFAhad a vast roster of regular sellers – brokerage firms that had a consistent need to trade large blocks of stock for their clients. Preferredsellers were firms (and individuals within those firms) that consistently made full disclosure to DFA of everything they knew aboutthe stock. Such brokers would be more likely to get a deal done and to negotiate a less steep discount. DFA would be more cautiouswith brokers with whom it was less familiar. Such sellers might find DFA wanted to do smaller deals until a trusting relationship hadbeen established, or that DFA might negotiate a particularly steep discount because of the greater risk associated with the possibilityof being ‘picked off’.”
2See Dellarocas (2004).
1
Reputation Effects in Trading on the New York Stock Exchange
Abstract: Theory suggests that reputations, developed in repeated face-to-face interactions, allow non-anonymous, floor-based trading venues to attenuate adverse selection in the trading process. We identifyinstances when stocks listed on the New York Stock Exchange (NYSE) experience a non-trivial relocationon the trading floor for reasons unrelated to execution quality. Although the specialist follows the stock toits new location, most floor brokers do not. We use this natural experiment to determine whether reputationappears to affect trading costs. We find a discernable increase in the cost of liquidity in the days surroundinga stock’s relocation. The increase is more pronounced for stocks with higher adverse selection and greaterbroker turnover. Using NYSE audit-trail data, we find that the floor brokers relocating with the stock obtainlower trading costs than those brokers who do not move and those that begin trading post-move in the dayssurrounding the move. Together, these results suggest that reputation plays an important role in the liquidityprovision process on the floor of the NYSE.
Klein (1997) documents that reputations have played a role in facilitating trade since at least the
Middle Ages by reducing the informational asymmetry between buyers and sellers described in Akerloff
(1970). Diamond (1991), Boot, Greenbaum, and Thakor (1993), and Wilner (2000) each model the role of
reputation in different financial-market settings. Despite their perceived importance, however, there is little
direct empirical evidence as to the economic value of relationships in financial markets. De Jong, et al.
(1985) and others demonstrate the importance of reputations in experimental financial markets, but it is
difficult to generalize their results to real world settings. Carter and Manaster (1990) find that an
underwriter’s reputation is associated with the returns initial public equity offerings provide investors, but
there appears to be no empirical evidence of a reputation-effect in secondary equity markets.1 More recently,
researchers have documented the economic importance of electronic reputation systems in Internet auctions.2
Although these studies find customer and seller feedback ratings are economically important, they likely
3Granovetter (1985) notes that, although such generalized information is better than nothing, the best information arisesfrom an individual’s own dealings with others.
2
understate the value of repeated, face-to-face interactions.3 In this paper, we use a natural experiment to
evaluate the economic importance of relationships on the floor of the New York Stock Exchange (NYSE).
NYSE trading is organized so that all orders in a security go to one physical location on the floor
where exchange members wishing to trade that security gather. One individual, the specialist, trades only the
securities assigned to that location. Other individuals, floor brokers, might trade securities at several
locations but usually handle all of their brokerage firm’s orders in a particular security. The regular face-to-
face interactions between specialists and floor brokers and between different floor brokers allow reputations
to form – reputations that Benveniste, et. al. (1992), Pagano and Roell (1992), Chan and Weinstein (1993),
and Desgranges and Foucault (2005) argue play a role in a security’s trading process. If relationships are
important in attenuating adverse selection problems, then exogenous disruptions to these relationships
provide opportunities to examine their economic importance. We investigate the joint hypothesis that trading
relationships are important and that these relationships affect the trading process by examining the liquidity
costs for a sample of securities changing the location at which they trade on the floor of the NYSE.
Benveniste, Marcus, and Wilhelm (1992) develop a model of the specialist trading system in which
specialists improve the welfare of both exchange members and the investing public by reducing incentives
to exploit information advantages. Because of repeated dealings with floor brokers, specialists can impose
the cost of informed trading onto traders using private information to disadvantage other traders by assessing
sanctions (e.g., by providing less favorable future prices, by being less willing to improve quoted prices, or
by being less willing to fill large orders at quoted prices). If a trader bears the full cost of informed trading
instead of only the pro rata cost of such behavior, then that trader is less likely to impose adverse selection
costs on others. This ability to sanction allows specialists to narrow bid-ask spreads without reducing
market-making profitability. In a multi-period setting, Chan and Weinstein (1993) also conclude that

3
specialists can quote tighter bid-ask spreads because of repeated dealings with floor brokers. In their model,
specialists reward brokers revealing private information by providing them with information about standing
orders. This is in stark contrast to the single-period models of Kyle (1985) and others which, by design, do
not consider the benefits of cooperative behavior.
We identify reallocations of trading locations by specialist firms, reorganizations of the NYSE floor
due to specialist-firm mergers, and the opening of a new trading floor. None of these events are the result
of endogenous changes in trading costs or are associated with NYSE disciplinary actions. If the imminent
departure of a specialist from the current trading location suggests to floor brokers that the specialist cannot
sanction undesirable and/or reward desirable behavior in the future, then we might observe changes in trading
behavior in the days leading up to a stock’s relocation on the NYSE floor. Specifically, if the floor broker
will not be subject to a particular specialist’s power to sanction or reward (because the specialist moves and
the floor broker does not), then trading costs could increase prior to the move to compensate for the
possibility of additional adverse selection risk. In theory, the old equilibrium unravels when the change in
location is anticipated. If trading relationships matter and these relationships are not established
instantaneously at the new location, then the disruption in relationships caused by the relocation also might
manifest itself in a security’s trading for some time after the change in location. In summary, if relationships
are important, then we expect to find an increase in trading costs prior to and a disruption in the trading
process after the date that securities change location on the NYSE floor.
Alternatively, it is possible that the floor broker community is relatively unimportant to the specialist.
For example, relationships with individual floor brokers might be irrelevant because much of the trading
strategy is determined by traders at the brokerage firm's trading desk and not by the broker on the NYSE
floor. That is, knowing that investors and the broker's traders are unaffected by NYSE space reallocation
decisions, the specialist behaves no differently immediately before and after the change in location. In
addition, because floor brokers at the new location work for the same brokerage firms as those at the former
4
location, the specialist can punish/reward the new brokers for the behavior of their fellow employees at the
prior trading location. These arguments suggest there might be no change in trading behavior when a
security's trading location on the floor of the NYSE changes.
We begin our analysis by using proprietary NYSE data to demonstrate that individual floor brokers
typically do not follow a stock to its new trading location. We find that fewer than five percent of brokers
executing trades in a particular stock prior to its relocation also trade in the post-move sample period. This
verifies our claim that the move disrupts relationships. Next, using the NYSE Trade and Quote (TAQ)
database, we examine spreads around the time securities change their trading location on the floor of the
NYSE. We find a discernible increase in liquidity costs when a stock moves. Consistently with theory, the
increase in trading costs is positively related to the measured adverse selection and the broker turnover
associated with the moving security.
Using proprietary NYSE data, we examine the execution costs of individual floor brokers who do
and do not trade the stock at both locations. In the days just prior to the move, we find that pre-move trading
costs for brokers moving with the specialist to the stock's new trading location are somewhat less than the
trading costs faced by non-moving brokers. These two groups of brokers face similar trading costs in times
further from the relocation day. We also find that post-move trading costs paid by moving brokers are lower
than those paid by the brokers who are new to the trading crowd. This result is especially strong in the first
few days after the move when the specialist is trading with a new crowd and is true regardless of whether
the trade is between two moving brokers (who have dealt with each other previously) or between the
specialist and a moving broker (who also have traded with each other previously). Non-moving (new) brokers
are at a trading-cost disadvantage when trading with the specialist or with a non-moving broker. This result
is particularly strong in a multivariate setting for stocks with high levels of adverse selection. Together, these
results provide the first direct evidence that face-to-face relationships might give floor-based exchanges an
advantage over anonymous electronic trading systems in executing certain orders.

4 See, e.g., Chakravarty (2002), Venkataraman (2001), Garfinkel and Nimalendran (2003), Barclay, Hendershott andMcCormick (2003), Waisburd (2003), Bessembinder and Venkataraman (2004), Theissen (2000), and Handa, Schwartz and Tiwari(2004). Boehmer, Saar and Yu (2004), Madhavan and Panchapagesan (2000), Corwin and Lipson (2000), Coval and Shumway (2001)each present evidence that suggests the floor is informationally rich. Baker and Iyer (1992) examine trading crowds in a nationaloption exchange and find that network structure influences price volatility and expected trading volume. They interpret their resultsas suggesting that the structure of the real communication network among investors may influence market behavior.
5
Our results suggest that electronic venues may not render the floor-based NYSE obsolete. Although
electronic markets are faster and cheaper to operate and monitor than floor-based markets, a large empirical
literature suggests floor-based exchanges excel at handling orders that are potentially motivated by private
information.4 Our work is the first to empirically support theoretical arguments that individual relationships
are a source of this comparative advantage. Although face-to-face interactions appear to be a comparative
advantage of floor-based trading, it is not clear that this advantage alone outweighs the cost advantages and
potential anonymity available on electronic trading venues.
The rest of the paper is organized as follows. Section I develops the hypotheses to be tested and
introduces the data. Section II examines changes in trading costs around the specialist's location change using
publicly available trade and quote data. Section III reviews in detail the trades of the moving and non-moving
brokers using NYSE proprietary data. Section IV concludes.
I. Hypothesis Development, Data, and Microstructure Variables
A. Hypotheses Development.
The NYSE floor is organized to focus a security’s trading at one physical location. Each location
typically trades multiple securities; the exact number being determined by security characteristics such as
trading volume. One individual, the specialist, trades only at that location and is responsible for maintaining
a ‘fair and orderly’ market in the securities trading there. Other individuals, floor brokers, represent customer
trading interests. Sofianos and Werner (2000) find that NYSE floor brokers executed trades corresponding
to 44% of the value of all buys and sells in January and February of 1997. Because orders are time sensitive,

5Cao, Choe and Hatheway (1997), Corwin (1999), and Coughenour and Saad (2004) present evidence suggesting that astock’s trading characteristics are related to the specialist firm trading the stock.
6Chan and Weinstein (1993) reach similar conclusions, arguing specialists reward floor brokers that reveal privateinformation regarding their orders by offering them tighter bid-ask spreads on future trades. Carlin, Lobo, and Viswanathan (2004)theoretically conclude that “traders cooperate through repeated interactions providing liquidity to each other.”
6
the physical area a floor broker covers typically is limited to something less than the entire exchange floor.
In most cases, a floor broker executes all of their firm’s orders in a given stock. The organization of trading
on the NYSE suggests that specialists and floor brokers trade with each other repeatedly. Furthermore,
because trading on an exchange floor is face-to-face, the trading relationships among the floor community
are more likely to play a role in the trading process than in an anonymous electronic setting.5
Theory suggests that relationships between floor brokers and specialists have important implications
for the trading process observed on an exchange. Benveniste, Marcus and Wilhelm (1992) argue that repeated
face-to-face interactions on the floor of the NYSE allow specialists (and other floor brokers) to sanction floor
brokers who exploit private information.6 For example, floor brokers obtaining favorable transaction prices
by misrepresenting time-sensitive orders as liquidity trades to specialists or fellow floor brokers might find
those parties less willing to trade with them in the future. Benveniste et. al. (1992) argue that the ability to
sanction is important in constraining individual floor brokers from imposing adverse selection costs on the
specialist and/or other brokers in the crowd. In the days leading up to a specialist’s move, this constraint
becomes relaxed for floor brokers who do not plan to follow the specialist to the new location. Specifically,
floor brokers who do not expect to follow the specialist might become increasingly willing to trade on private
information. Anticipating this possibility, specialists and other floor brokers might become more cautious
when interacting with the floor brokers they expect to remain behind.
After the move is complete, the specialists and floor brokers regain their ability to sanction crowd
members trading on private information. That is, the new floor community will, for the foreseeable future,
be involved in repeated face-to-face trades. If the discipline argument is the sole driver of floor relationships,
then we would expect trading to return to normal immediately after stocks relocate. However, in addition to

7Our conclusions do not change when we use the proxies for adverse selection used by Bessembinder and Kaufman (1997),Stoll (2000), and Brennan and Subrahmanyam (1996).
7
the discipline hypothesis, we posit that traders have trading reputations that take time to build. Although he
focuses on borrower-lender relationships, Diamond (1989) presents a model in which reputation building
affects how agents behave, and as a result, equilibrium prices. Diamond shows that borrowers alter their
behavior to influence what lenders learn about them. Specifically, borrowers change their behavior to protect
good reputations. If there is sufficient adverse selection, Diamond demonstrates that it takes time for market
participants to build their reputations. In our setting, there typically are many new floor brokers in the crowd
following the relocation of a specialist. Until new relationships are formed between the old and new members
of the crowd, providing liquidity to new floor brokers is more risky than providing liquidity to those with
established reputations. This suggests that liquidity providers will offer less favorable prices for orders
handled by new floor brokers to compensate them for bearing the increased adverse selection risk.
Together, Benveniste et. al. (1992), Chan and Weinstein (1993) and Diamond (1989) suggest that
we should see changes in the trading process in the days leading up to and immediately following the
relocation of a specialist if crowd relationships are important in attenuating adverse selection. These theories
suggest that the effective spreads paid by orders handled by floor brokers that leave (join) the crowd
following a specialist’s relocation will rise (fall) in the days leading up to (following) the move. Although
these changes should occur in all relocated stocks, they should be most drastic in stocks with the highest
levels of asymmetric information and stocks with the greatest turnover in floor brokers. As in Huang and
Stoll (1997), we use the difference between the effective and realized spread as a proxy for the level of
asymmetric information in a stock to investigate this conjecture.7 Following Bacidore and Sofianos (2002)
and Huang and Stoll (1996), we construct a matched sample of stocks that do not move to control for changes
in effective and realized spreads that are unrelated to the specialist’s relocation.

8 A schematic of the floor can be seen at http://marketrac.nyse.com/mt/index.html.
8
B. Data.
Our analysis uses three primary databases. We begin by identifying changes in location on the
NYSE floor using ‘post and panel’ data obtained from the Exchange. We next use the NYSE’s Trade and
Quote (TAQ) database to analyze NYSE trading costs around the specialist relocations. Although these
trading cost tests do not provide the sharpest tests of our hypotheses, they provide insight into the overall
economic importance of stock relocations. Finally, we use proprietary consolidated equity audit-trail data
(CAUD) obtained from the NYSE to examine whether effective spreads for orders handled by floor brokers
that leave (join) the crowd following a specialist’s relocation rise (remain the same) in the days leading up
to (following) the move. The ‘post and panel’ data, the CAUD, and the TAQ data are described more fully
below.
The NYSE’s floor is divided into 20 (17 active) trading posts. Posts are subdivided into as many as
30 ‘panels,’ each with a specialist. Panels are so-named due to the flat-screen panel above the specialist that
lists the stocks trading at that location and other pertinent data. Thus, the combination of post (numbered one
through twenty) and panel (lettered beginning at A in each post) provides a unique location on the floor.8 For
example, as of January 2004 General Electric stock trades at Post 13 Panel M. It is the only stock trading
there. AOL and five other stocks are traded by a specialist at Post 3 Panel O. The NYSE’s post and panel
data provide daily information about where stocks trade beginning in June 1999. We obtain these data from
June 1999 through April 2003. To determine changes in location, we take the first difference of these data.
We are not interested in all changes in post and panel. We need the distance a stock moves to be
large enough to suggest a clear turnover in the crowd trading the stock. The floor of the Exchange is divided
into five ‘rooms.’ The ‘Garage’ contains posts one through four. The ‘Main Room’ consists of posts five
through eleven. Posts 12 through 14 are in the ‘Blue Room’ and posts 15 through 17 (currently inactive) are
in the ‘Extended Blue Room.’ Finally, ‘Thirty Broad’ contains posts 18 through 20. To be included in our

9There appears to be no publicly available official NYSE announcement stating that stocks will be changing locations.
9
sample, a stock must move from one room to another. It is common for floor brokers to be assigned to a
specific ‘room’ if the brokerage firm is large enough to have multiple brokers. This prevents a broker from
having to cover too much territory, which slows order placement. The broker typically works from a single
booth (e.g., the firm’s booth in the Main Room) regardless of the mix of stocks trading in that room. Thus,
if a stock changes rooms, it is likely to be traded in a different floor broker crowd than it was previously as
the brokers in the new room begin coverage. Our sample consists of all location changes from June, 1999
through April, 2003 involving an entire panel of stocks switching rooms. We require that the panel of stocks
remain constant (i.e., the specialist trades the same stocks before and after the switch in location). The fact
that the entire panel of stocks changes location suggests that the specialist and stocks did not change, but that
there is a potential change in the floor broker community.
We find six occasions during our sample period in which one or more panels of stocks remains
together after a room change. Table I summarizes our sample.
[Insert Table I.]
The July 1999, the June 2000, and the March 2002 events appear to be internal reorganizations by one or
more specialist firms.9 Although there are many of these reorganizations, these appear to be the only ones
resulting in a panel of stocks changing rooms. The majority of our sample of location changes occur on three
dates in 2000: November 20, December 11, and December 20. The November date is the opening of the 30
Broad trading floor, and the later two dates are apparently the result of specialist mergers. Specialist firms
prefer to trade stocks at contiguous posts/panels due to efficiencies that can be gained in support staff. Thus,
following specialist mergers, the Exchange typically reallocates space to accommodate the acquiring firm.
It is important to note that, to the best of our knowledge, these relocations are not due to the
specialist providing poor-quality executions. Specialists are monitored by the Exchange and evaluated by
floor brokers. Should the specialist provide unacceptable execution quality, the stock can be reallocated to

10
another specialist. This is not the case for our sample of relocations, which occur for reasons exogenous to
trading costs. As a result, this setting should provide a relatively clean test for economically meaningful
reputation effects.
To measure the broker turnover associated with these location changes, we acquire NYSE
consolidated equity audit-trail data. CAUD provides, among other information, the counter-parties to each
trade. For electronically submitted orders (SuperDOT), only the member firm’s name is provided. For trades
involving a floor broker, however, the broker’s badge number (both buyer and seller badge numbers if both
are floor brokers) is part of the record. The badge number uniquely identifies an individual member.
By examining CAUD for a period of time before and after the switch in location, we can estimate
how many floor brokers follow the specialist to the new location on the floor. We obtain audit-trail data for
two weeks before and after the switch. We assume that a broker trades at least once in each of those periods.
If that is not true, then we mis-classify that broker as one that did not move to the new location (trades before,
but not after) or one that began trading after the switch (trades after, but not before). Of the 915 broker
badges trading the sample stocks prior to their relocation, only 34 (3.7%) make trades in multiple rooms.
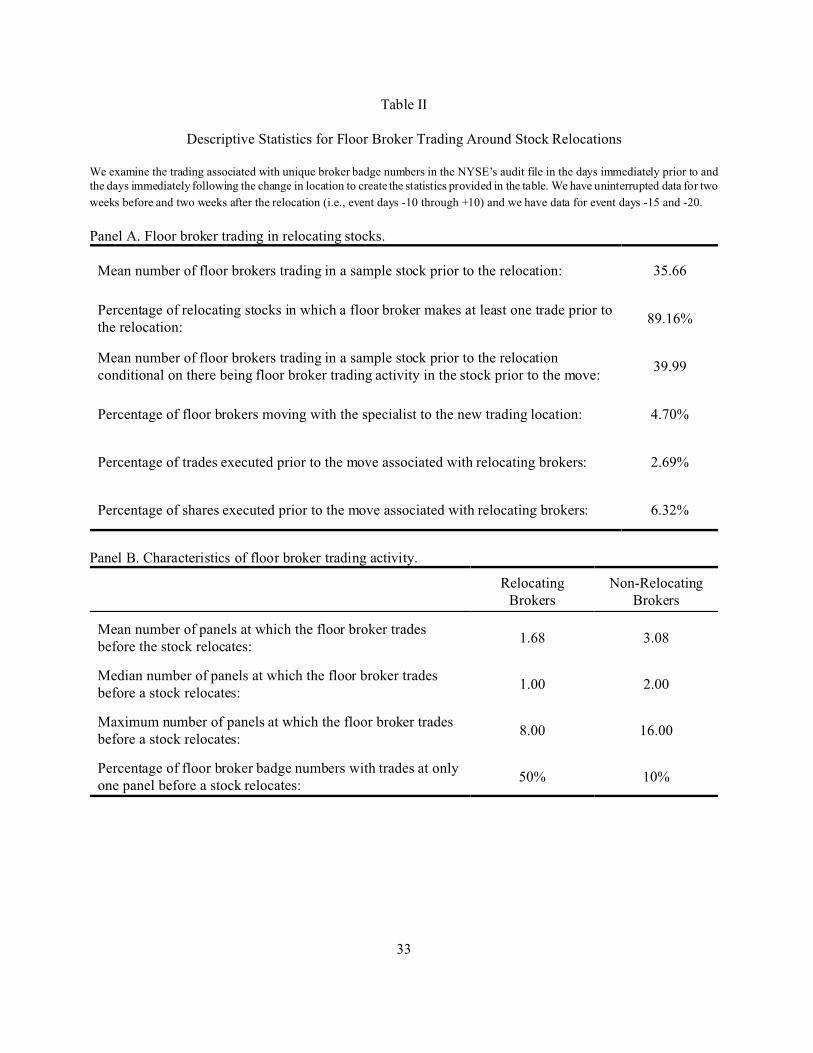
Thus, very few floor brokers normally trade in multiple rooms. Table II provides some descriptive statistics
regarding floor broker turnover around our sample relocations.
[Insert Table II.]
Prior to the switch date, the average sample stock has about 35 different floor brokers executing at
least one trade (40 conditional on a stock having at least one pre-move trade). On average, fewer than two
brokers (4.7% of the 35.66) appear in both the pre- and the post-switch trade data. These brokers participate
in about 2.7% of the trades, but trade 6.3% of the shares prior to the specialist’s move. Thus, floor brokers
following the specialist to the new location make fewer, but larger trades than the average floor broker.
In Panel B of Table II, we provide descriptive statistics regarding the pre-switch distribution of
trading by brokers that do and do not have trades in both the pre- and post- move sample periods. Note that

10See the NYSE’s TAQ2 User’s Guide for an in-depth description of the TAQ database.
11
moving brokers, on average, have their trading activity concentrated in fewer locations than non-moving
brokers (1.68 panels versus 3.08 panels). Fully one-half of the moving brokers trade at a single panel. For
these brokers, it is no surprise that they move to the new location.
We compute effective spreads, realized spreads, and the corresponding adverse selection measure
as in Huang and Stoll (1996) around specialist relocations using the NYSE’s TAQ database, which contains
intraday trades and quotes for all securities listed on the NYSE, the American Stock Exchange, and the
Nasdaq Stock Market. Each quote record indicates the underlying stock, the trading venue posting the quote,
the date and time of the quote, the bid and ask prices and quantities, and a condition code indicating whether
the quote is an opening or closing quote. Each trade record indicates the underlying stock, the date and time
the trade was reported, the venue reporting the trade, the transaction size and price, and codes indicating
whether the trade is subsequently cancelled or is made with ‘special’ conditions.10 Following Bessembinder
and Kaufman (1997) and others we eliminate trades with a Condition Code of ‘Z’ or ‘G’ and trades that have
a Correction Code that is not equal to zero or one. At each moment in the trading day, a stock’s National Best
Bid and Offer (NBBO) is computed by taking the highest bid and the lowest offer (i.e., the best prices)
quoted by venues on which the stock is traded. The computation of effective (realized) spreads requires
trades matched with the National Best Bid and Offer at (five minutes after) trades are reported.
C. Microstructure Variables.
Effective spreads are used to examine the impact of specialist relocations on trading costs. The
effective spread, which is the product of an indicator variable that equals 1 for buy orders and -1 for sell
orders and twice the difference between the trade price and the midpoint of the execution-time NBBO,
provides an estimate of the round trip cost of immediacy paid by liquidity demanders. Because the trade data
provided by TAQ do not identify transactions as buys or sells, we use the Lee and Ready (1991) algorithm
11Lee and Radhakrishna (2000), Odders-White (2000), and Finucane (2000) use the NYSE’s TORQ database to test theLee and Ready algorithm and document a success rate in excess of 85%.
12
to infer whether a trade is initiated by a buyer or seller.11 The Lee and Ready (LR) algorithm first attempts
to classify a trade as a buy or a sell by comparing the trade’s execution price to the prevailing quotes. Trades
with execution prices above (below) the midpoint of the execution-time bid and offer prices are classified
as buys (sells). To classify trades executed at the midpoint of the execution-time quotes, the LR algorithm
looks to prior trades. If the execution price of the prior trade is lower (higher) than the current trade’s
execution price, the current trade is classified as a buy (sell). If the prior trade has the same execution price
as the current trade, the LR algorithm moves backwards in time until it finds a prior trade with a different
price and follows similar logic. The realized spread, computed as the product of an indicator variable that
equals 1 for buy orders and -1 for sell orders and twice the absolute difference between the trade price and
the midpoint of the NBBO prevailing five minutes after a trade is executed, provides an estimate of the gross
trading revenue earned by liquidity providers. Finally, the adverse selection component of the spread as
defined by Huang and Stoll (1996) is the difference between the effective spread (i.e., what investors pay)
and the realized spread (i.e., what liquidity providers earn). Following Bacidore and Sofianos (2002) and
others, we standardize each of our microstructure variables by the execution-time NBBO midpoint to control
for variation in spreads due to residual differences in price levels.
To ensure that documented changes in trading costs are due to changes in the crowd (and not market
events), we compare spreads for stocks that change locations with spreads for a matched sample of stocks
that do not relocate. For each stock changing location, we find a similar, non-moving NYSE-listed security.
We match on the basis of market capitalization, share price, trade volume, and share price volatility. For
market capitalization, we use the year-end market capitalization from CRSP that immediately precedes a
stock’s relocation date. The remaining three matching variables are averages of daily values measured from
event-day minus 100 through event-day minus 50. Share price is the average closing price, trade volume is

13
the average number of trades in a day, and share price volatility is the natural log of the ratio of the high and
the low trade prices in a day. Following Bacidore and Sofianos (2002) and Huang and Stoll (1996), we find
the matching, non-moving stock that minimizes the following:
where ciMoving denotes the value of the ith matching variable for the relocating stock, and where ci
Non-Moving
denotes the value of the ith matching variable for the stock that does not change locations. This minimization
is done subject to the constraint that:
for all i (i.e., for each of our four matching characteristics).
Some of our tests compare effective and realized spreads across stocks. Because low-priced stocks
can have abnormally large relative spreads we eliminate relocating stocks and their controls on any day that
either stock’s average trade price is less than $5.00 per share. We also eliminate stock days on which the
relocating stock or its control have fewer than two trades. Table III provides descriptive statistics for our
sample and control stocks with these screens in place.
[Insert Table III.]
Both sets of stocks have an average share price of about $26 and have about 150 trades and 340,000 shares
traded daily during the sample period. The mean effective spread is six or seven cents and the mean realized
spread is about two cents.

14
II. NYSE Trading Costs around Stock Relocations.
Theory suggests that relationships between crowd members who plan to follow a relocating stock
and those who do not begin to break down as the relocation date nears. Theory also suggests that it takes time
and multiple interactions for relationships to form between members of the new crowd. In each of these
situations, the break-down of relationships creates greater adverse selection problems for liquidity providers
in the crowd. Thus, if relationships on the NYSE floor help attenuate adverse selection problems, then we
posit that trading costs (effective spreads) increase in the days leading up to a stock’s relocation, remain high
on the day the stock relocates, and then gradually decline in the days following the stock’s relocation.
As theory does not provide guidance as to when the relationships break down or evolve, we begin
computing spreads for each relocating stock and its match 50 trading days before and end 50 trading days
after the sample stock moves. We then test our hypothesis by examining the difference between the effective
spreads of the moving and non-moving stocks through time using standard event study methodology. We
include a stock pair (i.e., a relocating stock and its match) in our tests on an event day when the sample and
control stock each have two or more trades on the day and each have a trade-weighted average price that
equals or exceeds $5.00. The price screen decreases the chance that our results are driven by large percentage
spreads on low-priced stocks and the trading activity screen increases the reliability of our trading cost
estimates. The imposition of these screens on a daily basis, which maximizes the sample size on a given day,
implies that the sample size can change from day to day in our estimation period.
A. Relocation and Effective Spreads.
We begin by plotting the differences in relative effective spreads for sample and control stocks
around the sample stocks’ relocation on the NYSE floor. For each stock-pair in the sample on a given event
day, we subtract the matched stock’s share-weighted relative effective spread for the day from the sample
stock’s share-weighted relative effective spread on the same day. Because theory suggests larger trades are
most likely to be affected by disruptions to relationships, we aggregate effective spreads on a stock-day by

12We anticipate that the change in location causes an increase in spread variance, which will produce a test statistic rejectingthe null hypothesis of zero spread differences too frequently (see Brown and Warner, 1980 and 1985). We use the standardized cross-sectional test developed by Boehmer, Musumeci, and Poulsen (1991) to solve this problem. Each of the differences that are foundto be statistically significant with the standardized cross-sectional test is also found to be significant using the standard t-test. Theresults reported in the paper use the period from event day -120 through event day -80 as the base period. Similar results obtain whenwe use the period from event day -100 through event day -50 as the base period and when we use the standard t-test.
15
share-weighting effective spreads on individual trades. (Results are qualitatively identical when we trade-
weight.) We next find the median difference across all stock-pairs in the sample on that day. These
differences are plotted for event day -60 through event day +60 for the entire sample and for the group of
relocating stocks with above-median adverse selection costs in Figure 1.
[Insert Figure 1.]
Figure 1 presents evidence consistent with our hypothesis. We find that relative effective spreads
for the entire sample of relocating stocks and their controls are approximately equal in the period of time well
before and after the location change. Beginning about 40 to 45 trading days prior to the switch, relative
effective spreads for the relocating stocks increase versus their controls. From event day -5 through event
day +27 the median (mean) difference is about two (five) basis points. With an average sample stock price
of $26.80, a five basis point increase in relative effective spreads represents an increase in trading costs of
over $0.01 per share. Given that the average dollar effective spread is $0.0704, this represents an
economically significant increase in effective spreads of 19%.
[Insert Table IV.]
Table IV reports the results of cross-sectional t-tests (Wilcoxon tests) of the mean (median) spread
difference between relocating stocks and their controls for event days -55 through +55.12 Consistent with
results presented in Figure 1, we find evidence of statistically increased relative effective spreads for
relocating stocks versus their controls starting around event day -35 and ending after event day +35. This
suggests that the trading process is disrupted about seven weeks prior to the relocation and that it takes about
eight weeks for spreads to return to ‘normal’ after a location change. Thus, we find evidence consistent with

13We pick a different period of time than the period of time used to select our control stocks. Using the same period as weuse to select control stocks (days -100 through -50) produces nearly identical high/low designations.
16
an upward dislocation in trading costs in the time before the switch and elevated trading costs afterwards.
These results support the hypothesis that reputation effects matter in the trading process.
Theory suggests that the stocks for which relationships are most important are those with high levels
of adverse selection. In stocks with little private information, ending or starting a relationship should not
matter much. To investigate this intuition, we divide the sample of relocating stocks into two groups based
on their level of adverse selection. We measure adverse selection as the difference between the relocating
stocks’ effective and realized spreads on event days -120 through -80.13 If the effective spread is much larger
than the realized spread (i.e., the stock price moves in the liquidity demander’s favor post-trade), then we
conclude that there is substantial adverse selection. We divide the sample stocks into high and low adverse
selection sub-samples by comparing each relocating stock’s adverse-selection measure to the median
measure.
[Insert Table V.]
Table V contains descriptive statistics for characteristics of the high and low adverse selection sub-
samples relative to their matched stocks. Not surprisingly, the high adverse selection sub-sample of relocating
stocks has lower stock prices, fewer trades, and fewer shares traded than the overall sample. In addition, we
see that the high adverse selection sub-sample of relocating stocks has higher effective spreads and lower
realized spreads than their controls.
We repeat the event study for the high adverse selection sub-sample of relocating stocks. Figure 1
graphs the median differences in the stock pair’s daily share-weighted relative effective spreads. The pre-
and post-event difference in relative effective spreads is around three basis points. This is not surprising
because we rank relocating stocks based on their level of adverse selection well before the start of our event
study. Around the switch date, the difference increases to between 10 and 14 basis points. This represents
17
an increase in the spread difference of 7 to 11 basis points. The change is greater than the change documented
for the overall sample, which is consistent with the claim that reputations matter more for stocks with greater
adverse selection. Given the $17.14 average share price for the high-adverse-selection sample stocks, a ten
basis point increase translates into a 1.7 cent increase in effective spreads. Again, this is economically
significant when compared to an eight cent average effective spread. The difference in effective spreads
returns to its pre-relocation level by event day +50.
[Insert Table VI.]
As with the overall sample, we conduct statistical tests of the daily relative effective spread
differences in the period of time surrounding the relocation of stocks with above-median levels of adverse
selection and report the results in Table VI. The evidence of widening effective spreads for the high adverse
selection sub-sample is more convincing than that for the sample as a whole. With few exceptions, starting
45 days before the switch and continuing 35 days after the switch, the relocating stocks with high adverse
selection have relative effective spreads that are higher than their controls each day using at least one of the
statistical tests. These results are consistent with the hypothesis that reputations and relationships on the floor
of the NYSE are economically meaningful.
[Insert Figure 2.]
Finally, to address concerns that our results are driven by a few of the six events described in Table
I, we plot the differences in relative effective spreads between relocating stocks and their controls for the four
largest relocations in our sample in Figure 2. We exclude the two smallest relocations Because the daily
estimates of the median effective spread across 11 and 28 stocks are quite noisy. All of the four events (one
reallocation, two acquisitions, and one opening of a new floor) leave similar footprints in the data.
Benchmarked against their controls, the relative effective spreads of the relocating stocks begin to rise around
event day -35, level off around event day 0, and begin falling around event day 10. By event day 40, there

18
is little difference between the relative effective spreads of the relocating stocks and their controls. Figure
2 suggests the results presented in Figure 1, in Table IV, and in Table VI are not driven by one event.
B. Relocation and Realized Spreads.
We have demonstrated that the trading costs investors pay (the effective spread) increase prior to the
sample stocks’ relocation and continue at an elevated level for some time afterwards. This is consistent with
relationships being important in the trading process. We next investigate whether the increase in trading costs
paid by investors for immediacy translates into an increase in the trading revenue earned by liquidity
providers. We use the realized spread, which compares the trade price to the midpoint of the bid/ask spread
five minutes after the trade, as a proxy for gross trading revenue. If a liquidity provider buys (sells) and the
stock price falls (rises) during the five minutes following a trade, then the liquidity provider might lose all
or part of the effective spread paid by the liquidity demander at the time of the trade. Implicitly, this measure
assumes that on average, liquidity providers unwind their positions at the midpoint of the bid/ask spread
prevailing five minutes after they trade. An increase in the realized spread around the time of the change in
location would suggest that liquidity providers (including the specialist) can retain at least a portion of the
increase in effective spreads. Should the realized spread remain constant across the change, however, we
would conclude that the increase in effective spreads is just sufficient to offset additional adverse selection
costs. Finally, a decrease in realized spreads in the days preceding and immediately following stock
relocations would suggest that liquidity providers are harmed by the change in locations.
[Insert Figure 3.]
Figure 3 contains a plot of the daily median difference in the mean relative realized spread
(relocating stock minus control) for both the overall sample and the high-adverse-selection sub-sample. We
see little change in realized spreads around the relocation date; the realized spread differential seems to
fluctuate around zero. This suggests that the increase in effective spreads is approximately sufficient to
compensate liquidity providers for the higher levels of adverse selection in the market around location
14We choose the 75th percentile rather than the median as our break point because over 50% of the relocating stocks havezero brokers moving to the new location.
19
changes. Cross-sectional t-tests of the mean and Wilcoxon tests of the median realized spread difference
between relocating stocks and their controls for event days -50 through +50 confirm this conclusion (results
not reported).
C. Multivariate Analysis of the Differences in Relative Effective Spreads.
Thus far, we have shown that relative effective spreads for relocating stocks rise versus their controls
prior to the location change, remain elevated for some time, and then return to ‘normal’ levels. Consistently
with theory, this is particularly true for sample stocks with greater-than-median levels of adverse selection.
Realized spreads exhibit no such trend. To determine whether the effective spread result is robust in a
multivariate setting, we estimate the following regression equation:
)ESjt = " + $1(High ASj)(Event Time)2 + $2(Low MBj)(Event Time)2 + $3(AS Costsjt) +
$4() Trade Sizejt) + $5() # of Tradesjt) + $6() Trade Price Invjt) + $7(New Location Dummy) + ,jt, (1)
where )ESjt is the difference in the relative effective spreads for stock-pair j on event-day t, High ASj is a
binary variable taking the value of 1 if the relocating stock has a higher-than-median level of adverse
selection in the control period, (Event Time)2 is the event date squared, Low MBj is a binary variable taking
a value of 1 if the fraction of floor brokers following a stock to its new location is less than the 75th percentile
for relocating stocks and zero otherwise,14 AS Costsjt is the daily average of the difference between the
relocating stock’s effective and the realized spreads, ) Trade Sizejt is the difference in average trade sizes
for stock-pair j on event-day t, ) # of Tradesjt is the difference in the number of trades for stock-pair j on
event-day t, ) Trade Price Invjt is the difference in the inverses of the trade prices for stock-pair j on event
day t, and the New Location Dummy is a binary variable taking the value of 1 if event-day t is on or after the
20
relocation date and the value of 0 otherwise. We include fixed effects for each event day in the regression,
but we do not report those results.
Theory suggests that the estimates of $1 and $2 will be negative – consistent with a larger effect on
)ES (more curvature in the time series of differences in relative effective spreads) for relocating stocks with
high adverse selection and few relocating floor brokers. We already have documented the former effect in
a univariate setting. We hypothesize that relocating stocks with fewer brokers moving have more of a
turnover in the trading crowd, and therefore, have more disruption in the trading process. Trade size, trade
price, and the number of trades are control variables. The time series of the relocating stock’s adverse
selection is included to allow the level of adverse selection to change throughout the event window.
[Insert Table VII.]
Table VII contains the results of our multivariate analysis of the differences in effective spreads
around location changes. Each of the control variables is associated with differences in the effective spreads
of relocating stocks and their controls. Relative to their controls, relocating stocks have larger effective
spreads when they have larger trades than their controls, when they have more trades than their controls, and
when they have lower prices than their controls. The difference in effective spreads between moving stocks
and their controls is also directly related to the moving stock’s level of adverse selection during the event
period. Of particular interest, we see that the time series of differences in effective spreads (relocating stocks
minus their controls) is more extremely ‘humped’ for relocating stocks with high levels of adverse selection
costs and/or for moving stocks with few relocating floor brokers. We obtain similar results when the two
factors are considered separately (models 1 and 2), together (model 3), or together with an additional post
switch binary variable (model 4). These results are consistent with the hypothesis that reputations are useful
in countering the adverse selection problem on the floor of the NYSE.

21
D. Summary.
We find that disruptions to relationships on the NYSE floor are associated with increases in trading
costs. Relative to a matched sample of stocks that do not change location, our relocating stocks’ effective
spreads increase in the six to eight weeks prior to their move and remain elevated for several weeks after the
move. This increase in effective spreads is evident in both univariate and multivariate analyses. We
hypothesize that this dislocation is due to disruptions in trading relationships. Consistent with theory, we also
find that the increase in trading costs is positively related to the adverse selection of the relocating stock and
is inversely related to the fraction of brokers that relocate with the moving stock.
III. Analyses using Consolidated Audit-Trail Data.
The NYSE’s Consolidated Audit Trail Data allow us to examine the apparent effects of a change in
trading location on the NYSE in greater detail. Because we have floor broker badge numbers, we can study
the trading behavior of individual traders. We examine the trading behavior of brokers moving with the
specialist to the new location, brokers not moving (in the pre-move period), and brokers that begin trading
with the specialist in the post-move period. We also compute trading costs associated with trades between
parties who maintain a relationship and parties who have their relationship interrupted or establish a new
relationship. We expect that trades between the specialist and a floor broker that occur after a stock relocates
might enjoy lower trading costs when the specialist and the floor broker have had face-to-face interactions
in the past. It also is possible that floor brokers treat each other differently after the move. Trades between
relocating brokers might enjoy a level of comfort (i.e., a relationship) not evident when a relocating broker
trades with a new (i.e., non-moving) broker.
[Insert Table VIII.]
In Table VIII, we provide the across-stock average daily trading volume and trade size for selected
periods of time before and after the stock relocates on the floor of the NYSE for brokers moving with the

15We estimate this model with 2,319,198 observations and find that each of the coefficient estimates is significant at the0.0001 level.
22
stock and for brokers not moving with the stock. We equally-weight each sample stock. We find that the day
before the stock moves has the lowest volume and the smallest average trade size. This is consistent with the
claim that brokers modify their trading behavior anticipating being taken advantage of just prior to the
disruption in relationships.
If relationships matter, then trades involving moving brokers after stocks relocate should have less
price impact than trades involving brokers who did not relocate. To examine this, we estimate the following
equation using ordinary least squares:
where ) PRICE is the price of the trade of interest less the previous trade price (from CAUD), PRICE is the
transaction price of the trade of interest, TRADE QUANTITY is the number of shares the broker trades in the
trade of interest, MOVING BROKER DUMMY is a binary variable taking a value of 1 if the broker involved
in the trade transacts in the stock both before and after the move and a value of 0 otherwise, and HIGH AS
DUMMY is a binary variable taking a value of 1 if the stock in the trade of interest has a higher-than-median
level of adverse selection and a value of 0 otherwise.15 Given our estimates and a hypothetical 10,000 share
trade, we find that on average, a non-moving broker trading a low adverse selection stock has a price impact
of 12 basis points (our estimate of " is 0.00106 and our estimate of $ is 0.000000047). For trades in relocating
stocks with high levels of adverse selection, the average price impact for non-movers doubles (our estimate
of * is 0.00121). Finally, trades handled by moving brokers have five basis points less price impact (our
estimate of ( is -0.00049) on average. These results are consistent with the claim that relocating brokers use
their reputations to lessen the price impact of their trades.

23
To examine the cost of trading incurred by moving and non-moving brokers, we use CAUD to identify
trades in which a floor broker transacts with either the specialist or another floor broker. We then determine
whether the floor broker(s) involved in the trade follow the specialist to the new location or if the broker(s)
are non-mover(s). Prior to the relocation, non-moving brokers are brokers who cease to trade the stock after
the move. Following the relocation, many floor brokers are new to the trading crowd and must initiate new
relationships. For simplicity in exposition, we also refer to these new brokers as non-moving brokers. When
both counter-parties are floor brokers, we distinguish between trades in which both parties are moving brokers
and those trades in which one broker is a mover and the other a non-mover. Because Table VIII suggests that
there are differences between the types of trades of moving and non-moving brokers, we limit our univariate
analysis to stock-days on which both moving and non-moving brokers trade a given stock.
[Insert Table IX.]
We report the results of a statistical test for differences in the median share-weighted effective spreads for
trades involving moving and non-moving brokers in Table IX. Comparing the median effective spreads that
movers and non-movers pay when trading with the specialist in Panel A reveals that non-moving brokers pay
higher effective spreads for most days in the pre-move period (statistically so for days -8, -5, and -1) and
consistently in the four days following the relocation. The wider gap between movers’ and non-movers’
spreads is due to an increase in the non-movers’ spread around the event day. Movers’ spread remain
relatively constant (five-day averages of the movers’ median spreads is 22-23 basis points). This result is
consistent with the hypothesis that relocating brokers receive better trade prices from specialists than non-
moving brokers and that relationship is disrupted by the move.
Finally, we examine the effective spreads in trades between floor brokers around a stock’s relocation.
Although the Exchange monitors specialists regardless of where they trade on the floor, it is possible that the
relocation disrupts floor brokers’ ability to evaluate specialists and/or, in the specialist firm merger sub-
sample, makes it temporarily unclear which specialist firm (bidder or target) is required to monitor the

16 We thank Larry Harris for suggesting this.
24
specialist. If there is sufficient disruption in specialist monitoring, then specialists might try to gain an
advantage when taking one side of the trade. This should not, however, affect trades between floor brokers.16
In Panel B of Table IX, we examine trades between floor brokers. There is evidence that trades involving two
moving brokers have lower trading costs than trades involving one mover and one non-mover beginning seven
days prior to the move (except for day -2). On eight of the ten pre-move days, trades between movers have
lower effective spreads (significantly so on event days -7, -5, -4, and -2). Afterwards, the floor community
knows who moved with the stock and who is new. In other words, a relocating broker knows whether she is
trading with someone whom she is familiar with or not. We find that after stocks relocate, trades between two
moving brokers have lower effective spreads than trades between unfamiliar floor brokers for five of the first
six post-move trading days (significantly so on day +1, +2, and +5). Averaging the daily medians, we find
that the movers’ effective spreads are lowest in the period of time from event day -5 through event day +5.
These results provide more empirical evidence that reputations matter even if the specialist is not involved
in the trade.
Because moving and non-moving brokers have different characteristics in the pre-move period (e.g.,
moving brokers’ average trade size is about twice non-movers), we question whether the univariate analysis
presented in Table IX (despite conditioning) might simply reflect differences in stock characteristics. To
investigate this issue further, we conduct a multivariate analysis. Our goal is to understand the extent to which
relationships amongst floor brokers and between floor brokers and the specialist help to attenuate the adverse
selection problem faced by liquidity providers on the floor of the NYSE. Thus, we wish to explain the
effective spread of trades between floor brokers and specialists conditional on whether the floor broker
follows the specialist to the stock’s new trading location. Market microstructure theory suggests that we
should control for trade size, share price, and trading activity when trying to explain effective spreads. In
addition, we distinguish between stocks with above-median levels of adverse selection and those with below-

25
median levels. We also posit two time effects: one to distinguish the pre- and the post-move periods and
another to allow for a heightened difference close to the move date. Specifically, we estimate the following
regression:
ES = " + $1(Moving Broker) + $2(Moving Broker)(Event Time)2 + $3(Moving Broker)(High AS) +
$4(Moving Broker)(New Location Dummy) + $5(High AS) + $6(Trade Size) + $7(Trade Price Inv) +
$8(# of Trades) + $9(New Location Dummy) + ,, (2)
where ES is the effective spread of the trade of interest, Moving Broker is a binary variable taking a value of
one if the broker associated with the trade of interest moves with the specialist and a value of zero otherwise,
High AS is a binary variable taking a value of one if the stock being traded has higher-than-median adverse
selection costs and a value of zero otherwise, New Location Dummy is a binary variable taking a value of one
if the trade occurs after the stock has relocated and a value of zero otherwise, Trade Size is the size of the
trade in shares, Trade Price Inv is the inverse of the transaction price, and # of Trades is the number of trades
in the stock-day of interest. We expect that trades facilitated by moving brokers will have lower costs (i.e.,
$1 < 0). Because we expect that relationships are more important when trading stocks with above-median
levels of adverse selection, we interact the Moving Broker and the High AS variables and expect that $3 < 0.
We interact the Moving Broker variable with event date squared to allow for a non-linear trend in effective
spreads around the change in location. If concerns about adverse selection increase just prior to the move and
if time is required for the specialist to become familiar with new traders after the move, then we expect the
trading cost advantage moving brokers enjoy over non-moving brokers to diminish over time (i.e., $2 > 0). We
allow for a discontinuity in the association between moving brokers and the effective spreads by interacting
the moving broker and the new location dummy variables. Finally, all else equal, we expect that effective
spreads are higher for trades that are large, for trades in low priced stocks, for trades in low volume stocks,

26
and for trades in stocks with high adverse selection costs. We include all trades involving a floor broker as
one party and either another floor broker or a specialist as the counter-party in the regression.
[Insert Table X.]
As expected, large trades and trades with a low share price have higher effective spreads than small
trades and trades in higher priced stocks (i.e., both $6 and $7 are greater than zero). Trades in stocks with high
adverse selection tend to have higher effective spreads than trades in stocks with lower levels of adverse
selection, but the overall difference is not significant. Turning to the variable of interest, we find that moving
brokers enjoy significantly lower (statistically and economically) effective spreads than non-moving brokers
when we differentiate the pre- and post-move periods. This advantage is particularly strong in stocks where
the adverse selection problem is more severe. For high adverse selection stocks, moving brokers trade with
effective spreads that are 16 basis points ($1 + $3 + $4) less than non-movers on the event date. For a $15.00
stock, this translates into a cost advantage of $0.024. As we move further away from the event day in either
direction, the advantage enjoyed by the moving brokers dissipates ($2 is positive). This is consistent with the
idea that specialists become more concerned about end-game problems in the pre-move period and gradually
learn the trading styles of new brokers after they relocate. If the trend we identify in the ten post-move days
of CAUD data we analyze continues, then the advantage relocating brokers enjoy over new brokers in stocks
with above-median levels of adverse selection vanishes about 21 days after the move. Moving brokers have
no advantage over new brokers in trading stocks with below-median levels of adverse selection after a stock
relocates (i.e., $4 is approximately equal to $1 in absolute value). Thus, we conclude that relocating brokers
enjoy lower trading costs than brokers that do not follow stocks with high levels of adverse selection to their
new locations even when we control for other factors known to influence effective spreads. This is yet more
evidence suggesting reputations play a role in the trading process on the floor of the NYSE.

27
IV. Conclusion.
This paper explores whether relationships on the floor of the NYSE play an economically important
role in the trading process. To test this hypothesis, we identify instances in which stocks change trading
locations (move to different rooms) on the NYSE floor for exogenous reasons. For the relocations we study,
the specialist and the set of stocks are held constant but the floor community changes dramatically. We find
an economically and statistically meaningful increase in trading costs as measured by relative effective
spreads in the days leading up to and following the relocation of stocks on the NYSE floor versus a matched
sample of stocks that do not move. This effect is strongest for stocks where the adverse selection problem is
most severe. This result suggests that relationships on the floor of the NYSE are economically important.
Using proprietary consolidated audit trail data from the NYSE, we document more direct evidence
that the floor of the NYSE fosters relationships that help to overcome the adverse selection problems inherent
in equity trading. Specifically, we find that floor brokers that maintain their relationship with the specialist
when a set of stocks relocate between rooms on the floor of the NYSE obtain better execution prices than the
floor brokers that terminate relationships when stocks leave their old location or begin relationships when
stocks trade at their new location. Finally, we find that trades involving a moving and a non-moving floor
broker that occur after a stock changes its location have higher effective spreads than similar trades between
floor brokers that followed the stock to its new location. Together, these results suggest that reputations
nurtured on the floor of the NYSE play an economically important role in the trading process. More generally,
these results provide an economic justification for floor-based exchanges.
Whether the advantages to non-anonymous trading are sufficient to overcome the cost advantages of
electronic trading is an empirical question. Even for stocks with relatively high levels of adverse selection,
we find that effective spreads increase by little more than ten basis points in the days surround a stock’s
relocation. It is possible that the efficiency of electronic exchanges more than offsets this difference.
Conversely, our estimates of the advantage of repeated interactions on the floor of the NYSE may understate

28
the economic benefit. On the NYSE, the specialist’s obligation to provide liquidity does not change when a
stock relocates. Because we estimate the value of relationships in a constrained environment, our estimates
may not fully capture the value of face-to-face trading in markets without constraints.

29
References
Akerloff, George, 1970, The market for lemons: Quality uncertainty and the market mechanism, QuarterlyJournal of Economics 84, 488-500.
Bacidore, Jeffery and George Sofianos, 2002, Liquidity provision and specialist trading in NYSE-listed Non-U.S. stocks, Journal of Financial Economics 63, 133-158.
Baker, Wayne and Ananth Iyer, 1992, Information networks and market behavior, Journal of MathematicalSociology 15, 305-332.
Barclay, Michael, Terrence Hendershott and D. Timothy McCormick, 2003, Competition among tradingvenues: Information and trading on electronic communications networks, Journal of Finance 58, 2639-2667.
Benveniste, Lawrence, Alan Marcus and William Wilhelm, 1992, What’s so special about the specialist?,Journal of Financial Economics 32, 61-86.
Bessembinder, Hendrik and Herbert Kaufman, 1997, A cross-exchange comparison of execution costs andinformation flow for NYSE-listed stocks, Journal of Financial Economics 46, 293-319.
Bessembinder, Hendrik and Kumar Venkataraman, 2004, Does an electronic stock exchange need an upstairsmarket?, Journal of Financial Economics 73, 3-36.
Boehmer, Ekkehart, Jim Musumeci and Annette Poulsen, 1991, Event-study methodology under conditionsof event-induced variance, Journal of Financial Economics 30, 253-272.
Boehmer, Ekkehart, Gideon Saar and Lei Yu, 2004, Lifting the veil: An analysis of pre-trade transparencyat the NYSE, Journal of Finance, forthcoming.
Boot, Arnoud, Stuart Greenbaum and Anjan Thakor, 1993, Reputation and discretion in financial contracting,American Economic Review 83, 1165-1183.
Brennan, Michael and Avanidhar Subrahmanyam, 1996, Market microstructure and asset pricing: On thecompensation for illiquidity in stock returns, Journal of Financial Economics 38, 361-382.
Brown, Stephen and Jerold Warner, 1980, Measuring security price performance, Journal of FinancialEconomics 8, 205-258.
Brown, Stephen and Jerold Warner, 1985, Using daily stock returns: The case of event studies, Journal ofFinancial Economics 14, 3-31.
Cao, Charles, Hyuk Choe and Frank Hatheway, 1997, Does the specialist matter? Differential execution costsand inter-security subsidization on the NYSE, Journal of Finance 52, 1615-1640.
Carlin, B., M. Lobo and S. Viswanathan, 2004, Episodic Liquidity Crises: The Effect of Predatory andCooperative Trading, Working Paper, Duke University.

30
Carter, Richard and Steven Manaster, 1990, Initial public offerings and underwriter reputation, Journal ofFinance 45, 1045-1067.
Chakravarty, Sugato, 2002, Stealth-trading: Which traders’ trades move stock prices?, Journal of FinancialEconomics 61, 289-307.
Chan, Yuk-Shee and Mark Weinstein, 1993, Bid-ask spread and market structure, Financial Analysts Journal,57-62.
Cohen, Randolph, 2003, Dimensional Fund Advisors - 2002, Harvard Business School Case No. 9-203-026,Harvard Business School Publishing, Boston, Mass.
Corwin, Shane, 1999, Differences in trading behavior across NYSE specialist firms, Journal of Finance 54,721-745.
Corwin, Shane and Marc Lipson, 2000, Order flow and liquidity around NYSE trading halts, Journal ofFinance 55,1771-1801.
Coughenour, Jay and Mohsen Saad, 2004, Common market makers and commonality in liquidity, Journal ofFinancial Economics 73, 37-69.
Coval, Joshua and Tyler Shumway, 2001, Is sound just noise?, Journal of Finance 56, 1887-1910.
DeJong, Douglas, Robert Forsythe and Russell Lundholm, 1985, Ripoffs, lemons, and reputation formationin agency relationships: A laboratory market study, Journal of Finance, 40, 809-820.
Dellarocas, Chrysanthos, 2004, The digitization of word-of-mouth: Promises and challenges of onlinefeedback, Working Paper, Massachusetts Institute of Technology.
Desgranges, Gabriel, and Thierry Foucault, 2005, Reputation-based pricing and price improvements indealership markets, Working Paper, University of Cergy.
Diamond, Doug, 1989, Reputation in debt markets, Journal of the Political Economy 97, 828-862.
Diamond, Doug, 1991, Monitoring and reputation: The choice between bank loans and directly placed debt,Journal of Political Economy 99, 689-721.
Finucane, Thomas, 2000, A direct test of methods for inferring trade direction from intra-day data, Journalof Financial and Quantitative Analysis 35, 553-576.
Garfinkel, Jon and Mahendrarajah Nimalendran, 2003, Market structure and trader anonymity: An analysisof insider trades, Journal of Financial and Quantitative Analysis 38, 591-610.
Granovetter, Mark, 1985, Economic action and social structure: The problem of embeddedness, The AmericanJournal of Sociology 91, 481-510.
Handa, Puneet, Robert Schwartz and Ashish Tiwari, 2004, The economic value of a trading floor: Evidencefrom the American Stock Exchange, Journal of Business 77, 331-355.

31
Huang, Roger and Hans Stoll, 1996, Dealer versus auction markets: A paired comparison of execution costson Nasdaq and the NYSE, Journal of Financial Economics 41, 313-357.
Huang, Roger and Hans Stoll, 1997, The components of the bid-ask spread: A general approach, Review ofFinancial Studies 10, 995-1034.
Klein, Daniel, ed., 1997, Reputation: Studies in the voluntary elicitation of good conduct, Ann Arbor:University of Michigan Press.
Kyle, Albert, 1985, Continuous auctions and insider trading, Econometrica 53, 1315-1336.
Lee, Charles and Balkrishna Radhakrishna, 2000, Inferring investor behavior: Evidence from TORQ data,Journal of Financial Markets 3, 183-204.
Lee, Charles and Mark Ready, 1991, Inferring trade direction from intraday data, Journal of Finance 46, 733-746.
Madhavan, Ananth and Venkatesh Panchapagesan, 2000, Price discovery in auction markets: A look insidethe black box, Review of Financial Studies 13, 627-658.
Odders-White, Elizabeth, 2000, On the occurrence and consequences of inaccurate trade classification,Journal of Financial Markets 3, 259-286.
Pagano, Marco and Ailsa Roell, 1992, Auction and dealership markets: What is the difference?, EuropeanEconomic Review 36, 613-623.
Sofianos, George and Ingrid Werner, 2000, The trades of NYSE floor brokers, Journal of Financial Markets3, 139-176.
Stoll, Hans, 2000, Friction, Journal of Finance 55, 1479-1514.
Theissen, Eric, 2000, Market structure, informational efficiency and liquidity: An experimental comparisonof auction and dealer markets, Journal of Financial Markets 3, 333-363.
Venkataraman, Kumar, 2001, Automated versus floor trading: An analysis of execution costs on the Paris andNew York Stock Exchanges, Journal of Finance 56, 1445-1485.
Waisburd, Andrew, 2003, Anonymity and liquidity: Evidence from the Paris Bourse, Working Paper, NeeleySchool of Business, Texas Christian University.
Wilner, Benjamin, 2000, The exploitation of relationships in financial distress: The case of trade credit,Journal of Finance 55, 153-178.

32
Table I
Descriptive Statistics for Relocating Stocks
On the dates listed below, the indicated number of stocks changed the location at which they trade on the floor of the NYSE. The moveinvolves the entire panel of stocks moving to a new room on the floor and continuing to trade as one panel. The apparent reason forthe relocation is indicated. Our data cover the period from July 1999 through April 2003.
DateNumber of
Relocating StocksApparent Reason for Relocation
July 28, 1999 11 Internal reallocation by Fleet
June 1, 2000 100Internal reallocations by LaBranche, Fleet, andSusquehanna
November 20, 2000 410 Opening of new trading floor at 30 Broad Street
December 11, 2000 380 Spear Leeds acquires Benjamin Jacobson
December 20, 2000 167 Fleet acquires Meehan
March 25, 2002 28Internal reallocations by Performance, Susquehanna, andVan Der Moolen
33
Table II
Descriptive Statistics for Floor Broker Trading Around Stock Relocations
We examine the trading associated with unique broker badge numbers in the NYSE’s audit file in the days immediately prior to andthe days immediately following the change in location to create the statistics provided in the table. We have uninterrupted data for two
weeks before and two weeks after the relocation (i.e., event days -10 through +10) and we have data for event days -15 and -20.
Panel A. Floor broker trading in relocating stocks.
Mean number of floor brokers trading in a sample stock prior to the relocation: 35.66
Percentage of relocating stocks in which a floor broker makes at least one trade prior tothe relocation:
89.16%
Mean number of floor brokers trading in a sample stock prior to the relocationconditional on there being floor broker trading activity in the stock prior to the move:
39.99
Percentage of floor brokers moving with the specialist to the new trading location: 4.70%
Percentage of trades executed prior to the move associated with relocating brokers: 2.69%
Percentage of shares executed prior to the move associated with relocating brokers: 6.32%
Panel B. Characteristics of floor broker trading activity.
RelocatingBrokers
Non-RelocatingBrokers
Mean number of panels at which the floor broker tradesbefore the stock relocates:
1.68 3.08
Median number of panels at which the floor broker tradesbefore a stock relocates:
1.00 2.00
Maximum number of panels at which the floor broker tradesbefore a stock relocates:
8.00 16.00
Percentage of floor broker badge numbers with trades at onlyone panel before a stock relocates:
50% 10%

34
Table III
Descriptive Microstructure Statistics for Relocating and Matched Control Stocks
The sample stocks changed the room on the floor of the NYSE in which they trade between July 1999 and April 2003. An entire panelof stocks made the switch and continued to trade as a panel after the relocation. Each sample stock is matched with a non-moving stockon the basis of market capitalization, share price, trading volume, and share price volatility. The statistics provided below are estimatedusing data from event day -100 through event day -50. We characterize the distribution of daily averages of various microstructurestatistics for both relocating and for matched stocks below.
Mean Median Std. Dev Minimum Maximum
Trade-WeightedAverage Price
Sample $26.80 $22.41 $20.13 $5.00 $195.53
Control $26.22 $22.60 $18.03 $5.00 $181.04
Share-WeightedAverage Price
Sample $26.80 $22.41 $20.13 $5.00 $195.56
Control $26.22 $22.60 $18.02 $5.00 $180.84
Average # of Trades Per Day
Sample 156 41 310 2 3,612
Control 150 41 287 2 3,908
Average # of SharesTraded Per Day
Sample 342,471 47,000 1,137,852 200 83,995,400
Control 334,418 49,500 914,421 200 24,106,600
Trade-WeightedEffective Spread
Sample $0.0603 $0.0463 $0.0566 $0.0000 $2.7251
Control $0.0598 $0.0456 $0.0488 $0.0000 $2.3851
Trade-WeightedRealized Spread
Sample $0.0226 $0.0187 $0.0516 -$1.4848 $3.2210
Control $0.0231 $0.0194 $0.0459 -$0.9268 $4.0169
Share-WeightedEffective Spread
Sample $0.0704 $0.0550 $0.0644 $0.0000 $2.7563
Control $0.0700 $0.0545 $0.0578 $0.0000 $2.2109
Share-WeightedRealized Spread
Sample $0.0219 $0.0174 $0.0604 -$3.4223 $3.2375
Control $0.0216 $0.0177 $0.0515 -$1.6672 $4.0495

35
Table IV
Differences in the Share-Weighted Relative Effective Spreads of Relocating Stocks and Their Controls
Control stocks are selected based on market capitalization, share price, trading volume, and stock price volatility. To compute thereported number, we take the difference between the average share-weighted relative effective spread of the stock moving to a newlocation and the corresponding control stock that does not relocate. Sample stocks relocate on event day 0. The statistical test for themean difference being positive is conducted using the Boehmer, Musumeci, and Poulsen (1991) t-statistic with the period -120 to -80as the base period. Each of the differences that are found to be statistically significant with the standardized cross-sectional test is alsofound to be significant using the standard t-test. We use the Wilcoxon test to examine the differences in medians.
Event Time(days)
Difference in Basis Points Event Time(days)
Difference in Basis Points
Mean Median Mean Median
-55 2.43* 0.57* 0 6.05* 2.60**
-45 1.38 0.38 1 5.87* 2.57**
-35 3.58** 1.39* 2 4.58 3.01**
-25 3.65** 1.12* 3 6.63** 3.00**
-20 1.00 1.06* 4 6.00** 2.20**
-19 2.81** 1.49* 5 5.30** 1.83
-18 4.19** 2.29* 6 5.37** 3.08**
-17 3.23** 1.45* 7 4.62** 3.00**
-16 4.42** 1.69* 8 5.50 3.07**
-15 5.39** 1.74* 9 4.97** 2.61**
-14 4.12** 2.39** 10 4.63** 1.65*
-13 4.57** 2.49** 11 3.85** 1.34
-12 3.89** 1.50* 12 6.96** 1.96*
-11 2.99 1.05 13 3.96** 2.80*
-10 4.17** 1.92* 14 6.43** 2.37*
-9 3.65** 1.80* 15 4.65** 1.92*
-8 3.93* 1.71* 16 4.34 2.29*
-7 4.52* 1.42 17 5.26** 2.47**
-6 3.66** 1.62* 18 4.86** 2.15**
-5 4.10** 2.11** 19 4.97* 1.94*
-4 4.53 2.46** 20 7.10** 2.97*
-3 6.81** 2.68** 35 4.45* 1.40*
-2 4.41** 1.28* 45 2.90* 0.67
-1 7.84 2.36** 55 1.92 -0.92
* The difference is statistically significant at the .95 confidence level.** The difference is statistically significant at the .99 confidence level.

36
Table V
Descriptive Microstructure Statistics for Relocating with High Adverse Selection and Their Controls
The sample stocks changed the room on the floor of the NYSE in which they trade between July 1999 and April 2003. An entire panelof stocks made the switch and continued to trade as a panel after the relocation. Each sample stock is matched with a non-moving stockon the basis of market capitalization, share price, trading volume, and share price volatility. Adverse selection is measured as thedifference between the sample stocks’ effective and realized spreads on event days -120 through -80. Our sample of high adverseselection stocks is comprised of relocating stocks with higher than the median level of adverse selection. The statistics provided beloware estimated using data from event day -100 through event day -50. We characterize the distribution of daily averages of variousmicrostructure statistics for both relocating and for matched stocks below.
Mean Median Std. Dev Minimum Maximum
Trade-WeightedAverage Price
Sample $17.14 $14.57 $10.92 $5.00 $145.95
Control $17.36 $14.71 $10.62 $5.00 $114.22
Share-WeightedAverage Price
Sample $17.14 $14.57 $10.92 $5.00 $145.66
Control $17.35 $14.70 $10.60 $5.00 $114.22
Average # of Trades Per Day
Sample 32 12 66 2 1,943
Control 30 12 63 2 1,982
Average # of SharesTraded Per Day
Sample 70,087 11,200 254,008 200 7,278,300
Control 65,465 12,200 225,947 100 13,718,300
Trade-WeightedEffective Spread
Sample $0.0715 $0.0553 $0.0654 $0.0000 $2.7251
Control $0.0669 $0.0497 $0.0598 $0.0000 $2.3851
Trade-WeightedRealized Spread
Sample $0.0252 $0.0210 $0.0590 -$1.1650 $3.2210
Control $0.0288 $0.0243 $0.0608 -$0.9268 $4.0169
Share-WeightedEffective Spread
Sample $0.0814 $0.0625 $0.0739 $0.0000 $2.7562
Control $0.0755 $0.0565 $0.0681 $0.0000 $2.2109
Share-WeightedRealized Spread
Sample $0.0245 $0.0194 $0.0651 -$0.8490 $3.2375
Control $0.0273 $0.0228 $0.0647 -$1.6672 $4.0495

37
Table VIDifferences in the Share-Weighted Relative Effective Spreads of Relocating Stocks with High Adverse
Selection and Their ControlsControl stocks are selected based on market capitalization, share price, trading volume, and stock price volatility. To compute thereported number, we take the difference between the average share-weighted relative effective spread of the stock moving to a newlocation and the corresponding control stock that does not relocate. Sample stocks relocate on event day 0. Adverse selection ismeasured as the difference between the sample stocks’ effective and realized spreads on event days -120 through -80. Our sample ofhigh adverse selection stocks is comprised of relocating stocks with higher than the median level of adverse selection. The statisticaltest for the mean difference being positive is conducted using the Boehmer, Musumeci, and Poulsen (1991) t-statistic with the period-120 to -80 as the base period. Each of the differences that are found to be statistically significant with the standardized cross-sectionaltest is also found to be significant using the standard t-test. We use the Wilcoxon test to examine the differences in medians.
Event Time(days)
Difference in Basis Points Event Time(days)
Difference in Basis Points
Mean Median Mean Median
-55 6.70 6.35 0 17.73** 10.53**
-45 7.59* 5.39* 1 13.08* 10.08**
-35 9.65** 7.93* 2 11.77 12.82**
-25 12.75* 8.48* 3 16.53** 11.21**
-20 9.15** 8.55* 4 15.55* 10.19**
-19 10.96** 7.46 5 14.67** 10.59**
-18 13.13** 11.59** 6 15.17** 11.20**
-17 9.44** 8.72 7 13.63** 11.16**
-16 11.92** 9.93* 8 11.08 13.22**
-15 12.24* 9.58* 9 13.34** 8.70
-14 10.34** 9.47* 10 14.44** 12.75**
-13 13.15** 11.23** 11 10.37 5.72
-12 9.59 9.75 12 17.10** 7.39**
-11 11.29** 6.51 13 12.24** 10.40**
-10 12.34* 9.98** 14 18.74** 11.82**
-9 8.67 8.40** 15 12.37** 6.76
-8 13.17** 9.25** 16 10.10** 7.86
-7 12.74 8.00** 17 13.11** 9.63**
-6 11.41* 9.65** 18 14.89** 10.13**
-5 10.61* 10.24** 19 10.79 6.60
-4 11.85 9.41 20 16.49* 10.41**
-3 14.95** 11.14** 35 11.86* 9.27*
-2 14.41** 10.04** 45 8.64* 6.68
-1 17.17** 8.56* 55 8.87 2.06
* The difference is statistically significant at the .95 confidence level.** The difference is statistically significant at the .99 confidence level.

38
Table VII
Multivariate Analysis of Differences in the Relative Effective Spreads of Relocating Stocks and Their Controls Around Location Changes
The dependent variable is the difference in the relative effective spreads of a relocating stock and its control. The estimates shown areobtained from a fixed effects (event time) regression model. High AS is a binary variable taking the value of 1 if the relocating stockhas higher-than-median level of adverse selection. Low MB is a binary variable taking the value of 1 if the fraction of NYSE floorbrokers following a stock to its new location is less than the 75th percentile for relocating stocks. (High AS)(Event Time)2 is aninteractive variable between the High AS and the square of event time relative to the switch date. (Low MB)(Event Time)2 is aninteractive variable between Low MB and the square of event time relative to the switch date. AS costs is the daily average of thedifference between the effective and the realized spread for relocating stocks. Difference in Trade Size is the daily average differencebetween the trade size (in shares) of relocating stocks and their controls. Difference in # of Trades is the daily average differencebetween the number of trades in relocating stocks and their controls. Difference in Trade Price is the daily average difference betweenthe inverse of the trade price of relocating stocks and their controls. New Location Dummy is a binary variable taking the value of 1for trades occurring on trading days after the location change. T statistics are shown in parentheses.
Model 1 Model 2 Model 3 Model 4
Constant-0.09**
(-21.62)-0.08**
(-19.08)-0.08**
(-20.07)-0.09**
(-20.03)
(High AS)(Event Time)2 x 10⁶ -2.24**(-5.58)
-2.11**(-5.28)
-2.11**(-5.27)
(Low MB)(Event Time)2 x 10⁶ -1.60**(-8.12)
-1.34**(-7.17)
-1.35**(-7.25)
AS Costs0.47**
(22.12)0.46**
(23.01)0.47**
(22.13)0.47**
(22.09)
(Difference in Trade Size) x 106 0.92*(2.42)
0.90*(2.37)
0.90*(2.39)
0.89*(2.38)
(Difference in # of Trades) x 106 1.10**(4.40)
1.12**(4.49)
1.03**(4.13)
1.00**(4.01)
(Difference in Trade Price Inverse)x 106
3.08**(57.45)
3.08**(57.18)
3.08**(57.56)
3.06**(56.12)
New Location Dummy0.02**
(11.52)
# of Observations 202,994 202,994 202,994 202,994
R2 0.22 0.22 0.31 0.31
* The difference is statistically significant at the .95 confidence level.** The difference is statistically significant at the .99 confidence level.

39
Table VIII
Descriptive Statistics for Floor Trades Surrounding the Relocation of Stocks on the NYSE
Using the information available in the NYSE’s Consolidated Equity Audit (CAUD) file, we classify counter-parties to trades as ‘moving’ or ‘non-moving’ brokers. Moving brokers(MB) participate in trades before and after a sample stock relocate on the NYSE floor. Non-moving brokers (NMB) participate in trades only during the pre-move or the post-move period.Event time is measured relative to the day on which the relocating stock first trades at its new location. By design, the specialist (SPEC) follows relocating stocks to their new location.
Panel A: Average daily trading volume (in thousands).
Event Time
-10 through -6 -5 through -2 -1 0 +1 +2 through +5 +6 through +10
MB vs. SPEC 2,622 3,247 3,091 2,548 2,629 2,379 3,021
MB vs. MB 10,041 10,818 8,721 10,856 10,895 7,879 9,758
MB vs. NMB 10,615 11,193 7,359 10,383 9,864 9,358 12,364
NMB vs. NMB 28,488 24,366 17,573 23,769 27,117 36,362 24,953
NMB vs. SPEC 12,098 11,722 9,058 10,728 9,349 10,077 10,973
All MB 23,281 25,258 19,171 23,787 23,088 19,616 25,144
All NMB 51,201 47,281 33,990 44,580 46,329 55,797 48,290
Panel B: Average trade size (shares).
Event Time
-10 through -6 -5 through -2 -1 0 +1 +2 through +5 +6 through +10
MB vs. SPEC 6,999 7,185 7,041 6,941 5,895 6,663 7,264
MB vs. MB 23,009 22,414 20,765 25,543 22,604 21,129 24,138
MB vs. NMB 5,706 5,414 5,403 5,708 6,216 6,376 5,412
NMB vs. NMB 8,515 8,313 7,167 9,125 10,338 8,327 7,862
NMB vs. SPEC 2,245 2,135 2,169 2,390 2,283 2,378 2,404

40
Table IX
Share-Weighted Relative Effective Spreads for Moving and Non-Moving Brokers Before and After Stocks Relocate
We compute the share-weighted effective spread for trades handled by brokers relocating with the specialist and for trades handledby brokers who do not relocate with the specialist. The median values are obtained from the NYSE’s CAUD database and arereported from event day -10 through event day +10. Event day 0 is the first day of trading at the relocating stock’s new location.
Panel A: Trades between a moving (non-moving) brokers and the specialist.
EventTime
Median Effective Spread (bps.) EventTime
Median Effective Spread (bps.)
Movers Non-Movers Movers Non-Movers
-10 20.20 21.08 0 19.78 28.95*
-9 25.30 29.58 1 18.68 24.30*
-8 19.87 24.67* 2 27.23 32.72*
-7 21.75 21.03 3 28.19 30.69
-6 25.94 27.14 4 18.85 25.09*
-5 22.77 29.03* 5 21.74 21.65
-4 27.40 29.74 6 24.67 23.38
-3 24.51 19.58 7 31.04 36.71*
-2 20.98 21.53 8 25.95 21.68
-1 21.31 . 28.81* 9 20.14 18.97
10 29.40 26.11
Panel B: Trades between brokers.
EventTime
Median Effective Spread (bps.) EventTime
Median Effective Spread (bps.)
Both Movers One Mover Both Movers One Mover
-10 29.72 29.63 0 29.47 28.08
-9 29.69 31.73 1 26.35 30.42*
-8 27.49 29.93 2 27.08 30.85*
-7 29.11 33.37* 3 28.34 29.63
-6 35.96 37.71 4 25.34 27.82
-5 29.47 33.23* 5 27.53 35.08*
-4 27.47 32.32* 6 31.20 29.98
-3 30.72 27.93 7 32.79 32.31
-2 26.22 29.81* 8 33.43 34.30
-1 28.57 31.16 9 29.49 33.29*
10 37.46 33.84
* The difference between the effective spreads is statistically significant at the .95 confidence level. ** The difference between the effective spreads is statistically significant at the .99 confidence level.
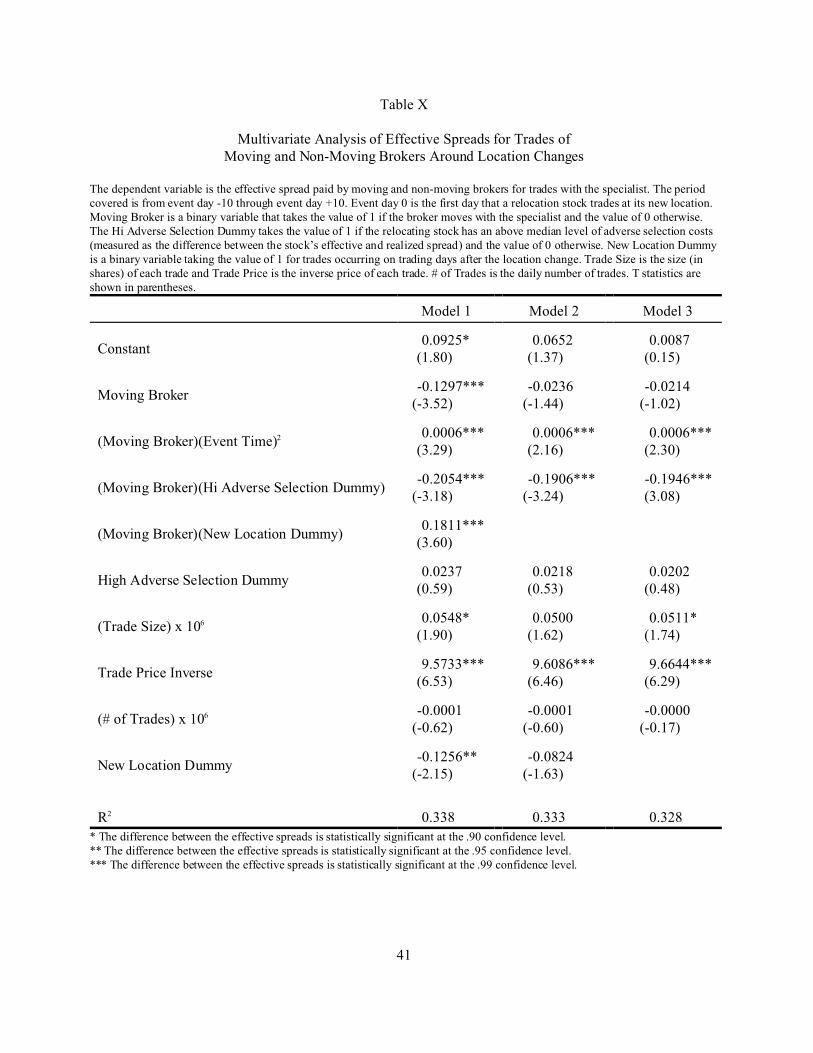
41
Table X
Multivariate Analysis of Effective Spreads for Trades ofMoving and Non-Moving Brokers Around Location Changes
The dependent variable is the effective spread paid by moving and non-moving brokers for trades with the specialist. The periodcovered is from event day -10 through event day +10. Event day 0 is the first day that a relocation stock trades at its new location.Moving Broker is a binary variable that takes the value of 1 if the broker moves with the specialist and the value of 0 otherwise.The Hi Adverse Selection Dummy takes the value of 1 if the relocating stock has an above median level of adverse selection costs(measured as the difference between the stock’s effective and realized spread) and the value of 0 otherwise. New Location Dummyis a binary variable taking the value of 1 for trades occurring on trading days after the location change. Trade Size is the size (inshares) of each trade and Trade Price is the inverse price of each trade. # of Trades is the daily number of trades. T statistics areshown in parentheses.
Model 1 Model 2 Model 3
Constant0.0925*
(1.80)0.0652
(1.37)0.0087
(0.15)
Moving Broker-0.1297***
(-3.52)-0.0236
(-1.44)-0.0214
(-1.02)
(Moving Broker)(Event Time)2 0.0006***(3.29)
0.0006***(2.16)
0.0006***(2.30)
(Moving Broker)(Hi Adverse Selection Dummy)-0.2054***
(-3.18)-0.1906***
(-3.24)-0.1946***(3.08)
(Moving Broker)(New Location Dummy)0.1811***
(3.60)
High Adverse Selection Dummy0.0237
(0.59)0.0218
(0.53)0.0202
(0.48)
(Trade Size) x 106 0.0548*(1.90)
0.0500(1.62)
0.0511*(1.74)
Trade Price Inverse9.5733***
(6.53)9.6086***
(6.46)9.6644***
(6.29)
(# of Trades) x 106 -0.0001(-0.62)
-0.0001(-0.60)
-0.0000(-0.17)
New Location Dummy-0.1256**
(-2.15)-0.0824
(-1.63)
R2 0.338 0.333 0.328
* The difference between the effective spreads is statistically significant at the .90 confidence level. ** The difference between the effective spreads is statistically significant at the .95 confidence level.*** The difference between the effective spreads is statistically significant at the .99 confidence level.

42
Figure 1
Median Differences in the Share-Weighted Relative Effective Spreads of Relocating Stocks and Their Controls

43
Figure 2
Median Differences in the Share-Weighted Relative Effective Spreads of Relocating Stocks and Their Controls for the Four Largest Relocations
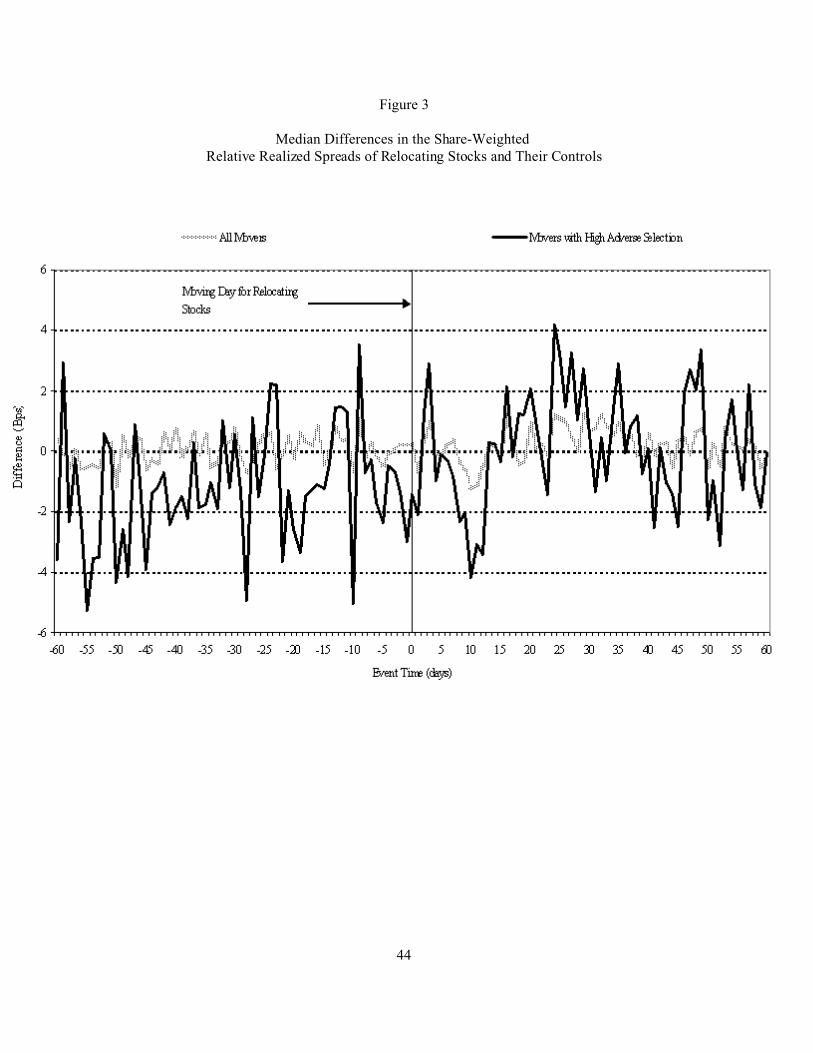
44
Figure 3
Median Differences in the Share-Weighted Relative Realized Spreads of Relocating Stocks and Their Controls