republic of uzbekistan - pbc.org.pk · in order to promote pakistan’s trade with its...
TRANSCRIPT

2017Republic of
UzbekistanTHE CENTRAL ASIA COUNTRY SERIES


Republic of Uzbekistan
November 2017

REPU
BLIC
OF
UZB
EKIS
TAN
201
7
ii
Acknowledgements:
Team Leader: Samir S. Amir
Lead Researcher: Mustafa Gul Kaliya
Disclaimer:
The findings, interpretations and conclusions expressed do not necessarily reflect the views of the Board of Directors and Members of The Pakistan Business Council or the companies they represent.
Any conclusions and analysis based on data from ITC, UN Comtrade, World Bank, Doing Business and CIA World Factbook are the responsibility of the author(s) and do not necessarily reflect the opinion of the UN, WTO, World Bank, or CIA. Although every effort has been made to cross-check and verify the authenticity of the data, The Pakistan Business Council, or the author(s), do not guarantee the data included in this work. All data and statistics used are correct as of September 1st, 2017, and may be subject to change.
For any queries or feedback regarding this report, please contact [email protected] or [email protected]

REPU
BLIC
OF
UZB
EKIS
TAN
201
7
iii
The Pakistan Business Council: An OverviewThe Pakistan Business Council (PBC) is a business policy advocacy platform, established in 2005 by 14 (now 62) of Pakistan’s largest private-sector businesses and conglomerates, including multinationals. PBC businesses cover nearly all sectors of the formal economy. It is a professionally-run organization headed by a full-time chief executive officer.
The PBC is a not-for-profit entity, registered under Section 42 of the Companies Ordinance 1984. Though it is not required under the law to do so, the PBC follows to the greatest extent possible, the Code of Corporate Governance as applicable to listed companies.
The PBC is a pan-industry advocacy group. It is not a trade body nor does it advocate for any specific business sector. Rather, its key advocacy thrust is on easing barriers to allow Pakistani businesses to compete in regional and global arenas. The PBC conducts research and holds conferences and seminars to facilitate the flow of relevant information to all stakeholders in order to help create an informed view on the major issues faced by Pakistan.
The PBC works closely with the relevant government departments, ministries, regulators and institutions, as well as other stakeholders including professional bodies, to develop consensus on major issues which impact the conduct of business in and from Pakistan. The PBC has submitted key position papers and recommendations to the government on legislation and other government policies affecting businesses. It also serves on various taskforces and committees of the Government of Pakistan as well as those of the State Bank, SECP and other regulators with the objective to provide policy assistance on new initiatives and reforms.
The PBC’s Founding Objectives:The major objectives of the PBC as stated in its founding documents are:
• To provide for the formation and exchange of views on any question connected with the conduct of business in and from Pakistan.
• To conduct, organize, set up, administer and manage campaigns, surveys, focus groups, workshops, seminars and field works for carrying out research and raising awareness in regard to matters affecting businesses in Pakistan.
• To acquire, collect, compile, analyze, publish and provide statistics, data analysis and other information relating to businesses of any kind, nature or description and on opportunities for such businesses within and outside Pakistan.
• To promote and facilitate the integration of businesses in Pakistan into the World economy and to encourage in the development and growth of Pakistani multinationals.
• To interact with governments in the economic development of Pakistan and to facilitate, foster and further the economic, social and human resource development of Pakistan.
More information on the PBC, its members, and its workings, can be found on its website: www.pbc.org.pk
REPU
BLIC
OF
UZB
EKIS
TAN
201
7
iv
The PBC’s Member Companies

REPU
BLIC
OF
UZB
EKIS
TAN
201
7
v
The PBC’s Member Companies

REPU
BLIC
OF
UZB
EKIS
TAN
201
7
vi
SummaryIn order to promote Pakistan’s trade with its non-traditional trading partners, the Pakistan Business Council (PBC) since 2015 has been doing a Country Profile Series aimed at introducing non-traditional markets to Pakistan’s exporters. In 2015 ‘6’ countries from Africa – Angola, Ethiopia, Ghana, Mozambique, Nigeria and South Africa were showcased. In 2016, ‘5’ countries from South America – Argentina, Brazil, Chile, Columbia and Mexico were featured. In 2017 the ‘5’ countries of Central Asia – Kazakhstan, Kyrgyzstan, Tajikistan, Turkmenistan and Uzbekistan are being covered by the PBC. This is the first publication of the Central Asian Country Series and features the Republic of Uzbekistan.
The Republic of Uzbekistan is a Central Asian Economy bordered by five landlocked countries. This makes it one of only two doubly landlocked countries in the world. It covers a total area of 447,400 km2 and has a population of 31.8 million, 88% of which are Muslim, with a growth of 0.93% per annum. The literacy rate is about 99.6% with Uzbek as the dominant language.
Uzbekistan has a very rich history which dates back to the first millennium BC (1,000 BC to 1 BC). The land was once occupied by Iranian nomads, and over the course of time it has been subject to conquests from Alexander the Great, Ghaznavids, Mongols and finally Russians. After the dissolution of the Soviet Union, Uzbekistan achieved its independence in December 1991 with Islam Karimov as its first president. In 2016, after the death of President Karimov, Shavkat Mirziyoyev became the President.
Though in comparison to Pakistan, Uzbekistan has a much smaller population and a lower GDP, its per capita income is much higher than Pakistan’s. Table below provides a brief comparison of the economies of Pakistan and Uzbekistan:
Pakistan UzbekistanPopulation 207,774,520 - (2017) Census 31,848,200 - (2016) Estimate
Year 2014 2015 2016 2014 2015 2016
GDP (Current US$ billions) 244.36 271.05 283.66 63.07 66.9 67.22
GDP per capita (Current US$) 1,316 1431 1468 2,050 2,138 2,111
GDP growth (%) 4.7 4.7 5.7 7.8 8 7.8
Inflation 7.2 2.5 3.8 9.1 8.5 8
Official exchange rate (US$, period average) 101 103 105 2,422 2810 3218
Uzbekistan’s economic growth went through a rough patch in the early years after its independence, however, over the past 15 years the growth rate has averaged 7.16 %. Growth has been fueled by investments and exports of its natural resources; gold, natural gas, cotton and copper. Oil and natural gas exports have been facilitated by Uzbekistan’s network of pipelines that provide links to Kazakhstan, Russia, Afghanistan, China, Kyrgyzstan, and Turkmenistan.
Moreover, in order to expand trade, Uzbekistan is actively involved in China’s One Belt One Road (OBOR) initiative, which envisages exchange of energy and technology through an improved system of transport. Furthermore, 50% of Uzbekistan’s GDP is generated by the tertiary sector, while secondary and primary sectors each contribute 33% and 17% respectively. Favorable foreign direct investment rates were achieved by commercial policies which have included high customs tariffs, closure of the border, and fiscal exemptions. Uzbekistan has received investments from China, South Korea, and Japan. In 2016, Uzbekistan had an inflation rate of 8%, unemployment rate of 8.9%, and a monetary policy rate of 8%.
As a major part of the ancient silk road, Uzbekistan is home to five of UNESCO’s World Heritage Sites. These sites include the Historic Center of Bukhara, Samarkand, Itchan Kala (Khiva), Historic Centre of Shakhrisyabz and the Western Tien-Shan.
REPU
BLIC
OF
UZB
EKIS
TAN
201
7
vii
Trade plays an important role in the economy of Uzbekistan contributing about 10% of the GDP. In 2016, Uzbekistan exported $7 billion worth of goods and imported goods valued at $9.1 billion, which resulted in a negative trade balance of about $2.1 billion. The major exports of Uzbekistan include gold, natural gas, pure cotton yarn and refined copper while the top imports are vehicular parts, machinery, iron and steel and pharmaceuticals. The most significant commodity exported by Uzbekistan is gold which makes up 40% of total Uzbek exports. The major export destinations of Uzbek goods are Switzerland, China and the Russian Federation; most of the exports from Uzbekistan to Switzerland comprise of gold and gold plates. Uzbekistan imports most of its products from China, the Russian Federation and Kazakhstan.
Bilateral trade between China and Uzbekistan has increased ten folds over the last 10 years. Exports to China amounted to $1.6 billion in 2016 which consisted mainly of mineral fuels, cotton and inorganic chemicals. Imports totaled $2 billion which included machinery, mechanical appliances, electrical machinery, plastics and iron and steel. Russia, another major trading partner, exports mineral fuels, wood, iron and steel and vegetable oils to Uzbekistan, and imports cotton and clothing accessories, fruits and nuts, knitted or crocheted fabrics and plastics. Moreover, remittances from Russia amount to roughly 16% of Uzbekistan’s GDP.
Nearer home, Uzbekistan trades with the other Central Asian Republics, Kazakhstan, Turkmenistan, Tajikistan, and Kyrgyzstan, out of which Kazakhstan holds a prominent position. In 2016, Imports from Kazakhstan included cereals, iron and steel and products for milling industries and amounted to $922.5 million, meanwhile, exports amounted to $588 million and included fruits, vegetables, mineral fuels and plastics., Uzbekistan supplies fertilizers, plastics, fruits, nuts and carpets to Kyrgyzstan, and receives vehicles, iron, steel, machinery, and mineral fuels. Total exports to Kyrgyzstan were $70 million and total imports amounted to $125 million in 2016. Due to lack of data, Uzbekistan’s trade with Turkmenistan and Tajikistan cannot be commented upon.
Uzbekistan exported goods worth $335 million to Afghanistan while importing only $0.3 million worth of goods in 2015. Imports from India mainly comprise of pharmaceutical products, machinery, vehicles and garments and amounted to $90.8 million in 2016. Exports consisted of vegetables, fertilizers, gums, resins and zinc articles, totaling $46.5 million in 2016.
Trade with Pakistan has been very erratic due to fluctuations in exports. In 2016, the trade deficit was $0.15 million as imports and exports stood at $3.38 and $3.22 million respectively. The trade between the two countries is minimal considering the indicative potential trade. Pakistan’s potential exports to Uzbekistan are $9.14 billion while the potential imports from Uzbekistan are $6.98 billion. Major exports to Pakistan include cotton, plastics, salts and earthly stones, and vegetables. Meanwhile, major imports from Pakistan are pharmaceutical products, photography and cinematography equipment, other various textile and agricultural products. The trade between Uzbekistan and Pakistan goes through Afghanistan. The route goes from Karachi to Quetta to Chaman before entering into Afghanistan; in Afghanistan, it goes from Kandahar to Kabul to Mazar-i-Sharif before entering into Uzbekistan at Termez.
In order to enhance trade relations, Uzbekistan has become a member of three major alliances: Organization of Islamic Cooperation (OIC), Commonwealth of independent states (CIS) and the Economic Cooperation Organization (ECO). In case of WTO, it is only an observer. Bilateral trade agreements have also been signed with Kyrgyzstan, Tajikistan, Ukraine, Azerbaijan, Russia, Moldova and Georgia.
According to the Doing Business Index, which is measured to determine the relative ease of starting and running a business by a local for each country, Uzbekistan ranks 87th in the world as of 2017. It ranks 25th in starting a business but falls back due to measures such as trading across borders and paying taxes where it ranks 165th and 138th respectively.


REPU
BLIC
OF
UZB
EKIS
TAN
201
7
ix
List of ContentsAcknowledgements: ii
Disclaimer: ii
The Pakistan Business Council: An Overview iii
The PBC’s Founding Objectives: iii
The PBC’s Member Companies iv
Summary vi
Geographic and Social Landscape of Uzbekistan 01
1.1 Geography 03
1.2. Demographic 05
1.3. Physical Infrastructure 06
1.4. Country History 07
Economic Profile 09
2.1. Economic Profile 11
2.2. Sectors of the Economy 16
2.3. Tourism 18
2.4. Oil and Gas Pipelines 24
2.5. One Belt One Road (OBOR) 27
Trade 29
3.1 Trade Overview 31
3.2. Trade Trend: Products 32
3.3. Trade Trend: Partners 36
3.4 Trade Alliances 40
Uzbekistan’s Trade Partners 45
4.1. China 47
4.2. Russia 50
4.3. Kazakhstan 52
4.4. Afghanistan 54
4.5. Kyrgyzstan 56
4.6. India 59
4.7. Pakistan 61
4.8. Turkmenistan 65
4.9. Tajikistan 66
Doing Business 67
5.1. Ease of Doing Business 69
5.2. Embassies and Consulates 70
Uzbek Embassy in Islamabad, Pakistan 70
Pakistani Embassy in Tashkent, Uzbekistan 70
5.3 Sources 71
Data Sources: 71
Cover Page 71
Section Breaks 71
Tourism 72

REPU
BLIC
OF
UZB
EKIS
TAN
201
7
x
List of TablesTable 1: Regions of Uzbekistan 04
Table 2: Economic Indicators of Uzbekistan 11
Table 3: Uzbekistan’s Imports Product Wise (HS-02) (2012-2016) (US$ Millions) 32
Table 4: Uzbekistan’s Imports Product Wise (HS-06) (2012-2016) (US$ Millions) 33
Table 5: Uzbekistan’s Exports Product Wise (HS-02) (2012-2016) (US$ Millions) 34
Table 6: Uzbekistan’s Exports Product Wise (HS-06) (2012-2016) (US$ Millions) 35
Table 7: Top 10 Export Partners of Uzbekistan (US$ Millions) (2012-2016) 36
Table 8: Top 10 Import Partners of Uzbekistan (US$ Millions) (2012-2016) 38
Table 9: Free Trade Agreements Signed by Uzbekistan 44
Table 10: Uzbekistan’s Imports from China (HS-02) (US$ Millions) (2012-2016) 48
Table 11: Uzbekistan’s Imports from China (HS-06) (US$ Millions) (2012-2016) 48
Table 12: Uzbekistan’s Exports to China (HS-02) (US$ Millions) (2012-2016) 49
Table 13: Uzbekistan’s Exports to China (HS-06) (US$ Millions) (2012-2016) 49
Table 14: Uzbekistan’s Imports from Russia (HS-02) (US$ Millions) (2012-2016) 51
Table 15: Uzbekistan’s Imports from Russia (HS-06) (US$ Millions) (2012-2016) 51
Table 16: Uzbekistan’s Exports to Russia (HS-02) (US$ Millions) (2012-2016) 51
Table 17: Uzbekistan’s Exports to Russia (HS-06) (US$ Millions) (2012-2016) 51
Table 18: Uzbekistan’s Imports from Kazakhstan (HS-02) (US$ Millions) (2012-2016) 53
Table 19: Uzbekistan’s Imports from Kazakhstan (HS-06) (US$ Millions) (2012-2016) 53
Table 20: Uzbekistan’s Exports to Kazakhstan (HS-02) (US$ Millions) (2012-2016) 53
Table 21: Uzbekistan’s Exports to Kazakhstan (HS-06) (US$ Millions) (2012-2016) 54
Table 22: Uzbekistan’s Imports from Afghanistan (HS-02) (US$ Millions) (2011-2015) 55
Table 23: Uzbekistan’s Imports from Afghanistan (HS-06) (US$ Millions) (2011-2015) 55
Table 24: Uzbekistan’s Exports to Afghanistan (HS-02) (US$ Millions) (2011-2015) 55
Table 25: Uzbekistan’s Exports to
Afghanistan (HS-06) (US$ Millions) (2011-2015) 55
Table 26: Uzbekistan’s Imports from Kyrgyzstan (HS-02) (US$ Millions) (2012-2016) 57
Table 27: Uzbekistan’s Imports from Kyrgyzstan (HS-06) (US$ Millions) (2012-2016) 57
Table 28: Uzbekistan’s Exports to Kyrgyzstan (HS-02) (US$ Millions) (2012-2016) 57
Table 29: Uzbekistan’s Exports to Kyrgyzstan (HS-06) (US$ Millions) (2012-2016) 58
Table 30: Uzbekistan’s Imports from India (HS-02) (US$ Millions) (2012-2016) 60
Table 31: Uzbekistan’s Imports from India (HS-06) (US$ Millions) (2012-2016) 60
Table 32: Uzbekistan’s Exports to India (HS-02) (US$ Millions) (2012-2016) 60
Table 33: Uzbekistan’s Exports to India (HS-06) (US$ Millions) (2012-2016) 60
Table 34: Uzbekistan’s Imports from Pakistan (HS-02) (US$ Millions) (2012-2016) 62
Table 35: Uzbekistan’s Imports from Pakistan (HS-06) (US$ Millions) (2012-2016) 62
Table 36: Uzbekistan’s Exports to Pakistan (HS-02) (US$ Millions) (2012-2016) 62
Table 37: Uzbekistan’s Exports to Pakistan (HS-06) (US$ Millions) (2012-2016) 63
Table 38: Pakistan’s Potential Imports from Uzbekistan 63
Table 39: Pakistan’s Potential Exports to Uzbekistan 64
Table 40: Doing Business in Uzbekistan 69

REPU
BLIC
OF
UZB
EKIS
TAN
201
7
xi
List of FiguresFigure 1: Map of Uzbekistan 03
Figure 2: Distribution of Population by Age Groups 05
Figure 3: Uzbekistan’s GDP (1990-2016) (US$ Billions) 12
Figure 4: Uzbekistan’s GDP per Capita (1990-2016) (US$) 12
Figure 5: Uzbekistan’s Annual GDP Growth Rate (1990-2016) 13
Figure 6: Uzbekistan’s Foreign Direct Investment, Net Inflows (1992-2015) 14
Figure 7: Uzbekistan’s Unemployment Rate (% of total labor force) (1990-2016) 14
Figure 8: Uzbekistan’s Inflation Rate (2006-2016) (Consumer Price Index) 15
Figure 9: Uzbekistan’s Monetary Policy Rate (1996-2016) 16
Figure 10: Distribution of GDP by Economic Sectors for Uzbekistan 16
Figure 11: Map of Central Asian Oil Pipelines 24
Figure 12: Map of Central Asian Gas Pipelines 25
Figure 13: Map of the One Road One Belt Project 27
Figure 14: Uzbekistan’s Trade overview (2001-2016) (US$ Millions) 31
Figure 15: Top 10 Export Partners of Uzbekistan (US$ Millions) (2012-2016) 37
Figure 16: Top 10 Import Partners of Uzbekistan (US$ Millions) (2012-2016) 39
Figure 17: Uzbekistan’s Trade with Members of Organization of Islamic Cooperation (US$ Millions) (2007-2016) 40
Figure 18: Uzbekistan’s Trade with Members of Commonwealth of Independent States (US$ Millions) (2007-2016) 41
Figure 19: Uzbekistan’s Trade with members of Economic Cooperation Organization (US$ Millions) (2007-2016) 42
Figure 20: Uzbekistan’s Trade with Members of World Trade Organization (US$ Millions) (2007-2016) 43
Figure 21: Uzbekistan’s Trade with China (US$ Millions) (2007-2016) 47
Figure 22: Uzbekistan’s Trade with Russia (US$ Millions) (2007-2016) 50
Figure 23: Uzbekistan’s Trade with Kazakhstan (US$ Millions) (2007-2016) 52
Figure 24: Uzbekistan’s Trade with Afghanistan (US$ Millions) (2008-2015) 54
Figure 25: Uzbekistan’s Trade with Kyrgyzstan (US$ Millions) (2007-2016) 56
Figure 26: Uzbekistan’s Trade with India (US$ Millions) (2007-2016) 59
Figure 27: Uzbekistan’s Trade with Pakistan (US$ Millions) (2007-2016) 61
Figure 28: Trade Route to Pakistan 65


SECTION 1 Geographic and Social
Landscape of Uzbekistan
The Tomb of the King Timur Barlas, Samarkand, Uzbekistan


REPU
BLIC
OF
UZB
EKIS
TAN
201
7
03
1.1 Geography1.1.1 Location
Uzbekistan, officially the Republic of Uzbekistan, is located in Central Asia. Uzbekistan is bordered by five landlocked countries: Kazakhstan to the north; Tajikistan to the southeast; Kyrgyzstan to the northeast; Afghanistan to the south; and Turkmenistan to the southwest. This makes it one of only two doubly landlocked countries in the world - the other being Liechtenstein in Central Europe.
Geographic Coordinates: 41.3775° N, 64.58530 E
Figure 1: Map of Uzbekistan
1.1.2. Area• Total Area: 447,400 km²
• Land: 425,400 km²
Agricultural land: 62.6%
Forest: 7.7%
Other: 29.7% (2011 est.)
• Water: 22,000 km²

REPU
BLIC
OF
UZB
EKIS
TAN
201
7
04
1.1.3. Land Boundaries
Total border length: 6,893 km
Border Countries: • Afghanistan - 144 km
• Kazakhstan - 2,330 km
• Kyrgyzstan - 1,314 km
• Tajikistan - 1,312 km
• Turkmenistan - 1,793 km
Since Uzbekistan is doubly landlocked, it has no coastline. The southern portion of Uzbekistan, however, includes the Aral Sea, where its shoreline with the Aral Sea is 420 Km long.
1.1.4. Regions of Uzbekistan
There are 12 provinces in Uzbekistan. The following table shows the capital city, the area and the population of each of the provinces along with that of Tashkent which is the Capital of Uzbekistan. In addition, the capital city, area and population of Karakalpakstan is also shown which is an autonomous republic within Uzbekistan.
Regions of Uzbekistan
Division Capital City Area Population
Andijan Region Andijan 4,200 2,857,300Bukhara Region Bukhara 39,400 1,785,400
Fergana Region Fergana 6,800 3,444,900
Jizzakh Region Jizzakh 20,500 1,250,100
Xorazm Region Urgench 6,300 1,715,600
Namangan Region Namangan 7,900 2,554,200
Navoiy Region Navoiy 110,800 913,200
Qashqadaryo Region Qarshi 28,400 2,958,900
Samarqand Region Samarkand 16,400 3,514,800
Sirdaryo Region Guliston 5,100 777,100
Surxondaryo Region Termez 20,800 2,358,300
Tashkent Region Tashkent 15,300 2,758,300
Karakalpakstan Nukus 160,000 1,763,100
Tashkent — 335 2,352,300
Table 1: Regions of Uzbekistan
REPU
BLIC
OF
UZB
EKIS
TAN
201
7
05
1.1.5. Natural Resources
Uzbekistan is a resource rich country, following natural resources are found in Uzbekistan:
• Gold
• Natural gas
• Petroleum
• Coal
• Uranium
• Silver
• Copper
• Lead
• Zinc
• Tungsten
• Molybdenum
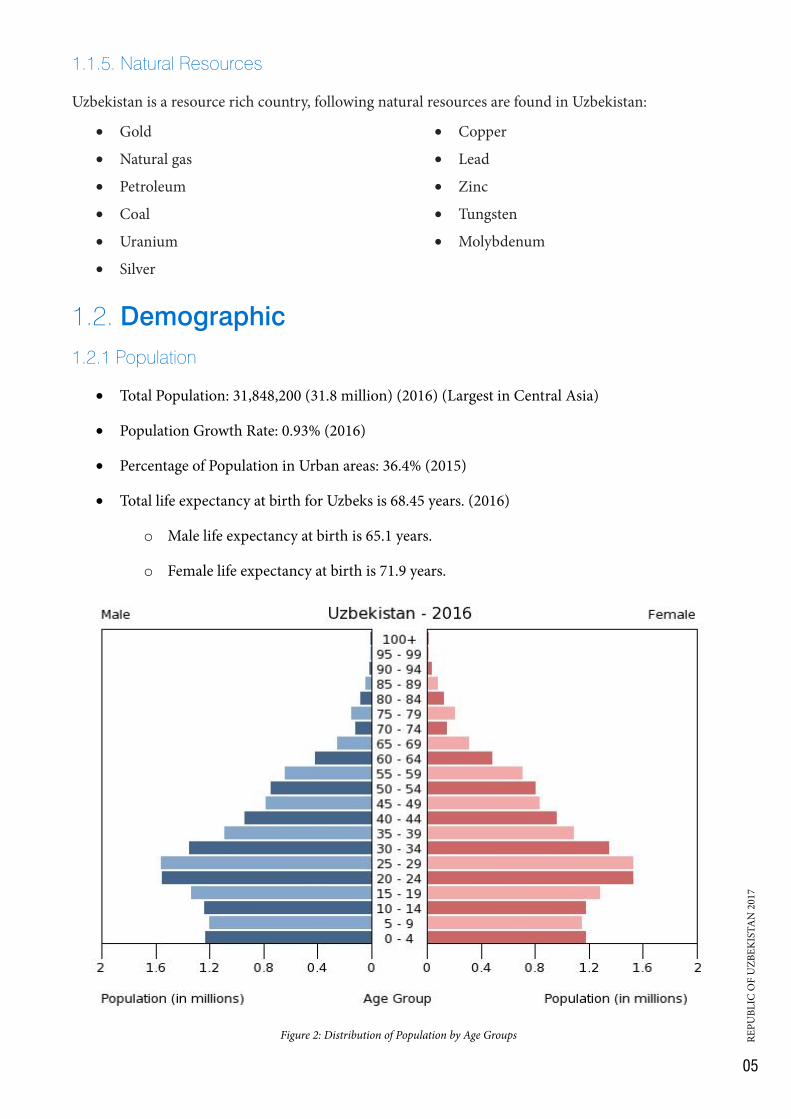
1.2. Demographic1.2.1 Population
• Total Population: 31,848,200 (31.8 million) (2016) (Largest in Central Asia)
• Population Growth Rate: 0.93% (2016)
• Percentage of Population in Urban areas: 36.4% (2015)
• Total life expectancy at birth for Uzbeks is 68.45 years. (2016)
o Male life expectancy at birth is 65.1 years.
o Female life expectancy at birth is 71.9 years.
Figure 2: Distribution of Population by Age Groups

REPU
BLIC
OF
UZB
EKIS
TAN
201
7
06
1.2.2. Education
Literacy rate is defined by the ability to read and write. The Literacy rate in Uzbekistan for the adult population, aged 15 years and above, is 99.72% and 99.47% for males and females respectively. The total adult literacy rate is 99.59%. The youth literacy rates, for ages from 15 to 24 years, are 99.9% and 100% for males and females respectively. Overall the youth literacy rate is 99.95%.
1.2.3. Language
There are a number of languages spoken in Uzbekistan, the more important ones being Uzbek, Russian and Tajik. The Uzbek language, with the highest number of users at 74%, is the only official state language, and which since 1992 is officially written in the Latin alphabet. Russian is also an important language for communication, especially in the cities, including much day-to-day technical, scientific, governmental and business use.
1.2.4. Religion
Islam is by far the most dominant religion in Uzbekistan with 88% of the population being Muslim. The Eastern Orthodox Church accounts for a further 9% of the population.
1.2.5. Ethnic Groups
The ethnic distribution of Uzbekistan (1996) is as follows:
• Uzbek 80%
• Russian 5.5%
• Tajik 5%
• Kazakh 3%
• Karakalpak 2.5%
• Tatar 1.5%
• other 2.5%
1.3. Physical Infrastructure• Road Network – 86,496 Km (2000)
o Paved – 75,511 Km
o Unpaved – 10,985 Km
• Airports – 53 (2013)
o With Paved Runways – 33
o Without Paved Runways – 20
• Railway – 4,304 Km (2016)
• Waterways – 1,100 Km (2012)
• Ports
o River Port – Termiz (Amu Darya)
• Access to Electricity (% of population) – 100% (2014)
• Internet access (% of population) – 52.4% (2016)

REPU
BLIC
OF
UZB
EKIS
TAN
201
7
07
1.4. Country History Uzbekistan has a very rich history which dates back to the first millennium BC (1,000 BC to 1 BC). It started with Iranian nomads building irrigation systems along the rivers of Central Asia. They built towns at Samarqand and Bukhara; which became extremely wealthy as transit points between China and Europe on what became known as the Silk Road. Alexander the Great conquered the region in 328 BC and brought it under the control of the Macedonian Empire for a brief period.
After the rise of Islam in 622 AD., it began to spread rapidly through Asia. The conquest of Central Asia was complete by the eighth century AD. According to some historians, the eighth and ninth centuries were the golden age of learning and culture in Transoxiana which consists of modern-day Uzbekistan, Tajikistan, southern Kyrgyzstan, and southwest Kazakhstan. Bukhara became one of the leading centers of learning, culture, and art in the Muslim world. Some of the greatest scientists, historians and geographers of the Muslim empire were natives of this region. Towards the end of the tenth century, the Ghaznavid state under the rule of Sultan Mahmud conquered large areas of Eastern Iran, Central Asia, Afghanistan, and Pakistan. The rule of the Ghaznavid Empire was however short lived in Central Asia as they were closely followed by the Turkic Qarakhanids who took Bukhara in 999 AD. The Turkic Qarakhanids ruled Transoxiana for the next two centuries.
At the start of the thirteenth century, the Mongols invaded Central Asia under Genghis Khan. This was a devastating period for Central Asia. The conquest caused large scale damage to wealthy cities such as Bukhara and the irrigation system along the Amu Darya.
During the mid-nineteenth century, Imperial Russia began a full-scale military conquest of Central Asia and by 1876 Russia had incorporated present-day Uzbekistan into its empire. The Russian population of Uzbekistan grew due to immigration from Russia, and some industrialization occurred. At the start of the twentieth century, the Jadidist movement began from present-day Uzbekistan; Jadidists overthrew the tsar in 1917 and established an autonomous state at Quqon. Uzbekistan was reconquered by the Soviets and in 1924, the Uzbek Soviet Socialist Republic was formed
As part of Stalin’s purge of the 1930s, the communist leadership under Khojayev was executed and replaced with Russian Officials who accelerated the migration of Russians to Uzbekistan. This was part of the Russification of Uzbekistan that began in the 1930s and lasted through the 1970s. Another purge of the Uzbek party began in the mid-1980s, however, unlike the last time this one boosted Uzbek nationalism. During 1989 a series of violent clashes involving ethnic Uzbeks led to the appointment of Islam Karimov as the Communist Party Chief. The Supreme Soviet of Uzbekistan approved independence from the Soviet Union in 1991.
Pakistan immediately recognized Uzbekistan as an independent state in December 1991. Diplomatic relations with Pakistan were established in May of 1992. In June 1992, Mian Mohammad Nawaz Sharif, the then Prime Minister of Pakistan, made the first official visit to Uzbekistan and subsequently Islam Karimov the then President of Uzbekistan made the first visit to Pakistan in August 1992. These visits laid down the foundation of bilateral relations between the two countries.
After independence Islam Karimov became the president of the Republic of Uzbekistan and a new constitution was approved. The main opposition party was banned, and media suppression began. This led to a couple of violent outbreaks in eastern Uzbekistan. In 1995, a referendum extended President Karimov’s term from 1997 to 2000 which was further extended when Karimov was re-elected in the election with a landslide.

REPU
BLIC
OF
UZB
EKIS
TAN
201
7
08
Serious regional issues developed after the elections in 2000 as Uzbekistan started laying mines along the Tajik border. Tensions also rose with other neighboring countries including Kyrgyzstan and Turkmenistan. A defense treaty was signed between Russia and Uzbekistan during the mid-2000s. Problems with Kyrgyzstan grew when Uzbekistan demanded extradition of the refugees who had fled to Kyrgyzstan due to ethnic riots in Uzbekistan in the 1990s. During the mid-2000s Uzbekistan was plagued by terrorist attacks by extremist groups such as Al-Qaeda.
In December 2007 Islam Karimov was re-elected to power followed by wins in the 2011 & 2015 presidential elections. Islam Karimov died in September 2016, from a stroke, and was replaced as President by Shavkat Mirziyoyev.

SECTION II Economic Profile
Registan, Samarkand, Uzbekistan

REPU
BLIC
OF
UZB
EKIS
TAN
201
7
10

REPU
BLIC
OF
UZB
EKIS
TAN
201
7
11
2.1. Economic Profile2.1.1. Economic Overview
After its independence from the Soviet Union, the Uzbek government continued with an autocratic style of government by exercising strict controls on prices, production and foreign currency access. The Uzbek economy is an agriculture-oriented economy with cotton as its main crop. It is the fifth largest cotton exporter and the 9th largest producer of gold. Uzbekistan earns large sums of foreign exchange by exporting its natural resources.
According to the World Bank, the major reason for economic growth in Uzbekistan has been investment; the economy has been growing at about 8% each year. However, according to the World Bank, owing to Uzbekistan’s authoritarian style of governance, economic growth has been impeded due to strict regulations. The government has carried out various state-led interventions based on export-oriented and import-substituting policies which have resulted in restricted access of private sector businesses to foreign exchange, it has also led to an overregulated banking sector and rampant corruption. To improve the environment of the country, the government has been taking initiatives which have simplified the registration process for businesses, giving extra tax incentives to investors and rationalized customs regulations.
While the World Bank has credited Uzbekistan’s high growth rates of around 8% to investment, the Asian Development Bank has credited the high economic growth rates to the large exports of commodities that the Uzbek economy is endowed with such as gold, natural gas, cotton and copper. The table below shows a list of economic indicators for the last 5 years:
Economic Indicators 2012 2013 2014 2015 2016GDP (Current US$ Billions) $52 $58 $63 $67 $67
GDP per capita (Current US$) $1,740 $1,908 $2,050 $2,138 $2,111
Real GDP growth (annual %) 8.20 8.00 7.79 8.00 7.80
Unemployment (% of total labor force) 9.13 9.05 8.96 8.92 8.90
Balance of Trade (US$ Billions) -4.54 -4.39 -6.44 -4.09 -2.18
Human Development Index (HDI) 0.68 0.69 0.70 0.70 NA
Inflation (annual %) 11.90 11.70 9.10 8.50 8.00
Exchange Rate (versus US$) 1984 2202 2422 2810 3218
Table 2: Economic Indicators of Uzbekistan
Even though the balance of trade for Uzbekistan has been negative for the past few years it improved by 78% in 2016, over 2012. The rate of growth of the economy was 7.80%, with a GDP of $67.22 billion in 2016. To avoid any likely economic chaos, Uzbekistan has joined many institutions such as the Organization of Islamic Cooperation (OIC), Commonwealth of Independent States (CIS) and other free-trade associations to ensure increased flow of trade and economic cooperation.

REPU
BLIC
OF
UZB
EKIS
TAN
201
7
12
2.1.2. Gross Domestic Product
In 1991, Uzbekistan had a GDP of $13.6 billion; from 1991 to 1998, the GDP ranged between $13.5 & $15.0 billion. It reached its lowest point in 2002 at $9.69 billion but has been rising since. The GDP of Uzbekistan has seen a rising trend over the last 15 years. Uzbekistan’s GDP has not been affected by any of the economic downturns like the Central Asian Energy Crisis (2007-2008) or the World Financial Crisis (2008) due to the Anti-Crisis Programme implemented by Islam Karimov. The Anti-Crisis Program focused on policies aimed to support the real sector of the economy. Some of the measures include upgrading production and encouraging cuts in production cost for import substitution; capping the increase in fuel and public transport prices by 6-8%; stimulating demand in the domestic market etc. Uzbekistan reached its highest recorded GDP in 2016 at $67 billion and this is expected to rise.
REPUBLIC OF UZBEKISTAN 21
2.1.2. Gross Domestic Product In 1991, Uzbekistan had a GDP of $13.6 billion; from 1991 to 1998, the GDP ranged between $13.5 & $15.0 billion. It reached its lowest point in 2002 at $9.69 billion but has been rising since. The GDP of Uzbekistan has seen a rising trend over the last 15 years. Uzbekistan’s GDP has not been affected by any of the economic downturns like the Central Asian Energy Crisis (2007-2008) or the World Financial Crisis (2008) due to the Anti-Crisis Programme implemented by Islam Karimov. The Anti-Crisis Program focused on policies aimed to support the real sector of the economy. Some of the measures include upgrading production and encouraging cuts in production cost for import substitution; capping the increase in fuel and public transport prices by 6-8%; stimulating demand in the domestic market etc. Uzbekistan reached its highest recorded GDP in 2016 at $67 billion and this is expected to rise.
Figure 3: Uzbekistan's GDP (1990-2016) (US$ Billions)
13.36 9.69
67.22
$0.00
$10.00
$20.00
$30.00
$40.00
$50.00
$60.00
$70.00
$80.00
1990
1991
1992
1993
1994
1995
1996
1997
1998
1999
2000
2001
2002
2003
2004
2005
2006
2007
2008
2009
2010
2011
2012
2013
2014
2015
2016
US$
(Bill
ions
)
Year
Nominal GDP
Figure 3: Uzbekistan’s GDP (1990-2016) (US$ Billions)
2.1.3. Gross Domestic Product Per Capita
Much like GDP, GDP per capita has also seen an upward trend after it reached its lowest point in 2002. Uzbekistan suffered a slight fall in GDP per capita from $2,137 in 2015 to $2,110 in 2016.
REPUBLIC OF UZBEKISTAN 22
2.1.3. Gross Domestic Product Per Capita Much like GDP, GDP per capita has also seen an upward trend after it reached its lowest point in 2002. Uzbekistan suffered a slight fall in GDP per capita from $2,137 in 2015 to $2,110 in 2016.
Figure 4: Uzbekistan's GDP per Capita (1990-2016) (US$)
651.42 383.35
2,110.65
0
500
1000
1500
2000
2500
1990
1991
1992
1993
1994
1995
1996
1997
1998
1999
2000
2001
2002
2003
2004
2005
2006
2007
2008
2009
2010
2011
2012
2013
2014
2015
2016
US$
Year
GDP Per Capita
Figure 4: Uzbekistan’s GDP per Capita (1990-2016) (US$)

REPU
BLIC
OF
UZB
EKIS
TAN
201
7
13
2.1.4. Economic Growth
Uzbekistan went through a rough patch in the early years after its independence i.e. from 1991 to 1995; 1992 being the lowest point with a growth rate of negative 11%. From 1996 onwards Uzbekistan has been enjoying a positive growth rate. The GDP growth rate reached its highest point in 2007 at about 10%. Over the last 15 years, on an average, Uzbekistan has been growing at a healthy rate of 7.16%. One thing that is apparent from the graph below is that the Uzbek economy has been more or less insulated from the economic and financial downturns that have plagued many countries in the past few years, possibly due to the adoption of the Anti-Crisis Programme by the late Uzbek President, Islam Karimov.
REPUBLIC OF UZBEKISTAN 23
2.1.4. Economic Growth Uzbekistan went through a rough patch in the early years after its independence i.e. from 1991 to 1995; 1992 being the lowest point with a growth rate of negative 11%. From 1996 onwards Uzbekistan has been enjoying a positive growth rate. The GDP growth rate reached its highest point in 2007 at about 10%. Over the last 15 years, on an average, Uzbekistan has been growing at a healthy rate of 7.16%. One thing that is apparent from the graph below is that the Uzbek economy has been more or less insulated from the economic and financial downturns that have plagued many countries in the past few years, possibly due to the adoption of the Anti-Crisis Programme by the late Uzbek President, Islam Karimov.
Figure 5: Uzbekistan's Annual GDP Growth Rate (1990-2016)
1.60
-11.20
9.92 7.80
-15
-10
-5
0
5
10
15
1990
1991
1992
1993
1994
1995
1996
1997
1998
1999
2000
2001
2002
2003
2004
2005
2006
2007
2008
2009
2010
2011
2012
2013
2014
2015
2016
Perc
enta
ge
Year
Annual GDP Growth Rate
Figure 5: Uzbekistan’s Annual GDP Growth Rate (1990-2016)
2.1.5. Foreign Direct Investment (FDI)
Foreign Direct Investment (FDI) in Uzbekistan had been relatively stable between 1992 and 2006, after which it experienced gradual growth. A sharp decline in FDI in 2012 of 65%, had a major impact on Uzbekistan’s economy and resulted in the implementation of structural and economic reforms. Since then, the country has promoted commercial policies which have included high customs tariffs, closure of the border, and fiscal exemptions. These changes in policies resulted in favorable investment opportunities and increased FDI from $0.62 billion to $1 billion from 2014-2015. The inflow of FDI is predicted to go as high as $2.65 billion in 2017, according to the office of the President of Uzbekistan.

REPU
BLIC
OF
UZB
EKIS
TAN
201
7
14
Chinese cooperation has paved the way for easy trade flows between China and Uzbekistan, this has included the launch of a pipeline extension, which links Central Asia and China. Along with this, China has also promised to invest $5 billion in the mining sector and help in improving infrastructure within Uzbekistan. South Korea has also been a major trading partner since 2011 and is reported to have invested $2.6 billion for a chemical production plant. Japan, along with South Korea have also agreed to invest in the exploration of hydrocarbon deposits.
REPUBLIC OF UZBEKISTAN 24
2.1.5. Foreign Direct Investment (FDI) Foreign Direct Investment (FDI) in Uzbekistan had been relatively stable between 1992 and 2006, after which it experienced gradual growth. A sharp decline in FDI in 2012 of 65%, had a major impact on Uzbekistan’s economy and resulted in the implementation of structural and economic reforms. Since then, the country has promoted commercial policies which have included high customs tariffs, closure of the border, and fiscal exemptions. These changes in policies resulted in favorable investment opportunities and increased FDI from $0.62 billion to $1 billion from 2014-2015. The inflow of FDI is predicted to go as high as $2.65 billion in 2017, according to the office of the President of Uzbekistan.
Chinese cooperation has paved the way for easy trade flows between China and Uzbekistan, this has included the launch of a pipeline extension, which links Central Asia and China. Along with this, China has also promised to invest $5 billion in the mining sector and help in improving infrastructure within Uzbekistan. South Korea has also been a major trading partner since 2011 and is reported to have invested $2.6 billion for a chemical production plant. Japan, along with South Korea have also agreed to invest in the exploration of hydrocarbon deposits.
Figure 6: Uzbekistan's Foreign Direct Investment, Net Inflows (1992-2015)
$9.00 $173.80
$1,635.15
$1,068.39
-2000
200400600800
10001200140016001800
US$
(Mill
ions
)
Years
Foreign Direct Investment, Net Inflows
Figure 6: Uzbekistan’s Foreign Direct Investment, Net Inflows (1992-2015)
2.1.6. Unemployment
Over the past 25 years since Uzbekistan became independent, the unemployment rate has been relatively constant hovering between 8.9% and 9.4%. the unemployment rate in 2016 was estimated at 8.89%.
REPUBLIC OF UZBEKISTAN 25
2.1.6. Unemployment Over the past 25 years since Uzbekistan became independent, the unemployment rate has been relatively constant hovering between 8.9% and 9.4%. the unemployment rate in 2016 was estimated at 8.89%.
Figure 7: Uzbekistan's Unemployment Rate (% of total labor force) (1990-2016)
8.98 9.30 8.90
0123456789
10
1990
1991
1992
1993
1994
1995
1996
1997
1998
1999
2000
2001
2002
2003
2004
2005
2006
2007
2008
2009
2010
2011
2012
2013
2014
2015
2016
Perc
enta
ge
Year
Unemployment Rate
Figure 7: Uzbekistan’s Unemployment Rate (% of total labor force) (1990-2016)

REPU
BLIC
OF
UZB
EKIS
TAN
201
7
15
2.1.7 Currency
So’m is the currency of Uzbekistan. The symbol for So’m is лв. Each So’m consists of 100 Tiyin. The ISO1 4217 currency code is UZS. лв1 (Uzbekistani So’m) is equal to US$0.00024 (US Dollars) and Rs0.0252 (Pakistani Rupees) as of 25th August 2017.
2.1.8. Inflation
The independence of Uzbekistan brought with it very high rates of inflation as the country transaction from a communist to a free-market economy. In its first decade inflation reached 1500% in 1994 up from 500% in 1993. Through sustained efforts by the government, inflation has been falling gradually in the last decade. In 2016, inflation had dropped to 8%. This is, still a high rate of inflation but considering the hyperinflation during the first few years, it is an improvement. Inflation is expected to stay under 10% over the medium term.
REPUBLIC OF UZBEKISTAN 26
2.1.7 Currency The So’m is the currency of Uzbekistan. The symbol for So’m is лв. Each So’m consists of 100 Tiyin. The ISO1 4217 currency code is UZS. лв1 (Uzbekistani So’m) is equal to US$0.00024 (US Dollars) and Rs0.0252 (Pakistani Rupees) as of 25th August 2017.
2.1.8. Inflation The independence of Uzbekistan brought with it very high rates of inflation as the country transited from a communist to a free-market economy. In its first decade inflation reached 1500% in 1994 up from 500% in 1993.Through sustained efforts by the government, inflation has been falling gradually in the last decade. In 2016, inflation had dropped to 8%. This is, still a high rate of inflation but considering the hyperinflation during the first few years, it is an improvement. Inflation is expected to stay under 10% over the medium term.
Figure 8: Uzbekistan's Inflation Rate (2006-2016) (Consumer Price Index)
1 ISO – International Organization for Standardization
0.0
10.0
20.0
30.0
40.0
50.0
60.0
70.0
80.0
199619971998199920002001200220032004200520062007200820092010201120122013201420152016
Perc
enta
ge
Year
Inflation rate
Inflation rate
Figure 8: Uzbekistan’s Inflation Rate (2006-2016) (Consumer Price Index)
1 ISO – International Organization for Standardization
REPU
BLIC
OF
UZB
EKIS
TAN
201
7
16
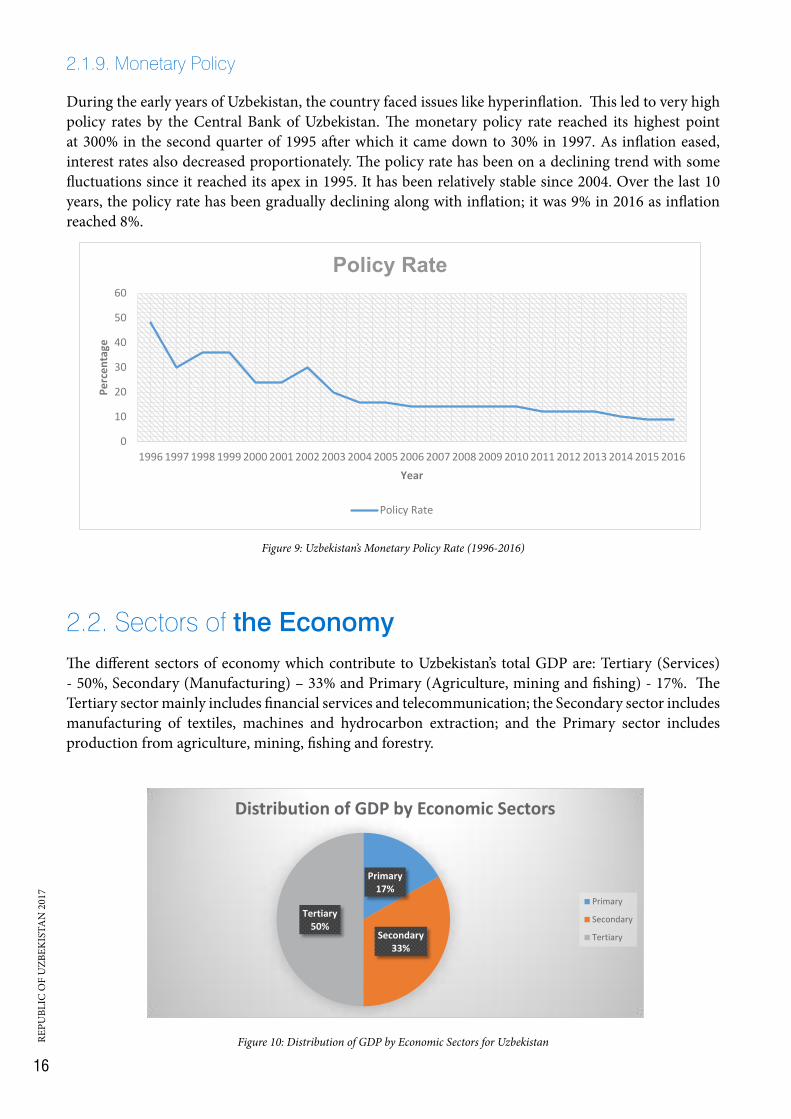
2.1.9. Monetary Policy
During the early years of Uzbekistan, the country faced issues like hyperinflation. This led to very high policy rates by the Central Bank of Uzbekistan. The monetary policy rate reached its highest point at 300% in the second quarter of 1995 after which it came down to 30% in 1997. As inflation eased, interest rates also decreased proportionately. The policy rate has been on a declining trend with some fluctuations since it reached its apex in 1995. It has been relatively stable since 2004. Over the last 10 years, the policy rate has been gradually declining along with inflation; it was 9% in 2016 as inflation reached 8%.
REPUBLIC OF UZBEKISTAN 27
2.1.9. Monetary Policy During the early years of Uzbekistan, the country faced issues like hyperinflation. This led to very high policy rates by the Central Bank of Uzbekistan. The monetary policy rate reached its highest point at 300% in the second quarter of 1995 after which it came down to 30% in 1997. As inflation eased, interest rates also decreased proportionately. The policy rate has been on a declining trend with some fluctuations since it reached its apex in 1995. It has been relatively stable since 2004. Over the last 10 years, the policy rate has been gradually declining along with inflation; it was 9% in 2016 as inflation reached 8%.
Figure 9: Uzbekistan’s Monetary Policy Rate (1996-2016)
0
10
20
30
40
50
60
1996 1997 1998 1999 2000 2001 2002 2003 2004 2005 2006 2007 2008 2009 2010 2011 2012 2013 2014 2015 2016
Perc
enta
ge
Year
Policy Rate
Policy Rate
Figure 9: Uzbekistan’s Monetary Policy Rate (1996-2016)
2.2. Sectors of the EconomyThe different sectors of economy which contribute to Uzbekistan’s total GDP are: Tertiary (Services) - 50%, Secondary (Manufacturing) – 33% and Primary (Agriculture, mining and fishing) - 17%. The Tertiary sector mainly includes financial services and telecommunication; the Secondary sector includes manufacturing of textiles, machines and hydrocarbon extraction; and the Primary sector includes production from agriculture, mining, fishing and forestry.
REPUBLIC OF UZBEKISTAN 28
2.2. Sectors of the Economy The different sectors of economy which contribute to Uzbekistan’s total GDP are: Tertiary (Services) - 50%, Secondary (Manufacturing) – 33% and Primary (Agriculture, mining and fishing) - 17%. The Tertiary sector mainly includes financial services and telecommunication; the Secondary sector includes manufacturing of textiles, machines and hydrocarbon extraction; and the Primary sector includes production from agriculture, mining, fishing and forestry.
Figure 10: Distribution of GDP by Economic Sectors for Uzbekistan
2.2.1. Tertiary Sector Over the past five years, the tertiary sector in Uzbekistan has grown to become the largest sector contributing half of the GDP. The sector grew by 13.3% per annum from 2007 to 2011. Strong growth in services was underpinned by macroeconomic stability, anchored on trade and fiscal surpluses. Over the past 5 years, trade, financial services, and telecommunications were the main drivers of growth in the services sector, posting a combined 24% growth in 2011, supported mainly by strong domestic demand and domestic lending. In telecommunications, the increased foreign investment due to low penetration rates was the main growth factor.
Tourism accounts for only 0.2% of the services sector output and has seen little growth over the past 5 years. The famous Silk Road’s 3 most important cities are located in Uzbekistan; Khiva, Bukhara and Samarkand. Uzbekistan has numerous smoothly connected roads and pathways that connect the various tourist spots. Moreover, the country is also blessed with 5 of UNESCO’s World Heritage Sites.
Primary 17%
Secondary 33%
Tertiary 50%
Distribution of GDP by Economic Sectors
Primary
Secondary
Tertiary
Figure 10: Distribution of GDP by Economic Sectors for Uzbekistan

REPU
BLIC
OF
UZB
EKIS
TAN
201
7
17
2.2.1. Tertiary Sector
Over the past five years, the tertiary sector in Uzbekistan has grown to become the largest sector contributing half of the GDP. The sector grew by 13.3% per annum from 2007 to 2011. Strong growth in services was underpinned by macroeconomic stability, anchored on trade and fiscal surpluses. Over the past 5 years, trade, financial services, and telecommunications were the main drivers of growth in the services sector, posting a combined 24% growth in 2011, supported mainly by strong domestic demand and domestic lending. In telecommunications, the increased foreign investment due to low penetration rates was the main growth factor.
Tourism accounts for only 0.2% of the services sector output and has seen little growth over the past 5 years. The famous Silk Road’s 3 most important cities are located in Uzbekistan; Khiva, Bukhara and Samarkand. Uzbekistan has numerous smoothly connected roads and pathways that connect the various tourist spots. Moreover, the country is also blessed with 5 of UNESCO’s World Heritage Sites.
2.2.2. Secondary Sector
The secondary sector makes up for 33% of the GDP of Uzbekistan. The industrial sector of Uzbekistan has been driven by raw materials extraction, cotton production and minerals. The dominant industries in the country are wool, cotton and silk and food processing. Uzavtosanoat is the key player in the automotive industry in the country and has joint agreements with Daimler-Benz (Germany) and Daewoo (ROK). Food-processing is the second largest industry in Uzbekistan because of the abundance of fruits and vegetables in the country.
Industrial Production Index of Uzbekistan grew on an average by 19.91% since 2004 and reached an all-time high of 41.12% in the second quarter of 2006. The growth rate reached its lowest point of 6% in the first quarter of 2013, which later increased to 6.6% in 2016.
2.2.3. Primary Sector
Mining and extraction of minerals is of utmost importance to the economy of Uzbekistan. Gold makes up for most of the foreign exchange earnings of the Country. Uzbekistan is the 9th largest gold producer in the world (2016) with 100 metric tons of mine production. The country also has a plethora of natural gas, oil and other metals such as copper, lead, zinc and uranium
Agriculture makes up 17% of Uzbekistan’s GDP and employs 28% of the total work force. One of the major crops grown in the country is cotton which is a legacy of the Soviet era polices when Uzbekistan was designated the main cotton growing region for the former USSR. However, after independence, the country started shifting its cotton production to wheat and other crops in a bid to increase its food security. It has reduced its cotton acreage from 2 million hectares in 1999 to 0.5 million hectares in 2015. The cultivation of wheat has jumped from 1 million hectares in 1999 to 2.3 million hectares in 2015.
Other agricultural products like fruits, silk and vegetables contribute another 8% to the country’s exports. In addition, the thrust on dairy & livestock has led to an increase in the number of cattle heads from 4 million in 1999 to 10 million in 2015.This has led to an increase in the production of meat & milk which is an important source for family incomes in the rural areas.

REPU
BLIC
OF
UZB
EKIS
TAN
201
7
18
2.3. Tourism The famous Silk Road’s 3 most important cities are located in Uzbekistan; Khiva, Bukhara and Samarkand, and which are major tourist attractions. Uzbekistan’s rich history has given life to its architectural diversity. It is home to some of the most beautiful examples of Muslim architecture. Uzbekistan is also blessed with 5 of UNESCO’s World Heritage Sites.
2.3.1. Historic Center of Bukhara
More the 2000 years old, Bukhara is the perfect example of a medieval city in Central Asia. It is situated on the famous Silk Route that connected the Middle East and Europe to China. Bukhara is home to a number of ancient monuments such as:
i. The Ark – A grand fortress built in 5th century AD as the residence of Bukhara’s Amirs. It was damaged by the Red Army during the Russian Civil War amidst the Battle of Bukhara in 1920.
The Ark

REPU
BLIC
OF
UZB
EKIS
TAN
201
7
19
ii. Po-i-Kalyan Mosque and Minarat - Kalyan Mosque was completed in 1514, during the Khanate of Bukhara. The Kalyan Minarat was also used as a place for executions and thus became famous as the Tower of Death.
Po-i-Kalyan Mosque
iii. Char Minar – It is a historic mosque completed in 1807. It is protected as a cultural heritage monument.
Char Minar

REPU
BLIC
OF
UZB
EKIS
TAN
201
7
20
2.3.2. Samarkand
The historic town was founded in the 7th century BC. The major monuments include the Registan Mosque and Madrasas, Bibi-Khanym Mosque, the Shakhi-Zinda compound and the Gur-Emir ensemble, as well as Ulugh-Beg’s Observatory.
i. Bibi Khanym Mosque – One of the most important monuments in Samarkand. It was the largest mosque in the Islamic World in the 15th century.
Bibi Khanym Mosque
ii. Registan – It was the public square at the heart of Samarkand. The square is surrounded by three madrassas’.
Registan
REPU
BLIC
OF
UZB
EKIS
TAN
201
7
21
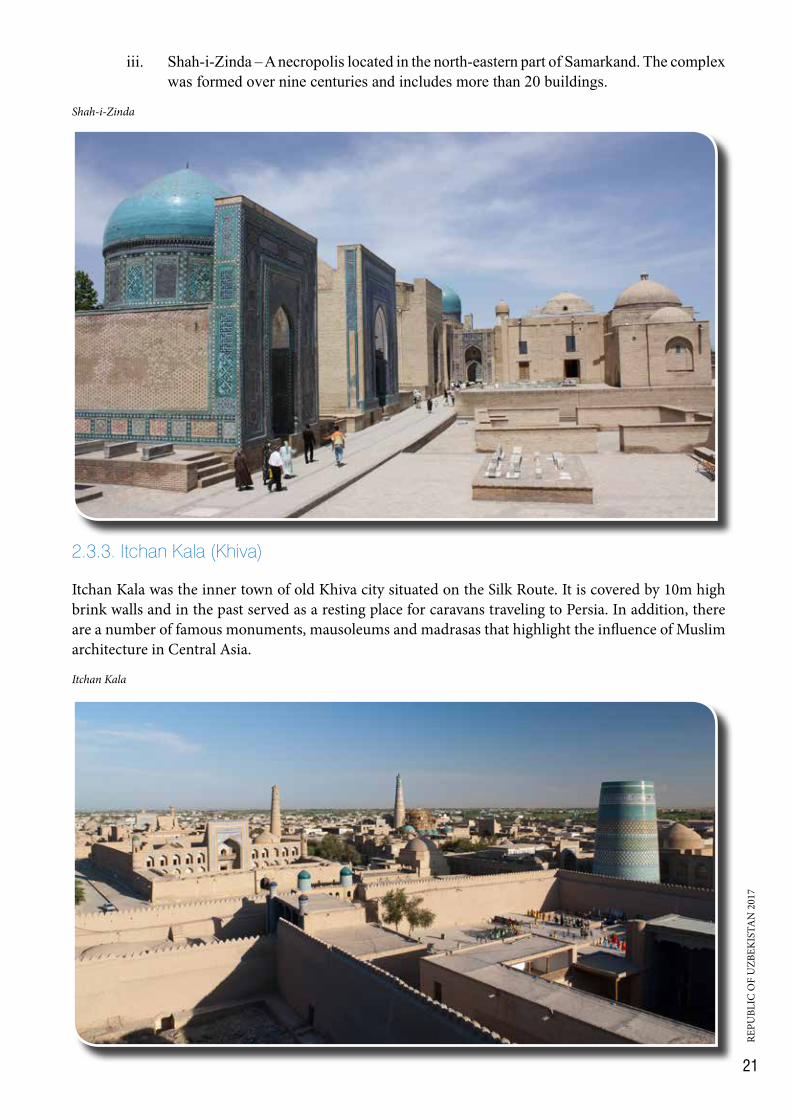
iii. Shah-i-Zinda – A necropolis located in the north-eastern part of Samarkand. The complex was formed over nine centuries and includes more than 20 buildings.
Shah-i-Zinda
2.3.3. Itchan Kala (Khiva)
Itchan Kala was the inner town of old Khiva city situated on the Silk Route. It is covered by 10m high brink walls and in the past served as a resting place for caravans traveling to Persia. In addition, there are a number of famous monuments, mausoleums and madrasas that highlight the influence of Muslim architecture in Central Asia.
Itchan Kala

REPU
BLIC
OF
UZB
EKIS
TAN
201
7
22
2.3.4. Historic Centre of Shakhrisyabz
Over 2,000 years old and located on the Silk Route in Southern Uzbekistan, it was the political and cultural center of the Kesh region in the 14th and 15th centuries. It contains a collection of beautiful monuments and ancient quarters which can be found within its medieval walls.
Shakhrisyabz
Shakhrisyabz

REPU
BLIC
OF
UZB
EKIS
TAN
201
7
23
2.3.5. Western Tien-Shan
The Western Tien-Shan is one of the longest mountain ranges in the world; it stretches 2,800 km east from Tashkent, which is the capital of Uzbekistan. Its altitude ranges from 700 m to 4,503 m. The Tien-Shan range is of global importance as the site of origin for many of the cultivated fruit crops. It is home to a wide range of forests and a unique plant community.
Western Tien-Shan

REPU
BLIC
OF
UZB
EKIS
TAN
201
7
24
2.4. Oil and Gas Pipelines2.4.1. Oil
Uzbekistan imports oil and its derivatives from Russia and Kazakhstan. Two major pipelines are used for the transportation of oil which are:
Figure 11: Map of Central Asian Oil Pipelines
1. Russia – Uzbekistan
The Omsk – Chardzhou pipeline starts in Omsk, Russia and ends in Chardzhou, Uzbekistan. It is an international oil pipeline that transports petroleum from Russia to Uzbekistan. The pipeline is used to transports oil from the Siberian city of Omsk through Pavlodar, Karaganda and Shymkent to Uzbekistan.
2. Kazakhstan – Uzbekistan
The Shymkent – Tashkent pipeline starts at the refinery in Shymkent, Kazakhstan and runs to Tashkent, Uzbekistan. The pipeline is used to import oil from Kazakhstan.

REPU
BLIC
OF
UZB
EKIS
TAN
201
7
25
2.4.2. Gas
There are a number of natural gas pipelines that originate from or cross Uzbekistan. Natural Gas is the second most exported product from Uzbekistan. The major gas pipelines are:
Figure 12: Map of Central Asian Gas Pipelines
1. Andienhan - Chembar Field Pipeline
The Andienhan - Chembar Field pipeline starts from Andienhan, Uzbekistan and ends at Chembar field, Uzbekistan. It is a local natural gas pipeline with the reference code D56.
2. Uzbekistan - Kazakhstan
The Chembar Field – Alma Ata is a natural gas pipeline that starts in Chembar Field, Uzbekistan and ends in Alma Ata, Kazakhstan. It is an international pipeline with the reference code D5.
3. Uzbekistan - Russia
Kungrad - Chelyabinsk Pipeline is an international pipeline that goes from Kungard, Uzbekistan to Chelyabinsk, Russia. It is the major pipeline for Uzbek natural gas exports to Russia. The reference code for the Kungard – Chelyabinsk Pipeline is D58.
4. Uzbekistan - Afghanistan
The international pipeline starts from Samarkand, Uzbekistan and ends at Mazar-i-Sharif, Afghanistan. The reference code for Mazar-i-Sharif – Samarkand Pipeline is G1. The pipeline is used to export gas to Afghanistan.

REPU
BLIC
OF
UZB
EKIS
TAN
201
7
26
1. Bukhara–Tashkent–Bishkek–Almaty pipeline
This is the main export pipeline for Uzbekistan’s natural gas. Construction of the pipeline started in 1967. In 1968, the pipeline reached Tashkent, in 1970 it was extended to Bishkek in Kyrgyzstan and finally to Almaty–Kazakhstan in 1971. The Bukhara–Tashkent–Bishkek–Almaty pipeline is the main source of gas supply for Kyrgyzstan and the southern parts of Kazakhstan.
2. Central Asia-China Pipeline
Central Asia–China gas pipeline also known as Turkmenistan-China gas pipeline originatess in Saman-Depe, Turkmenistan and ends at Horgos, Xinjiang province in the Peoples Republic of China. From Horgos, it connects to the West-East Gas Pipeline which goes from the western part of China to its eastern part. This pipeline goes through Uzbekistan and Kazakhstan before entering China. Work on the Uzbek part of the pipeline started on 30 June 2008 as a joint venture of Uzbekneftegas and CNPC. Uzbekistan also uses the Central Asia – China pipeline to export natural gas to China.
3. Central Asia–Center Gas Pipeline System
One pipeline originates from Okarem, Turkmenistan and ends at Alexandrov Gay, Russia. It travels through Khiva, Uzbekistan and Beyneu, Kazakhstan. Most of Uzbek and Turkmen natural gas to Russia is delivered through the CAC pipeline system

REPU
BLIC
OF
UZB
EKIS
TAN
201
7
27
2.5. One Belt One Road (OBOR)One Belt One Road (OBOR) is a Chinese led initiative. It is the 21st Century version of the ancient Silk Road. OBOR, in its final form, will provide energy, technology and cultural exchange amongst the member states.
Uzbekistan’s economic development model has been aligned with the OBOR initiative. China has agreed to invest in transportation projects such as railroads, roads and tunnels; some of which have already been completed. OBOR promises to bring strong economic development in the Central Asian region.
In Uzbekistan, foreign investments related to OBOR cover a wide range of sectors. Investments have been made in developing Uzbekistan’s natural gas reserves and transportation systems. The Central Asia – China Gas Pipeline is one such project; three pipelines have already been laid and a fourth is under construction, all of which pass through Uzbekistan. Chinese investment in the Uzbek economy amounts to about $6.5 billion already. Some joint projects have also been implemented such as the Jizzakh and Angren Economic and Industrial Zones.
Currently there is no direct rail link between Uzbekistan and China. Since China is Uzbekistan’s most important trading partner, having a direct link could potentially improve trade through lower freight cost. After prolonged talks, a railroad linking China, Uzbekistan and Kyrgyzstan was agreed upon in 2015. There have been some internal conflicts in Kyrgyzstan about OBOR as some argue that the north-south railway link connecting Russia-Kazakhstan-Kyrgyzstan-Tajikistan should be built first. By September 2016, Uzbekistan had finished 104 km of the 129 km of the Uzbek stretch of the railroad.
Figure 13: Map of the One Road One Belt Project


SECTION III Trade
State Museum of History of Uzbekistan, Tashkent, Uzbekistan

REPU
BLIC
OF
UZB
EKIS
TAN
201
7
30

REPU
BLIC
OF
UZB
EKIS
TAN
201
7
31
3.1 Trade OverviewUzbekistan is the world’s 70th largest economy in nominal GDP terms according to the World Bank (2016). It is ranked as the 97th most complex economy according to the Economic Complexity Index (ECI) (2015). In the year 2016, Uzbekistan exported $7 billion worth of goods and services and imported goods valued at $9.1 billion; this resulted in a negative trade balance of about $2.1 billion.
The major exports of Uzbekistan include gold, natural gas, pure cotton yarn and refined copper. Uzbekistan’s top imports are vehicular parts, machinery, iron and steel and pharmaceuticals. Additionally, the major trading partners of Uzbekistan are China, the Russian Federation, Switzerland, Kazakhstan and Turkey.
Uzbekistan’s trade balance had been positive till 2007 as exports stayed ahead of imports after which it started to turn negative. The deficit reached its highest point in 2014 with a negative trade balance of US$ 6.5 billion as imports rose to $13.5 billion. The trade deficit can be attributed to a rise in imports without any significant rise in exports. After 2014, imports started to fall; imports reached $9.1 billion in 2016 from $13.5 billion in 2014. The trade deficit in 2016 was $2.16 billion.
REPUBLIC OF UZBEKISTAN 42
3.1 Trade Overview Uzbekistan is the world’s 70th largest economy in nominal GDP terms according to the World Bank (2016). It is ranked as the 97th most complex economy according to the Economic Complexity Index (ECI) (2015). In the year 2016, Uzbekistan exported $7 billion worth of goods and services and imported goods valued at $9.1 billion; this resulted in a negative trade balance of about $2.1 billion.
The major exports of Uzbekistan include gold, natural gas, pure cotton yarn and refined copper. Uzbekistan’s top imports are vehicular parts, machinery, iron and steel and pharmaceuticals. Additionally, the major trading partners of Uzbekistan are China, the Russian Federation, Switzerland, Kazakhstan and Turkey.
Uzbekistan’s trade balance had been positive till 2007 as exports stayed ahead of imports after which it started to turn negative. The deficit reached its highest point in 2014 with a negative trade balance of US$ 6.5 billion as imports rose to $13.5 billion. The trade deficit can be attributed to a rise in imports without any significant rise in exports. After 2014, imports started to fall; imports reached $9.1 billion in 2016 from $13.5 billion in 2014. The trade deficit in 2016 was $2.16 billion.
Figure 14: Uzbekistan's Trade overview (2001-2016) (US$ Millions)
224
-6,436 -2,157
-10,000
-5,000
0
5,000
10,000
15,000
2001 2002 2003 2004 2005 2006 2007 2008 2009 2010 2011 2012 2013 2014 2015 2016US$
(mill
ions
)
Year
Trade Overview
Exports Imports Trade Balance
Figure 14: Uzbekistan’s Trade overview (2001-2016) (US$ Millions)

REPU
BLIC
OF
UZB
EKIS
TAN
201
7
32
3.2. Trade Trend: Products3.2.1. Imports
The table below shows imports of Uzbekistan over the last five years, at HS-02 level. Imports of Uzbekistan comprise mainly of machinery, mechanical appliance and vehicles. Imports have however have been declining over the years since the country has adopted a policy of self-reliance in producing some goods. The top 10 imports at HS-02 Level contribute about 66% of the total imports of Uzbekistan.
2012 2013 2014 2015 2016'TOTAL All products 10,965.9 12,882.9 13,580.2 10,478.5 9,140.9
Product Code Product Description
'84 Machinery, mechanical appliances, nuclear reactors, boilers; parts thereof 1,946.9 2,180.2 2,529.8 2,021.5 1,631.2
'87 Vehicles other than railway or tramway rolling … 1,496.7 1,730.5 1,597.8 1,005.5 842.3
'85 Electrical machinery and equipment and parts thereof … 702.4 819.3 1,021.0 824.0 709.3
'72 Iron and steel 626.0 763.5 803.8 598.8 530.4
'30 Pharmaceutical products 485.6 572.9 685.0 635.9 521.5
'27 Mineral fuels, mineral oils and products of their distillation … 685.0 823.8 737.5 616.5 474.6
'39 Plastics and articles thereof 344.9 469.9 498.9 449.4 368.5
'73 Articles of iron or steel 520.5 768.9 627.4 345.4 318.0
'88 Aircraft, spacecraft, and parts thereof 233.9 231.9 152.4 105.4 307.5
'44 Wood and articles of wood; wood charcoal 511.3 662.4 640.9 361.0 303.5
Table 3: Uzbekistan’s Imports Product Wise (HS-02) (2012-2016) (US$ Millions)
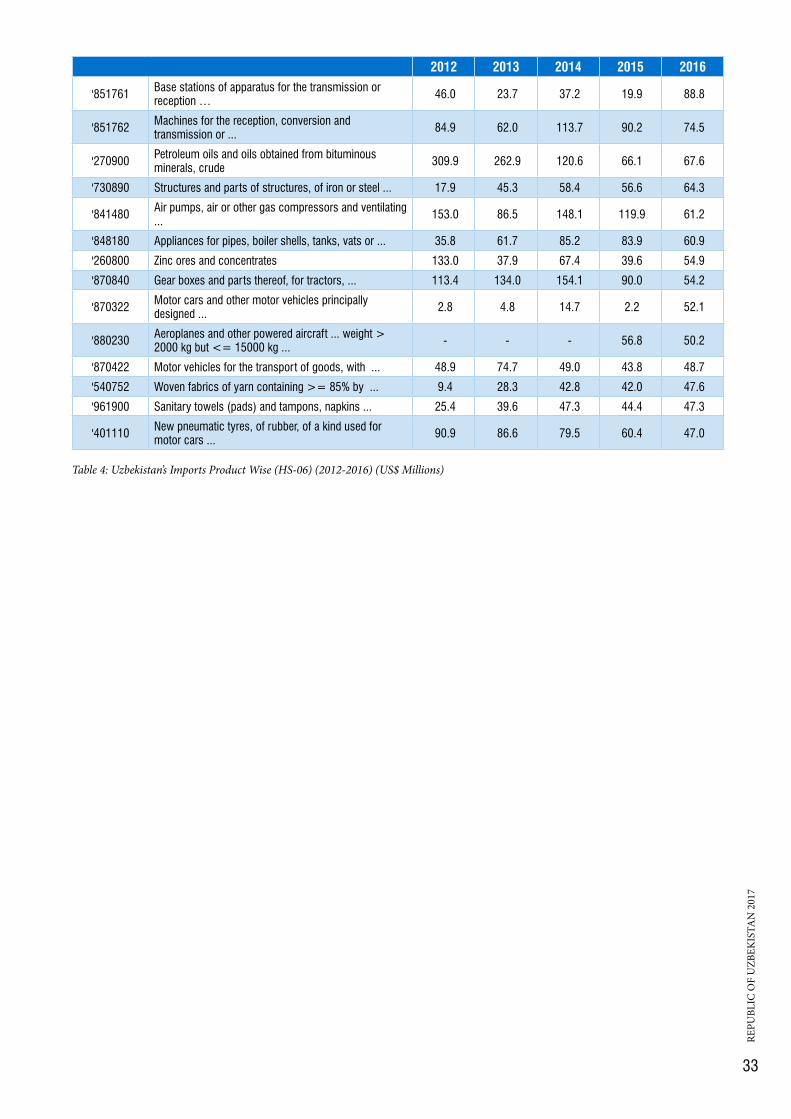
The table below shows imports at HS-06 level for the last five years. It shows that medicaments for therapy, medium oils and accessories for vehicles comprise most of the imports. A decreasing trend can be observed in imports between 2012 & 2016. The top 25 imports for Uzbekistan contribute about 33% of total imports, which shows that Uzbekistan imports a wide range of goods.
2012 2013 2014 2015 2016'TOTAL All products 10,965.9 12,882.9 13,580.2 10,478.5 9,140.9
Product Code Product Description
'300490 Medicaments consisting of mixed or unmixed ... 356.2 418.2 492.8 439.5 353.4
'271019 Medium oils and preparations, of petroleum or bituminous minerals ... 306.4 468.0 480.4 489.2 338.4
'999999 Commodities not elsewhere specified 320.3 370.5 243.9 147.5 336.4
'870899 Parts and accessories, for tractors, motor vehicles ... 660.8 639.9 564.9 352.7 260.5
'100199 Wheat and meslin (excluding seed for sowing, and durum wheat) 90.8 120.2 153.7 206.1 201.8
'440710 Coniferous wood sawn or chipped lengthwise, ... 320.8 429.9 413.7 210.8 166.5
'110100 Wheat or meslin flour 291.0 273.2 232.5 195.4 127.5
'151219 Sunflower-seed or safflower oil and their fractions, ... 133.3 142.8 156.5 99.6 107.1
'721070 Flat products of iron or non-alloy steel, of a width of >= 600 mm, ... 42.7 103.1 142.6 105.5 101.7
'870323 Motor cars and other motor vehicles principally ... 208.3 263.1 155.7 99.7 98.4
'721049 Flat-rolled products of iron or non-alloy steel, of a width of >= 600 mm, ... 143.3 202.5 184.0 132.7 97.8
REPU
BLIC
OF
UZB
EKIS
TAN
201
7
33
2012 2013 2014 2015 2016
'851761 Base stations of apparatus for the transmission or reception … 46.0 23.7 37.2 19.9 88.8
'851762 Machines for the reception, conversion and transmission or ... 84.9 62.0 113.7 90.2 74.5
'270900 Petroleum oils and oils obtained from bituminous minerals, crude 309.9 262.9 120.6 66.1 67.6
'730890 Structures and parts of structures, of iron or steel ... 17.9 45.3 58.4 56.6 64.3
'841480 Air pumps, air or other gas compressors and ventilating ... 153.0 86.5 148.1 119.9 61.2
'848180 Appliances for pipes, boiler shells, tanks, vats or ... 35.8 61.7 85.2 83.9 60.9
'260800 Zinc ores and concentrates 133.0 37.9 67.4 39.6 54.9
'870840 Gear boxes and parts thereof, for tractors, ... 113.4 134.0 154.1 90.0 54.2
'870322 Motor cars and other motor vehicles principally designed ... 2.8 4.8 14.7 2.2 52.1
'880230 Aeroplanes and other powered aircraft ... weight > 2000 kg but <= 15000 kg ... - - - 56.8 50.2
'870422 Motor vehicles for the transport of goods, with ... 48.9 74.7 49.0 43.8 48.7
'540752 Woven fabrics of yarn containing >= 85% by ... 9.4 28.3 42.8 42.0 47.6
'961900 Sanitary towels (pads) and tampons, napkins ... 25.4 39.6 47.3 44.4 47.3
'401110 New pneumatic tyres, of rubber, of a kind used for motor cars ... 90.9 86.6 79.5 60.4 47.0
Table 4: Uzbekistan’s Imports Product Wise (HS-06) (2012-2016) (US$ Millions)

REPU
BLIC
OF
UZB
EKIS
TAN
201
7
34
3.2.2. Exports
The exports of Uzbekistan mainly depend on gold, mineral fuels, cotton and copper. According to the table below, the export trend for natural pearls and gold increased because of the increase in the country’s mining output. The export of Gold alone makes up about 40% of its total exports. The export of cotton has fallen by about 50% over the past 5 years primarily due to a shift from growing cotton to growing wheat and other crops. The top 10 exports of Uzbekistan at HS-02 add up to 92% of its total exports and this shows Uzbekistan’s dependence on these 10 product groups. The table below shows Uzbekistan’s exports product wise at HS-02 level.
2012 2013 2014 2015 2016'TOTAL All products 6,428.9 8,489.6 7,144.5 6,399.9 6,983.6
Product Code Product Description
'71 Natural or cultured pearls, precious or semi-precious stones ... 696.3 1,804.1 1,445.3 1,935.2 2,900.4
'27 Mineral fuels, mineral oils and products of their distillation ... 894.5 1,586.0 1,472.4 666.9 813.7
'52 Cotton 1,447.9 1,356.2 925.3 1,113.4 720.9
'74 Copper and articles thereof 624.0 611.9 598.0 570.2 455.2
'39 Plastics and articles thereof 62.5 55.8 52.2 45.6 392.3
'08 Edible fruit and nuts; peel of citrus fruit or melons 354.0 351.6 350.4 267.8 390.5
'28 Inorganic chemicals; organic or inorganic compounds … 328.5 444.4 381.6 463.2 323.1
'61 Articles of apparel and clothing accessories, knitted or crocheted 194.6 218.0 178.4 153.0 187.9
'07 Edible vegetables and certain roots and tubers 122.8 220.7 216.5 174.2 127.4
'79 Zinc and articles thereof 109.5 102.5 115.4 106.6 114.8
Table 5: Uzbekistan’s Exports Product Wise (HS-02) (2012-2016) (US$ Millions)
The table below shows exports classified according to the Harmonized System – 06 level. Gold, is by far the largest export commodity. The top 25 exports of Uzbekistan at HS-06 level represent 85% of its total exports to the world.
2012 2013 2014 2015 2016'TOTAL All products 6,428.9 8,489.6 7,144.5 6,399.9 6,983.6
Product Code Product Description
'710812 Gold, incl. gold plated with platinum, unwrough … 658.3 1,769.0 1,403.7 1,895.3 2,861.3
'271121 Natural gas in gaseous state 270.0 1,194.1 1,031.9 639.3 801.3
'390120 Polyethylene with a specific gravity of >= 0,94, in primary forms 32.7 25.1 22.9 26.0 317.9
'284410 Natural uranium and its compounds; alloys ... 288.8 393.8 335.7 430.2 288.0
'740311 Copper, refined, in the form of cathodes and sections of cathodes 450.8 446.9 388.2 342.5 253.4
'520100 Cotton, neither carded nor combed 1,072.7 894.4 390.7 573.9 199.3
'520512 Single cotton yarn, of uncombed fibres, containing >= 85% ... 133.0 170.3 156.1 155.3 148.1
'520514 Single cotton yarn, of uncombed fibres, containing >= 85% … 68.7 77.7 137.7 179.2 137.8
'790112 Unwrought zinc, not alloyed, containing by weight < 99,99% of zinc 109.4 102.4 115.4 106.6 113.2
'080620 Dried grapes 34.4 24.1 37.2 69.8 82.7

REPU
BLIC
OF
UZB
EKIS
TAN
201
7
35
2012 2013 2014 2015 2016
'610910 T-shirts, singlets and other vests of cotton, knitted or crocheted 91.9 97.2 79.6 70.3 78.2
'520513 Single cotton yarn, of uncombed fibres, containing >= 85% ... 36.3 57.2 65.8 55.0 75.4
'740819 Wire of refined copper, with a maximum cross-sectional dimension of <= 6 mm 88.1 101.2 96.5 63.5 71.7
'080610 Fresh grapes 126.5 28.7 86.9 66.3 69.7
'740811 Wire of refined copper, with a maximum cross-sectional dimension of > 6 mm 75.2 48.7 61.7 72.3 60.8
'080929 Fresh cherries (excluding sour cherries) 10.2 42.3 43.6 15.7 51.6
'390210 Polypropylene, in primary forms - 0.0 - 0.1 40.9
'711292 Waste and scrap of platinum, incl. metal clad with platinum ... - 28.9 33.7 27.0 36.3
'081070 Fresh persimmons 31.3 51.1 16.8 10.5 35.4
'520523 Single cotton yarn, of combed fibres, containing >= 85% ... 19.4 19.6 36.4 22.3 33.9
'080910 Fresh apricots 17.7 62.0 27.7 11.1 29.5
'080930 Fresh peaches, incl. nectarines 26.8 19.8 30.3 12.8 28.2
'070200 Tomatoes, fresh or chilled 16.0 22.5 22.3 36.2 28.0
'870322 Motor cars and other motor vehicles principally ... 282.2 453.4 358.1 44.8 27.0
'070999 Fresh or chilled vegetables n.e.s. 18.5 32.3 29.6 28.5 26.3
Table 6: Uzbekistan’s Exports Product Wise (HS-06) (2012-2016) (US$ Millions)

REPU
BLIC
OF
UZB
EKIS
TAN
201
7
36
3.3. Trade Trend: Partners3.3.1. Top 10 Export Partners of Uzbekistan (2016)
The major countries that Uzbekistan exports to are Switzerland, China and the Russian Federation. Exports to Switzerland and China have increased over the last of 5 years. Most of the exports from Uzbekistan to Switzerland comprise of gold and gold plates. On the other hand, exports to the Russian Federation declined primarily because of the financial crisis in Russia (2014), which caused a downturn in the Russian economy. We can see from the table and graph below that Uzbekistan is not fully dependent on any country as its trade partner, rather, its trade is distributed amongst a number of countries. Although, trade with Afghanistan amounted to $336 million in 2015 it is not included in the 2016 list as data for Uzbekistan’s exports for Afghanistan in 2016 was not available at the time of preparation of this Study.
2012 2013 2014 2015 2016Total 6,428.9 8,489.6 7,144.5 6,399.8 6,983.4
Rank Country (Importer)
1 Switzerland 543.2 1,539.0 1,336.2 1,884.2 2,863.6
2 China 1,091.8 1,938.1 1,597.7 1,266.8 1,606.9
3 Russian Federation 1,390.8 1,256.9 869.8 575.8 761.0
4 Turkey 813.3 815.4 780.7 711.6 709.3
5 Kazakhstan 817.2 970.1 1,017.7 725.7 587.8
6 Kyrgyzstan 63.2 97.6 102.2 59.2 69.8
7 France 156.3 167.8 131.8 177.3 66.1
8 India 33.6 35.1 39.1 56.5 46.5
9 Poland 31.4 25.8 29.1 28.0 32.4
10 United States of America 26.3 26.9 15.1 10.2 31.2
Table 7: Top 10 Export Partners of Uzbekistan (US$ Millions) (2012-2016)

REPU
BLIC
OF
UZB
EKIS
TAN
201
7
37
REPUBLIC OF UZBEKISTAN 50
Figure 15: Top 10 Export Partners of Uzbekistan (US$ Millions) (2012-2016)
0.00
500.00
1000.00
1500.00
2000.00
2500.00
3000.00
3500.00
2012 2013 2014 2015 2016
US$
(Mill
ions
)
Year
Top 10 Export Partners
Switzerland China Russian Federation
Turkey Kazakhstan Kyrgyzstan
France India Poland
United States of America
Figure 15: Top 10 Export Partners of Uzbekistan (US$ Millions) (2012-2016)

REPU
BLIC
OF
UZB
EKIS
TAN
201
7
38
3.3.2. Top 10 Import Partners of Uzbekistan (2016)
The top countries from which Uzbekistan imports goods are China, the Russian Federation, Republic of Korea and Kazakhstan. Imports from China, however, have fallen over the last 3 years from $2.6 billion to $2 billion, yet it still has the largest share of Uzbekistan’s imports. During the last 5 years imports from the Russian Federation, Korea and Kazakhstan have fallen, while that from Japan and Lithuania have risen. The fall in trade with Russia has been attributed to the devaluation of the Russian Ruble due to a slump in global oil prices as well as Western sanctions over Ukraine over the last two years.
2012 2013 2014 2015 2016Total 10,965.8 12,882.9 13,580.3 10,486.4 9,163.1
Country (Importer)
1 China 1,783.3 2,613.4 2,678.3 2,236.4 2,033.3
2 Russian Federation 2,324.7 2,803.9 3,113.6 2,221.2 1,965.0
3 Korea, Republic of 1,766.5 1,968.0 2,032.7 1,284.2 930.5
4 Kazakhstan 1,343.7 1,145.3 1,083.9 942.3 922.5
5 Turkey 449.9 562.5 603.0 488.7 533.3
6 Germany 517.3 572.3 671.1 478.9 500.4
7 United States of America 284.6 356.4 212.9 138.0 318.0
8 Italy 141.7 121.5 197.7 154.2 195.2
9 Japan 97.6 122.9 168.0 251.3 160.3
10 Lithuania 48.2 102.1 133.2 123.5 125.7
Table 8: Top 10 Import Partners of Uzbekistan (US$ Millions) (2012-2016)

REPU
BLIC
OF
UZB
EKIS
TAN
201
7
39
REPUBLIC OF UZBEKISTAN 52
Figure 16: Top 10 Import Partners of Uzbekistan (US$ Millions) (2012-2016)
0
500
1000
1500
2000
2500
3000
3500
2012 2013 2014 2015 2016
US$
(Mill
lions
)
Year
Top 10 Import Partners
China Russian Federation Korea, Republic of
Kazakhstan Turkey Germany
United States of America Italy Japan
Lithuania
Figure 16: Top 10 Import Partners of Uzbekistan (US$ Millions) (2012-2016)

REPU
BLIC
OF
UZB
EKIS
TAN
201
7
40
3.4 Trade AlliancesUzbekistan is a member of three major alliances: Organization of Islamic Cooperation (OIC), Commonwealth of independent states (CIS) and the Economic Cooperation Organization (ECO).
3.4.1. Organization of Islamic Cooperation
OIC was founded in 1969 and consists of 57-member countries. The organization was founded to be the collective voice of the Islamic world. Its core purpose is to “safeguard and protect the interests of the Muslim world in the spirit of promoting international peace and harmony”. The OIC has permanent delegations to the United Nations and the European Union. The official languages of the OIC are Arabic, English, and French.
Uzbekistan’s balance of trade with members of the OIC has mostly been positive. In 2010, the trade surplus reached $1.3 billion with the members of OIC. Since then, the balance of trade has seen a negative trend due to rising imports and falling exports. The graph below shows the exports, imports and trade balance between Uzbekistan and members of OIC.
REPUBLIC OF UZBEKISTAN 53
3.4 Trade Alliances Uzbekistan is a member of three major alliances: Organization of Islamic Cooperation (OIC), Commonwealth of independent states (CIS) and the Economic Cooperation Organization (ECO).
3.4.1. Organization of Islamic Cooperation OIC was founded in 1969 and consists of 57-member countries. The organization was founded to be the collective voice of the Islamic world. Its core purpose is to "safeguard and protect the interests of the Muslim world in the spirit of promoting international peace and harmony". The OIC has permanent delegations to the United Nations and the European Union. The official languages of the OIC are Arabic, English, and French.
Uzbekistan’s balance of trade with members of the OIC has mostly been positive. In 2010, the trade surplus reached $1.3 billion with the members of OIC. Since then, the balance of trade has seen a negative trend due to rising imports and falling exports. The graph below shows the exports, imports and trade balance between Uzbekistan and members of OIC.
Figure 17: Uzbekistan's Trade with Members of Organization of Islamic Cooperation (US$ Millions) (2007-2016)
588.86
1316.55
-302.676 -500
0
500
1000
1500
2000
2500
3000
3500
2007 2008 2009 2010 2011 2012 2013 2014 2015 2016
US$
(Mill
ions
)
Year
Organization of Islamic Cooperation
Exports Imports Balance of Trade
Figure 17: Uzbekistan’s Trade with Members of Organization of Islamic Cooperation (US$ Millions) (2007-2016)

REPU
BLIC
OF
UZB
EKIS
TAN
201
7
41
3.4.2. Commonwealth of Independent States
The Commonwealth of independence States (CIS), also known as the Russian commonwealth, is a loose confederation of nine-member states and two associate members. The CIS was formed after the dissolution of the Soviet Union; all members were previously a part of the Soviet Union. CIS possesses coordinating powers in areas of finance, lawmaking, security and trade. Members participate in the CIS Free Trade Area.
Although the members of CIS participate in a free trade agreement, Uzbekistan has had a trade deficit for the last 10 years. The reason for the rising trade deficit can be attributed to the fall in exports after they reached $3.3 billion in 2011; in 2016, exports to members of CIS further fell to $1.5 billion. The trade deficit with members of CIS reached $2.7 billion in 2014 after which it experienced a slight improvement. The Graph below shows Uzbekistan’s trade with members of the Commonwealth of Independent States.
REPUBLIC OF UZBEKISTAN 54
3.4.2. Commonwealth of Independent States The Commonwealth of independence States (CIS), also known as the Russian commonwealth, is a loose confederation of nine-member states and two associate members. The CIS was formed after the dissolution of the Soviet Union; all members were previously a part of the Soviet Union. CIS possesses coordinating powers in areas of finance, lawmaking, security and trade. Members participate in the CIS Free Trade Area.
Although the members of CIS participate in a free trade agreement, Uzbekistan has had a trade deficit for the last 10 years. The reason for the rising trade deficit can be attributed to the fall in exports after they reached $3.3 billion in 2011; in 2016, exports to members of CIS further fell to $1.5 billion. The trade deficit with members of CIS reached $2.7 billion in 2014 after which it experienced a slight improvement. The Graph below shows Uzbekistan’s trade with members of the Commonwealth of Independent States.
Figure 18: Uzbekistan's Trade with Members of Commonwealth of Independent States (US$ Millions) (2007-2016)
-390.16
-2,702.29
-1,667.36
-4000
-3000
-2000
-1000
0
1000
2000
3000
4000
5000
6000
2007 2008 2009 2010 2011 2012 2013 2014 2015 2016US$
(Mill
ions
)
Year
Commonwealth of Independent States
Exports Imports Balance of Trade
Figure 18: Uzbekistan’s Trade with Members of Commonwealth of Independent States (US$ Millions) (2007-2016)

REPU
BLIC
OF
UZB
EKIS
TAN
201
7
42
3.4.3. Economic Cooperation Organization
Economic Cooperation Organization (ECO) is a Eurasian political and economic intergovernmental organization which was founded in 1985 in Tehran by the leaders of Iran, Pakistan and Turkey. It provides a platform to discuss ways to improve development and promote trade and investment opportunities. The objective is to establish a single market for goods and services, much like the European Union.
Over the last ten years, Uzbekistan’s trade with members of ECO has constantly been in the negative. The trade deficit was on a rising trend up until 2014; when it reached its highest point of about $6.5 billion. Since then, the deficit has been declining due to a large decrease in imports while exports stayed constant. The Graph below shows Uzbekistan’s trade with members of the Economic Cooperation Organization.
REPUBLIC OF UZBEKISTAN 55
3.4.3. Economic Cooperation Organization Economic Cooperation Organization (ECO) is a Eurasian political and economic intergovernmental organization which was founded in 1985 in Tehran by the leaders of Iran, Pakistan and Turkey. It provides a platform to discuss ways to improve development and promote trade and investment opportunities. The objective is to establish a single market for goods and services, much like the European Union.
Over the last ten years, Uzbekistan’s trade with members of ECO has constantly been in the negative. The trade deficit was on a rising trend up until 2014; when it reached its highest point of about $6.5 billion. Since then, the deficit has been declining due to a large decrease in imports while exports stayed constant. The Graph below shows Uzbekistan’s trade with members of the Economic Cooperation Organization.
Figure 19: Uzbekistan's Trade with members of Economic Cooperation Organization (US$ Millions) (2007-2016)
109.68
-6,435.76
-2,157.30
-10000
-5000
0
5000
10000
15000
2007 2008 2009 2010 2011 2012 2013 2014 2015 2016US$
(Mill
ions
)
Years
Economic Cooperation Organization
Exports Imports Balance of Trade
Figure 19: Uzbekistan’s Trade with members of Economic Cooperation Organization (US$ Millions) (2007-2016)

REPU
BLIC
OF
UZB
EKIS
TAN
201
7
43
3.4.4. World Trade Organization
The World Trade Organization (WTO) is an intergovernmental organization that regulates international trade. It is the largest international economic organization in the world. The WTO deals with regulation of trade between participating countries. It provides a framework for negotiating trade agreements and a dispute resolution mechanism for its members. Uzbekistan is not a member of WTO but is only an observer. The process of accession into the WTO was commenced in December of 1994. Uzbekistan has passed the preliminary stages of accession to the WTO and is now negotiating with member countries of the WTO. Trade with members of WTO makes up for most of Uzbekistan’s trade with the world.
REPUBLIC OF UZBEKISTAN 56
3.4.4. World Trade Organization The World Trade Organization (WTO) is an intergovernmental organization that regulates international trade. It is the largest international economic organization in the world. The WTO deals with regulation of trade between participating countries. It provides a framework for negotiating trade agreements and a dispute resolution mechanism for its members. Uzbekistan is not a member of WTO but is only an observer. The process of accession into the WTO was commenced in December of 1994. Uzbekistan has passed the preliminary stages of accession to the WTO and is now negotiating with member countries of the WTO. Trade with members of WTO makes up for most of Uzbekistan’s trade with the world.
Figure 20: Uzbekistan's Trade with Members of World Trade Organization (US$ Millions) (2007-2016)
512.31
-7,029.28
-1,820.40
-10000
-5000
0
5000
10000
15000
2007 2008 2009 2010 2011 2012 2013 2014 2015 2016US$
(Mill
ions
)
Year
World Trade Organisation
Exports Imports Balance of Trade
Figure 20: Uzbekistan’s Trade with Members of World Trade Organization (US$ Millions) (2007-2016)

REPU
BLIC
OF
UZB
EKIS
TAN
201
7
44
3.4.5 Regional Free Trade Agreements
Uzbekistan is a part of a number of Free Trade Agreements (FTA) with its neighboring countries. Uzbekistan also joined the Economic Cooperation Organization in 2003, to facilitate increased trade with members of the organization. Recently, Uzbekistan joined the Commonwealth of Independent States Free Trade Agreement and is the 9th member of this trade bloc. In addition to the multilateral CIS FTA, Uzbekistan has signed a number of bilateral trade agreements with members of the CIS. Bilateral FTA have been signed with Kyrgyzstan, Tajikistan, Ukraine, Azerbaijan, Russia, Moldova and Georgia. Detailed data on these FTA could not be found.
Name of FTA Signed and In Effect Members
Azerbaijan-Uzbekistan FTA 5/27/1996 2
Commonwealth of Independent States Free Trade Area 9/20/2012 12
Economic Cooperation Organization Trade Agreement 7/17/2003 10
Kyrgyz-Uzbekistan FTA 3/20/1998 2
Tajikistan-Uzbekistan FTA 1/1/1996 2
Ukraine-Uzbekistan FTA 1/1/2006 2
Uzbekistan-Georgia FTA 1/1/1995 2
Uzbekistan-Kazakhstan FTA 1/1/1997 2
Uzbekistan-Moldova FTA 1/1/1995 2
Uzbekistan-Russia FTA 3/25/1993 2
Table 9: Free Trade Agreements Signed by Uzbekistan

SECTION IVUzbekistan’s Trade Partners
Bibi Khanym Mosque, Samarkand, Uzbekistan

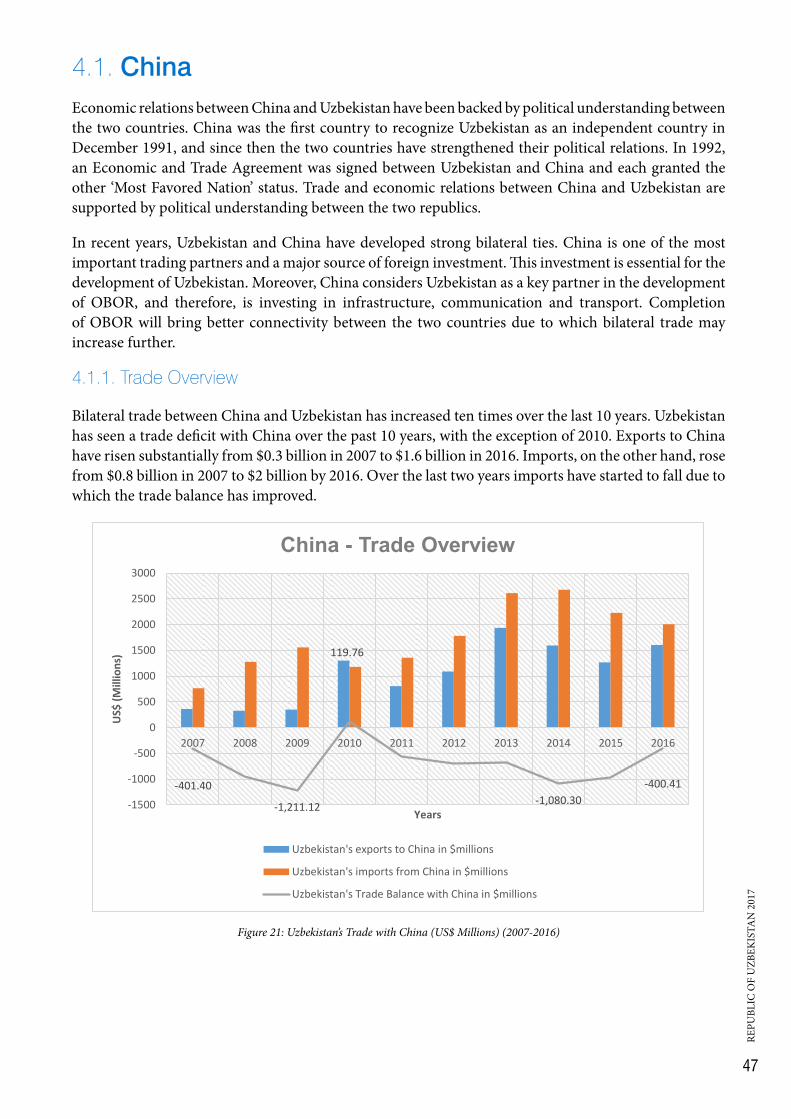
REPU
BLIC
OF
UZB
EKIS
TAN
201
7
47
4.1. ChinaEconomic relations between China and Uzbekistan have been backed by political understanding between the two countries. China was the first country to recognize Uzbekistan as an independent country in December 1991, and since then the two countries have strengthened their political relations. In 1992, an Economic and Trade Agreement was signed between Uzbekistan and China and each granted the other ‘Most Favored Nation’ status. Trade and economic relations between China and Uzbekistan are supported by political understanding between the two republics.
In recent years, Uzbekistan and China have developed strong bilateral ties. China is one of the most important trading partners and a major source of foreign investment. This investment is essential for the development of Uzbekistan. Moreover, China considers Uzbekistan as a key partner in the development of OBOR, and therefore, is investing in infrastructure, communication and transport. Completion of OBOR will bring better connectivity between the two countries due to which bilateral trade may increase further.
4.1.1. Trade Overview
Bilateral trade between China and Uzbekistan has increased ten times over the last 10 years. Uzbekistan has seen a trade deficit with China over the past 10 years, with the exception of 2010. Exports to China have risen substantially from $0.3 billion in 2007 to $1.6 billion in 2016. Imports, on the other hand, rose from $0.8 billion in 2007 to $2 billion by 2016. Over the last two years imports have started to fall due to which the trade balance has improved.
REPUBLIC OF UZBEKISTAN 60
Figure 21: Uzbekistan's Trade with China (US$ Millions) (2007-2016)
-401.40
-1,211.12
119.76
-1,080.30 -400.41
-1500
-1000
-500
0
500
1000
1500
2000
2500
3000
2007 2008 2009 2010 2011 2012 2013 2014 2015 2016
US$
(Mill
ions
)
Years
China - Trade Overview
Uzbekistan's exports to China in $millions
Uzbekistan's imports from China in $millions
Uzbekistan's Trade Balance with China in $millions
Figure 21: Uzbekistan’s Trade with China (US$ Millions) (2007-2016)

REPU
BLIC
OF
UZB
EKIS
TAN
201
7
48
4.1.2. Imports
Imports from China increased substantially from $0.7 billion in 2007 to $2 billion in 2016, largely because of the growing economic and political relations between the two countries. The table below shows imports from China which consist mainly of machinery, mechanical appliances, electrical machinery, plastics and iron and steel. The imports have grown considerably for all the top imported products except for articles of iron and steel which fell by about 80% since 2013. The tables below show imports from China at HS-02 and HS-06 levels.
2012 2013 2014 2015 2016‘TOTAL All Products 1,783.3 2,613.4 2,678.2 2,228.8 2,007.5
Product Code Product Description
'84 Machinery, mechanical appliances, … 469.1 585.1 584.9 523.2 485.9
'85 Electrical machinery and equipment and ... 246.1 239.6 317.3 334.1 316.9
'39 Plastics and articles thereof 118.3 172.0 176.2 156.0 151.6
'72 Iron and steel 96.8 165.4 190.6 133.4 134.0
'73 Articles of iron or steel 207.9 448.7 277.4 135.5 95.9
Table 10: Uzbekistan’s Imports from China (HS-02) (US$ Millions) (2012-2016)
2012 2013 2014 2015 2016‘TOTAL All Products 1,783.3 2,613.4 2,678.2 2,228.8 2,007.5
Product Code Product Description
'851761 Base stations of apparatus for the transmission… 45.5 18.1 30.9 15.2 87.0
'721070 Flat products of iron ... width of >= 600 mm, ... 24.4 77.5 114.9 73.0 76.7
'851762 Machines for the reception, ... 58.1 45.1 54.0 58.9 53.1
'540752 Woven fabrics of yarn containing >= 85% ... 7.0 27.3 42.3 41.6 47.3
'390410 Poly"vinyl chloride", in primary forms, … 34.9 47.5 44.9 32.0 37.8
Table 11: Uzbekistan’s Imports from China (HS-06) (US$ Millions) (2012-2016)
4.1.3. Exports
Exports to China, amounted to $1,607.1 million in 2016, which was the highest since Uzbekistan’s independence. The trend of exports can be seen as increasing due to the ‘Belt and Road’ initiative by China.
The most exported products to China comprised of mineral fuels, cotton and inorganic chemicals. However, the exports of cotton to China decreased over the years from $794.7 million in 2012 to $348.5 million in 2016, largely because of the shift in cropping patterns from cotton to wheat. Exports of plastics and copper have risen from $1.4 and $3.3 million in 2015 to $163.3 and $78.1 million in 2016 respectively. The rise in the exports of plastics can be attributed to the sudden jump in exports of polyethylene to $144 million in 2016. The tables below show the goods exported to China at HS-02 and HS-06 levels.

REPU
BLIC
OF
UZB
EKIS
TAN
201
7
49
2012 2013 2014 2015 2016‘TOTAL All Products 1,091.8 1,938.1 1,597.9 1,267.1 1,607.1
Product Code Product Description
'27 Mineral fuels, mineral oils and products ... 70.0 967.2 802.6 372.3 689.8
'52 Cotton 794.7 686.5 525.7 547.8 348.5
'28 Inorganic chemicals; organic or inorganic … 126.9 222.7 213.8 264.7 206.3
'39 Plastics and articles thereof 1.5 1.0 5.2 1.4 163.3
'74 Copper and articles thereof - 1.9 2.6 3.3 78.1
Table 12: Uzbekistan’s Exports to China (HS-02) (US$ Millions) (2012-2016)
2012 2013 2014 2015 2016‘TOTAL All Products 1,091.8 1,938.1 1,597.9 1,267.1 1,607.1
Product Code Product Description
'271121 Natural gas in gaseous state 52.9 962.7 799.3 372.0 689.8
'284410 Natural uranium and its compounds; ... 126.9 221.7 212.5 263.7 205.8
'520100 Cotton, neither carded nor combed 693.2 543.9 331.4 285.0 154.1
'390120 Polyethylene ... gravity of >= 0,94, …. - - - - 144.0
'520514 Single cotton yarn ... uncombed fibres, ... >= 85% cotton ... 58.3 63.7 120.3 160.5 118.3
Table 13: Uzbekistan’s Exports to China (HS-06) (US$ Millions) (2012-2016)

REPU
BLIC
OF
UZB
EKIS
TAN
201
7
50
4.2. RussiaUzbekistan has always had good relations with Russia. From its independence in 1991 till 1993 Uzbekistan was still in the Ruble zone. Since then Uzbekistan has moved politically away from Russia. There has been some friction between the two countries because of increasing independence from Russian influence. Tensions grew as Russia started supporting Tajikistan and Kyrgyzstan in their pursuit to build a hydro power project which Uzbekistan was completely against. Relations however have gotten significantly better since the appointment of Shavkaat Mirziyoyev as the President in 2016. Despite their differences, Russia is still one of the major trade partners of Uzbekistan and remittances from Russia amount to roughly 16% of Uzbekistan’s GDP.
4.2.1. Trade overview
Over the last 10 years, Uzbekistan has had a trade surplus with the Russian Federation. The period of 2010-11 has been the most favorable for Uzbekistan as exports came to par with imports. The trade balance reached its lowest point in 2014 as imports rose to $3.1 billion and exports fell to $0.85 billion. The recent fall in trade is attributed to some extent to the fall in the price of Ruble in 2014.
REPUBLIC OF UZBEKISTAN 64
Figure 22: Uzbekistan's Trade with Russia (US$ Millions) (2007-2016)
-262.71 -150.05
-2,243.77
-1,203.93
-3000.00
-2000.00
-1000.00
0.00
1000.00
2000.00
3000.00
4000.00
2007 2008 2009 2010 2011 2012 2013 2014 2015 2016US$
(Mill
ions
)
Year
Exports Imports Balance of trade
Russia - Trade Overview
Figure 22: Uzbekistan’s Trade with Russia (US$ Millions) (2007-2016)
4.2.2. Imports
Uzbekistan imports a large variety of goods from the Russian Federation. The major imports comprise of mineral fuels, wood, iron and steel and vegetable oils. Since the fall in value of the Ruble in 2014, the value of imports from Russia has fallen significantly. The greatest impact has been on the imports of Wood and articles of wood which fell by more than 50% between 2014 & 2016.

REPU
BLIC
OF
UZB
EKIS
TAN
201
7
51
2012 2013 2014 2015 2016'TOTAL All products 2,324.7 2,803.9 3,113.6 2,221.2 1,965.0
Product Code Product Description
'27 Mineral fuels, mineral oils and products of their distillation ... 218.0 407.2 470.8 453.0 352.4
'44 Wood and articles of wood; wood charcoal 450.9 590.6 576.4 314.6 264.7
'72 Iron and steel 344.6 369.6 407.1 284.2 221.2
'15 Animal or vegetable fats and oils and their ... 154.8 162.5 178.3 129.9 160.1
'84 Machinery, mechanical appliances, nuclear reactors, boilers; parts thereof 247.4 301.9 266.5 163.1 124.4
Table 14: Uzbekistan’s Imports from Russia (HS-02) (US$ Millions) (2012-2016)
2012 2013 2014 2015 2016'TOTAL All products 2,324.7 2,803.9 3,113.6 2,221.2 1,965.0
Product Code Product Description
'271019 Medium oils and preparations, of petroleum ... 209.6 379.7 425.4 395.1 302.9
'440710 Coniferous wood sawn or chipped lengthwise, ... 319.5 429.2 413.0 209.7 165.2
'151219 Sunflower-seed or safflower oil and their fractions, ... 115.9 128.1 140.7 91.7 103.4
'721049 Flat-rolled products of iron … width of >= 600 mm ... 71.9 101.3 112.3 83.1 42.6
'441011 Particle board of wood, whether or not agglomerated ... 45.4 66.3 64.7 44.3 37.0
Table 15: Uzbekistan’s Imports from Russia (HS-06) (US$ Millions) (2012-2016)
3.5.2.3. Exports
Exports to the Russian Federation have been heavily dependent on cotton and clothing accessories; these two make up about 50% of Uzbekistan’s export to Russia. The other major exports include fruits and nuts, knitted or crocheted fabrics and plastics. Most of the exports including cotton and knitted or crocheted fabrics have seen a rise in the last 5 years. On the other hand, there has been a fall in the exports of t-shirts at the HS-06 level over the past 5 years.
2012 2013 2014 2015 2016'TOTAL All products 1,390.8 1,256.9 869.8 575.8 761.0
Product Code Product Description
'52 Cotton 166.7 177.9 202.7 169.0 200.3
'61 Articles of apparel and clothing accessories, knitted or crocheted 182.8 188.0 153.7 128.8 160.1
'08 Edible fruit and nuts; peel of citrus fruit or melons 104.1 33.5 4.0 14.8 60.9
'60 Knitted or crocheted fabrics 20.5 29.9 28.1 38.6 58.8
'39 Plastics and articles thereof 41.5 34.6 27.8 27.3 50.2 Table 16: Uzbekistan’s Exports to Russia (HS-02) (US$ Millions) (2012-2016)
2012 2013 2014 2015 2016'TOTAL All products 1,390.8 1,256.9 869.8 575.8 761.0
Product Code Product Description
'520512 Single cotton yarn, of uncombed fibres, containing >= 85% cotton ... 81.6 75.2 75.7 68.9 69.9
'610910 T-shirts, singlets and other vests of cotton, knitted or crocheted 87.3 84.3 69.1 57.9 66.0
'390120 Polyethylene with a specific gravity of >= 0,94, in primary forms 31.0 23.7 18.8 22.8 38.4
'711292 Waste and scrap of platinum, incl. metal clad ... - 28.9 33.7 27.0 34.2
'520513 Single cotton yarn, of uncombed fibres, containing >= 85% cotton ... 9.2 10.3 19.8 25.7 30.2
Table 17: Uzbekistan’s Exports to Russia (HS-06) (US$ Millions) (2012-2016)

REPU
BLIC
OF
UZB
EKIS
TAN
201
7
52
4.3. KazakhstanUzbekistan and Kazakhstan are two of the largest countries of Central Asia. Uzbekistan has the largest population while Kazakhstan has the largest area. There has been some tension between the two countries over border disputes. The major one being the case of the Bagys Settlement. The area was given to Uzbekistan on lease from Kazakhstan during the Soviet Era. The Bagys village has an ethnic Kazakh majority. Due to better living conditions in Kazakhstan the residents of Bagys Settlement have been trying to separate from Uzbekistan to join Kazakhstan.
There have been two major treaties between Uzbekistan and Kazakhstan along with a large number of cooperation agreements. Treaty on Eternal Friendship was signed on October 31, 1998 while the more recent Treaty on Strategic Partnership was signed on June 13, 2013. A joint Intergovernmental Organization has also been put to place to expand trade and cooperation between the two countries.
4.3.1. Trade Overview
Trade with Kazakhstan has not been too beneficial for the trade balance of Uzbekistan. Over the last ten years Uzbekistan has never had a trade surplus with Kazakhstan. The trade between Kazakhstan has had a fluctuating trend; imports hit $1.3 billion in 2012 causing a trade deficit of $0.5 billion.
REPUBLIC OF UZBEKISTAN 67
3.5.3. Kazakhstan Uzbekistan and Kazakhstan are two of the largest countries of Central Asia. Uzbekistan has the largest population while Kazakhstan has the largest area. There has been some tension between the two countries over border disputes. The major one being the case of the Bagys Settlement. The area was given to Uzbekistan on lease from Kazakhstan during the Soviet Era. The Bagys village has an ethnic Kazakh majority. Due to better living conditions in Kazakhstan the residents of Bagys Settlement have been trying to separate from Uzbekistan to join Kazakhstan.
There have been two major treaties between Uzbekistan and Kazakhstan along with a large number of cooperation agreements. Treaty on Eternal Friendship was signed on October 31, 1998 while the more recent Treaty on Strategic Partnership was signed on June 13, 2013. A joint Intergovernmental Organization has also been put to place to expand trade and cooperation between the two countries.
3.5.3.1. Trade Overview Trade with Kazakhstan has not been too beneficial for the trade balance of Uzbekistan. Over the last ten years Uzbekistan has never had a trade surplus with Kazakhstan. The trade between Kazakhstan has had a fluctuating trend; imports hit $1.3 billion in 2012 causing a trade deficit of $0.5 billion.
Figure 23: Uzbekistan's Trade with Kazakhstan (US$ Millions) (2007-2016)
-333.26
-755.96
-66.28 -334.73
-1000
-500
0
500
1000
1500
2007 2008 2009 2010 2011 2012 2013 2014 2015 2016US$
(Miil
lions
)
Year
Kazakhstan - Trade Overview
Uzbekistan's exports to Kazakhstan in $millions
Uzbekistan's imports from Kazakhstan in $millions
Uzbekistan's Trade Balance with Kazakhstan in $millions
Figure 23: Uzbekistan’s Trade with Kazakhstan (US$ Millions) (2007-2016)

REPU
BLIC
OF
UZB
EKIS
TAN
201
7
53
4.3.2. Imports
Uzbekistan’s imports are mainly focused on cereals, iron and steel and products for milling industries. Imports of motor vehicles have risen by about 100 times over the last five years going from $0.9 million to $88.8 million. Imports of mineral fuels and oils have plummeted from $414.5 million in 2012 to $74.6 million in 2016. The tables below show the top 5 goods imported from Kazakhstan at HS-02 and HS-06 levels.
2012 2013 2014 2015 2016'TOTAL All products 1,343.7 1,145.3 1,083.9 942.3 922.5
Product Code Product Description
'10 Cereals 98.8 124.4 167.7 232.1 208.6
'72 Iron and steel 98.4 130.3 132.6 129.6 141.7
'11 Products of the milling industry ... 298.1 277.3 238.9 195.3 130.7
'87 Vehicles other than railway or tramway … 0.9 1.4 3.0 5.1 88.8
'27 Mineral fuels, mineral oils and … 414.5 359.8 204.2 59.9 74.6 Table 18: Uzbekistan’s Imports from Kazakhstan (HS-02) (US$ Millions) (2012-2016)
2012 2013 2014 2015 2016'TOTAL All products 1,343.7 1,145.3 1,083.9 942.3 922.5
Product Code Product Description
'100199 Wheat and meslin (excluding ...) 90.8 120.2 153.8 206.1 201.8
'110100 Wheat or meslin flour 290.7 273.1 231.7 193.8 127.0
'260800 Zinc ores and concentrates 133.0 37.9 67.5 39.7 54.9
'270900 Petroleum oils and oils ... bituminous minerals, crude 309.9 262.7 120.6 23.6 51.4
'870322 Motor cars and other motor vehicles ... 0.0 0.0 0.0 - 49.5 Table 19: Uzbekistan’s Imports from Kazakhstan (HS-06) (US$ Millions) (2012-2016)
4.3.3. Exports
Uzbekistan’s exports to Kazakhstan, have not increased significantly since 2007. Exports to Kazakhstan include fruits, vegetables, mineral fuels and plastics, of which, fruits and mineral fuels comprise of most of the exports. Exports of Edible fruits and nuts make up about 40% of Uzbekistan’s total exports to Kazakhstan. The tables below show the top 5 goods exports to Kazakhstan at HS-02 and HS-06 levels.
2012 2013 2014 2015 2016'TOTAL All products 817.2 970.1 1,017.7 725.7 587.8
Product Code Product Description
'08 Edible fruit and nuts; peel of citrus fruit or melons 198.6 265.2 284.2 172.8 227.4
'27 Mineral fuels, mineral oils and … 185.0 187.5 192.3 255.5 109.1
'07 Edible vegetables and certain roots and tubers 65.0 135.1 118.1 100.2 67.9
'39 Plastics and articles thereof 13.6 12.8 12.1 10.3 27.8
'61 Articles of apparel and clothing accessories … 6.4 20.5 17.6 18.5 19.9 Table 20: Uzbekistan’s Exports to Kazakhstan (HS-02) (US$ Millions) (2012-2016)
2012 2013 2014 2015 2016'TOTAL All products 817.2 970.1 1,017.7 725.7 587.8
Product Code Product Description
'271121 Natural gas in gaseous state 184.2 186.5 187.1 254.5 108.4
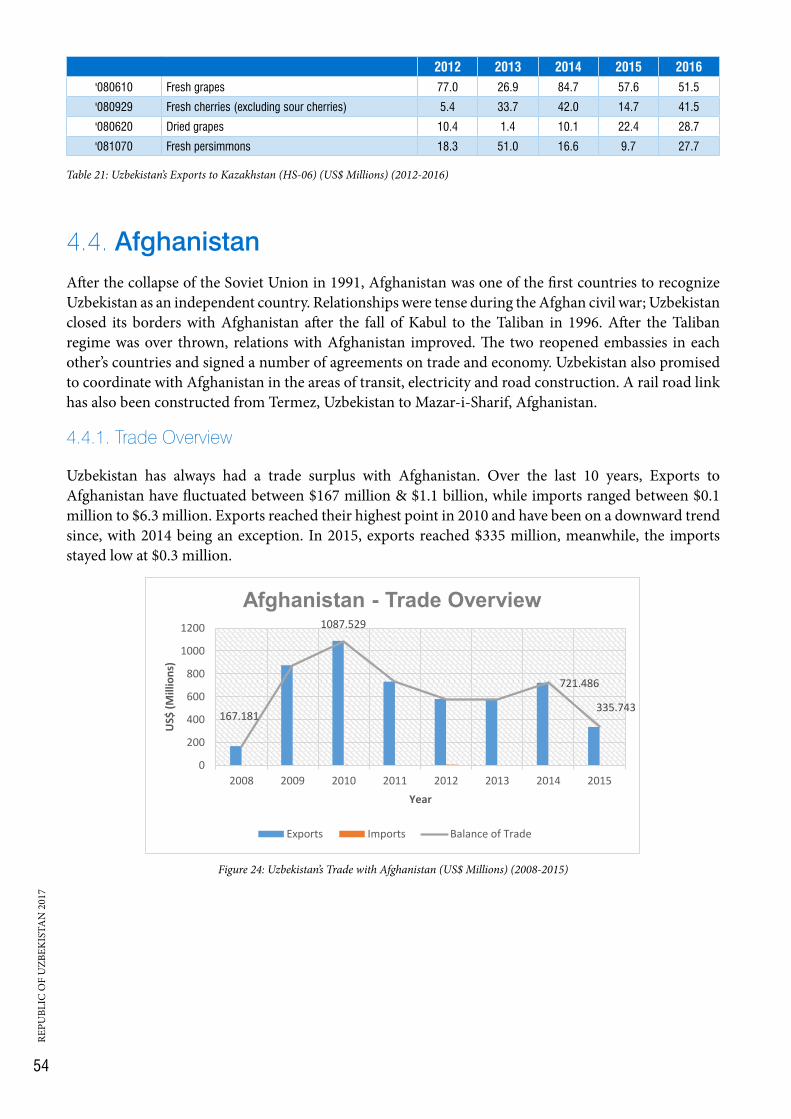
REPU
BLIC
OF
UZB
EKIS
TAN
201
7
54
2012 2013 2014 2015 2016'080610 Fresh grapes 77.0 26.9 84.7 57.6 51.5
'080929 Fresh cherries (excluding sour cherries) 5.4 33.7 42.0 14.7 41.5
'080620 Dried grapes 10.4 1.4 10.1 22.4 28.7
'081070 Fresh persimmons 18.3 51.0 16.6 9.7 27.7 Table 21: Uzbekistan’s Exports to Kazakhstan (HS-06) (US$ Millions) (2012-2016)
4.4. AfghanistanAfter the collapse of the Soviet Union in 1991, Afghanistan was one of the first countries to recognize Uzbekistan as an independent country. Relationships were tense during the Afghan civil war; Uzbekistan closed its borders with Afghanistan after the fall of Kabul to the Taliban in 1996. After the Taliban regime was over thrown, relations with Afghanistan improved. The two reopened embassies in each other’s countries and signed a number of agreements on trade and economy. Uzbekistan also promised to coordinate with Afghanistan in the areas of transit, electricity and road construction. A rail road link has also been constructed from Termez, Uzbekistan to Mazar-i-Sharif, Afghanistan.
4.4.1. Trade Overview
Uzbekistan has always had a trade surplus with Afghanistan. Over the last 10 years, Exports to Afghanistan have fluctuated between $167 million & $1.1 billion, while imports ranged between $0.1 million to $6.3 million. Exports reached their highest point in 2010 and have been on a downward trend since, with 2014 being an exception. In 2015, exports reached $335 million, meanwhile, the imports stayed low at $0.3 million.
REPUBLIC OF UZBEKISTAN 70
3.5.4. Afghanistan After the collapse of the Soviet Union in 1991, Afghanistan was one of the first countries to recognize Uzbekistan as an independent country. Relationships were tense during the Afghan civil war; Uzbekistan closed its borders with Afghanistan after the fall of Kabul to the Taliban in 1996. After the Taliban regime was over thrown, relations with Afghanistan improved. The two reopened embassies in each other’s countries and signed a number of agreements on trade and economy. Uzbekistan also promised to coordinate with Afghanistan in the areas of transit, electricity and road construction. A rail road link has also been constructed from Termez, Uzbekistan to Mazar-i-Sharif, Afghanistan.
3.5.4.1. Trade Overview Uzbekistan has always had a trade surplus with Afghanistan. Over the last 10 years, Exports to Afghanistan have fluctuated between $167 million & $1.1 billion, while imports ranged between $0.1 million to $6.3 million. Exports reached their highest point in 2010 and have been on a downward trend since, with 2014 being an exception. In 2015, exports reached $335 million, meanwhile, the imports stayed low at $0.3 million.
Figure 24: Uzbekistan's Trade with Afghanistan (US$ Millions) (2008-2015)
167.181
1087.529
721.486
335.743
0
200
400
600
800
1000
1200
2008 2009 2010 2011 2012 2013 2014 2015
US$
(Mill
ions
)
Year
Afghanistan - Trade Overview
Exports Imports Balance of Trade
Figure 24: Uzbekistan’s Trade with Afghanistan (US$ Millions) (2008-2015)

REPU
BLIC
OF
UZB
EKIS
TAN
201
7
55
4.4.2. Imports
Uzbekistan imports from Afghanistan are almost negligible. There are some irregularities amongst the data the root of which could not be traced. The imports from Afghanistan at the HS-02 and HS-06 level are given below.
2011 2012 2013 2014 2015'TOTAL All products 0.2 6.3 2.4 0.4 0.3
Product Code Product Description
'41 Raw hides and skins (other than furskins) and leather 0.2 1.1 0.6 0.2 0.3
'99 Commodities not elsewhere specified - - 20.0 - 10.0
'13 Lac; gums, resins and other vegetable saps and extracts - 0.3 - 0.3 -
'07 Edible vegetables and certain roots and tubers - 4.7 1.6 - -
'08 Edible fruit and nuts; peel of citrus fruit or melons - 0.1 0.1 - - Table 22: Uzbekistan’s Imports from Afghanistan (HS-02) (US$ Millions) (2011-2015)
2011 2012 2013 2014 2015'TOTAL All products 0.2 6.3 2.4 0.4 0.3
Product Code Product Description
'999999 Commodities not elsewhere specified 0.2 5.8 2.3 0.2 0.3
'200931 Single citrus fruit juice, unfermented, . . . - - - - -
'070310 Fresh or chilled onions and shallots - - - - -
'080620 Dried grapes - 0.1 0.1 - -
'130219 Vegetable saps and extracts (excluding liquorice, hops and opium) - 0.3 - 0.3 - Table 23: Uzbekistan’s Imports from Afghanistan (HS-06) (US$ Millions) (2011-2015)
4.4.3. Exports
Exports to Afghanistan have fallen significantly over the last couple of years. They fell from $721 million in 2014 to $336 million in 2015. The figures below may be inconsistent or not properly categorized. The table below show Uzbekistan’s exports to Afghanistan at HS-02 and HS-06 level.
2011 2012 2013 2014 2015'TOTAL All products 732.5 580.3 581.4 721.9 336.0
Product Code Product Description
'90 Optical, photographic, cinematographic, ... 0.7 - 98.0 98.1 114.1
'72 Iron and steel 106.6 3.9 103.2 142.5 88.4
'99 Commodities not elsewhere specified 6.2 7.7 24.8 6.2 38.8
'07 Edible vegetables and certain roots and tubers 16.3 10.6 21.1 38.8 25.6
'11 Products of the milling industry; malt; starches; inulin; wheat gluten 6.0 0.1 7.7 21.3 24.4
Table 24: Uzbekistan’s Exports to Afghanistan (HS-02) (US$ Millions) (2011-2015)
2011 2012 2013 2014 2015'TOTAL All products 732.5 580.3 581.4 721.9 336.0
Product Code Product Description
'999999 Commodities not elsewhere specified 118.0 540.4 419.1 510.6 140.2
'902830 Electricity supply or production meters, incl. calibrating meters therefor - - 98.0 98.0 114.1
'110100 Wheat or meslin flour 6.0 0.1 7.7 21.3 24.4
'071331 Dried, shelled beans of species ... 16.3 10.6 20.4 38.8 23.9
'271121 Natural gas in gaseous state 13.4 18.6 28.1 41.9 8.8 Table 25: Uzbekistan’s Exports to Afghanistan (HS-06) (US$ Millions) (2011-2015)

REPU
BLIC
OF
UZB
EKIS
TAN
201
7
56
4.5. KyrgyzstanUzbekistan has had troubled relations with Kyrgyzstan due to border and water disputes. In 1997, the two countries signed a Treaty of Eternal Friendship. There have been a number of skirmishes between the two countries on their border disputes, specifically around a small mountain, Ungar-Tepa, near the Uzbek-Kyrgyz border. The other major issue is the water dispute. Since Kyrgyzstan controls one-third of Central Asia’s water sources and Uzbekistan needs water for its agricultural produce, there has been a constant political struggle between the two countries.
Uzbekistan is relatively stronger than Kyrgyzstan in terms of both the economy as well as the military. Kyrgyzstan has had a heavy dependence on Uzbekistan’s natural gas. This has led to increased dependence on Uzbekistan, and which was exploited by Karimov to get political gains. Recently the export of natural gas to Kyrgyzstan has fallen.
4.5.1. Trade Overview
Trade with Kyrgyzstan has been low over the past few years. Fertilizers, plastics, fruits and nuts and carpets make up most of Uzbekistan’s exports to Kyrgyzstan. While, imports from Kyrgyzstan include vehicles, iron, steel, machinery and mineral fuels. Over the last ten years the only times Uzbekistan’s trade balance showed a surplus was in 2007 and then again in 2010; in the other years it has been in a deficit. Over the past five years, exports of natural gas and ammonium nitrate have fallen significantly. On the other hand, imports of dumpers for off-highway use rose from about $0.8 million in 2012 to $33.7 million in 2016.
REPUBLIC OF UZBEKISTAN 74
Figure 25: Uzbekistan's Trade with Kyrgyzstan (US$ Millions) (2007-2016)
3.5.5.2. Imports Uzbekistan’s imports from Kyrgyzstan have been heavily dependent on Vehicles; it makes up 33% of total imports from Kyrgyzstan. Over the past five years the exports of natural gas and ammonium nitrate have fallen sharply. On the other hand, imports of dumpers for off-highway use rose from about $0.8 million in 2012 to $33.7 million in 2016. The tables below show the top 5 goods imported from Kyrgyzstan at HS-02 and HS-06 levels.
2012 2013 2014 2015 2016 'TOTAL All products 190.1 159.0 163.7 95.0 125.1
Product Code Product Description
'87 Vehicles other than railway or tramway … 86.1 30.4 18.1 27.6 42.1
'72 Iron and steel 26.4 28.9 15.3 8.1 15.6
'84 Machinery, mechanical appliances, … 12.5 17.9 8.5 9.8 10.7
'90 Optical, photographic, cinematographic, ... 0.1 0.2 0.2 0.1 8.8
'27 Mineral fuels, mineral oils and products ... 11.0 5.4 9.2 5.8 8.8
Table 26: Uzbekistan's Imports from Kyrgyzstan (HS-02) (US$ Millions) (2012-2016)
35.184 53.66
-126.97 -55.307 -150
-100
-50
0
50
100
150
200
250
300
2007 2008 2009 2010 2011 2012 2013 2014 2015 2016
US$
(Mill
ions
)
Year
Kyrgyzstan - Trade Overview
Uzbekistan's exports to Kyrgyzstan in $ millions
Uzbekistan's imports from Kyrgyzstan in $ millions
Uzbekistan's Trade Balance with Kyrgyzstan in $ millions
Figure 25: Uzbekistan’s Trade with Kyrgyzstan (US$ Millions) (2007-2016)
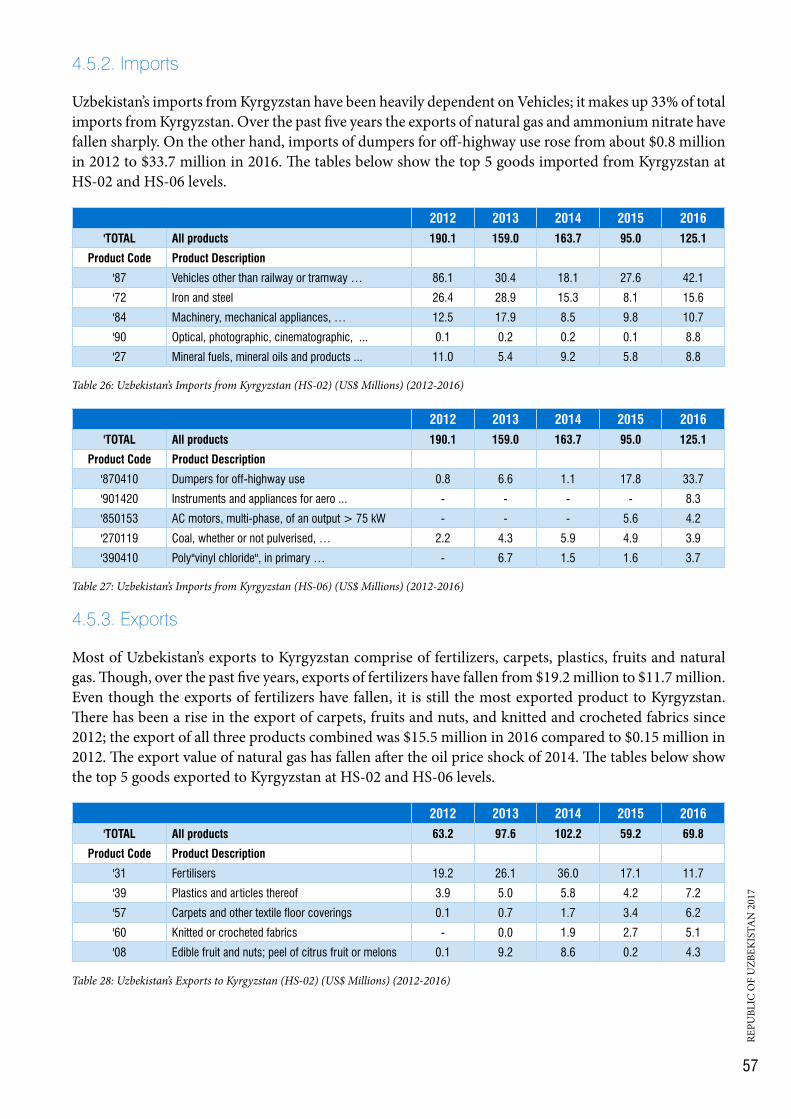
REPU
BLIC
OF
UZB
EKIS
TAN
201
7
57
4.5.2. Imports
Uzbekistan’s imports from Kyrgyzstan have been heavily dependent on Vehicles; it makes up 33% of total imports from Kyrgyzstan. Over the past five years the exports of natural gas and ammonium nitrate have fallen sharply. On the other hand, imports of dumpers for off-highway use rose from about $0.8 million in 2012 to $33.7 million in 2016. The tables below show the top 5 goods imported from Kyrgyzstan at HS-02 and HS-06 levels.
2012 2013 2014 2015 2016'TOTAL All products 190.1 159.0 163.7 95.0 125.1
Product Code Product Description
'87 Vehicles other than railway or tramway … 86.1 30.4 18.1 27.6 42.1
'72 Iron and steel 26.4 28.9 15.3 8.1 15.6
'84 Machinery, mechanical appliances, … 12.5 17.9 8.5 9.8 10.7
'90 Optical, photographic, cinematographic, ... 0.1 0.2 0.2 0.1 8.8
'27 Mineral fuels, mineral oils and products ... 11.0 5.4 9.2 5.8 8.8 Table 26: Uzbekistan’s Imports from Kyrgyzstan (HS-02) (US$ Millions) (2012-2016)
2012 2013 2014 2015 2016'TOTAL All products 190.1 159.0 163.7 95.0 125.1
Product Code Product Description
'870410 Dumpers for off-highway use 0.8 6.6 1.1 17.8 33.7
'901420 Instruments and appliances for aero ... - - - - 8.3
'850153 AC motors, multi-phase, of an output > 75 kW - - - 5.6 4.2
'270119 Coal, whether or not pulverised, … 2.2 4.3 5.9 4.9 3.9
'390410 Poly"vinyl chloride", in primary … - 6.7 1.5 1.6 3.7 Table 27: Uzbekistan’s Imports from Kyrgyzstan (HS-06) (US$ Millions) (2012-2016)
4.5.3. Exports
Most of Uzbekistan’s exports to Kyrgyzstan comprise of fertilizers, carpets, plastics, fruits and natural gas. Though, over the past five years, exports of fertilizers have fallen from $19.2 million to $11.7 million. Even though the exports of fertilizers have fallen, it is still the most exported product to Kyrgyzstan. There has been a rise in the export of carpets, fruits and nuts, and knitted and crocheted fabrics since 2012; the export of all three products combined was $15.5 million in 2016 compared to $0.15 million in 2012. The export value of natural gas has fallen after the oil price shock of 2014. The tables below show the top 5 goods exported to Kyrgyzstan at HS-02 and HS-06 levels.
2012 2013 2014 2015 2016'TOTAL All products 63.2 97.6 102.2 59.2 69.8
Product Code Product Description
'31 Fertilisers 19.2 26.1 36.0 17.1 11.7
'39 Plastics and articles thereof 3.9 5.0 5.8 4.2 7.2
'57 Carpets and other textile floor coverings 0.1 0.7 1.7 3.4 6.2
'60 Knitted or crocheted fabrics - 0.0 1.9 2.7 5.1
'08 Edible fruit and nuts; peel of citrus fruit or melons 0.1 9.2 8.6 0.2 4.3 Table 28: Uzbekistan’s Exports to Kyrgyzstan (HS-02) (US$ Millions) (2012-2016)
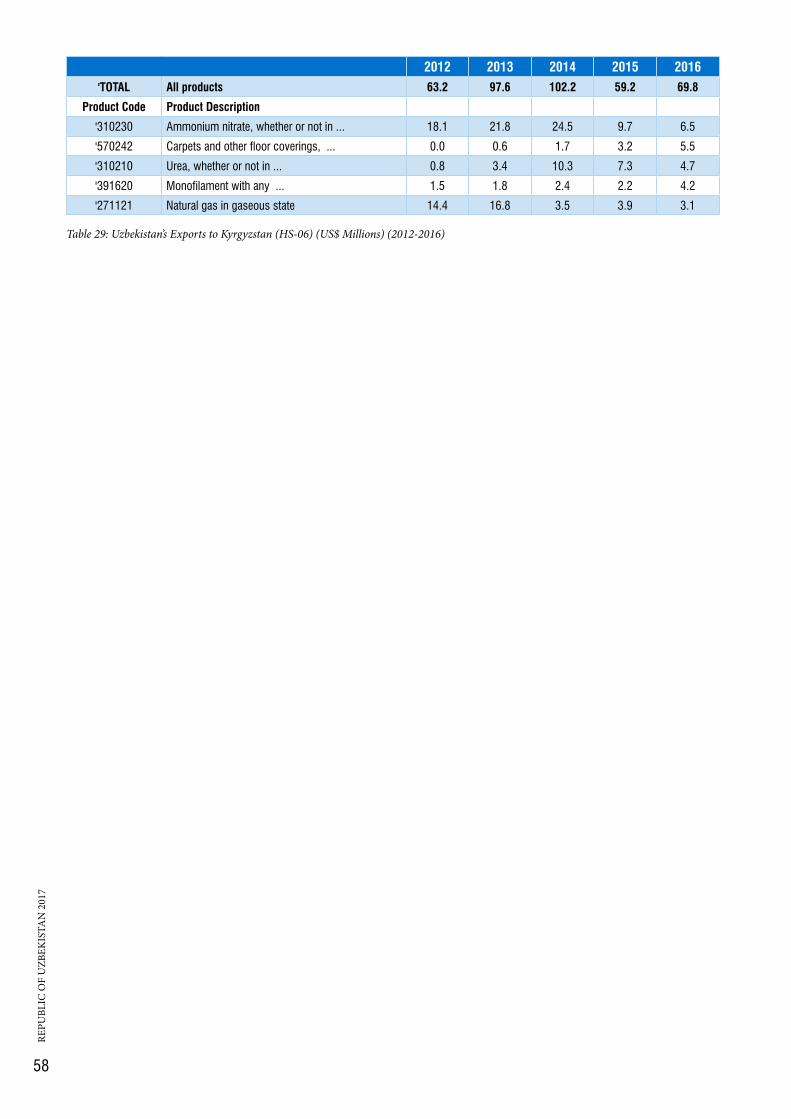
REPU
BLIC
OF
UZB
EKIS
TAN
201
7
58
2012 2013 2014 2015 2016'TOTAL All products 63.2 97.6 102.2 59.2 69.8
Product Code Product Description
'310230 Ammonium nitrate, whether or not in ... 18.1 21.8 24.5 9.7 6.5
'570242 Carpets and other floor coverings, ... 0.0 0.6 1.7 3.2 5.5
'310210 Urea, whether or not in ... 0.8 3.4 10.3 7.3 4.7
'391620 Monofilament with any ... 1.5 1.8 2.4 2.2 4.2
'271121 Natural gas in gaseous state 14.4 16.8 3.5 3.9 3.1 Table 29: Uzbekistan’s Exports to Kyrgyzstan (HS-06) (US$ Millions) (2012-2016)

REPU
BLIC
OF
UZB
EKIS
TAN
201
7
59
4.6. IndiaRelations between Uzbekistan and India have strengthened over the years through an agreement on Trade and Economic Cooperation in 1993. This cooperation agreement covers many areas which include the economy, agriculture, science, technology, politics and culture. Since the signing of this agreement, the two countries have increased trade in medicinal drugs, paper, wood, machinery, garments, surgical tools and consumer goods. Since 1993, Uzbekistan and India are in an agreement to give credit lines to each other of $10 million each, for a term of 10 years.
There has been a noticeable opportunity for mining in Uzbekistan, as it is very rich in minerals. India has also invested in the energy sector of Uzbekistan with the objective to increase trade and economic relations.
4.6.1. Trade Overview
The trade balance with India has been negative for over 10 years, with an exception of 2008. Imports showed an increasing trend from 2007 and reached their highest point of $168 million in 2014. Exports have had a cyclical trend as these have ranged between $13 & $35 million. In 2016, exports were valued at $46.5 million and imports were valued at $90.8 million, resulting in a trade deficit of $44.3 million.
REPUBLIC OF UZBEKISTAN 77
3.5.6. India Relations between Uzbekistan and India have strengthened over the years through an agreement on Trade and Economic Cooperation in 1993. This cooperation agreement covers many areas which include the economy, agriculture, science, technology, politics and culture. Since the signing of this agreement, the two countries have increased trade in medicinal drugs, paper, wood, machinery, garments, surgical tools and consumer goods. Since 1993, Uzbekistan and India are in an agreement to give credit lines to each other of $10 million each, for a term of 10 years.
There has been a noticeable opportunity for mining in Uzbekistan, as it is very rich in minerals. India has also invested in the energy sector of Uzbekistan with the objective to increase trade and economic relations.
3.5.6.1. Trade Overview The trade balance with India has been negative for over 10 years, with an exception of 2008. Imports showed an increasing trend from 2007 and reached their highest point of $168 million in 2014. Exports have had a cyclical trend as these have ranged between $13 & $35 million. In 2016, exports were valued at $46.5 million and imports were valued at $90.8 million, resulting in a trade deficit of $44.3 million.
Figure 26: Uzbekistan's Trade with India (US$ Millions) (2007-2016)
-23.25
35.32
-129.18
-44.26
-150
-100
-50
0
50
100
150
200
2007 2008 2009 2010 2011 2012 2013 2014 2015 2016US$
(Mill
ions
)
Year
India - Trade Overview
Uzbekistan's exports to India Uzbekistan's imports from India
Uzbekistan's Trade Balance with India
Figure 26: Uzbekistan’s Trade with India (US$ Millions) (2007-2016)
4.6.2. Imports
Imports from India mainly comprise of pharmaceutical products, machinery, vehicles and garments which have increased significantly, however import of vehicles did not rise as much due to the high excise tax of more than 50% on cars. The tables below show the classification of imports at HS-02 and HS-06 levels.
2012 2013 2014 2015 2016‘TOTAL All Products 110.2 119.8 168.3 107.9 90.8
Product Code Product Description
'30 Pharmaceutical products 38.9 48.8 47.7 49.9 42.9
'84 Machinery, mechanical appliances, …. 7.9 12.6 21.7 14.7 12.5

REPU
BLIC
OF
UZB
EKIS
TAN
201
7
60
2012 2013 2014 2015 2016'87 Vehicles other than railway or tramway … 25.6 17.7 22.3 6.8 12.5
'62 Articles of apparel ... not knitted or crocheted 2.6 2.9 5.9 6.2 2.9
'09 Coffee, tea, maté and spices 0.2 0.7 1.4 1.2 2.3 Table 30: Uzbekistan’s Imports from India (HS-02) (US$ Millions) (2012-2016)
2012 2013 2014 2015 2016‘TOTAL All Products 110.2 119.8 168.3 107.9 90.8
Product Code Product Description
'300490 Medicaments consisting of mixed or unmixed ... 22.3 29.2 28.3 33.1 24.6
'870600 Chassis fitted with engines, for tractors ... 22.7 10.9 16.2 3.9 10.3
'300450 Medicaments containing provitamins, ... 3.3 6.3 6.7 2.9 5.4
'300220 Vaccines for human medicine 3.5 4.2 3.8 5.4 5.0
'300420 Medicaments containing antibiotics, ... 6.5 3.4 6.1 4.5 3.8 Table 31: Uzbekistan’s Imports from India (HS-06) (US$ Millions) (2012-2016)
4.6.3. Exports
Exports to India consist of vegetables, fertilizers, gums, resins and zinc articles. Edible vegetables and fertilizers make up about 80% of total exports to India. All exports showed a considerable increase in their values except zinc articles, primarily because Uzbekistan started to import zinc from Kazakhstan from 1999. The tables below show the classification of exports at HS-02 and HS-06 levels.
2012 2013 2014 2015 2016‘TOTAL All Products 33.6 35.1 39.1 56.5 46.5
Product Code Product Description
'07 Edible vegetables and certain roots and tubers 8.3 10.6 14.5 10.9 18.1
'31 Fertilizers 7.0 13.4 14.7 25.5 14.4
'13 Lac; gums, resins and other … 2.6 5.6 4.9 5.6 5.3
'79 Zinc and articles thereof 2.4 1.9 - - 1.9
'52 Cotton 0.4 0.4 1.1 - 1.4 Table 32: Uzbekistan’s Exports to India (HS-02) (US$ Millions) (2012-2016)
2012 2013 2014 2015 2016‘TOTAL All Products 33.6 35.1 39.1 56.5 46.5
Product Code Product Description
'071331 Dried, shelled beans of species ... 7.5 10.4 14.5 10.8 18.0
'310420 Potassium chloride for use as fertiliser (excluding ... - 3.9 4.1 9.4 8.0
'130190 Lac; natural gums, resins, gum-resins,... 2.6 5.6 4.9 5.6 5.2
'310210 Urea, whether or not in aqueous solution ... 7.0 9.5 10.7 16.1 4.1
'310490 Carnallite, sylvite and other crude natural potassium ... - - - - 2.3
Table 33: Uzbekistan’s Exports to India (HS-06) (US$ Millions) (2012-2016)

REPU
BLIC
OF
UZB
EKIS
TAN
201
7
61
4.7. Pakistan Relations between Uzbekistan and Pakistan were established when Uzbekistan became independent in 1992. The relations became stronger when both the countries worked together to counter terrorism in Afghanistan. Pakistan and Uzbekistan enjoy pleasant and friendly political ties and have signed bilateral agreements with each other.
The two countries have signed about 56 bilateral agreements and MOU’s since 1991, to expand good relations. These agreements cover economic trade, healthcare, agriculture, educational fields, military, science and technology, tourism, banking, telecommunications and transit. In November 2015, Pakistan and Uzbekistan signed three documents to strengthen cooperation in the fields of trade, economy and foreign affairs. The two countries have also signed protocols to avoid double taxation and to increase cooperation between their Foreign Affairs Ministries.
Uzbekistan has proposed a Pakistan-Afghanistan-Uzbekistan trilateral transit trade agreement to help remove problems in trade. Uzbekistan has also made an inquiry to use Gwadar (Pakistani Port) to expand its reach to the global markets. Recently the KASB Group of Pakistan and Uzbek Export Corporation have signed an agreement to establish Pak-Uzbek Trade House aimed at introducing new technology in the field of agriculture in Pakistan.
4.7.1. Trade Overview
Trade with Pakistan has been very erratic. Although imports from Pakistan have stayed fairly constant, exports show unpredictability as these have ranged from $25 million to $0.5 million in the last ten years. The huge drop in exports came largely because of political instability in Afghanistan, since the trade route from Pakistan to Uzbekistan is through Afghanistan. In 2016, the trade deficit was $0.15 million as imports almost matched exports.
REPUBLIC OF UZBEKISTAN 81
Figure 27: Uzbekistan's Trade with Pakistan (US$ Millions) (2007-2016)
3.5.7.2. Imports Trade between Uzbekistan and Pakistan has somewhat been favorable over a period of time. Uzbekistan’s imports fluctuated between the years 2007 and 2016, however, the overall impact has been an increase in the country’s imports; from $2.73 million in 2007 to $3.38 million in 2016.
The main commodities that Uzbekistan imported from Pakistan were mostly vegetable textile fibers, pharmaceutical products, photography and cinematography equipment and other various textile and agricultural products. The trend however explains that the imports from Pakistan were almost negligible. The tables below show the goods imported at HS-02 and HS-06 levels.
2012 2013 2014 2015 2016 'TOTAL All products 4.0 3.5 2.3 2.0 3.4
Product Code Product Description
'53 Other vegetable textile fibres; … - - - 0.7 2.0
'30 Pharmaceutical products 3.5 2.1 1.4 0.4 0.6
'82 Tools, implements, cutlery, … - - - 0.3 0.3
'63 Other made-up textile articles… - - - - 0.2
'90 Optical, photographic, cinematographic ... 0.3 0.7 0.6 0.5 0.1
Table 34: Uzbekistan's Imports from Pakistan (HS-02) (US$ Millions) (2012-2016)
2012 2013 2014 2015 2016
-505
1015202530
2007 2008 2009 2010 2011 2012 2013 2014 2015 2016
US$
(Mill
ions
)
Year
Pakistan - Trade Overview
Uzbekistan's exports to Pakistan in $millions
Uzbekistan's imports from Pakistan in $millions
Uzbekistan's Trade Balance with Pakistan in $millions
Figure 27: Uzbekistan’s Trade with Pakistan (US$ Millions) (2007-2016)

REPU
BLIC
OF
UZB
EKIS
TAN
201
7
62
4.7.2. Imports
Trade between Uzbekistan and Pakistan has somewhat been favorable over a period of time. Uzbekistan’s imports fluctuated between the years 2007 and 2016, however, the overall impact has been an increase in the country’s imports; from $2.73 million in 2007 to $3.38 million in 2016.
The main commodities that Uzbekistan imported from Pakistan were mostly vegetable textile fibers, pharmaceutical products, photography and cinematography equipment and other various textile and agricultural products. The trend however explains that the imports from Pakistan were almost negligible. The tables below show the goods imported at HS-02 and HS-06 levels.
2012 2013 2014 2015 2016'TOTAL All products 4.0 3.5 2.3 2.0 3.4
Product Code Product Description
'53 Other vegetable textile fibres; … - - - 0.7 2.0
'30 Pharmaceutical products 3.5 2.1 1.4 0.4 0.6
'82 Tools, implements, cutlery, … - - - 0.3 0.3
'63 Other made-up textile articles… - - - - 0.2
'90 Optical, photographic, cinematographic ... 0.3 0.7 0.6 0.5 0.1 Table 34: Uzbekistan’s Imports from Pakistan (HS-02) (US$ Millions) (2012-2016)
2012 2013 2014 2015 2016'TOTAL All products 4.0 3.5 2.3 2.0 3.4
Product Code Product Description
531010 Woven fabrics of jute or of other textile … unbleached - - - 0.3 1.1
531090 Woven fabrics of jute or of other textile ... Bleached . . . - - - 0.4 0.9
300490 Medicaments consisting of mixed or unmixed . . . 0.8 0.9 0.6 0.3 0.5
821220 Safety razor blades of base metal … - - - 0.1 0.3
630510 Sacks and bags, for the packing of goods ... - - - - 0.0 Table 35: Uzbekistan’s Imports from Pakistan (HS-06) (US$ Millions) (2012-2016)
4.7.3. Exports
Exports to Pakistan have decreased significantly since 2007, from $24.7 million in 2007 to $3.22 million in 2016. The main commodities exported by Uzbekistan were cotton, plastics, salts and earthly stones and vegetables. The export of cotton increased to $1.3 million in 2016 from $0.6 million in 2015. The tables below show goods exported at HS-02 and HS-06 levels.
2012 2013 2014 2015 2016'TOTAL All products 0.7 0.7 0.7 1.1 3.2
Product Code Product Description
'52 Cotton - 0.3 - 0.6 1.3
'39 Plastics and articles thereof 0.0 - - - 0.9
'25 Salt; sulphur; earths and stone; … 0.4 0.3 0.2 - 0.4
'07 Edible vegetables and certain roots and tubers 0.1 - - - 0.4
'84 Machinery, mechanical app... parts thereof ... - - - - 0.1 Table 36: Uzbekistan’s Exports to Pakistan (HS-02) (US$ Millions) (2012-2016)

REPU
BLIC
OF
UZB
EKIS
TAN
201
7
63
2012 2013 2014 2015 2016'TOTAL All products 0.7 0.7 0.7 1.1 3.2
Product Code Product Description
'520100 Cotton, neither carded nor combed - 0.3 - 0.3 1.3
'390120 Polyethylene ... gravity of >= 0,94, … - - - - 0.9
'250300 Sulphur of all kinds (excluding ...) 0.4 0.3 0.2 - 0.4
'071339 Dried, shelled beans . . . 0.1 - - - 0.4
'847432 Machines for mixing mineral substances with bitumen - - - - 0.1
Table 37: Uzbekistan’s Exports to Pakistan (HS-06) (US$ Millions) (2012-2016)
3.5.7.4. Potential for Pakistan-Uzbekistan Trade
Trade potential is an economic concept that allows us to identify the scale and scope for increasing bilateral trade. It seeks to measure the additional trade that can exist between the two countries if trade is perfectly frictionless between them.
3.5.7.4.1. Import potential
Import potential for a product is calculated by subtracting Pakistan’s actual imports for a product from Uzbekistan from the minimum of Pakistan’s imports from the world and Uzbekistan’s exports to the world for that product.
Import Potential = Min (Pakistan’s imports from the world of X, Uzbekistan’s exports to the world of X) – Pakistan’s current imports from Uzbekistan of X
The table below shows Pakistan’s current imports from Uzbekistan, Pakistan’s Imports from the world, Uzbekistan’s Exports to the world and Pakistan’s potential imports from Uzbekistan. According to the table, Pakistan only imports $3.2 million worth of products from Uzbekistan while the potential imports could be worth as much as $6,980 million.
Imports from Uzbekistan
Pakistan's imports from
world
Uzbekistan's exports to
world
Potential Imports from Uzbekistan
All Products 3.2 46,998.3 6,983.6 6,980.3
Product Code Product Description
390120 Polyethylene with a specific gravity of >= 0,94, in primary forms 0.9 266.4 317.9 265.5
520100 Cotton, neither carded nor combed 1.3 580.5 199.4 198.0
740311 Copper, refined, in the form of cathodes and sections of cathodes - 85.1 253.4 85.1
80610 Fresh grapes - 73.4 69.7 69.7
390210 Polypropylene, in primary forms - 384.9 40.9 40.9
70200 Tomatoes, fresh or chilled - 120.8 28.0 28.0
870322 Motor cars and other motor vehicles principally designed for the transport of persons, incl. . . . - 326.0 27.0 27.0
854449 Electric conductors, for a voltage <= 1.000 V, insulated, not fitted with connectors, n.e.s. - 72.7 22.9 22.9
741110 Tubes and pipes of refined copper - 20.0 20.5 20.0
710812 Gold, incl. gold plated with platinum, unwrought, for non-monetary purposes (excluding gold . . . - 18.4 2,861.3 18.4
Table 38: Pakistan’s Potential Imports from Uzbekistan

REPU
BLIC
OF
UZB
EKIS
TAN
201
7
64
4.7.4.2. Export Potential
The export potential for a product is calculated by subtracting Pakistan’s actual exports for a product to Uzbekistan from the minimum of Pakistan’s exports to the world or Uzbekistan’s imports from the world for that product
Export Potential = Min (Pakistan’s exports to the world of X, Uzbekistan’s imports from the world of X) – Pakistan’s current exports to Uzbekistan of the X
The table below shows the Pakistan’s exports to Uzbekistan, Pakistan’s exports to the world, Uzbekistan’s imports from the world and most importantly Pakistan’s potential exports to Uzbekistan. Pakistan only exports $3.4 million worth of products to Uzbekistan while the potential exports could be worth about $9.1 billion.
Exports to Uzbekistan
Pakistan's exports to
world
Uzbekistan's imports from
world
Potential Exports to Uzbekistan
All Products 3.4 20,533.8 9,140.9 9,137.5
Product Code Product Description
110100 Wheat or meslin flour - 172.8 127.6 127.6
300490 Medicaments consisting of mixed or unmixed products … 0.5 73.3 353.4 72.8
390760 Polyethylene terephthalate, in primary forms - 135.8 43.1 43.1
151620 Vegetable fats and oils and their fractions, - 53.0 39.5 39.5
721049 Flat-rolled products of iron or non-alloy steel … - 27.4 97.8 27.4
730890 Structures and parts of structures, of iron or steel, n.e.s. (excluding . . . - 24.5 64.3 24.5
901890 Instruments and appliances used in medical, surgical or veterinary sciences, n.e.s 0.1 326.0 18.8 18.7
870190 Tractors (excluding those of heading 8709,. . . - 15.6 24.9 15.6
300420Medicaments containing antibiotics, put up in measured doses "incl. those in the form of transdermal . . .
- 14.3 35.7 14.3
210690 Food preparations, n.e.s. - 19.2 13.4 13.4 Table 39: Pakistan’s Potential Exports to Uzbekistan
4.7.5. Trade Route to Pakistan
Pakistan is strategically located. It provides the closest sea port for most of the Central Asian Republics, especially Uzbekistan. There is very high potential for trade between Pakistan and Uzbekistan. The trade between Uzbekistan and Pakistan goes through Afghanistan. The closest route to Pakistan from Uzbekistan is via the Regional Cooperation for Development Hwy/N-25 and AH1. The route from Pakistan connects Karachi to Quetta to Chaman before entering into Afghanistan; in Afghanistan, it goes from Kandahar to Kabul to Mazar-i-Sharif before entering into Uzbekistan at Termez.
Trade between Pakistan and Uzbekistan has slowed down significantly due to the unstable political conditions in Afghanistan. The route through Afghanistan is neither safe nor reliable which poses several issues during transit of goods. In order to increase bilateral trade both Pakistan and Uzbekistan are working to counter terrorism in Afghanistan for a stable and safer region. There have been talks about building a rail road link from Pakistan through Afghanistan that connects to the Uzbek controlled railroad in Mazar-i-Sharif, Afghanistan. Once China-Pakistan Economic Corridor (CPEC) has been

REPU
BLIC
OF
UZB
EKIS
TAN
201
7
65
completed, it could also be used as a route for trade with Uzbekistan and other Central Asian economies including Russia.
Figure 28: Trade Route to Pakistan
4.8. TurkmenistanUzbekistan and Turkmenistan have had troubled relations in the past. One of the deep-rooted issues lies within ethnic diversity. There are a large number of ethnic Turkmens in Uzbekistan and an equally large population of ethnic Uzbeks in Turkmenistan. Since schooling is in the dominant language in both countries, this has caused a language issue for the minorities leading to unemployment and dissatisfaction. In November 2002, there was an assassination attempt on Niyazov, the President of Turkmenistan at the time. Uzbekistan was blamed for the assassination attempt and the Uzbek ambassador in Turkmenistan was sent back.
Turkmenistan is a relatively isolated state. Though its isolation is by choice rather than necessity. The foreign policy of Turkmenistan is such that it has always only kept relations with countries it has needed to survive. Recently the two countries have been working on strengthening their ties. The Uzbek-Turkmen Joint commission has also been formed to insure cooperation in the energy, transport and communication sector with regular meetings. In 2017, Bayram Annameredov, the deputy prime minister of Turkmenistan, was appointed the co-chairman of Uzbek-Turkmen Joint Commission.
The Ashgabat Agreement was signed in April 2011 for an international transit and transport corridor that would connect Uzbekistan to Oman through Turkmenistan and Iran. Kazakhstan and Pakistan have also joined the Ashgabat Agreement. In a recent visit to Turkmenistan by the newly elected President of Uzbekistan, Shavkat Mirziyoyey, a number of agreements on strategic partnership were signed. The agreements are aimed at improving relations in the areas of agriculture, commerce, tourism and petrochemicals.
In 2010, bilateral trade with Turkmenistan amounted to $200 million and reached $460 million in 2011. Sufficient trade data could not be found for Uzbekistan’s trade with Turkmenistan.

REPU
BLIC
OF
UZB
EKIS
TAN
201
7
66
4.9. TajikistanUzbekistan has had troubled relations with Tajikistan since their independence. The tension between the two countries boils down to three major issues: border disputes, terrorism and energy. The fall of the Soviet Union in 1991 gave birth to a number of terrorist groups all across Central Asia. When the Islamic Movement of Uzbekistan (IMU) crossed into the country through Tajikistan in 2000, the government of Uzbekistan unilaterally planted land mines in disputed areas along the Uzbek-Tajik border and accused the government of Tajikistan of inability to control militant activity. This resulted in an unhealthy relationship between the two regions.
Another major issue between the two countries is the water dispute. The Amu Darya flows from Tajikistan to Uzbekistan which gives Tajikistan control over Uzbekistan’s water supply. Rogun Dam was a project from the Soviet Era but due to unrest and unstable political conditions it was never started. Uzbekistan has been completely against the project because it would hinder the flow of Amu Darya. Even after the criticisms and issues highlighted by Uzbekistan, construction of the Rogun Dam finally commenced in 2015 after approval from the World Bank in 2014. Since the Rogun Dam required water from the Vaksh river which is a tributary to the Amu Darya that runs through Uzbekistan, the Uzbeks feared that this would cause disturbance in the water flow and further harm the Aral Sea, along with creating problems for irrigation. Cotton being a major export for Uzbekistan, lack of water supply would mean huge losses for Uzbekistan.
We are unable to comment on the trade between the two countries due to lack of data.

SECTION V Doing Business
Khiva, Uzbekistan


REPU
BLIC
OF
UZB
EKIS
TAN
201
7
69
5.1. Ease of Doing Business The Doing Business Index is measured and recorded by the World Bank Group. It is a comprehensive study based on ten indicators. The purpose of these rankings is to determine the relative ease of starting and running a business by a local for each country.
Uzbekistan ranks 87th in world as of 2017 in ease of doing business. Although, Uzbekistan ranks 25th in starting a business its overall rating fell due to criteria such as trading across borders and paying taxes where it ranks 165th and 138th respectively. Changes in these rankings may be a bit ambiguous since changes may either be due to changes in the business environment for Uzbekistan or even by changes in the business environment of other countries. The table below shows the Doing Business Rankings along with the ten indicators used to measure it for the years 2016 and 2017.
DB 2017 Rank DB 2016 Rank Change in RankOverall 87 82 -5
Topics
Starting a Business 25 23 -2
Dealing with Construction Permits 147 147 -
Getting Electricity 83 78 -5
Registering Property 75 81 6
Getting Credit 44 42 -2
Protecting Minority Investors 70 78 8
Paying Taxes 138 139 1
Trading across Borders 165 166 1
Enforcing Contracts 38 37 -1
Resolving Insolvency 77 72 -5
Table 40: Doing Business in Uzbekistan
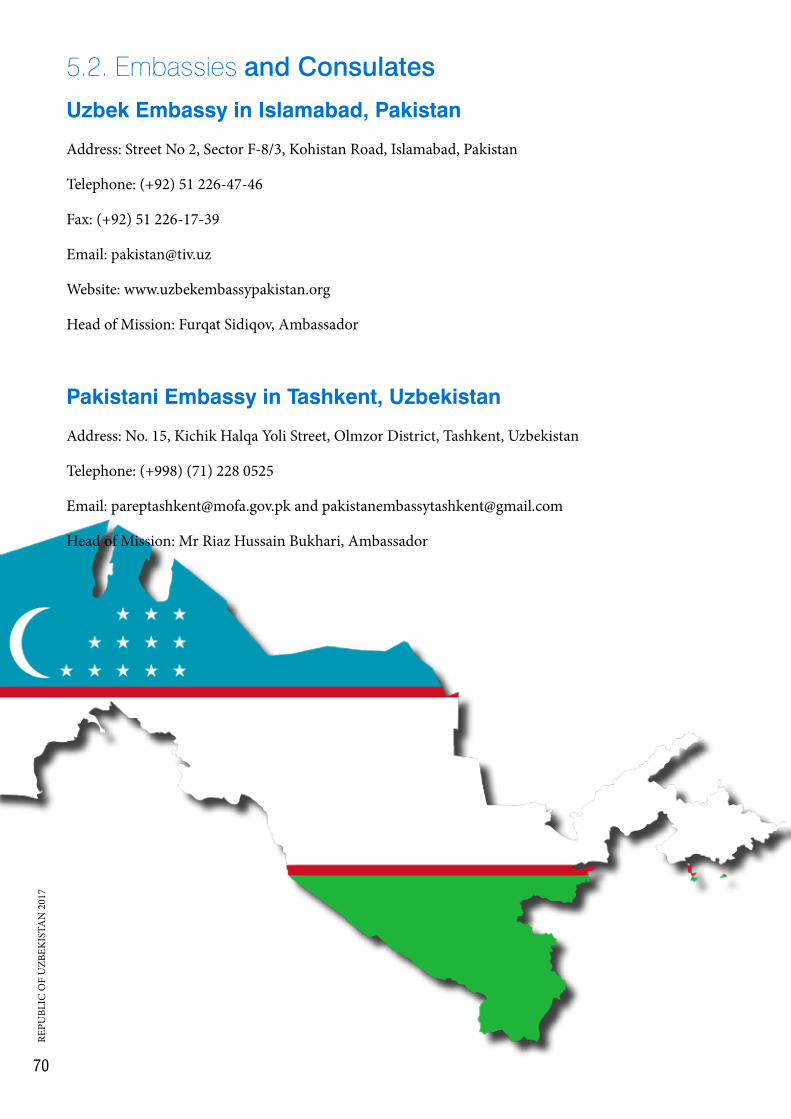
REPU
BLIC
OF
UZB
EKIS
TAN
201
7
70
5.2. Embassies and Consulates
Uzbek Embassy in Islamabad, Pakistan
Address: Street No 2, Sector F-8/3, Kohistan Road, Islamabad, Pakistan
Telephone: (+92) 51 226-47-46
Fax: (+92) 51 226-17-39
Email: [email protected]
Website: www.uzbekembassypakistan.org
Head of Mission: Furqat Sidiqov, Ambassador
Pakistani Embassy in Tashkent, Uzbekistan
Address: No. 15, Kichik Halqa Yoli Street, Olmzor District, Tashkent, Uzbekistan
Telephone: (+998) (71) 228 0525
Email: [email protected] and [email protected]
Head of Mission: Mr Riaz Hussain Bukhari, Ambassador

REPU
BLIC
OF
UZB
EKIS
TAN
201
7
71
5.3 Sources
Data Sources:
I. World Bank Open Data; http://data.worldbank.org/
II. Doing Business; http://www.doingbusiness.org/
III. ITS Trade Map
IV. World Integrated Trade Solution (WITS); World Bank
V. CIA Fact Book
VI. World Trade Organization (WTO)
VII. IMF; World Economic Outlook
Cover Page
Figure 1 - https://commons.wikimedia.org/wiki/File:Oliy_Majlis_parliament_of_Uzbekistan.JPG
Figure 2 - https://commons.wikimedia.org/wiki/File:Itchan_Kala_Khiva_2012.jpg
Figure 3 - https://commons.wikimedia.org/wiki/File:Bukhara_Mir-i-Arab_madrasa_outside_entrance_detail_1.JPG
Figure 4 - https://commons.wikimedia.org/wiki/File:Samarkand,_Bibi-Khanym_Mosque_(6238617046).jpg
Figure 5 - https://commons.wikimedia.org/wiki/File:%E9%A3%9E%E8%B6%8A%E5%A4%A9%E5%B1%B1_fly_over_Tian_Shan_mountains_(4117410958).jpg
Figure 6 - https://commons.wikimedia.org/wiki/File:Samarkand_Bibi-Khanum_Mosque_-_Entrance_portal_8_(detail)_and_south_side_4.JPG
Figure 7 - https://commons.wikimedia.org/wiki/File:Shah-i-Zinda,_Samarkand_(4934657268).jpg
Section Breaks
Section 1 - https://c1.staticflickr.com/4/3835/14580269791_4a5601a3ea_b.jpg
Section 2 - https://commons.wikimedia.org/wiki/File:Registan_square_Samarkand.jpg
Section 3 - https://commons.wikimedia.org/wiki/File:Main_entrance_of_Museum_of_History_of_Uzbekistan.jpg
Section 4 - https://commons.wikimedia.org/wiki/File:Samarkand,_Bibi-Khanym_Mosque_(6238617046).jpg
Section 5 - https://commons.wikimedia.org/wiki/File:Itchan_Kala_Khiva_2012.jpg

REPU
BLIC
OF
UZB
EKIS
TAN
201
7
72
Tourism
https://commons.wikimedia.org/wiki/File:Ark_Citadel.jpg - 1
https://commons.wikimedia.org/wiki/File:Le_minaret_et_la_mosqu%C3%A9e_Kalon_(Boukhara,_Ouzb%C3%A9kistan)_(5658826884).jpg - 2
https://commons.wikimedia.org/wiki/File:La_m%C3%A9dersa_Tchor_Minor_(Boukhara,_Ouzb%C3%A9kistan)_(5675552866).jpg - 3
https://commons.wikimedia.org/wiki/File:Samarkand,_Bibi-Khanym_Mosque_(6238617046).jpg - 4
https://commons.wikimedia.org/wiki/File:Registan_square_Samarkand.jpg - 5
https://commons.wikimedia.org/wiki/File:Samarkand,_Shah-i-Zinda_(6238891272).jpg - 6
https://commons.wikimedia.org/wiki/File:Itchan_Kala_Khiva_2012.jpg - 7
https://commons.wikimedia.org/wiki/File:Shakhrisabz,_Uzbekistan,_21.05.2014.jpg - 8
https://commons.wikimedia.org/wiki/File:Ak_Serai_Palace,_Shakhrisabz_(490496).jpg - 9
https://commons.wikimedia.org/wiki/File:%E9%A3%9E%E8%B6%8A%E5%A4%A9%E5%B1%B1_fly_over_Tian_Shan_mountains_(4117410958).jpg - 10


8th Floor, Dawood Centre, M. T. Khan Road, Karachi, PakistanTelephone: +92-21 35630528-29 Fax: +92-21 35630530 Website: www.pbc.org.pk P
rinte
d &
Des
igne
d at
: The
Tim
es P
ress
(Pvt
) Ltd
.