republic of marshall islands technical report, high
TRANSCRIPT

EU EDF 9 – SOPAC Project Report 117 Reducing Vulnerability of Pacific ACP States
REPUBLIC OF MARSHALL ISLANDS TECHNICAL REPORT High-Resolution Bathymetric Survey of Majuro
Fieldwork undertaken from 18 to 27 July 2006
October 2008
Three-dimensional perspective image of Majuro Atoll looking east.

Prepared by:
Jens Krüger and Salesh Kumar
SOPAC Secretariat
July 2008
PACIFIC ISLANDS APPLIED GEOSCIENCE COMMISSION
c/o SOPAC Secretariat
Private Mail Bag
GPO, Suva
FIJI ISLANDS
http://www.sopac.org
Phone: +679 338 1377
Fax: +679 337 0040
www.sopac.org
Important Notice
This report has been produced with the financial assistance of the European Community; however, the views expressed herein must never be taken to reflect the official opinion of the
European Community.

Majuro: High-Resolution Bathymetry EU EDF- SOPAC Reducing Vulnerability of Pacific ACP States – iii
EU-SOPAC Project Report 117 – Krüger and Kumar 2008
TABLE OF CONTENTS
EXECUTIVE SUMMARY ...................................................................................................................... 1
1. INTRODUCTION ...................................................................................................................... 2
1.1 Background 2 1.2 Geographic Situation 2 1.3 Geological Setting 3 1.4 Previous Bathymetry Compilations 3
2. RESULTS ................................................................................................................................. 6
2.1 Bathymetry and Backscatter 6 2.2 Morphological Features 9
3. DATA ACQUISITION AND PROCESSING .......................................................................... 13
3.1 Survey Particulars 13 3.2 Field Personnel 13 3.3 Geodetic Reference System 13 3.4 Vessel Description and Static Offsets 14 3.5 Positioning Control 14 3.6 Survey Computer 14 3.7 Multibeam Echosounder 16 3.8 Multibeam Echosounder Data Processing 17 3.9 Multibeam Backscatter 17 3.10 Tidal Information 17 3.11 Sound Velocity Profiling 18
4. REFERENCES ....................................................................................................................... 22
APPENDICES ..................................................................................................................................... 23
Appendix 1 – Statement of Accuracy and Suitability for Charting 23 Appendix 2 – Ship Track and Data Coverage 28 Appendix 3 – CTD Profiles 30 Appendix 4 – High-Resolution A0 Charts, Majuro Bathymetry 32 Appendix 5 – SOPAC Multibeam Online Line Log 33

iv – Majuro: High-Resolution Bathymetry EU EDF- SOPAC Reducing Vulnerability of Pacific ACP States
EU-SOPAC Project Report 117 – Krüger and Kumar 2008
LIST OF FIGURES
Figure 1. Location map of Pacific Island countries and territories constituting SOPAC. ... v
Figure 2. Bathymetric map of Marshall Islands showing exclusive economic zone. ......... 2
Figure 3. Oceanic cruise plots for Majuro Atoll. ................................................................. 4
Figure 4. Map showing the 1994 and 2002 MBES bathymetry coverage. ........................ 5
Figure 5. Three-dimensional perspective image of Majuro atoll looking west. .................. 7
Figure 6. Gradient slope angle map of the Majuro seabed. .............................................. 7
Figure 7. Shaded relief map of Majuro’s lagoon and nearshore bathymetry. .................... 8
Figure 8. Map showing the MBES backscatter mosaic of the Majuro lagoon floor. .......... 8
Figure 9. Interpreted offshore seabed morphology of Majuro. ........................................ 10
Figure 10. Majuro lagoon multibeam backscatter mosaic, detail boxes A and B. ............. 11
Figure 11. Preliminary interpreted habitat map of the Majuro Lagoon. ............................. 12
Figure 12. Cross-section across the lagoon seafloor. ....................................................... 12
Figure 13. Cross-section across a depression in the deep flat part of the lagoon. ........... 12
Figure 14. The chartered survey vessel RV Summer Spirit. ............................................. 14
Figure 15. SEAFRAME tide gauge datum definition and geodetic levels at Majuro. ........ 18
Figure 16. Map showing the locations of CTD and GDEM profiles. .................................. 20
Figure 17. Sound velocity profiles used for MBES data correction. .................................. 21
Figure A1.1. Conceptual illustration of bathymetric data acquisition with an MBES. ............ 24
Figure A2.1. SOPAC/EU MBES Reson 8101 5-m grid coverage for Majuro. ....................... 28
Figure A2.2. SOPAC/EU MBES Reson 8160 coverage for Majuro. ..................................... 28
Figure A2.3. SOPAC/EU 1995 MBES Reson 8101 coverage for Majuro. ............................ 29
LIST OF TABLES
Table 1. Summary of Geography of Majuro ...................................................................... 3
Table 2. Public Multibeam Datasets for Majuro ................................................................ 4
Table 3. Summary of SOPAC Bathymetric Survey. .......................................................... 5
Table 4. Bathymetric Derivatives and Multibeam Backscatter .......................................... 6
Table 5. Geodetic Reference System ............................................................................. 13
Table 6. Post-Processing Sequence ............................................................................... 17
Table 7. Map Production Sequence ................................................................................ 17
Table 8. CTD Profile Details ............................................................................................ 19
Table 9. Generalised Digital Environmental Model Data (GDEM) .................................. 20
Table 10. Sound Velocity Profiles ..................................................................................... 21
Table A1.1. Recommended Accuracy of Survey Orders ...................................................... 23
Table A1.2. Values for Calculating Error Limits for Depth Accuracy .................................... 24
Table A1.3. Projected Footprint Size under Varying Water Depths ..................................... 26

Majuro: High-Resolution Bathymetry EU EDF- SOPAC Reducing Vulnerability of Pacific ACP States – v
EU-SOPAC Project Report 117 – Krüger and Kumar 2008
Figure 1. Location map of Pacific Island countries and territories constituting SOPAC.

vi – Majuro: High-Resolution Bathymetry EU EDF- SOPAC Reducing Vulnerability of Pacific ACP States
EU-SOPAC Project Report 117 – Krüger and Kumar 2008
Acronyms and their meaning
ACP African, Caribbean, and Pacific
ADCP Acoustic Doppler current profilers
ARGO Array for real-time geostrophic oceanography
ASCII American standard code for information interchange
CD Chart datum
CTD Conductivity – temperature – depth
DEM Digital elevation model
DTM Digital terrain model
EEZ Exclusive economic zone
GDEM Generalised digital environmental model
GEBCO General bathymetric chart of the oceans
GPS Global positioning system
LAT Lowest astronomical tide
MBES Multibeam echosounder
MRU Motion reference unit
MSL Mean sea level
NTC National Tide Centre
PI-GOOS Pacific Islands global ocean observing system
RTK Real-time kinematic GPS (centimetre accuracy)
SMNT Seamount catalogue
SOPAC Pacific Islands Applied Geoscience Commission
SPCZ South Pacific convergence zone
SRTM Shuttle radar topography model
TAO Tropical atmosphere ocean array
UTM Universal transverse Mercator
WGS World geodetic system

Majuro: High-Resolution Bathymetry EU EDF- SOPAC Reducing Vulnerability of Pacific ACP States – 1
EU-SOPAC Project Report 117 – Krüger and Kumar 2008
EXECUTIVE SUMMARY
Kruger, J. and Kumar, S. 2008: High-Resolution Bathymetric survey of Majuro, Republic of Marshall Islands. EU EDF 9 – SOPAC Project Report 117. Pacific Islands Applied Geoscience Commission: Suva, Fiji, vi + 39 p. + 2 charts.
The Pacific Islands Applied Geoscience Commission (SOPAC) carried out a marine survey for Majuro Atoll in the Marshall Islands. The objective was to investigate the seabed and provide information about water depths in and around the atoll using a multibeam echosounder (MBES)
This report describes a high-resolution bathymetric survey carried over a period of 10 days from 18 to 27 July, resulting in the acquisition of 752 km of multibeam echosounder data.
The survey achieved good coverage of the seafloor in the lagoon within the survey area from approximately 10 to 70 m water depths. The eastern nearshore area of the reef slope was mapped from approximately 10 m depth to an average offshore distance of 5 km, reaching water depths of some 2200 m. The seafloor terrain was found to be highly irregular with an average slope of 31º. The survey data was supplemented with data previously collected by SOPAC.
The resultant data compilation was used to produce bathymetry charts of Majuro at a scale of 1 : 50 000. The compiled bathymetry dataset reveals the main morphological features of the seabed in the lagoon and also around the eastern offshore areas. These new bathymetric maps provide a descriptive picture of the ocean bottom terrain, vividly revealing the size, shape and distribution of underwater features. They can serve as the basic tool for scientific, engineering, marine geophysical and environmental studies, as well as for marine and coastal resource management.

2 – Majuro: High-Resolution Bathymetry EU EDF- SOPAC Reducing Vulnerability of Pacific ACP States
EU-SOPAC Project Report 117 – Krüger and Kumar 2008
1. INTRODUCTION
1.1 Background
A marine survey for Majuro lagoon and parts of the offshore was carried out. The objective was to investigate the seabed and provide information about water depths using a multibeam echosounder (MBES). The present report describes the results of the MBES survey. This work was initiated by the SOPAC/EU Reducing Vulnerability of Pacific ACP States Project, under the European Development Fund.
Figure 2. Bathymetric map of Marshall Islands showing the atolls and approximate position of the exclusive economic zone. Bathymetric data are predicted water depths, with shallow to deep shown in red to blue (Smith and Sandwell 1997).
1.2 Geographic Situation
The Republic of the Marshall Islands (RMI) comprises approximately 1225 low-lying islets which make up the 29 atolls and five low-elevation islands. Its total land area is 181 square kilometres with a maximum height of 3 metres above sea level. The archipelagic islands are spread over a vast area of ocean in two roughly parallel island chains. The eastern group is the Ratak (Sunrise) Chain and the western is the Ralik (Sunset) Chain. Selected geographic characteristics of Majuro are provided in Table 1.

Majuro: High-Resolution Bathymetry EU EDF- SOPAC Reducing Vulnerability of Pacific ACP States – 3
EU-SOPAC Project Report 117 – Krüger and Kumar 2008
Table 1. Summary of Geography of Majuro
Location 17112 E and 709N
Land area The atoll is elongate in shape, extending 40 km from east to west and 9.7 km from north to south with an approximate land area of 181.3 km2.
Coastline The lagoon is enclosed by an almost continuous reef flat with some passages on the middle west of the north rim, in which a 3.2 km wide and 9.1–18.3 m deep passage is located to the west of Calin islet. Most islets are on the eastern half of the north rim, and east, south and southwest rims. The islets on the south rim have been connected by causeways. The lagoon has a surface area of about 344 km2 and an average depth of about 46 m, descending to a maximum depth of 67 m (Manoa Mapworks 1989; Wilson et al. 1990; Holthus et al. 1992).
Tides Semi-diurnal with pronounced diurnal inequalities (i.e. two tidal cycles per day of unequal tidal range). Predicted mean range and mean spring range at Majuro Atoll are 1.13 m and 1.62 m respectively (US Department of Commerce).
Climate Predominant influence is from the northeast trade winds; temperature variations are slight with northern islands being slightly cooler than the southern. Rainfall varies from north to south; Ujelang has an average of 2030 mm per annum while Jaluit, further south, has twice that amount. Mean temperature is 27C.
Exclusive Economic Zone, EEZ
2 131 000 km2
1.3 Geological Setting
The atolls of Marshall Islands consist of circular to elliptical chains of small carbonate islands associated with a coral-reef platform encircling a shallow, central, seawater lagoon. The atoll islands, which typically consist of reef debris and atoll sediments, are exposed or emerged portions of a thick carbonate platform that has formed on top of a subsided and submerged volcanic edifice.
The Marshall Islands sit atop the Pacific Plate and are thought to represent a senescent volcanic chain produced by a long-inactive hotspot (Scott and Rotondo 1983). Unlike the nearby linear volcanic island chains in the Pacific, the volcanoes that underlie the present-day Marshall Islands are widely scattered and do not exhibit any apparent age linearity.
1.4 Previous Bathymetry Compilations
Bathymetric maps are topographic maps of the sea floor, giving a descriptive picture of the ocean bottom terrain. With an exclusive economic zone (EEZ) of approximately 2 131 000 km2, the available bathymetric data is limited and the exact nature of seafloor is poorly known. Most available bathymetric data originates from sparse single-beam soundings from oceanographic cruises, and since the early 1990s, from MBES systems as well as satellite-derived predicted depth.
A search for public Multibeam data on NOAA’S national geophysical data centre (http://www.ngdc.noaa.gov) and the seamount Catalogue, SMNT (earthref.org) in February 2008 produced the scientific cruises for the area of interest shown in Table 2 and Figure 3.

4 – Majuro: High-Resolution Bathymetry EU EDF- SOPAC Reducing Vulnerability of Pacific ACP States
EU-SOPAC Project Report 117 – Krüger and Kumar 2008
Table 2. Public Multibeam Datasets for Majuro
Ship Survey ID/instrument Year
RV Washington RNDB12WT/SeaBeam 1988–1989
RV Washington RNDB11WT/SeaBeam 1988
RV Washington RNDB10WT/SeaBeam 1988
RV Washington RNDB13WT/SeaBeam 1989
RV Washington TUNE09WT/SeaBeam 1992
RV Washington TUNE08WT/SeaBeam 1992
RV Melville AVON02MV/SeaBeam2000 1999
RV Melville AVON01MV/SeaBeam2000 1999
Figure 3. Oceanic cruise plots for Majuro Atoll
SOPAC carried out a series of marine surveys in the Majuro lagoon from 1994. Bathymetry data collected in 1994 and 2002 are provided in Figure 4. The summary of the surveys is provided in Table 3.

Majuro: High-Resolution Bathymetry EU EDF- SOPAC Reducing Vulnerability of Pacific ACP States – 5
EU-SOPAC Project Report 117 – Krüger and Kumar 2008
Table 3. Summary of SOPAC Bathymetric Survey.
Figure 4. Map showing the 1994 and 2002 MBES bathymetry coverage by SOPAC.
Year of Survey
Area Surveyed Survey Methods Reference
1994 Western end of Anemwanot islet to the east of Ejit islet
Some 30 km of single-channel bathymetry (De 719e Raytheon precision echo sounder)
Smith (1995)
2002 Eastern portion of the lagoon from the airport to Uliga in the east, the inner margin of lagoon from Peace Park to Laura and the northern margin from Calalin Channel to Rita.
Some 478 km of high-resolution multibeam bathymetry (Reson 8101 echo sounder)
Smith & Collen (2004)

6 – Majuro: High-Resolution Bathymetry EU EDF- SOPAC Reducing Vulnerability of Pacific ACP States
EU-SOPAC Project Report 117 – Krüger and Kumar 2008
2. RESULTS
2.1 Bathymetry and Backscatter
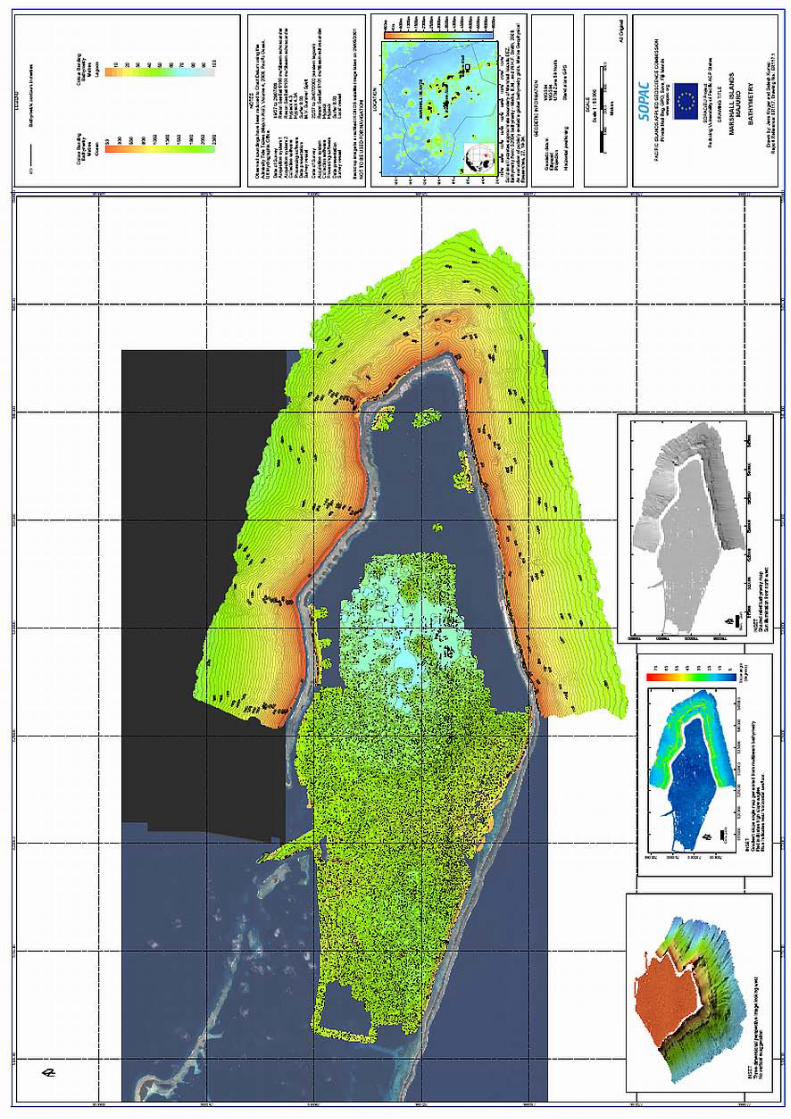
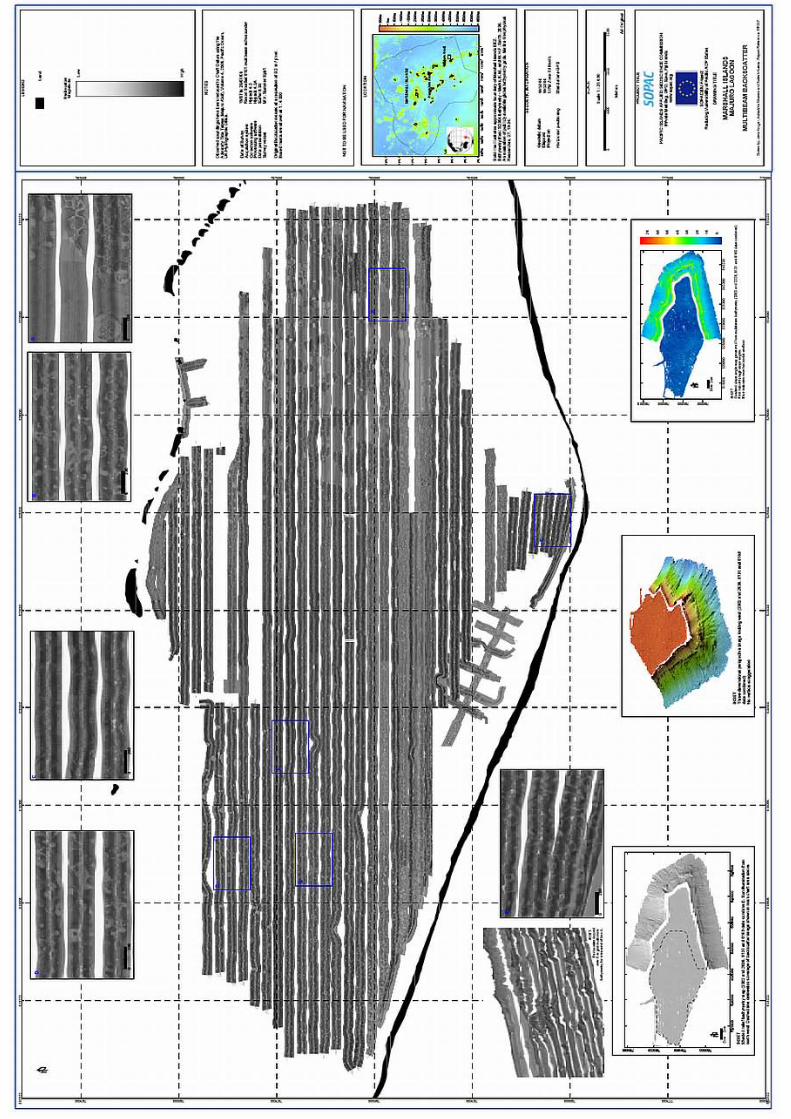
The MBES bathymetry acquired during this survey is shown on chart ER117.1 at a scale of 1 : 50 000 and contoured at intervals of 100 m. The multibeam backscatter data acquired for the lagoon during this survey is shown on chart ER117.2 at a scale of 1 : 25 000. The grid files, as well as charts, meta data, and report are available through the SOPAC Geonetwork site. The report and full-size charts are also available from the SOPAC virtual library. Links to these sites can be found on www.sopac.org.
Bathymetric and backscatter data provide information on the depth and morphology of the seafloor, as well as the shape and size of submarine features. Three bathymetry derivatives (slope angle maps, shaded relief maps, and three-dimensional rendered surfaces), were used in addition to the high-resolution bathymetry and backscatter data to aid visual interpretation of the seabed morphology. These terms are summarised in Table 4 below, and images are shown in Figure 5 to Figure 8.
Table 4. Bathymetric Derivatives and Multibeam Backscatter
Slope angle Slope is a measure of steepness between locations on the seabed, and is reported in degrees from zero (horizontal). Slope values are computed as a mean value for one grid cell from the slope gradient between it and the eight neighbouring grid cells.
Shaded relief Shaded relief maps use shades of grey to indicate the local orientation of the seafloor relative to a user-defined light source direction. The light source can be thought of as the sun shining on a topographic surface, much like artificial hillshading that illuminates bathymetric roughness. Portions of the surface that face away from the light source reflect less light toward the viewer, and thus appear darker.
Three-dimensional surface For three-dimensional surfaces the height of the surface corresponds to the depth of the seafloor.
Backscatter The MBES records echo strength data (reflected energy) that can be presented as seabed backscatter maps, similar to sidescan sonar mosaic. The backscatter image shows information on the composition of the seafloor. For example, soft marine muds absorb part of the sound energy, thereby muting the reflected signal, whereas a strong echo may indicate a rock outcrop or coral reef.
Majuro: High-Resolution Bathymetry EU EDF- SOPAC Reducing Vulnerability of Pacific ACP States – 7
EU-SOPAC Project Report 117 – Krüger and Kumar 2008
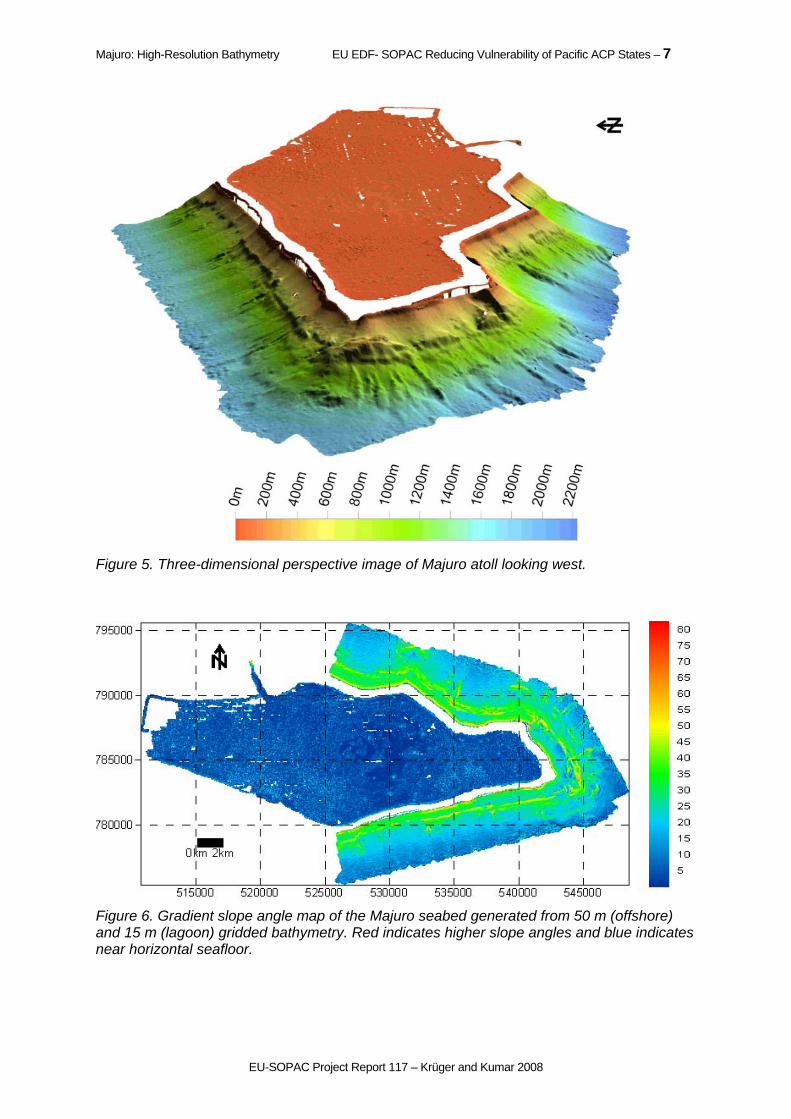
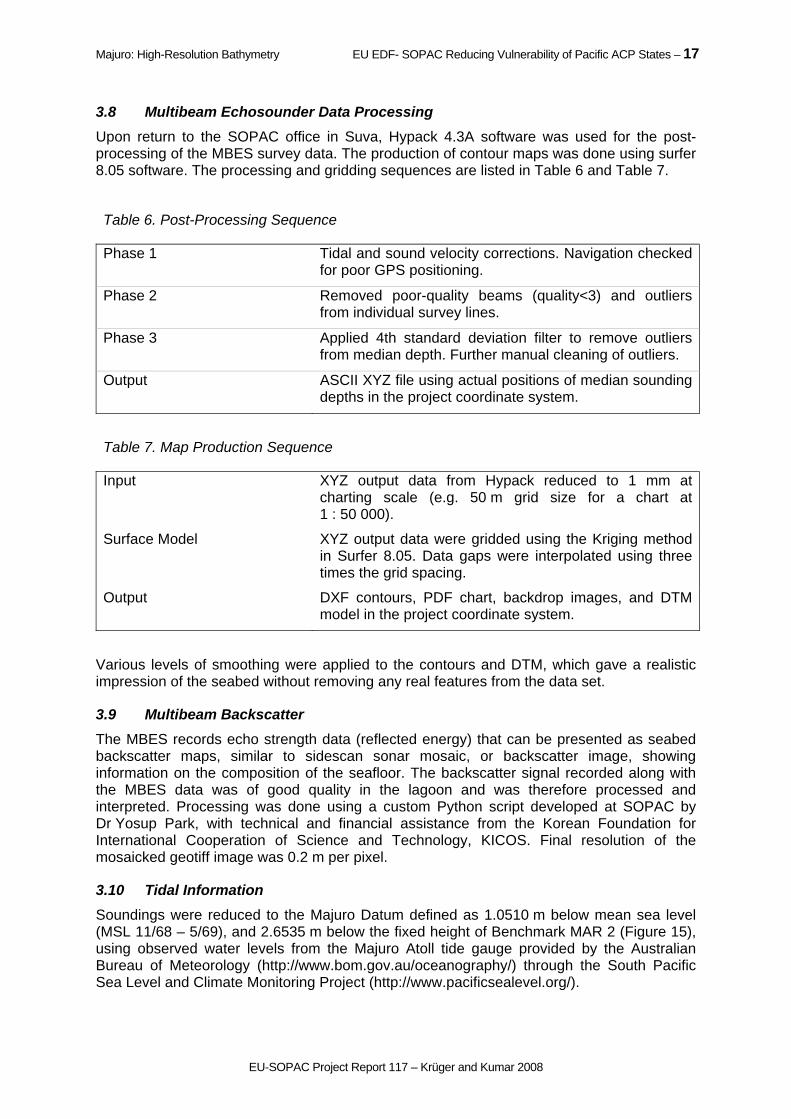
Figure 5. Three-dimensional perspective image of Majuro atoll looking west.
Figure 6. Gradient slope angle map of the Majuro seabed generated from 50 m (offshore) and 15 m (lagoon) gridded bathymetry. Red indicates higher slope angles and blue indicates near horizontal seafloor.

8 – Majuro: High-Resolution Bathymetry EU EDF- SOPAC Reducing Vulnerability of Pacific ACP States
EU-SOPAC Project Report 117 – Krüger and Kumar 2008
Figure 7. Shaded relief map of Majuro’s lagoon and nearshore bathymetry. Sun illumination from the northwest.
Figure 8. Map showing the MBES backscatter mosaic of the Majuro lagoon floor. Land is shown in black. Low to high backscatter intensity is shown from white to black.

Majuro: High-Resolution Bathymetry EU EDF- SOPAC Reducing Vulnerability of Pacific ACP States – 9
EU-SOPAC Project Report 117 – Krüger and Kumar 2008
2.2 Morphological Features
The high-resolution MBES data, bathymetric derivatives, and backscatter (in case of the lagoon) described in the section above, were used to interpret broad habitats in geomorphic terms of the lagoon and the eastern offshore flank as shown in Figure 9 and Figure 11, respectively. The classification used in Figure 9 makes use of the terms and nomenclature endorsed by the International Hydrographic Organisation (IHO 2001) as defined in the table below.
Geomorphic feature Definition
Apron A gently dipping featureless surface, underlain primarily by sediment, at the base of any steeper slope.
Canyon A relatively narrow, deep depression with steep sides, the bottom of which generally has a continuous slope, developed characteristically on some continental slopes.
Escarpment An elongated and comparatively steep slope separating gently sloping areas.
Knoll/Hill/Peak A small isolated elevation.
Pinnacle Any high tower or spire-shaped pillar or rock or coral, alone or cresting a summit. It may extend above the surface of the water. It may or may not be a hazard to navigation.
Reef Rock/Coral lying at or near the sea surface that may constitute a hazard to surface navigation.
Ridge A long, narrow elevation with steep sides.
Shelf Zone around an island extending from the low water line to a depth at which there is usually a marked increase of slope towards oceanic depths.
Slope Slope seaward from the shelf edge to the upper edge of a continental rise or the point where there is a general reduction in slope.
The nearshore bathymetry of Majuro shows a terrace below the fringing reef platform. It is approximately 100 m wide with an average water depth of 300 m. Below this terrace the seabed slopes at angles of 30–40º to a depth of approximately 1500 m. Depths to 1900 m are characterised by much gentler slopes of 0–20º. A bathymetric high is observed at the south-eastern end of the atoll in water depth of 400 m.
Few small channels on the southern side of the atoll are seen to be originating at the base of the terrace while a channel on the northern side seems to be cutting through the terrace. Around the southern and northern parts in waters greater than 1200 m, the seafloor appears to be quite featureless. A few submarine slumps and ridges are seen originating at around 1400 m at the north-eastern side of the atoll. The extent of the slump extends beyond the limit of the bathymetric survey.

10 – Majuro: High-Resolution Bathymetry EU EDF- SOPAC Reducing Vulnerability of Pacific ACP States
EU-SOPAC Project Report 117 – Krüger and Kumar 2008
Figure 9. Interpreted offshore seabed morphology of Majuro on a shaded relief image illuminated from the North.
The distribution of surficial sediments and sedimentary environments in Majuro lagoon were investigated using high-resolution bathymetry, backscatter, seismic profiling and sediment data. Shallow-water multibeam data were acquired using Reson 8101, together with the backscatter data. Seismic profiling was accomplished with the DataSonics SBT 200 system. The analogue data was recorded on an EPC 1650 graphic recorder with a sweep frequency of 125 milliseconds (ms). The seismic data was interpreted and is presented in a separate report (Woo & Kumar in press).
Surficial sediment samples, used to verify the backscatter and bathymetry data, were collected using a Van Veen grab sampler, and analysed for grain size. The data analyses and results are presented in a separate report (Tawake & Kumar 2008). These sediment samples were spatially limited to the inner reef rim slopes. Tonal changes in the backscatter mosaic (Figure 10) help determine sediment type in the lagoonal area. Light tones indicate low backscatter caused by generally fine grained sediment or soft bottom or an acoustic shadow; dark tones indicate high backscatter caused by generally coarser-grained sediment. No sediment samples or seabed samples were available for the lagoon proper or depths below 10 m. The interpretation shown in Figure 11 is therefore preliminary and largely based on expert opinion. SOPAC is planning a ground truthing survey for Majuro lagoon for 2008, or early 2009.
A large proportion of the mapped lagoon floor comprised numerous mounds interpreted to be Halimeda mounds from seismic profiles, giving the seabed a rough and hummocky bathymetric fabric (Figure 12). In the deepest parts of the lagoon the seafloor appears quite flat and consists of fine to medium sand (Smith and Collen 2003). These mounds measure on average approximately 200 m across and 10 m high (Figure 12 and Figure 13).

Majuro: High-Resolution Bathymetry EU EDF- SOPAC Reducing Vulnerability of Pacific ACP States – 11
EU-SOPAC Project Report 117 – Krüger and Kumar 2008
Scattered isolated pinnacles within the lagoon are presumed coral heads. An irregular area of 6x6 km, centred on 529 900 E, 786 400 N, in the eastern portion of the lagoon is mapped as flat, fine to medium sand in Figure 11. This area exhibits a relatively flat and featureless seafloor with occasional depressions. Wind-driven waves, storm erosion, and tidal currents rework the seafloor in the lagoon. Coarser-grained sediment is abundant in shallow depths where the sediment is winnowed by waves and currents. Fine grains are transported from these high-energy environments and deposited in low-energy environments where bathymetry is smooth and water depths are moderate to deep. Sorting and reworking of sediments is taking place throughout the sedimentary environment. Most of the nearshore areas of the lagoon are composed of gravelly sediments and is classified as sediment aprons. Sediment aprons dominate around the northern and eastern inner reef rim edges of the lagoon. A thin veneer of sand is believed to cover bathymetric mounds near the entrance channel.
Figure 10. Majuro lagoon multibeam backscatter mosaic, with backscatter of boxes A and B.

12 – Majuro: High-Resolution Bathymetry EU EDF- SOPAC Reducing Vulnerability of Pacific ACP States
EU-SOPAC Project Report 117 – Krüger and Kumar 2008
Land
Area Dominated with Halimeda Mounds
Coral heads
Sediment covered outcrops/subcrops
Flat fine to medium sand
Sediment aprons
N
0 2km
Figure 12. Cross-section across the lagoon seafloor, presumed Halimeda mounds, showing associated hummocky bathymetry.
Figure 13. Cross-section across a depression in the deep flat part of the lagoon, with the associated bathymetry.
Figure 11. Preliminary interpreted habitat map of the Majuro Lagoon. An already planned ground-truthing survey of the lagoon floor will be used to update the broad habitats shown in this map.

Majuro: High-Resolution Bathymetry EU EDF- SOPAC Reducing Vulnerability of Pacific ACP States – 13
EU-SOPAC Project Report 117 – Krüger and Kumar 2008
3. DATA ACQUISITION AND PROCESSING
3.1 Survey Particulars
Survey vessel: RV Summer Spirit
Fieldwork date: 18 to 27 July 2006
Equipment used: Reson 8160, deep water MBES, Reson 8101 shallow-water MBES
All dates and times in this report are given in the local Majuro time zone (12:00h GMT = 24:00h local).
3.2 Field Personnel
SOPAC: Robert Smith (Chief Scientist), Salesh Kumar (Technical Officer), Ed Saphore (Electronic Technician)
Vessel: Brian Hennings (Master), Tomasi (Officer), Sakiusa (Engineer), Ram Reddy (Cook)
3.3 Geodetic Reference System
Survey results were mapped in terms of the geodetic reference system shown in Table 5.
Table 5. Geodetic Reference System
Geodetic datum WGS84
Ellipsoid WGS84
Semi-major axis (a) 6378137.000
Inverse flattening (1/f) 298.257223563
Projection UTM zone 59 north
Projection type Transverse Mercator
Reference latitude 00° 00' 00.000" North
Central meridian 171° 00' 00.000" East
Origin false easting 500000.0000
Origin false northing 10000000.0000
Scale factor 0.9996000000
Grid unit metres
Geodetic transformation From WGS84 (GPS satellite datum) to UTM 59 North
Source coordinate system WGS84
Target coordinate system UTM 59 North
Transformation parameters
dX 0.00
dY 0.00
dZ 0.00
rX 0.00000

14 – Majuro: High-Resolution Bathymetry EU EDF- SOPAC Reducing Vulnerability of Pacific ACP States
EU-SOPAC Project Report 117 – Krüger and Kumar 2008
rY 0.00000
rZ 0.00000
Scale 0.00000
3.4 Vessel Description and Static Offsets
Details regarding the survey vessel are shown in Figure 14 and on page 15.
Figure 14. The chartered survey vessel RV Summer Spirit.
3.5 Positioning Control
The vessels reference point (X=0, Y=0, Z=0) was the motion reference unit (MRU) position at the waterline. Positioning was by stand-alone GPS, using an Ashtech Aquarius dual-frequency P-code receiver. A good satellite constellation status was observed throughout the survey. The patch test was conducted in Suva, Fiji, using RTK GPS.
3.6 Survey Computer
The survey computer was a Windows 2000 PC running Hypack 4.3. This computer was used for continuous on-line data logging and computation of positioning and digital bathymetry. The package also provided a line control display for the helm. The on-line operator continuously monitored a range of quality control parameters.
An off-line Hypack 4.3A package was used in the office for replaying and post-processing of track data and bathymetry. An A0 plotter was available for the production of full-size charts (841 x 1189 mm).

Majuro: High-Resolution Bathymetry EU EDF- SOPAC Reducing Vulnerability of Pacific ACP States – 15
EU-SOPAC Project Report 117 – Krüger and Kumar 2008
ensor X (m) Y (m) Z (m)
Reference point at water level 0.00 0.00 0.00
Motion Reference Unit (MRU) 0.00 0.00 1.82
Positioning Antenna (GPS) 1.92 –6.92 –6.29
Multibeam Echo Sounder (MBES)8160 0.86 –3.96 1.52
Multibeam Echo Sounder (MBES)8101 –2.15 –2.82 1.34
Winch –14.29 1.92 3.00
Vessel
Name Summer Spirit
Length overall 25 m
Breadth (mid) 6 m
Draft (mid) 2.5 m
Displacement 65 t
Port of registry Brisbane
Registration No. IQ115Q
Call Sign 3DTF
Vessel Type Mono-hull motor yacht
MBES
Winch
GPS
-Z
+Z
+Y-Y
Water level
MRU
+X
-X
+Y-Y
Winch MBES
MRU
GPS
Not to scale

16 – Majuro: High-Resolution Bathymetry EU EDF- SOPAC Reducing Vulnerability of Pacific ACP States
EU-SOPAC Project Report 117 – Krüger and Kumar 2008
3.7 Multibeam Echosounder
A Reson SeaBat 8160 and 8101 multibeam echosounder (MBES) was temporarily installed on MV Summer Spirit, and used to provide swath bathymetry data. A MBES provides high-resolution information about the depth of water from the surface to the seafloor in a water body. The pre-operational calibration (patch test and bar check) were performed in accordance with procedures contained in USACE (2002). The main instrumental and operating parameters are listed below.
Instrumentation Item Reson SeaBat 8160 Reson SeaBat 8101
Transducer mount Starboard hull-mounted Port side hull-mounted
Motion reference unit TSS DMS 2-05 Dynamic Motion Sensor
TSS DMS 2-05 Dynamic Motion Sensor
Gyro SG Brown Meridian Surveyor Gyro Compass
SG Brown Meridian Surveyor Gyro Compass
Sound velocity probe at transducer
Installed N/A
Operating Parameters Reson SeaBat 8160 Reson SeaBat 8101
Transducer frequency 50 kHz 240 kHz
General water depth 10–2500 m 0–250 m
Average ship’s speed 7 knots (3.6 m/s) 7 knots (3.6 m/s)
Transmit power Variable 1–16 Variable 1–16
Pulse length Variable 0.5–10.0 ms Variable 0.5–10.0 ms
Horizontal coverage Approximately two times water depth
Approximately two times water depth
No of beams / beam spacing
126 / 1.5 ° 101 / 1.5 °
Ping rate Variable, maximum of 4 Hz Variable, maximum of 4 Hz
Dynamic Offset Calibration Vanimo, 12/06/2006. Reson 8101
Suva, 25/04/2006. Reson 8160
Roll correction –1.60 –1.30
Pitch correction –2.00 –1.00
Yaw correction –1.00 0.00
GPS Latency correction 0.00 0.40
Gyro correction Not determined Not determined
Majuro: High-Resolution Bathymetry EU EDF- SOPAC Reducing Vulnerability of Pacific ACP States – 17
EU-SOPAC Project Report 117 – Krüger and Kumar 2008
3.8 Multibeam Echosounder Data Processing
Upon return to the SOPAC office in Suva, Hypack 4.3A software was used for the post-processing of the MBES survey data. The production of contour maps was done using surfer 8.05 software. The processing and gridding sequences are listed in Table 6 and Table 7.
Table 6. Post-Processing Sequence
Phase 1 Tidal and sound velocity corrections. Navigation checked for poor GPS positioning.
Phase 2 Removed poor-quality beams (quality<3) and outliers from individual survey lines.
Phase 3 Applied 4th standard deviation filter to remove outliers from median depth. Further manual cleaning of outliers.
Output ASCII XYZ file using actual positions of median sounding depths in the project coordinate system.
Table 7. Map Production Sequence
Input XYZ output data from Hypack reduced to 1 mm at charting scale (e.g. 50 m grid size for a chart at 1 : 50 000).
Surface Model XYZ output data were gridded using the Kriging method in Surfer 8.05. Data gaps were interpolated using three times the grid spacing.
Output DXF contours, PDF chart, backdrop images, and DTM model in the project coordinate system.
Various levels of smoothing were applied to the contours and DTM, which gave a realistic impression of the seabed without removing any real features from the data set.
3.9 Multibeam Backscatter
The MBES records echo strength data (reflected energy) that can be presented as seabed backscatter maps, similar to sidescan sonar mosaic, or backscatter image, showing information on the composition of the seafloor. The backscatter signal recorded along with the MBES data was of good quality in the lagoon and was therefore processed and interpreted. Processing was done using a custom Python script developed at SOPAC by Dr Yosup Park, with technical and financial assistance from the Korean Foundation for International Cooperation of Science and Technology, KICOS. Final resolution of the mosaicked geotiff image was 0.2 m per pixel.
3.10 Tidal Information
Soundings were reduced to the Majuro Datum defined as 1.0510 m below mean sea level (MSL 11/68 – 5/69), and 2.6535 m below the fixed height of Benchmark MAR 2 (Figure 15), using observed water levels from the Majuro Atoll tide gauge provided by the Australian Bureau of Meteorology (http://www.bom.gov.au/oceanography/) through the South Pacific Sea Level and Climate Monitoring Project (http://www.pacificsealevel.org/).

18 – Majuro: High-Resolution Bathymetry EU EDF- SOPAC Reducing Vulnerability of Pacific ACP States
EU-SOPAC Project Report 117 – Krüger and Kumar 2008
Figure 15. SEAFRAME tide gauge datum definition and other geodetic levels at Majuro (from NTFA 2005).
3.11 Sound Velocity Profiling
The accuracy of the depth soundings depends in part on the variation of the speed of sound with water depth. Sound velocity profiles are therefore required in order to find the correct depth and location of water depth soundings. The speed of sound in seawater varies with temperature, salinity and depth, and was determined by measuring the conductivity, temperature and depth (CTD) through the water column. The main instrumental, operational, processing parameters are listed below.
CTD Instrumentation
Make SeaBird Electronics
Model SeaCat 19+ (self-powered, self-contained)
Serial number 4716
Depth rating 3000 m
Operating Parameters
Sample rate 1 scan every 0.5 s
Maximum depth Limited to 400 m due to wire rope length
Data recorded Profiles of conductivity, temperature, and pressure

Majuro: High-Resolution Bathymetry EU EDF- SOPAC Reducing Vulnerability of Pacific ACP States – 19
EU-SOPAC Project Report 117 – Krüger and Kumar 2008
Data Processing
Positioning The profile position was taken at the GPS antenna near the start of the downcast. Vessel drift may have been significant (~500 m) over the duration of the profile.
Data conversion Converted raw data (.hex) to a .cnv file. The following values are output from the recorded data:
Pressure, dbar
Depth, m (derived using salt water at local latitude)
Temperature, deg C (ITS-90)
Salinity, psu (derived)
Density, kg m–3 (derived)
Sound velocity, m/s (derived using Chen and Millero 1977)
Bin average Average data into 1 m depth bins. No filtering was applied.
Output Processed data is saved in ASCII text format with the file name date_location_bin.cnv.
The CTD profile details are listed in Table 8, and locations are shown in Figure 16.
Table 8. CTD Profile Details
Profile location Date Time Easting Northing Depth (m)
South-side offshore 23/07/06 12:45 525852.9 77768.9 1100
Offshore-Calalin 24/07/06 16:27 525656.74 793093.7 1180
South of Calin pass 26/07/06 16:53 522385.26 787311.26 46.5
Central lagoon 26/07/06 17:43 533392.53 787225.99 54
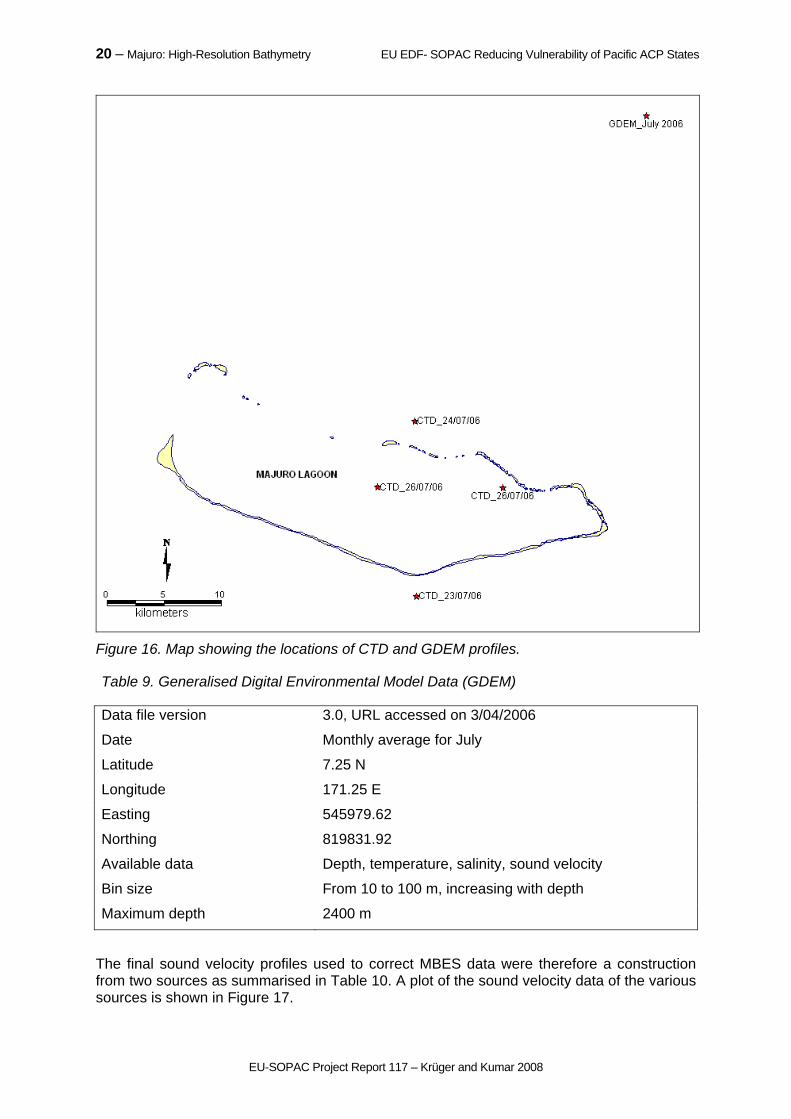
The on-board CTD probe could only be operated to maximum depth of 400 m due to restrictions on the wire rope length. The ship-based profile data were complemented with an external source of sound velocity data, in order to ensure corrections for depth soundings exceeding 400 m. This source consisted of predicted sound velocity profile from the Generalised Digital Environmental Model (GDEM). The GDEM is a global climatology model developed by the U.S Naval Oceanographic Office and provides a monthly temperature, salinity, and sound velocity profiles on a global ¼ degree grid (https://128.160.23.42/gdemv.html). Parameters of this source are shown in Table 9.
20 – Majuro: High-Resolution Bathymetry EU EDF- SOPAC Reducing Vulnerability of Pacific ACP States
EU-SOPAC Project Report 117 – Krüger and Kumar 2008
Figure 16. Map showing the locations of CTD and GDEM profiles.
Table 9. Generalised Digital Environmental Model Data (GDEM)
Data file version 3.0, URL accessed on 3/04/2006
Date Monthly average for July
Latitude 7.25 N
Longitude 171.25 E
Easting 545979.62
Northing 819831.92
Available data Depth, temperature, salinity, sound velocity
Bin size From 10 to 100 m, increasing with depth
Maximum depth 2400 m
The final sound velocity profiles used to correct MBES data were therefore a construction from two sources as summarised in Table 10. A plot of the sound velocity data of the various sources is shown in Figure 17.

Majuro: High-Resolution Bathymetry EU EDF- SOPAC Reducing Vulnerability of Pacific ACP States – 21
EU-SOPAC Project Report 117 – Krüger and Kumar 2008
Table 10. Sound Velocity Profiles
Sound Velocity Data Source Water Depth
CTD casts 0 to < 400 m
GDEM model 400 to 2400 m
0
200
400
600
800
1000
1200
1400
1600
1800
2000
2200
2400
1480 1500 1520 1540 1560
Sound velocity (m/s)
De
pth
(m
)
GDEM
CTD
Figure 17. Example plot showing the sound velocity profiles used for MBES data correction.

22 – Majuro: High-Resolution Bathymetry EU EDF- SOPAC Reducing Vulnerability of Pacific ACP States
EU-SOPAC Project Report 117 – Krüger and Kumar 2008
4. REFERENCES
Array for real-time geostrophic oceanography. ARGO. http://www.argo.ucsd.edu/
Chen, C.T. and Millero, F.J. 1977. Speed of sound in seawater at high pressure. Journal of the Acoustic Society of America 32(10): 1357 p.
Global Topography. GTOPO. http://topex.ucsd.edu/marine_topo/mar_topo.html. Global topography data is available from: http://topex.ucsd.edu/cgi-bin/get_data.cgi
Generalised Digital Environmental Model. GDEM. https://128.160.23.42/gdemv/gdemv.html
Holthus, P., Crawford, M., Makoro, C. and Sullivan, S. 1992. Vulnerability Assessment for Accelerated Sea level Rise, Case study; Majuro Atoll, republic of the Marshall Islands. South Pacific Regional Environmental Programme, Apia, 107 p.
IHO 2001. Standardization of Undersea Feature Names: Guidelines, Proposal Form, Terminology, International Hydrographic Bureau/Intergovernmental Oceanographic Commission, Monaco, p. 40.
Manoa Mapworks 1989. Majuro Atoll coastal resource atlas. Honolulu, Hawaii: US army Corps of Engineers, Pacific Ocean Division.
Scott, G.A.J. and Rotondo, G.M. 1983. A model for the development of types of atolls and volcanic islands on the Pacific lithospheric plate. Atoll Research Bulletin 260, 33 p.
Smith, R. 1995. Sand and aggregate resources, Majuro Atoll, Marshall Islands. SOPAC Technical Report 215. 49 p.
Smith, R. and Collen, J. 2003. Sand and gravel resources of Majuro Atoll, Marshall Islands, SOPAC Technical Report 360.
Smith, W.H.F. and Sandwell, D.T. 1997. Global seafloor topography from satellite altimetry and ship depth soundings, Science 277: 1957–1962.
Tawake, A.K. and Kumar, S. 2008. Marshall Islands Technical Report: Assessment of Marine Aggregates in Selected Sites of the Majuro Lagoon Rim, Republic of the Marshall Islands, SOPAC Project Report 108, 27 p.
Woo, J. and Kumar, S. in press. Seismic survey, Majuro Atoll, Marshall Islands. SOPAC Technical Report 414.
Tropical Atmosphere Ocean Project. TAO. http://tao.noaa.gov/
USACE, US Army Corps of Engineers, 2002. Engineering and design – hydrographic surveying. Engineering Manual, EM 1110-2-1003. (http://www.usace.army.mil/publications/eng-manuals/em1110-2-1003/toc.htm).
Wilson, A.M., Margos, J.E. and Rappa, P. 1990. Executive summary. In: Margo, J.E. et al. (eds) Coastal Resource Inventory of Majuro Atoll, Republic of the Marshall Islands. pp. 1–39.

Majuro: High-Resolution Bathymetry EU EDF- SOPAC Reducing Vulnerability of Pacific ACP States – 23
EU-SOPAC Project Report 117 – Krüger and Kumar 2008
APPENDICES
Appendix 1 – Statement of Accuracy and Suitability for Charting
Bathymetric maps are topographic maps of the sea floor. The bathymetric map serves as a basic tool for performing scientific, engineering, marine geophysical and environmental studies. The information presented in this report and enclosed charts are intended to assist persons and authorities engaged in recreation, tourism, marine resource related industries, hydrographic mapping, coastal development, trade and commerce, sovereignty and security, and environmental management. It is consequently important that users be informed of the uncertainties associated with the data and with products constructed from it. The following is an outline of the survey equipment used and the operating principles, including limitations and estimates regarding the data accuracy.
A1.1 Horizontal positioning
The methods used to acquire survey data will affect the final product accuracy. The global positioning system, GPS, uses radio signals from satellites that orbit the earth to calculate the position of the GPS receiver. Stand-alone GPS has an estimated accuracy as good as approximately 10 m, depending on satellite configuration and atmospheric conditions. In addition to this, equipment and measurements errors also need to be considered.
A general rule of thumb is that surveys should be conducted with a positioning accuracy of 1 mm at the scale of the chart. Therefore, at a scale of 1 : 10 000, the survey would be required to be accurate to 10 m.
The present S-44 4th Edition Standard of the International Hydrographic Office (IHO) includes a depth-dependent factor that takes into account the added uncertainty of the positions of soundings from multibeam echo sounder (MBES) systems as depth increases. The relevant survey orders are listed in Table A1.1, with multibeam surveys conducted by SOPAC generally falling into orders 2 and 3.
Table A1.1. Recommended Accuracy of Survey Orders
Survey order Application Recommended Accuracy
Order 1 Harbours and navigation channels 5 m + 5% of depth
Order 2 Depths < 200 m 20 m + 5% of depth
Order 3 Depths > 200 m 150 m + 5% of depth
For the purpose of this survey, it was assumed that the use of GPS provided adequate precision in terms of horizontal position. Therefore, it is not recommended to interpret nearshore data at scales larger than 1 : 10 000, or a grid size smaller than 10 m. For areas with water depths greater than 200 m, a charting scale of least 1 : 50 000 is recommended.
A1.2 Depth measurements
Bathymetric maps provide information about the depth of water from the water surface to the seabed. Through the use of detailed depth contours and full use of bathymetric data, the size, shape and distribution of underwater features are clearly revealed. The depth is measured using a ship-mounted multibeam echo sounder. The MBES transducer produces an acoustic pulse designed as a fan that is wide in the across-track and narrow in the along-track direction (Figure A1.1). The swath of seabed covered by this transmit beam is typically twice the water depth. The pulse of sound emitted from the MBES travels through the water column and is reflected back as an echo and received as numerous narrow beams by the

24 – Majuro: High-Resolution Bathymetry EU EDF- SOPAC Reducing Vulnerability of Pacific ACP States
EU-SOPAC Project Report 117 – Krüger and Kumar 2008
receiving elements of the MBES. The measurements are time based, and by using the speed of sound in seawater each time is converted first to a range and then, knowing the beam angle, to a depth. The distance to the seabed is then combined with the movement of the vessel to stabilise it into a real-world framework. The framework is then positioned to provide XYZ soundings for each beam’s interaction with the seabed. A series of these swaths are then combined to produce a three-dimensional representation of the seafloor topography.
The accuracy of the MBES system is critically dependent on the corrections applied for vessel motion (heave, pitch, roll, yaw, and heading). However, the absolute accuracy of single beam and multibeam bathymetry depends on several factors that are not easy to determine. For single beam data, probably the principal errors that may be introduced are due to topographic features falling between survey lines. Multibeam systems give far better coverage.
The S-44 4th Edition Standard of the IHO lists values “a” and “b” (Table A1.2) that should be introduced into the following equation to calculate the error limits for depth accuracy:
22 dba , where d = depth.
Table A1.2. Values for Calculating Error Limits for Depth Accuracy.
Survey order Application Constants
Order 1 Harbours and navigation channels a = 0.5 m, b = 0.013
Order 2 Depths < 200 m a = 1.0 m, b = 0.023
Order 3 Depths > 200 m a = 1.0 m, b = 0.023
For example, the IHO recommends that a near-shore coastal survey (Order 2) in water depths of 20 m should have a maximum error of ± 1.1 m.
An MBES has, as any other measuring instrument, an inherent limit in its achievable accuracy. The total measurement accuracy, i.e. the uncertainty in the depth and location of the soundings, also depends upon the errors of the auxiliary instruments such as the motion reference unit, the gyro compass, and the measurements of the speed of sound through the water column. The sea state at the time of the survey also contributes significantly to the
Figure A1.1. Conceptual illustration of bathymetric data acquisition with a multibeam echosounder, MBES (source: http://www.rcom.marum.de, accessed 10/01/2007)

Majuro: High-Resolution Bathymetry EU EDF- SOPAC Reducing Vulnerability of Pacific ACP States – 25
EU-SOPAC Project Report 117 – Krüger and Kumar 2008
quality of the data. The possible accuracy of the measured depths may be estimated by considering the following main error sources.
A1.3 Error budget analysis for depths
Measurement The nadir-beam bottom detection range resolution of the multibeam system has a maximum limit of 0.1 m (Reson 2002). However, multibeam systems are particularly susceptible to errors in the far range (outer beams), and detection is estimated at ± 0.3 m plus 0.5 % of the depth. Errors also include the detection of the sea floor due to local variations of depth within the beam footprint, especially in the outer beams, and a varying density of the bottom material. This may be significant if a relatively low frequency transducer is used on soft marine muds in shallow water.
Transducer draft The transducer depth may be accurate to ± 0.1 m. However, the draft of the vessel due to the variability in vessel loading, e.g. fuel and fresh water storage, was not determined. It is estimated that this introduced a water depth independent error of up to ± 0.2 m. Dynamic draft errors, e.g. vessel squat, may also be significant.
Sound velocity The sound velocity profiles measured by the conductivity-temperature-depth sensor (CTD) probe did not reach full survey depths in waters exceeding 400 m. An inaccurate sound path from the transducer to the bottom and back will affect not only the observed depth of water, but also the apparent position of the observed sounding. This error is presumed to exceed 0.5% of the water depth beyond the direct CTD measurements. In order to minimise this error, ARGO and GDEM data may be used to supplement the CTD data.
Heave This error is directly dependent on the sea state and the sensitivity of the motion sensor and installation parameters. The MRU installation did not account for the offset distance between MRU, the centre of gravity, and the MBES transducer mount. The software was able to perform lever arm calculations and heave compensation during post-processing, and the vertical error is assumed to be significant only in heavy seas.
Tide/water level Uncertainties due to tides may be significant, especially where predicted tides some distance from the survey area are used. Perhaps ± 0.3 m for uncertainty in tidal datum need to be considered.
From the listing above, it is estimated that the measured depths in 20 m have an accuracy of ± 1.5 m. However, the complete bathymetric model, or digital terrain model (DTM), is based on some form of interpolation between the sampled depths from several survey lines. Consequently, the total uncertainty associated with a bathymetric model will include uncertainties due to horizontal positioning, and uncertainties introduced by the interpolation process, and will therefore be larger than the depth sounding uncertainty.
A1.4 Multibeam echosounder data density
The density of data used to construct a bathymetric grid is an important factor in its resolution – the denser the data, the higher the resolution that can be achieved. Sounding density is critical in terms of seabed feature detection and delineation. The two main factors that control the potential bathymetric target resolution capability of a multibeam echosounder are the distance between individual soundings (both in the cross-track and along-track dimensions), and the footprint size. The footprint is the area on the bottom covered by the sound pulse. Footprint size is a function of range, beam angle, and receiver and transmitter

26 – Majuro: High-Resolution Bathymetry EU EDF- SOPAC Reducing Vulnerability of Pacific ACP States
EU-SOPAC Project Report 117 – Krüger and Kumar 2008
beam widths. A high sounding density and small footprint will result in higher resolution data. Conversely, the target detection capability is going to decay as a result of a growing projected beam footprint and decreasing data density.
The along-track spacing is controlled by the ping rate, which in turn is limited by the two-way travel time from the source to the furthermost point imaged. The maximum across-track spacing depends again primarily on the range, but also on the equiangular beam spacing. The size of the beams received by the MBES system is between one and one and a half degrees. This means that a system mounted on a ship will have a larger projected footprint as the water depth increases. The footprint will also be larger at the outer beams than at the centre of the swath, as the range and incident angles increase with distance from the nadir beam. It is possible to have local variations of depth within the beam footprint, causing vertical error and affecting amplitude detection.
The table below shows a summary of the projected beam footprint size under varying water depths for the two MBES systems currently in use by SOPAC. It should be noted that the higher-frequency system (SeaBat 8101) is not appropriate for applications in waters deeper than 200 m. Due to the constant beam width; the sounded area varies according to the depth and slope, which results in a variable data density in the survey area.
Table A1.3. Projected Footprint Size under Varying Water Depths
Water depth
SeaBat 8160 (deep water) 50 kHz, 126 beams at 1.2
SeaBat 8101 (shallow water) 240 kHz, 101 beams at 1.5
(m) Inner footprint, nadir (m)
Outer footprint (m)
Inner footprint, nadir (m)
Outer footprint (m)
20 0.4 5.8 0.5 3.5
50 1.0 14.4 1.3 17.6
100 2.1 28.8 2.6 35.3
200 4.2 57.6 5.2 70.6
500 10.5 143.9 N/A N/A
1000 20.9 287.9 N/A N/A
1500 31.4 431.8 N/A N/A
Table A1.2 assumes a horizontal seabed, and shows the variation in across-track footprint size with water depth and beam angle. The sounding density and swath width will also vary when surveying steep slopes, or highly incised margins, as the footprint size varies strongly with topography. Therefore, deeper sections have larger projected footprints and fewer data point. This has the effect that a bathymetric feature whose lateral dimensions are less than the beam footprint size will not be resolved.
It should also be noted that the along-track resolution usually exceeds the across-track resolution due to ping rates, especially in deep water. Since ping rates are limited by the two-way travel time, rates for water depths of 20 m and 1500 m are 12.9 and 0.2 pings per second, respectively. Using maximum ping rates, or when surveying in deep water, the same area may be measured with the outer beams for several pings, which may give inconsistent sounding data due to the poor repeatability on uneven seabed.
In order to take into account depth-dependent point density, it is generally accepted to grid bathymetric data at a resolution that is of the order of the average beam footprint size, typically 10% of the water depth.

Majuro: High-Resolution Bathymetry EU EDF- SOPAC Reducing Vulnerability of Pacific ACP States – 27
EU-SOPAC Project Report 117 – Krüger and Kumar 2008
A1.5 Multibeam echosounder backscatter
The MBES records echo strength data (reflected energy) that can be presented as seabed backscatter maps, similar to sidescan sonar. The final sidescan sonar mosaic, or backscatter image, shows information on the composition of the seafloor. The backscatter intensity is largely a function of the properties of the superficial seafloor material, particularly the physical shape of individual components, and the angle of incidence of the sonar beam as it encounters a reflective surface. For example, soft marine muds absorb part of the sound energy, thereby muting the reflected signal, whereas a strong echo may indicate a rock outcrop or coral reef.
The effectiveness of this system can be gauged primarily by the following variables: range, detectability, resolution and plotting accuracy. Range is a fundamental property and is governed by the water depth in the survey area, as the system is ship mounted. The range will affect the other variables; with an increase in range generally degrading the other three.
Resolution, both vertical and horizontal, is affected by most of the factors mentioned. Resolution is directly affected by the data density, and has been discussed in detail above. In favourable weather conditions and a water depth of 20 m, the backscatter data can often show objects that might ideally be measured to the nearest metre horizontally. Ship-mounted sidescan sonar systems are generally not suitable to measure height of a detected object. Under poor sea conditions and a water depth of 100 m however, the data may fail to show a one-metre diameter pipeline on the seafloor, more so if ship track is perpendicular to the pipe rather than parallel. Similarly, resolution between adjacent objects would be less accurate still.
It has been shown that the detectability is determined by a number of factors, none of which are very easy to quantify. In practical terms detectability is determined by the shape, attitude, size and hardness of the target, its range, the vessel’s speed, the complexity and reflection strength (i.e. backscatter) of the surrounding seabed and the water depth. Water depth, together with the prevailing weather, largely determines the amount of interference from sea and vessel noise. In some circumstances transient factors, such as the presence of fish shoals can further reduce detectability.
Plotting accuracy is also problematic, and the limitations that apply are the same as those mentioned under horizontal and bathymetric positioning above.
Sonar images (backscatter) are typically resolved with a pixel size of 5% of the water depth.
28 – Majuro: High-Resolution Bathymetry EU EDF- SOPAC Reducing Vulnerability of Pacific ACP States
EU-SOPAC Project Report 117 – Krüger and Kumar 2008
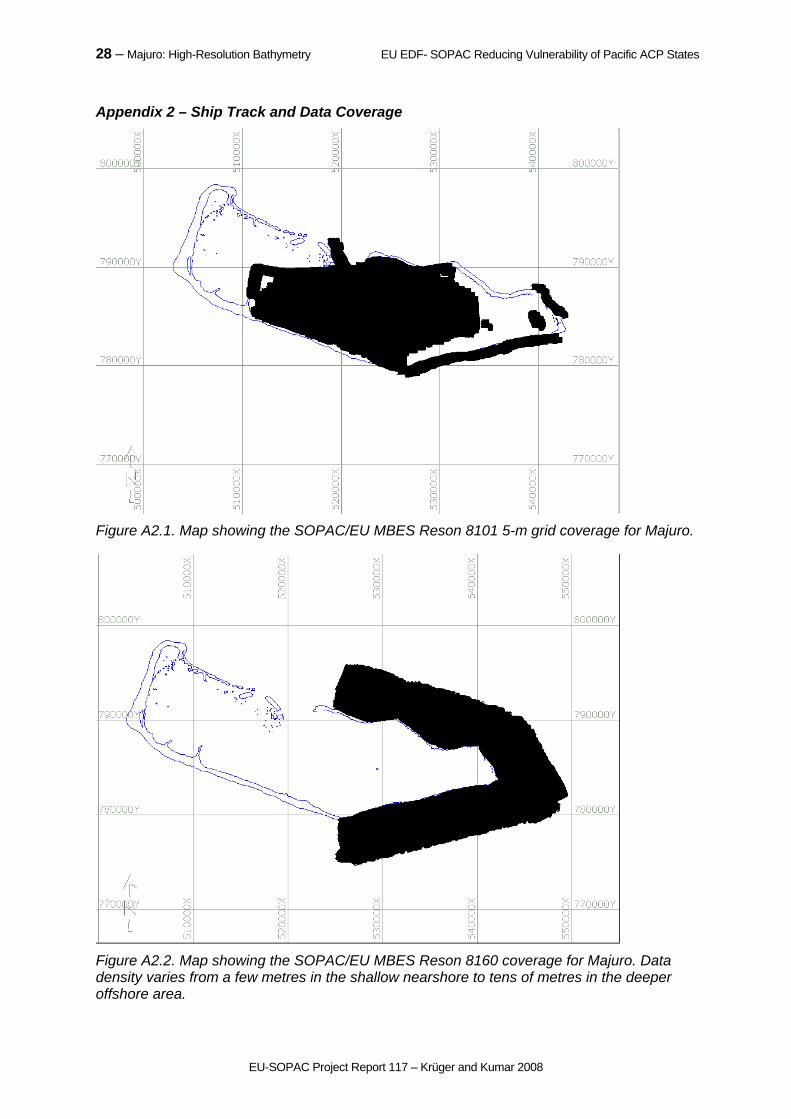
Appendix 2 – Ship Track and Data Coverage
Figure A2.1. Map showing the SOPAC/EU MBES Reson 8101 5-m grid coverage for Majuro.
Figure A2.2. Map showing the SOPAC/EU MBES Reson 8160 coverage for Majuro. Data density varies from a few metres in the shallow nearshore to tens of metres in the deeper offshore area.

Majuro: High-Resolution Bathymetry EU EDF- SOPAC Reducing Vulnerability of Pacific ACP States – 29
EU-SOPAC Project Report 117 – Krüger and Kumar 2008
Figure A2.3. Map showing the SOPAC/EU 1995 MBES Reson 8101 coverage for Majuro.

30 – Majuro: High-Resolution Bathymetry EU EDF- SOPAC Reducing Vulnerability of Pacific ACP States
EU-SOPAC Project Report 117 – Krüger and Kumar 2008
Appendix 3 – CTD Profiles

Majuro: High-Resolution Bathymetry EU EDF- SOPAC Reducing Vulnerability of Pacific ACP States – 31
EU-SOPAC Project Report 117 – Krüger and Kumar 2008
32 – Majuro: High-Resolution Bathymetry EU EDF- SOPAC Reducing Vulnerability of Pacific ACP States
EU-SOPAC Project Report 117 – Krüger and Kumar 2008
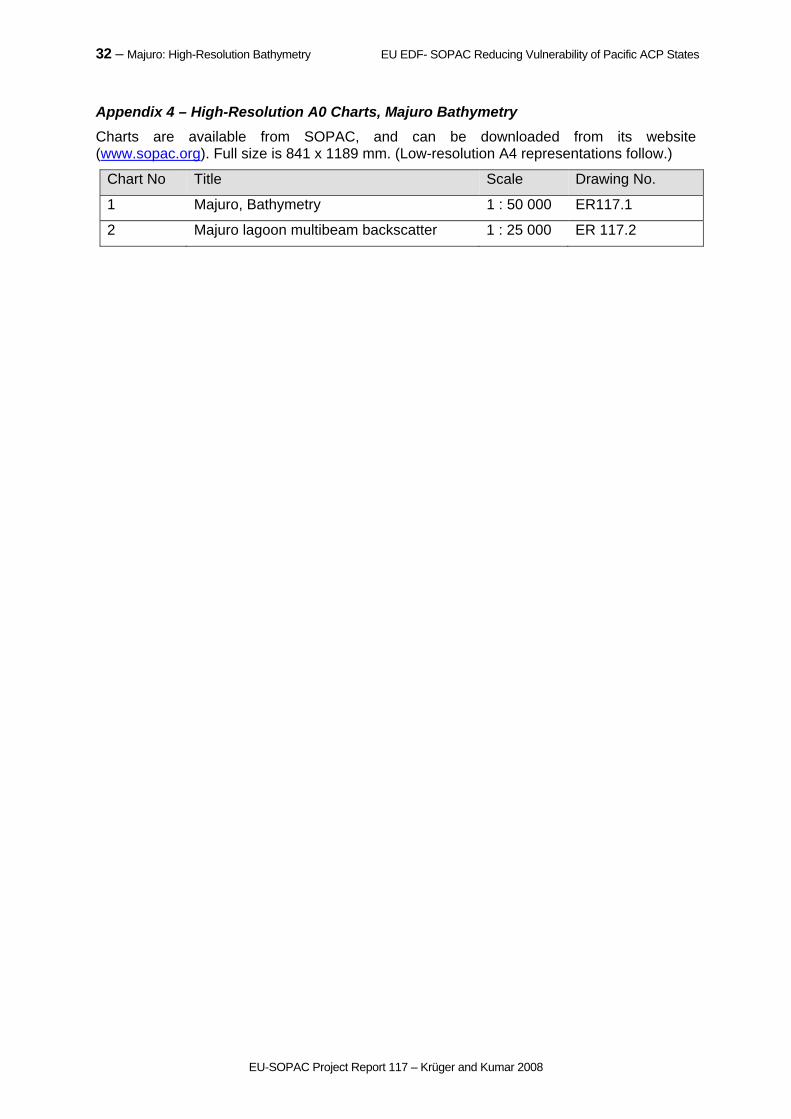
Appendix 4 – High-Resolution A0 Charts, Majuro Bathymetry
Charts are available from SOPAC, and can be downloaded from its website (www.sopac.org). Full size is 841 x 1189 mm. (Low-resolution A4 representations follow.)
Chart No Title Scale Drawing No.
1 Majuro, Bathymetry 1 : 50 000 ER117.1
2 Majuro lagoon multibeam backscatter 1 : 25 000 ER 117.2
Majuro: High-Resolution Bathymetry EU EDF- SOPAC Reducing Vulnerability of Pacific ACP States – 33
EU-SOPAC Project Report 117 – Krüger and Kumar 2008
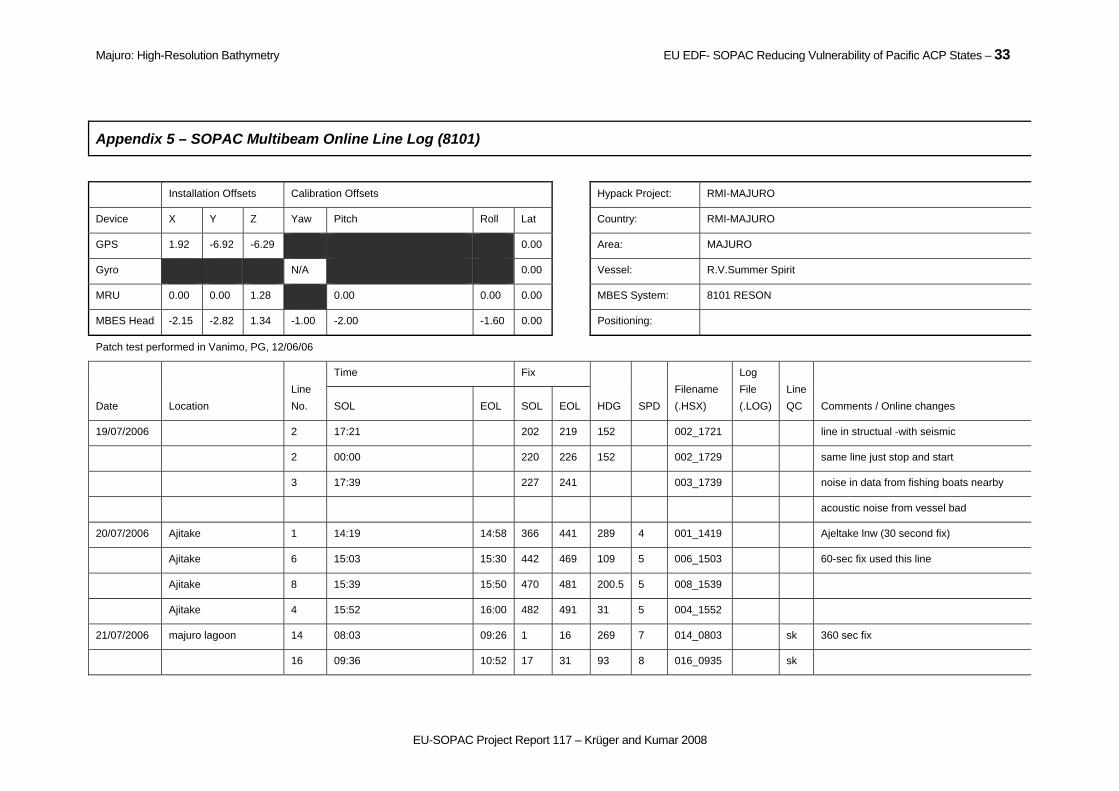
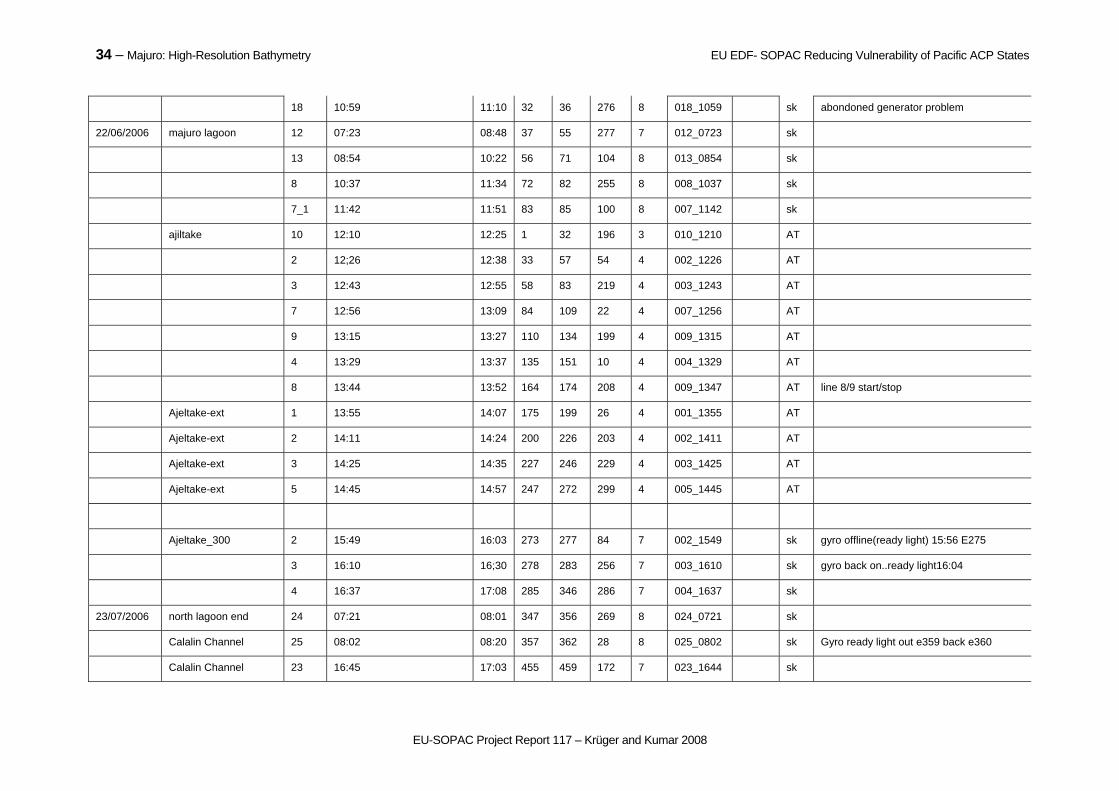
Appendix 5 – SOPAC Multibeam Online Line Log (8101)
Installation Offsets Calibration Offsets Hypack Project: RMI-MAJURO
Device X Y Z Yaw Pitch Roll Lat Country: RMI-MAJURO
GPS 1.92 -6.92 -6.29 0.00 Area: MAJURO
Gyro N/A 0.00 Vessel: R.V.Summer Spirit
MRU 0.00 0.00 1.28 0.00 0.00 0.00 MBES System: 8101 RESON
MBES Head -2.15 -2.82 1.34 -1.00 -2.00 -1.60 0.00 Positioning:
Patch test performed in Vanimo, PG, 12/06/06
Date Location
Line
No.
Time Fix
HDG SPD
Filename
(.HSX)
Log
File
(.LOG)
Line
QC Comments / Online changes SOL EOL SOL EOL
19/07/2006 2 17:21 202 219 152 002_1721 line in structual -with seismic
2 00:00 220 226 152 002_1729 same line just stop and start
3 17:39 227 241 003_1739 noise in data from fishing boats nearby
acoustic noise from vessel bad
20/07/2006 Ajitake 1 14:19 14:58 366 441 289 4 001_1419 Ajeltake lnw (30 second fix)
Ajitake 6 15:03 15:30 442 469 109 5 006_1503 60-sec fix used this line
Ajitake 8 15:39 15:50 470 481 200.5 5 008_1539
Ajitake 4 15:52 16:00 482 491 31 5 004_1552
21/07/2006 majuro lagoon 14 08:03 09:26 1 16 269 7 014_0803 sk 360 sec fix
16 09:36 10:52 17 31 93 8 016_0935 sk
34 – Majuro: High-Resolution Bathymetry EU EDF- SOPAC Reducing Vulnerability of Pacific ACP States
EU-SOPAC Project Report 117 – Krüger and Kumar 2008
18 10:59 11:10 32 36 276 8 018_1059 sk abondoned generator problem
22/06/2006 majuro lagoon 12 07:23 08:48 37 55 277 7 012_0723 sk
13 08:54 10:22 56 71 104 8 013_0854 sk
8 10:37 11:34 72 82 255 8 008_1037 sk
7_1 11:42 11:51 83 85 100 8 007_1142 sk
ajiltake 10 12:10 12:25 1 32 196 3 010_1210 AT
2 12;26 12:38 33 57 54 4 002_1226 AT
3 12:43 12:55 58 83 219 4 003_1243 AT
7 12:56 13:09 84 109 22 4 007_1256 AT
9 13:15 13:27 110 134 199 4 009_1315 AT
4 13:29 13:37 135 151 10 4 004_1329 AT
8 13:44 13:52 164 174 208 4 009_1347 AT line 8/9 start/stop
Ajeltake-ext 1 13:55 14:07 175 199 26 4 001_1355 AT
Ajeltake-ext 2 14:11 14:24 200 226 203 4 002_1411 AT
Ajeltake-ext 3 14:25 14:35 227 246 229 4 003_1425 AT
Ajeltake-ext 5 14:45 14:57 247 272 299 4 005_1445 AT
Ajeltake_300 2 15:49 16:03 273 277 84 7 002_1549 sk gyro offline(ready light) 15:56 E275
3 16:10 16;30 278 283 256 7 003_1610 sk gyro back on..ready light16:04
4 16:37 17:08 285 346 286 7 004_1637 sk
23/07/2006 north lagoon end 24 07:21 08:01 347 356 269 8 024_0721 sk
Calalin Channel 25 08:02 08:20 357 362 28 8 025_0802 sk Gyro ready light out e359 back e360
Calalin Channel 23 16:45 17:03 455 459 172 7 023_1644 sk

Majuro: High-Resolution Bathymetry EU EDF- SOPAC Reducing Vulnerability of Pacific ACP States – 35
EU-SOPAC Project Report 117 – Krüger and Kumar 2008
lagoon 23 17:04 17:53 468 471 80 7 023_1704 sk
24/07/2006 lagoon 22 06:43 07:21 472 481 273 8 022_0643 sk
offshore-southside 12 12:30 13:34 535 555 75 7.9 012_1229 line file offshore-east
13 14:49 15:07 566 572 320 5 013_1449 top infill window in data
Running 8101 inside lagoon
8101 25_1 17:27 18:09 591 600 89 8 25_1.raw central-300 lnw
25/06/2006 lagoon 16 06:59 08:35 601 622 266.6 8.1 016_0659 sk Central.lnw
lagoon 17 08:38 10:12 623 643 90 8 017_0838 sk
lagoon 18 10:18 11:45 644 663 276 8 018_1018 sk
19 11:48 13:12 664 682 91 8 019_1148
area2 1 13:37 14:09 683 748 265 4 001_1337 sk sesimic as well
area2 4 14:20 14:25 750 761 358 4 004_1420 sk sesimic as well
area2 2 14:34 14:39 762 773 355 4 002_1434 sk sesimic as well
area2 3 14:49 774 777 13 4 003_1449 sk problem with seismic e777
lagoon 26 15:15 15:41 778 784 274 8 026_1515 sk
27 15:43 16:10 785 792 86 8 027_1543 sk
28 16:12 16:38 793 799 274 8 028_1612 sk
29 16:40 17:05 800 806 90 8 029_1640 sk
seismic line 3 17:28 17:35 807 823 348 3 003_1728 sk rerun seismic line 3
26/07/2006 lagoon 14 06:57 08:28 824 843 274 8 014_0657 sk
15 08:29 10:03 844 864 52 8 015_0829 sk e857 gps spike

36 – Majuro: High-Resolution Bathymetry EU EDF- SOPAC Reducing Vulnerability of Pacific ACP States
EU-SOPAC Project Report 117 – Krüger and Kumar 2008
20 10:10 11:13 865 878 270 8 020_1010 sk program crash end line restart
20 11:24 11:50 879 886 270 8 020_1124 sk
around entrance ch 28_1 11:52 12:45 887 899 var var 28_1 sk
27 12:51 13:28 900 908 var var 027_1250
26 13:30 14:02 909 916 86.7 7 026_1330
25_1 14:07 14:39 917 924 268 7.4 25_1A
24 14:42 15:16 925 932 84 7 024_1442
23 15:19 15:58 933 942 270 7 023_1519
22 16:03 16:48 943 953 90 7 022_1603
21 17:01 17:43 954 963 90 7.9 021_1701
27/07/2006 southern endof lagoon 11 06:57 08:32 964 984 279 8 011_0657 sk central-300 lnw
central-300 lnw 32 08:41 09:57 985 1001 94 8 032_0841 sk central-300 lnw
central-300 lnw 33 10:05 11:17 1002 1017 280 8 033_1005 sk central-300 lnw
central-300 lnw 7 11:21 12:21 1018 1032 109 8 007_1121 central-300 lnw
central-300 lnw 6 12:37 13:18 1033 1042 270 7.5 006_1237 central-300 lnw
central-300 lnw 5 13:24 13:52 1045 1050 90 8 005_1324
central-300 lnw 39 14:08 14:24 1051 1056 misc 039_1408 line start opp Peace Park
central-300 lnw 38 14:32 14:39 1057 1059 105 8 038_1432
central-300 lnw 37 14:41 14:48 1060 1062 275 8 037_1441
central-300 lnw 34 14:51 14:58 1063 1065 98.5 8.1 034_14:51
central-300 lnw 36 15:00 15:09 1066 1068 270 7.5 036_1500
central-300 lnw 1 15:11 15:19 1069 1071 90 8.1 001_1511
central-300 lnw 21 15:50 16:38 1072 1083 270 7.7 021_1550
Majuro: High-Resolution Bathymetry EU EDF- SOPAC Reducing Vulnerability of Pacific ACP States – 37
EU-SOPAC Project Report 117 – Krüger and Kumar 2008
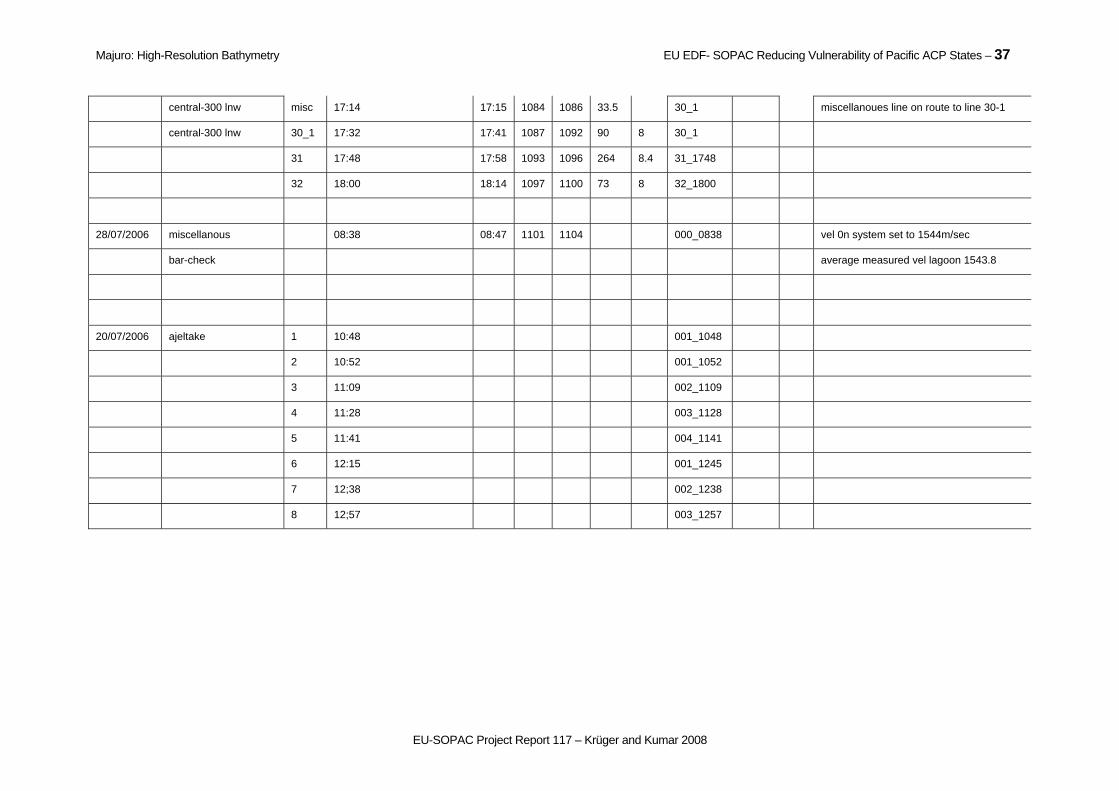
central-300 lnw misc 17:14 17:15 1084 1086 33.5 30_1 miscellanoues line on route to line 30-1
central-300 lnw 30_1 17:32 17:41 1087 1092 90 8 30_1
31 17:48 17:58 1093 1096 264 8.4 31_1748
32 18:00 18:14 1097 1100 73 8 32_1800
28/07/2006 miscellanous 08:38 08:47 1101 1104 000_0838 vel 0n system set to 1544m/sec
bar-check average measured vel lagoon 1543.8
20/07/2006 ajeltake 1 10:48 001_1048
2 10:52 001_1052
3 11:09 002_1109
4 11:28 003_1128
5 11:41 004_1141
6 12:15 001_1245
7 12;38 002_1238
8 12;57 003_1257

38 – Majuro: High-Resolution Bathymetry EU EDF- SOPAC Reducing Vulnerability of Pacific ACP States
EU-SOPAC Project Report 117 – Krüger and Kumar 2008
SOPAC MULTIBEAM ONLINE LINE LOG (8160)
Installation Offsets Calibration Offsets Hypack Project:
Device X Y Z Yaw Pitch Roll Lat. Country: RMI
GPS 1.92 -6.92 -6.29 0.40 Area: Majuro
Gyro N/A 0.00 Vessel: Summer Spirit
MRU 0.00 0.00 1.28 0.00 0.00 0.00 MBES System: 8160
MBES Head 0.86 -3.96 1.52 0.00 -1.00 -1.30 0.00 Positioning: Stand Alone GPS
Patch test performed in Suva on 25/04/2006
Date Location Line No.
Time Fix
HDG SPD Filename (.HSX)
Line QC Comments / Online changes SOL EOL SOL EOL
23/07/2006offshore north end 2 08:57 10:00 363 377 103 8 002_0857 Line file offhore-east
3 10:11 10:34 378 383 138 7.7 003_1011 noisy data -appears turbulence at the corner
4 10:40 10:44 384 386 386 004_1039 gyro -ready light out abort..
4 11:04 12:26 387 405 266 6.8 004_1104 restart although gyro light out on @ 11:28:56
5 12:56 14:27 406 425 70 7 005_1256 sk
7 14:28 15:02 426 434 44 7 007_1427 sk

Majuro: High-Resolution Bathymetry EU EDF- SOPAC Reducing Vulnerability of Pacific ACP States – 39
EU-SOPAC Project Report 117 – Krüger and Kumar 2008
1 15:14 16:20 435 453 267 7 001_1514 sk
24/07/2006 offshore 2 08:18 08:25 482 485 116 7 002_0818 sk engine problem 08:25
2 08:35 10:05 486 505 105 5 002_0835 sk E489 gps spike
8 10:07 10:48 506 515 172 7 008_1007 sk
6 10:50 12:17 516 536 217 7 006_1050 sk
11 13:48 13:58 556 559 255 7.4 011_1347 window -infill line 11
10 14:19 14:35 560 565 327 8 010_1419 sk
9 15:13 16:19 573 590 262 7 009_1513 sk