republic of kenya - preventionweb.net...republic of kenya ministry of environment and mineral...
TRANSCRIPT

REPUBLIC OF KENYA
MINISTRY OF ENVIRONMENT AND MINERAL RESOURCES
SEPTEMBER 2012
MASTER PLAN FOR THE CONSERVATION AND SUSTAINABLE MANAGEMENT OF WATER
CATCHMENT AREAS IN KENYA


MASTER PLAN FOR THE CONSERVATION AND SUSTAINABLE MANAGEMENT OF WATER
CATCHMENT AREAS IN KENYA
SEPTEMBER 2012
REPUBLIC OF KENYA
MINISTRY OF ENVIRONMENT AND MINERAL RESOURCES
Funding for this publication was provided by Danida through the Natural Resources Management Programme (NRMP)

This publication may be produced in whole or in part and in any form for educational or non-profit purposes without special permission from the copyright holder, provided acknowledgement of the source is made. The Ministry of Environment and Mineral Resources (MEMR) would appreciate receiving a copy of any publication that uses this report as a source.
No use of this publication may be made for resale or for any other commercial purpose whatsoever without prior permission in writing of the Ministry.
This is a Government of Kenya Publication.For bibliographic and reference purposes this publication should be referred to as:“MEMR (2012). Masterplan for the Conservation and Sustainable Management of Water Catchment Areas in Kenya”Ministry of Environment and Mineral ResourcesP.O. Box 30126-00100, Nairobi, Kenya.
To obtain copies of this publication, please contact:
The Permanent SecretaryMinistry of Environment and Mineral ResourcesP.O. Box 30126-00100 NairobiTel +254202730808/9Fax +254202734722Email: [email protected]: www.environment.go.ke
This report was prepared using funds provided by the Government of Kenya and DANIDA through the Natural Resources Management Programme (NRMP)
The views expressed in this publication are not necessarily those of the agencies cooperating in this project. The designation employed and the presentations do not imply the expression of any opinion whatsoever on the part of MEMR or cooperating agencies. Mention of a commercial company or product in this report does not imply endorsement by MEMR.
The use of information from this publication for publicity or advertising is not permitted. Trademark names and symbols are used in an editorial fashion with no intention of infringement on trademark or copyright laws.
We regret any errors or omissions that may have been unwittingly made.
ISBN: 978-9966-21-326-6
Copyright ©2012, Ministry of Environment and Mineral Resources, Kenya.

iiiMaster Plan for Water Catchment Areas
List of Figures .............................................................................................................................................................. iv
List of Tables ............................................................................................................................................................... vi
List of Plates ............................................................................................................................................................... vii
Abbreviations and Acronyms..................................................................................................................................viii
Foreword ......................................................................................................................................................................xi
Acknowledgements ...................................................................................................................................................xii
Glossary......................................................................................................................................................................xiii
Executive Summary ................................................................................................................................................xviii
1.0 Chapter One: Introduction ..............................................................................................................................1
2.0 Chapter Two: Environmental Status, Land Use and Biodiversity ...............................................................7
2.1 Introduction ......................................................................................................................................................... 8
2.2 Water Catchment Areas in Kenya ................................................................................................................... 9
2.3 Physiography, Hydrology and Climate .........................................................................................................10
2.4 Population and Livelihoods ............................................................................................................................12
2.5 Ecosystems and Biodiversity Status .............................................................................................................22
2.6 Status of Water Catchments and Sub-Catchments ..................................................................................33
2.7 Environmental Status of Transboundary Water Catchments .................................................................57
2.8 Water Catchment Conservation and Climate Change .............................................................................58
2.9 Summary .............................................................................................................................................................59
3.0 Chapter Three: Governance Framework for Water Catchment Areas ...................................................61
3.1 Introduction .......................................................................................................................................................62
3.2 International and Regional Frameworks for Governing Catchment Areas .........................................62
3.3 The Imperatives of The Constitution of Kenya 2010 ................................................................................63
3.4 Legal and Policy Frameworks for the Conservation of Water Catchment Areas ...............................65
3.5 Institutional Arrangements ............................................................................................................................73
3.6 Challenges with Current Governance Arrangements ...............................................................................75
4.0 Chapter Four: Conservation and Sustainable Management of Water Catchment Areas ....................77
4.1 Problems Identified ..........................................................................................................................................78
4.2 Proposed Interventions ...................................................................................................................................79
4.3 Resource Mobilisation .....................................................................................................................................84
4.4 Monitoring and Evaluation Framework .......................................................................................................86
4.5 Communication and Public Participation ...................................................................................................87
4.6 Organisation Structure for the Restoration ................................................................................................87
4.7 Intervention Measures for Transboundary Water Catchments .............................................................87
4.8 Cost Benefit Analysis of the Restoration Programme ..............................................................................90
TABLE OF CONTENTS

iv Master Plan for Water Catchment Areas
References ..................................................................................................................................................................91
Appendices ...............................................................................................................................................................101
Appendix 1. Gazetted Members of the TaskForce ...................................................................................................101
Appendix 2. Terms of Reference Of Taskforce..........................................................................................................104
Appendix 3. Population by County, Gender and Youth (2009) ............................................................................104
Appendix 4. Location and Status of the Main Water Catchment and Sub-Catchment Areas ......................107
Appendix 5. Key Tree Species for the Main Water Catchment and Sub-Catchment Areas ...........................112
Appendix 6. Extent of Degradation of Water Catchments In Kenya ...................................................................118
Appendix 7. Policies, Legal Instruments and Institutions Applicable to Governance of Water Catchment Areas .........................................................................................................................124
Appendix 8. Resource Distribution by Medium Term Expenditure Framework ...............................................126
Appendix 9. Resource Distribution to Sectors and Agency ..................................................................................128
Appendix 10. Resource Distribution to Output by Lead Agency ...........................................................................130
Appendix 11. Logical Framework: 2011-2030 ............................................................................................................133
Appendix 12. Activity Budget Logframe ......................................................................................................................142

vMaster Plan for Water Catchment Areas
Figure 1.1 Methodological approach for producing the Master Plan ................................................................. 4
Figure 2.2.1 The main water catchment areas of Kenya ......................................................................................... 10
Figure 2.3.1 Stream flow measurements in middle Athi April –June 1980 ......................................................... 11
Figure 2.3.2 Rainfall distribution in Kenya ..................................................................................................................12
Figure 2.4.1 Population distribution in Kenya ............................................................................................................13
Figure 2.4.2 Trend of Kenya’s population growth (1950-2050) and the shrinking land resource base ....... 13
Figure 2.5.1.1 Land cover distribution in Kenya ...........................................................................................................23
Figure 2.5.5.1 Gazetted dryland hilltop forests .............................................................................................................27
Figure 2.6.1.1 Changes in land cover types in Marsabit sub-catchment (1986-2009) .......................................36
Figure 2.6.1.2 Changes in land cover types in Marsabit sub-catchment -1986-2009 ......................................... 37
Figure 2.6.2.1 Reducing base flows for Wanjohi sub-catchment (station 2GB04) (1974-2002) ....................... 37
Figure 2.6.2.2 The position of 2GB04 in Wanjohi sub-catchment (near Rironi) .................................................. 37
Figure 2.6.2.3 Changes in land cover types in Shamata-Wanjohi sub-catchment (1973-2009).......................38
Figure 2.6.2.4 Changes in land cover types in Wanjohi sub-catchment (1973-2009) .........................................39
Figure 2.6.3.1 Changes in land cover types in Tinderet sub-catchment (1986-2009) ........................................40
Figure 2.6.3.2 Changes in land cover types in Tinderet sub-catchment (1986-2009) ........................................40
Figure 2.6.3.3 Decadal flow duration curves for river Nyando compared for 60s to 90s ................................... 41
Figure 2.6.4.1 Changes in land cover types in Kinale sub-catchment (1986-2009) ............................................ 41
Figure 2.6.4.2 Changes in land cover types in Kinale sub-catchment (1986-2009) ............................................42
Figure 2.6.4.3 Trends in base flow (80% probability of exceedance) of Ndarugu River .....................................42
Figure 2.6.5.1 Changes detected in land cover types in western slopes of Cherangany (1973-2009) ............43
Figure 2.6.5.2 Changes in land cover types in Cherangany (1973-2009) ...............................................................44
Figure 2.6.5.3 Trendline for base flow for Wuoroya catchment (station 1EG03) (1974-2000) .........................45
Figure 2.6.5.4 Trendline for flood flow for Wuoroya catchment (Station 1EG03) (1974-2000) .......................45
Figure 2.6.5.5 Position of 1EG03 in Wuoroya sub-catchment in Butere and Siaya counties .............................45
Figure 2.6.6.1 Changes in land use in Njoro sub-catchment (1973-2009) .............................................................46
Figure 2.6.6.2 Changes in land cover types in Njoro sub-catchment (1973-2009) .............................................. 47
Figure 2.6.6.3 A decadal trend of vegetation health and density in East Mau ...................................................... 47
Figure 2.6.6.4 Trendline of low flows in Njoro River (Station 2FC05) (1943-1998) ............................................. 47
Figure 2.6.7.1 Changes in land cover in Mt. Kenya North catchment area (1976-2009) ....................................48
Figure 2.6.7.2 Changes in land cover in Mt. Kenya North catchment area (1976-2009) ....................................49
Figure 2.6.7.3 A decreasing base flow for Likii sub-catchment (1968-2006)........................................................50
Figure 2.6.7.4 Position of stream flow determination (5BE21) in Likii sub-catchment ......................................50
Figure 2.6.8.1 Changes in land use in Mt. Kenya South catchment area (1976-2009) ........................................ 51
Figure 2.6.8.2 Changes in land cover in Mt. Kenya South catchment area (1976-2009) .................................... 51
Figure 2.6.8.3 The position of 4DA01 in Thiba sub-catchment (near Koroma) ...................................................52
LIST OF FIGURES

vi Master Plan for Water Catchment Areas
Figure 2.6.8.4 Flow trend line for Thiba River (station 4DA01) (1950-1996) ........................................................52
Figure 2.6.9.1 Changes in land cover types in Taita sub-catchment (1975-2009) ...............................................53
Figure 2.6.9.2 Changes in land cover types in Taita sub-catchment (1975-2009) ...............................................54
Figure 2.6.10.1 Change detection in land cover types in Mt. Kulal (1986-2009) ....................................................54
Figure 2.6.10.2 Changes in vegetation in Mt. Kulal (1986-2009) ...............................................................................55
Figure 2.7.1 Some transboundary water catchments shared by Kenya and Tanzania ..................................... 57
Figure 2.8.1 Temperature trends for Mombasa (1960-2005) ................................................................................58
Figure 2.8.1.1 Rainfall trend in Lamu and Garissa over the period 1959-2007 .....................................................59
Figure 4.3 Position of Kenya’s water towers traversing counties .......................................................................88
LIST OF TABLES
Table 2.1.1 Changes in areas of forest types in Kenya (1990-2010) .....................................................................8
Table 2.4.1 Kenya’s population in 2009 and the projected population in 2030 ..............................................14
Table 2.4.2.1 Divisions of Mui basin for coal exploration .........................................................................................16
Table 2.4.3.1 Wildlife population for selected animals (2006-2010) .....................................................................17
Table 2.5.1.1 Percentage extent of the different land cover types of Kenya ....................................................... 24
Table 2.5.3.1 Globally threatened species in Kenya compared to selected high-biodiversity
African countries ...................................................................................................................................... 25
Table 2.5.5.1 Dryland catchments ................................................................................................................................. 28
Table 2.6.1 Vegetation cover changes and hydrological flows of selected catchments ............................... 33
Table 4.3.1 Total 2011/12 Budgetary Allocations .................................................................................................. 85
Table 4.6.3.1 Extent of selected water catchments ................................................................................................... 89
viiMaster Plan for Water Catchment Areas
LIST OF PLATES
Plate 2.1.1 Exposure of rivers due to land use changes ..........................................................................................9
Plate 2.2.1 Endau Hills and Mathews Ranges are water catchment areas in the drylands ...........................10
Plate 2.4.1.1 Congestion in towns poses a threat to waste management ............................................................14
Plate 2.4.2.1 High dependence on wood fuel ..............................................................................................................16
Plate 2.4.3.1 Kenya’s arid lands are richly endowed with wildlife ..........................................................................17
Plate 2.4.4.1 Inappropriate agricultural practices threaten the ecosystem and human health .....................18
Plate 2.4.5.1 Nomadic pastoralism characterised by large herds of livestock .....................................................19
Plate 2.4.7.1 Youth and women involved in cleaning river Nairobi and tending trees in nurseries ...............21
Plate 2.5.2.1.1 Pure stands of bamboo in the Aberdares and Mau Forests ............................................................ 24
Plate 2.5.2.1.2 A well conserved moist montane forest and similar forest ravaged by fire ................................ 25
Plate 2.5.5.1 Dry and very dry ecosystems of northern Kenya .............................................................................. 27
Plate 2.5.5.2 Honey is a major source of livelihood from natural resources in arid land forests ................... 29
Plate 2.5.7.1 The Napuyapuyi Swamp which forms the upper catchments of the Mara River...................... 30
Plate 2.5.7.2 Fish farming is done in wetlands and this may compromise the quality of water .....................31
Plate 2.5.8.1 Invasive species (P. senegalense, S. Molesta and E. crassipes) in L. Ol Bolossat and L. Naivasha .......................................................................................................................................... 33
Plate 2.6.1.1 Changes in the levels of the water in Lake Paradise, Marsabit Forest Reserve .......................... 35
Plate 2.6.1.2 Marsabit Town and water scarcity ........................................................................................................ 35
Plate 2.6.8.1 Farming in the steep hills of Murang’a ................................................................................................ 52
Plate 2.6.11.1 Shella Dunes catchment .......................................................................................................................... 56
Plate 4.2.11 Renewable wind energy on Ngong Hills .............................................................................................. 83

viii Master Plan for Water Catchment Areas
Sterling Pound
above sea level
Access and Benefit Sharing
Arid and Semi-Arid Lands
Catchment Area Advisory Committees
Coast Development Authority
Community Development Fund
Carbon Development Mechanism
Community Forests Associations
Constitution of Kenya 2010
Catchment Management Strategy
Conference of Parties
Civil Society Organisations
Deutscher Akademischer Austausch Dienst
District Environment Committees
Deoxyribonucleic Acid
Department of Resource Survey and Remote Sensing
East
East African Community
Elder of the Burning Spear
Economic Social Council
Environment Management Association
Environment Management Committees
Environmental Management and Coordination Act
Ewaso Ng’iro North Development Authority
Ewaso Ng’iro South Development Authority
El Niño/La Niña-Southern Oscillation,
Economic Recovery Strategy for Wealth and Employment Creation
ABBREVIATIONS AND ACRONYMS
European Union
Forest Carbon Partnership Facility
flow duration curves
Geographic Information System
Government of Kenya
Hectares
Human Immunodeficiency Virus/Acquired Immune Deficiency Syndrome
World Agroforestry Centre
Interim Coordinating Secretariat – Mau Forest Complex
income generating activities
Intergovernmental Panel on Climate Change
Inter-Tropical Convergence Zone
Integrated Water Resource Management
Joint Transboundary Management Plan
Kenya Agricultural Research Institute
Kenya Forestry Research Institute
Kenya Economic and Household Survey
Kenya Generating Company
Kenya Private Sector Association
Kenyan Shillings
Kenya Forest Service
Kazi Kwa Vijana
Kilometres
Kenya Metrological Department
Kerio Valley Development Authority
Kenya Wildlife Service
Lake Basin Development Authority
Lake Victoria Environment Management Programme
metres
monitoring and evaluation
£
a.s.l.
ABS
ASAL
CAAC
CDA
CDF
CDM
CFA
CK2010
CMS
COP
CSOs
DAAD
DEC
DNA
DRSRS
E
EAC
EBS
ECOSOC
EMA
EMC
EMCA
ENNDA
ENSDA
ENSO
ERSWEC
EU
FCPF
FDC
GIS
GoK
Ha
HIV/AIDS
ICRAF
ICS
IGA
IPCC
ITCZ
IWRM
JTMP
KARI
KEFRI
KEHS
KenGen
KEPSA
Kes.
KFS
KKV
km
KMD
KVDA
KWS
LBDA
LVEMP
m
M&E

ixMaster Plan for Water Catchment Areas
Millennium Development Goals
Ministry of Environment and Mineral Resources
Mt. Elgon Regional Ecosystem Conservation Programme
Ministry of Agriculture
Mountain
Medium Term Expenditure Framework
Mid-Term Plan
North
National Agriculture and Livestock Extension Programme
National Climate Change Response Strategy
National Environment Action Plan
National Environment Management Authority
Nongovernmental Organisation
National Museum of Kenya
Natural Resources
Natural Resource Use Association
National Water Catchment Conservation Programme
National Water Catchment Management Programme
non-wood forest products
Plantation Establishment and Livelihood Improvement Scheme
Payment of Environmental Services
Polluter Pays Principle
Poverty Reduction Strategy Paper
Polyvinyl Chloride (Plastic)
Regional Development Authorities
Reducing Emission from Deforestation and Forest Degradation
Readiness Preparation Proposal
South
Sub-Catchment Management Plan
Sustainable Land Management
State of Environment
sea surface temperatures
Tana and Athi Rivers Development Authority
United Nations Environment Programme
United Nation Educational Scientific and Cultural Organisation
United Nations Framework Convention on Climate Change
United States Dollars
Vision 2030
West
Water Allocation Plans
Water Catchment Areas
WRUA Development Cycle
Water Resource Management Authority
Water Resource User Associations
Water Service Trust Fund
Water Towers Trust Fund
ABBREVIATIONS AND ACRONYMS
MDG
MEMR
MERECP
MoA
Mt.
MTEF
MTP
N
NALEP
NCCRS
NEAP
NEMA
NGO
NMK
NR
NRUA
NWCCP
NWCMP
NWFP
PELIS
PES
PPP
PRSP
PVC
RDAs
REDD
R-PP
S
SCMP
SLM
SoE
SST
TARDA
UNEP
UNESCO
UNFCCC
USD
V2030
W
WAP
WCA
WDC
WRMA
WRUA’s
WTSF
WTTF

x Master Plan for Water Catchment Areas

xiMaster Plan for Water Catchment Areas
According to international standards, Kenya is categorised as a ‘water scarce’ country. The
country currently has available 400m3 per capita per annum of renewable freshwater resources in comparison to the 1,000m3 per capita per annum recommended by the United Nations.
Water scarcity challenges facing our country have worsened in recent decades. While the country had 647m3of renewable freshwater resources per capita per annum in 1992, these water resources have declined by more than 200 m3 per capita per annum since that time.
The situation can be attributed to a range of human and environmental causal factors. At independence, many dams and water-pans were dug to supply water for farming, domestic and industrial use. Over time, these have become degraded, silted and even inhabited. Rapid population growth has exerted immense pressure on the quality and quantity of water and other vital natural resources. The State of the Coast Report for Kenya, published by the National Environment Management Authority in 2009, indicated that climate variability and uncertainty has been the chief contributor to the degradation of water catchments, heavy siltation of dams and pans, and deterioration of water quality. Climate change is also contributing to the negative impacts on the country’s water resources and presents serious implications for food and energy security and resource user conflicts.
It is necessary to acknowledge the severe degradation of water catchment areas that has affected Kenya’s five water towers over the last twenty years. The
FOREWORD
Aberdare Ranges, Cherangany Hills, Mau Forest Complex, and Mounts Elgon and Kenya have become so severely impacted by human and environmental processes that even the existence of the rivers that drain the water towers is now threatened.
Our country realises that our economy, society and environment are founded on services provided by ecosystems. Water, biodiversity, quality soils, and air are fundamental to economic productivity and social wellbeing and must be protected to provide every Kenyan’s constitutional right to a clean and healthy environment and if Kenya is to become a middle-income country by 2030 as set out in the country’s development blueprint Vision 2030.
The Ministry of Environment and Mineral Resources is proud to launch this Master Plan for improved conservation and sustainable management of water resources in Kenya. I believe the conservation, restoration and management of water catchment areas will be greatly supported by the recommendations presented herein for the benefit of ecosystems and urban and rural livelihoods country-wide.
Hon. Amb. Chirau Ali Mwakwere, EGH, FCILT, MP Minister for Environment and Mineral Resource

xii Master Plan for Water Catchment Areas
Tremendous individual and institutional efforts went into the research, fieldwork, analysis and
writing of this Master Plan for the Conservation and Sustainable Management of Water Catchment Areas in Kenya.
I would like to acknowledge the vision and leadership provided by the Late Hon. John N. Michuki, EGH, MP, Minister for Environment and Mineral Resources. He emphasized the articulation of a spectrum of challenges and possible solutions while at the same time broadening the scope in which water catchment areas was defined. This enabled broader investigation of diverse drivers of degradation of water catchment areas and inclusion of otherwise less considered ecosystems such as dried up lagas, sand dunes and mountain ranges in the drier parts of the country which rarely appear in many other national documents.
The Ministry collaborated with many stakeholders from the academia, research institutions, civil society groups, and many other stakeholders to put together the report. It is through the valuable support and information provided by all stakeholders that the report was finalized. We wish to acknowledge the contributions of all.
ACKNOWLEDGEMENTS
The Taskforce established by the Ministry collated and synthesized the rich information into a document that can now guide practical and transformative actions for the sustainable management of complex ecosystems. Their efforts and commitment is highly appreciated.
The production of the Master Plan benefited from the financial support of the Government of Denmark through the Natural Resources Management Programme. The African Adaptation Programme funded by the Government of Japan through the United Nations Development Programme also supported aspects of the report. We are grateful to all.
Finally, our appreciation goes to all the people of Kenya whose right to a clean and healthy environment will be secured through fulfillment of their responsibilities to manage our natural environment.
Ali D. Mohamed, CBSPermanent Secretary,Ministry of Environment and Mineral Resources
Ali D M h d CB

xiiiMaster Plan for Water Catchment Areas
Obtaining, possessing and using genetic resources conserved, whether derived products and, where applicable, intangible components, for purposes of research, bio-prospecting, conservation, industrial application or commercial use
All farming activities including cultivation, agroforestry, beekeeping, livestock management and aquaculture
Any exotic non-indigenous life forms originating from outside a given ecological location, accidentally or deliberately introduced to the location by human activity or by natural means
Sharing of benefits that accrue from the utilisation of genetic resources
The variability among living organisms from all sources including, terrestrial ecosystems, aquatic ecosystems and the ecological complexes of which they are part; this includes diversity within species, among species and of ecosystems
Include genetic resources organisms or parts thereof, populations, or any other biotic component or ecosystems with actual or potential use or value for humanity
Biosphere reserves are areas of terrestrial and coastal ecosystems promoting solutions to reconcile the conservation of biodiversity with its sustainable use
1. The catching or collecting of water, especially rainfall2. A reservoir or other basin for catching water3. The water thus caught
1. The intake area of an aquifer and all areas that contribute surface water to the intake area
2. The areas tributary to a lake, stream, sewer, or drain3. A reservoir or basin developed for flood control or water management for
livestock and/or wildlife
A programme of measures that have been developed for the purposes of conserving and or improving the conditions of the catchment
A document that has been prepared for the purpose of directing the management of the water resources within the catchment area
Access
Agriculture
Alien species
Benefit sharing
Biological diversity
Biological resources
Biosphere Reserve
Catchment
Catchment area
Catchment Management Plan
Catchment Management Strategy
GLOSSARY

xiv Master Plan for Water Catchment Areas
Climate Change
Climate Change Vulnerability
Conservation
Drainage basin
Ecosystem
Endangered species
Environment
Environmental resources
Gene bank
Intra-county
Invasive plant
Joint Transboundary Management Plan
Land tenure
Directional change in climatic variables over a long-term period
The degree to which a system is susceptible to, or unable to cope with the adverse effects of climate change, including climate variability and extremes. Vulnerability is a function of the character, magnitude, and rate of climate variation to which a system is exposed, its sensitivity, and its adaptive capacity (IPCC, 2001)
The care and management of a resource so that the resource maintains its ability to fulfil its functions and provide goods and services for present and future generations
An area in which surface runoff collects and from which it is carried by a drainage system, as a river and its tributaries. Also known as catchment area, drainage area, feeding ground, gathering ground, hydrographic basin (McGraw-Hill, 2002)
A biological environment consisting of all the organisms living in a particular area, as well as all the nonliving, physical components of the environment with which the organisms interact, such as air, soil, water, and sunlight
Any species which is in danger of extinction throughout all or a significant portion of its range due to man-made or natural changes in the environment or as may be declared by the relevant national or international authority
Includes the physical factors of the surroundings of human beings including land, water, atmosphere, climate, sound, odour, taste, the biological factors of animals and plants and the social factor of aesthetics and includes both the natural and the built environment
Includes the resources of the air, land, flora, fauna and water together with their aesthetic qualities
A genetic sequence database, an annotated collection of all publicly available DNA sequences
Within county
A plant that moves in and takes over an Ecosystem to the detriment of other species; often the result of environmental manipulation
A document that guides and controls the management of transboundary resources within an agreed framework and binds entries to work together
The relationship, whether legally or customarily defined, among people, as individuals or groups, with respect to land, its management and administration

xvMaster Plan for Water Catchment Areas
Livestock
Management Plan
Migratory species
Mitigation
Natural resources
Natural water body
Payment for Ecosystem Services
Protected area
REDD+
Resource quality
Restoration
River
Riverbank
Includes cattle, horses, donkeys, mules, pigs, sheep, goats, camels and all other domesticated animals
A document that guides and controls the management of protected area resources, the uses of the area and the development of facilities needed to support that management and use
Species that move from one place to another in search of food or breeding habitats or other phenomenon on a regular basis
Measures taken to avert effects of an undesirable phenomenon
Include resources of the land, air, water, animals and plants including their aesthetic qualities
Any river, stream, spring, lake, swamp, pond or other water source flowing in a natural watercourse
The practice of offering incentives to farmers or landowners or protected area managers in exchange for managing their land or resources to provide some sort of ecological service
A clearly defined geographical space, recognised, dedicated and managed, through legal or other effective means, to achieve the long-term conservation of nature with associated ecosystem services and cultural values
Reducing emissions from deforestation and forest degradation; includes the role of conservation, sustainable management of forests and enhancement of forest carbon stocks in developing countries
In relation to a water resource, means the quality of all the aspects of a water resource including the:a. character and condition of the in-stream and riparian habitat;b. characteristics, condition and distribution of the aquatic biota;c. physical, chemical and biological characteristics of the water;d. quantity, pattern, timing, water level and assurance of in-stream flow;e. water quality stipulated for the reserves
Regeneration or putting back a wetland, riverbank or lake shore or sea shore to the state it was in or near to what it was before it was modified
Includes a permanent and seasonal river
The rising ground from the highest normal water mark, bordering or adjacent to a river in the form of rock, mud, gravel or sand and in cases of flood plains include the point where the water surface touches the land, that land not being the bed of the river

xvi Master Plan for Water Catchment Areas
Sensitivity Atlas
Sustainable Land Management
Sustainable use
Threatened species
Transboundary Biosphere Reserve
Transboundary Natural Resources Management
Trans-county
Water
Water catchment
Watershed
Watershed basin
A set of Geographic Information System (GIS) based products, providing contingency planners and emergency responders with accurate and relevant information for preparedness and response to an occurrence
Managing land without damaging ecological processes or reducing biological diversity
Present use of the environment or natural resources which does not compromise the ability to use the same by future generations or degrade the carrying capacity of supporting ecosystems
Any species of plant or animal that is likely to become an endangered species within the foreseeable future throughout or in a significant portion of its range or as may be declared by the relevant national authority
Areas set aside for the conservation of organisms, ecosystems, and genetic resources that cross national borders
Any process of cooperation across national borders that facilitates or improves the management of natural resources, to the benefit of all parties in the area concerned (Griffin et al. 1999)
Across more than one county
Includes drinking water, river, stream watercourse, reservoir, well, dam, canal, channel, lake, swamp, open drain or underground water
Also referred to as Drainage Basin or Water Basin
1. An area that, because of topographic slope, contributes water to a specified surface water drainage system, such as a stream or river. An area confined by topographic divides that drains a given stream or river
2. (Catchment): The natural or disturbed unit of land on which all of the water that falls (or emanates from springs or melts from snowpacks), collects by gravity, and fails to evaporate, runs off via a common outlet
3. All lands enclosed by a continuous hydrologic drainage divide and lying upslope from a specified point on a stream; a region or area bounded peripherally by a water parting and draining ultimately to a particular watercourse or body of water
4. A ridge of relatively high land dividing two areas that are drained by different river systems
The area draining into a river, reservoir, or other body of water

xviiMaster Plan for Water Catchment Areas
Wetland
Wetland products
Areas permanently or seasonally flooded by water where plants and animals have become adapted; including swamps, areas of marsh, peat land, mountain bogs, bank of rivers, vegetation, areas of impeded drainage or brackish, salt or alkaline; including areas of marine water the depth of which at low tide does not exceed 6 metres. It also incorporates riparian and coastal zones adjacent to the wetlands
Includes fish, fibre, fruit, papyrus, grass, soil, stone, gravel, sand and such other things as the Minister may, by statutory instrument, declare to be wetland produce

xviii Master Plan for Water Catchment Areas
Natural resources derived from the environment drive Kenya’s economic growth and
development, indeed sustaining the livelihoods of the Kenyan people. Over the years, the Kenyan population has increased rapidly thereby surpassing the natural capital (land and water resources), a situation that calls for the sustainable management of natural resources including water catchment areas. This is particularly important for a country, whose extensive areas (approximately 80% of the land mass) are categorised as drylands – essentially fragile ecosystems – where any form of degradation can be disastrous. In the past, this has been evident from the massive livestock and human losses associated with extreme climatic events (intense and frequent droughts and floods) experienced between 2008 and 2011.
With this in mind, the Master Plan for the Restoration, Conservation and Sustainable Management of Water Catchment Areas in Kenya has been developed for all water catchment areas in Kenya, including the five water towers, the sub-catchments, local catchments and those that have ceased to function as water catchments due to degradation. The Plan describes the rationale and justification as well as the goal, objectives, strategies and actions that will facilitate the realization of restoration, conservation and sustainable management of water catchment areas. This Plan will be implemented over a 19-year period from 2011 to 2030 in line with the Kenya Vision 2030 and the Constitution of Kenya, 2010. It takes into consideration the variability and diversity of the country, the devolved governance system according to the Constitution of Kenya 2010, and global conservation paradigms including the management of transboundary water catchments. In addition, it advocates for the adherence to key environmental management principles including Payment for Ecosystems Services and the polluter pays principles.
EXECUTIVE SUMMARY
The Master Plan envisions a Kenya with well managed water catchment areas; its goal is to assure the conservation and sustainable management of water catchment areas. The Plan provides a detailed review of existing legislation, policies and other relevant documents relating to the management of water catchment areas, and identifies gaps and conflicts in the existing legislation and policies as well as weaknesses in the institutional framework. The environmental status, biodiversity and land use of the water catchment areas are described and remedial actions identified.
The Terms of Reference of the Taskforce, published in the Gazette Notice No. 7730 of 02 July 2010, guided the preparation of this Master Plan. The Terms of Reference were to:a. prepare a work plan for the taskforce activitiesb. study existing legislation, policies and other
relevant documents relating to the management of water catchment areas and identify any gaps in the existing legislation, policies and other relevant documents
c. identify, map and document water catchment areas in the country including areas that have ceased to be catchment areas for reasons to be identified by the taskforce
d. document the environmental status of each water catchment area
e. recommend appropriate intervention measures for each water catchment area
f. prepare an action plan for the implementation of the recommendations
g. draft a Master Plan for the sustainable management of water catchment areas
h. identify potential sources of financial and human resources to facilitate the implementation of recommended interventions
i. elect its chairpersonj. identify and co-opt other members or any other
resource, provided that the co-opted members do not exceed one third of the Taskforce

xixMaster Plan for Water Catchment Areas
The Taskforce used various methods and datasets in collecting information and compiling the Master Plan, which defines intervention areas as any existing degraded environment that requires remedial action. From the analysis of the status of the waters catchments in Kenya, key outputs have been detailed in the workplan for the sustainable management of water catchment areas within the framework of the National Water Catchment Conservation Programme (NWCCP). The planning, implementation and monitoring of the activities identified in the Master Plan will involve multiple stakeholders as is required in the Constitution of Kenya 2010.
The main problems that need to be addressed in the conservation and protection of water catchment areas include:a. weak institutional linkages and synergiesb. conflicting institutional mandatesc. lack of clear funding mechanisms for water
catchment areas (WCA)d. lack of integrated WCA monitoring and evaluation
systemse. inadequate flow of information on WCAsf. low levels of awareness and capacity of
stakeholdersg. degraded WCAh. land degradation (and soil erosion) in WCAi. poor management of water resourcesj. water Insecurityk. poor waste managementl. livelihood insecuritym. overdependence on biomass energyn. limited involvement of women and youth in WCA
activities
RecommendationsBased on field observations and discussions with various stakeholders, the following intervention measures were recommended:
a. The establishment and implementation of a National Water Catchment Management Programme (NWCMP) – founded on governance
structure that incorporates all stakeholders at national, county and community-level activities – to strengthen synergistic partnerships and adoption of conservation technologies and innovations
b. The comprehensive review, harmonisation, application and enforcement of policies, legislations, regulations and standards governing WCA including those covering transboundary water catchment areas and water bodies
c. Prioritising financing of national, county and community-level WCA conservation programmes; resources need to be mobilised from internal and external sources including through Clean Development Mechanism projects, carbon credits trading, Payment for Ecosystems Services fees, and the 2% allocation from devolved funds. Such funds should be consolidated into a Trust Fund and allocated proportionately to Ministries responsible for the management of environmental and natural resources, and appropriately included in their annual and forward budgets
d. The development and application of a results-based management system founded on an integrated monitoring and evaluation system such as E-PROMIS and other simpler data-capture tools at community and project level
e. Access to timely, quality information and knowledge to support WCA conservation is necessary; a communication strategy needs to be developed and promoted
f. Enhancing the use of disseminated technologies and innovations on WCA conservation, and developing practical skills and competency-strengthening programmes for all categories of stakeholders, especially corporations and communities
g. The research and promotion of resource-use efficiency including recycling and reuse to enable conservation of water resources
h. The improvement and promotion of water storage infrastructures like dams, pans, household roof-catchments, and road runoff harvesting, in appreciation of the fact that capturing and storing rainwater is instrumental in the attainment of water security across seasons and years

xx Master Plan for Water Catchment Areas
i. The strengthening the management of urban and industrial waste and sanitation systems in WCAs, as well as the enforcement of appropriate laws governing waste management
j. The identification and promotion of alternative livelihoods through small to medium size enterprises that are necessary for sustaining ecological quality of WCAs, in order to check the overreliance on natural resources
k. Promotion of renewable energy from alternative sources such as biogas, solar, wind and energy-efficient devices in order to alleviate the destruction of water catchment areas from the rural overdependence on fuelwood
l. The active involvement of youth and women in the design, development and implementation of WCA programmes in appreciation of the high proportion of youth in Kenya’s demographic structure, and the effectiveness of women development groups in the implementation of community-based natural resources management programmes
A substantial amount of financial, technical and human resources is required for the rehabilitation, restoration and sustainable management of water catchment areas. Approximately Kes. 942 billion will be required for the National Water Catchment Conservation Programme at national, county and community level during the period 2011 to 2030. The funding will not be entirely new because during the 2011/12 financial year, the government allocation to WCAs programmes amounts to Kes. 100 billion. Additional funds will be mobilised from merging opportunities presented by climate change. For example, the Clean Development Mechanism and carbon credits trading. Schemes on Payment for Ecosystems Services present a huge potential because over 50% of her Lakes, rivers and aquifers and their associated catchments are transboundary.

1Master Plan for Water Catchment Areas
1.0 CHAPTER ONE
INTRODUCTION

2 Master Plan for Water Catchment Areas
Kenya is located between latitude 4°21’ North and 4°28’ South and between longitudes 34° and 42° East. The country covers a land area
of 569,137km2 and is almost horizontally bisected by the equator and vertically by longitude 38° East. Kenya has a diversity of landforms ranging from glaciated mountain peaks under permanent snow cover to the coastal plain. She is split by the Great Rift Valley into the eastern part – dominated by Mt. Kenya (5,200m) and the Aberdare Ranges (4,000m) – and the western part, which slopes down into Lake Victoria from the Mau Ranges and Mt. Elgon (4,300m).
Kenya, whose population currently stands at 38,610,097 according to the 2009 Kenya Population and Housing Census, has over the last four decades recorded a high population growth. The rapid population increase has exerted immense pressure on the quality and quantity of natural resources including water, a situation that has been further compounded by climate variability. Recent reports from the Ministry of Environment and Mineral Resources (MEMR) indicate that Kenya’s five water towers namely the Aberdare Ranges, Cherangany Hills, Mau Forest Complex, Mt. Elgon and Mt. Kenya have been so severely degraded that the existence of the rivers that drain them is threatened. In view of the fact that the country’s renewable freshwater resources (400m3) fall severely short of the UN recommendation of 1,000m3 per capita per annum, it is unsurprising therefore that Kenya is internationally categorised as a ‘water scarce’ country.
The conservation of pristine ecosystems is considered an important aspect of preserving nature to sustain the availability of nature-based environmental resources including biological diversity, clean air, fresh water, quality soils, and overall environmental and habitat health, which are vital for social wellbeing and economic development. Nevertheless, if not managed through efficient resource use and other environmentally sensitive mechanisms, the quest for economic development can deplete natural
resources. For this reason, arguments abound on the need to formulate conservation strategies that put a premium on the principles of environmental conservation and sustainable development, especially in protected areas. These arguments are pertinent to the simultaneous pursuit of divergent agendas – conservation vs. development – which remains a major challenge for many developing countries wherein poverty eradication is a major national priority.
According to Galvin and Haller (2008), there are three main strategies for conserving protected areas, and these depend on the decision-making framework; the populist approach adopts a bottom-up strategy where decisions on appropriate actions rest with the local community, which is also responsible for providing leadership in the implementation of conservation programmes. The second approach, which considers poverty as the root cause of environmental degradation, seeks to provide alternative livelihoods to communities that depend on the natural resource that is to be conserved. In this case, conservation efforts may well be in conflict with development aspirations, necessitating the use of exclusion mechanisms to bar communities from accessing the conserved resources.
The third approach is founded on the principles of cost-benefit analysis, and here conservation takes a business model that requires action to be taken on the basis of perceived benefits and costs. However, quantifying and attributing value to abstract benefits of conservation such as clean air is a challenge that plagues the cost-benefit method, which is also hinged on principles of rational choice. The three approaches are relevant to any conservation programme but require the articulation of the role of the private sector beyond corporate social responsibility; furthermore, the assumption that poverty is the root cause of environmental degradation is inaccurate.
In the case of Kenya and based on the work of this Taskforce, it is considered that the three
INTRODUCTION

3Master Plan for Water Catchment Areas
INTRODUCTION
conservation approaches are relevant depending on the socioeconomic and ecological circumstances. That Kenya’s dependence on natural resources is inextricably linked to her poverty eradication efforts makes cost-benefit analyses imperative if the environment is to be sustainably conserved. This is especially considering that over the last forty years, Kenya’s water catchment areas have been severely degraded (UNEP and MEMR 2009) by several drivers of degradation including rapid population growth, expansion of agricultural land, climate change, poor governance, inappropriate land-use practices and limited appreciation of the value of a clean and healthy environment in supporting quality life.
Certainly, there are significant benefits accrued from WCA, whose indigenous forests provide numerous ecosystem services such as trapping and storing rainwater, regulating river flows and preventing flooding. Other services include recharging groundwater tables, improving soil fertility, reducing soil erosion and sediment loads in river water, regulating local climate conditions, and acting as carbon reservoirs and sinks (GOK and UNEP, 2009). In addition, they serve as essential wildlife habitats, and are traditionally important to local communities for their cultural and divine significance. Indeed, approximately 2.9 million people (8% of the population) classified as forest-adjacent households by virtue of the fact that they live within a 5-kilometre radius of the forest, derive significant direct benefits from WCA.
Regardless of this, the costs and benefits of conserving WCA countrywide have not been determined, neither have the methods for undertaking conservation across the diverse ecosystems and the varied land-use practices been defined. Even so, few analyses of major WCA including the Mau Forest Complex and the Aberdare Ranges are available for reference and to guide action. The assessment of the Mau Forest Complex (GOK, 2009) and the study on the Aberdares’ system demonstrate the great economic value of WCAs. Indeed, the annual economic value of the latter’s products and services including biodiversity is Kes. 56.5 billion, and within the Complex, it is estimated that the economic gains from
tourism, hydroelectricity generation and optimal tea production could exceed Kes. 20 billion annually (GOK, 2009). In addition, indigenous closed-canopy forests play a critical role as water catchments, as they increase infiltration, prevent surface runoff and contribute to the availability of water for hydroelectricity generation (which accounts for approximately 60% of Kenya’s generated electricity) by reducing siltation of hydroelectric plants.
For this reason, the conservation and sustainable management of water catchment areas is of strategic importance to Kenya; not only does it address the need to sustain the availability of environmental goods and services such as clean water, quality soils and habitats, but also other socioeconomic development needs such as employment creation. Accordingly, the Kenya Vision 2030 – the national development strategy for Kenya – lists conservation of water catchment areas among the five priority programmes in the environment sector (GOK, 2008). Specifically, the social pillar of the Kenya Vision 2030, under which the environment sector falls, recognises the value of a cohesive society that enjoys equitable social development in a clean and secure environment. In addition, the Government has prioritised the environment sector as an important driver of socioeconomic development, and the Constitution of Kenya 2010 acknowledges that the environment is a heritage that must be conserved and managed for present and future generations. Indeed, Part 2 of Chapter 5 of the Constitution provides for the management and conservation of the environment in order to inter alia conserve biological diversity and ensure that the right of all to a clean and secure environment is upheld.
In support of these provisions, on 02 June 2010, the Hon. Minister for Environment and Mineral Resources gazetted an interdisciplinary Taskforce to develop a national Master Plan to guide the country’s water catchment conservation programmes. The need arose out of recognition that the persistent and intense cyclical droughts and floods associated with climate change were indeed a proxy indicator of the extensive environmental degradation, and the intensifying scarcity of critical environmental

4 Master Plan for Water Catchment Areas
resources as water. The development of this Master Plan is therefore in appreciation of the fact that failure to conserve and protect the water catchment areas is likely to result in massive economic losses, human suffering and disintegration of the country’s social fabric as inter-community conflicts over environmental resources intensify.
The Taskforce used various methodologies as indicated in Figure 1.1 to collect data and compile the Master Plan.The vision of this Master Plan is for a Kenya with well managed water catchment areas, and its goal is to ensure the conservation and sustainable management of water catchment areas. The Plan provides a detailed review of existing legislation, policies and other relevant documents on the management of water catchment areas, and identifies gaps and conflicts in existing legislation and policies as well as weaknesses in the institutional framework. In addition, it describes the environmental status, biodiversity and land use of water catchments areas and proposes intervention measures, which are aligned with Kenya Vision 2030 and the Constitution of Kenya 2010.
In terms of scope, the Master Plan defines intervention areas as any existing degraded environment that requires remedial action. From the analysis of the status of the waters catchments in Kenya, key outputs have been detailed in the workplan for the sustainable management of water catchment areas within the framework of the National Water Catchment Conservation Programme (NWCCP). These include:a. improved partnerships and participation of
stakeholders in the management of water catchment areas
b. strengthened capacity of communities to implement WCA programmes
c. restored and protected water catchment areasd. adoption of soil conservation and land use
management practisese. water resource conservation and management of
all WCA
f. water storage infrastructure developed and maintained in all WCA
g. policies, legislations, regulations and standards governing the management of water catchment areas harmonised and enforced
h. improved management of urban and industrial waste and sanitation
Literature review and desk study analysis
Field visits
Land cover/ land use change analysis
Hydrological environmental status
Synthesis of information and drafting of the Master Plan
Preparation/presentation of draft Master Plan
Presentation of draft of Master Plan
Production of final Master Plan based on comments
Submission of final Master Plan
Figure 1.1 Methodological approach for producing the Master Plan
INTRODUCTION

5Master Plan for Water Catchment Areas
i. pursuit of alternative livelihood options for sustainable resource use in water catchment conservation programmes
j. renewable energy technologies identified, developed and promoted
k. water catchment areas funding mechanisms streamlined and mainstreamed in budgets at all levels
l. strengthened monitoring and reporting systems for water catchment areas.
Ultimately, if Kenya is to achieve sustainable development, the conservation of the five water towers together with their sub-catchments,
INTRODUCTION
particularly those in ecologically fragile environments – specifically arid and semi-arid areas and the wetlands – is critical. This is in consideration of the significance of these remote fragile ecosystems to the livelihoods of the most vulnerable populations, whose production and consumption patterns are a major threat to such environments. Therefore, the national program proposed in this Master Plan will be established to guide outcomes that target poverty eradication, economic growth and most importantly a sustained quality environment. The planning, implementation and monitoring of the activities identified in the Master Plan will involve multiple stakeholders as is required in the Constitution of Kenya 2010.

6 Master Plan for Water Catchment Areas

7Master Plan for Water Catchment Areas
2.0 CHAPTER TWO
ENVIRONMENTAL STATUS, LAND USE AND BIODIVERSITY
8 Master Plan for Water Catchment Areas
2.1 INTRODUCTION
Natural resources derived from the environment drive Kenya’s economic growth and development, indeed sustaining the
livelihoods of the people. Water is a significant natural resource – and a key factor of production – whose availability in adequate quantities and quality has been challenged by several factors including rapid population growth. This growing human population calls for the sustainable management of water catchment areas if the demands of the current and future generations are to be met. For intervention measures to be successful, they will need to be applied to each water catchment area in its entirety i.e. including the biodiversity and land, soil, forest and water resources (Chapter 5, Constitution of Kenya 2010).
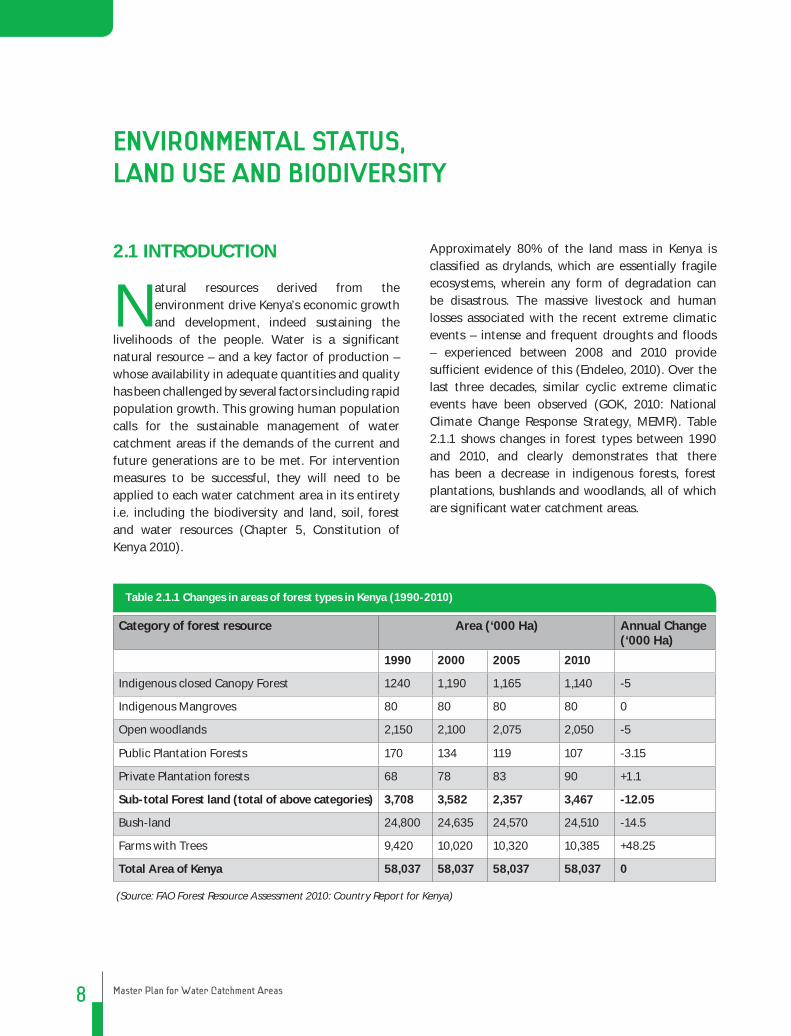
Approximately 80% of the land mass in Kenya is classified as drylands, which are essentially fragile ecosystems, wherein any form of degradation can be disastrous. The massive livestock and human losses associated with the recent extreme climatic events – intense and frequent droughts and floods – experienced between 2008 and 2010 provide sufficient evidence of this (Endeleo, 2010). Over the last three decades, similar cyclic extreme climatic events have been observed (GOK, 2010: National Climate Change Response Strategy, MEMR). Table 2.1.1 shows changes in forest types between 1990 and 2010, and clearly demonstrates that there has been a decrease in indigenous forests, forest plantations, bushlands and woodlands, all of which are significant water catchment areas.
ENVIRONMENTAL STATUS, LAND USE AND BIODIVERSITY
Category of forest resource Area (‘000 Ha) Annual Change (‘000 Ha)
1990 2000 2005 2010
Indigenous closed Canopy Forest 1240 1,190 1,165 1,140 -5
Indigenous Mangroves 80 80 80 80 0
Open woodlands 2,150 2,100 2,075 2,050 -5
Public Plantation Forests 170 134 119 107 -3.15
Private Plantation forests 68 78 83 90 +1.1
Sub-total Forest land (total of above categories) 3,708 3,582 2,357 3,467 -12.05
Bush-land 24,800 24,635 24,570 24,510 -14.5
Farms with Trees 9,420 10,020 10,320 10,385 +48.25
Total Area of Kenya 58,037 58,037 58,037 58,037 0
(Source: FAO Forest Resource Assessment 2010: Country Report for Kenya)
Table 2.1.1 Changes in areas of forest types in Kenya (1990-2010)

9Master Plan for Water Catchment Areas
Such evidence of continued land degradation calls for the conservation of not only the water towers but also other local catchment areas. The arid and semi-arid areas, which comprise the largest percentage of Kenya’s land cover, are critical for the existence of local pastoralist communities, their livestock and wild animals living nearby. Other unique areas including the Shella sand dunes, oases in arid areas and rocky outcrops are significant sources of water catchment and require special restoration and management.
In this Chapter, the environmental status of water catchment areas is assessed and described in terms of the extent of the degradation experienced and the implications with regards to remedial action. The biodiversity status of the catchment areas is discussed in relation to the current land use and economic activities, and water catchment areas that have ceased to be are identified and explanations provided. The analysis forms the basis for the intervention and restoration programme of the Master Plan on Conservation and Management of Water Catchment Areas in Kenya.
2.2 WATER CATCHMENT AREAS IN KENYA
A water catchment area refers to an extent or area of land where water from rain and melting snow or ice drains downhill into a body of water, such
as a river, lake, reservoir, estuary, wetland, sea or ocean. The water catchment area includes both the streams and rivers that convey the water and the land surfaces from which water drains into these channels, and is separated from adjacent basins by a catchment divide. The operational definition used in the Master Plan considers that the water catchment is concerned with not only the water but also the land and all the resources within the delineated area. Therefore, it considers the country’s 5 water towers, namely the Aberdares, Cherangany, Mau, and Mts. Kenya and Elgon that form water drainage areas for Athi, Ewaso Ng’iro North, Lake Victoria, Rift Valley and Tana (Figure 2.2.1).
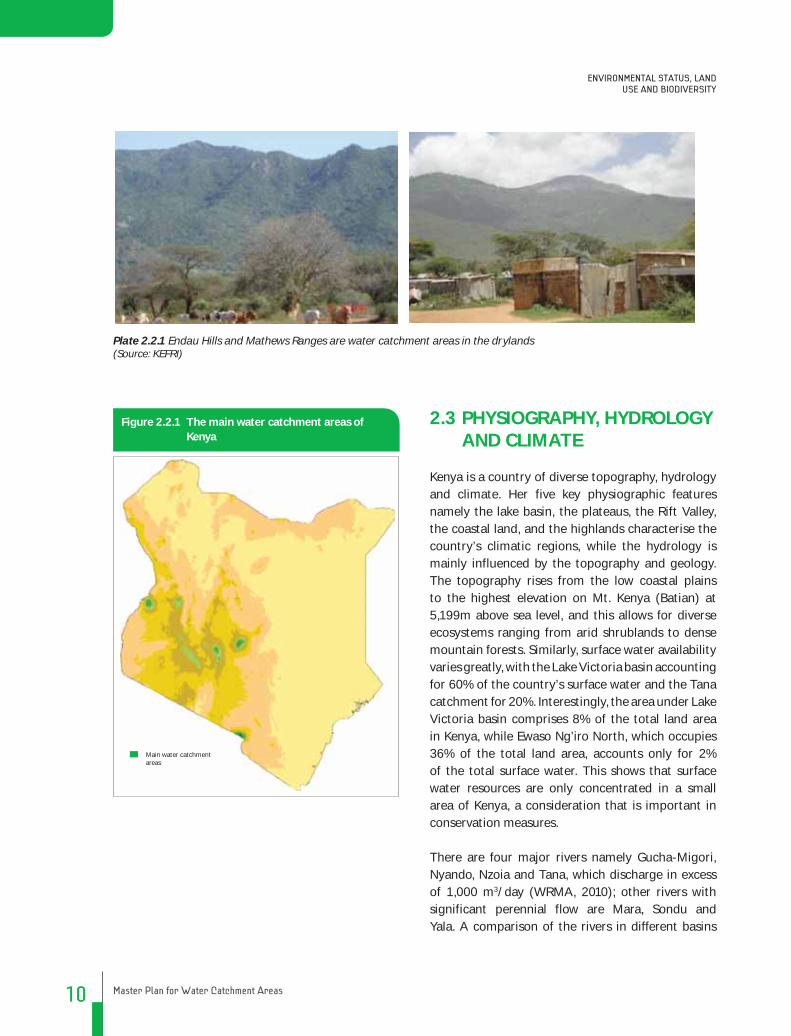
There are other smaller significant water towers and catchment areas in the country, including low mountains and hills in the drylands, which provide important sources of freshwater to the surrounding areas and are therefore vital to the pastoralist communities. These catchment areas include the hills in Machakos and Kitui, the Chyulu, Igembe, Manga, Maragoli, Ngong, Shimba and Taita Hills, and Mt. Kulal, Mt. Marsabit, Mt. Ndoto and Mt. Nyiru. Other significant catchments include the sandy reserves at the Kenyan Coast such as Shella Dunes of Lamu, and oases in the arid areas such as Loiyangalani in Marsabit. Plate 2.2.1 shows the Endau Hill in Kitui, a significant water catchment area within the drylands.
Plate 2.1.1 Exposure of rivers due to land use changes
ENVIRONMENTAL STATUS, LAND USE AND BIODIVERSITY
10 Master Plan for Water Catchment Areas
Figure 2.2.1 The main water catchment areas of Kenya
2.3 PHYSIOGRAPHY, HYDROLOGY AND CLIMATE
Kenya is a country of diverse topography, hydrology and climate. Her five key physiographic features namely the lake basin, the plateaus, the Rift Valley, the coastal land, and the highlands characterise the country’s climatic regions, while the hydrology is mainly influenced by the topography and geology. The topography rises from the low coastal plains to the highest elevation on Mt. Kenya (Batian) at 5,199m above sea level, and this allows for diverse ecosystems ranging from arid shrublands to dense mountain forests. Similarly, surface water availability varies greatly, with the Lake Victoria basin accounting for 60% of the country’s surface water and the Tana catchment for 20%. Interestingly, the area under Lake Victoria basin comprises 8% of the total land area in Kenya, while Ewaso Ng’iro North, which occupies 36% of the total land area, accounts only for 2% of the total surface water. This shows that surface water resources are only concentrated in a small area of Kenya, a consideration that is important in conservation measures.
There are four major rivers namely Gucha-Migori, Nyando, Nzoia and Tana, which discharge in excess of 1,000 m3/day (WRMA, 2010); other rivers with significant perennial flow are Mara, Sondu and Yala. A comparison of the rivers in different basins
Plate 2.2.1 Endau Hills and Mathews Ranges are water catchment areas in the drylands(Source: KEFRI)
ENVIRONMENTAL STATUS, LAND USE AND BIODIVERSITY
Main water catchment areas

11Master Plan for Water Catchment Areas
countrywide demonstrates the need for intervention upstream of the catchments in order to improve their conditions. The flow data plotted during high flows in April and June for rivers Athi (near Makueni) and Nyando (near Ahero) show that although both rivers are unregulated, the variability in Nyando is not as large as Athi’s. The latter is very unsteady, with flow ranging from 74 to 277m3/s within a 6-day period compared to an increase of 10m3/s in Nyando over a period of 7 days (Figure 2.3.1). The two catchments compare well in terms of landforms, a dendritic drainage pattern, population density and economic activities but differ in land use, land cover and geology: the Nyando basin is dominated by volcanic hills and ranges with deep soils while the Athi basin is largely granitic metamorphic rock. The variability in flows could illustrate flow conditions in arid and moist climates.
Kenya’s climatic regions are classified according to altitude above sea level: the coastal belt is generally hot and humid, and altitudes of 1,500m a.s.l. have moderate temperatures with maxima of 25°C and minima of 15°C, while at altitudes above 2,500m, frosts are common during the dry season with maxima of about 21°C or less. Areas on the windward side of water bodies generally receive higher rainfall and have more luxuriant vegetation compared to those on the leeward side.
Among the elements of climate, rainfall has the highest temporal (time) and spatial (space) variability. Indeed, the mean annual rainfall varies from as low as 200mm in the marginal areas of northern Kenya to as high as 2,000mm in the high potential areas. The 600mm isohyets form the boundary between semi-arid and humid climates while the 300mm isohyets delineate the arid from the semi-arid zones. Marginal areas are characterised by high rainfall intensities with the associated effects of water and wind erosion mainly due to the exposed top soils. This kind of variability, and the marginal to sub-marginal nature of rainfall distribution, is a serious drawback for the agricultural sector, which is the mainstay of the Kenyan economy.
Kenya’s rainfall depicts very strong seasonality in harmony with the latitudinal migration of the Inter-Tropical Convergence Zone (ITCZ). There are bimodal and tri-modal rainfall distributions, with rainfall peaks generally occurring in April/May (long rains) and October/November (short rains) for bimodal rainfall regimes, and in July/August (mostly in western Kenya) for tri-modal rainfall regimes. In most areas, the long rains account for over 50% of the annual totals but in the southeastern lowlands of Kenya, the short rains are more significant and more stable.
Figure 2.3.1 Stream flow measurements in middle Athi April –June 1980
(Source: WRMA)
ENVIRONMENTAL STATUS, LAND USE AND BIODIVERSITY

12 Master Plan for Water Catchment Areas
The northward and southward relative movement of the sun controls Kenya’s climate as in the whole of the Eastern Africa region. The areas of maximum heating and therefore lowest pressures occur when the sun is approximately overhead, a phenomenon known as the equatorial heat trough or the ITCZ. The movement of this trough follows the movement of the sun but with a lag of 3 to 6 weeks behind the sun’s time of greatest elevation. The fact that the sun is approximately overhead in March and again in September explains the bimodal rainfall pattern experienced in the region. The ITCZ is expected to be effective soon after the maximum intensity of rainfall, i.e. in April/May and October/November, when the synoptic pressure systems of the subtropical latitudes of the Sahara, Arabia, South Africa and Atlantic Ocean are intensive and there is a general transport of air masses towards the low-pressure zones of the equatorial regions. This results in well organised south easterlies and north easterlies meeting in a zone of convergence resulting in rainfall.
Figure 2.3.2 Rainfall distribution in Kenya
The large area of low pressure over Arabia and India has such great control that the southeast trade winds re-curve across the equator into a southwest monsoon over the Indian Ocean and the coast of East Africa and Somalia. Throughout the year, a trough of low pressure extends over Uganda and Lake Victoria so that there is always a tendency of afternoon convergence making the areas near the lake wet virtually throughout the year.
2.4 POPULATION AND LIVELIHOODS
Population, land use and livelihoods in Kenya are intricately linked, seeing as the Kenyan population is heavily dependent on land as a principal source of livelihood. Therefore, as the population continues to increase so does the pressure on land resources. According to the 2009 Kenya Population and Housing Census, there were 38,610,097 people in the country
ENVIRONMENTAL STATUS, LAND USE AND BIODIVERSITY

13Master Plan for Water Catchment Areas
in 2009 aggregated into 8,767,954 households (2009 Kenya Population and Housing Census, GOK 2010). Figure 2.4.1 shows the population distribution and areas in Kenya with high population density, which as a result, are susceptible to degradation.
At the current growth rate of 3.0% (GOK, 2011: Economic Survey 2011, Kenya National Bureau of Statistics, 2011), the country is expected to increase to about 60 million people by the year 2030. Figure 2.4.2 illustrates how this increasing population will continue to present a big challenge to the realization of sustainable development.
The population structure in Kenya indicates that the country has a large proportion of young people, specifically 11,145,872 people between the age bracket of 15 to 29 years and 10,632,571 children between the age of 0 and 14 years (GOK, 2011: Economic Survey 2011, Kenya National Bureau of Statistics, 2011). As these children and youth grow, they will require gainful employment but with the current unemployment rate, very few employment opportunities exist. As a consequence, these will need to seek employment in the informal sector, whose main activities tend to rely heavily on natural resources such as forestry for carpentry, beekeeping and fishing, thereby increasing pressure on the country’s natural resources.
Figure 2.4.2 Trend of Kenya’s population growth (1950-2050) and the shrinking land resource base
Figure 2.4.1 Population distribution in Kenya
2.4.1 Urbanisation and Settlement TrendsMore than 75% of the population is concentrated in the high potential areas comprising only 20% of the land surface (Jaetzold and Schmidt, 1983), and these tend to be forest areas and sources of Kenya’s major river basins. As the population
ENVIRONMENTAL STATUS, LAND USE AND BIODIVERSITY
(Source: Kenya: Atlas of Our Changing Environment)

14 Master Plan for Water Catchment Areas
increases, so will the demand for land, resulting in further encroachment of forests and pressure on natural resources as people increasingly settle in water catchment areas. In turn, this will result in loss of wetlands, increased demand for pasture, clearing of vegetation, decrease in agricultural productivity due to change of land use, and an increase in water abstraction rates.
In most ASAL, settlement patterns are characterised by nomadic pastoralism, and the location of
administrative headquarters and famine relief centres, which guarantee socioeconomic security. In the River Tana and Athi basins, settlement along the river is common among farming and pastoralist communities due to the availability of water, a practice that is a major source of conflict as it enhances the degradation of already fragile ecosystems. Ever since the energy sector was liberalised, people have purchased land in areas with high potential for geothermal well fields, in anticipation of investment in this type of energy.
Age-group 2,009 (Census) 2030 (Projections)
Table 2.4.1 Kenya’s population in 2009 and the projected population in 2030
0-4
5-9
10-14
15-19
20-24
25-29
30-34
35-39
40-44
45-49
50-54
55-59
60-64
65-69
70-74
75-79
80+
NS
TOTAL
3,000,439
2,832,669
2,565,313
2,123,653
1,754,105
1,529,116
1,257,035
1,004,361
743,594
635,276
478,346
359,466
295,197
183,151
160,301
99,833
159,125
1,810
19,192,458
2,938,867
2,765,047
2,469,542
2,045,890
2,020,998
1,672,110
1,262,471
1,004,271
732,575
637,469
477,860
352,487
298,581
207,612
179,000
118,675
224,576
1,761
19,417,639
5,597,716
5,597,716
5,034,855
4,169,543
3,775,103
3,201,226
2,519,506
2,008,632
1,476,169
1,272,745
956,206
711,953
593,778
390,763
339,301
218,508
383,701
3,571
38,610,097
4,800,702
4,532,270
4,104,501
3,397,845
2,806,568
2,446,586
2,011,256
1,606,978
1,189,750
1,016,442
765,354
575,146
472,315
293,042
256,482
159,733
254,600
2,896
30,692,464
4,702,187
4,424,075
3,951,267
3,273,424
3,233,597
2,675,376
2,019,954
1,606,834
1,172,120
1,019,950
764,576
563,979
477,730
332,179
286,400
189,880
359,322
2,818
31,055,667
9,502,890
8,956,346
8,055,768
6,671,269
6,040,165
5,121,962
4,031,210
3,213,811
2,361,870
2,036,392
1,529,930
1,139,125
950,045
625,221
542,882
349,613
613,922
5,714
61,748,131
Male Female Total Male Female Total
(Source: GOK statistical abstracts 2010)
ENVIRONMENTAL STATUS, LAND USE AND BIODIVERSITY

15Master Plan for Water Catchment Areas
Thanks to rural-urban migration, engendered by population movements in search of employment opportunities, Kenya’s urban population is growing at a high rate. Currently, 32% of the population lives in urban areas (GOK, 2009: Kenya Population and Housing Census), resulting in an increase in the degradation of some areas as the demand for basic facilities such as housing, water and waste disposal increases. Only 41% of urban households have access to flush toilets leaving a large proportion of urban dwellers to utilise other methods of waste disposal. Many low-income urban residents live in poorly planned informal settlements, characterised by substandard housing, poor sanitation and a lack of other basic social infrastructure that have a high potential of affecting water availability and quality as illustrated in Plate 2.4.1.1.
To cater for the growing urban populations, the number of urban areas is also increasing rapidly – currently there are 277 urban areas in the country, with a population of 2,000 people and above (2009 Kenya Population and Housing Census). Certainly, this means that settlement areas and social amenities will need to increase commensurately as people move into forested areas and convert land currently used for agriculture as has been the case in the Karura and Ngong Forests, Kiambu and its environs, and Kitengela and Athi River. The two forests were excised, and the coffee farms in Kiambu and livestock pastures in Kitengela and Athi River converted to accommodate the growing urban population.
Plate 2.4.1.1 Congestion in towns poses a threat to waste management(Source: DRSRS)
2.4.2 Energy and LivelihoodsIn comparison with other sources of energy including hydro-, geothermal, wind and solar power, it has been established that biomass (fuelwood) is the most relied upon, with 67% of Kenya’s population using firewood and another 17% charcoal for cooking (GOK, 2011: Economic Survey 2011, Kenya National Bureau of Statistics). The dependency on fuelwood as a source of energy is a major threat to forests particularly in the rural areas where 86% of the population use firewood and another 10% use charcoal for cooking. Nearly three out of four households (74.3%) use kerosene for lighting, 19% use electricity and 3.7% use firewood. If alternative sources of energy are not identified to meet the needs of a growing population, then this high usage of wood fuel poses a great threat to water catchment areas.
According to the Ministry of Energy (2010), Kenya is well endowed with a great geothermal resource potential, in excess of MW 7,000, that is capable of meeting all of Kenya’s electricity needs over the next twenty years. Most of the prospects are within the Rift Valley – in Suswa, Longonot, Olkaria, Eburru, Menengai, Lake Bogoria, Lake Baringo, Korosi and Paka volcanic fields. Given its resource potential and in anticipation of future investment in this source of energy, people have purchased land in areas with high potential for geothermal well fields.
Kenya’s potential source of wind power is quite substantial especially around the lakes including
ENVIRONMENTAL STATUS, LAND USE AND BIODIVERSITY

16 Master Plan for Water Catchment Areas
the Kano Plains and Marsabit, which has been identified as a potential site for installation of a wind powered electricity generation plant. Solar energy has for a long time been used for drying animal skins and clothes, preserving meat, drying crops and evaporating seawater to extract salt. It is utilised at various levels including household level where it is used for lighting, cooking and water heaters, and at community level, where it is used for vaccine refrigeration, rural electrification, and water pumping and purification.
Coal deposits in the Mui basin are being touted as a viable alternative source of energy following the Ministry of Energy’s coal exploration in the Basin (sub-divided into four blocks as shown in Table 2.4.2.1) since 1999 to establish the quantity and quality of coal reserves and develop a roadmap for coal development. The potential uses of coal include domestic uses, conversion to liquid fuels, cement
Plate 2.4.2.1 High dependence on wood fuel(Source: MEMR)
Table 2.4.2.1 Divisions of Mui basin for coal exploration
Zombe – Kabati 121.5 4 3
Itiko – Mutitu 117.5 7 3
Yoonye – Kateiko 131.5 57 32
Isekele – Karunga 120.0 4 2
Block Size (km2) No of drill Holes Coal Intercepts
(Source: Ministry of Energy, 2010)
manufacture, electric power generation and iron ore smelting (steel industry).
2.4.3 Wildlife and LivelihoodsKenya’s tourism industry, largely dependent on wildlife, is a significant source of foreign exchange revenue (Gachenge, 2008) and one of the largest contributors to the economy. Indeed, the sector contributed close to Kes. 100 billion to the country’s economy and generated up to 45% of Kenya’s foreign exchange earnings from tourism and related activities in 2010. The sector has grown from strength to strength as the number of people visiting parks and game reserves increased steadily over the years, from 1,533,438 people in 1999 to 2,495,135 in 2007.
Some of the wildlife tourist sites are dependent on the water catchment areas; the sites near the Rift Valley including Maasai Mara and Lakes Nakuru and Elementaita draw their water from the Mau Forest
ENVIRONMENTAL STATUS, LAND USE AND BIODIVERSITY

17Master Plan for Water Catchment Areas
Plate 2.4.3.1 Kenya’s arid lands are richly endowed with wildlife(Source: KWS and DRSRS)
Table 2.4.3.1 Wildlife population for selected animals (2006-2010)
(Source: GOK, 2010 Statistical Abstracts)
Complex. The importance of these and other tourist attractions including Mt. Kenya, the Aberdares, Lake Bogoria, Shimba Hills, Saiwa Swamp and the marine parks, also emphasises the need for the conservation of water catchment areas. Table 2.4.3.1 illustrates changes in wildlife populations for selected animals from 2006 to 2010 – essentially the positive effects of conservation on elephant and wildebeest populations and the negative effects on buffalo, giraffe and waterbuck populations. From this, it is evident that the sustainable conservation of wildlife requires
Species Number of animals (‘000) in specified years
2006 2007 2008 2009 2010
Elephant 17.5 19.7 19.4 20.9 22.6
Wildebeest 291.3 291.5 298.0 295 294.6
Grant’s Gazelle 117.5 115 114 113.3 112.4
Buffalo 22.1 20.1 18.1 17.8 16.0
Giraffe 31.7 29.3 27.5 25.4 24
Burchell’s Zebra 115.4 109.0 107.0 103.4 102.1
Thomson’s Gazelle 45.1 45 47.4 47.5 47
Waterbuck 4.1 4.4 3.7 3.9 3.0
Impala 62.5 63.4 63.9 63.8 62.6
proper conservation of their habitats, which also form important water catchment areas.
2.4.4 Agriculture and LivelihoodsAgriculture is the mainstay of Kenya’s economy, contributing approximately 24% of the GDP (GOK, 2011) and employing an estimated 3.8 million people directly in crop and livestock production and fishing, and another 4.5 million in off-farm informal sector activities. The Agriculture Act (Cap 318) of 1986 (revised) gives the Ministry of Agriculture the mandate
ENVIRONMENTAL STATUS, LAND USE AND BIODIVERSITY

18 Master Plan for Water Catchment Areas
to ensure the adoption of sustainable agricultural practices in order to protect and conserve the country’s environment.
One of the strategic thrusts under the Agriculture Sector Development Strategy (ASDS) is transforming land use to ensure better utilisation of high and medium potential lands, increasing productivity, and development of ASAL for crops and livestock production. The key activities identified to promote better land-use practices include:i. soil and water conservation where the Ministry’s
technical officers spearhead conservation efforts through laying of terraces and other measures mainly on small-scale farms with more than 12.5% slope
ii. promotion of water harvesting and management technologies to help farmers and local communities to harvest rainwater and surface runoff for domestic and food production
iii. riverbank protection for communities living along riverbanks and water bodies where stakeholders are sensitised and involved in pegging these rivers to demarcate areas to be left under natural vegetation
iv. involvement of stakeholders in the construction of water pans and small earth dams used for agroforestry nurseries, tree planting, food crop production, and watering livestock; each water pan has a sub-catchment area that is protected and conserved, contributing further to the overall conservation of natural resources
v. enforcement of the 10% farm forestry rule – gazetted by the Ministry in 2009 – requiring that a minimum cover of at least 10% of each farm holding be planted with trees or woodlot
vi. promotion of Integrated Farming Systems with the involvement of the Ministry’s extension staff to increase productivity especially in urban and peri-urban areas.
The Government’s policy for the fisheries’ sub-sector is to maximise production by proper utilisation of resources. To expedite commercial aquaculture growth, the Government introduced the construction of fishponds under the Economic Stimulus Package (ESP) in the 2009/2010 financial year (GOK, 2010: Economic Stimulus Package), and constructed. 20,000 fishponds in 160 constituencies during the period. ESP targeted fish farming as an alternative source of livelihood, and a measure to reduce the demand for fish from conventional sources including Lakes Baringo, Jipe, Naivasha, Turkana and Victoria, River Tana and the Indian Ocean. However, fish farming has a negative impact on water conservation particularly in areas where some fish farmers practise fish farming in water catchment areas such as wetlands.
2.4.5 Livestock and LivelihoodsThe production and distribution of livestock in Kenya is largely influenced by rainfall patterns, and since only 20% of the country is arable, the ASAL are
Plate 2.4.4.1 Inappropriate agricultural practices threaten the ecosystem and human health(Source: MEMR and DRSRS)
ENVIRONMENTAL STATUS, LAND USE AND BIODIVERSITY

19Master Plan for Water Catchment Areas
Plate 2.4.5.1 Nomadic pastoralism characterised by large herds of livestock(Source: KEFRI)
most suitable for livestock production and wildlife conservation. Traditionally, nomadic pastoralism constitutes the dominant and the mainstay of the economy in the drylands, and this makes vegetation important for the provision of grazing and browsing resources. The pastoral production system operates by independent family units exploiting a common resource – water and grazing land – through privately owned and managed herds.
Among the pastoralists, frequent daily movement of herds between pastures helps prevent overuse of a single area’s biomass and reduces disease and pest incidences in their livestock. Herd diversification (camels, cattle, donkeys, goats and sheep) ensures that both browsers and grazers are present, thus providing protection against the effects of an extended dry spell or a single disease that could wipe out an entire herd. This highly flexible system has evolved over time as the most efficient means of exploiting transient water and pasture under ecologically marginal conditions, available technologies and the prevailing economy (Chikamai and Odera, 2002).
With the alteration of hydrological regimes in catchment areas, frequent prolonged drought, poor land use and deforestation in some ecosystems, the livestock sector is seriously at risk, as are the other important activities in these ASAL – tourism and sand mining.
2.4.6 Indigenous KnowledgeIndigenous Knowledge can broadly be defined as the knowledge that a local community accumulates over generations of living in a particular environment. The role of indigenous knowledge in biodiversity conservation and sustainable management of water catchment areas can be great. This knowledge, which is based on, and deeply embedded in local experience and historic reality, has made it possible for communities to live in harmony with their environment for generations. It has guided people on how to sustainably utilise their natural resources using a variety of innovations to deal with environmental conservation and natural disaster management. It represents all the skills and innovations of a people and embodies the collective wisdom and resourcefulness of the community (Warren, 1992).
Development activities that work with and through indigenous knowledge and organisational structures have several important advantages over projects that operate outside them. Indigenous knowledge provides the basis for grassroots decision-making, much of which takes place at the community level through indigenous organisations and associations that identify problems and determine their solutions. Solution-seeking behaviour is based on indigenous creativity leading to experimentation and innovations as well as the appraisal of knowledge and technologies introduced from without. Local level
ENVIRONMENTAL STATUS, LAND USE AND BIODIVERSITY

20 Master Plan for Water Catchment Areas
knowledge and organisations provide the foundation for participatory approaches to development that are both cost-effective and sustainable.
The role of indigenous knowledge in conservation and sustainable management of water catchment areas in Kenya has to be viewed from the fact that people have depended on the biological resources for their wellbeing and survival for generations. The accumulated knowledge gained through this intimate relationship with nature is invaluable in decision-making on resource use, conservation and development options. Indigenous knowledge systems are participatory in nature and action, and exploiting their use in conservation would need the involvement of local communities, as these hold the key to the knowledge and problem-solving options within their environment.
The management of resources, for example grazing lands and water sources, in the hilltop forests by nomadic pastoralist communities indicates their deep understanding of the dryland ecosystems in a way that should be considered during land use development planning. The knowledge attached to decision-making on seasonal pasture rotation, for instance, should be a guide to land and resource management. Elsewhere, some communities as part of their cultural beliefs and practices manage sacred
sites like the coastal Kayas of the Mijikenda, the Naimena Engiyo-Loita forest of the Maasai and the Ramogi Hill forest of the Luo. The strict control of resource use tends to conserve rare species, forests, water catchment areas and other natural resources.Local communities with indigenous knowledge need to be recognised and involved in decision-making, particularly during the formulation and execution of all community-based projects. This goes hand in hand with dissemination and exchange of information for wider consumption within communities and development agencies, and among policymakers (Kabuye, 1996).
2.4.7 Women and YouthIt is important to note that gender dimensions in the use of water catchments influence their conservation. For instance, it has been observed that in areas where women are involved in conservation activities, the environmental status is well managed, a reality attributed to the fact that women are more involved in rural activities than men. Then again, women spend a lot of time in search of water, firewood and other domestic chores, leaving them with little time for activities related to conservation. Mainstreaming gender into policies, plans and budgets, affirmative action will ensure that women have good representation in various activities within the water catchment areas. Indeed, the Economic Survey 2011 advocates for an enhanced role of women
groups in the conservation and protection of water catchment areas in view of the key role that they have increasingly played in development activities. In 2010, the country had 142,783 registered women groups with a membership of 5,579,639 members who mobilised Kes. 551.2 million, demonstrating that women may also be good at resource mobilisation.
ENVIRONMENTAL STATUS, LAND USE AND BIODIVERSITY
Plate 2.4.7 The long wait by women and children to fetch water at a spring

21Master Plan for Water Catchment Areas
Unemployment is one of the major challenges facing the youth, who currently comprise 32% of Kenya’s population, as only about 500,000 young people join the labour market annually. In order to improve their livelihoods, many young people migrate to urban centres in search of employment, thereby increasing competition among unskilled labourers in urban areas. With high unemployment rates, limited skills, lack of resources and lack of opportunities, it becomes easy for the youth to be enticed into irregular activities such as crime, prostitution and substance abuse. Therefore, this valuable human resource needs to be exploited for the conservation of water catchment areas, as was successfully done during the implementation of the Trees for Jobs initiative, where many young people were involved in tree planting and nurturing, and bush clearing. In addition, 97,174 young people were engaged in tree-planting programmes and 8,878,978 trees were planted between 2007 and 2010.
2.4.7.1 Proposed Involvement of Youth in Catchment Rehabilitation
Since 2009, the Government of Kenya has promoted a policy aimed at planting and growing 7.6 billion trees by the year 2030. To this end, various programmes have been instituted by state and non-state actors with examples including the Trees for Jobs initiative of the Ministry of Youth Affairs and Sports, through which nine million seedlings will have been planted throughout the country over a six-year period beginning 2008 at a cost of roughly Kes. 1.38 billion.
Plate 2.4.7.1 Youth and women involved in cleaning river Nairobi and tending trees in nurseries(Source: DRSRS)
Full exploitation of tree-planting programmes through the registered 16,350 youth groups, 4,300 women groups and 4,200 selected Green Schools in the country, expands possibilities for the accelerated restoration of WCAs.
In 2010, the Ministry of Environment and Mineral Resources and the Ministry of Forestry and Wildlife created a joint tree-planting programme to support efforts aimed at attaining a 10% forest cover by the year 2030. For this to be attained, 200 million seedlings need to be planted yearly, and this requires that tree nurseries are established in 500 schools annually, with each school producing 500,000 seedlings, as presented in the 2011/12 annual budget. This estimate excludes the normal planting programme of Kenya Forest Service (KFS) and the numerous initiatives by non-state actors including financial institutions, community-based and faith-based organisations.
Working through schools has several multiplier effects including creating a critical mass of future environmental stewards, inculcating appropriate attitudes on environmental management to a high population segment, and imparting skills and knowledge to the youth. Figure 2.4.7.1 shows the density of Green Schools in water catchment areas.
ENVIRONMENTAL STATUS, LAND USE AND BIODIVERSITY

22 Master Plan for Water Catchment Areas
Figure 2.4.7.1 Distribution of Green Schools in Kenya
(Source: MEMR)
2.5 ECOSYSTEMS AND BIODIVERSITY STATUS
The term ecosystem is generally used to denote the physical and biological components of an environment considered in relation to each other, and these include plants and animals together with their environment: surrounding air, water, soil, sunlight, rocks etc. Ecosystems vary greatly in size and the elements that make them up but each is a functioning unit of nature (Campbell 2009). There is such a high level of interdependence among species and elements in an ecosystem that damage to, or the disappearance of, one part of an ecosystem is sure to have an impact on all the other parts.
Biodiversity or biological diversity – a concept that originated as a plea for the preservation of the great wealth of plant and animal life in tropical forests (Trapnell, 1997) – is a measure of the relative diversity among organisms present in different ecosystems (Vreugdenhil et al., 2003). By the same token, forest biodiversity refers to the whole web of life – including trees, shrubs, herbs, fungi and animals – that is supported in a forest. Although accounting for only 2% of Kenya’s land area, closed canopy forests harbour a large percentage of the nation’s biodiversity (Beentje, 1994).
Rainfall and altitude are the two major factors that determine the distribution and growth of plants, thereby conceiving ecosystems with characteristic flora and fauna by which they are distinguished. Kenya’s flora is particularly interesting because of the wide range of ecological and climatic conditions: 1,800 woody species have been identified (Beentje, 1994) but this number could be higher, and it is estimated that there are 6,000 to 7,000 species of vascular plants (Eberhard et al., 2010). Sadly, dramatic loss of biodiversity in water catchment areas has been and continues to be caused by human activities including direct harvesting of species, introduction of alien species, habitat destruction and various forms of habitat degradation including environmental pollution. In order to address issues related to the environmental status and biodiversity of the water catchment areas, prior knowledge of the ecosystems in which these water catchment areas are found is imperative, as this helps in monitoring rehabilitation and restoration activities.
2.5.1 Land Cover and Land UseKenya is endowed with diverse ecosystems including montane forest, dryland, wetland, marine and terrestrial mangrove ecosystems that are rich in flora and fauna. Figure 2.5.1.1 shows the land cover distribution while Table 2.5.1.1 shows the specific percentage of each land cover type. The figures show that the annual agricultural cropland constitutes only 15% while shrubland dominates the Kenya land cover at approximately 54%.
ENVIRONMENTAL STATUS, LAND USE AND BIODIVERSITY

23Master Plan for Water Catchment Areas
(Source: FAO DRSRS Africover Project 2000)
2.5.2 Status of Key Water Catchment EcosystemsThis section highlights some of the important water catchment ecosystems, their biodiversity status, threats and the need for their conservation, and presents illustrative case studies on how some of them are being managed. The main ones presented are forest and dryland hills ecosystems and wetlands; details on their locations, main catchments and rivers, status and threats are provided in Appendix 4, Appendix 5 and Appendix 6.
Figure 2.5.1.1 Land cover distribution in Kenya 2.5.2.1 High Montane Forest Water Catchment Ecosystems
The five major water towers namely the Aberdare Ranges, Cherangany, Mau Complex and Mts. Elgon and Kenya, are also the main forest ecosystems within which are natural vegetation types with characteristic biodiversity, largely determined by elevation and rainfall. Details of the typical natural vegetation types and the key tree species for each water catchment area are provided in Appendix 5. The natural vegetation types for the major water towers are:• Afro alpine occurring above
3,800m a.s.l, found on Mts. Elgon and Kenya and the Aberdares only, and characterised by freezing temperatures, strong wind, shallow wet or marshy peaty soils on rock, and the absence of trees except Senecios, tussok grasses, Carex bogs, wiry herbs, mosses and lichens. There is minimal human or animal disturbance at these elevations and the major threat would be the effects of climate change.
• Mountain scrubland and moorland occurring at 2,500–3,800m and found in all water towers. It is characterised by very cold temperatures, thin wet or marshy peaty soils on rock, tussock-forming grasses and sedges, mosses, lichens and ferns are also common. There is minimal human and animal disturbance at these elevations and like in the Afro Alpine, the major threat would be the effects of climate change.
ENVIRONMENTAL STATUS, LAND USE AND BIODIVERSITY

24 Master Plan for Water Catchment Areas
Table 2.5.1.1 Percentage extent of the different land cover types of Kenya
Annual agricultural crops 898,664,439 15.42
Bare areas 24,869,544 0.43
Grassland 370,635,107 6.36
Irrigated cropland 15,709,530 0.27
Mangroves 6,600,512 0.11
Natural forest 129,685,530 2.23
Perennial crops 96,398,932 1.65
Plantation forest 18,030,787 0.31
Rice paddy 4,923,689 0.08
Shrubland 3,162,538,113 54.28
Urban 3,098,008 0.05
Water bodies 125,753,101 2.16
Wetlands 162,875,837 2.80
Woodland 806,716,871 13.85
Total 5,826,500,000 100
Land use Type Area in Ha % Coverage
• Bamboo woodland and thicket occurring at 2,100–3,300m a.s.l. with rainfall above 1,200mm and recognised by the occurrence of bamboo in pure stands in closed canopy or patches or mixed with scattered trees but usually forming over 80%
Plate 2.5.2.1.1 Pure stands of bamboo in the Aberdares and Mau Forests(Source: DRSRS)
cover. This is a crucial vegetation type because most rivers, streams and springs start here and so does serious destruction by humans and animals through the intensive harvesting of bamboo and other woody species and cultivation.
• Drier montane forest occurring at 1,800-2,900m a.s.l., with annual rainfall totals of 700-1,350mm. This vegetation type, found in the drier, cold (leeward) slopes of mountains, is an important source of several rivers and springs. Unfortunately, there has been much destruction particularly through illegal logging, grazing, cultivation and settlements, charcoal burning and fires among others, resulting in severe degradation.
• Moist montane forest occurring at 1,600-2,450m a.s.l., with rainfall over 1,800mm. This forest ecosystem is found in the wetter (windward) slopes of mountains, and is characterised by a continuous stand of trees over 10m tall with closed canopy, relatively moist or wet floor, usually with carpet forming Selaginella kraussiana, lichens and epiphytic ferns – the tree fern, Cyathea manniana, is common along streams. This ecosystem, being an important source of several rivers and springs, faces potential destruction, as it is most suitable for the production of many staple crops such as potatoes and cabbages. Indeed, many of these areas have been cleared of natural vegetation and converted to agricultural land and plantations of exotic species.
ENVIRONMENTAL STATUS, LAND USE AND BIODIVERSITY

25Master Plan for Water Catchment Areas
Plate 2.5.2.1.2 A well conserved moist montane forest and similar forest ravaged by fire(Source: DRSRS)
2.5.3 Biodiversity of Key Forest Water Catchment Areas
Kenya is among the world’s top 50 countries in terms of species richness (IUCN, 1996), and has one of the highest numbers of total mammal species in Africa. In addition to being the heart of biodiversity
Table 2.5.3.1 Globally threatened species in Kenya compared to selected high-biodiversity African countries
Country
Kenya
Namibia
Madagascar
Uganda
Tanzania
Mammals
359(a) 21(b) 43(c)12 (d)
154(a) 3(b) 11(c)7.1 (d)
105(a) 84(b) 46(c)44 (d)
338(a) 6(b) 18(c)5.3 (d)
316(a) 12(b) 33(c)10 (d)
Birds
844(a) 6(b) 24(c)2.8 (d)
469(a) 1(b) 8(c)1.7 (d)
202(a) 104(b) 28(c)14 (d)
830(a) 3(b) 10(c)1.1 (d)
822(a) 24(b) 30(c)3.6 (d)
Freshwater Fishes
unknown (a)unknown (b)20 (c)unknown (d)
102(a)un(b)3(c)2.9 (d)
40(a)un(b) 13(c)33 (d)
291(a)un(b) 28(c)9.6 (d)
un(a)un(b)19(c)un (d)
Plants
6000(a) 265(b) 158(c)2.6 (d)
3128(a) un(b) 23(c).74 (d)
9000(a) 6500(b) 189(c)2.1 (d)
5000(a) un(b) 6(c).12 (d)
10000(a) 1122(b) 406(c)4.1 (d)
wealth, Kenya’s water catchment ecosystems are the backbone of much of the country’s economic activities on which many livelihoods depend. Table 2.5.3.1 compares Kenya’s biodiversity with that of selected African countries.
Biodiversity: (a) total number of known species, (b) endemic species, (c) threatened species, (d)% of threatened taxa
(Source: 1996 Red List, World Conservation Monitoring Centre and IUCN)
ENVIRONMENTAL STATUS, LAND USE AND BIODIVERSITY

26 Master Plan for Water Catchment Areas
The Mau Forest Complex is an example of the wealth in biodiversity of catchment areas, as it hosts several indigenous valuable plant and animal species (KIFCON, 1993) including the Bongo whose race, T. e. Isaaci, is endemic to Kenya. Other mammal species that are of international and regional conservation concern include the yellow-backed duiker, golden cat, giant forest hog, leopard spotted and striped hyena, buffalo, black and white colobus, black-fronted duiker and the African elephant. Other nationally endangered species found only in this forest include the potto, spotted necked otter and the striped hyena. The forest has a rich variety of birds representing the richest montane avifauna in the Eastern African region with 173 bird species having been recorded there, and is also rich in invertebrates, reptiles and amphibians.
Another biodiversity-rich water catchment is Mt. Kenya, a unique ecosystem with great cultural and biological significance, recognised as a Forest Reserve in 1932, established as a National Park in 1949, and designated a Biosphere Reserve under UNESCO Man and Biosphere Programme in 1978. In addition, the National Park and forest reserve area was in 1997 listed as a World Heritage Site for its notable landscape and outstanding flora and fauna. Mt. Kenya has various altitudinal zones of vegetation including moist forest, dry highland forest, bamboo, afro-alpine moorland and finally the snow and glacier belt (Appendix 5).
The floral diversity of these forests includes 882 plant species and subspecies belonging to 479 genera in 146 plant families (Bussmann, 1994). With much of Central Kenya forests gone, Mt. Kenya has become a refuge for rare and endangered plant and animal species once common in the region. These forests are also rich in medicinal plants and supplement the pharmaceutical requirements of the people.
2.5.4 Threats to Biodiversity of Forests and Water Catchment Functions
With forest ecosystems being vulnerable to natural shocks, mismanagement and unsustainable use, many are facing the threat of depletion, and as a
result, the ecosystems and biodiversity of water catchments have been increasingly degraded. The rapidly growing population and increasing developmental needs within the high potential areas where catchments are concentrated have increased demand for fertile land, water, and energy, therefore putting considerable pressure on the resource base. The continued mining of catchment resources jeopardises biodiversity and essential ecological services and this will certainly increase poverty levels. In view of the two-way causal relationship between catchment degradation and poverty, it goes without saying that the majority of poor people depending directly on catchment resources for sustenance will be the most directly affected by degradation of the capital base.
2.5.5 Dryland Water Catchment EcosystemsDrylands make up approx. 80% of Kenya’s land surface and support 25% of the human population, slightly more than 70% of the livestock population and 90% of the gazetted National Parks and Game Reserves. Generally, they are characterised by hot and dry climate with low, brief, erratic and sporadic annual rainfall, poor soils and scanty vegetation cover. These regions – in which droughts, conflicts and household food insecurity are commonplace – have the highest incidence of poverty in Kenya (Government of Kenya, 2000).
Extensive areas of Kenya’s drylands are low-lying plains covered with thickets of thornbush, grassland and scattered trees – mainly Acacia and Commiphora species. These plains are dotted with isolated hills and low mountains (Figure 2.5.5.1 and Table 2.5.5.1), which when of sufficient height, trap and hold clouds or force moisture-laden winds into high altitudes where cooling causes condensation. These hilltops, which hold unique islands of forests supporting different flora and fauna (Gachathi, 1996), are explored in this section to demonstrate their importance as water catchments and biodiversity conservation areas, and their role in strengthening adaptation to climate change. See the Endau Hill case study (Figure 2.5.5.1).
ENVIRONMENTAL STATUS, LAND USE AND BIODIVERSITY

27Master Plan for Water Catchment Areas
Plate 2.5.5.1 Dry and very dry ecosystems of northern Kenya(Source: KEFRI)
Figure 2.5.5.1 Gazetted dryland hilltop forests
(Source: KEFRI dryland Forestry Handbook)
2.5.5.1 The Importance of the Hilltop Forests at the Local LevelThe impact of hilltop forest cover on microclimate (i.e. soil, temperature and soil moisture conditions) is significant, as it moderates the effects of temperature and wind, and significantly changes the humidity regime (Wass, 1995). These microclimates provide a much wider
range of environmental conditions that are nonexistent under other dryland vegetation cover, and as a result support a wider range of species. The fact that these hilltop forests prevent rapid runoff of rainwater and help replenish springs and streams in the valleys below, makes them water catchments vital for the existence of pastoralists, domesticated and wild animals. Not only do these hills provide water, pastures and wild food plants during periods of drought, but also traditional herbs and medicines and a venue for socio-cultural activities such as traditional ceremonies and sacrifices. For this reason, the conservation of such biodiversity hotspots is of paramount importance (Myers et al., 2000).
2.5.5.2 Conservation and Management of Hilltop Forests by the Local Communities
Traditionally, the local communities have responsibly conserved and managed hilltop forests in the drylands through customs and unwritten rules and
ENVIRONMENTAL STATUS, LAND USE AND BIODIVERSITY

28 Master Plan for Water Catchment Areas
regulations that govern the use and management of these forests. These communities have employed ecological management strategies in harmony with their fragile ecosystem by exploiting different ecological niches, even resisting the desire to have their animals graze in the hilltop forest where pastures are good (Karanja, Tessema and Barrow, 2002). Furthermore, harvesting of plant materials including herbal medicines is regulated by community rules and regulations effected by the elders.
2.5.5.2.1 Case Study of Endau Hill ForestEndau Hill lies between the highlands and the coastal forests at 38o 38’ East, 1o 16’ South, rising from the general altitude of 500m a.s.l. on the plains to several peaks that summit at Matundu (1,400 m). Endau Hill Forest, which falls under the administration of the Zonal Forest Office in Kitui, is a gazetted forest that is legally owned by the Government and managed directly by the KFS. A Forester at Mwitika together with a Forest Guard and a Patrol Man stationed at Endau Trading Centre are responsible for the daily management of the 6,700 Ha forest, particularly the water catchments (Gachathi and Amwatta, 2005).
Table 2.5.5.1 Dryland catchments
MOUNTAIN/HILL
Mt. Marsabit
Mt. Kulal
Hurri Hills
Mathews Range
Ndoto Mts
Nyiru Mts
Kirisia Hills
Namanga/Ol Doinyo Orok
Emali Hills
Chyulu Hills
Machakos Hills
Ol Doinyo Sabuk
Endau Hill
Mutitu Hill
Mumoni Hill
Tugen Hills
Karasuk/Loima Hills
Kasigau Mt.
Maungu Hills
CATCHMENT/RIVER
Local
Local
Local
Ewaso Ng’iro, Milgis
Local, Milgis
Local
Ewaso Ng’iro, Milgis
Local, Cross-Border, TZ
Local
Mzima, Tsavo, Galana
Athi
Athi
Local
Local
Local
Perkerra, Kerio, Suguta,
Turkwell
Local
Local
COUNTY
Marsabit
Marsabit
Marsabit
Samburu
Samburu
Samburu
Samburu
Kajiado
Kajiado
Makueni, Kajiado, Taita
Machakos, Makueni
Machakos
Kitui
Kitui
Kitui
Baringo
Turkana
Taita-Taveta
Taita-Taveta
ENVIRONMENTAL STATUS, LAND USE AND BIODIVERSITY

29Master Plan for Water Catchment Areas
According to the local community, water is the most important commodity derived from this hill, a source of nearly 20 permanent water springs of which six have been tapped and piped down into huge tanks for use by the local community and their livestock. The permanent springs include Ngunya-imwe and Kausya springs supplying Ikisaya, Wazalani and Kathua markets, the Ikituku and Yongoni springs supplying Manjunja area, the Kangera and Kaundua springs supplying Mutalani, the Kibau spring supplying Koi primary School and Twamboi markets. The spring water is piped with support from various NGOs particularly the ASAL Programme and AMREF, while local communities manage the water through water committees.
Other important uses of Endau Hill are for grazing livestock during the dry season when all grass and palatable herbs have dried up, sourcing traditional herbs and medicines and for socio-cultural activities. The forest has become central to the culture of the local Kamba community living around Endau Hill, and is associated with various traditional ceremonies of great cultural and spiritual value. For example, each year before planting, a traditional ceremony is performed on sacred sites at Kwa Sio Sili and Kwa Muteyia, with people taking their seeds for blessings from their ancestors.
The case of Endau forest clearly exemplifies the importance of community involvement in the sustainable use and conservation of water resources
Plate 2.5.5.2 Honey is a major source of livelihood from natural resources in arid land forests(Source: MEMR)
and catchment areas, which could be replicated countrywide in the management of important environmental resources.
2.5.6 Threats to Biodiversity and Water Catchment Functions of ASAL Areas
The increased pressure on natural resources in the ASALs has led to the degradation of fragile ecosystems and resulted in a marked increase in resource-based conflicts as competition for scarce resources stiffens. Sadly, there are no formal regimes to manage and support the multiple functions of hilltop forests in a holistic manner, and the current formal knowledge base tends to focus either on adaptation to climate within farming or livestock systems or on biodiversity conservation in protected areas. Seldom does it focus on local level interaction between the two on which both people’s adaptation options and biodiversity conservation depended, and this needs to be addressed.
2.5.7 Wetland Water Catchment EcosystemsKenya’s wetland ecosystems, which cover between 3-4% of the total land surface, are considered the most diverse and productive, probably second only to forests (Wetlands International, 2011). Their importance and value range from ecological/environmental to socio-economic functions, as they support a number of livelihood systems and cultural practices among Kenyans countrywide.
ENVIRONMENTAL STATUS, LAND USE AND BIODIVERSITY

30 Master Plan for Water Catchment Areas
The Kenyan landscape and wetlands are associated with rich biodiversity assemblages, unique to the different wetland types, and in some cases with endemic flora and fauna. The wetlands, stated as the richest sinks of carbon (IPCC, 2010), have special benefits to the overall ecosystems and livelihoods. They control floods and prevent soil erosion by storing excess amounts of water during heavy rainfall, thereby reducing floodwater volumes downstream. This in turn mitigates settlement disruptions similar to those on the lower courses of the Nzoia and Tana River basins that have become a common feature. The water is then discharged in small amounts, and it is through this slow movement of water that infiltration is enhanced and ground water and aquifers recharged. Similarly the slow movement allows silt and sediment retention and protects the riverbanks from erosion and reduces the flow of toxic substances from inflowing water thereby improving the quality of water downstream.
Plate 2.5.7.1 The Napuyapuyi Swamp which forms the upper catchments of the Mara River(Source: MEMR)
Wetlands are natural habitats for a variety of plants and animals some of which are endemic, endangered and migratory. They are therefore in-situ banks for genetic resources. This makes them unique sites for tourism, cultural activities and scientific research. As a source of hydroelectric power and raw materials (reeds such as Papyrus sp. and Phragmites sp.) for the cottage industry, wetlands support industrial growth. In addition, the edible plants, animals and fish that thrive in wetlands are a source of food.
2.5.7.1 Threats to Biodiversity and Water Catchment Functions in Wetlands
Despite the high productivity and provision of many benefits, wetland ecosystems are still facing serious threats. The main threats are those arising from poverty, poor policies, population pressures – specifically rapid human population growth, immigration, urbanisation and industrialisation. These lead to several problems in the wetlands
ENVIRONMENTAL STATUS, LAND USE AND BIODIVERSITY

31Master Plan for Water Catchment Areas
including reclamation, pollution from domestic and agricultural discharge, eutrophication, overexploitation of resources, excessive extraction of water and invasion by alien invasive species. With time, these problems have intensified, resulting in serious ecological imbalances.
Serious cases of pollution include Lake Nakuru, which is threatened by industrial and domestic waste, Lake Naivasha by agrochemicals from horticultural enterprises and Tana River by agrochemicals and urban waste. In addition, Lake Victoria and associated wetlands are under threat of destruction by industrial effluent from sugar and paper industries, agro-chemicals and domestic waste. Indeed, most wetlands are increasingly showing symptoms of nutrient enrichment such as algal blooms, fish kills, prolific growth of macrophytes and murky foul water.
The main land use changes that have affected wetlands in Kenya include deforestation, encroachment onto catchment areas, and the reclamation and draining of wetlands for agricultural purposes. The deforestation of critical areas including the Mau, Mt. Kenya and the Aberdares forests has occasioned the destruction of various catchments such as the Tana River and Lakes Victoria, Nakuru and Baringo. The encroachment of catchments is a major problem that has been observed on the Yala Swamp, Lakes Naivasha, Baringo, Victoria and Ol Bolossat, and Tana River, as is the reclamation of many wetlands including the Yala Swamp and Tana Delta.
Plate 2.5.7.2 Fish farming is done in wetlands and this may compromise the quality of water(Source: MEMR)
Given the fragility of wetlands, there is an urgent need to strike a balance between the environmental functioning of wetlands and their sustainable use for livelihoods. For this reason, there is desperate need for management regimes that guide the use, conservation and sustainable management of wetland biodiversity resources in Kenya. Such a policy, which would need to be tailored to the natural characteristics of individual wetlands, would contain guidelines on the conservation, wise use and management of these wetlands.
2.5.8 Invasive SpeciesA species is regarded as invasive if, having been introduced by human action into a location where it is not native, it becomes capable of establishing a breeding population without further intervention by humans and becomes a pest, threatening the local biodiversity (Space, et al, 2003). However, it is worth mentioning that some indigenous species can also be invasive, as is the case of Polygonum senegalense which has invaded Lake Ol Bolossat, Phragmites mauritianus, Pistia stratiotes, Typha latifolius, Cyperus papyrus, Nymphaea spp and Ludwigia stoloniferus.Invasive aquatic species, both floating and submerged, pose serious threats to the country’s lakes, rivers, dams and swamps, as they impede fishing, navigation and interfere with general water flow. Water hyacinth (Eichhornia crassipes) on Lake Victoria has chocked the socio-ecological functions of the lake, as has Salvinia molesta, which occupies large areas of Lake Naivasha, and occurs on Rivers Nairobi and Ramisi, Masinga Dam and other aquatic
ENVIRONMENTAL STATUS, LAND USE AND BIODIVERSITY

32 Master Plan for Water Catchment Areas
Wetland Degradation: The Case Study of Tana Delta
The Tana Delta wetlands within Tana River District of Coast province are arguably Kenya’s largest, most ecologically and biologically diverse, and socioeconomically important wetlands in Kenya. Covering an estimated area of 130,000 Ha, the delta supports a gallery of ecosystems ranging from forests to swamps to dunes to beaches and ocean, home to diverse exotic plants and animal species, some of which are listed as endangered. The delta is immensely valuable to the local people who have built an intricate relationship between their lifestyles and the dynamics of the delta’s ecosystems.
Multinationals and local corporations are scrambling for a piece of the globally important Tana Delta wetland, on which they propose to grow food for export, biofuels and source minerals. There is a need for feasible development projects that will not only enhance the livelihoods of local communities in the areas but also promote sound conservation practices, but this is not the case in the Tana Delta where development projects are currently being promoted in absence of a land use plan.
Figure 2.5.7.1 The wetlands of the Tana Delta
ecosystems (Roimen et al., 2008). Prosopis juliflora, commonly known as Mathenge, is yet another alien invasive species that has invaded various water bodies and watercourses including Lakes Baringo, Turkana and Bogoria and Rivers Tana, Ewaso Ng’iro and Turkwell.
The Convention of Biological Diversity (CBD) recognises the significance of aquatic invasive species as a threat to biodiversity conservation, and is committed to the prevention and control of their spread globally.The management of widespread invasions on transboundary water resources such as the water
ENVIRONMENTAL STATUS, LAND USE AND BIODIVERSITY

33Master Plan for Water Catchment Areas
hyacinth on Lake Victoria requires intergovernmental coordination, for example the Lake Victoria Environment Management Programme (LVEMP) involving many agencies from all the countries sharing the lake resource. It is also important to involve the neighbouring farming communities, which through using many agricultural inputs, provide ideal sources for nutrient loads that support growth of these weeds. This calls for the harmonisation of land use regulations in the catchment areas and around lakes.
2.6 STATUS OF WATER CATCHMENTS AND SUB-CATCHMENTS
The water catchments have a varied environmental status that is continually changing in terms of environmental status due to both anthropogenic and natural influences and can be categorised according to different levels of degradation. Appendix 6 shows the different levels of degradation analysed using satellite images from 1975 to 2010. This section contains a description of the major river systems, changes in vegetation cover and land use, and threats to the selected water catchments and sub-catchments. The status of selected catchments, sub-catchments and local catchments has been analysed in terms of trends in flow with the aim of detecting whether any land cover and land use may have had an impact on flows. Table 2.6.1 shows the list of selected catchments analysed.
Plate 2.5.8.1 Invasive species (P. senegalense, S. molesta and E. crassipes) in L. Ol Bolossat and L. Naivasha(Source: KEFRI)
2.6.1 Mt. Marsabit CatchmentMt. Marsabit has a low mountain forest covering 15,700 Ha whose vegetation composition is typical of a dry upland mixed forest; it occurs at an altitude of 1,165 – 1,500m a.s.l. and is a local catchment area for several streams that provide water to the town. Figure 2.6.1.1 shows changes in vegetation cover and land use from 1989 to 2009. Land-use practices that threaten the existence of the mountain forest include encroachment, excessive water use, charcoal burning, firewood collection, grazing and climate change effects. Land cover changes from 1986 to 2009 (Figure 2.6.1.1) indicate that cropland and shrubland have been increasing at the expense of natural forests and grassland. The reduction of the natural forest threatens the water catchment role of the forest while the decreasing grassland threatens the livelihoods of pastoralist communities.Marsabit Forest is considered a water tower by virtue of the fact that it is the source of water for the town and the highly populated surrounding communities that tap it for water, fuelwood and pasture for their livestock of which at least 50,000 graze the forest daily. Indeed, it has been noted that in the last five years, the water levels within the crater lakes of Mt. Marsabit have declined significantly and in some instances completely dried up – see plate 2.6.1.1.With the expansion of Marsabit town, whose lacking sewer system contributes to the pollution of surface and ground water sources, the sustainability of the Marsabit catchment area has been called into question. Indeed, there are no reliable ground water sources in the catchment and the few productive
ENVIRONMENTAL STATUS, LAND USE AND BIODIVERSITY

34 Master Plan for Water Catchment Areas
ENVIRONMENTAL STATUS, LAND USE AND BIODIVERSITY
SN Catchment Selected sub catchment
Size/Location/Remarks
Percentage decrease in forest cover (1976-2009)
Decrease in base flow 1926-2000 (Mean %)
Remarks
1 Mt. Marsabit Forest Mt. Marsabit Local Forest
catchment 20
Change in settlement patterns and change to sedentary livelihoods leading to a loss
2 Tinderet Sub catchment Nyando
Main catchment area for Nyando River
25 Expansion of cropland
Malewa Sub Catchment Wanjohi
A significant water catchment for Naivasha
48 44 Subsistent agriculture
3 Mt. Kenya Likii and Thiba
A major catchment for river Tana 29 49
Forest cover reduction due to agricultural activities
4 Kinale Sub catchment Ndarugu
Found in Kikuyu escarpment. Significant for water source to Nairobi
3 14Clearing indigenous forests for large scale tea plantations
5 Cherangany Upper NzoiaThe main catchment for river Nzoia
46
Encroachment, high water use, illegal logging, charcoal burning, firewood collection, illegal grazing, cultivation
6 Nzoia River Wuoruoya
A catchment with several subcatchment experiencing different levels of threat
25 6Expansion of cropland causing flooding downstream
7 Njoro River NjoroIs the main catchment for Lake Nakuru
69 11 Forest clearance for agricultural activies
11 Shella Dunes catchmet
Shella Sand dunes
A significant but threatened catchment at the coast
Water front development activities
12 Taita Hills A local catchment area for Voi River 78
Subsistence farming and high population pressure
13 Mt Kulal A local catchment area in a dryland 6
Logging for fuel wood, building materials and construction, removal of the understory and grass fires,
Table 2.6.1: Changes in Vegetation cover and Base Flow of selected catchments

35Master Plan for Water Catchment Areas
shallow wells, springs and pans are drying up. Bakuri, the major spring has recorded lowest flow in 10 years, while Sokote Ndiko and Sokote Buba have dried up for the first time in history. (Plate 2.6.1.1).The lack of a reserve means that all the water is abstracted as soon as it becomes available, and this needs to be addressed urgently through an integrated catchment management approach.
The problems facing the catchment can be attributed to changing settlement patterns and the change to sedentary livelihoods, with large livestock herds grazing in the forest. Though traditionally Marsabit Forest was a dry season grazing land, the immigration of pastoralist communities to the area has made grazing a permanent activity in the forest thereby destroying existing vegetation and hindering its regeneration. The population increase has precipitated forest encroachment, excessive water
Plate 2.6.1.2 Marsabit Town and water scarcity
use, and increased demand for firewood, grazing land and charcoal; the uncontrolled sinking of boreholes is arguably the reason why Lake Paradise dried up.
Some of the proposed interventions for the conservation of the Marsabit catchment include improving water harvesting and storage systems, which requires communities to construct or buy water storage tanks to harvest rainwater, and the construction of check dams for water harvesting in the laggas. Indeed, the construction of Marsabit dam is a milestone in this conservation effort since it ensures that all the runoff from the forest can now be tapped. Reducing excessive extraction of forest products would require that communities adopt the use of alternative energy sources (e.g. biogas and energy saving stoves) and livelihoods such as tourism, butterfly farming, beekeeping and carbon trading to diversify their incomes and reduce forest dependence. Adoption of agroforestry systems and practices would reduce pressure on the forest by providing wood products and fodder on farms while improving farm produce.
2.6.2 The Malewa CatchmentThe Malewa Basin is located on western slopes of the Aberdare ranges; the basin is 625 km2 in size, slopes at 18% to the west and varies from 2,066 to 2,788m in elevation. Ridges are sharp-crested, valleys vary from V-shaped for sub drainages to broad U-shaped for the major valleys, and the drainage pattern is dendritic. Stream density is high, around 6km/km2
ENVIRONMENTAL STATUS, LAND USE AND BIODIVERSITY
Plate 2.6.1.1 Changes in the levels of the water in Lake Paradise, Marsabit Forest Reserve
Lake Paradise Marsabit Forest in 2005 with water (Source: KEFRI & MEMR)
Dry Lake Paradise in Marsabit Forest 2010

36 Master Plan for Water Catchment Areas
Figure 2.6.1.1 Changes in land cover types in Marsabit sub-catchment (1986-2009)
1989
2005
1999
2009
and the climate is classified as humid mesothermal with temperatures averaging 10°C in July and 21.6°C in September. Rainfall in the vicinity, as determined from data of Ol Jorok KARI station (altitude 2,574m, rainfall 820mm and Geta Forest station (2,788m, rainfall 1,196mm) is low compared to that of the
windward stations in east Tutho, Murang’a (2,263mm and 2,314mm respectively). Nevertheless, within the catchment it varies with elevation (slight orographic effect) from 679mm at low elevations (Naivasha at 2,066m) to 1,196mm at high elevations and averages 800mm annually. Rainfall is distributed fairly evenly
ENVIRONMENTAL STATUS, LAND USE AND BIODIVERSITY

37Master Plan for Water Catchment Areas
Figure 2.6.1.2 Changes in land cover types in Marsabit sub-catchment -1986-2009
Figure 2.6.2.1 Reducing base flows for Wanjohi sub-catchment (station 2GB04) (1974-2002)
throughout the year, peaking in May (160mm) and dropping to its lowest in January (30mm).
Wanjohi sub-catchment is one of the smaller areas that form Malewa, which constitutes the upper Lake Naivasha catchment. An analysis of observations made at station 2GB04, the last outlet of Wanjohi River from 1974 to 2002 are as follows: mean is 1.05m3/s, median is 0.57m3/s, minimum is 0.011m3/s and maximum is 11.86m3/s. The trend depicted for this river is one of rising for flood flow which has increased by 27% and base flows which have decreased by 44% (Figure 2.6.2.1).
The Shamata-Wanjohi catchment is largely comprised of fragile areas with low vegetation cover and is prone to sheet erosion, with the most fragile area stretching from Ruriie to Ol Kalau and down to Morendat. The catchment area, made up of vegetated slopes (closed canopy forests) of the Aberdare ranges, decreased from 8,390 Ha in 1973 to 4,370 in 2009 (Figures 2.6.2.3 and 2.6.2.4). Half of sub-catchment land cover that was previously virgin forest has been converted into agricultural land for subsistence farming, a serious threat to the sustainability of the catchment area and therefore the livelihoods of the people.
2.6.3 Tinderet Sub-CatchmentThe Tinderet forest is the main catchment area for the Nyando River whose waters also drain into the River Kerio. The main land-use practices are agriculture and livestock rearing. Between 1986 and 2009, the natural forest decreased from 35,110 to
Figure 2.6.2.2 The position of 2GB04 in Wanjohi sub-catchment (near Rironi)
ENVIRONMENTAL STATUS, LAND USE AND BIODIVERSITY

38 Master Plan for Water Catchment Areas
ENVIRONMENTAL STATUS, LAND USE AND BIODIVERSITY
Figure 2.6.2.3 Changes in land cover types in Shamata-Wanjohi sub-catchment (1973-2009)
26,270 Ha attributable to the expansion of cropland (Figures 2.6.3.1, and 2.6.3.2).
The situation for Nyando River which has some of its catchments in Tinderet has been a steady one over
the decades shown by the shape of the flow duration curves (FDC) in Figure 2.6.3.3, which may imply that the catchment is resilient to the changing land uses including conversion of forests into agricultural land. A justification for this may be the fact that the forests were mainly cleared to create tea farms whose water
1973
1986
1999
2009

39Master Plan for Water Catchment Areas
ENVIRONMENTAL STATUS, LAND USE AND BIODIVERSITY
Figure 2.6.2.4 Changes in land cover types in Wanjohi sub-catchment (1973-2009)
catchment conservation capacity may be equal to that of forests.
2.6.4 Kinale Catchment AreaKinale sub-catchment derives its waters from the Kikuyu escarpment and predominantly supports agriculture – 75% of the land use activities. The natural forest, which has an area of less than 30% of the total catchment area, is under threat from the ongoing rapid urbanisation. The changes in the land cover are indicated in Figures 2.6.4.1 and 2.6.4.2 for the period 1986 to 2009.
The sub-catchment and those in the surroundings – majority of which constitute upper Athi and Tana Rivers – have had their indigenous forest and wetland vegetation replaced with tea plantations and rainfed subsistence food crops. In addition, the downstream water use for irrigation, domestic and industry has steadily increased consistent with Kenya’s population growth. A historical analysis shows that in 1940, about 50% of the watershed area was under natural forest cover but this decreased to 43% by 1948 and 30% by 1965. From 1940 to 1947, deforestation was undertaken mainly for agricultural purposes including shifting cultivation, home gardens, and large-scale tea plantations. The large-scale (more than 50 ha) tea plantations by the British planters in Crown lands (i.e. lands vested in the government during British rule) prompted the migration of people from the downstream areas to supply labour.
Between 1948 and 1964, tea smallholdings (varying from less than 1 to 5 ha) had mainly replaced the forest, particularly at steep headwater areas, and tea production supplanted other land uses such as shifting cultivation. The major factors for the expansion of tea smallholdings were population pressure resulting mainly from migratory labour, the tea subsidy scheme made available to smallholders, the introduction of high yielding clonal tea, and the allocation of smallholdings to farmers by the Government. Indeed, the suitability of the
existing climate for tea assured farmers of a year-round income exceeding that of other agricultural crops. The changes associated with these land use transformations coupled with the reduction in forest cover from 50 to 30% between 1940 and 1964 was the generation of increased runoff.
An analysis of daily stream flow data from the Ndarugu River, located in the Kinale sub-catchments, from 1943 to 2002 shows that mean flow has been 1.79m3/s and the median 1.02m3/s. The decreasing linear trend for baseflows is noticeable, having reduced by 14%, while flood flow has increased by 23%. (Figure 2.6.4.3) Though the conversion of forestland into urban areas seems not have had significant impacts on mean flows, it has nevertheless had a significant impact on both minimal and maximal flows.
The effects of the intensification of extreme events (drought and flooding) in the country due to land cover degradation are well documented (e.g. Mogaka et al., 2006), for example the 1997/98 El Niño event is estimated to have cost Kes. 70 billion while the following La Niña drought is said to have cost at least Kes. 220 billion.
2.6.5 The Cherangany CatchmentThe western slopes of the Cherangany support tributaries that feed into the River Nzoia; here the

40 Master Plan for Water Catchment Areas
Figure 2.6.3.2 Changes in land cover types in Tinderet sub-catchment (1986-2009)
ENVIRONMENTAL STATUS, LAND USE AND BIODIVERSITY
Figure 2.6.3.1 Changes in land cover types in Tinderet sub-catchment (1986-2009)
1986
2009
1999

41Master Plan for Water Catchment Areas
ENVIRONMENTAL STATUS, LAND USE AND BIODIVERSITY
Figure 2.6.3.3 Decadal flow duration curves for river Nyando compared for 60s to 90s
Figure 2.6.4.1 Changes in land cover types in Kinale sub-catchment (1986-2009)
Kinale 1986 Kinale 1989 Kinale 2009

42 Master Plan for Water Catchment Areas
ENVIRONMENTAL STATUS, LAND USE AND BIODIVERSITY
land-use practices include intensive and subsistence agriculture and livestock farming but in the Upper part of West Pokot and Kerio Valley nomadic pastoralism thrives. The threats to the catchment include encroachment, high water use, illegal logging, charcoal burning, firewood collection, illegal grazing, cultivation and climate change effects. Figures 2.6.5.1 and 2.6.5.2 illustrate that from 1973 to 2009, cropland nearly doubled, increasing from 49,950 to 99,800 Ha at the expense of the natural forest, which reduced from 46,450 to 23,850 Ha.The Frequency Duration Curve for River Nzoia did not show any significant variation over decades:
Figure 2.6.4.2 Changes in land cover types in Kinale sub-catchment (1986-2009)
Figure 2.6.4.3 Trends in base flow (80% probability of exceedance) of Ndarugu River
maximal flows in the 50s were a few hundred m3s-1 less than in the later decades particularly the 70s. The decay in flow from maxima to minima was steady and more towards linearity than those occurring in later decades. Those from the 70s to the 90s were of logarithmic decay, which reflects a condition of the catchment in which flows cannot retain water for slow release as was the case in the 50s and 60s. However, Githui (2008) has shown that the land use and land cover changes during 1973–2001 have contributed to a considerable increase in runoff and this is further supported by Khan et al, (2011) who show that there

43Master Plan for Water Catchment Areas
ENVIRONMENTAL STATUS, LAND USE AND BIODIVERSITY
Figure 2.6.5.1 Changes detected in land cover types in western slopes of Cherangany (1973-2009)
1973
1986
1999
2009
were more years with high peak discharges after the 90s even with relatively less precipitation.
Wuoroya sub-catchment traversing Butere and Siaya counties and measuring 300 km2 constitutes part of the 8-10 sub-catchments on the lower Nzoia Catchment. Data observed at station 1EG03 (Figure
2.6.5.3) from 1974 to 2000 showed base flow to have decreased by 6% and flood flow increased by 21% (Figure 2.6.5.4). The observation that base flow change is less significant than flood flow may be explained by the activities that have occurred in the sub-catchment. Though the area’s population growth is one of the fastest in the country and therefore

44 Master Plan for Water Catchment Areas
ENVIRONMENTAL STATUS, LAND USE AND BIODIVERSITY
water abstraction should have grown at the same rate, the extent to which base flow abstraction has decreased is the least amongst all sub-catchments used in this case studies. The area enjoys good rainfall well distributed throughout the year and the area’s geology favours the occurrence of springs but with the hardening of the surface for multiple roads used to ferry sugar cane - the predominant crop in the region – and construction of dwelling structures, the flood flow has increased steeply. Consequently, there has been an increase in the runoff coefficient, which means any storm translates into peak discharges in a short time.
2.6.6 Njoro Sub-CatchmentThe changes in land cover and flows recorded in the Njoro sub-catchment – the main source of water for Lake Nakuru – are indicated in Figures 2.6.6.1, 2.6.6.2, 2.6.6.3 and 2.6.6.4. There has been a decline in forest cover against a rise in agricultural area from 1973 to 2009, partly due to the excision of about 35,000 Ha off East Mau Forest block for conversion into a settlement area in 2001. Okelo and Ussenge (2009) note that the catchment’s once forested areas have been replaced by fragmented landscape composed of remnant forest patches, advanced and emerging secondary vegetation, grassland, tree plantations and highly compacted surfaces including roads, paths and housing units. Apart from reducing forest area, Kinyanjui (2011) further demonstrated that there has been a decline in vegetation health and density
Figure 2.6.5.2 Changes in land cover types in Cherangany (1973-2009)
in the last decade. Using the Normalised Difference Vegetation Index (NDVI) data recorded at 10 days interval from 1999 to 2009 (Figure 2.34), it was discovered that the vegetation health and density of the East Mau Forest was decreasing gradually.
The consequence of forest clearance has been that surface runoff is highest on open land and least on indigenous forestland. The reduction in dry season streams is attributed to increased water use upstream of Njoro town and the upcoming evergreen eucalyptus plantations in which soil evaporation and stream flow have been modelled to be lower than in existing natural vegetation (Alavi and Ong, 2004). Dry season stream flow in this sub-catchment showed a reduction of 11% over the period 1943-1998 (Figure 2.35). Like sub-catchments across the floor of the Rift valley and in the west of the Aberdares, the sub-catchment has similar rainfall amounts. Geta Forest Station in the Aberdares (1,195mm) is similar to the Nessuit Forest Station in Mau (1,025mm).
2.6.7 Mt. Kenya North Water CatchmentMt. Kenya catchment area has a radial drainage system which illustrates its richness as a catchment area for the Tana and Ewaso Ng’iro drainage systems. The main land-use practices in the area are intensive agriculture and tourism – there is a National Park and several tourist hotels and lodges within the catchment area, which are significant sources of revenue. The threats to the catchment include

45Master Plan for Water Catchment Areas
ENVIRONMENTAL STATUS, LAND USE AND BIODIVERSITY
Figure 2.6.5.3 Trendline for base flow for Wuoroya catchment (station 1EG03) (1974-2000)
Figure 2.6.5.4 Trendline for flood flow for Wuoroya catchment (Station 1EG03) (1974-2000)
Figure 2.6.5.5 Position of 1EG03 in Wuoroya sub-catchment in Butere and Siaya counties

46 Master Plan for Water Catchment Areas
ENVIRONMENTAL STATUS, LAND USE AND BIODIVERSITY
encroachment of the forest, illegal logging, charcoal burning, collection of firewood, illegal grazing and cultivation, and excessive use of water for irrigation, flower farming and fish farming activities.
The analysis of land cover change showed evidence of decreasing forest cover on Mt. Kenya over the last 3 decades since 1973, as the Mt. Kenya North catchment area continues to be dominated by agricultural areas (Figure 2.6.7.1).
Figure 2.6.6.1 Changes in land use in Njoro sub-catchment (1973-2009)
1973
1986
1999
2009

47Master Plan for Water Catchment Areas
ENVIRONMENTAL STATUS, LAND USE AND BIODIVERSITY
Figure 2.6.6.2 Changes in land cover types in Njoro sub-catchment (1973-2009)
Figure 2.6.6.3 A decadal trend of vegetation health and density in East Mau
Figure 2.6.5.4 Trendline for flood flow for Wuoroya catchment (Station 1EG03) (1974-2000)
(Source: DRSRS)

48 Master Plan for Water Catchment Areas
Analyses of stream flow at station 5BE21 of the Likii sub-catchment – which mostly falls under the heavily degraded gazetted forest (KWS, 1999) in Mt. Kenya North – showed that overall flows were steady over the 5 decades of observations (Figure 2.6.7.3): baseflows fell by 49% and flood flow decreased by 23%. Ngigi et al., (2008) noted a reduction in baseflows at Archer’s Post and related this to the semi-arid savannah grasslands downstream. In an effort to improve land production, agroforestry has been applied to lands previously under shrubs with the growth of evergreen Grevillea spp (Muthuri et al., 2004). This has improved water use efficiency by reducing the unproductive components of the water balance, specifically runoff, soil evaporation and drainage, but it also said to have reduced stream flow.
ENVIRONMENTAL STATUS, LAND USE AND BIODIVERSITY
In this catchment, it has been demonstrated that forest plantations characterised by evergeen canopies and deep root systems have high potential for reducing stream flow in catchments relative to the short seasonal indigenous vegetation (Dye and Bosch, 2000). However, Scott and Lesch, (1997) observed stream flow to have completely dried up by the ninth year after planting with Eucalyptus grandis in catchments previously under savannah vegetation. Irrigated and rainfed crop production is rapidly expanding with most of the irrigation supplies being obtained illegally. Indeed, the abstraction of Likii waters is estimated to be 70% at the upper catchment and about 60% on the lower mountain slopes and adjoining savannah areas (Gikonyo, 1998; Gichuki et al., 1998). Based on water flow data from the neighbouring Naro Moru River, it has been demonstrated that the over-abstraction is mainly to
Figure 2.6.7.1 Changes in land cover in Mt. Kenya North catchment area (1976-2009)
1973
1986
1999
2009

49Master Plan for Water Catchment Areas
ENVIRONMENTAL STATUS, LAND USE AND BIODIVERSITY
Figure 2.6.7.2 Changes in land cover in Mt. Kenya North catchment area (1976-2009)
irrigate horticultural crops, and that the number of abstractors increased fourfold in a period of 10 years (Ngigi et al., 2008).
2.6.8 Mt. Kenya South Catchment AreaMt. Kenya South Catchment area is the main source of water for River Tana, and has important rivers including River Thiba, which is one of the largest rivers supplying flows to Masinga Dam. With the catchment dominated by agricultural lands (Figure 2.6.8.1), the forest cover has gradually decreased since the 70s. The mean flows observed from station 4DA01 along River Thiba have been decreasing since 1950s (Figure 2.6.8.3). Statistical summaries for this river include a mean flow of 6.15m3/s, a median flow of 3.38m3/s, a minimum flow of 0.002m3/s, and maximal flow of 84.29m3/s.
2.6.9 Taita Sub-CatchmentThe Taita Hills in Southwest Kenya are Precambrian mountain ranges made up of three massifs namely Dabida northwest of Voi, Sagalla directly south of Voi and separated from the rest of the hills by the Voi River, and Kasigau to the northeast of this range and near the Tanzanian border. The Dabida massif, the main body of the hills, is the largest and tallest of the three with an altitude of 2,228m a.s.l. at its
highest peak, Vuria; other peaks include Iyale, Wesu, and Susu. The Hills, which cover an area of 1,000km2, form the northernmost part of the Eastern Arc Mountains of Tanzania and Malawi, and are isolated from other mountainous areas by the vast Tsavo plains. These mountainous areas are Shimba Hills to the southeast, Pare and Usambara Mountains to the south, Mt. Kilimanjaro to the southwest, Ngulia and Chyulu Hills to the west and the Kenyan highlands to northwest.The hills are known for their moist forests with a unique fauna and flora: more than 20 endemic species of African violets such as Saintpaulia teitensis occur exclusively in this region, which is known for its endemic bird species including the Taita Thrush (Turdus helleri) and Taita Apalis (Apalis fascigularis). First discovered in the Taita Hills, the Taita Falcon (Falco fasciinucha) and the Taita Fiscal (Lanius dorsalis) are known to occur elsewhere while the amphibian genus Boulengerula can only be found in these hills, which are also a habitat for the critically endangered worm-like amphibian, Sagala Caecilian (Boulengerula niedeni). In order to protect the region from severe logging, as has been the case in the past, the remaining indigenous forest is now part of a nature reserve where consumptive use is prohibited.

50 Master Plan for Water Catchment Areas
ENVIRONMENTAL STATUS, LAND USE AND BIODIVERSITY
Figure 2.6.7.3 A decreasing base flow for Likii sub-catchment (1968-2006)
Figure 2.6.7.4 Position of stream flow determination (5BE21) in Likii sub-catchment
There are two rainy seasons in the area (March-May/June and October-December) recording a mean annual rainfall ranging from 500mm in the lowlands to over 1,500mm in the upper mountain zone. The population of Taita-Taveta district has increased, as has the land use in Taita Hills (in favour of intensive agriculture) and on the foothills and plains surrounding the hills (in favour of extensive agriculture and grazing). The growing population and resultant scarcity of available land have contributed to growing pressure in the lowlands and urban centres and caused dynamic changes in the land use patterns, leading to serious land degradation from
deforestation, soil erosion, lowered water tables. Figures 2.6.9.1 and 2.6.9.2 show an analysis of the vegetation changes, which indicate that grasslands occupy the largest area.
2.6.10 Mt. Kulal Sub-CatchmentMount Kulal (2,285m a.s.l.) is an extinct volcano – located in northern Kenya, east of Lake Turkana and the town of Loiyangalani – that has a deep crater, covered with rain and mist forest at its summit. The mountain, one of Kenya’s six Man and the Biosphere (MAB) reserves having been designated thus in 1979,

51Master Plan for Water Catchment Areas
ENVIRONMENTAL STATUS, LAND USE AND BIODIVERSITY
Figure 2.6.8.1 Changes in land use in Mt. Kenya South catchment area (1976-2009)
1976
1999
1989
2009
Figure 2.6.8.2 Changes in land cover in Mt. Kenya South catchment area (1976-2009)

52 Master Plan for Water Catchment Areas
ENVIRONMENTAL STATUS, LAND USE AND BIODIVERSITY
Figure 2.6.8.3 The position of 4DA01 in Thiba sub-catchment (near Koroma)
Figure 2.6.8.4 Flow trend line for Thiba River (station 4DA01) (1950-1996)
Plate 2.6.8.1 Farming in the steep hills of Murang’a (Source: DRSRS)

53Master Plan for Water Catchment Areas
ENVIRONMENTAL STATUS, LAND USE AND BIODIVERSITY
is inhabited by the Turkana, Samburu, Rendille, El Molo and Gabbra people who are predominantly pastoralists. Apart from livestock rearing and fishing, the main human livelihoods are dependent on the montane and sub-montane forests of Mount Kulal for fuelwood, building materials and the construction of
livestock enclosures. Forest regeneration is hampered by the removal of the understory in several areas while grass fires, lit by pastoralists, erode the forest edge.
Figure 2.6.9.1 Changes in land cover types in Taita sub-catchment (1975-2009)
1975
1999
1989
2009
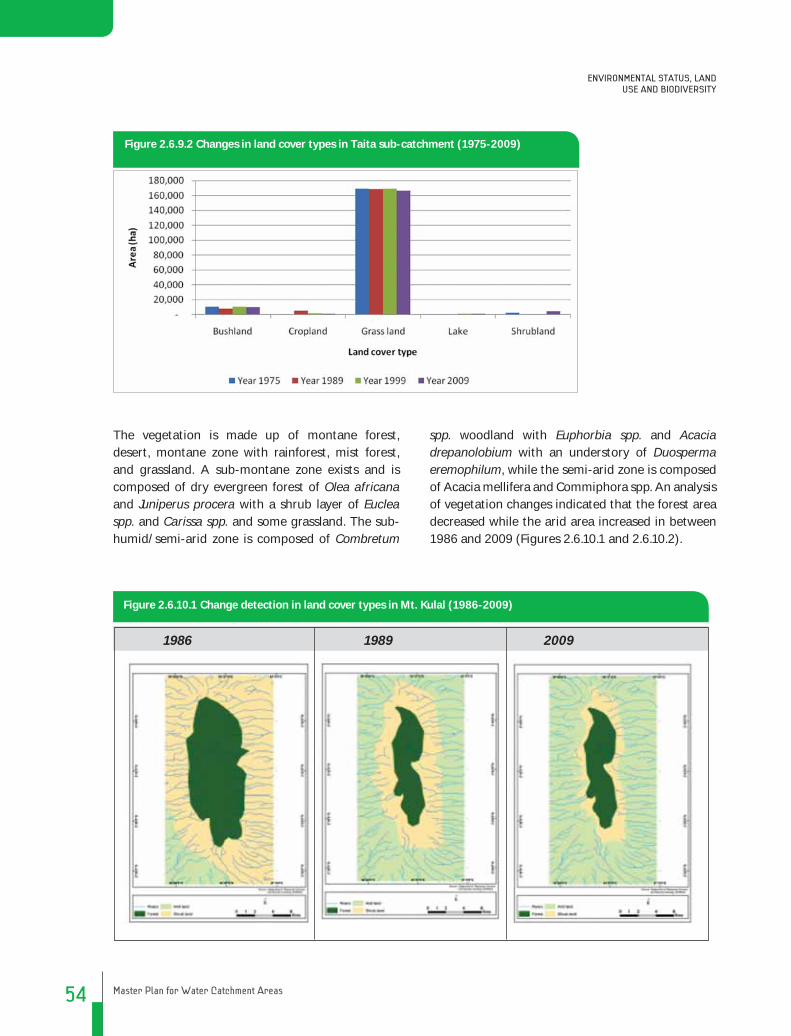
54 Master Plan for Water Catchment Areas
ENVIRONMENTAL STATUS, LAND USE AND BIODIVERSITY
Figure 2.6.9.2 Changes in land cover types in Taita sub-catchment (1975-2009)
The vegetation is made up of montane forest, desert, montane zone with rainforest, mist forest, and grassland. A sub-montane zone exists and is composed of dry evergreen forest of Olea africana and Juniperus procera with a shrub layer of Euclea spp. and Carissa spp. and some grassland. The sub-humid/semi-arid zone is composed of Combretum
spp. woodland with Euphorbia spp. and Acacia drepanolobium with an understory of Duosperma eremophilum, while the semi-arid zone is composed of Acacia mellifera and Commiphora spp. An analysis of vegetation changes indicated that the forest area decreased while the arid area increased in between 1986 and 2009 (Figures 2.6.10.1 and 2.6.10.2).
Figure 2.6.10.1 Change detection in land cover types in Mt. Kulal (1986-2009)
1986 1989 2009

55Master Plan for Water Catchment Areas
ENVIRONMENTAL STATUS, LAND USE AND BIODIVERSITY
Figure 2.6.10.2 Changes in vegetation in Mt. Kulal (1986-2009)
2.6.11 Shella Sand Dunes Water Catchment Area
The Shella Sand Dunes Catchment in Lamu Island forms a unique oasis of fresh water catchment surrounded by salty waters (Plates 2.6.11.1).
The Lamu/Shella sand dunes are located on the southern end of Lamu Island, running from Kizingoni in the southwestern tip of Ras Singue Island to the southeastern tip just outside the Shella village. They stretch for 12km, cover an approximate area of 958 Ha and rise to a height of approximately 60m a.s.l. forming a continuous ridge along the Lamu bay that acts as protection against the strong open sea winds. This was evident during the Tsunami episode of 2006 that substantially affected the East African coastline with the exception of the Lamu harbour. Since the 1960’s the National Museums of Kenya has been actively involved in the development of the Lamu Old Town as a cultural heritage site owing to its century’s old urban landscape, its unique vernacular architecture and an unperturbed traditional way of life.
Two of the complimentary buffer zone areas which are part of the natural landscape and from which the town draws both its water resource and its beauty are the Lamu water catchment (Lamu/Shella
sand dunes) and the Ras Kitau-Manda skyline. The dunes, gazetted (Gazette Notice No. 1933 of March 2002) as a protected site under the Antiquities and Monuments Act (Cap 215), continue to maintain that status under the provisions of the National Museums and Heritage Act 2006. The Ras Kitau-Manda skyline were gazetted as complimentary areas to the buffer zone of the Lamu World Heritage Site by the National Museums of Kenya (Gazette Notice No. 3499 of April 2008).
One of the major reasons for Lamu’s 700 years of continuous habitation lies in its relatively vast resources of potable water, the most prominent of which is the Shella sand dune regime that acts as a giant sponge capable of absorbing and retaining rainwater, and as a membrane preventing seawater from mixing with underground water aquifers. These established facts are expounded in a report Ground Water Resources Assessment of Lamu Island and the Hindi – Mokowe Areas of Lamu District (1991) prepared by Coast ASAL Development Project that was under then Ministry of Reclamation and Development of Arid and Semi-Arid Areas and Wastelands.
Between 1983 and 2000, several technical and scientific studies were conducted in the sand dune area to assess the quality and quantity of the water aquifers located within the sand dune

56 Master Plan for Water Catchment Areas
ENVIRONMENTAL STATUS, LAND USE AND BIODIVERSITY
Plate 2.6.11.1 Shella Dunes catchment
Degraded Shella catchment and associated human encroachment
A few containers of precious fresh water ferried on a mass of salty water from Lamu to Mada Island (Source: NMK)
regime. Inhabitants of Lamu Island solely depend on Shella catchment for domestic water, as do those from Mada Island, who ‘import’ fresh water from Lamu as illustrated on Plate 2.6.11.1. Despite the significance as a water catchment area, the state of conservation of the Shella sand dune regime is under threat from human activities that go contrary to the area’s established conservation policy. Continued degradation of the catchment largely stems from the fact that inhabitants of the Shella catchment are wealthy individuals who can afford to desalinise water, a privilege not shared with the downstream inhabitants of Lamu town. In recognition of the fact that the sand dune holds the key to Lamu’s future as a habitable island, local communities consulted during field visits relating to the development of this Plan strongly supported the need to protect and conserve Shella Water Catchment.
In order to improve the conservation and management of sand dunes, an assessment of the quantity and quality of water aquifers located within the sand dune regime needs to be conducted to document the significance of the sand dunes as water catchment areas and identify vulnerable dunes for special attention. It is imperative that a community-based approach be employed in the management and reclamation of all degraded sand dunes, and innovative approaches be replicated from other countries that have successfully managed their dunes.
2.7 ENVIRONMENTAL STATUS OF TRANSBOUNDARY WATER CATCHMENTS
One of the complex water resource crises that Kenya faces stems from the fact that more than half of her rivers, lakes and aquifers – including Lakes Victoria and Jipe and Rivers Mara, Daua, Malaba, Malakisi, Sio and Lumi – are shared with neighbouring countries. The environmental status of Lake Victoria may be described by the water level and quality, land use and vegetation cover in the catchment, of which the water level is dependent on seasonal inflows and decadal trends in interannual precipitation over the lake. The water level rose by 0.98m during the 1950-2000 period (LVEMP, 2001) but the surface inflows declined during the 2004-2006 period as the lake witnessed consecutive periods of drought and increasing the evaporation rate (Kyosingira et al., 2011). In terms of water quality, evidence has been presented of increasing algal blooms (Ochumba and Kibaara, 1989, Mugidde, 1993), massive fish kills (Ochumba and Kibaara (1989) and declining oxygen concentrations in the deeper water of the lake (Hecky and Bugenyi, 1992).
Land surrounding the lake includes that of transboundary Mara in which agricultural land has increased by 55% between 1986 and 2000 through the combined encroachment of forests and savannah grasslands – these have reduced by 23% and 24%

57Master Plan for Water Catchment Areas
ENVIRONMENTAL STATUS, LAND USE AND BIODIVERSITY
respectively (Mati et al., 2005). In the Sio Malaba Malakisi catchment, there is evidence of continuing land degradation and loss of soil fertility (Barasa et al., 2010), deforestation and absence of reforestation activities (Ogutu et al, 2005) and the use of biomass as the main source of energy (Scheren, 1995). Other evidence showing the environmental status of Lake Victoria transboundary sub-catchment include the lack of clean water for household use, insufficient water for grazing, exploitation and degradation of wetlands based on the perception that they are public property available to all.
2.8 WATER CATCHMENT CONSERVATION AND CLIMATE CHANGE
There is growing scientific consensus and evidence that global climate change is taking place and will influence the future of the global economy, ecosystems and livelihoods of the rich and poor
(IPCC, 2007). Temperatures in East Africa 30,000 to 21,000 years ago are reported to have been 2 to 4.1°C lower than present, which is an indication that global temperatures have been rising. Several theories provide evidence of climate change and variability in East Africa: one associates the rise in Lake Victoria water level in the 20th century with peaks in the 11,000-year sunspot cycle (Stager et al, 2007). Another documented an 11,700-year record of Holocene climate and environmental variability showing that the greatest historically recorded drought occurred 4,000 years ago (Thompson et al., 2002). The studies proposed that if climatological conditions persisted, the remaining ice fields were likely to disappear between 2015 and 2020.
The National Climate Change Response Strategy (GOK, 2010) has presented evidence of climate change in Kenya including increases in minimum temperature by 0.5ºC to 1.0ºC since 1960 for the Western, Northern and Northeastern, Central and Southeastern Districts of Kenya. In addition, there has
Figure 2.7.1 Some transboundary water catchments shared by Kenya and Tanzania

58 Master Plan for Water Catchment Areas
ENVIRONMENTAL STATUS, LAND USE AND BIODIVERSITY
been a notable increase in maximum temperature by 0.5ºC to 1.3ºC since 1960 in the same regions, with the coastal strip experiencing the highest increase by a maximum of 2ºC. These changing temperatures and rainfall will continue to have profound effects on water catchments; Figure 2.7.1 illustrates temperature trends for Mombasa.
2.8.1 Rainfall Variability and its ImpactAn analysis of daily and monthly rainfall for the December-February, March-May, June-August, and September-November seasons since 1960 showed factors that influence rainfall in Kenya (GOK, 2010: National Climate Response Strategy). The analysis indicated that neutral to slightly decreasing trends are manifested in the annual rainfall series over most areas, mainly due to an associated general decline with time of rainfall in the main rainfall season of March-May (the ‘Long Rains’) over most areas.Further, the analysis revealed a general positive trend (increase) in rainfall events of the September to February season, suggesting a tendency for the ‘Short Rains’ (October-December) season to be extending into what is normally the hot and dry
period of January and February over most areas. This may possibly be attributed to more frequent occurrences of El-Niño events occasionally coupled with relatively warmer sea surface temperatures (SSTs) over the western Indian ocean (along the coast of east Africa) and relatively cooler-than-average sea surface temperatures to the east of the Indian Ocean. This sea surface temperature pattern over the Indian Ocean is conducive for enhancing rainfall over the country even in the absence of El-Niño conditions, resulting in heavy rainfall during the ‘Short Rains’ season as was the case in 1961-62 and recently in 2006-07.
Rainfall variability, and extremes such as those of 1961, 1997 and 2009 (GOK, 2010: National Climate Change Response Strategy) have caused extensive loss of life, socioeconomic disruption, damage to infrastructure and ‘shocks’ to livelihood systems (Conway et al., 2005). Indeed, the 1997/98 El Niño floods are estimated to have destroyed and damaged infrastructure with a replacement cost of approximately Kes. 64 billion (Mogaka et al., 2006).
Figure 2.8.1 Temperature trends for Mombasa (1960-2005) (Source: NCCRS)

59Master Plan for Water Catchment Areas
ENVIRONMENTAL STATUS, LAND USE AND BIODIVERSITY
Figure 2.8.1.1 Rainfall trend in Lamu and Garissa over the period 1959-2007 (Source: NCCRS)
2.9 SUMMARY
The status of water catchments discussed in this Chapter gives evidence that the catchments of Kenya have been undergoing degradation in terms of water quantity, quality, availability, hydrological regimes, and biodiversity and ecosystem health. These changes have been exacerbated by increasing human, livestock and wildlife populations in the catchments and the associated increase in demand for developmental resources. Due to their critical significance, the ongoing discussion emphasises the need for conservation and sustainable management to prevent the complete loss of water catchment areas.
In particular, it has been noted that the following problems exist:a. degraded water catchment areasb. land degradation and soil erosion in water
catchment areasc. poor management of water resourcesd. water insecuritye. poor waste managementf. livelihood insecurity stemming from the
degradation of water catchment areasg. overdependence on biomass energyh. limited involvement of women and youth in water
catchment conservation, which may be a cause for their degradation

60 Master Plan for Water Catchment Areas
ENVIRONMENTAL STATUS, LAND USE AND BIODIVERSITY

61Master Plan for Water Catchment Areas
3.0 CHAPTER THREE
GOVERNANCE FRAMEWORK FOR WATER CATCHMENT AREAS

62 Master Plan for Water Catchment Areas
3.1 INTRODUCTION
Effective environmental governance at all levels is critical for finding lasting solutions to environmental challenges facing society. The
term governance has been defined in many different ways that vary according to the scope and locus of decision-making power (ECOSOC, 2006). The World Bank, initially defined governance as the exercise of political power to manage a nation’s affairs (World Bank, 1991) but recent developments have shown that governance is much wider than the political realm, and many governance functions in society are beyond the exclusive remit of Governments.
In recent times, the term governance has been used in reference to a set of rules and the institutional arrangements for their implementation and enforcement. According to Ruggie (2004), governance may therefore refer to conducting the public’s business constellation of authoritative rules, institutions and practices for the collective management of affairs. Environmental governance therefore comprises policies, legislations and institutions that shape how humans interact with the environment (Nagai, 2009). Effective environmental governance based on targeted resource efficiency measures is therefore an important aspect of conservation of water catchment areas at various levels. This Chapter highlights the framework for environmental (and in effect water catchment) governance in Kenya.
3.2 INTERNATIONAL AND REGIONAL FRAMEWORKS FOR GOVERNING CATCHMENT AREAS
With Kenya as part of the global community, her framework for governing water catchment areas is influenced by international and regional agreements and treaties, to which she is party. The programme of action for achieving sustainable development, adopted at the United Nations Conference on Environment and Development in Rio in 1992 (Agenda 21, 1992) remains the most comprehensive international policy document on environmental issues. It identifies degradation of water catchment areas as one of the challenges facing the global community and recognises the importance of catchment areas to the availability of freshwater resources.
In addition, it recognises that the long-term development of global freshwater requires holistic management of resources and an appreciation of the interconnectedness of the elements related to freshwater and freshwater quality. To address the problem of availability of quality freshwater resources, the Agenda calls for the rehabilitation, protection and conservation of important water catchment areas. As part of this process, States are required to strengthen administrative and legislative measures to prevent encroachment on existing and potentially usable catchment areas.
In appreciation of the fact that forests are essential water catchment areas, several international conventions address forest governance including two conventions adopted in Rio in 1992 – the Convention on Biological Diversity (CBD) and United Nations Framework Convention on Climate
GOVERNANCE FRAMEWORK FOR WATER CATCHMENT AREAS

63Master Plan for Water Catchment Areas
GOVERNANCE FRAMEWORK FOR WATER CATCHMENT AREAS
Change (UNFCCC). The objective of the CBD is the conservation of biological diversity, sustainable use of its components, and fair and equitable sharing of the benefits arising from the utilisation of genetic resources. Through its provisions and required action, the Convention seeks to conserve forests and ensure their existence as water catchment areas.
The UNFCCC and the Kyoto Protocol recognise the importance of conserving forests as carbon sinks that mitigate the effects of pollutants that contribute to climate change. Further, the United Nations Convention to Combat Desertification (UNCCD) recognises the importance of forests in combating desertification and drought, and calls for their conservation. In addition, other Conventions like the Ramsar Convention on Wetlands, the World Heritage Convention and the Convention on International Trade in Endangered Species of Wild Fauna and Flora also address the protection and conservation of forests.
Kenya is a member of the African Union and the East African Community (EAC), both of which have agreements relevant to environmental governance that provide a regional framework for governing national and transboundary water catchment areas. In 2003, Members of the African Union adopted the Revised African Convention on the Conservation of Nature and Natural Resources to replace the 1968 Algiers Convention. The Convention addresses the needs for the conservation and sustainable utilisation of water resources and urges states to ensure integrated management of water resources and the conservation of forests and other catchment areas.
Similarly, Chapter 19 of the EAC Treaty addresses environment and natural resources, in recognition of the fact that environmental degradation and the depletion of natural resources negatively affect access to a clean and healthy environment, which is a prerequisite for sustainable development. Under the Treaty, Partner States commit to undertake action to address environmental degradation through environmental management, conservation of water resources, sustainable utilisation of natural resources
and protection of critical ecosystems. In addition, the EAC has developed a Protocol on Environment and Natural Resource Management, which calls for the protection of mountain ecosystems as critical water catchment areas. Further, the EAC has developed guidelines for undertaking transboundary environmental assessment of shared ecosystems including water catchment areas. These provide international and regional legal and policy frameworks for managing water catchment areas in Kenya.
3.3 THE IMPERATIVES OF THE CONSTITUTION OF KENYA 2010
The Constitution of Kenya recognises and addresses issues of environmental governance, giving the environment and its management due prominence in the preamble, which as a rule provides the background within which the specific constitutional provisions are to be interpreted and applied. The preamble to the Constitution notes that Kenya’s environment – and by implication her water catchment areas – is her heritage and should be sustained for the benefit of future generations. As catchment areas serve critical functions in maintaining the country’s water supply, it is important that they are conserved to guarantee the availability of quality water for both present and future generations.
This imperative is underscored by the provisions of Article 10 on national values and principles of governance that are expected to guide the process of implementing the Constitution, laws and public policies. As this Master Plan now forms part of Kenya’s public environmental policies, its development and implementation must help the country to meet the requirements of the national values and principles of governance. In the efforts to conserve and sustainably manage Kenya’s water catchment areas, the prerequisites of sustainable development must be adhered to and delivered on. Appreciating the key role played by water in the country’s development,

64 Master Plan for Water Catchment Areas
GOVERNANCE FRAMEWORK FOR WATER CATCHMENT AREAS
this Master Plan provides a framework for sustainably conserving water catchment areas thereby meeting the requirements of sustainable development.
The conservation of water catchment areas focuses not only on water resources but also on the larger ecosystem within which the water exists, and similarly the specific focus of water catchment governance is on water and the context within which it exists including the frameworks for land, forests and biodiversity management. The Constitution addresses each of these issues, and these provisions have a bearing on the governance of water catchment areas. The Bill of Rights in the Constitution recognises the environment as a fundamental right, an inextricable part of the country’s democratic framework with a bearing on socioeconomic and cultural policies.
Indeed, Article 42 of the Constitution guarantees all people the right to a clean and healthy environment, a right that places an obligation on the State and all Kenyan citizens to protect the environment for the benefit of current and future generations. In addition, it is the duty of all citizens to cooperate with all organs of the State and with other persons to protect and conserve the environment and ensure sustainable development and use of natural resources. This brings to the fore the need for enhancing public participation in the conservation of water catchment areas, a task that the State is constitutionally obligated to undertake. Accordingly, this Master Plan proposes deliberate measures to be undertaken by the State to improve the levels of citizen participation in the protection and conservation of water catchment areas.
Other constitutional obligations placed on the State – and for which this Master Plan provides a policy and action framework – in delivering the right to a clean and healthy environment include:a. ensuring sustainable exploitation, utilisation,
management and conservation of the environment and natural resources, and equitable sharing of benefits that arise thereof
b. protecting genetic resources and biological diversity
c. promoting the achievement and maintenance of a tree cover of at least 10% of Kenya’s land area
d. utilising the environment and natural resources for the benefit of the people of Kenya
e. establishing systems of environmental impact assessment, audit and monitoring of the environment
f. protecting and enhancing intellectual property in, and indigenous knowledge of, biodiversity and the genetic resources of communities
g. eliminate processes and activities that endanger and degrade the environment.
The Constitution has changed the nature of governance in Kenya to a devolved government, and this means that policies will be implemented at the national and county level. Devolution is geared towards promoting democracy and accountability, promoting the involvement of people in their governance, enhancing equitable sharing of resources, and facilitating decentralisation of state organs and their functions and services. In accordance with the division of functions between national and county governments, as detailed in the Fourth Schedule of the Constitution, this Master Plan proposes avenues for the conservation of water catchment areas at national and county levels. These focus on enhancing conservation through proximate and accessible institutions and with the active participation of citizens at local levels.
A critical consideration in the conservation and sustainable management of water catchment areas is land and the laws regulating its ownership and use, in appreciation of the principal role of land in the livelihoods of most Kenyans, its nexus to the conservation of all natural resources and its impact on the availability and supply of water. Nevertheless, a key hindrance to the conservation of water catchment areas has been laws on land tenure and use, a conclusion that is supported by the findings of a Government-appointed taskforce on the conservation of the Mau Forest. Therefore, the constitutional provisions on land, the National Land Policy and the enactment of laws on land
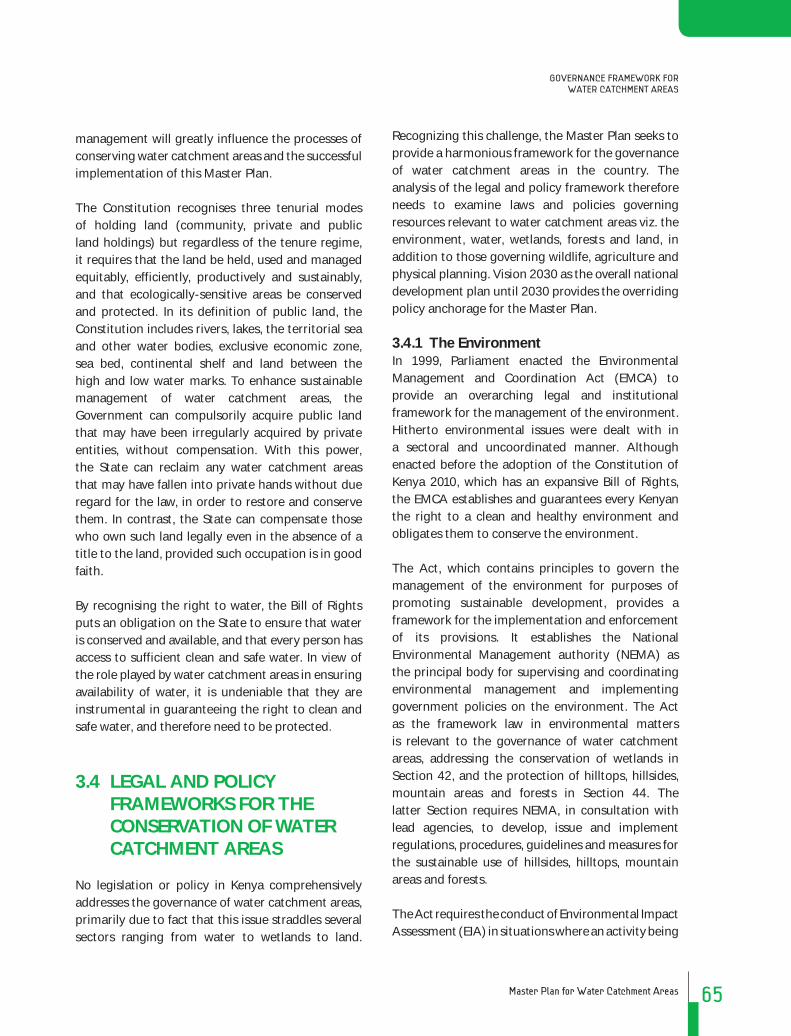
65Master Plan for Water Catchment Areas
GOVERNANCE FRAMEWORK FOR WATER CATCHMENT AREAS
management will greatly influence the processes of conserving water catchment areas and the successful implementation of this Master Plan.
The Constitution recognises three tenurial modes of holding land (community, private and public land holdings) but regardless of the tenure regime, it requires that the land be held, used and managed equitably, efficiently, productively and sustainably, and that ecologically-sensitive areas be conserved and protected. In its definition of public land, the Constitution includes rivers, lakes, the territorial sea and other water bodies, exclusive economic zone, sea bed, continental shelf and land between the high and low water marks. To enhance sustainable management of water catchment areas, the Government can compulsorily acquire public land that may have been irregularly acquired by private entities, without compensation. With this power, the State can reclaim any water catchment areas that may have fallen into private hands without due regard for the law, in order to restore and conserve them. In contrast, the State can compensate those who own such land legally even in the absence of a title to the land, provided such occupation is in good faith.
By recognising the right to water, the Bill of Rights puts an obligation on the State to ensure that water is conserved and available, and that every person has access to sufficient clean and safe water. In view of the role played by water catchment areas in ensuring availability of water, it is undeniable that they are instrumental in guaranteeing the right to clean and safe water, and therefore need to be protected.
3.4 LEGAL AND POLICY FRAMEWORKS FOR THE CONSERVATION OF WATER CATCHMENT AREAS
No legislation or policy in Kenya comprehensively addresses the governance of water catchment areas, primarily due to fact that this issue straddles several sectors ranging from water to wetlands to land.
Recognizing this challenge, the Master Plan seeks to provide a harmonious framework for the governance of water catchment areas in the country. The analysis of the legal and policy framework therefore needs to examine laws and policies governing resources relevant to water catchment areas viz. the environment, water, wetlands, forests and land, in addition to those governing wildlife, agriculture and physical planning. Vision 2030 as the overall national development plan until 2030 provides the overriding policy anchorage for the Master Plan.
3.4.1 The EnvironmentIn 1999, Parliament enacted the Environmental Management and Coordination Act (EMCA) to provide an overarching legal and institutional framework for the management of the environment. Hitherto environmental issues were dealt with in a sectoral and uncoordinated manner. Although enacted before the adoption of the Constitution of Kenya 2010, which has an expansive Bill of Rights, the EMCA establishes and guarantees every Kenyan the right to a clean and healthy environment and obligates them to conserve the environment.
The Act, which contains principles to govern the management of the environment for purposes of promoting sustainable development, provides a framework for the implementation and enforcement of its provisions. It establishes the National Environmental Management authority (NEMA) as the principal body for supervising and coordinating environmental management and implementing government policies on the environment. The Act as the framework law in environmental matters is relevant to the governance of water catchment areas, addressing the conservation of wetlands in Section 42, and the protection of hilltops, hillsides, mountain areas and forests in Section 44. The latter Section requires NEMA, in consultation with lead agencies, to develop, issue and implement regulations, procedures, guidelines and measures for the sustainable use of hillsides, hilltops, mountain areas and forests.
The Act requires the conduct of Environmental Impact Assessment (EIA) in situations where an activity being

66 Master Plan for Water Catchment Areas
GOVERNANCE FRAMEWORK FOR WATER CATCHMENT AREAS
undertaken is out of character with its surroundings, or involves the construction of any structure of a scale not in keeping with its surrounding and major changes in land use. The principal objective of EIA is to ensure that environmental considerations are incorporated into the planning, decision-making and implementation processes of development activities. It assists in preventing, or where that is not possible, minimizing adverse impacts and maximizing the positive effects of any given activity, essentially evaluating the economic costs and benefits of individual environmental projects. By demanding the conduct of EIA, the Act seeks to ensure that water catchment areas are protected and activities of the nature described can only be carried out once it has been determined that they will not have adverse effects on the water catchment area, and after sufficient corrective measures have been undertaken.
3.4.2 Water ResourcesThe governance of water catchment areas is undertaken principally to guarantee the availability and supply of water. The legal and policy framework for the water sector has undergone fundamental reforms over the last decade, first in Sessional Paper No. 1 of 1999 on Water Resource Management and Development (Water Policy, 1999). The Policy’s main goal is to enhance sustainable and integrated development and management of the water sector through the:i. preservation, conservation, and protection of
water resources and their sustainable, rational and economical allocation
ii. supply of sufficient quantities of good quality water to meet various needs including poverty alleviation while ensuring safe disposal of wastewater and environmental protection
iii. establishment of an efficient and effective institutional framework and
iv. development of a sound and sustainable financing system for effective water resources management, water supply and sanitation development.
The Policy also incorporates the principles of Integrated Water Resource Management (IWRM) as fundamental to the sustainable management of water resources in Kenya.
The Policy set the stage for reforms geared towards enhancing institutional responsibility and coordination, efficiency, sustainability and public participation, and provided the basis for the enactment of the Water Act (Cap 372) of 2002, which made several reforms to the water sector revolving around four themes namely:i. separation of management of water resources
from the provision of water servicesii. separation of policy making from day to day
administration and regulationiii. decentralisation of functions to local institutions
andiv. the involvement of nongovernment entities in
the management of water resources and in the provision of water services (Mumma, 2006).
The Act lays out mechanisms for the management, conservation, use and control of water resources and for the regulation of rights to use water and of water supply and sewerage services, setting detailed rules and institutional infrastructure to realize its objectives. It gives the Minister the power to formulate a national Water Resource Management Strategy to set the framework for the management, protection, use, development, conservation and control of water resources in Kenya. Pursuant to the provision of the Water Act, the Minister for Water and Irrigation published the first National Water Resources Management Strategy for the 2007 to 2009 period. Following its expiry, a new strategy has been developed for the 2010 to 2016 period, with key highlights including the recognition of water as a finite and scarce resources, the need for public participation in the management of water resources, and the application of IWRM principles in the management of water resources.
The Strategy reinforces the fact that water resource management in Kenya is undertaken along catchment

67Master Plan for Water Catchment Areas
GOVERNANCE FRAMEWORK FOR WATER CATCHMENT AREAS
or basin boundaries thus justifying the conservation of catchment areas. The Strategy, finalised based on the provisions of the Constitution, points out that water catchment areas are to be held by the national government in trust for the people of Kenya and administered by the National Land Commission. The Strategy seeks to promote integrated approaches to water resources and catchment management using tools such as the Catchment Management Strategies (CMS) that the Act requires to be developed for every catchment area.
The Water Resource Management Authority (WRMA), the principal institution responsible for water resource management, is empowered to gazette a defined area within which rainwater flows into a watercourse as a catchment area. In exercise of this power, WRMA has classified Kenya into six catchment areas namely Lake Victoria North, Lake Victoria South, Athi, Tana, Ewaso Ng’iro and Rift Valley. Section 15 of the Water Act empowers WRMA to develop a CMS for the management, use, development, conservation, protection and control of water resources within each catchment area. Further, WRMA is required to review every CMS from time to time to ensure that each:i. takes into account the class of the water resource
and resource quality objectives of the waterii. is consistent with the national water resources
strategyiii. prescribes principles, objectives, procedures and
institutional arrangements for management within each catchment area
iv. contains water allocation plansv. provides mechanisms and facilities for public
participation in water resource management.
The Water Act prohibits the pollution of water resources and controls the discharge of industrial and municipal effluents into rivers and oceans, and pursuant to these provisions, the Ministry has established technical mechanisms (including laboratory facilities) for monitoring the quality of various water resources in Kenya. As provided for in the Act, the Minister for Water and Irrigation,
upon the recommendation of WRMA, gazetted Water Resource Management Rules 2007, which addresses several issues including water quality and catchment management strategies and rules that give guidelines on water permit acquisition and adherence to conditions and enforcement of the user fee charges. Other water related Acts that impact on the management of water catchment areas are the Fisheries Act, the Irrigation Act, the Continental Shelf Act and the Maritime Zones Act.
3.4.3 WetlandsWetlands are amongst the most important ecosystems on earth (Kusler, 1990), making ecological contributions to the global environment by improving water quality, recharging aquifers, and functioning as storm buffers (Kruchek, 2003). In addition, wetlands control soil erosion and climate stability, and serve as a habitat for a variety of biological diversity thereby providing an important reservoir of genetic material. Therefore, wetlands significantly affect the national economy, in terms of supporting both direct livelihoods and vital ecological functions such as water provision and maintenance of hydrological cycles (Odote, 2010). Sadly, wetlands have not always been accorded the recognition and protection they warrant considering that in the past they have been converted for agricultural and development purposes irrespective of the fragility of the ecosystem.
The adoption in 1971 of the Convention on Wetlands of International Importance, especially as Waterfowl Habitat (Ramsar Convention) marked a turning point in the conservation of wetlands. The Convention, which Kenya acceded to on 05 June 1990, requires contracting parties to conserve and wisely use wetlands, and designate suitable wetlands within the country for inclusion into the list of wetlands of international importance. Further, the parties are required to include wetland conservation considerations into their natural resource planning processes, and this requires a supportive and effective legal and policy framework.
Kenya does not have a national policy on wetlands but a final Draft Wetlands Policy produced in

68 Master Plan for Water Catchment Areas
GOVERNANCE FRAMEWORK FOR WATER CATCHMENT AREAS
2008 following stakeholder consultations that commenced in the early 90s, and which aims to enhance the conservation and wise use of wetlands as well as promote recognition of wetlands as an integral component of the environment. The Policy seeks to strengthen the contribution of wetlands to sustainable development and the improvement of the livelihoods of the Kenyan people at the local and national level. The objectives of the Wetlands Policy are to:i. establish an effective and efficient institutional
and legal framework for integrated management and wise use of wetlands which will provide an enabling environment for the participation of all stakeholders
ii. enhance and maintain functions and values derived from wetlands in order to protect biological diversity and improve livelihood of Kenyans
iii. promote communication, education and public awareness among stakeholders to enhance their appreciation and participation in wetland conservation
iv. carry out demand-driven research on and monitor wetlands to improve scientific information and knowledge base
v. enhance capacity building within relevant institutions and for personnel involved in conservation and management of wetlands
vi. establish a national wetlands information management system and database including tools and packages to targeted groups
vii. promote innovative planning and integrated management approaches towards wetlands conservation and management in Kenya
viii.promote partnership and cooperation at regional and international levels for the management of transboundary wetlands and migratory species.
The Policy identifies the challenges facing wetlands in Kenyan and proposes measures to address those challenges including establishing wetland conservation areas, restoring and rehabilitating degraded wetlands, education and public awareness, and recognizing, protecting and promoting the user
rights of communities living adjacent to wetland resources. Despite the importance of conserving wetlands as water catchment areas, this Policy is yet to be adopted.
Not unlike water catchment areas, no legislation or policy in Kenya comprehensively addresses the governance of wetlands, which is essentially dealt with piecemeal in the EMCA, Physical Planning and the Water Acts (Odote, 2008). Section 42 of the EMCA contains provisions for the protection of wetlands, and empowers the Director General of NEMA to regulate certain activities that cannot be undertaken within a wetland except with the approval of the Director General following an EIA. These activities include:i. erecting, reconstructing, placing, altering,
extending, removing or demolishing any structure or part of any structure in or under a wetland
ii. excavating, drilling, tunnelling or disturbing a wetland
iii. introducing any animal whether alien or indigenous into a wetland
iv. introducing any plant or part of a plant specimen, whether alien or indigenous, dead or alive, into any wetland
v. depositing any substance in a wetland if that substance would or is likely to have adverse environmental effects on the wetland
vi. directing or blocking any wetland from its natural and normal course and
vii. draining of a wetland
In addition, Section 42 gives the Minister for Environment, the powers to declare a wetland as a protected area and impose such restrictions as are necessary to protect a wetland from environmental degradation. In keeping with the powers accorded the Minister to issue orders, regulations and standards for the management of wetlands, the Minister for Environment and Mineral Resources gazetted the Environmental Management and Coordination (Wetlands, River Banks, Lake Shores and Sea Shore Management) Regulations. These Regulations, whose primary objective is to conserve water

69Master Plan for Water Catchment Areas
GOVERNANCE FRAMEWORK FOR WATER CATCHMENT AREAS
catchments and control floods, detail the procedure for declaring a wetland as a protected area and require NEMA, in consultation with lead agencies, to prepare an inventory of wetlands together with the uses permitted in wetlands and the procedures for obtaining permits for such uses. Further, they specifically place a duty on every landowner, occupier or user of land adjacent or contiguous to a wetland to maintain the ecological integrity of a wetland.
3.4.4 ForestsForests have numerous economic, social, cultural and ecological values, as they provide essential goods and services including timber, poles, fuel-wood, medicine and a variety of non-wood products. In addition to playing a critical role in supporting the livelihoods of Kenyans and the national economy, forests serve as habitat for flora and fauna and as water catchment areas. In view of the fact that they support the five water main water towers in Kenya (the Aberdares, Mau Complex, Mt. Elgon, Mount Kenya and Cherangany hills), their conservation and sustenance is critical to the availability of quality water.
The Forest Act was enacted in 2005 following past failures of forest legislation to sustainably manage forest and related products, and upon the realisation that forests play a vital role in the stabilisation of soils and ground water. Naturally, they support agriculture, play a crucial role in protecting water catchments and moderate climate by absorbing greenhouse gases. The Act governs all types of forests whether on publicly (state and local authority) or privately owned land but only public forests – with the exception of community forests – are vested in the State (Section 21). On its part, the Constitution classifies government forests and water catchment areas as public land to be managed by the National Land Commission.
The Forest Act gives the Minister in charge of Forests the authority to declare any land under the jurisdiction of a local authority to be a local authority forest where such land is an important catchment area, a source of water springs, or a fragile environment. However, this authority is
conferred upon the recommendation of the forest conservation committee for the area within which a forest is situated, the local authority and the Board – essentially advocating for the collaborative and participatory management of forests. Indeed, even as the principal responsibility for the management of forests is vested in the Kenya Forest Service, the Act allows the communities adjacent to the forest to participate in their management. To this end, the Act provides for the creation of Community Forest Associations by persons living adjacent to the forest who can then apply to the Director of KFS to participate in the conservation and management of a forest.
In recognition of the importance of forests for sustainable development, the Constitution in Article 69 provides for the State to work towards increasing the country’s forest cover to 10% of the land area of Kenya.
3.4.5 LandAlthough land forms the basis of livelihoods for the majority of the people of Kenya, until 2009, the country did not have a comprehensive and clearly defined National Land Policy. Coupled with numerous, and in certain instances contradictory land laws, the result was a complex yet inadequate land management and administration system that gave rise to low levels of productivity, poverty and conflicts over land and related resources. Specifically it has occasioned the:i. severe land pressure and fragmentation of
landholdings into uneconomic unitsii. deterioration in land quality due to poor land-use
practicesiii. unproductive and speculative land hoardingiv. underutilisation and abandonment of agricultural
landv. severe tenure insecurity due to overlapping
rightsvi. disinheritance of women and vulnerable
members of society and biased decisions by land management and dispute resolution institutions
vii. landlessness and the squatter phenomenon

70 Master Plan for Water Catchment Areas
GOVERNANCE FRAMEWORK FOR WATER CATCHMENT AREAS
viii.uncontrolled development, urban squalor and environmental pollution
ix. wanton destruction of forests, catchment areas and areas of unique biodiversity
x. desertification in the arid and semi-arid landsxi. growth of extralegal land administration processes
(National Land Policy, 2009)
In order to provide a policy framework for addressing the above issues, Parliament adopted the Sessional Paper No. 3 on National Land Policy in 2009 to “guide the country towards efficient, sustainable and equitable use of land for prosperity and posterity.” The Policy’s overall objective is to secure rights over land and provide for sustainable growth, investment and reduction of poverty in line with the Government’s overall development objectives. The Policy seeks to provide a legal and policy framework for the maintenance of sound and effective land administration and management in order to provide:i. all citizens with the opportunity to access and
beneficially occupy landii. economically viable, socially equitable and
environmentally sustainable allocation and use of land;
iii. efficient, effective and economical operation of land markets
iv. efficient and effective utilisation of land and land-based resources, and
v. efficient and transparent land dispute resolution mechanisms.
The National Land Policy recognises that land has numerous values including economic, cultural, social and environmental, and therefore makes proposals for regulating land to ensure the realisation of these multiple values. It recognises that tenure, being the terms and conditions under which land and related resources are acquired, held, managed and disposed of is at the heart of the past land problems in the country. It thus, in similar terms as the Constitution, recognises that land belongs to the people of Kenya and is to be held by these nationally as public land,
individually as private land or as communities as community land. These three land tenure categories will receive equal recognition and protection in both law and policy, a move away from the previous view where private landholding was viewed as superior.
The Policy reinforces the role of government in regulating property rights in land through the exercise of its powers of compulsory acquisition and development control over all land in the public interest. The Policy, however, recognises that this power has in the past been used in a manner that is inimical to the security of land rights and against public interest including not promoting conservation or natural resources and sustainable management of the environment. To ensure that the powers of the State in regulating property rights serve their intended functions, the Policy recommends the review and democratisation of the process of their exercise, their effective enforcement and the harmonisation of the institutional framework for their exercise. The Policy also calls for the review and consolidation of the laws relating to land and proposes the development of a comprehensive land law, an issue that needs to be undertaken within eighteen months of the date when the Constitution was adopted.
Aside tenure, the Constitution and the National Land Policy provide rules for the regulation of the use of land and other natural resources, given as the manner of use has implications on sustainability. The National Land Policy requires land-use planning, reviews of the policy and legal framework for land-use planning, and the participation of the public in the planning process be recognised and improved. The Physical Planning Act (Cap 286) of 1996 regulates the preparation and implementation of physical development plans in all parts of the country, and as such, it is critical to the regulation of land use. It details the procedures for development control and requires that proponents apply to the relevant authority to obtain approvals before a development is undertaken.
The Act requires the balancing of various interests in the process of designing and approving physical

71Master Plan for Water Catchment Areas
GOVERNANCE FRAMEWORK FOR WATER CATCHMENT AREAS
plans and specifically calls for the conduct of EIA in cases where the local authority is of the view that proposals for industrial development activities will have injurious impact on the environmental. As the EIA provides an opportunity for development projects to be weighed against the environmental imperatives of the ecosystem, it effectively ensures the conservation of water catchment areas.
3.4.6 WildlifeAlthough still relevant, the policy framework for the management of wildlife resources is very old, having first been developed in 1975 through Sessional Paper No. 3 of 1975, A Statement on Future Wildlife Management Policy in Kenya. Thereafter, the Wildlife (Conservation and Management) Act of 1976 was enacted to provide a legal and institutional framework for the implementation of the Policy. Through an amendment in 1989, the Act established the Kenya Wildlife Services (KWS) as the principal body for overseeing the development and implementation of policies and strategies on wildlife conservation and management. The KWS has the duty of advising the Government on the establishment of protected areas namely, national parks, game reserves or protected wildlife sanctuaries, and for managing the majority of the protected areas.
On occasion, water catchment areas fall within the purview of the Act if they are protected areas that are habitat for wildlife – a factor that raises the issue of institutional responsibility for the management of WCA and the relevant legal framework. The decision by the Government to designate KWS as the focal point for the implementation of the Ramsar Convention on Wetlands in Kenya makes the Act relevant to the conservation and management of wetlands – critical water catchment areas.
In 2008, efforts to revise the Act culminated in the development of the draft Wildlife Policy, which provides a framework for the protection, conservation and management of wildlife, habitats and ecosystems in Kenya for the present and future generations. The proposed changes to the Act aim to address existing inadequacies that have contributed to the current threats and challenges facing wildlife conservation
in Kenya including human-wildlife conflict and the disjointed approach to wildlife conservation.
3.4.7 AgricultureThe agricultural sector, which constitutes the greatest use of land in Kenya, significantly affects livelihoods and sustainability considering that it is the single largest employer of the country’s labour force and user of freshwater resources. The Agriculture Act (Cap 318), the principal legislation governing agricultural activities, is geared towards promoting agricultural development in Kenya. The long-term objective of the Act is to ensure the development of arable land in accordance with sound land management and husbandry practices, hence the emphasis on the need for the conservation of soil and its fertility.
The Act empowers the Minister for Agriculture to make regulations to, inter alia, prevent soil erosion and thus preserve the soil. To this end, the Minister for Agriculture gazetted the Agriculture Farm Forestry Rules on 27 October 2009, with the aim of “promoting and maintaining farm forest cover of at least 10% of every agricultural landholding and to preserve and sustain the environment in combating climate change and global warming.” The Rules are geared towards the establishment and maintenance of sustainable forests for purposes of water, soil and biodiversity conservation, and the protection of riverbanks, shorelines, riparian and wetland areas.
As stipulated in Section 48 of the Act, such regulations will prevent the clearing of certain parcels of land for cultivation and the drainage of land, as well as protect slopes and catchment areas, and preserve soil on ridges, slopes or valleys. The powers of the Minister and the Director of Agriculture relevant to the conservation of water catchment areas include imposing penalties on those violating the stipulated regulations. By regulating the utilisation of different categories of land in Kenya for various agricultural purposes, the Act strives towards sustainable utilisation of land resources.
The Agricultural Sector Development Strategy 2010-2020 was adopted to guide the sector in addressing the challenges facing it and enhance its development

72 Master Plan for Water Catchment Areas
GOVERNANCE FRAMEWORK FOR WATER CATCHMENT AREAS
and expansion. The Strategy acknowledges the importance of forests as water catchment areas, and appropriately prioritises the rehabilitation of degraded water catchment areas. In addition, the Strategy identifies wetlands conservation and the implementation of the National Climate Change Response Strategy as key to the development and conservation of catchment areas.
3.4.8 Legislation on Regional AuthoritiesSince the 1970s, the GOK has created six Regional Development Authorities (RDAs) with the mandate to plan and coordinate the implementation of rural development activities to ensure equitable resource development and promote regional socioeconomic development through integrated planning and management. The RDAs are the Tana and Athi Rivers Development Authority (TARDA), Kerio Valley Development Authority (KVDA), Lake Basin Development Authority (LBDA), Ewaso Ng’iro North Development Authority (ENNDA), Ewaso Ng’iro South Development Authority (ENSDA), and Coast Development Authority (CDA). These development authorities were established through various Acts of Parliament namely the:i. Tana and Athi Rivers Development Authority
(TARDA) Cap 443 of 1974ii. Kerio Valley Development Authority (KVDA) Cap
441 of 1979iii. Lake Basin Development Authority (LBDA) Cap
442 of 1979iv. Ewaso Ng’iro North Development Authority
(ENNDA) Cap 448 of 1989v. Ewaso Ng’iro South Development Authority
(ENSDA) Cap 447 of 1989vi. Coast Development Authority (CDA) Cap 449 of
1990.
The effective planning, development and implementation of integrated and multipurpose programmes and projects in these RDAs contributes to the achievement of balanced regional development through employment creation, equitable distribution of resources and rural-urban balance. The RDAs are mandated to promote integrated development
within their areas of jurisdiction through the implementation of integrated programmes and projects including the provision of hydropower, flood control, water for irrigation, domestic and industrial use as well as environmental conservation.
The jurisdiction of the RDAs covers the following areas:i. TARDA covers about 138,000km2 of the area
bounded by and drained by the Tana and Athi River catchments
ii. KVDA covers about 96,285km2 the area drained and bounded by watersheds of Kerio, Turkwell, Arror, Perkera, Embobut, Weseges, Wei-Wei, Muruny rivers and their tributaries
iii. LBDA covers about 39,000km2 of areas in the Lake Victoria catchments
iv. ENNDA covers about 209,576km2 of the area drained and bounded by Ewaso Ng’iro North River Basin
v. ENSDA covers about 47,000km2 of the area drained and bounded by Ewaso Ng’iro South River Basin
vi. CDA covers about 83,681km2 and the Exclusive Economic Zone (EEZ) of 200 nautical miles, the immediate coastal hinterland.
3.4.9 Land ReclamationKenya has not had a land reclamation policy, hence the significance of the recent formulation of the draft National Land Reclamation Policy whose aim is to transform Kenya’s arid and semi-arid areas into vibrant economic development areas, and sustainably exploit their potential for economic development. The ASALs, which cover 80% (467,200km2) of the country’s landmass of 584,000km2, have been expanding due to land degradation and increased settlements stemming from migration. The draft policy intends to promote the reclamation of degraded lands, wastelands, wetlands and restoration of fragile eco-systems, promoting rehabilitation and construction of water harvesting structures including water development technologies. In addition, it will follow up on environment and development issues in ASAL and rural areas, and reclaim, rehabilitate

73Master Plan for Water Catchment Areas
GOVERNANCE FRAMEWORK FOR WATER CATCHMENT AREAS
and restore degraded ASAL areas through de-silting pans, dams and other water bodies, soil and water conservation, and reforestation.
3.5 INSTITUTIONAL ARRANGEMENTS
The governance of catchment areas is scattered across several sectors and legislations, as is evident from the Acts – discussed previously in this Chapter – which establish diverse institutions all charged with certain aspects of water resource management. In practice, these Acts have rarely coordinated their activities and fully implemented their mandates over water catchment areas, due to the lack of clarity on which institution has overall responsibility for the governance of these areas. Multiple agencies have a mandate over the determination and utilisation of riparian land, which provides an opportunity for collaborative enforcement mechanisms on the extent of river and lake riparian reserve (environment, water, agriculture, local authorities), and formulating regulations concerning the development of riparian land (environment, agriculture).
3.5.1 MinistriesThere are several Ministries responsible for various aspects of water catchments, namely those responsible for agriculture, water and irrigation, local government, land, fisheries, forestry and wildlife. With the main aim of these Ministries being policy formulation, each has a role in the governance of water catchment areas. However, given that the governance of water catchment areas transcends the mandate of any one particular ministry, inter-ministerial collaboration is imperative. In appreciation of the multi-ministerial nature of various issues, collaborative efforts have been undertaken including the establishment of the Agricultural Sector Coordination Unit (ASCU) to ensure coordinated development and implementation of policies and strategies for improving the agricultural sector, and the coordinated of the rehabilitation of the Mau Forest Complex under the Prime Minister’s Office.
The constitutional provisions governing the various Ministries afford them with the opportunity for collaboration in the management of water catchment areas, with the Ministry of Environment and Mineral Resources playing an important role including:i. monitoring and coordination of environmental
activities and enforcing compliance with environmental regulations and guidelines
ii. formulating environment and natural resources policy, and related analyses
iii. reviewing continuous development of the geodatabase for integrated natural resource and environmental management systems, conducting applied research and dissemination of research findings in forestry, land resources and geology
iv. carrying out geological surveys, mineral explorations and regulations of mining and the use of commercial explosives.
3.5.2 National Environmental Management Authority
The Environmental Management and Coordination Act creates the National Environmental Management Authority (NEMA) as the principal instrument of government for implementing policies relating to the environment, and supervising and coordinating all matters relating to the environment. In discharging its mandate, NEMA coordinates lead agencies, recognising that whereas it has the overall coordinating and supervisory responsibility, the lead agencies have the legislative or administrative responsibility for the management of certain elements of the environment. However, as regards water catchment areas, the lack of clarity on the lead institution results in duplication and institutional rivalry between NEMA and sectoral institutions mandated to manage certain aspects of water catchment areas. Although NEMA is responsible for the management, protection and conservation of the water bodies and water sources, and the development of appropriate environmental plans, the implementation of these provisions has not resulted in effective protection of water catchment areas.

74 Master Plan for Water Catchment Areas
GOVERNANCE FRAMEWORK FOR WATER CATCHMENT AREAS
At the lower levels, the EMCA creates Provincial and District Environmental Committees charged with the responsibility of coordinating environmental management within their respective areas of jurisdiction. With the adoption of the Constitution, the structures and membership of these Committees will need to be aligned with the devolved system of government.
3.5.3 Water Resource Management Authority and Other Water Institutions
The Water Act creates a comprehensive institutional structure for the management of water resources in Kenya, with the Water Resource Management Authority (WRMA) being the apex body responsible for the day-to-day management of water resources. Its functions include:i. developing principles, guidelines, and procedures
for allocation of water resourcesii. monitoring and periodically reassessing the
national water strategyiii. receiving and determining applications for water
useiv. monitoring an enforcing conditions attached to
permits for water usev. regulating and protecting water resource quality
from adverse impactsvi. managing and protecting water catchmentsvii. determining charges to be imposed for the use
of water from any water resource andviii. gathering and maintaining information on
water resources and periodically publishing forecasts, projections and information on water resources.
In discharging its functions of managing and protecting water catchment, WRMA has divided the country into six catchment areas, and in accordance with the requirements of Section 15 of the Water Act facilitated the development of Catchment Management Strategies (CMS) to enable the management of water resources and related land use within the catchment area. The Act provides for the establishment of two institutions
to enhance the participation of local communities in water management: Catchment Area Advisory Committees (CAAC) and Water Resources Users Associations (WRUAs). The Act requires that WRMA, in consultation of the Minister, appoint a CAAC for every catchment area to advise it in water resource conservation, use and apportionment. The membership of every CAAC comprises 15 members drawn from representatives of RDAs and local authorities whose jurisdiction falls within the catchment, representatives of farmers/pastoralists, representatives of the business community, representatives of NGOs engaged in water resource management, and other persons of demonstrated competence all within the catchment.
In addition, every catchment management area shall have, within the context of the implementation of the CMS, WRUAs to provide fora for the resolution of conflicts and cooperative management of water resources in catchment areas. The inclusion of these institutions in the Water Act was to fulfil the policy objective that the community should be involved in all stages of the water projects. However, modalities for ensuring the full operation of these bodies are still not in place, with WRMA neither fully appreciating nor implementing recommendations from CAACs.
3.5.4 Kenya Forest ServiceThe Forest Act establishes the Kenya Forest Services and vests it with the overall responsibility of:i. formulating policies and guidelines for the
management, conservation and utilisation of all types of forests
ii. managing all state forestsiii. managing all provisional forests in consultation
with forest ownersiv. protecting forests in Kenyav. promoting forestry education and trainingvi. collaborating with individuals and private
and public research institutions in identifying research needs and applying research findings
vii. drawing or assisting in drawing up of management plans for all indigenous and plantation estates, local authority, provisional and private forests

75Master Plan for Water Catchment Areas
GOVERNANCE FRAMEWORK FOR WATER CATCHMENT AREAS
viii. collaborating with other organisations and communities in the management and conservation of forests and
ix. managing forests in water catchment areas primarily for water and soil conservation, carbon sequestration and other environmental services.
KFS, which is managed by a board that exercises policy oversight over the operations of the Service, is empowered to establish forest conservancy areas for the proper and efficient management of forests. This considered, it is evident that the KFS has a role to play in the management of forests in water catchment areas.
3.5.5 Kenya Wildlife ServicesThe Kenya Wildlife Service was established under the provisions of the Wildlife (Conservation and Management) Act to formulate and implement policies for the conservation, management and utilisation of wildlife resources, manage national parks and reserves, prevent the destruction by wildlife of agricultural and animal husbandry activities of ranching communities. In addition, KWS is empowered to administer and coordinate international treaties relating to wildlife conservation, and protect ecologically vulnerable ecosystems and wetlands including those designated as Ramsar sites. In Kenya, the water bodies that are designated as Ramsar sites are Lakes Nakuru, Elementaita, Naivasha, Baringo and Bogoria.
3.6 CHALLENGES WITH CURRENT GOVERNANCE ARRANGEMENTS
With the existence of the wide array of laws, policies and institutions related to the governance of water catchment areas, there are several challenges plaguing the current governance framework including:a. Multiplicity and Conflicts within Laws: There
are numerous laws governing the management of water catchment areas but none of these
comprehensively address water catchment management. Instead, the provisions have to be gleaned from numerous laws, some of which contradict each other, for example the powers to regulate water quality under the Water Act and The Environmental Management and Coordination Act. Based on both Acts, the respective authorities have developed regulations, which both set water quality standards and the need for payment for permits for effluent discharge: Rule 87 and 104 of the Water Resource Regulations and sections 74 and 75 of EMCA. Such duplicity and conflicting legislations have led to difficulty in their implementation thereby reducing effectiveness in governance.
b. Weak Institutional Linkages and Synergies: Despite the existence of a wide array of institutions relevant to the management of water catchment areas, there are very few linkages and synergies between these institutions. The lack of an integrated approach in the management of water catchment areas has resulted in their encroachment as well as massive deforestation. Evidence of the institutional disharmony is clearly demonstrated by the controversies between KFS and KWS on the management of Mount Kenya and the controversies between KFS and NEMA over the powers to cut down trees within a forest. What these demonstrate is the lack of clarity on the overall institutional responsibility for the conservation of water catchment areas or a proper framework for harmonisation and coordination of mandates. The provisions within EMCA, though useful, are not adequate to fully deliver the required harmonisation and coordination.
c. Lack of a Comprehensive Policy Framework: Despite the existence of several policies, the lack of an overall policy framework for the environment sector hampers effective governance of water catchment areas. The Draft Environmental Policy developed in 2008 has never been finalised and adopted, and there is no single government policy framework specific to
76 Master Plan for Water Catchment Areas
GOVERNANCE FRAMEWORK FOR WATER CATCHMENT AREAS
water catchment areas despite the recognition by Vision 2030 of the importance of conserving water catchment areas. The development of this Master Plan is a response to this policy gap.
d. Non-Alignment to the Constitutional Directives: As the current legal and policy framework relevant to the governance of water catchment areas was put in place before the adoption of the Constitution, several of its provisions contradict the Constitution. The institutional arrangement for example, refers to Provinces and Local authorities, aspects that have been reconfigured within the context of the current constitutional dispensation. The imperatives of a devolved system of government also calls for realignment of the arrangements for governing water catchment areas to sui devolved system of government.

77Master Plan for Water Catchment Areas
4.0 CHAPTER FOUR
CONSERVATION AND SUSTAINABLE MANAGEMENT OF WATER CATCHMENT AREAS

78 Master Plan for Water Catchment Areas
This Chapter identifies programmes to maintain and enhance the sustainability of natural resources, and that will have knock-on effects
on other environmental restoration and conservation efforts. The Plan, which addresses key areas that need immediate attention, aspires to embrace collaborative natural resource management practices through partnerships and participation. This section includes a summary that takes into account the continued biodiversity loss, current conservation practices, unplanned settlements, and natural resources-use conflicts. It identifies the areas that need fast tracking as the development and implementation of tree planting programmes, rehabilitation of silted dams and pans, waste management and construction of contours, and estimates the required resources.
These estimates are apportioned to the 14 target outputs and 189 activities, which are clustered under the respective sector working groups and Ministries: 6 sector working groups organized according to the 2012-2015 grouping of MTEF sectors, and 25 lead agencies assigned specific activities based on their respective mandates. The financial projections, estimated at Kes. 942 billion, are segmented into various medium-term planning periods between 2011 and 2032 – a duration of 21 years; only Kes. 31 billion will be required during the first planning period. These funds have already been provided and allocated to various sectors, as this is expected to aid resource mobilisation in line with the national planning system. The proposed management structures will accommodate the devolved governance structure envisioned in the Constitution of Kenya 2010; a monitoring and evaluation framework will be integrated into the national E-PROMIS.
4.1 PROBLEMS IDENTIFIED
The factors that have triggered – and continue to drive – the degradation of water catchment areas were identified as:a. weak institutional linkages, synergies and limited
consultation of stakeholdersb. conflicting institutional mandates a is evident
from the overlapping mandates, programmes, projects, and conflicting policies and legislations
c. inadequate flow and sharing of information on WCAs
d. low levels of awareness and limited capacity of stakeholders – particularly at corporate and grassroots level – to implement conservation measures
e. expansive and severely degraded WCAsf. continued application of inappropriate land use
and management in WCAsg. poor and inefficient water resource
managementh. water insecurityi. poor waste management including inappropriate
disposal methodsj. livelihoods insecurityk. continued high dependence on a limited range
of energy sources particularly wood fuel for industrial and household use
l. inadequate involvement of gender and youth in WCAs conservation programmes and projects
m. lack of clear funding mechanisms for WCASn. lack of integrated WCA monitoring and
evaluation systems
CONSERVATION AND SUSTAINABLE MANAGEMENT OF WATER CATCHMENT AREAS

79Master Plan for Water Catchment Areas
CONSERVATION AND SUSTAINABLE MANAGEMENT OF
WATER CATCHMENT AREAS
4.2 PROPOSED INTERVENTIONS
This document proposes remedial actions for the 14 problems identified, based on data analysis, literature review, consultations at policy level, and observations made during fieldwork in 20 sub-catchments. The actions primarily aim to enhance production and consumption efficiency, respond to climate change, support socioeconomic growth, and ensure sustainable availability of natural resources derived from WCAs.
4.2.1 Partnerships and Participation of Stakeholders
This Master Plan proposes the establishment of the National Water Catchment Management Programme (NWCMP), which will coordinate the prioritised actions and eliminate duplication of activities by various Departments and Ministries, while harmonising the conservation of WCAs. For the effective conservation of WCAs, strong partnerships and public participation at all levels will be necessary in responding to the issues of weak institutional linkages and synergies, and limited consultation of stakeholders. The proposed NWCMP will be operationalised through committees similar to the National Water Towers Management Committee that was established by the Kenya Gazette Supplement No. 47 of July 2010, and will be governed by an Inter-Ministerial Steering Committee. A multi-stakeholder National WCA Management Committee will oversee the zoning and demarcation of the boundaries by the Ministry of Lands and the Ministry of Forestry and Wildlife. WCA discussion fora will be convened biannually at national level, and quarterly at county level where an inter-departmental committee will be established to facilitate these county meetings.
Degradation of water catchment areas is a process that takes place from as low an administrative level as the village, and for this reason, strategic actions need to be steered through common interest groups in villages. It is important to establish community-level environmental conservation, planning and implementation committees to support the activities of natural resource users associations including WRUAs, Community Forest Associations (CFA) and
Environment Management Committees (EMC). Such user-groups can facilitate change in attitudes towards conservation through capacity-building programmes that address practical conservation challenges derived from community-driven conservation approaches. This proposal recognises that environmental destruction is mainly due to human activities, and that conservation efforts can only succeed with the full participation of local communities.
4.2.2 Governance of Water Catchment Areas
In order to strengthen the governance of WCAs, the proposed interventions are as follows:i. review and harmonise conflicting policies,
legislations, regulations and standards governing the management of water catchment areas, including Water Policy (Sessional Paper No. 1 of 1999 on Water Resource Management and Development), Water Act 2002, Agriculture Act 1986, Wetlands Regulations 2009, Forests Act 2005 and EMCA 1999. Regarding effluent discharge, there are provisions in EMCA 1999 and Water Resource Management Rules 2007 that have been discussed previously in Chapter 3 of this Plan. The revision of these will enable the articulation of provisions of the Kenya Constitution 2010 and flagship projects in the environment sector according to Kenya Vision 2030
ii. strengthen enforcement of and compliance with relevant legislations, policies and regulations including the acquisition of water abstraction permits and compliance with water use conditions, Part V of the Environmental Management and Coordination Act (1999) that provides a rational framework for enforcing provisions of Part VII of EMCA (1999) particularly the sections on waste management standards and control of discharge of waste into the environment
iii. develop and promote the application of policy and legislative provisions that support profitable engagement in carbon credit trading and carbon offset programmes with specific objectives of enhancing the protection and conservation of

80 Master Plan for Water Catchment Areas
water catchment areas, poverty alleviation and employment creation
iv. harmonise institutional arrangements for the sustainable management of water catchment areas
v. develop and implement a national programme on resource efficiency.
4.2.3 Communication strategyIn order to implement the NWCMP, a communication strategy to promote access to and use of information, innovation and technologies needs to be developed. The strategy will take into account the following measures:i. develop, upload and maintain a website,
information database and information centres on WCA
ii. disseminate information through newsletters, brochures, sports, competition, media, billboards, arts, posters and in community fora
iii. develop and integrate WCA curricula at all levels in schools
iv. set up water catchment management information centres in all Wards
v. establish a conservation-reward system and promote competition on WCA activities among the communities and groups
4.2.4 Capacity BuildingCapacity building interventions have been designed to respond to the lack of awareness, skills and competency shortfalls in the application of innovations and technologies relating to environmental conservation and management. The Education for Sustainable Development Initiative is one of programmes that will contribute to capacity building. The main interventions are:i. organising regular educational and sensitisation
meetings to enhance community awareness on NWCMP and water catchment conservation of rangelands, forests and wetlands
ii. strengthening the capacities of communities, corporates and other stakeholders in the
conservation and management of water catchment areas
iii. establishing and operationalising community-level youth and women WCA conservation groups
iv. building capacity on water quality monitoring including training personnel to protect, conserve and sustainably manage watersheds
v. strengthening the capacity, skills and competency of WRUAs, CFAs and EMCs to establish tree nurseries through community groups (youths, women, elders groups and other groups), and empowering them to co-manage critical water catchment areas.
4.2.5 Restoration and Management of Water Catchment Areas
All water catchments areas need to be restored, conserved and sustainably managed in order to address problems related to the degradation of WCAs such as inadequate water catchment protection, unsustainable utilisation of resources, unplanned developments and settlements, non-point pollution from inflows of urban wastes, and soil erosion. The main interventions are:i. delineating natural vegetation and degraded
areas as baseline information for restorationii. promoting tree planting in forests and on farms,
and designing and replicating existing successful programmes aimed at achieving at least 10% cover through youth, women and community groups. Based on the 2009 census data and taking into account that the economically active age-group of Kenyans ranges from 15 and 64 years (20, 684, 861 people), the 7.6 billion trees target by 2030 can be attained if each person grew 27 trees per year assuming a 60% survival rate
iii. adhering to species and site matching principles taking into account the following:• what species were there before
degradation?• what kind of degradation is taking place
and at what elevation?
CONSERVATION AND SUSTAINABLE MANAGEMENT OF
WATER CATCHMENT AREAS

81Master Plan for Water Catchment Areas
• what species would be appropriate for that particular ecological zone? (see Appendix 5)
• what is the appropriate ecological restoration model to apply
iv. controlling and, where necessary, banning livestock grazing, logging and charcoal production in critical water catchment areas in order to allow for aquifer recharge
v. surveying, demarcating and mapping out critical water catchment forest areas where the non-destructive use of forests should not be allowed
vi. assisting communities living adjacent to indigenous forests to establish their own wood lots on their private land, and engage in non-forest-destructive bio-enterprises
4.2.6 Land Use and Management PracticesSoil conservation and land use management interventions are proposed to address some of the problems related to inadequate water catchment protection and unsustainable utilisation of water resources. The main interventions are:i. establishing a baseline on biodiversity
endowment, vegetation and land coverii. introducing and promoting sustainable land
managed technologies – including minimum tillage, organic agriculture, controlled grazing, construction of terraces, contour farming, mulching – and other conservation measures that will enable recovery of areas that have ceased to be water catchments
iii. gazetting water catchments as environmentally significant areas
iv. enforcing the Agriculture (Farm Forestry) Rules 2009
v. constructing waterways and gabions within farms to manage on-farm runoff
vi. mapping fragile ecosystems in critical catchment areas and updating the soil and geology maps of all catchment areas
vii. promoting drip irrigation
4.2.7 Water Resource Conservation and Management
Water resource conservation and management interventions have been prepared to promote landscape-wide conservation of catchments. The main interventions are:i. implementing inter-basin and intra-basin water
transfers to channel water from areas with excess water to areas with water deficit,
ii. conducting a detailed water-use survey and water resources assessment to establish water balance
iii. implementing Sub-Catchment Management Plans (SCMPs)
iv. demarcating and constructing designated livestock water consumption points
4.2.8 Water Storage InfrastructureWater storage infrastructure interventions have been designed to promote rainwater and storm runoff harvesting. The main interventions are to:i. promoting rainwater and storm runoff harvesting
through establishment of on-farm ponds for water harvesting and installation of water tanks
ii. increasing capture and retention of rainwater through the construction of waterways, strategically located boreholes and other water harvesting structures to ensure water availability during dry seasons
iii. rehabilitating silted and degraded pans and dams, which can result in harvesting 5 billion cubic metres of rainwater that can support extensive crop irrigation and livestock production including rearing fish in ponds. Overall, all degraded water infrastructure including dams, water pans, water supply and distribution lines need to be rehabilitated or constructed at the lowest level of administration to ensure that consumers exert less pressure on water resources. Given that water in dams and pans may not be consumable, consumers and water resource managers should therefore be equipped with skills for monitoring water quality.
CONSERVATION AND SUSTAINABLE MANAGEMENT OF
WATER CATCHMENT AREAS

82 Master Plan for Water Catchment Areas
At household and community level, small-scale water purification and quality management methods will need to be promoted
iv. increasing water storage and harvesting through development of infrastructure such as pans, gabions, dams, canals, ponds
v. building capacity on water quality monitoring including training personnel to protect watersheds and monitor water quality
vi. constructing watering infrastructure (ramps, troughs) to prevent destruction of water pans and boreholes by livestock.
4.2.9 Management of Urban, Rural and Industrial Waste
Proper waste management can contribute significantly to the conservation of WCAs by promoting resource-use efficiency, thereby minimising harmful discharge into the environment and increasing resource productivity. In order to enable the country improve and manage urban and industrial waste and sanitation, the following interventions have been identified:i. developing and implementing waste
management strategies for all major urban areas
ii. promoting sorting of waste at source in all types of establishments, and on a large scale not only to enable the country dispose of solid waste appropriately through gasification and bio-methanisation, but also generate revenue through the Clean Development Mechanism initiatives
iii. managing urban and industrial waste as is the case with domestic waste to generate revenue through the application of resource-efficient technologies and innovations, for instance, efficient water-use technologies can save up to 20% of production costs
iv. upgrading sanitation and sewerage systems to reduce pollution
v. increasing national coverage of water supply and sanitation according to the Millennium Development Goals (MDG) while developing longer-term targets
vi. promoting the use of cleaner production technologies including recycling and re-use of water in all types of establishments.
4.2.10 Alternative LivelihoodsAlternative livelihood interventions have been prepared to reduce pressure on natural resource utilisation, enhance conservation and promote livelihoods sustenance. The main interventions are to:i. diversify livelihoods to facilitate the sustainable
natural resource use in water catchment areas, which are important resources upon which a large percentage of communities neighbouring them depend for their livelihoods. Creating livelihood options is one of the most viable WCA conservation strategies that will reduce pressure on dependence on natural forests. Options like bee-keeping, butterfly farming, mushroom farming, establishment and management of small-scale tree nurseries, on-farm woodlots, community-based production and marketing of handcrafts, operating local eco-tourism groups and other income-generating activities (IGAs) need to be promoted
ii. establish a contract-based production and market through nature-based conservation programmes to address the persistent drawback of lack of markets
iii. increase area under irrigation to improve efficiency and food security
iv. promote the use of non-wood forest products especially gums and resins in the drylands
v. develop appropriate livestock management strategies for the drylands
4.2.11 Renewable Energy Consumption and Catchment Conservation
Kenya, like other African countries heavily depends on biomass energy, and this will continue to be the case for many decades to come unless drastically heavy investments are made to develop and promote renewable energy. Biomass energy contributes 67% of the country’s energy requirements (Mugo and
CONSERVATION AND SUSTAINABLE MANAGEMENT OF
WATER CATCHMENT AREAS

83Master Plan for Water Catchment Areas
Gathui, 2010), and it is this high dependence on biomass energy (crop residues and dung) that is driving the degradation of water catchment areas. The indiscriminate harvesting of woodlands and trees in natural forests results in bare hilltops and aggravates land degradation by accelerating soil erosion, the formation of gulleys and high sediment loads in rivers and lakes.
The following actions are proposed:i. support the use of alternative energy sources
such as solar, biogas, offshore wave energy harvesting and wind energy to meet the energy demands especially of rural populations
ii. support tree planting on farms, protect natural forests, promote regeneration of natural woodlands
iii. promote the use of energy-saving appliancesiv. develop and promote bio-energy technologies.
4.2.12 Mainstreaming Gender, Youth and Vulnerable Groups
Women and youth are numerically the most significant part of Kenya’s population, and owing
CONSERVATION AND SUSTAINABLE MANAGEMENT OF
WATER CATCHMENT AREAS
Plate 4.2.11 Renewable wind energy on Ngong Hills(Source: Ministry of Energy 2011)
to its vibrancy, the youth is a particularly valuable asset to national development – social, political and economic growth. The majority of the population in this category has formal education but no vocational skills but their engagement in environmental conservation programmes can produce positive multiplier effects on economic growth. The following interventions have been designed to close this gap:i. developing a gender mainstreaming strategy to
address the low involvement of the gender and the youth in activities like tree planting, waste management, promotion of indigenous and current forms of soil conservation and alternative sources of energy and livelihood activities
ii. developing a strategy for the youth, physically-challenged and other vulnerable groups
iii. building the capacity of women, youth and special interest groups to enable them effectively participate in catchment conservation activities
4.2.13 Funding MechanismsThe restoration of water catchment areas will require a substantial amount of funds estimated at Kes. 942 billion for technical support, capacity building and

84 Master Plan for Water Catchment Areas
CONSERVATION AND SUSTAINABLE MANAGEMENT OF
WATER CATCHMENT AREAS
other institutional arrangements. This intervention has been prepared to enable the proposed NWCMP secure funds for the implementation of activities proposed in this Master Plan. The main interventions are:i. identifying current and potential sources of
fundingii. reviewing and evaluating the current funding
mechanisms and streamline their operationsiii. developing a financial, procurement and
management handbook for WCA at all levelsiv. introducing conservancy levy and payment for
ecosystem servicesv. establishing a WCA fund coordinating bodyvi. facilitating carbon credit trading and carbon
offset programmesvii. putting in place an auditing mechanism to
strengthen the management of WCA funds committees at district and county levels
viii. reviewing, evaluating, developing and streamlining WCA funding mechanisms at all levels
4.2.14 Monitoring and Evaluation Systems in Water Catchment Areas
A rapid survey conducted by the Taskforce showed that the ongoing interventions have a unique monitoring, evaluation and reporting component that is mainly a prescription of the sponsoring/funding agency. A strategic communication intervention – one of the key means through which access to and application of knowledge and information are facilitated – helps establish a common understanding among all participants of a development initiative, creating a base for common action (Mozammel and Schechter 2005). Under this component, the following activities will be undertaken:i. developing and operationalising a monitoring
and evaluation (M&E) framework and an M&E manual for Natural Resource Users Association (NRUAs)
ii. supporting publication and dissemination of a WCA annual report
iii. installing water catchment M&E systems in all catchments
iv. building the capacity of NRUAs and other legally constituted organisations in monitoring and equip all NRUAs and other legally constituted organisations with monitoring tools
v. sensitising and training stakeholders on M&Evi. mid-term review of the Master Plan after 10
yearsvii. end term review of the Master Plan
4.3 RESOURCE MOBILISATION
The restoration of water catchment areas requires a substantial amount of financial, technical and human resources. Funding will be required to undertake thorough surveys of all water catchment areas countrywide, take inventory of the biodiversity in all water catchment areas, and acquire the appropriate tree species seedlings for rehabilitation. A qualified workforce will be required to undertake the restoration, so will guides to ensure that the appropriate tree species are planted. Considering that the annual budget allocation is approximately Kes. 100 billion, the Master Plan has a funding deficit of over Kes. 800 billion that is required over the remaining period of Vision 2030. The Government will lead the process of funding the Master Plan, and development partners (both bilateral and multilateral), NGOs/CBOs, the civil society, private sector, and public private partnerships will contribute significantly to close the funding gap. Other innovative financing mechanisms, including tapping resources to be allocated to the 47 Counties, will be explored. It is envisaged that the resources will be allocated according to the identified priority interventions in Section 5.3 of the NWCCP, commensurate with Kenya’s Vision 2030 Medium Term Plans. A resource mobilisation strategy will also be developed in the first phase of the implementation of the Master Plan.

85Master Plan for Water Catchment Areas
CONSERVATION AND SUSTAINABLE MANAGEMENT OF
WATER CATCHMENT AREAS
Table 4.3.1 Total 2011/12 Budgetary Allocations
a. Ministry of Water and Irrigation
b. Ministry of Environment and Mineral Resources
c. Ministry of Forestry and Wildlife
Ministry of Water and irrigation
Ministry of environment and Mineral resources
Ministry of Forestry and Wildlife
Other Ministries (Funds, Agriculture, Livestock development, Communities, CBOs, NGOs etc)
Financing Deficit
Water Services Trust Fund
The National Environmental Trust Fund
National Restoration Fund
Water Tower Conservation Fund
Forest Management and Conservation Fund
The Wildlife Service Fund
6,060,124,046.00
2,602,169,150.00
5,174,231,210.00
20,000,000.00
50,000,000.00
N/A
N/A
N/A
N/A
36,931,463,944.00
4,105,750,532.00
3,488,912,000.00
995,783,175.00
Nil
N/A
50,000,000
N/A
N/A
42,991,587,990.00
6,707,919,682.00
8,663,143,210.00
42,0000000000.00
100,000,000,000,000.00
800,000,000,000,000.00
1,015,783,175.00
50,000,000.00
N/A
50,000,000.00
N/A
N/A
MINISTRY RECURRENT DEVELOPMENT TOTAL
FUND RECURRENT DEVELOPMENT TOTAL
FUND RECURRENT DEVELOPMENT TOTAL
FUND RECURRENT DEVELOPMENT TOTAL

86 Master Plan for Water Catchment Areas
CONSERVATION AND SUSTAINABLE MANAGEMENT OF
WATER CATCHMENT AREAS
4.3.1 Funding Restoration from the Government-Established Funds
Various funds have been established to support conservation of water catchment areas, and there are other funds established for other purposes but which can still be used for the protection of water catchment areas. Some of these potential sources of funds for restoration include the:i. Water Towers Conservation Fund, established on
23 July 2010, is part of the Mau Complex Forest Interim Coordinating Secretariat’s mandate “to develop the framework for long-term measures to restore and sustainably manage the Mau Forest Complex and other water towers”. This fund is managed by a National Water Towers Management Committee that comprises eight members
ii. Forest Management and Conservation Fund, established under the Forests Act 2005, is managed by a Finance Committee appointed and empowered by the Kenya Forest Service (KFS) Board. Some of the functions of the Board include the maintenance and conservation of indigenous forests, rehabilitation of forests, management of unique forests for biodiversity conservation, and establishment of nurseries and production of seedlings
iii. Water Services Trust Fund, established under the Water Act 2002, whose objective is to assist in financing the provision of water to areas of Kenya with inadequate water supply
iv. National Environment Trust Fund established under EMCA 1999 and managed by a Board of Trustees
v. National Restoration Fund vested in NEMA with the objective of supplementing insurance for the mitigation and control of environmental degradation
vi. Kenya Wildlife Service Fund established under the Wildlife (Conservation and Management) Act and managed by the KWS Board of Trustees
vii. National Consolidated Fund and the County Government Revenue Fund established by the Constitution of Kenya 2010
viii. Constituency Development Fund (CDF) established by the CDF Act
ix. Local Authorities Transfer Fund (LATF) established by the Local Authorities Act
4.4 MONITORING AND EVALUATION FRAMEWORK
The purpose of monitoring and evaluation is to measure and assess performance, in order to manage the outcomes of the restoration/rehabilitation process more effectively, and as such it will be an essential part of planning and management. Monitoring will be a continuous, systematic and critical review of a process with the aim of assessing progress, and it will be done in a participatory manner through a logical framework.
The objective for applying a monitoring and evaluation framework is to help empower the primary stakeholders by creating opportunities for them to reflect critically on the direction of the management interventions. For this reason, stakeholders should hold regular meetings to share experiences or lessons and evaluate potential impacts arising from any interventions on water catchments. Short study tours, particularly for the leaders, could be organised for capacity building and to facilitate sharing of experiences on what others are doing in water catchment restoration and management. Relevant government institutions (e.g. WRMA, KFS, KWS) should be mandated to conduct and evaluate the status of water catchments on annual basis, ensuring that findings, recommendations/remedial actions are communicated promptly and regularly to the relevant parties.
The initiative should be aimed at promoting learning, and information sharing of results and lessons learned among the stakeholders as a basis for decision-making on various strategies and to improve knowledge and performance on water catchment restoration and management. Appendix 11 shows the logical framework on priority activities needed for the protection and conservation of water catchment areas, Appendix 12 shows the work plan and activity based budget, while Appendix 8

87Master Plan for Water Catchment Areas
CONSERVATION AND SUSTAINABLE MANAGEMENT OF
WATER CATCHMENT AREAS
indicates the detailed budget for each output to be implemented in the Master Plan over the 2011 to 2030 period.
4.5 COMMUNICATION AND PUBLIC PARTICIPATION
The Government and nongovernmental organisations need to aggressively undertake initiatives to educate the public, particularly communities living adjacent to WCAs, on the importance of water catchment conservation. It is imperative for these communities to be involved in all plans for the restoration and management programmes of the water catchments in order to see and get direct benefits from their initiatives. These local communities, which sometimes possess untapped indigenous knowledge on restoration, have not been consulted resulting in the adoption of counterproductive interventions including planting unsuitable species in water catchment areas.
In order to assure the effective implementation of the restoration programme, multi-stakeholder consultation and participation will be critical, especially given that water catchment areas are a direct source of livelihood for millions of people in Kenya. Therefore, consultations need to be held for the following reasons:a. improve the quality of decision-making
processes by capturing the experience of specialised governmental and nongovernmental organisations and local community groupings
b. tap the knowledge of other CSOs working at community level
c. promote the sustainability of the proposed forest restoration programme
d. appreciate the diverse needs of different population groups based on gender, ethnic, socio-economic or geographical variations
e. set the foundation for broad-based participation in the ensuing design and implementation of restoration interventions and
f. assist governments in increasing transparency, public understanding and citizen involvement in restoration decision-making.
4.6 ORGANISATION STRUCTURE FOR THE RESTORATION
It is important for all stakeholders to agree on the conduct of the restoration programme. For this reason, all relevant Government Ministries, county governments, NGOs, donors and other stakeholders including local community organisations (WRUAs, CFAs CBOs etc.), need to be involved in the joint development of a common blueprint acceptable to all. The involvement of the youth in water catchment conservation activities can be assured by local schools and the Kazi Kwa Vijana and other youth programmes. The blueprint needs to clearly provide for the organisational structure, taking into consideration provisions of relevant laws and policies. Indeed, during the development of the Master Plan, a Management Structure was developed, clarifying how the programme will be effectively managed, and setting out the planning, organising, directing, controlling, supervision, monitoring and evaluation of water catchment conservation activities.
These activities will provide a framework that gives confidence that the programme is operating as planned. It will also ensure cost effective and durable sustainable water reservation and restorations outputs. The programme will be managed at various levels, with the two main levels being the National and County levels, which will have supervisory and oversight roles, while the other two will be the wards and community levels. Figure 4.1 provides the organisational structure envisaged for restoration of the programme.
4.6.1 National Water Catchment Management Steering Committee
The Water Catchment Master Plan Programme will be implemented under the overall supervision and guidance of the National Steering Committee, which will be set up in the Ministry of Environment

88 Master Plan for Water Catchment Areas
CONSERVATION AND SUSTAINABLE MANAGEMENT OF
WATER CATCHMENT AREAS
TECHNICAL CATCHMENT WATER MANAGEMENT COMMITTEE
INTER-MINISTERIAL/ AGENCY STEERING COMMITTEE
NATIONAL WATER CATCHMENT MANAGEMENT COMMITTEE
COUNTY WATER CATCHMENT MANAGEMENT COMMITTEE
WARDS WATER CATCHMENT MANAGEMENT COMMITTEE
COMMUNITY WATER CATCHMENT MANAGEMENT COMMITTEE
INTER-COUNTY SUB-CATCHMENT WATER MANAGEMENT COMMITTEE
INTER-COUNTY WARDS WATER CATCHMENT MANAGEMENT
COMMITTEE
INTER-COUNTY COMMUNITY WATER CATCHMENT MANAGEMENT
COMMITTEE
Figure 4.1 Organisational Structure for Restoration
and Mineral Resources and chaired by the Cabinet Secretary in the MEMR. Other representatives that will be involved in the implementation of the Master Plan are the Principal Secretaries of relevant Ministries – including Forestry and Wildlife, Energy, Youth and Sports Affairs, Local Government, Water, Agriculture and Livestock, Trade and Industrialisation, Lands, and Gender, Children and Social Development – and selected representatives of development partners involved in the water sector. The functions of the Steering Committee will be to give policy direction, set national agenda, approve budgets, programme activities and workplans, and participate in national monitoring and evaluation.
4.6.2 National Water Catchment Management Committee
Below the steering committee will be the National Water Catchment Management Committee to be chaired by the Principal Secretary of the Ministry of Environment and Mineral resources, which provides the Secretariat. This Committee will comprise of designated officers as reflected in the National Steering Committee and other representatives from the relevant organisations. Specifically, the membership will comprise the Principal Secretaries of the Ministries of Forestry and Wildlife, Energy, Youth and Sports Affairs, Local Government, Water, Agriculture and Livestock, Trade and Industrialisation, Lands, and Gender, Children and Social Development. Other members will be representatives of development partners, KEPSA, WRMA, KEFRI, KFS, and NMK for biodiversity monitoring purposes.

89Master Plan for Water Catchment Areas
CONSERVATION AND SUSTAINABLE MANAGEMENT OF
WATER CATCHMENT AREAS
The functions of this Management Committee will be to:i. coordinate the Water Catchment Master Plan
activities at national levelii. make appropriate recommendations to the
Steering Committee for consideration and approval
iii. undertake overall monitoring and evaluate – 5%iv. develop the programme designv. develop the Water Catchment Strategic Planvi. provide technical assistance to the countiesvii. provide quarterly returns and reporting
4.6.3 Trans-County Water Catchment Management Committee
This multi-county water catchment forum, equivalent to the county management committee, will be composed of various counties that fall within the sub-catchment areas. Table 4.6.3.1 below gives a sample of the extent of the water catchments in terms of county and inter-county units of implementation.
The membership of this Committee will comprise Governors of the respective counties, and Heads of technical officers from the line Ministries mentioned in section 4.6.2 above. Its functions will be to:i. implement water catchment programme
activities at inter-county level
Table 4.6.3.1 Extent of selected water catchments
Sub-Catchment
Wuoroya
Hibwein Kuria
Bathi
Nyando
Nzoia
Size
300
150
136
3,625
12,710
Extent
Trans-county
Intra-county
Intra-county
Trans-county
Trans-county
Percentage in county
65% Kakamega, 35% Siaya
100% Migori
100% Kiambu
44% Kericho, 25% Kisumu, 22% Nandi, 4% Uasin Gishu, 4% Nakuru, and 2% Baringo
22% Uasin Gishu, 20% Kakamega, 18% Trans Nzoia, 15% Bungoma, 11% Keiyo/Marakwet, 6% Siaya, 4% Nandi, 3% West Pokot, 2% Busia
ii. manage the transboundary catchmentsiii. provide technical assistance at ward leveliv. provide quarterly returns
4.6.4 County Water Catchment Management Committee
The second level of management, the County Level Management Committee, will be charged with the implementation of policies and programmes of WCA activities; the Ministry of Environment and Mineral Resources will provide the Secretariat. In addition to the County Governor who will chair the Committee, its membership will comprise 3 members of the County Executive Committee appointed by the Governor as provided for in Article 179 of the Constitution, heads of the technical Ministries mentioned in section 4.6.2 above, and 2 other members drawn from civil society organisations. Its functions will be to:i. coordinate the activities of the Water Catchment
Master Plan at county levelii. carry out planning at county leveliii. undertake monitoring and evaluation – 25%
programme activities in the countyiv. implement water catchment activities at county
levelv. provide technical assistance to the wards.

90 Master Plan for Water Catchment Areas
CONSERVATION AND SUSTAINABLE MANAGEMENT OF
WATER CATCHMENT AREAS
4.6.5 Ward Water Catchment Management Committee
The third level of management, the Ward Management Committee, will be chaired by the County Assembly member elected to represent the ward. Its membership will comprise the chair, heads of relevant technical Ministries represented at the ward level, and 2 other members from CBOs. Its functions will be to:i. coordinate the activities of the Water Catchment
Master Plan at ward levelii. carry out planning at ward leveliii. undertake monitoring and evaluation – 50%
programme activities in the countyiv. implement water catchment activities at ward
levelv. provide technical assistance to the
communities.
4.6.6 Community Water Catchment Management Committee
The lowest level of management, the Community Water Catchment Management Committee, will be reporting to the Ward Management Committee or the Project Management Committee, by the Project Coordinator appointed by the line Ministry responsible for the particular project. It will comprise representatives of other concerned line Ministries, community and local leaders and youth and women leaders. Its membership will comprise the chair elected from either WRUAs or CFAs, a representative of the youth, and a representative of the women.
In the memberships of all the management committees discussed above, no more than two thirds of the membership will be from the same gender.
4.7 INTERVENTION MEASURES FOR TRANSBOUNDARY WATER CATCHMENTS
a. Conducting assessments of water resources and water demand on entire river basins, for
the purpose of computing the water balance, will result in knowledge of water distribution against surface, groundwater, precipitation, rainfall, runoff and water quality, and facilitate the development of a water allocation plan
b. Development of a water allocation plan taking full account of all users and uses across the political boundary; the Plan should consider priority water needs agreeable as per National Water Acts, including human and ecosystems needs, agriculture, power and industrial in that sequence.
c. Development of a monitoring system for natural resource (particularly water) use, agreeable across the political boundary in terms of equipment, sampling protocol and reporting; this mainly involves hydrological, hydrogeological and water quality practices.
d. Development and implementation of a common funding mechanism for catchment restoration activities that takes into account each country’s revenue statutes.
e. Development and implementation of a common land management and water infrastructure development plan.
There are transboundary water catchment areas that require cross-border collaboration in their restoration and management and these include the Mt. Elgon, Lakes Victoria and Jipe, Mara ecosystem, Sio Malakisi, River Dawa, and the Moyale and Namanga Hills. It is important to develop harmonised and well coordinated joint management work plan to guide the management of these cross-border water catchment areas. This may be achieved through intergovernmental committees on water catchment areas aimed at ensuring sustained water resource production.
The East African Community (EAC) Protocol on Environment and Natural Resource Management, which applies to among others, all activities, matters and areas of management of the environment and natural resources of the Partner States provides an opportunity to address the cross-border issue. Article

91Master Plan for Water Catchment Areas
CONSERVATION AND SUSTAINABLE MANAGEMENT OF
WATER CATCHMENT AREAS
Figure 4.3. Position of Kenya’s water towers traversing counties
11 on the management of forest and tree resources states that Partner States shall cooperate in all activities relating to the development, conservation, sustainable management and utilisation of all types of forests, trees, and trade in forest products throughout the Community. The Protocol was signed in 2005 but it is only recently that governments have come together and agreed to ensure its adequate implementation.
4.8 COST BENEFIT ANALYSIS OF THE RESTORATION PROGRAMME
Restoring 1 Ha with 1,000 tree seedlings is estimated to cost between Kes. 35,000 to 40,000, dependent on whether the seedlings are raised in a nursery or purchased, or on the type of seedlings, sizes, sites and other local factors like transport and labour. In case of raising seedlings in a nursery, the cost will include costs of nursery management (soil collection, wildings collection and purchasing of potting bags),
costs of nursery management practices (root pruning, pest control, weeding etc), costs of field operations (pitting and planting) and post-planting care. On seedling purchases, the main costs are related to the cost of the seedlings, pitting, planting and post-planting care.
Some of the un-quantified benefits of restoring water catchment areas include:a) Biodiversity: increasing the plant and animal
variety and improving their habitatb) Water retention capacity: increasing the water
retention capacity of soilsc) Products: availability of fuelwood and fodder
for animals. It has been noted that in some young/new restoration sites, quantity and quality of some fodder particularly the grass has improved
d) Medicinal trees: Most of the tree parts used by community for medicine include Prunus Africana and Zanthoxylum gilettii
e) Culture: many communities attach cultural values to some of the trees e.g. the fig trees are considered sacred by many communities

92 Master Plan for Water Catchment Areas
CONSERVATION AND SUSTAINABLE MANAGEMENT OF
WATER CATCHMENT AREAS
f ) Aesthetics: trees are beautiful and used for ornamental purposes
g) Educational: most indigenous trees are important for educational and scientific research
h) Pollination: restored catchments increases pollinators, thereby enhancing the reproductive biology of most species
i) Tourism: restored catchments increase the touristic value
j) Ownership and community participation in conservation: tree-planting and restoration activities bring peri-forest communities closer to the forest, which allows for ownership and community stewardship in the management of natural resources.
Planting eucalyptus trees is not encouraged in water catchment areas but these can be grown in appropriate areas outside the water catchment areas. The KFS guide shows that a hectare of firewood and poles could generate a net surplus of Kes. 540,000 and Kes. 1, 000,000 respectively over a period of 8 years. This is a high return compared with Kes. 88 000 for low to medium production maize, Kes. 96,000 for medium production maize, Kes. 376,000 for high production maize and Kes. 630,000 for tea over the same period.

93Master Plan for Water Catchment Areas
Alavi, G. and Ong C. K. (2004). Modelling the Impact of Eucalyptus Plantations on Streamflow of Njoro River in Kenya. Land Use and Water Resources Research Journal
Becha, Hadley (29 January 2010). Creating and Enabling Environment for Sustainable Management, Conservation and Wise Use of Wetlands and Wetland Resources in Kenya: A Technical and Legal Justification Paper. Wetland Forum Project No. CEF/EPS/ADV/2008/014 c/o, The East Africa Wildlife Society
Beentje, H.J. (1990). The Forests of Kenya. Proceedings of the Twelfth Plenary Meeting of AETFAT. Mitteilungen aus dem Institut für Allgemeine Botanik der Universität Hamburg
Busman, R. (1994). The Forests of Mount Kenya: Vegetation, Ecology, Destruction and Management of Tropical Mountain Forest Ecosystem
Campbell, Neil A. (2009). Biology Concepts and Connections Sixth Edition
Chikamai and Odera (2002). Forest Management for Non-Wood Forest Products and Services in Sub-Catchment Areas
Conway, D. (2005). From Headwater Tributaries to International River Basin: Observing and Adapting to Climate Change and Variability in the Nile Basin. Global Environ. Change
Conway, D., Allison, E., Felstead, R. and Goulden, M. (2005). Rainfall Variability in East Africa: Implications for Natural Resources Management and Livelihoods. Philosophical Transactions of the Royal Society of London Series A-Mathematical, Physical and Engineering Sciences 363(1826)
Conway, D., Hulme, M. (1993). Recent Fluctuations in Precipitation and Runoff over the Nile Sub-Basins and their Impact on Main Nile discharge. Climatic Change
Dye, P.J. and Bosch, J.M. (2000). Sustained Water Yield in Afforested Catchments – The South African Experience. In Sustainable Forest Management. Kluwer Academic Publishers: The Netherlands
Eberhard Fischer et al. (2010). Annotated Checklist of the Vascular Plants of Kakamega Forest, Western Province. Journal of East African Natural History, 99 (2). 2010 (doi 10.2982/028.099.0205). East Africa Natural History Society, Nairobi
United Nations (2006). Official Records of the Economic and Social Council, 2006, Supplement No. 24. (E/2006/44)
Endeleo (2010). Endeleo Manual. http://endeleo.vgt.vito.be/help.html#monitoringtool Retrieved on 19 October 2011
Gachathi, F.N. and Amwatta M. (2005). A Vital Habitat and Drought Coping Strategies in Drylands: The Case of Endau Hilltop Forest, Kitui District, Kenya. International Human Dimensions Programme on Global Environmental Change (IHDP), Bonn, Germany
Gachathi, F.N.M. (1996). Conservation Priorities in the Arid and Semi-Arid Lands: The Case of the Hilltop Forests of Kenya, in the Biodiversity of African Plants. (eds) L.J.G. van der Maesen et al, Kluwer Academic Publishers, Netherlands
LITERATURE CITED

94 Master Plan for Water Catchment Areas
Gachenge, Beatrice (2008). Kenya: Country Scoops Top Tourism Award. Business Daily
Gichuki, F.N., Liniger, H., MacMillan, L.C., Schwilch, G.,Gikonyo, J.K. (1998b). Scarce Water: Exploring Resource Availability, Use and Improved Management. Eastern and Southern Africa Geographical Journal, Vol. 8, September 1998
Gichuki, F.N., Liniger, H., Schwilch, G. (1998a). Knowledge about Highland-Lowland Interactions: The Role of Natural Resource Information System. Eastern and Southern Africa Geographical Journal, Vol. 8, September 1998
Gikonyo, J.K. (1998). River Water Abstraction, Accounting and Allocation. PhD Thesis. University of Nairobi, Nairobi
Githui, F. W. (2008). Assessing the Impacts of Environmental Change on the Hydrology of the Nzoia Catchment, in the Lake Victoria Basin., PhD dissertation, Vrije Universiteit, Brussel, Belgium
Government of Kenya (1974). The Tana and Athi Rivers Development Authority Act, Chapter 443, Laws of Kenya. Nairobi, Kenya: Government Printers
Government of Kenya (1976). Wildlife (Conservation and Management) Act. Laws of Kenya. Nairobi, Kenya: Government Printers
Government of Kenya (1979). Kerio Valley Development Authority Act, Chapter 441, Laws of Kenya. Nairobi, Kenya: Government Printers
Government of Kenya (1979). Lake Basin Development Authority Act, Chapter 442, Laws of Kenya. Nairobi, Kenya: Government Printers
Government of Kenya (1984). Antiquities and Monuments Act, Chapter 215, Laws of Kenya. Nairobi, Kenya: Government Printers
Government of Kenya (1989). Ewaso Ng’iro North Development Authority Act, Chapter 448, Laws of Kenya. Nairobi, Kenya: Government Printers
Government of Kenya (1989). Ewaso Ng’iro South Development Authority Act, Chapter 447, Laws of Kenya. Nairobi, Kenya: Government Printers
Government of Kenya (1990) Coast Development Authority Act, Chapter 449, Laws of Kenya. Nairobi, Kenya: Government Printers
Government of Kenya (1991). Ground Water Resources Assessment of Lamu Island and the Hindi - Mokowe Areas of Lamu District. Coast ASAL Development Project
Government of Kenya (1992). The Costs, Benefits and Unmet Needs of Biological Diversity Conservation in Kenya. A Study Prepared for the Government of Kenya and the United Nations Environment Programme. National Museums of Kenya and Metroeconomica Ltd
Government of Kenya (1999). Environmental Management and Coordination Act of 1999. Nairobi, Kenya: Government Printers
Government of Kenya (1999). Sessional Paper No. 1 of 1999 on Water Resource Management and Development (Water Policy, 1999). Laws of Kenya. Nairobi, Kenya: Government Printers
Government of Kenya (2002). Analytical Report on Population Projections, Volume VIII, Central Bureau of Statistics, 2002
REFERENCES

95Master Plan for Water Catchment Areas
Government of Kenya (2002). Gazette Notice No. 1933 of March 2002
Government of Kenya (2002). The Water Act, 2002. Laws of Kenya. Nairobi, Kenya: Government Printers
Government of Kenya (2003). Economic Recovery Strategy for Wealth and Employment Creation (ERSWEC). Nairobi, Kenya: Government Printers
Government of Kenya (2006). National Museums and Heritage Act. Laws of Kenya. Nairobi, Kenya: Government Printers
Government of Kenya (2007). Kenya Vision 2030. Ministry of State for Planning National Development and Vision 2030. Nairobi, Kenya: Government Printers
Government of Kenya (2007). Status of the Coast Report: Towards an Integrated Management of Kenya’s Coastal and Marine Resources. Nairobi, Kenya: Government Printers
Government of Kenya (2008) Gazette Notice No. 3499 of April 2008. Laws of Kenya. Nairobi, Kenya: Government Printers
Government of Kenya (2008). Final Draft (Revised) Sessional Paper on National Wetlands Conservation and Management. Ministry of Environment and Mineral Resources. Nairobi, Kenya: Government Printers
Government of Kenya (2008). Sector Plan for Environment, Water and Sanitation 2008-2012. Ministry of Planning, National Development and Vision 2030. Nairobi, Kenya: Government Printers
Government of Kenya (2009). Environmental Management and Coordination (Wetlands, River Banks, Lake Shores and Sea Shore Management) Regulations. Legal Notice No. 19. Laws of Kenya. Nairobi, Kenya: Government Printers
Government of Kenya (2009). Legal Notice No. 166: The Agriculture Act Chapter 318 – The Agriculture (Farm Forestry) Rules. Laws of Kenya. Nairobi, Kenya: Government Printers
Government of Kenya (2009). Sessional Paper No. 3 of 2009 on National Land Policy. Laws of Kenya. Nairobi, Kenya: Government Printers
Government of Kenya (2009). Sessional paper No. 3 of 2009 on the National Land Policy. Ministry of Lands. Nairobi, Kenya: Government Printer.
Government of Kenya (2010). 2009 Kenya Population and Housing Census, Volume 1A, 1B, 1C and Volume II. KNBS. Nairobi, Kenya: Government Printers
Government of Kenya (2010). Agricultural Sector Development Strategy 2010-2020. Nairobi, Kenya: Government Printers
Government of Kenya (2010). Constitution of Kenya 2010. Nairobi, Kenya: Government Printers
Government of Kenya (2010). Economic Stimulus Package. www.economicstimulus.go.ke Retrieved on 19 October 2011
Government of Kenya (2010). National Climate Change Response Strategy. Nairobi, Kenya: Government Printers
Government of Kenya (2010). National Climate Change Response Strategy Government of Kenya 2010
Government of Kenya (2010). Statistical Abstracts. KNBS. Nairobi, Kenya: Government Printers
REFERENCES

96 Master Plan for Water Catchment Areas
Government of Kenya (2011). Atlas of the Changing Environment, 2011
Government of Kenya (2011). Economic Survey 2011
Government of Kenya (March 2002). Gazette Notice No. 1933. Laws of Kenya. Nairobi, Kenya: Government Printers
Government of Tanzania (March, 1998). The National Forest Policy. Ministry of Natural Resources and Tourism, Dar es Salaam
Griffin, J., Cumming, D., Metcalfe, S., t’Sas-Rolfes, M. and Singh. J. (1999). Transboundary Natural Resource Management in Southern Africa: Main Report. Biodiversity Support Program, c/o World Wildlife Fund, Washington, D.C.
Hastenrath, Stefan (1990) the Relationship of Highly Reflective Clouds to Tropical Climate Anomalies. Journal of Climate, Volume 3, Issue 3, 1990
Hecky, R. E.and F. W. B. Bugenyi. 1992. Hydrology and chemistry of the African Great Lakes and Water Quality Issues: Problems and Solutions. Mitt. Int. Ver. Theor. Angew. Limnol. 23, p. 45-54
International Monetary Fund, Poverty Reduction Strategy Paper, 2001-2004. IMF Country Report No. 05/11. 2005
IPCC (2007). Fourth Assessment Report of the Intergovernmental Panel on Climate Change. Cambridge, United Kingdom and New York, USA: Cambridge University Press
IPCC (2001). Third Assessment Report of the Intergovernmental Panel on Climate Change. Cambridge University Press, Cambridge, United Kingdom, and New York, USA
IUCN (1996). IUCN Red List of Threatened Animals. IUCN, Gland, Switzerland and Cambridge, UK
Jaetzold, R. and Schmidt, H. (1983). Farm Management Handbook of Kenya Vol. II Part A. West Kenya MALD, Kenya
Kabuye, Christine H. S. ed. (1996). Indigenous Knowledge for Biodiversity and Development: Proceedings of a National Workshop on Indigenous Knowledge (July 01-03 1996), National Museums of Kenya, Nairobi
Kameri-Mbote, P. (2002). Property Rights and Biodiversity Management in Kenya. Acts Press, Nairobi
Karanja F., Tessema Y., and Barrow E. (2002). Equity in the Loita/Purko Naimina Enkiyio Forest in Kenya: Securing Maasai Rights to and Responsibilities for the Forest. IUCN Eastern Africa Regional Office, Nairobi
KEFRI (1992). A Dryland Forestry Handbook for Kenya. Kenya Forestry Research Institute, Nairobi
Kenya Land Alliance (2004). The National Land Policy in Kenya: Critical Public Land Issues and Policy Statements
Khan, S. I., Adhikari, P., Hong, Y., Vergara, H., F Adler, R., Policelli, F., Irwin, D., Korme, T., and Okello, L. (2011). Hydroclimatology of Lake Victoria Region Using Hydrologic Model and Satellite Remote Sensing Data, Hydrol. Earth Syst. Sci., 15
KIFCON (1993). A National Profile of Kenya’s Indigenous Forests. KIFCON, F.D. MENR. Nairobi
Kinyanjui (2011). NDVI Base Forest Vegetation Monitoring in the Mau Forest Complex. African Journal of Ecology 49:165-174
REFERENCES

97Master Plan for Water Catchment Areas
Kruchek, B.L. (2003). Extending Wetlands Protection under the Ramsar Treaty’s Wise Use Obligation, 20(2) Arizona Journal of International and Comparative Law 404-441) at 409
Kusler, J. (1990). Wetlands Delineation: An Issue of Science or Politics? 34 Environment 7
KWAHO (2009). Enhancing Water and Sanitation in Kenya, Human Rights Based Approach in the Kenyan Water Sector by Kenya Water for Health Organisation December 2009
Kyosingira F. W., Nakato, M.D., Twikirize, D and Twinimuhangi, M. (2011). A Case Study of River Rwizi, Lake Wamala, Lake Victoria Catchments and Representative Groundwater Monitoring Stations. Document of Directorate of Water Resource Management
Purdue and Moi Universities (2009). The Long-Term Strategic Partnership: Purdue and Moi Universities
LVEMP (2001). Integrated Water Quality/Limnology Study of Lake Victoria: Final Technical Report. COWI/DHI, Denmark
Mati, B. M., Mtalo, F., and Mtalo, G.E. (2005). Use of Geospatial Tools for Planning and Sustainable Management of Hydrological Determinants in the Mara Basin. Proceedings of the 3rd EARSeL Workshop on Remote Sensing for Developing Countries. National Research Centre, Cairo, Egypt, 26-29 September 2004
Matiru, Violet (2000). Forest Covers and Forest Reserves in Kenya Policy and Practice. December 1999
McGraw-Hill (2002). The McGraw-Hill Dictionary of Scientific and Technical Terms, Sixth Edition. New York, New York: McGraw-Hill Book Company, Inc
Mogaka Hezron, Samuel Gichere, Richard Davis and Rafik Hirji, (2006). Climate Variability and Water Resources Degradation in Kenya: Improving Water Resources Development and Management World Bank Working Paper No. 69
Mozammel, Masud and Schechter, Galia (2005). Strategic Communication for Community Driven Development. A Practical Guide for Project Managers and Communication Practitioners. World Bank Publications
Mugidde R. (1993). The Increase in Phytoplankton Primary Productivity and Biomass in Lake Victoria (Uganda). Ver. int. Ver. Limnol. 25, 846–849
Mugo, F. and Gathui, T. (2010). Biomass Energy Use in Kenya. A Background Paper Prepared for the International Institute for Environment and Development (IIED) for an International ESPA Workshop on Biomass Energy, 29-21 October 2010, Parliament House Hotel, Edinburgh
Mumma, A. “Kenya’s New Water Law: An Analysis of the Implications for the Rural Poor,” Paper Presented at an International Workshop on Africa’s Water Laws: Plural Legislative Frameworks for Rural Water Management in Africa, 26-28 January 2006, Johannesburg, South Africa
Munyamwezi, Eugen M., Draft Rules to Govern Water Resource Management in Kenya
Muthuri C. W., Ong, C.K., Black C.R., Mati, B.M., Ngumi, V.W., and Van-Noordwijk M. (2004). Modelling the Effects of Leafing Phenology on Growth and Water Use by Selected Agroforestry Tree Species in Semi-Arid Kenya”. Land Use and Water Resources Research 4
Myers, N., Mittermeier, R.A., Mittermeier, C.G., da Fonseca, G.A.B. and Kent, J. (2000), “Biodiversity Hotspots for Conservation Priorities” Nature, 403, 853-858
REFERENCES

98 Master Plan for Water Catchment Areas
REFERENCES
Nagai, Masa (2009). UNEP’s Environmental Governance, www.unep.org/pdf/brochures/EnvironmentalGovernance.pdf Retrieved on 19 October 2011
Ngigi, Stephen N., Savenije, Hubert H. G., and Gichuki, Francis N. (2008). Hydrological Impacts of Flood Storage and Management on Irrigation Water Abstraction in Upper Ewaso Ng’iro River Basin, Kenya Water Resource Management (2008) 22:1859–1879
Nicholson, S. and Yin, X. (2001). Rainfall Condition in Equatorial East Africa during the Nineteenth Century as Inferred from the Record of Lake Victoria. Climate Change 48
Ochumba P. B. O. and Kibaara D. I. (1989). Observations on Bluegreen Algal Blooms in the Open Waters of Lake Victoria, Kenya. Afr. J. Ecol. 27, 23–34
Odingo, R. S. (1962). The Abnormal and Unseasonal Rains in East Africa. Geographical Review. 52
Odote, Collins (2008). Wise Use and Sustainable Management of Wetlands in Kenya. in Okidi, C.O., et al Environmental Governance in Kenya: Implementing the Framework Law (East African Educational Publishers Ltd, Nairobi, 2008)
Odote, Collins (2010), “Regulating Property Rights To Ensure Sustainable Management of Wetlands In Kenya,” PhD Thesis, School of Law, University of Nairobi
Ogallo L. J., Okoola R. E., Wanjohi D. N. (1993) Characteristics of Quasi-Biennial Oscillation over Kenya and their Predictability Potential for the Seasonal Rainfall. Journal of the African Meteorological Society, Nairobi
Ogutu, Z. A.; Misana, S.; and Mwaka, V. (2005). Land Use Research in the Lake Victoria Basin: Analysis and Synthesis. IUCEA, SIDA
Okelo, Malachi O., Ussenge, S. B. (2010). Land Use Impact in River Njoro Watershed. IAIA09 Conference Proceedings, Impact Assessment and Human Wellbeing 29th Annual Conference of the International Association for Impact Assessment, 16-22 May 2009, Accra International Conference Centre
Okidi, C. O., Kameri-Mbote, P. and Akech, M. eds. (2008). Environmental Governance in Kenya: Implementing the Framework Law. East African Educational Publishers Ltd, Nairobi
Olum, John (2008). Water Resources Issues and Intervention in Kenya. in Proceedings of the International Executive Seminar: Earth Observation for Improving Water Management in Africa. 23-25 September 2008, ITC Enschede, the Netherlands
Roimen, H.P. (2008). Inventory and Monitoring of Invasive Water Weeds in Lakes and Rivers of Kenya. 2008 Technical Report No. 171
Routsalainea, Anna (2004). Kenya Forestry Master Plan – Recognition of Local Forest Users
Ruggie, J.G., 2004, “Reconstituting the Global Public Domain: Issues, Actors and Practices” European Journal of International Relations 10(4)
Sang, Joseph K. (2005). Modelling the Impact of Changes in Land Use, Climate and Reservoir Storage on Flooding in the Nyando basin MSc Thesis (Unpublished)
Scheren P. A. G. M., Zanting, H. A., and Lemmens, A. M. C. (2000). Estimation of Water Pollution Sources in Lake Victoria, East Africa: Application and Elaboration of the Rapid Assessment Methodology. Journal of Environmental Management

99Master Plan for Water Catchment Areas
REFERENCES
Scheren, P. (1995). A Systematic Approach to Lake Water Pollution Assessment: Water Pollution in Lake Victoria, East Africa. Eindhoven University of Technology.
Scott, D.F., Lesch, W. (1997). Streamflow Responses to Afforestation with Eucalyptus Grandis and Pinus Patula and to Felling in the Mokobulaan Experimental Catchments, South Africa. J. Hydrol
Simiyu, S. M. (2010). Status of Geothermal Exploration in Kenya and Future Plans for its Development. Proceedings from World Geothermal Congress 2010, Bali, Indonesia
Space, J. C., Waterhouse, B.M., Miles, J. E., Tiobech, J. and Rengulbai, K., (2003). Report to the Republic of Palau on Invasive Plant Species of Environmental Concern. USDA Forest Service, Honolulu
Stager, J. C. and Johnson, T. C. (2007). The Late Pleistocene Desiccation of Lake Victoria and the Origin of Its Endemic Biota: A Case Study of River Rwizi, Lake Wamala, Lake Victoria Catchments and Representative Groundwater Monitoring Stations. Document of Directorate of Water Resource Management
Thompson, L.G., et al. (2002). Kilimanjaro Ice Core Records: Evidence of Holocene Climate Change in Tropical Africa. Science, 298
Trapnell, C.G. (1997). Biodiversity and Conservation of the Indigenous Forests of the Kenya Highlands
United Nations (1992). Agenda 21: Programme of Action for Sustainable Development. United Nations Conference on Environment and Development (UNCED). New York: United Nations
Vreugdenhil, D., Terborgh, J., Cleef, A.M., Sinitsyn, M., Boere, G.C., Archaga, V.L., Prins, H.H.T., 2003, Comprehensive Protected Areas System Composition and Monitoring, IUCN, Gland, Switzerland
Warren, D. M. (1992). Indigenous Knowledge, Biodiversity Conservation and Development. Keynote Address at International Conference on Conservation of Biodiversity in Africa: Local Initiatives and Institutional Roles. 30 August to 03 September. Nairobi, Kenya.
Wass, P. (ed.). 1995: Kenya’s Indigenous Forests: Status, Management and Conservation. IUCN, Gland Switzerland and Cambridge, UK
Wetlands International (2011): Wetlands and Biodiversity. http://japan.wetlands.org/tabid/1789/language/en-US/Default.aspx Retrieved on 19 October 2011
World Bank, Managing Development: The Governance Dimension, 1991, www-wds.worldbank.org/external/default/WDSContentServer/WDSP/IB/2006/03/07/000090341_20060307104630/Rendered/PDF/34899.pdf Retrieved on 19 October 2011

100 Master Plan for Water Catchment Areas
CONSERVATION AND SUSTAINABLE MANAGEMENT OF
WATER CATCHMENT AREAS

101Master Plan for Water Catchment Areas
APPENDICES

102 Master Plan for Water Catchment Areas
APPENDIX 1.
GAZETTED MEMBERS OF THE TASKFORCE
Name
Hassan Noor Hassan (Chairperson)
Prof. Joy Obando (Vice-Chairperson)
Esther N. Ndirangu
Henry Njuguna
Beatrice Manyonge
Lorna Akoth Odero
Zaverio N. Njeru
Erastus M. Wahome
Michael Gachanja
Prof. Moses Imo
Dr. Helida Oyieke
Anne Nyakihu Mukoma
Esther Muiruri
Dr. Alice Kaudia (Secretary)
Esther Kathure Magambo
Raphael Mwatha
William Ogolla
Francisca Wamboi
Francis N. Gachathi
Peter Mule Makau
Esau Omolo
Institution
Office of the Deputy Prime Minister and Ministry of Local Government
Kenyatta University
Ministry of Gender, Children and Social Services
Water Resources Management Authority
Ministry of State for Planning, National Development and Vision 2030
Ministry of State for Provincial Administration and Internal Security
Ministry of Youth Affairs and Sports
Office of The Deputy Prime Minister and Ministry of Finance
East African Wildlife Society
Moi University
National Museums of Kenya
Ministry of Youth Affairs and Sports
Equity Bank
Ministry of Environment and Mineral Resources
Ministry of Agriculture
Ministry of Fisheries Development
Ministry of Regional Development Authorities
Kenya Wildlife Service
Kenya Forestry Research Institute
Eco Bank
Kenya Forest Service

103Master Plan for Water Catchment Areas
Name
Paul Kere
Isabella A. Masinde
Dr. Mwangi Kinyanjui
Kimani J. N.
Wilfred Amollo
King’uru Wahome
Faith T. Pesa
Ernest Mwangi Maina
Aristarico Onyango
Philip Munah
Veronica Kioko
Mary S. Tiges
Lorraine Kojwang’
Institution
Ministry of Environment and Mineral Resources
Technical Advisor Environmental Policy, Natural Resources Management Programme
Department of Resource Survey and Remote Sensing
Coordinator Natural Resources Management Programme
Ministry of Environment and Mineral Resources
Ministry of Environment and Mineral Resources
Ministry of Environment and Mineral Resources
National Environmental Management Authority
Department of Mines and Geology
Kenya Meteorological Department
Ministry of Environment and Mineral Resources
Ministry of Environment and Mineral Resources
Ministry of Environment and Mineral Resources
Name
Hassan Noor Hassan, EBS
Prof. Joy Obando
Henry Njuguna
Beatrice Manyonge
Lorna Akoth Odero, OGW
Zaverio N. Njeru
Institution
Office of the Deputy Prime Minister and Ministry of Local Government
Kenyatta University
Water Resources Management Authority
Ministry of State for Planning, National Development and Vision 2030
Ministry of State for Provincial Administration and Internal Security
Ministry of Youth Affairs and Sports
SECRETARIAT WATER CATCHMENT AREA
CHAPTER DRAFTERS AND REVIEWERS

104 Master Plan for Water Catchment Areas
APPENDIX 2.
TERMS OF REFERENCE OF TASKFORCE
1. Prepare a work plan for the taskforce activities
2. Study existing legislation, policies and other relevant documents regarding the management of water catchment areas and identify any gaps in the existing legislation, policies and other relevant documents
3. Identify, map and document water catchment areas in the country including areas that have ceased to be catchment areas for reasons to be identified by the taskforce
4. Document the environmental status of each water catchment area
5. Recommend appropriate intervention measures for each water catchment area
6. Prepare an action plan for the implementation of the recommendations
7. Draft a Master Plan for the Sustainable Management of Water Catchment Areas
8. Identify potential sources of resources, both financial and human for undertaking the recommended interventions
9. Elect its chairperson
10. Identify and co-opt other members or any other resource provided that the co-opted members do not exceed one third of the taskforce
Erastus M. Wahome
Michael Gachanja
Dr. Helida Oyieke
Dr. Alice Kaudia, HSC
Raphael Mwatha
Francis N. Gachathi
Paul Kere
Isabella A. Masinde
Dr. Mwangi Kinyanjui
Faith T. Pesa
Lorraine Kojwang’
Office of The Deputy Prime Minister and Ministry of Finance
East African Wildlife Society
National Museums of Kenya
Ministry of Environment and Mineral Resources
Ministry of Fisheries Development
Kenya Forestry Research Institute
Ministry of Environment and Mineral Resources
Technical Advisor Environmental Policy, Natural Resources Management Programme
Department of Resource Survey and Remote Sensing
Ministry of Environment and Mineral Resources
Ministry of Environment and Mineral Resources

105Master Plan for Water Catchment Areas
APPENDIX 3.
POPULATION BY COUNTY, GENDER AND YOUTH (2009)
S/NO.
1.
2.
3.
4.
5.
6.
7.
8.
9.
10.
11.
12.
13.
14.
15.
16.
17.
18.
19.
20.
21.
22.
23.
24.
25.
26.
27.
County
Nairobi
Mombasa
Kwale
Kilifi
Tana River
Lamu
Taita Taveta
Garissa
Wajir
Mandera
Marsabit
Isiolo
Meru
Tharaka
Embu
Kitui
Machakos
Makueni
Nyandarua
Nyeri
Kirinyaga
Murang’a
Kiambu
Turkana
West Pokot
Samburu
Trans Nzoia
Males
1,605,230
486,924
315,997
535,526
119,853
53,045
145,334
334,939
363,766
559,943
151,112
73,694
671
178,451
254,303
481,282
543,139
430,710
292,155
339,725
260,630
457,864
802,809
445,089
254,827
112,007
407,172
Females
1,533,139
452,446
333,934
574,209
120,222
48,494
139,323
288,121
298,175
465,813
140,054
69,600
685,645
186,879
261,909
531,427
555,445
453,817
304,113
353,833
267,424
484,717
820,673
410,330
257,883
111,940
411,585
Youth Population
1,171,901
328,712
184,374
244,375
59,252
21,572
77,496
96,931
74,534
71,393
50,849
28,773
473,770
31,244
192,164
260,298
317,396
255,894
159,283
214,560
185,878
221,591
487,877
162,334
89,137
42,060
255,197
Total
3,138,369
939,370
649,931
1,109,735
240,075
101,539
284,657
623,060
661,941
1,025,756
291,166
143,294
1,356,301
365,330
516,212
1,012,709
1,098,584
844,527
596,268
693,558
528,054
942,581
1,623,282
855,399
512,690
223,947
818,757

106 Master Plan for Water Catchment Areas
28.
29.
30.
31.
32.
33.
34.
35.
36.
37.
38.
39.
40.
41.
42.
43.
44.
45.
46.
47.
Uasin Gishu
Elgeyo Marakwet
Nandi
Baringo
Laikipia
Nakuru
Narok
Kajiado
Bomet
Kericho
Kakamega
Vihiga
Bungoma
Busia
Siaya
Kisumu
Homa Bay
Migori
Kisii
Nyamira
Kenya(Total)
448,994
183,738
378,488
279,081
198,625
804,582
429,026
345,146
359,727
381,980
800,989
262,716
795,595
232,075
398,652
474,760
462,454
444,356
550,464
287,048
19,192,458
445,185
186,280
376,477
276,480
200,602
798,743
421,894
342,166
364,459
376,359
859,662
291,906
835,339
256,000
443,652
494,149
501,340
472,814
601,818
311,204
19,417,639
894,179
369,998
752,965
555,581
399,227
1,603,325
850,920
687,312
724,186
758,339
1,660,651
554,622
1,630,934
488,075
842,304
968,909
963,794
917,170
1,152,282
598,252
38,610,097
288,688
106,171
198,600
150,803
129,987
433,885
159,759
166,285
127,102
291,560
367,456
161,827
370,149
179,041
208,148
311,376
224,325
208,855
171,941
325,777
10,340,580

107Master Plan for Water Catchment Areas
APPENDIX 4.
LOCATION AND STATUS OF THE MAIN WATER CATCHMENT AND SUB-CATCHMENT AREAS
Catchment Area
Aberdare Ranges
Mountain ranges (3,994m), natural montane forests and plantations, 2,000 – 3,000m a.s.l.
Mt. Kenya
Mountain (5,199m.), natural montane forests and plantations, 2,000 – 3,000m a.s.l.
Mt. Elgon
Mountain (4,321m.), natural montane forests and plantations, 1900 – 3,000m a.s.l.
Cherangany Hills
Series of hills with natural forests and plantations, forms the western escarpment of Kerio Valley 1,900 – 3,000m a.s.l.
Location/County
Central Kenya.
Nyeri, Laikipia, Nyandarua, Murang’a, Kiambu
Central Kenya.
Nyeri, Meru, Kirinyaga, Embu
Western Kenya (cross-border with Uganda).
Trans Nzoia, Bungoma, Mt. Elgon
Rift Valley
West Pokot, Elgeyo Marakwet, Trans Nzoia
Main Catchment/Major Rivers
Tana River, Ewaso Ng’iro and Athi River systems
Chania, Thika, Kimakia, Gatamaiyu, Gura, Thiririka, Zuti, Zaina, Thengeraini, Komothai, Theta, Kariminu, Sasumua, Maela, Bathi, Kiburu
Tana River and Ewaso Ng’iro River systems.Chehe, Ragati, Hombe, Muhohi, Mathira, Kamuya, Nairobi, Sagana, Naromoru and Gathiuru, Liki, Ontulili, Timau, Nanyuki, Ngara-Ndare, Ethi, Marania, Kathita, Kanyaritha, Gachiuma, Gatobora, Mutonga, Mara and Nithi, Nyamindi, Rumido, Karinga, Thiba, Kamweti and Nyaga, Thuchi, Thambana, Kie and Rupingazi
Suam/Turkwell (Lake Turkana), Nzoia and Malakisi (Lake Victoria) River systems
Suam, Kaibei, Kimothon, Mubere, Kiptogot, Suam, Kapteka,Kamjong, Chepchoinor, Labaa, Kibisi, Kimilili, Kapkateny, Kitamani, Chepkungwi, Kikuk and Chepbirbey
Lake Victoria, Turkana and Baringo
Nzoia, Turkwel (source of Turkwel Gorge dam), Chebiemit (source of Chebara dam for Eldoret Municipality), Sosian, Chepkoilel, Kapteret, Suguta, Kerio and others
Threats
Encroachment, high water use, illegal logging, charcoal burning, firewood collection, illegal grazing, cultivation, climate change effect
Encroachment, high water use, illegal logging, charcoal burning, firewood collection, illegal grazing, cultivation, loss of mountain glaciers, climate change effect
Encroachment, high water use, illegal logging, charcoal burning, firewood collection, illegal grazing, cultivation.
Encroachment, high water use, illegal logging, charcoal burning, firewood collection, illegal grazing, cultivation.

108 Master Plan for Water Catchment Areas
Mau Forest
Natural montane forests and plantations, 1,900 – 3,000m a.s.l.
Nandi Forest
Natural tropical rain forests and plantations, 1,700-1,850m a.s.l.
Marmanet/Ol Arabel Forest
Upland Dry Forest and plantations, 1,550-1,650m a.s.l.
Bahati Forest
Natural Upland Dry Forest and plantations, 2,100-2,800m a.s.l.
Tugen Hills
Hilltop Forests, 1,800-2,500m a.s.l.
Karasuk/Loima Hills
Hilltop Forests, 2,100-2,700m a.s.l.
Elgeyo-Marakwet EscarpmentEscarpment, Dry Forests, 1,900-3,000m. a.s.l.
Rift Valley
Kericho, Nakuru, Narok
Western Kenya
Kakamega
Rift ValleyNandi County
Rift Valley
Laikipia
Rift Valley
Nakuru
Rift Valley
Baringo
Rift Valley
Turkana
Rift Valley
Elgeyo-Markwet
Lake Victoria, Nakuru and Baringo
Mara, Ewaso Ng’iro South, Molo, Kedowa, Rongai, Mau, Eldama Ravine, Perkera, Narosura, Arama, Keringet, Baraget, Chania, Ruiru, Baruk, Wanyororo, Kiamunyeki, Nabkoi, Kipkaren, Kerio and Nyando.
River Yala system for Lake Victoria
Isiukhu, Ikunywa, Lugusisi, Shitiya, Musimi, Sirwa and Mitobi
River Yala and tributaries of Nyando River system, for Lake Victoria
Ewaso Ng’iro North River system
Lake Nakuru, Lake Bogoria
Lake Baringo, Perkerra, Kerio, and Suguta River systems
Turkwell River system
Kerio River system
Encroachment, high water use, illegal logging, charcoal burning, firewood collection, illegal grazing, cultivation.
Encroachment, high water use, illegal logging, charcoal burning, firewood collection, illegal grazing, cultivation. Encroachment, high water use, illegal logging, charcoal burning, firewood collection, illegal grazing, cultivation. Encroachment, high water use, illegal logging, charcoal burning, firewood collection, illegal grazing, cultivation
Encroachment, high water use, illegal logging, charcoal burning, firewood collection, illegal grazing, cultivation .
Encroachment, high water use, illegal logging, charcoal burning, firewood collection, illegal grazing, cultivation
Encroachment, high water use, charcoal burning, firewood collection, grazing. Encroachment, high water use, illegal logging, charcoal burning, firewood collection.
APPENDIX 4.LOCATION AND STATUS OF THE MAIN WATER
CATCHMENT AND SUB-CATCHMENT AREAS
Catchment Area Location/County Main Catchment/Major Rivers Threats

109Master Plan for Water Catchment Areas
APPENDIX 4.LOCATION AND STATUS OF THE MAIN WATER
CATCHMENT AND SUB-CATCHMENT AREAS
Catchment Area Location/County Main Catchment/Major Rivers Threats
Kikuyu Escarpment
Escarpment Dry Forest and plantations, 1,800-2,250m. a.s.l.
Kiganjo
Upland Dry Forest, 1,650-1,800m. a.s.l.
Kirisia (Leroghi) Hills
Hilltop Dry Forest, 2,000-2,500m. a.s.l.
Loita HillsHills, Dry Forest 2,300-2,500m. a.s.l.
Siria
Plateau Forest 1,600-1,800m. a.s.l.
Mathews Range (Ol Doinyo Lenkiyo)
Mountain ranges about 150km long. (2,375m a.s.l.), natural montane forest
Mt. Marsabit
Low Mountain, dry forests, 1,165-1,500m a.s.l.
Maungu Hills
Hilltop forest, 900-1,000m a.s.l.
Ndoto Mountains
Low Mountain dry forests, 1,400-2,600m a.s.l.
Central Kenya
Kiambu
Central Kenya
Nyeri
Rift Valley
Samburu
Rift Valley
Narok
Rift Valley
Narok
Northern Kenya
Samburu
Northern Kenya
Marsabit
Coastal
Taita-Taveta
Northern Kenya
Samburu
Kedong river system
Ewaso Ng’iro river system
Ewaso Ng’iro North system, seasonal for Milgis River
Local catchment
Migori and Mara River systems
Ewaso Ng’iro and Milgis River systems
Ngeng river
Local catchment
Local catchment
Local catchment and seasonal for the Milgis lugga
Encroachment, high water use, illegal logging, charcoal burning, firewood collection, illegal grazing, cultivation.
Encroachment, high water use, illegal logging, charcoal burning, firewood collection, illegal grazing, cultivation
Encroachment, high water use, illegal logging, charcoal burning, firewood collection
Encroachment, high water use, illegal logging, charcoal burning, firewood collection
Encroachment, high water use, illegal logging, charcoal burning, firewood collection
High water use, over grazing
High water use, over grazing
Encroachment, high water use, charcoal burning, firewood collection, grazing
High water use, over grazing
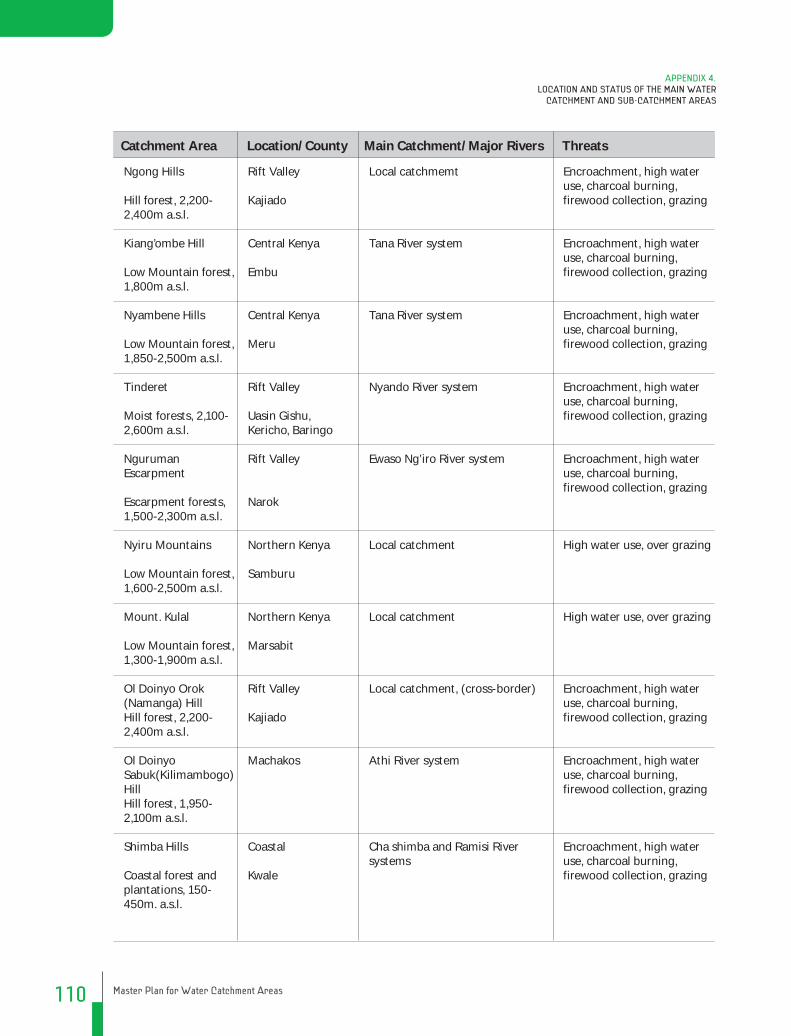
110 Master Plan for Water Catchment Areas
Ngong Hills
Hill forest, 2,200-2,400m a.s.l.
Kiang’ombe Hill
Low Mountain forest, 1,800m a.s.l.
Nyambene Hills
Low Mountain forest, 1,850-2,500m a.s.l.
Tinderet
Moist forests, 2,100-2,600m a.s.l.
Nguruman Escarpment
Escarpment forests, 1,500-2,300m a.s.l.
Nyiru Mountains
Low Mountain forest, 1,600-2,500m a.s.l.
Mount. Kulal
Low Mountain forest, 1,300-1,900m a.s.l.
Ol Doinyo Orok (Namanga) HillHill forest, 2,200-2,400m a.s.l.
Ol Doinyo Sabuk(Kilimambogo) HillHill forest, 1,950-2,100m a.s.l.
Shimba Hills
Coastal forest and plantations, 150-450m. a.s.l.
Rift Valley
Kajiado
Central Kenya
Embu
Central Kenya
Meru
Rift Valley
Uasin Gishu, Kericho, Baringo
Rift Valley
Narok
Northern Kenya
Samburu
Northern Kenya
Marsabit
Rift Valley
Kajiado
Machakos
Coastal
Kwale
Local catchmemt
Tana River system
Tana River system
Nyando River system
Ewaso Ng’iro River system
Local catchment
Local catchment
Local catchment, (cross-border)
Athi River system
Cha shimba and Ramisi River systems
Encroachment, high water use, charcoal burning, firewood collection, grazing
Encroachment, high water use, charcoal burning, firewood collection, grazing
Encroachment, high water use, charcoal burning, firewood collection, grazing
Encroachment, high water use, charcoal burning, firewood collection, grazing
Encroachment, high water use, charcoal burning, firewood collection, grazing
High water use, over grazing
High water use, over grazing
Encroachment, high water use, charcoal burning, firewood collection, grazing
Encroachment, high water use, charcoal burning, firewood collection, grazing
Encroachment, high water use, charcoal burning, firewood collection, grazing
Catchment Area Location/County Main Catchment/Major Rivers Threats
APPENDIX 4.LOCATION AND STATUS OF THE MAIN WATER
CATCHMENT AND SUB-CATCHMENT AREAS

111Master Plan for Water Catchment Areas
Catchment Area Location/County Main Catchment/Major Rivers Threats
APPENDIX 4.LOCATION AND STATUS OF THE MAIN WATER
CATCHMENT AND SUB-CATCHMENT AREAS
Taita Hills
Various hills including Mbololo, Ngangao, Chawia, Sagala, Vuria 1,350-2,270m. a.s.l.
Taveta (Kitovo) Lumi
Ground water forest
Mount. Kasigau
Low mountain with forest, 1,400-1,550m. a.s.l.
Mangea
Coastal forest
Kitui HillsVarious hills including: Endau, Mutha, Mutitu, Makongo, Nuu, Nthoani, Kabonge, Kyawea etc.
Machakos HillsVarious hilltop forests generally below 1,800m. a.s.l. e.g. Nzaui, Kibauni
Chyulu HillsVarious ridges, 1,400-1,750m a.s.l. hilltop forests
Coastal
Taita-Taveta
Coastal
Taita-Taveta
Coastal
Taita-Taveta
Coastal
Kilifi
Kitui
Machakos
Makueni, Kajiado, Taita Taveta
Voi River systems
Lumi River system
Local catchment
Local catchment
Local catchments
Local and general catchment for Athi River system
Mzima springs, Tsavo and Athi/Galana river systems
Encroachment, high water use, charcoal burning, firewood collection, grazing
Encroachment, high water use, charcoal burning, firewood collection, grazing Encroachment, high water use, charcoal burning, firewood collection, grazing
Encroachment, high water use, charcoal burning, firewood collection, grazing
Encroachment, high water use, charcoal burning, firewood collection, grazing
Encroachment, high water use, charcoal burning, firewood collection, grazing
Encroachment, high water use, charcoal burning, firewood collection, grazing
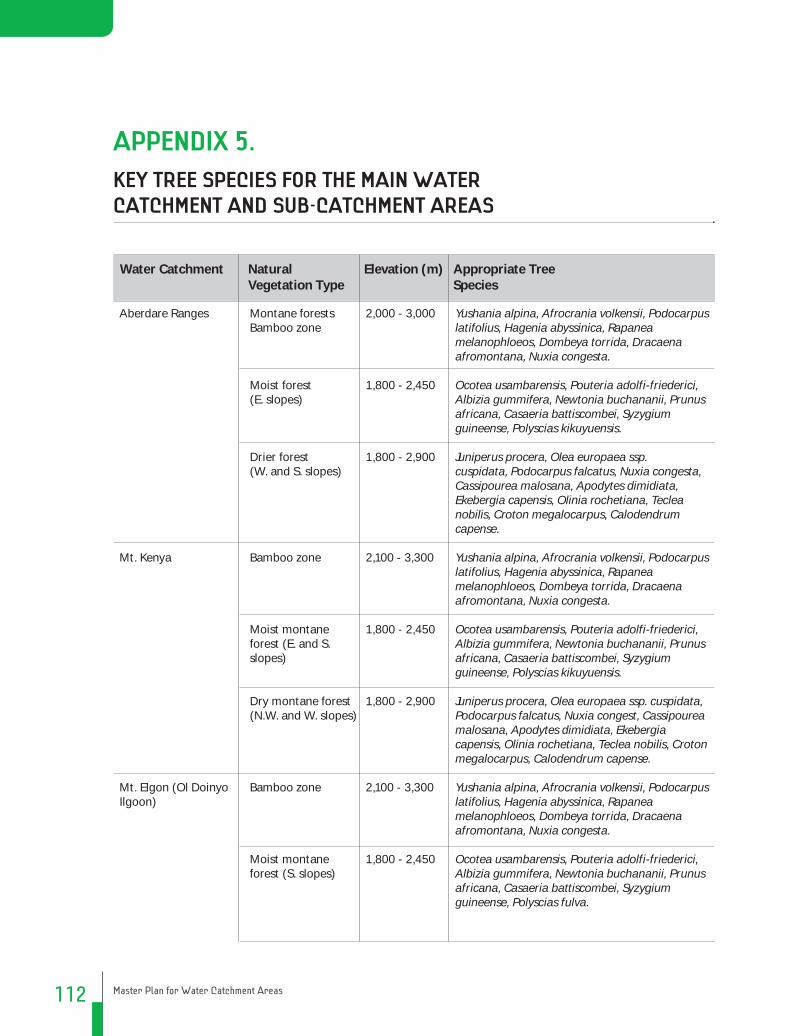
112 Master Plan for Water Catchment Areas
APPENDIX 5.
KEY TREE SPECIES FOR THE MAIN WATER CATCHMENT AND SUB-CATCHMENT AREAS
Aberdare Ranges
Mt. Kenya
Mt. Elgon (Ol Doinyo Ilgoon)
Montane forestsBamboo zone
Moist forest(E. slopes)
Drier forest(W. and S. slopes)
Bamboo zone
Moist montane forest (E. and S. slopes)
Dry montane forest (N.W. and W. slopes)
Bamboo zone
Moist montane forest (S. slopes)
2,000 - 3,000
1,800 - 2,450
1,800 - 2,900
2,100 - 3,300
1,800 - 2,450
1,800 - 2,900
2,100 - 3,300
1,800 - 2,450
Yushania alpina, Afrocrania volkensii, Podocarpus latifolius, Hagenia abyssinica, Rapanea melanophloeos, Dombeya torrida, Dracaena afromontana, Nuxia congesta.
Ocotea usambarensis, Pouteria adolfi-friederici, Albizia gummifera, Newtonia buchananii, Prunus africana, Casaeria battiscombei, Syzygium guineense, Polyscias kikuyuensis.
Juniperus procera, Olea europaea ssp. cuspidata, Podocarpus falcatus, Nuxia congesta, Cassipourea malosana, Apodytes dimidiata, Ekebergia capensis, Olinia rochetiana, Teclea nobilis, Croton megalocarpus, Calodendrum capense.
Yushania alpina, Afrocrania volkensii, Podocarpus latifolius, Hagenia abyssinica, Rapanea melanophloeos, Dombeya torrida, Dracaena afromontana, Nuxia congesta.
Ocotea usambarensis, Pouteria adolfi-friederici, Albizia gummifera, Newtonia buchananii, Prunus africana, Casaeria battiscombei, Syzygium guineense, Polyscias kikuyuensis.
Juniperus procera, Olea europaea ssp. cuspidata, Podocarpus falcatus, Nuxia congest, Cassipourea malosana, Apodytes dimidiata, Ekebergia capensis, Olinia rochetiana, Teclea nobilis, Croton megalocarpus, Calodendrum capense.
Yushania alpina, Afrocrania volkensii, Podocarpus latifolius, Hagenia abyssinica, Rapanea melanophloeos, Dombeya torrida, Dracaena afromontana, Nuxia congesta.
Ocotea usambarensis, Pouteria adolfi-friederici, Albizia gummifera, Newtonia buchananii, Prunus africana, Casaeria battiscombei, Syzygium guineense, Polyscias fulva.
Water Catchment Natural Vegetation Type
Elevation (m) Appropriate Tree Species

113Master Plan for Water Catchment Areas
APPENDIX 5.KEY TREE SPECIES FOR THE MAIN WATER
CATCHMENT AND SUB-CATCHMENT AREAS
Water Catchment Natural Vegetation Type
Elevation (m) Appropriate Tree Species
Cherangany Hills
Mau Forest
Kakamega Forest
Nandi Forest
Dry montane forest (N. and E. slopes)
Bamboo woodland
Moist montane forest (lower parts of Kiptaberr-Kapkanyar)
Dry montane forest (S. and E. slopes)
Bamboo woodland
Moist montane forest (S.W. Mau)
Dry montane forest (N., N.E., S.E. higher elevation)
Tropical Rain Forest
Tropical Rain Forest (like Kakamega)
1,800 - 2,900
2,100 - 3,300
1,800 - 2,450
1,800 - 2,900
2,100 - 3,300
1,800 - 2,450
1,800 - 2,900
1,550 - 1,650
1,700 - 1,850
Juniperus procera, Olea europaea ssp. cuspidata, Podocarpus falcatus, Nuxia congest, Cassipourea malosana, Apodytes dimidiata, Ekebergia capensis, Olinia rochetiana, Teclea nobilis.
Yushania alpina, Afrocrania volkensii, Podocarpus latifolius, Hagenia abyssinica, Rapanea melanophloeos, Dombeya torrida, Dracaena afromontana, Nuxia congesta.
Pouteria adolfi-friederici, Albizia gummifera, Prunus africana, Casaeria battiscombei, Syzygium guineense, Polyscias fulva, Dombeya torrida.
Juniperus procera, Olea europaea ssp. cuspidata, Podocarpus falcatus, Nuxia congest, Cassipourea malosana, Apodytes dimidiata, Ekebergia capensis, Olinia rochetiana, Teclea nobilis, Ephorbia spp.
Yushania alpina, Afrocrania volkensii, Podocarpus latifolius, Hagenia abyssinica, Rapanea melanophloeos, Dombeya torrida, Dracaena afromontana, Nuxia congesta.
Pouteria adolfi-friederici, Albizia gummifera, Prunus africana,, Casaeria battiscombei, Syzygium guineense, Polyscias fulva, Dombeya torrida, Podocarpus latifolius.
Juniperus procera, Olea europaea ssp. cuspidata, Podocarpus falcatus, Nuxia congest, Cassipourea malosana, Apodytes dimidiata, Ekebergia capensis, Olinia rochetiana, Teclea nobilis.
Pouteria altissima, Croton megalocarpus, Antiaris toxicaria, Zanthoxylum gillettii, Celtis gomphophylla, Prunus africana, Maesopsis eminii, Albizia grandibracteata, Milicia excelsa, Polyscias fulva, Funtumia africana.
Pouteria altissima, Croton megalocarpus, Antiaris toxicaria, Zanthoxylum gillettii, Celtis gomphophylla, Prunus africana, Maesopsis eminii, Albizia grandibracteata, Milicia excelsa, Polyscias fulva, Funtumia africana.

114 Master Plan for Water Catchment Areas
APPENDIX 5.KEY TREE SPECIES FOR THE MAIN WATER
CATCHMENT AND SUB-CATCHMENT AREAS
Marmanet/Ol Arabel Forest
Bahati Forest
Tugen Hills
Karasuk/Loima Hills
Elgeyo-Marakwet Escarpment
Kikuyu Escarpment
Kiganjo
Upland Dry Forest
Upland Dry Forest
Hilltop Forests, dry type
Hilltop Forests, dry type
Escarpment, Dry Forest
Escarpment Dry Forest
Upland Dry Forest
1,550 - 1,650
2,100 - 2,800
1,800 - 2,500
2,100 - 2,700
1,900 - 3,000
1,800 - 2,250
1,650 - 1,800
Juniperus procera, Olea europaea ssp. cuspidata, Nuxia congesta, Podocarpus falcatus, Croton megalocarpus, Calodendrum capense, Olinia rochetiana, Zanthoxylum usambarense, Ekebergia capensis, Pistacia aethiopica, Schrebera alata, Teclea simplicifolia.
Warburgia ugandensis, Olinia rochetiana, Syzygium cordatum, Sapium ellipticum, Prunus africana, Ficus spp. Olea europaea ssp. cuspidata, Ehretia cymosa, Juniperus procera, Podocarpus falcatus, Nuxia congesta, Ekebergia capensis, Teclea nobilis, Acokanthera schimperi, Zanthoxylum usambarense, Pittosporum viridiflorum.
Croton megalocarpus, Podocarpus falcatus Juniperus procera, Podocarpus falcatus, Nuxia congesta, Ekebergia capensis, Teclea nobilis, Acokanthera schimperi, Zanthoxylum usambarense, Olea europaea ssp. cuspidata.
Croton megalocarpus, Podocarpus falcatus Juniperus procera, Podocarpus falcatus, Nuxia congesta, Ekebergia capensis, Teclea nobilis, Acokanthera schimperi, Zanthoxylum usambarense, Olea europaea ssp. cuspidata.
Warburgia ugandensis, Olinia rochetiana, Sapium ellipticum, Prunus africana, Olea europaea ssp. cuspidata, Juniperus procera, Podocarpus falcatus, P. latifolius, Nuxia congesta, Ekebergia capensis, Teclea nobilis, Acokanthera schimperi, Zanthoxylum usambarense.
Olea europaea ssp. cuspidata, Juniperus procera, Elaeodendron buchananii, Albizia gummifera, Syzygium cordatum, Prunus africana, Nuxia congesta, Ekebergia capensis, Zanthoxylum usambarense, Pittosporum viridiflorum, Warburgia ugandensis, Celtis africana, Croton megalocarpus, Acokanthera schimperi,Cussonia holstii, Calodendrum capense, Teclea simplicifolia
Olea europaea ssp. cuspidata, Nuxia congesta, Ekebergia capensis, Zanthoxylum usambarense, Pittosporum viridiflorum, Warburgia ugandensis, Croton megalocarpus, Acokanthera schimperi,Cussonia holstii, Calodendrum capense, Teclea simplicifolia, Brachylaena huillensis.
Water Catchment Natural Vegetation Type
Elevation (m) Appropriate Tree Species

115Master Plan for Water Catchment Areas
APPENDIX 5.KEY TREE SPECIES FOR THE MAIN WATER
CATCHMENT AND SUB-CATCHMENT AREAS
Kirisia (Leroghi) Hills
Loita Hills
Siria
Mathews Range (Ol Doinyo Lenkiyo)
Mt. Marsabit
Maungu Hills
Ndoto Mountains
Ngong Hills
Hilltop forests, Dry Forest
Dry Upland Forest
Plateau Forest
Dry montane forest type
Low Mountain forest, dry type
Hilltop forest
Low Mountain forest
Dry upland forest
2,000 - 2,500
2,300 - 2,500
1,600 - 1,800
1,200 - 2,600
1,165 - 1,500
900 - 1,000
1,400 - 2,600
2,200 - 2,400
Croton megalocarpus, Podocarpus falcatus Juniperus procera, Podocarpus falcatus, Nuxia congesta, Ekebergia capensis, Teclea nobilis, Acokanthera schimperi, Zanthoxylum usambarense, Olea europaea ssp. cuspidata, Olea capensis
Warburgia ugandensis, Olinia rochetiana, Syzygium cordatum, Sapium ellipticum, Prunus africana, Ficus spp. Olea europaea ssp. cuspidata, Ehretia cymosa, Juniperus procera, Podocarpus falcatus, Nuxia congesta, Ekebergia capensis, Teclea nobilis, Acokanthera schimperi, Zanthoxylum usambarense, Cassipourea malosana.
Warburgia ugandensis, Olinia rochetiana, Prunus africana, Olea europaea ssp. cuspidata, Juniperus procera, Podocarpus falcatus, Nuxia congesta, Ekebergia capensis, Acokanthera schimperi.
Juniperus procera, Olea europaea ssp. cuspidata, Podocarpus latifolius, Nuxia congest, Cassipourea malosana, Apodytes dimidiata, Ekebergia capensis, Teclea simplicifolia, Croton megalocarpus, Calodendrum capense, Encephalartos tegulaneus (endemic).
Olea europaea ssp. cuspidata, Olea capensis, Podocarpus latifolius, Nuxia congest, Cassipourea malosana, Apodytes dimidiata, Ekebergia capensis, Teclea simplicifolia, Croton megalocarpus, Calodendrum capense, Strychnos spp.
Craibia brownii, Diospyros gerrardii, Syzygium sclerophyllum, Cola greenwayi, Encephalartos kisambo
Olea europaea ssp. cuspidata, Olea capensis, Podocarpus latifolius, Nuxia congest, Ekebergia capensis, Teclea simplicifolia, Croton megalocarpus, Calodendrum capense, Strychnos mitis.
Olea europaea ssp. cuspidata, Olea capensis, Nuxia congest, Cassipourea malosana, Ekebergia capensis, Teclea simplicifolia, T. nobilis, Croton megalocarpus, Calodendrum capense, Strychnos spp., Maesa laneolata, Dombeya torrida.
Water Catchment Natural Vegetation Type
Elevation (m) Appropriate Tree Species

116 Master Plan for Water Catchment Areas
Kiang’ombe Hill
Nyambene Hills
Tinderet
Nguruman Escarpment
Nyiru Mountains
Mount. Kulal
Ol Doinyo Orok (Namanga) Hill
Ol Doinyo Sabuk (Kilimambogo) Hill
Shimba Hills
Low Mountain forest
Low Mountain forest
Moist forests
Escarpment forests, drier type
Low Mountain forest
Low Mountain forest
Dry montane forest
Hill forest
Coastal moist forest
1,500 - 1,800
1,850 - 2,500
2,100 - 2,600
1,500 - 2,300
1,600 - 2,500
1,300 - 1,900
2,200 - 2,400
1,950 - 2,100
150 - 450
Ocotea usambarensis, Pouteria adolfi-friederici, Albizia gummifera, Newtonia buchananii, Prunus africana,, Casaeria battiscombei, Syzygium guineense, Polyscias kikuyuensis, Cylicomorpha parviflora.
Ocotea usambarensis, Pouteria adolfi-friederici, Albizia gummifera, Newtonia buchananii, Prunus africana,, Casaeria battiscombei, Syzygium guineense, Polyscias kikuyuensis.
Polyscias fulva, Croton macrostachyus, Albizia gummifera, Syzygium cordatum, Tabernaemontana stapfiana, Prunus africana, Sapium ellipticum, Casaeria battiscombei, Zanthoxylum gillettii, Bridelia micrantha, Celtis africana, Dombeya torrida, Pouteria adolfi-friederici, Nuxia congesta.
Tabernaemontana stapfiana, Olea europaea ssp. cuspidata, Olea capensis, Nuxia congesta, Podocarpus falcatus, Ekebergia capensis, Teclea simplicifolia, T. nobilis, Croton megalocarpus, Calodendrum capense, Strychnos spp., Maesa laneolata, Diospyros abyssinica.
Juniperus procera, Olea europaea ssp. cuspidata, Podocarpus latifolius, Nuxia congest, Ekebergia capensis, Teclea simplicifolia, Croton megalocarpus, Strychnos mitis.
Juniperus procera, Olea europaea ssp. cuspidata, Podocarpus latifolius, Nuxia congest, Ekebergia capensis, Teclea simplicifolia, Croton megalocarpus, Strychnos mitis.
Olea capensis, Nuxia congest, Cassipourea malosana, Ekebergia capensis, Teclea simplicifolia, T. nobilis, Croton megalocarpus, Calodendrum capense, Maesa laneolata, Drypetes gerrardii.
Drypetes gerrardii, Diospyros abyssinina, Croton macrostachyus, Cassipourea malosana, Cola greenwayi, Pouteria adolfi-friedericii, Strombosia scheffleri.
Afzelia quanzensis,Hymenaea verrucosa, Combretum schumannii, Syzygium sclerophyllum, Breonadia microcephala.
Water Catchment Natural Vegetation Type
Elevation (m) Appropriate Tree Species
APPENDIX 5.KEY TREE SPECIES FOR THE MAIN WATER
CATCHMENT AND SUB-CATCHMENT AREAS

117Master Plan for Water Catchment Areas
Taita Hills including Mbololo, Ngangao, Chawia, Sagala, Vuria
Taveta (Kitovo) Lumi
Mount. Kasigau
Mangea
Kitui Hills Endau, Mutha, Mutitu, Makongo, Nuu, Nthoani, Kabonge, Kyawea etc.
Machakos HillsVarious hills, e.g. Nzaui, Kibauni
Chyulu Hills
Coastal moist and dry forests
Ground water forest
Low mountain, Coastal/upland forest type
Coastal dry forests
Dry hilltop forests
Dry hilltop forests
Dry hilltop forests
1,350 - 2,270
700 - 850
1,400 - 1,550
300 - 500
1,400 - 1,800
1,400 - 1,800
1,400 - 1,750
Ocotea kenyensis, Cola greenwayi, Craibia brevicaudata, Maesa lanceolata, Erica mannii, Syzygium sclerophyllum.
Diospyros mespiliformis, Albizia glaberrima, A. gummifera, Celtis africana, Newtonia buchananii, Trichilia emetica, Cordyla africana, Milicia excelsa.
Newtonia buchananii, Albizia gummifera, Ficus sycomorus, Maesa lanceolata, Rapanea melanophloeos, Syzygium guineense, Strombosia scheffleri, Olea europaea ssp. cuspidata, Chrysophyllum viridifolium, Encephalartos kisambo, Polyscias fulva.
Brachylaena huillensis, Cynometra webberi, Diospyros kabuyeana, Manilkara sansibarensis, Pteleopsis tetraptera, Julbernardia magnistipulata, Inhambanella henriquesii, Manilkara sansibarensis, Pteleopsis tetraptera.
Podocarpus falcatus, Newtonia hildebrandtii, Albizia gummifera, Calodendrum capense, Olea capensis, Olea europaeae ssp. cuspidata, Zanthoxtylum usambarense, Cassipourea celastroides, Terminalia brownii, Hunteria zeylanica.
Craibia brevicaudata, Podocarpus falcatus, Newtonia hildebrandtii, Albizia gummifera, Calodendrum capense, Olea capensis, Olea europaea ssp. cuspidata, Zanthoxtylum usambarense, Cassipourea celastroides, Terminalia brownii.
Olea capensis, Prunus africana, Rapanea melanophloeos, Pistacia aethiopica, Alangium chineense, Ilex mitis, Ficus sycomorus, Catha edulis, Olea europaea ssp. cuspidata, Commiphora eminii, Juniperus procera, Xymalos monospora.
Water Catchment Natural Vegetation Type
Elevation (m) Appropriate Tree Species
APPENDIX 5.KEY TREE SPECIES FOR THE MAIN WATER
CATCHMENT AND SUB-CATCHMENT AREAS

118 Master Plan for Water Catchment Areas
APPENDIX 6.
EXTENT OF DEGRADATION OF WATER CATCHMENTS IN KENYA
Athi-River Basin
Ewaso Ng’iro Basin
Athi Kibwezi
Athi River
Athi River
Athi Wamunyu
Chania
Kalundu
Kalundu
Kiu
L. Naivasha
Lake Jilore
Little Kedong
Lumi
Mtito Andei
Mtito Andei
Mukurumuji
Mwachi
Ndarugu
Ndsovuni
Ruiru
Sabaki
Stoney Athi
Thika
Thiririka
Thwake
Tsavo
Voi
Kajiado
Kajiado
Machakos
Machakos
Kiambu
Kitui
Kitui
Kiambu
Nakuru
Kilifi
Kajiado
Taita Taveta
Makueni
Makueni
Kwale
Taita Taveta
Nakuru
Kilifi
Kiambu
Taita Taveta
Makueni
Thika
Kiambu
Machakos
Taita Taveta
Taita Taveta
Normal
Normal
Good
Good
Good
Normal
Good
Very good
Poor
Good
Poor
Normal
Good
Good
Good
Good
Very good
Good
Very good
Normal
Normal
Very good
Very good
Good
Normal
Normal
Water Catchment Area
Sub-Catchments Counties Extent Of Degradation (Very Good, Good, Normal, Poor, Very Poor)
APPENDIX 6.EXTENT OF DEGRADATION OF WATER
CATCHMENTS IN KENYA

119Master Plan for Water Catchment Areas
Water Catchment Area
Sub-Catchments Counties Extent Of Degradation (Very Good, Good, Normal, Poor, Very Poor)
APPENDIX 6.EXTENT OF DEGRADATION OF WATER
CATCHMENTS IN KENYA
Lake Victoria Basin
Amboni
Burguret
Ewaso Ng’iro
Kathita
Lemisigio
Maji matamu
Malewa
Moyok
Mutara
Ngare Ndare
Nithi
Nithi
Pesi
Rupingazi
Suguroi
Suguta
Tana Garissa
Timau
Ainamotwa
Ainopsiwa
Alupe
Amala
Awach
Awach Tende
Chwele
Edzaba
Gaula
Gembe Hills
Gucha
Nyeri
Laikipia
Samburu
Meru
Laikipia
Meru
Nyandarua
Laikipia
Laikipia
Samburu
Tharaka Nithi
Meru
Nyandarua
Embu
Laikipia
Samburu
Garissa
Meru
Nandi
Nandi
Busia
Busia
Kisumu
Homa bay
Bungoma
Nandi
Busia
Homa bay
Kisii
Very good
Good
Normal
Very good
Normal
Very good
Very good
Good
Normal
Poor
Good
Very good
Good
Very good
Good
Poor
Poor
Good
Very good
Very Good
Normal
Good
Good
Good
Good
Good
Good
Good
Very good

120 Master Plan for Water Catchment Areas
Isiukhu
Itare
Kamakoiwa
Keringet
Kerio
Khalaba
Kibabet
Kibos
Kimondi
Kipkarren
Kipsonoi
Koitobos
Kuywa
Lelgel
Little Nzoia
Luandeti
Lusumu
Malaba
Malakisi
Maramara
Maseno
Migori
Moiben
Molo
Nyando
Nyangores
Nzoia
Riana
Rusinga
Kakamega
Bomet
Trans nzoia
Nakuru
Elgeyo marakwet
Busia
Nandi
Siaya
Nandi
Bungoma
Bomet
Trans nzoia
Bungoma
Nandi
Uaasin Gishu
Bungoma
Kakamega
Busia
Bungoma
Bomet
Kisumu
Migori
Trans Nzoia
Nakuru
Kericho
Bomet
Trans nzoia
Homa bay
Homa bay
Good
Very good
Very good
Very good
Good
Good
Very good
Good
Very good
Good
Very good
Good
Good
Very good
Good
Good
Good
Normal
Good
Good
Good
Good
Good
Good
Very good
Good
Good
Very good
Good
Water Catchment Area
Sub-Catchments Counties Extent Of Degradation (Very Good, Good, Normal, Poor, Very Poor)
APPENDIX 6.EXTENT OF DEGRADATION OF WATER
CATCHMENTS IN KENYA

121Master Plan for Water Catchment Areas
APPENDIX 6.EXTENT OF DEGRADATION OF WATER
CATCHMENTS IN KENYA
Water Catchment Area
Sub-Catchments Counties
Rift Valley Basin
Sergoit
Sio
Sondu
Sosiani
Suguta
Tambach
Timbilil
Tugenon
Wuroya
Yala
Yurith
Crater stream
Endao
Engare Narok
Engare Narok
Esageri
Ewaso Narok
Ewaso Narok
Ewaso Ng’iro
Gilgil
Itare
Kipsonoi
Koitobos
L. Naivasha
Lelgel
Little Kedong
Maji matamu
Malewa
Mariashoni
Bungoma
Busia
Kisumu
Uasin gishu
Turkana
Elgeyo marakwet
Kericho
Kericho
Siaya
Siaya
Kericho
Nakuru
Baringo
Narok
Narok
Baringo
Laikipia
Narok
Narok
Nakuru
Bomet
Bomet
Uasin Gishu
Nakuru
Baringo
Nakuru
Nakuru
Nyandarua
Nakuru
Good
Good
Good
Good
Very poor
Good
Very good
Good
Good
Good
Very good
Good
Good
Very good
Normal
Good
Good
Good
Very good
Good
Very good
Very good
Good
Good
Good
Good
Good
Good
Good
Extent Of Degradation (Very Good, Good, Normal, Poor, Very Poor)

122 Master Plan for Water Catchment Areas
Water Catchment Area
Sub-Catchments Counties Extent of Degradation (Very Good, Good, Normal, Poor, Very Poor)
APPENDIX 6.EXTENT OF DEGRADATION OF WATER
CATCHMENTS IN KENYA
Tana River Basin
Mereroni
Moiben
Molo
Mutonga
Njoro
Nyangores
Ol arabel
Onyokie
Perkerra
Pesi
Sergoit
Siyoi
Sosiani
Suam
Subukia
Tugenon
Turasha
Turasha
Turkwel
Turkwel
Chania
Ena
Gura
Kathita
Lake Kenyatta
Maragua
Mathioya
Mkondo Wawitu
Ragati
Nakuru
Elgeyo Marakwet
Nakuru
Meru
Nakuru
Bomet
Laikipia
Uasin Gishu
Baringo
Nyandarua
Uasin Gishu
Turkana
Uasin Gishu
Trans Nzoia
Nakuru
Kericho
Nyandarua
Nyandarua
Turkana
West Pokot
Nyeri
Nyeri
Nyeri
Meru
Garissa
Murang’a
Murang’a
Garissa
Nyeri
Good
Normal
Good
Very good
Good
Very good
Good
Good
Good
Good
Good
Very poor
Good
Normal
Good
Good
Good
Good
Very poor
Normal
Very good
Very good
Very good
Very good
Good
Very good
Very good
Good
Good

123Master Plan for Water Catchment Areas
APPENDIX 6.EXTENT OF DEGRADATION OF WATER
CATCHMENTS IN KENYA
Rwathambi
Saba Saba
Sagana
Sagana
Tana
Tana Garissa
Tana Kamburu
Thiba
Thika
Kirinyaga
Murang’a
Nyeri
Murang’a
Murang’a
Tana River
Kitui
Kirinyaga
Murang’a
Good
Good
Good
Very good
Good
Normal
Good
Very good
Very good
Water Catchment Area
Sub-Catchments Counties Extent Of Degradation (Very Good, Good, Normal, Poor, Very Poor)

124 Master Plan for Water Catchment Areas
APPENDIX 7.
POLICIES, LEGAL INSTRUMENTS AND INSTITUTIONS APPLICABLE TO GOVERNANCE OF WATER CATCHMENT AREAS
Forest Policy 1968 (draft forest policy is in formulation)
Water Policy Session Paper I of 1999
Water Policy Session Paper I of 1999
Non-existent
The Constitution of Kenya 2010
The Forest Act 2005
Water Act 2002
Water Resource Management Rules 2007
Agriculture Act (Cap 318)
Wildlife Conservation and Management Act
Continental Shelf Act (Cap 312)
Local Authority Act (Cap 265)
GOK
KFS
Ministry of Water and Irrigation
WRUA (WRMA) CAAC
Ministry of Agriculture
Ministry of Forestry and Wildlife
KWS
Ministry of Local Government
The preamble provides obligations of Kenyans to be respectful of the environment. Article 2(6) treaties that Kenya has signed are part of the laws of Kenya, article 42, right to clean environment, article 69-72, provisions on environment and natural resources.
The main objective is to achieve conservation and maintenance of vegetative cover and water catchment areas. Section 40 provides for sustainable management of forests and woodlands for the purpose of conservation of water. Part 4(45-46) provides for community participation in conservation and management.
Formulation of National Water Resource Management Strategy. The Water Act provides for conservation and controlled use of water uses in Kenya. Section 14 and 15 deals with catchment management.
These are forums for Conflict resolution. Lack of capacity to enforce compliance is missing
This emphasises on the requirement of soil conservation i.e. through prevention of erosion therefore indirectly conserving the water quality.
Protection and management of watersheds
Designates Ramsar sites as protected areas
Provides for management o the continental shelf situated in Kenya territorial waters.
Provisions of enactment of by-laws which include construction of water supply and sewerage systems
Policy Legal Framework InstitutionFunctional Relationship to Governance on Water Catchment Areas, Relevant Sections

125Master Plan for Water Catchment Areas
APPENDIX 7.POLICIES, LEGAL INSTRUMENTS AND
INSTITUTIONS APPLICABLE TO GOVERNANCE OF WATER CATCHMENT AREAS
Policy Legal Framework InstitutionFunctional Relationship to Governance on Water Catchment Areas, Relevant Sections
Draft Policy
Regional Development Policy
Session Paper 6 of 1999
Non-exist
National Land Policy
Mining Act (Cap 306)
Regional Development Acts
EMCA Act No. 8 of 1999
Fisheries Act (Cap 378)
The Registered Land Act (Cap 300)
The Land Acquisition Act (Cap 295)
The Lakes and River Act (Cap 409)
It has an implication on water catchment areas in that with the approval of the minister, mining can be allowed in both gazetted and non-gazetted areas
It provides for the implementation of rural development activities to ensure equitable resource development and promote regional social economic development through integrated planning and management
Guide and co-ordinates activities related to the management of natural resources.
This legislation governs provides for wetlands regulations and waste regulations which have a bearing on catchment governance
It provides for regulation of fish industry through sustainable exploitation of fisheries and protection of fish ecosystemsApplies to land under customary law, namely native reserves and trust land.
Provides for acquisition of land for public benefit. The Government has the powers under this Act to acquire land for projects, which are intended to benefit the general public.
This Act provides for protection of river, lakes and associated flora and fauna.
MEMR
Department of Mines and Geology
TARDAENSDACDAENNDALBDA
MEMR
NEMA
Ministry of Fisheries
Ministry of Lands

126 Master Plan for Water Catchment Areas
APPENDIX 8.
RESOURCE DISTRIBUTION BY MEDIUM TERM EXPENDITURE FRAMEWORK
Output 1: Partnerships and participation of stakeholders in the management of water catchment areas improved
Output 2: Policies, legislations, regulations and standards governing management of water catchment areas reviewed, harmonised and enforced
Output 3: A Communication strategy for WCA programme developed and implemented
Output 4: Capacity of communities to implement WCA programmes strengthened
Output 5: Restoration and protection of all water catchment areas undertaken
Output 6: Adoption of soil conservation and land use management practises promoted
Output 7: Water Resource Conservation and management undertaken in all WCAs
Output 8: Water storage infrastructure developed and maintained in all WCA
Output 9: Improved management of urban and industrial waste and sanitation harmonised and enforced
Output 10: Alternative livelihoods for sustainable resource use in water catchment conservation programmes supported
16,958
1,506
3,998
4,847
46,785
10,340
332,190
224,000
134,000
1,405
3,378
280
944
1,137
5,170
1,763
67,365
11,000
1,800
280
4,222
349
991
1,237
8,130
2,350
72,010
11,000
2,500
350
4,222
349
991
1,137
11,430
2,350
74,950
86,000
64,500
350
879
69
47
94
2,780
588
2,145
15,000
700
75
4,257
459
1,026
1,242
19,275
3,290
115,720
101,000
64,500
350
OUTPUTS MTP1 2008-2012
MTP2 2013-2017
MTP3 2018-2022
MTP4 2023-2027
MTP5 2028-2032
TOTAL
Amount in Kes. Millions

127Master Plan for Water Catchment Areas
OUTPUTS MTP1 2008-2012
MTP2 2013-2017
MTP3 2018-2022
MTP4 2023-2027
MTP5 2028-2032
TOTAL
Amount in Kes. Millions
APPENDIX 8.RESOURCE DISTRIBUTION BY MEDIUM TERM
EXPENDITURE FRAMEWORK
Output 11: Renewable energy technologies identified, developed and promoted
Output 12: Gender, youth and vulnerable groups mainstreamed in WCA activities
Output 13: Water catchment areas funding mechanisms streamlined and mainstreamed in budgets at all levels
Output 14: Water catchment areas monitoring and evaluation systems integrated and strengthened
GRAND TOTAL
7,350
404
2
189
30,322
38,370
2,050
689
901
353,128
38,350
2,020
535
917
288,100
37,350
2,020
535
756
143,799
30,000
1,616
533
621
125,885
151,420
8,110
2,293
3,383
941,234

128 Master Plan for Water Catchment Areas
Agriculture and Rural Development (ARD)
KARI
KEFRI
KFS
MOA
MoLD
Education
KIE
MoEducation
Energy Infra and ICT (EII)
KenGen
MoEnergy
MOLG
MoRoads
Environmental Protection, Water and Housing (EWH)
MEMR
MWI
NEMA
NRUAs
WRMA
General Economic, Commercial and Labour Affairs (GECLA)
MoEAC
MoIndustry
Governance, Justice, Law and Order (GJLOS)
Governor
MoJCA
74,695
1,470
10,090
8,000
50,135
5,000
505
5
500
166,420
86,720
64,700
14,000
1,000
588,759
18,600
94,425
7,005
231,236
237,493
94,900
900
94,000
3,007
2,982
25
APPENDIX 9.
RESOURCE DISTRIBUTION TO SECTORS AND AGENCY
Sector1 and Agency Sum (Million Kes.)
1These are MTEF sectors during the 2011/2012. The Ministries are as per the GoK Circular April 2008

129Master Plan for Water Catchment Areas
APPENDIX 9.RESOURCE DISTRIBUTION TO
SECTORS AND AGENCY
Sector1 and Agency Sum (Million Kes.)
Health
MoPH
Macro Working Group
MoF
MoPV2030
Social Protection, Culture and Recreation (SCR)
MoGender and Social Development
MoYA
Grand Total
6,000
6,000
2,638
46
2,592
4,310
3,370
940
941,234

130 Master Plan for Water Catchment Areas
Output 1. Partnerships and participation of stakeholders in the management of water catchment areas improved
Governor
MEMR
WRMA
Output 10. Alternative livelihoods for sustainable resource use in water catchment conservation programmes supported
MWI
WRMA
Output 11: Renewable energy technologies identified, developed and promoted
KenGen
KFS
MoEnergy
Output 12: Gender and youth involvement, Mainstreamed in WCA activities
MoGender and Social Development
NRUAs
Output 13. Water catchment areas funding mechanisms streamlined and mainstreamed in budgets at all levels.
Governor
KEFRI
MEMR
MoF
NEMA
Output 14. Water catchment areas monitoring and evaluation systems integrated and strengthened.
Governor
MEMR
MoPV2030
16,957.7
306.0
16,463.7
188.0
1,405.0
405.0
1,000.0
151,420.0
86,720.0
0
64,700.0
8,110.0
2,110.0
6,000.0
2,292.5
100.0
2,100.0
66.5
21.0
5.0
3,382.8
225.6
4.0
2,589.2
APPENDIX 10.
RESOURCE DISTRIBUTION TO OUTPUT BY LEAD AGENCY
Output Amount (million Kes.)

131Master Plan for Water Catchment Areas
APPENDIX 10.RESOURCE DISTRIBUTION TO
OUTPUT BY LEAD AGENCY
Output Amount (million Kes.)
NRUAs
WRMA
Output 2. Policies, legislations, regulations and standards governing management of water catchment areas reviewed, harmonised and enforced
MEMR
MoJCA
NEMA
Output 3. A Communication strategy for WCA programme developed and implemented
Governor
KIE
MEMR
MoGender and Social Development
MoEducation
MoPV2030
MoYA
MWI
NRUAs
Output 4. Capacity of communities to implement WCA programmes strengthened.
Governor
KFS
MEMR
NRUAs
WRMA
Output 5. Restoration and protection of all water catchment areas undertaken
KEFRI
KFS
MoA
MoF
MoLD
564.0
0
1,506.2
481.2
25.0
1,000.0
3,998.0
0
5.0
1,050.0
1,260.0
500.0
3.0
940.0
20.0
220.0
4,847.0
1,410.0
0
200.0
3,232.0
5.0
46,785.0
7,990.0
8,000.0
5,000.0
25.0
5,000.0

132 Master Plan for Water Catchment Areas
16,520.0
4,250.0
10,340.0
470.0
235.0
4,935.0
4,700.0
332,190.0
940.0
1,000.0
100.0
900.0
200.0
1,000.0
30,000.0
6,000.0
200,000.0
92,050.0
224,000.0
40,000.0
44,000.0
140,000.0
134,000.0
94,000.0
14,000.0
6,000.0
20,000.0
941,234.2
Output Amount (million Kes.)
NRUAs
WRMA
Output 6: Adoption of soil conservation and land use management practises promoted
KARI
MEMR
MoA
NRUAs
Output 7: Water Resource Conservation and management undertaken in all WCAs
Governor
KARI
MEMR
MoEAC
MoA
MoRoads
MWI
NEMA
NRUAs
WRMA
Output 8: Water storage infrastructure developed and maintained in all WCA
MoA
MWI
WRMA
Output 9: Improved management of urban and industrial waste and sanitation harmonised and enforced
MoIndustry
MoLG
MoPH
MWI
Grand Total
APPENDIX 10.RESOURCE DISTRIBUTION TO
OUTPUT BY LEAD AGENCY

133Master Plan for Water Catchment Areas
Vis
ion:
Wel
l man
aged
wat
er c
atch
men
t are
as
Inte
rven
tion
Log
icO
bjec
tive
ly V
erifi
able
Indi
cato
rsM
eans
of V
erifi
cati
onIm
port
ant a
ssum
ptio
ns
Goa
lW
ater
cat
chm
ent a
reas
are
con
serv
ed
and
sust
aina
bly
man
aged
to e
nabl
e Ke
nya
atta
in g
loba
l wat
er c
atch
men
t se
curi
ty ta
rget
s fo
r al
l; w
hile
su
ppor
ting
nat
iona
l dev
elop
men
t as
asp
ired
by
Keny
a V
isio
n 20
30
and
unde
r th
e pr
inci
ples
of r
ight
s-ba
sed
deve
lopm
ent a
nd d
evol
ved
gove
rnan
ce, i
n th
e Co
nsti
tuti
on o
f Ke
nya
2010
Purp
ose
To im
prov
e th
e ca
paci
ties
of
stak
ehol
ders
and
inst
itut
ions
wit
h m
anda
te o
n w
ater
cat
chm
ent a
reas
to
und
erta
ke e
ffect
ive
and
effic
ient
m
anag
emen
t in
orde
r to
sus
tain
ec
onom
ic, s
ocia
l and
eco
logi
cal
bene
fits
of w
ater
cat
chm
ents
.
• A
nat
iona
l mul
ti-s
ecto
ral p
rogr
amm
e of
Act
ion
is d
evel
oped
and
im
plem
enta
tion
reso
urce
s se
cure
d by
M
ay 2
012
(NW
CMP)
• G
over
nanc
e sy
stem
s fo
r co
nser
vati
on
of w
ater
reso
urce
s re
stru
ctur
ed a
nd
harm
onis
ed b
y Ju
ne 2
014
• Ba
selin
e re
port
s on
com
pete
ncy
skill
s of
com
mun
itie
s in
wat
er c
atch
men
t co
nser
vati
on
• In
crea
sed
unde
rsta
ndin
g an
d ap
plic
atio
n of
bes
t pra
ctic
es in
Wat
er
Reso
urce
Con
serv
atio
n an
d w
ater
-use
ef
ficie
ncy
• Re
port
on
inve
ntor
y of
Wat
er
Reso
urce
Con
serv
atio
n pr
acti
ces
and
wat
er-u
se e
ffic
ienc
y te
chno
logi
es a
nd
prin
cipl
es a
dher
ed to
by
reso
urce
s us
ers
• D
evel
oped
cur
ricu
la a
nd tr
aini
ng
mat
eria
ls
Prog
ram
me
docu
men
tSi
gned
agr
eem
ent b
etw
een
finan
cier
s an
d th
e Tr
easu
ry
Repo
rts
on h
arm
onis
ed p
olic
ies,
Law
an
d in
tuit
iona
l arr
ange
men
ts
Base
line
surv
ey re
port
sTr
aini
ng re
port
s
Repo
rts
% a
dopt
ion
of W
ater
Res
ourc
e Co
nser
vati
on, w
ater
har
vest
ing
and
wat
er-u
se e
ffic
ienc
y te
chno
logi
es a
t al
l lev
els
Impo
rtan
t ass
umpt
ions
Dev
olve
d G
over
nanc
e sy
stem
s of
th
e Co
nsti
tuti
on o
f Ken
ya 2
010
is
oper
atio
nalis
ed a
nd fu
ncti
onin
g
Nat
iona
l and
Reg
iona
l Gov
ernm
ents
al
loca
ted
adeq
uate
reso
urce
s to
su
ppor
t lar
ge s
cale
con
serv
atio
n pr
ogra
mm
es
AP
PEN
DIX
11.
LOG
ICA
L FR
AM
EWO
RK
: 20
11-2
030

134 Master Plan for Water Catchment Areas
Inte
rven
tion
Log
icO
bjec
tive
ly V
erifi
able
Indi
cato
rsM
eans
of V
erifi
cati
onIm
port
ant a
ssum
ptio
ns
• A
n in
ter-
min
iste
rial
com
mitt
ee s
et
up b
y 20
13
• 30
% W
CA u
nits
est
ablis
hed
at a
ll le
vels
201
2
• A
ll pa
rtne
rs id
enti
fied
role
s re
spon
sibi
litie
s an
d in
terv
enti
on
mat
rix
deve
lope
d by
201
2
• A
Nat
iona
l sta
ke h
olde
r co
mm
ittee
se
t up
at b
y 20
12
• 50
% o
f WCA
inte
rdep
artm
enta
l and
st
akeh
olde
r fo
rum
s at
the
Coun
ty
leve
l est
ablis
hed
by 2
013
• Ke
y m
assa
ges
for
sens
itis
atio
n of
st
akeh
olde
rs d
evel
oped
and
50%
of
stak
ehol
ders
sen
siti
sed
by 2
013
• Po
licie
s le
gisl
atio
n re
gula
tion
s an
d st
anda
rds
revi
ewed
and
har
mon
ised
by
201
3
• W
CA h
andb
ook
to th
e st
akeh
olde
rs
deve
lope
d an
d di
stri
bute
d by
201
3
• M
idte
rm re
view
don
e by
202
1
• En
d te
rm e
valu
atio
n co
nduc
ted
by
2031
Min
utes
of t
he m
eeti
ngs
held
Min
utes
of m
eeti
ngs
List
of s
take
hold
er m
embe
rsM
inut
es o
f the
sta
keho
lder
s m
eeti
ng
List
of p
artn
ers,
Reg
istr
atio
n ce
rtifi
cate
s, w
ork
plan
s an
d bu
dget
sA
gree
men
ts a
nd M
OU
Sche
dule
of m
eeti
ngs
Num
ber
of W
CA fo
rum
s se
t up
Repo
rts
of th
e se
nsit
isat
ion
mee
ting
s
Repo
rt o
f the
PLR
S re
view
WCA
han
dboo
k
Mid
term
revi
ew re
port
End
term
eva
luat
ion
repo
rt
Mas
ter
Plan
is a
dopt
ed
Lead
ersh
ip c
omm
itm
ent
Out
put 1
: Par
tner
ship
s an
d pa
rtic
ipat
ion
of s
take
hold
ers
in th
e m
anag
emen
t of w
ater
cat
chm
ent a
reas
impr
oved
Out
put 2
: Pol
icie
s, le
gisl
atio
ns, r
egul
atio
ns a
nd s
tand
ards
gov
erni
ng m
anag
emen
t of w
ater
cat
chm
ent a
reas
rev
iew
ed, h
arm
onis
ed a
nd e
nfor
ced

135Master Plan for Water Catchment Areas
• 80
% c
omm
unic
atio
n un
it a
nd
web
site
on
WCA
set
up
and
mai
ntai
ned
by 2
014
• W
CA C
onse
rvat
ion
prog
ram
mes
de
velo
ped
and
four
wee
kly
prog
ram
mes
air
ed b
y 20
14
• 50
0 bi
llboa
rds
broc
hure
s ou
tlini
ng
acti
viti
es a
nd a
chie
vem
ents
of W
CA
desi
gned
by
2013
• 4
mon
thly
you
th g
roup
s, w
omen
sc
hool
com
peti
tion
s (e
ssay
wri
ting
, pa
inti
ng, d
raw
ing,
gam
es)
to
com
mun
icat
e W
CA r
unni
ng fr
om
2014
• 50
% o
f Env
iron
men
t and
co
nser
vati
on R
esou
rce
Cent
res
for
shar
ing
info
rmat
ion
esta
blis
hed
by
2014
• 50
% c
omm
unit
y gr
oups
to
impl
emen
t WCA
pro
gram
mes
trai
ned
by 2
014
• 50
% o
f com
mun
ity
base
d gr
oups
im
plem
enti
ng p
rogr
amm
es u
sing
W
CA m
anua
ls b
y 20
13
• A
rew
ard
syst
em fo
r W
CA
cons
erva
tion
est
ablis
hed
by 2
015
• 40
% c
omm
unit
y gr
oups
exc
hang
e vi
sits
und
erta
ken
afte
r ev
ery
3 ye
ars
Com
mun
icat
ion
unit
and
Web
site
in
plac
e
Radi
o, T
V p
rogr
amm
es
Billb
oard
s, b
roch
ures
Perf
orm
ance
s re
cord
s an
d sh
ows
held
Num
ber
of g
roup
s se
t up
and
invo
lved
No
of c
lubs
est
ablis
hed
No
of re
sour
ces
cent
res
esta
blis
hed
No
of p
eopl
e tr
aine
d
Repo
rts
No
of o
ffic
es e
stab
lishe
d an
d eq
uipp
ed
No
of g
roup
s re
war
ded
rew
ard
No
plac
es v
isit
ed a
nd re
port
s of
ex
chan
ge v
isit
s
Ava
ilabi
lity
of fu
nds
Out
put 4
: Cap
acit
y of
com
mun
itie
s to
impl
emen
t WCA
pro
gram
mes
str
engt
hene
d.
Inte
rven
tion
Log
icO
bjec
tive
ly V
erifi
able
Indi
cato
rsM
eans
of V
erifi
cati
onIm
port
ant a
ssum
ptio
ns
Out
put 3
: A c
omm
unic
atio
n st
rate
gy fo
r W
CA p
rogr
amm
e de
velo
p an
d ap
plie
d by
201
3

136 Master Plan for Water Catchment Areas
• N
atur
al v
eget
atio
n co
ver
base
line
in w
ater
ca
tchm
ent a
reas
est
ablis
hed
by 2
013
• A
ppro
pria
te tr
ee c
over
incr
ease
d to
5%
by
2020
an
d th
en 1
0% b
y 20
30
• A
ll w
ater
cat
chm
ent a
reas
gaz
ette
d by
201
5
• 10
,000
km o
f rip
aria
n ar
eas
rest
ored
and
co
nser
ved
by y
ear
2030
• So
urce
s of
See
d/pr
opag
atio
n m
ater
ial a
vaila
ble
at a
ll fo
rest
sta
tion
s an
d ot
her
sour
ces
of q
ualit
y ge
rmpl
asm
by
year
201
5
• Bi
odiv
ersi
ty e
ndow
men
t of a
t lea
st o
ne
catc
hmen
t per
Cou
nty
stud
ied
by 2
020
• A
t lea
st 2
0 tr
ee n
urse
ries
per
Cou
nty
esta
blis
hed
by a
Sch
ool/
com
mun
ity/
yout
h/w
omen
gro
up b
y 20
20
• A
ll fa
rms
wit
h 12
- 3
0% s
lope
terr
aced
by
year
20
20
• 10
urb
an c
entr
es p
er c
ount
y ha
ve d
evel
oped
an
d im
plem
ente
d st
orm
wat
er m
anag
emen
t
• 20
% o
f all
farm
ing
hous
ehol
ds h
ave
adop
ted
high
val
ue a
nd e
ffic
ient
pro
duct
ion
and
cons
umpt
ion
syst
ems
Land
use
and
land
cov
er m
aps
Land
use
and
land
cov
er m
aps
Gaz
ette
not
ices
Land
use
land
cov
er m
aps
Pres
ence
of m
arke
d se
ed s
tand
s in
the
fore
stFo
rest
see
d su
pply
reco
rds
Publ
ishe
d re
port
Mon
itor
ing
repo
rts
Agr
icul
tura
l off
icer
s’ re
cord
s
Repo
rts
Ann
ual a
gric
ultu
ral r
epor
ts
Inte
rven
tion
Log
icO
bjec
tive
ly V
erifi
able
Indi
cato
rsM
eans
of V
erifi
cati
onIm
port
ant a
ssum
ptio
ns
Out
put 5
: Res
tora
tion
and
pro
tect
ion
of a
ll w
ater
cat
chm
ent a
reas
und
erta
ken
Out
put 6
: Pro
mot
e th
e ad
opti
on o
f soi
l con
serv
atio
n an
d la
nd u
se m
anag
emen
t pra
ctis
es
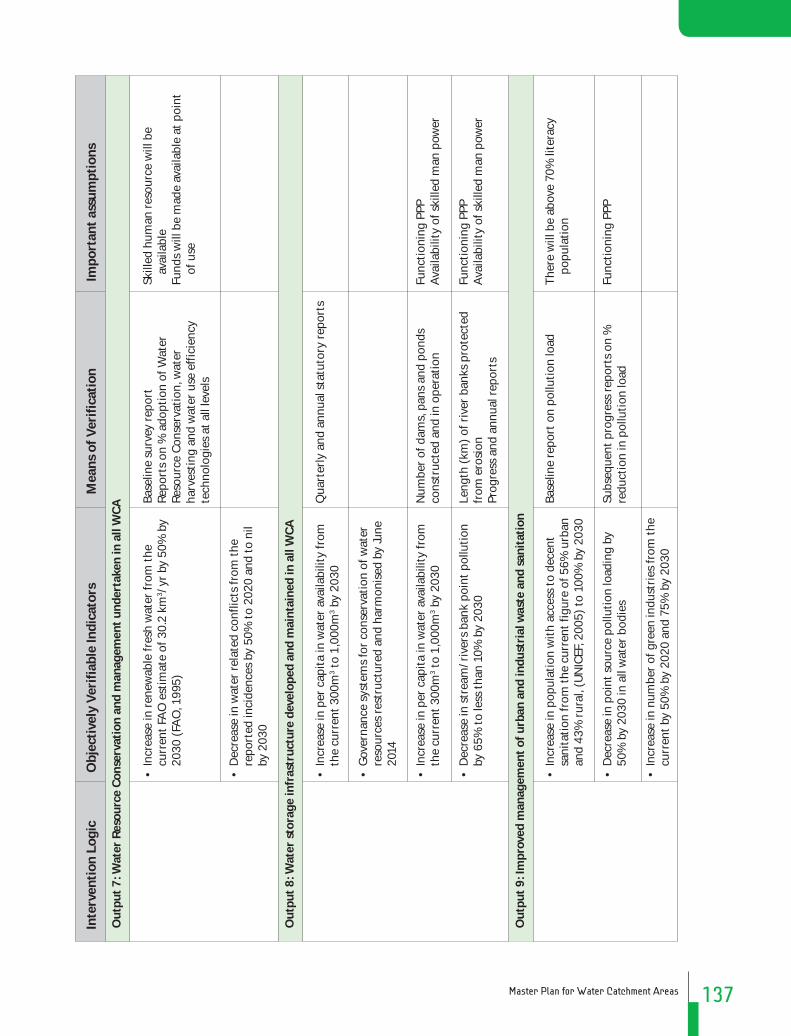
137Master Plan for Water Catchment Areas
Inte
rven
tion
Log
icO
bjec
tive
ly V
erifi
able
Indi
cato
rsM
eans
of V
erifi
cati
onIm
port
ant a
ssum
ptio
ns
Out
put 7
: Wat
er R
esou
rce
Cons
erva
tion
and
man
agem
ent u
nder
take
n in
all
WCA
• In
crea
se in
rene
wab
le fr
esh
wat
er fr
om th
e cu
rren
t FA
O e
stim
ate
of 3
0.2
km3 /
yr b
y 50
% b
y 20
30 (
FAO
, 199
5)
• D
ecre
ase
in w
ater
rela
ted
conf
licts
from
the
repo
rted
inci
denc
es b
y 50
% to
202
0 an
d to
nil
by 2
030
• In
crea
se in
per
cap
ita
in w
ater
ava
ilabi
lity
from
th
e cu
rren
t 300
m3 t
o 1,
000m
3 by
2030
• G
over
nanc
e sy
stem
s fo
r co
nser
vati
on o
f wat
er
reso
urce
s re
stru
ctur
ed a
nd h
arm
onis
ed b
y Ju
ne
2014
• In
crea
se in
per
cap
ita
in w
ater
ava
ilabi
lity
from
th
e cu
rren
t 300
m3 t
o 1,
000m
3 by
2030
• D
ecre
ase
in s
trea
m/r
iver
s ba
nk p
oint
pol
luti
on
by 6
5% to
less
than
10%
by
2030
• In
crea
se in
pop
ulat
ion
wit
h ac
cess
to d
ecen
t sa
nita
tion
from
the
curr
ent f
igur
e of
56%
urb
an
and
43%
rur
al, (
UN
ICEF
, 200
5) to
100
% b
y 20
30
• D
ecre
ase
in p
oint
sou
rce
pollu
tion
load
ing
by
50%
by
2030
in a
ll w
ater
bod
ies
• In
crea
se in
num
ber
of g
reen
indu
stri
es fr
om th
e cu
rren
t by
50%
by
2020
and
75%
by
2030
Base
line
surv
ey re
port
Repo
rts
on %
ado
ptio
n of
Wat
er
Reso
urce
Con
serv
atio
n, w
ater
ha
rves
ting
and
wat
er u
se e
ffic
ienc
y te
chno
logi
es a
t all
leve
ls
Qua
rter
ly a
nd a
nnua
l sta
tuto
ry re
port
s
Num
ber
of d
ams,
pan
s an
d po
nds
cons
truc
ted
and
in o
pera
tion
Leng
th (
km)
of r
iver
ban
ks p
rote
cted
fr
om e
rosi
onPr
ogre
ss a
nd a
nnua
l rep
orts
Base
line
repo
rt o
n po
lluti
on lo
ad
Subs
eque
nt p
rogr
ess
repo
rts
on %
re
duct
ion
in p
ollu
tion
load
Skill
ed h
uman
reso
urce
will
be
avai
labl
eFu
nds
will
be
mad
e av
aila
ble
at p
oint
of
use
Func
tion
ing
PPP
Ava
ilabi
lity
of s
kille
d m
an p
ower
Func
tion
ing
PPP
Ava
ilabi
lity
of s
kille
d m
an p
ower
Ther
e w
ill b
e ab
ove
70%
lite
racy
po
pula
tion
Func
tion
ing
PPP
Out
put 8
: Wat
er s
tora
ge in
fras
truc
ture
dev
elop
ed a
nd m
aint
aine
d in
all
WCA
Out
put 9
: Im
prov
ed m
anag
emen
t of u
rban
and
indu
stri
al w
aste
and
san
itat
ion

138 Master Plan for Water Catchment Areas
Inte
rven
tion
Log
icO
bjec
tive
ly V
erifi
able
Indi
cato
rsM
eans
of V
erifi
cati
onIm
port
ant a
ssum
ptio
ns
• In
crea
se in
num
ber
of in
dust
ries
ado
ptin
g re
sour
ce u
se e
ffic
ienc
y te
chno
logi
es b
y 50
% b
y 20
20 a
nd 7
5% b
y 20
30
• A
con
trac
t-ba
sed
mar
keti
ng s
yste
m fo
r N
atur
e Ba
sed
Ente
rpri
ses
esta
blis
hed
by y
ear
2015
at
Nat
iona
l and
Cou
nty
leve
l
• N
atur
al R
esou
rce
user
Ass
ocia
tion
s Es
tabl
ishe
d an
d op
erat
iona
l in
all c
atch
men
t are
as b
y 20
15
• Re
duce
the
relia
nce
of w
ood
fuel
in K
enya
from
th
e cu
rren
t 80%
to 3
0% b
y ye
ar 2
030
• A
cces
s to
ele
ctri
city
by
Keny
an h
ouse
hold
s im
prov
ed fr
om th
e cu
rren
t 15%
to 8
0% b
y ye
ar
2030
• O
ne S
ensi
tisa
tion
wor
ksho
p yo
uth,
wom
en a
nd
men
gro
ups
on e
nvir
onm
enta
l con
serv
atio
n m
etho
ds
• Fi
ve C
apac
ity
build
ing
wor
ksho
ps fo
r yo
uth,
w
omen
and
men
gro
ups
on e
nvir
onm
enta
l co
nser
vati
on m
etho
ds
• Es
tabl
ish
30 tr
ee n
urse
ries
per
cou
nty
per
year
• Tr
ee p
lant
ing-
30,
000
tree
s pe
r ye
ar
Wat
er a
nd s
anit
atio
n st
atis
tics
The
quan
tity
of p
rodu
ce s
uppl
ied
thro
ugh
the
esta
blis
hed
mar
kets
Reco
rds
from
Cou
ntie
s an
d Re
gist
rar
of
Soci
etie
sN
umbe
r of
Man
agem
ent a
gree
men
ts
sign
ed a
nd im
plem
ente
dA
nnua
l pro
gres
s re
port
s
Reco
rds
from
Ken
ya e
nerg
y se
ctor
re
port
s an
d re
cord
s
Reco
rds
from
Ken
ya E
nerg
y se
ctor
• Re
port
s of
the
sens
itis
atio
n m
eeti
ngs
• N
umbe
r of
gro
ups
sens
itis
ed
Repo
rts
on tr
aini
ngs
held
• N
umbe
r of
tree
nur
seri
es
• N
umbe
r of
tree
s pl
ante
d
Ava
ilabi
lity
of fu
nds
Ava
ilabi
lity
of fu
nds
Out
put 1
0: S
uppo
rt A
lter
nati
ve li
velih
ood
opti
ons
for
sust
aina
ble
reso
urce
use
in w
ater
cat
chm
ent c
onse
rvat
ion
prog
ram
mes
Out
put 1
1: Id
enti
fy d
evel
op a
nd p
rom
ote
rene
wab
le e
nerg
y te
chno
logi
es
Out
put 1
2: G
ende
r an
d yo
uth
invo
lvem
ent m
ains
trea
med
in W
CA a
ctiv
itie
s

139Master Plan for Water Catchment Areas
Inte
rven
tion
Log
icO
bjec
tive
ly V
erifi
able
Indi
cato
rsM
eans
of V
erifi
cati
onIm
port
ant a
ssum
ptio
ns
• En
cour
age
yout
h, w
omen
and
men
gro
ups
to
form
was
te m
anag
emen
t Gro
ups
• D
evel
op a
gen
der
mai
nstr
eam
ing
stra
tegy
• En
hanc
ed 2
011/
12 b
udge
tary
allo
cati
ons
to th
e w
ater
, for
estr
y an
d En
viro
nmen
tal s
ecto
r
• M
&E
tool
s de
velo
ped
for
and
Nat
ural
Res
ourc
es
Use
rs A
ssoc
iati
ons
(NRU
A’s)
oth
er c
omm
unit
y de
velo
pmen
t gro
ups
• M
&E
Fram
ewor
k de
velo
ped
and
oper
atio
nal
• Pu
blic
atio
ns a
nd d
isse
min
atio
n of
WCA
su
ppor
ted
• N
umbe
r of
wat
er c
atch
men
t M&
E Sy
stem
s in
stal
led
• D
ata
colle
cted
mon
thly
in a
ll W
CAs
• Ca
paci
ty b
uilt
for
Nat
ural
Res
ourc
es U
sers
A
ssoc
iati
ons
(NRU
A’s)
and
oth
er le
gally
in
stit
uted
org
aniz
atio
ns
• N
umbe
r of
you
th g
roup
s fo
rmed
on
was
te m
anag
emen
t
Act
ual e
xpen
ditu
re in
the
MTP
pha
ses
and
annu
al e
stim
ates
• M
&E
tool
s in
pla
ce a
nd o
pera
tion
al
• Re
port
s an
d do
cum
enta
tion
s,
incl
udin
g op
erat
iona
l man
uals
• M
&E
fram
ewor
k in
pla
ce a
nd
oper
atio
nal
• Re
leva
nt d
ocum
enta
tion
s an
d re
cord
s •
• Re
port
and
pub
licat
ions
• D
isse
min
atio
n re
port
/wor
ksho
p/se
min
ars
repo
rts
• A
ctua
l M&
E sy
stem
s in
stal
led
• In
stal
lati
on m
anua
ls
• O
pera
tion
man
uals
• D
ata
files
, dat
a so
ftw
are
and
rela
ted
docu
men
ts in
pla
ce•
Repo
rts
and
stat
isti
cal a
bstr
acts
•
• Tr
aine
d hu
man
reso
urce
s in
pla
ce•
Cert
ifica
tes
of tr
aine
d pe
rson
s an
d re
port
s
• O
vera
ll po
licy
and
inst
itut
iona
l fr
amew
ork
can
supp
ort t
he s
yste
m/
i.e. M
&E
fram
ewor
k.
• Re
leva
nt d
ocum
enta
tion
/ pu
blic
atio
n is
ava
ilabl
e•
Reso
urce
s re
quir
ed fo
r th
is a
ctiv
ity
is a
dequ
ate.
• O
vera
ll in
tegr
ated
sys
tem
is
inst
alle
d an
d op
erat
iona
l cen
tral
ly•
Reso
urce
s av
aila
bilit
y
• Ba
selin
e da
ta is
ava
ilabl
e•
Dat
a st
orag
e so
ftw
are
avai
labl
e•
Rele
vant
hum
an c
apac
ity
avai
labl
e
• Re
sour
ces
requ
ired
for
trai
ning
is
adeq
uate
Out
put 1
3: W
ater
cat
chm
ent a
reas
fund
ing
mec
hani
sms
stre
amlin
ed a
nd m
ains
trea
med
in b
udge
ts a
t all
leve
ls
Out
put 1
4: W
ater
cat
chm
ent a
reas
mon
itor
ing
and
repo
rtin
g sy
stem
s in
tegr
ated
and
str
engt
hene
d

140 Master Plan for Water Catchment Areas
Inte
rven
tion
Log
icO
bjec
tive
ly V
erifi
able
Indi
cato
rsM
eans
of V
erifi
cati
onIm
port
ant a
ssum
ptio
ns
• N
RUA’
s an
d ot
her
lega
lly c
onst
itut
ed
orga
niza
tion
s eq
uipp
ed w
ith
mon
itor
ing
tool
s
• N
umbe
r of
upd
ates
mad
e fo
r ea
ch C
A a
t Co
unty
and
dis
tric
t lev
els
• N
umbe
r of
mon
itor
ing
and
repo
rtin
g sy
stem
s id
enti
fied
and
list
• N
umbe
r of
reco
mm
enda
tion
s an
d im
prov
emen
ts m
ade
on p
erfo
rman
ce a
nd
valid
ity
of M
&E
tool
s
• M
&E
stra
tegy
dev
elop
ed a
long
wit
h in
stru
men
ts, p
re-t
esti
ng, s
tand
ards
and
re
port
ing
fram
ewor
k in
pla
ce
• N
umbe
r of
pre
-mon
itor
ing
mid
term
and
end
of
prog
ram
me
M&
E pr
oces
ses
cond
ucte
d.
• N
umbe
r of
sta
keho
lder
s se
nsit
ized
and
trai
ned
on M
&E
• N
umbe
r of
M&
E m
anua
ls d
evel
oped
• N
umbe
r of
add
itio
nal d
ata
colle
ctio
n in
stru
men
ts s
uppl
ied,
inst
alle
d an
d co
mm
issi
oned
• M
&E
impl
emen
ted
regu
larl
y in
WCA
• Pe
rfor
man
ce C
ontr
act i
ncor
pora
ted
in W
CA
prog
ram
mes
• In
stit
utio
ns w
ith
mon
itor
ing
tool
s an
d ar
e op
erat
iona
l•
Ope
rati
ons
man
uals
ava
ilabl
e
• U
pdat
e re
port
s•
Upd
ate
prog
ram
me/
plan
s
• Id
enti
ficat
ion
list
• Re
port
of m
onit
orin
g an
d re
port
ing
syst
em id
enti
fied
and
liste
d
• Re
port
of e
valu
atio
n•
Act
ion
take
n ba
sed
on
reco
mm
enda
tion
s
• M
&E
stra
tegy
doc
umen
t•
Pre-
test
ing
stan
dard
izat
ion
and
repo
rtin
g gu
idel
ines
, fra
mew
ork
• Re
port
s of
act
ual a
ctiv
itie
s un
dert
aken
• Se
nsit
izat
ion
and
trai
ning
repo
rts
• Ce
rtifi
cate
s aw
arde
d •
• Re
port
and
man
uals
in p
lace
/use
d •
• A
ctua
l ins
trum
ents
sup
plie
d•
Inst
alla
tion
man
uals
• Su
pply
cer
tific
ate
• Co
mm
issi
onin
g re
port
• Im
plem
enta
tion
repo
rts
• PC
doc
umen
t inc
orpo
rati
ng W
CA
prog
ram
mes
• Re
port
• N
RUA’
s an
d ot
her
lega
lly
cons
titu
ted
orga
niza
tion
s ar
e re
cept
ive
to th
e m
onit
orin
g to
ols.
• A
ll up
date
s re
quir
emen
ts a
re in
pl
ace
• M
onit
orin
g an
d re
port
ing
syst
ems
do e
xist
at t
he c
ount
y an
d di
stri
ct
leve
ls
• Pe
rfor
man
ce a
nd v
alid
ity
of th
e M
&E
tool
s/sy
stem
s is
effe
ctiv
e an
d ef
ficie
nt.
• A
dequ
ate
reso
urce
s an
d pr
oper
pl
anni
ng is
gua
rant
eed.
• A
ll sy
stem
s ar
e pr
oper
ly o
pera
tion
al
• Re
sour
ces
requ
ired
are
ass
ured
.
• Sk
ills
requ
ired
is a
vaila
ble
• Th
ere
is in
adeq
uate
dat
a co
llect
ion
equi
pmen
t in
plac
e
• A
ll ne
cess
ary
arra
ngem
ents
and
re
sour
ces
are
prov
ided
• A
ll th
e pe
rson
nel u
nder
stan
d PC
an
d it
s ap
plic
atio
n in
WCA

141Master Plan for Water Catchment Areas
Inte
rven
tion
Log
icO
bjec
tive
ly V
erifi
able
Indi
cato
rsM
eans
of V
erifi
cati
onIm
port
ant a
ssum
ptio
ns
• N
umbe
r of
use
rs a
pply
ing
self
mon
itor
ing
• N
umbe
r of
mid
term
revi
ews
unde
rtak
en o
n M
aste
r Pl
an
• M
aste
r Pl
an re
view
ed a
t the
end
of p
lane
d pe
riod
• Re
port
• Li
st o
f use
rs a
pply
ing
M&
E •
Revi
ew re
port
• Li
st o
f rec
omm
enda
tion
abs
trac
t
• Re
vise
d do
cum
ent
• Ro
ad m
ap/A
ctio
n pl
an
• A
ll us
ers
are
conv
ersa
nt w
ith
mon
itor
ing
tool
s
• In
stru
men
ts o
f rev
iew
of t
he M
aste
r Pl
an a
re in
pla
ce.
• A
ll fa
ctor
s ar
e sa
tisf
acto
rily
met
• Re
view
reso
urce
s ar
e av
aila
ble.

142 Master Plan for Water Catchment Areas
Out
put 1
: Pa
rtne
rshi
ps a
nd
part
icip
atio
n of
st
akeh
olde
rs in
the
man
agem
ent o
f w
ater
cat
chm
ent
area
s im
prov
ed
3 6 8 752
0 19 0 0
5 6 10 940
0 24 0 0
5 6 10 940
0 24 0 0
2 6 2 188
0 5 0 0
20 30 40 3,76
0
25 94 0 0
1.1
1.2
1.3
1.4
1.5
1.6
1.7
1.8
Allo
cate
20
mill
ion
for
20
year
s
Allo
cate
1.5
mill
ion
for
20
year
s
Allo
cate
2 m
illio
n an
nual
ly =
1,
000,
000
x 20
yea
rs
Allo
cate
1 m
illio
n pe
r co
unty
an
nual
ly =
1,0
00,0
00 x
47
x 4
x 20
yea
rs
Allo
cate
5 m
illio
n pe
r M
inis
trie
s =
5,00
0,00
0 x
5
Allo
cate
100
,000
for
mon
thly
m
eeti
ng o
f 30
pers
ons
in 4
7 co
unti
es fo
r 20
yea
rs
Inco
rpor
ate
in m
eeti
ngs
in 1
.5
inco
rpor
ate
in 1
.6
Set u
p an
d op
erat
iona
lise
an
inte
r-m
inis
teri
al/a
genc
y po
licy
stee
ring
com
mitt
ee
Set u
p an
d op
erat
iona
lise
WCA
sta
keho
lder
sta
ndin
g co
mm
ittee
at N
atio
nal l
evel
Conv
ene
bi-a
nnua
l WCA
di
scus
sion
fora
at n
atio
nal l
evel
Conv
ene
quar
terl
y m
eeti
ngs
for
WCA
dis
cuss
ion
fora
at
coun
ty le
vel
Setu
p W
CA d
esks
in re
leva
nt
Min
istr
ies
Crea
te in
ter
depa
rtm
enta
l co
mm
ittee
fora
in e
ach
Coun
ty
Dev
elop
com
mun
ity
gove
rnm
ent P
riva
te s
ecto
r Pa
rtne
rshi
p in
all
sub-
catc
hmen
ts
Def
ine
role
s an
d re
spon
sibi
litie
s of
sta
keho
lder
s at
sub
-cat
chm
ent l
evel
5 6 10 940
25 24 0 0
Out
put
MTP
1 20
08-
2012
Am
ount
(m
illio
n)
Kes.
Inpu
tsA
ctiv
ity
MTP
2 20
13-
2017
MTP
3 20
18-
2022
MTP
4 20
23-
2027
MTP
5 20
28-
2032
AP
PEN
DIX
12.
AC
TIV
ITY
BU
DG
ET L
OG
FRA
ME

143Master Plan for Water Catchment Areas
Out
put
MTP
1 20
08-
2012
Am
ount
(m
illio
n)
Kes.
Inpu
tsA
ctiv
ity
MTP
2 20
13-
2017
MTP
3 20
18-
2022
MTP
4 20
23-
2027
MTP
5 20
28-
2032
1.9
1.10
1.11
1.12
1.13
1.14
1.15
1.16
1.17
1.18
Hol
d re
gula
r ed
ucat
iona
l m
eeti
ngs
for
the
stak
ehol
ders
Iden
tify
key
sta
keho
lder
s an
d th
eir
mai
n in
terv
enti
ons
in
WCA
Iden
tific
atio
n of
str
engt
hs,
(SW
OT)
and
init
iati
on o
f co
llabo
rati
ve e
ffort
s H
old
nati
onal
sta
keho
lder
fo
rum
for
WCA
pro
gram
me
laun
ch
Sens
itis
atio
n of
sta
keho
lder
s at
na
tion
al le
vels
Sens
itis
atio
n of
sta
keho
lder
s at
co
unty
and
com
mun
ity
leve
ls
Iden
tify
and
doc
umen
t the
pa
rtne
rs in
WCA
(St
akeh
olde
r an
alys
is)
Build
tech
nica
l and
man
ager
ial
capa
citi
es
Set u
p W
CA c
omm
unit
y gr
oups
fo
r m
anag
emen
t
Esta
blis
h an
d op
erat
iona
lise
com
mun
ity
leve
l WCA
co
nser
vati
on y
outh
Gro
ups
3 m
eeti
ngs
per
yr in
47
coun
ties
for
100
pax
@ 1
00,0
00
Part
of 1
.9
Part
of 1
.9
20 m
illio
n fo
r 20
0 pa
x (N
otes
)
Allo
cate
3 m
illio
n fo
r 20
yea
rs
for
200
peop
le
Allo
cate
3 m
illio
n qu
arte
rly
to
47 c
ount
ies
for
20 y
ears
Cons
ulta
ncy
at 4
mill
ion
One
mon
th tr
aini
ng fo
r 50
pax
@
200
,000
Allo
cate
100
,000
per
cou
nty
(x47
)
Allo
cate
200
,000
per
cou
nty
for
20 y
rs
SUB
TOTA
L
282
0 0 20 1,20
0
11,2
80
4 10 5 188
16,9
58
14 0 0 20 60 564
4 0 5 9 879
71 0 0 0 300
2,82
0
0 10 0 47 4,25
7
71 0 0 0 300
2,82
0
0 0 0 47 4,22
2
71 0 0 0 300
2,82
0
0 0 0 47 4,22
2
56 0 0 0 240
2,25
6
0 0 0 38 3,37
8

144 Master Plan for Water Catchment Areas
Out
put
MTP
1 20
08-
2012
Am
ount
(m
illio
n)
Kes.
Inpu
tsA
ctiv
ity
MTP
2 20
13-
2017
MTP
3 20
18-
2022
MTP
4 20
23-
2027
MTP
5 20
28-
2032
Out
put 2
: Pol
icie
s,
legi
slat
ions
, re
gula
tion
s an
d st
anda
rds
gove
rnin
g m
anag
emen
t of
wat
er c
atch
men
t ar
eas
revi
ewed
, ha
rmon
ised
and
en
forc
ed
2.1
2.2
2.3
2.4
2.5
2.6
2.7
2.8
2.9
2.10
Revi
ew a
nd d
etec
t con
flict
ing
polic
ies,
legi
slat
ions
, re
gula
tion
s an
d st
anda
rds
(PLR
S) g
over
ning
man
agem
ent
of w
ater
cat
chm
ent a
reas
Esta
blis
h st
anda
rds
for
cons
erva
tion
of W
ater
CA
Dev
elop
enf
orce
men
t pr
oced
ures
for
com
mun
ity
grou
ps
Carr
y ou
t pub
lic c
onsu
ltati
on
of D
raft
har
mon
ised
PLR
S
Iden
tify
PLR
S to
be
revi
ewed
Dev
elop
a s
impl
ified
han
d bo
ok
on P
LRS
on W
CA
Publ
ish
dist
ribu
te a
nd
diss
emin
atio
n th
e ha
ndbo
ok
List
rele
vant
PLR
S fo
r W
CA
Iden
tify
gap
and
ove
rlap
s th
at
need
to b
e ch
ange
d
Esta
blis
h in
ter-
min
iste
rial
co
mm
ittee
to c
oord
inat
e an
d m
ange
the
prop
osed
cha
nges
w
ith
stak
ehol
ders
Cons
ulta
ncie
s @
25
mill
ion
See
TOR
2.1
See
TOR
2.1
47 c
ount
y w
orks
hops
for
100
peop
le x
600
,000
Nat
iona
l lev
el w
orks
hop
for
200
peop
le
See
TOR
2.1
Cons
ulta
ncy
@ 5
mill
ion
47 c
ount
ies
@ 1
mill
ion
See
outp
ut 2
.1
See
outp
ut 2
.1
See
outp
ut 2
.1
25 0 0 28 5 0 5 47 0 0 0
0 0 0 0 0 0 0 0 0 0 0
25 0 0 28 5 0 5 47 0 0 0
0 0 0 0 0 0 0 0 0 0 0
0 0 0 0 0 0 0 0 0 0 0
0 0 0 0 0 0 0 0 0 0 0

145Master Plan for Water Catchment Areas
Out
put
MTP
1 20
08-
2012
Am
ount
(m
illio
n)
Kes.
Inpu
tsA
ctiv
ity
MTP
2 20
13-
2017
MTP
3 20
18-
2022
MTP
4 20
23-
2027
MTP
5 20
28-
2032
Out
put 3
: A
Com
mun
icat
ion
stra
tegy
for
WCA
pr
ogra
mm
e de
velo
ped
and
impl
emen
ted
Esta
blis
h a
Dep
artm
ent o
n W
CA w
ithi
n th
e M
inis
try
in
char
ge o
f Env
iron
men
t
Mai
nstr
eam
WCA
pol
icie
s in
all
the
rele
vant
Min
istr
ies
Publ
icis
e an
d cr
eate
aw
aren
ess
for
PLRS
on
WCA
Carr
y ou
t a s
urve
y to
de
term
ine
com
plia
nce
to P
LRS
Mon
itor
com
plia
nce
to e
xist
ing
PLRS
Stre
ngth
en E
nvir
onm
enta
l co
mpl
ianc
e en
forc
emen
t ca
paci
ties
for
EMCA
in
stit
utio
ns a
nd o
ther
re
gula
tory
age
ncie
s up
to
coun
ty le
vel
Dev
elop
, upl
oad
and
mai
ntai
n a
web
site
on
WCA
Publ
ish
a ne
wsl
ette
r
2.11
2.12
2.13
2.14
2.15
2.16
3.1
3.2
See
outp
ut 1
.3
See
outp
ut 1
.3
Nat
iona
l lev
el @
5 m
illio
n fo
ur
tim
es in
20
yrs
47 c
ount
ies
@ 2
mill
ion
four
ti
mes
in 2
0 yr
s
Nat
ionw
ide
field
vis
its
@ 1
0 m
illio
n fo
r 20
yrs
See
outp
ut 2
.15
Allo
cate
40
mill
ion
x 20
ye
ars
for
trai
ning
and
rela
ted
acti
viti
es
SUB
TOTA
L
Ann
ual b
udge
t of 1
00,0
00 fo
r 20
yea
rs
Ann
ually
@50
,000
for
20 y
ears
Mon
thly
Ele
ctro
nic
0 0 20 376
200
0 800
1,50
6
2 1 0
0 0 0 19 10 0 40 69 0 0 0
0 0 5 94 50 0 200
459
1 0 0
0 0 5 94 50 0 200
349
1 0 0
0 0 5 94 50 0 200
349
1 0 0
0 0 5 75 40 0 160
280
0 0 0

146 Master Plan for Water Catchment Areas
Out
put
MTP
1 20
08-
2012
Am
ount
(m
illio
n)
Kes.
Inpu
tsA
ctiv
ity
MTP
2 20
13-
2017
MTP
3 20
18-
2022
MTP
4 20
23-
2027
MTP
5 20
28-
2032
3.3
3.4
3.5
3.6
3.7
3.8
3.9
3.10
3.11
Prom
ote
WC
Cons
erva
tion
th
roug
h va
riou
s m
edia
(tv,
ra
dio
prog
ram
mes
, mob
ile
phon
es, r
anet
radi
o, s
ocia
l m
edia
)
Prod
uce
illus
trat
ive
post
ers
on P
LRS
rela
ted
to W
CA
Crea
te c
omm
unit
y di
ssem
inat
ion
prog
ram
mes
Prom
ote
com
mun
ity
exch
ange
pro
gram
mes
, ba
raza
s an
d m
eeti
ngs
Des
ign
billb
oard
s ou
tlini
ng
acti
viti
es a
nd a
chie
vem
ents
of
WCA
Dev
elop
bro
chur
es to
be
dist
ribu
ted
to c
omm
unit
ies
and
othe
r st
akeh
olde
rs fo
r se
nsit
isat
ion
Dev
elop
pub
lic a
war
enes
s to
ols
Dev
elop
cur
ricu
la a
t pri
mar
y an
d se
cond
ary
scho
ol le
vels
Inte
grat
e W
CA in
to s
choo
l cu
rric
ula
Ann
ual b
udge
t of 1
0 m
illio
n of
20
yea
rs
See
outp
ut 4
See
outp
ut 4
See
outp
ut 1
10 m
illio
n an
nual
ly x
20
year
s
Allo
cate
1 m
illio
n an
nual
ly fo
r 20
yrs
See
outp
ut 4
Cons
ulta
ncy
@ 5
mill
ion
Educ
atio
nal b
udge
t of 2
0 m
illio
n an
nual
ly x
20
year
s
20 0 0 0 200
20 0 5 400
1 0 0 0 10 1 0 0 20
5 0 0 0 50 5 0 5 100
5 0 0 0 50 5 0 0 100
5 0 0 0 50 5 0 0 100
4 0 0 0 40 4 0 0 80
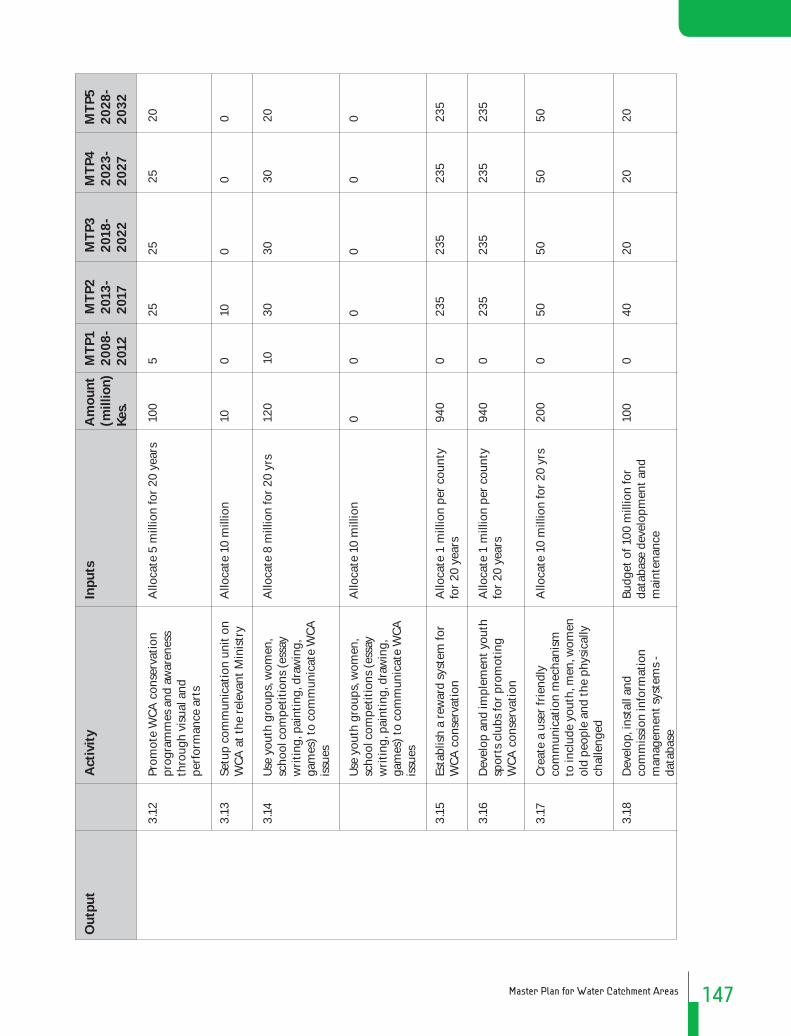
147Master Plan for Water Catchment Areas
Out
put
MTP
1 20
08-
2012
Am
ount
(m
illio
n)
Kes.
Inpu
tsA
ctiv
ity
MTP
2 20
13-
2017
MTP
3 20
18-
2022
MTP
4 20
23-
2027
MTP
5 20
28-
2032
3.12
3.13
3.14
3.15
3.16
3.17
3.18
Prom
ote
WCA
con
serv
atio
n pr
ogra
mm
es a
nd a
war
enes
s th
roug
h vi
sual
and
pe
rfor
man
ce a
rts
Setu
p co
mm
unic
atio
n un
it o
n W
CA a
t the
rele
vant
Min
istr
y
Use
you
th g
roup
s, w
omen
, sc
hool
com
peti
tion
s (e
ssay
w
riti
ng, p
aint
ing,
dra
win
g,
gam
es)
to c
omm
unic
ate
WCA
is
sues
Use
you
th g
roup
s, w
omen
, sc
hool
com
peti
tion
s (e
ssay
w
riti
ng, p
aint
ing,
dra
win
g,
gam
es)
to c
omm
unic
ate
WCA
is
sues
Esta
blis
h a
rew
ard
syst
em fo
r W
CA c
onse
rvat
ion
Dev
elop
and
impl
emen
t you
th
spor
ts c
lubs
for
prom
otin
g W
CA c
onse
rvat
ion
Crea
te a
use
r fr
iend
ly
com
mun
icat
ion
mec
hani
sm
to in
clud
e yo
uth,
men
, wom
en
old
peop
le a
nd th
e ph
ysic
ally
ch
alle
nged
Dev
elop
, ins
tall
and
com
mis
sion
info
rmat
ion
man
agem
ent s
yste
ms
- da
taba
se
Allo
cate
5 m
illio
n fo
r 20
yea
rs
Allo
cate
10
mill
ion
Allo
cate
8 m
illio
n fo
r 20
yrs
Allo
cate
10
mill
ion
Allo
cate
1 m
illio
n pe
r co
unty
fo
r 20
yea
rs
Allo
cate
1 m
illio
n pe
r co
unty
fo
r 20
yea
rs
Allo
cate
10
mill
ion
for
20 y
rs
Budg
et o
f 100
mill
ion
for
data
base
dev
elop
men
t and
m
aint
enan
ce
100
10 120
0 940
940
200
100
5 0 10 0 0 0 0 0
25 10 30 0 235
235
50 40
25 0 30 0 235
235
50 20
25 0 30 0 235
235
50 20
20 0 20 0 235
235
50 20

148 Master Plan for Water Catchment Areas
Out
put
MTP
1 20
08-
2012
Am
ount
(m
illio
n)
Kes.
Inpu
tsA
ctiv
ity
MTP
2 20
13-
2017
MTP
3 20
18-
2022
MTP
4 20
23-
2027
MTP
5 20
28-
2032
Out
put 4
: Ca
paci
ty o
f co
mm
unit
ies
to
impl
emen
t WCA
pr
ogra
mm
es
stre
ngth
ened
3.19
4.1
4.2
4.3
4.4
4.5
4.6
4.7
4.8
Esta
blis
h En
viro
nmen
t and
co
nser
vati
on R
esou
rce
Cent
res
for
shar
ing
info
rmat
ion
Aw
aren
ess
crea
tion
of
com
mun
ity
on W
CA
Trai
ning
on
tech
nica
l asp
ects
, pr
opos
als,
and
oth
er a
spec
ts
of W
CA p
rogr
amm
e
Exch
ange
vis
its
for
com
mun
ity
grou
ps
Qua
rter
ly m
eeti
ngs
for
feed
back
on
issu
es a
risi
ng
from
impl
emen
tati
on o
f WCA
pr
ogra
mm
es
Spec
ial t
rain
ing
for
man
agem
ent s
taff
(na
tion
al
leve
l)
Trai
ning
of t
rain
ers
(cou
nty
leve
l)
Faci
litie
s es
tabl
ishm
ent f
or
WCA
ass
ocia
tion
s (o
ffic
es,
tran
spor
t, in
tern
et)
Trai
ning
on
book
kee
ping
, da
ta c
olle
ctio
n an
d re
port
ing
Allo
cate
1 m
illio
n pe
r co
unty
fo
r 20
yea
rs
SUB
TOTA
L
See
1.5
Ann
ual b
udge
t for
trai
ning
for
47 m
illio
n x
20 y
ears
Allo
cate
500
000
per
Coun
ty
for
20 y
ears
Allo
cate
200
,000
per
Cou
nty
Ann
ual b
udge
t of 1
0 m
illio
n x
20 y
ears
Ann
ual b
udge
t of 2
mill
ion
x 47
cou
ntie
s ev
ery
5 ye
ars
Ann
ual b
udge
t of 1
00 m
illio
n tw
ice
in 4
7 Co
unti
es
See
6.2
940
3,99
8
0 940
470
188
200
470
200
0
0 47 0 0 0 0 0 94 0 0
235
1,02
6
0 235
118
47 50 94 100
0
235
991
0 235
118
47 50 94 0 0
235
991
0 235
118
47 50 94 100
0
235
944
0 235
118
47 50 94 0 0

149Master Plan for Water Catchment Areas
Out
put
MTP
1 20
08-
2012
Am
ount
(m
illio
n)
Kes.
Inpu
tsA
ctiv
ity
MTP
2 20
13-
2017
MTP
3 20
18-
2022
MTP
4 20
23-
2027
MTP
5 20
28-
2032
4.9
4.10
4.11
4.12
4.13
4.14
4.15
4.16
4.17
Trai
ning
of W
CA in
stit
utio
ns
on e
mpo
wer
men
t ski
lls
Esta
blis
h an
d st
reng
then
m
anag
emen
t str
uctu
res
for
WCA
com
mun
ity
orga
nisa
tion
s
Trai
ning
of e
nvir
onm
enta
l m
anag
emen
t iss
ues
(Tre
e nu
rser
y m
anag
emen
t, te
rrac
ing,
ene
rgy
savi
ng
tech
nolo
gies
and
wat
er
harv
esti
ng)
Faci
litat
ing
com
mun
itie
s to
en
gage
in IG
A
Prod
ucti
on o
f aw
aren
ess
and
com
mun
icat
ion
mat
eria
ls
Trai
n co
mm
unit
ies
on
deve
lopm
ent a
nd m
anag
emen
t of
nat
ure
base
d en
terp
rise
s
Trai
n co
mm
unit
ies
on la
nd
man
agem
ent a
nd re
sour
ces
use
effic
ienc
y
Dev
elop
cap
acit
y of
co
mm
unit
ies
to d
evel
op a
nd
nego
tiat
e co
-man
agem
ent
agre
emen
ts
Build
cap
acit
y of
com
mun
itie
s in
reso
urce
s in
vent
ory
and
asse
ssm
ent
Tota
l bud
get o
f 24
mill
ion
See
outp
ut 1
See
outp
ut 5
Revo
lvin
g fu
nd a
t 100
0000
0 pe
r Co
unty
eve
ry fi
ve y
ears
See
outp
ut 3
See
outp
ut 5
See
outp
ut 5
See
outp
ut 5
See
outp
ut 5
24 0 0 2,35
0
0 0 0 0 0
0 0 0 0 0 0 0 0 0
6 0 0 588
0 0 0 0 0
6 0 0 588
0 0 0 0 0
6 0 0 588
0 0 0 0 0
6 0 0 588
0 0 0 0 0

150 Master Plan for Water Catchment Areas
Out
put
MTP
1 20
08-
2012
Am
ount
(m
illio
n)
Kes.
Inpu
tsA
ctiv
ity
MTP
2 20
13-
2017
MTP
3 20
18-
2022
MTP
4 20
23-
2027
MTP
5 20
28-
2032
Out
put 5
: Re
stor
atio
n an
d pr
otec
tion
of a
ll w
ater
cat
chm
ent
area
s un
dert
aken
4.18
5.1
5.2
5.3
5.4
5.5
5.6
5.7
5.8
Dev
elop
a c
urri
cula
and
trai
ning
m
anua
ls fo
r ca
paci
ty b
uild
ing
for
WCA
at a
ll le
vels
SUB
TOTA
L
Dev
elop
and
app
ly c
atch
men
t re
stor
atio
n m
odel
s
Und
erta
ke b
iodi
vers
ity
reso
urce
as
sess
men
t in
wat
er c
atch
men
t ar
eas
Esta
blis
h 40
0,00
0 tr
ee s
eedl
ing
capa
city
nur
seri
es p
er s
choo
l/
per
com
mun
ity
Plan
ting
and
gro
win
g tr
ees
Dev
elop
and
pro
mot
e w
ater
ha
rves
ting
tech
nolo
gies
Esta
blis
h on
farm
woo
dlot
s
Reha
bilit
ate
Qua
rrie
s (E
stab
lishm
ent o
f Eco
par
ks)
Reha
bilit
ate
and
prot
ect
ripa
rian
are
as
Cons
ulta
ncy
@ 5
mill
ion
(Inc
reas
e)
Allo
cate
10
mill
ion
for
each
of
the
agro
eco
logi
cal z
ones
of
Keny
a
Allo
cate
10
mill
ion
per
catc
hmen
t x 2
5 ca
tchm
ents
Allo
cate
Kes
. 5 fo
r ra
isin
g ea
ch
seed
ling
x 40
00 n
urse
ries
Allo
cate
Kes
. 2 p
er s
eedl
ing
for
plan
ting
labo
ur
Allo
cate
Kes
. 2 p
er s
eedl
ing
for
mai
ntai
ning
see
dlin
gs
See
outp
ut 8
Allo
cate
Kes
. 30
per
seed
ling
per
pers
on to
pla
nt 1
2 se
edlin
gs p
er y
ear
Allo
cate
10
mill
ion
to
reha
bilit
ate
100
quar
ries
Allo
cate
500
,000
per
km
to
reha
bilit
ate
10,0
00km
of
ripa
rian
are
as
5 4,84
7
60 250
8,00
0
4,00
0
4,00
0
0 11,5
20
1,00
0
5,00
0
0 94 0 10 500
100
100
0 520
0 500
5 1,24
2
20 80 3,00
0
2,00
0
2,00
0
0 5,00
0
400
2,00
0
0 1,13
7
20 70 2,00
0
1,00
0
1,00
0
0 3,00
0
400
1,00
0
0 1,23
7
10 50 1,50
0
500
500
0 2,00
0
100
1,00
0
0 1,13
7
10 40 1,00
0
400
400
0 1,00
0
100
500

151Master Plan for Water Catchment Areas
Out
put
MTP
1 20
08-
2012
Am
ount
(m
illio
n)
Kes.
Inpu
tsA
ctiv
ity
MTP
2 20
13-
2017
MTP
3 20
18-
2022
MTP
4 20
23-
2027
MTP
5 20
28-
2032
5.9
5.10
5.11
5.12
5.13
5.14
5.15
Dev
elop
and
Pro
mot
e co
mm
unit
y ba
sed
graz
ing
in
wat
er c
atch
men
t are
as
Dev
elop
and
pro
mot
e H
illsi
de
terr
acin
g
Dev
elop
and
pro
mot
e Ca
rbon
cr
edit
trad
ing
and
carb
on
offs
et p
rogr
amm
es
Dev
elop
and
pro
mot
e po
int
and
non
poin
t Pol
luti
on
cont
rol m
easu
res
Iden
tify
and
mar
k ou
t in
dige
nous
tree
see
d st
ands
Esta
blis
h tr
ee s
eed
and
othe
r pr
opag
atio
n m
ater
ial,
supp
ly
cent
res
at F
ores
t sta
tion
leve
l
Trai
ning
in n
urse
ry
esta
blis
hmen
t, m
anag
emen
t, ou
tpla
ntin
g, g
row
ing
tree
s an
d di
spos
al o
f see
dlin
g co
ntai
ners
SUB
TOTA
L
Allo
cate
500
,000
per
km
to
cons
erve
10,
000k
m o
f rip
aria
n ar
eas
Allo
cate
1 m
illio
n to
dev
elop
gr
azin
g ag
reem
ents
for
25
catc
hmen
t are
as
Allo
cate
10
mill
ion
for
terr
acin
g in
frag
ile c
atch
men
t are
as
Allo
cate
10
mill
ion
per
catc
hmen
t x 4
0 ca
tchm
ents
to
deve
lop
carb
on b
asel
ines
and
tr
adin
g ag
reem
ents
Allo
cate
1 m
illio
n pe
r ca
tchm
ent f
or 2
000
sub-
catc
hmen
ts
Allo
cate
10
mill
ion
per
catc
hmen
t x 4
0 ca
tchm
ents
for
mar
king
and
mai
ntai
ning
the
seed
sta
nds
Allo
cate
1 m
illio
n pe
r fo
rest
st
atio
n pe
r ye
ar x
150
sta
tion
s fo
r 20
yea
rs fo
r
Allo
cate
2 m
illio
n pe
r ye
ar p
er
coun
ty fo
r 20
yea
rs
5,00
0
25 250
400
2,00
0
400
3,00
0
1,88
0
46,7
85
500
0 10 10 50 10 300
170
2,78
0
2,00
0
25 80 200
1,00
0
200
800
470
19,2
75
1,00
0
0 70 100
500
100
700
470
11,4
30
1,00
0
0 50 50 250
50 600
470
8,13
0
500
0 40 40 200
40 600
300
5,17
0

152 Master Plan for Water Catchment Areas
Out
put
MTP
1 20
08-
2012
Am
ount
(m
illio
n)
Kes.
Inpu
tsA
ctiv
ity
MTP
2 20
13-
2017
MTP
3 20
18-
2022
MTP
4 20
23-
2027
MTP
5 20
28-
2032
Out
put 6
: A
dopt
ion
of s
oil
cons
erva
tion
an
d la
nd u
se
man
agem
ent
prac
tise
s pr
omot
ed
Out
put 7
: W
ater
Res
ourc
e Co
nser
vati
on a
nd
man
agem
ent
unde
rtak
en in
all
WCA
s
6.1
6.2
6.3
6.4
6.5
6.6
7.1
7.2
Upd
ate
and
docu
men
t slo
pe
fact
ors
for
all c
atch
men
t are
as
Upd
ate
soil
and
geol
ogy
map
s fo
r al
l cat
chm
ent a
reas
Map
out
frag
ile e
cosy
stem
s in
47
cou
ntie
s
Prac
tica
l Tra
inin
g of
farm
ers
on te
rrac
ing,
gab
ion
cons
truc
tion
and
con
tour
fa
rmin
g
Cons
truc
t and
mai
ntai
n te
rrac
es a
nd g
abio
ns Tr
ain
farm
ers
on s
usta
inab
le
land
use
man
agem
ent
prac
tice
s
SUB
TOTA
L
Enfo
rcem
ent o
f wat
er
abst
ract
ion
perm
its
cond
itio
ns,
e.g.
inst
alla
tion
of m
easu
ring
an
d co
ntro
l dev
ice
Mon
itor
com
plia
nce
of w
ater
us
e co
ndit
ions
, e.g
. ins
talla
tion
of
mea
suri
ng a
nd c
ontr
ol
devi
ce
Allo
cate
5 m
illio
n pe
r co
unty
fo
r 47
cou
ntie
s
Allo
cate
10
mill
ion
per
coun
ty
for
47 c
ount
ies
Allo
cate
5 m
illio
n pe
r co
unty
fo
r 47
cou
ntie
s
Allo
cate
5 m
illio
n pe
r co
unty
x
20 y
rs
Allo
cate
5 m
illio
n pe
r co
unty
x
20 y
rs
See
outp
ut 8
.4
Patr
ollin
g an
d aw
aren
ess
stre
ngth
enin
g at
Kes
. 1 m
illio
n pe
r ye
ar p
er 1
000
sub-
catc
hmen
ts fo
r ne
w a
nd il
lega
l w
ater
use
rs 1
0 ye
ars
Mon
itor
ing/
enfo
rcem
ent
expe
nses
at K
es. 1
mill
ion
Kes.
pe
r ye
ar p
er s
ub-c
atch
men
t fo
r a
tota
l of 2
000
acti
ve s
ub-
catc
hmen
ts fo
r 20
yea
rs
235
470
235
4,70
0
4,70
0
0 10,3
40
10,0
00
40,0
00
0 0 0 294
294
0 588
500
1,00
0
235
470
235
1,17
5
1,17
5
0 3,29
0
4,00
0
16,0
00
0 0 0 1,17
5
1,17
5
0 2,35
0
2,50
0
10,0
00
0 0 0 1,17
5
1,17
5
0 2,35
0
2,00
0
8,00
0
0 0 0 881
881
0 1,76
3
1,00
0
5,00
0

153Master Plan for Water Catchment Areas
Out
put
MTP
1 20
08-
2012
Am
ount
(m
illio
n)
Kes.
Inpu
tsA
ctiv
ity
MTP
2 20
13-
2017
MTP
3 20
18-
2022
MTP
4 20
23-
2027
MTP
5 20
28-
2032
7.3
7.4
7.5
7.6
Enfo
rcem
ent o
f rel
evan
t pr
ovis
ions
in th
e Fo
rest
s A
ct, M
iner
als
Act
, EM
CA, t
o en
hanc
e pr
otec
tion
of l
and
cove
r an
d in
app
ropr
iate
de
velo
pmen
t, e.
g.
mon
itor
com
plia
nce
on
lives
tock
gra
zing
bey
ond
carr
ying
cap
acit
y
Enfo
rcem
ent o
f rel
evan
t pr
ovis
ions
in th
e w
ater
Act
, EM
CA to
pre
vent
wet
land
en
croa
chm
ent
Enfo
rcem
ent o
f byl
aws
to
prev
ent s
torm
wat
er d
amag
e,
e.g.
soi
l ero
sion
, to
bare
land
w
ithi
n co
unti
es
Ensu
re ro
ad d
esig
ns th
at
prov
ide
for
stor
m w
ater
m
anag
emen
t on
farm
s ne
xt to
th
e ro
ad
Esta
blis
hmen
t of a
m
echa
nism
for
plou
gh b
ack
to
cons
erva
tion
and
man
agem
ent,
e.g.
a c
onse
rvat
ion
levy
by
bene
ficia
ries
suc
h as
KEN
GEN
, Ke
nya’
s To
uris
m in
dust
ry,
Keny
a’s
Hor
ticu
ltura
l and
Cut
flo
wer
indu
stry
and
Ken
ya
Fish
erie
s In
dust
ry
Mon
itor
ing/
enfo
rcem
ent
expe
nses
at K
es. 1
mill
ion
Kes.
pe
r ye
ar p
er d
istr
ict f
or a
tota
l of
300
dis
tric
ts fo
r 20
yea
rs
Mon
itor
ing/
enfo
rcem
ent
expe
nses
at K
es. 1
mill
ion.
per
ye
ar p
er d
istr
icts
for
a to
tal o
f 47
cou
ntie
s fo
r 20
yea
rs
Dev
elop
men
t of p
olic
y an
d re
gula
tion
s (w
ithi
n th
ree
year
s)
and
mon
itor
impl
emen
tati
on a
t Ke
s. 1
bill
ion
Dev
elop
and
impl
emen
t PES
pr
ogra
mm
e at
Kes
. 100
mill
ion
6,00
0
940
1,00
0
100
500
35 0 0
1,50
0
235
500
50
1,50
0
235
300
30
1,50
0
235
100
10
1,00
0
200
100
10

154 Master Plan for Water Catchment Areas
Out
put
MTP
1 20
08-
2012
Am
ount
(m
illio
n)
Kes.
Inpu
tsA
ctiv
ity
MTP
2 20
13-
2017
MTP
3 20
18-
2022
MTP
4 20
23-
2027
MTP
5 20
28-
2032
7.7
7.8
7.9
7.10
7.11
7.12
Esta
blis
h w
ater
bal
ance
s th
roug
h re
sour
ce a
sses
smen
t an
d de
man
d su
rvey
Map
out
ero
sion
hot
spot
s an
d us
e of
ver
tiva
gra
ss o
n ro
ad s
ides
and
oth
er d
iffic
ult
eros
ion
hots
pots
Dev
elop
men
t of w
ater
al
loca
tion
(ap
port
ionm
ent)
pl
an fo
r ea
ch s
ub-c
atch
men
t to
ens
ure
equi
ty fo
r ec
osys
tem
s an
d ba
sic
hum
an
need
s
Esta
blis
hmen
t and
de
linea
tion
of w
ater
reso
urce
m
anag
emen
t uni
ts
Init
iate
foru
ms
for
tran
sbou
ndar
y w
ater
ne
goti
atio
n
Cons
truc
ting
inte
r-ba
sin
and
intr
a-ba
sin
wat
er tr
ansf
ers
to
chan
nel w
ater
from
are
as w
ith
exce
ss w
ater
to a
reas
wit
h w
ater
def
icit
Wat
er re
sour
ce a
sses
smen
t and
w
ater
use
sur
vey
for
2000
sub
-ca
tchm
ents
at 1
.5 m
illio
n fo
r 10
ye
ars
Map
out
5 a
nd re
habi
litat
e ho
tspo
ts in
200
0 su
b-ca
tchm
ents
at K
es. 1
00,0
00
Cons
ulta
tion
mee
ting
s,
wor
ksho
ps a
nd s
emin
ars
for
2000
sub
cat
chm
ents
at K
es. 1
m
illio
n ea
ch fo
r 5
year
s
Use
GIS
app
licat
ion,
sta
keho
lder
m
eeti
ng fo
r 5
drai
nage
bas
ins
at
5 m
illio
n fo
r 2
year
s
Mee
ting
exp
ense
s, in
tern
atio
nal
and
loca
l tra
vel f
or 3
mee
ting
pe
r ye
ar fo
r 6
inte
rnat
iona
l w
ater
bod
ies
at 1
0 m
eac
h fo
r 5
year
s
One
pro
ject
for
5 tr
ansf
ers
over
20
yea
rs a
t 3 y
ear
inte
rval
at 1
bi
llion
30,0
00
1,00
0
10,0
00
50 900
30,0
00
0 0 0 0 0 0
30,0
00
1,00
0
4,00
0
50 225
7,50
0
0 0 2,00
0
0 225
7,50
0
0 0 2,00
0
0 225
7,50
0
0 0 2,00
0
0 225
7,50
0

155Master Plan for Water Catchment Areas
Out
put
MTP
1 20
08-
2012
Am
ount
(m
illio
n)
Kes.
Inpu
tsA
ctiv
ity
MTP
2 20
13-
2017
MTP
3 20
18-
2022
MTP
4 20
23-
2027
MTP
5 20
28-
2032
Out
put 8
: W
ater
sto
rage
in
fras
truc
ture
de
velo
ped
and
mai
ntai
ned
in
all W
CA
7.13
7.14
7.15
8.1
8.2
8.3
Incr
easi
ng c
aptu
re a
nd
rete
ntio
n of
rain
wat
er th
roug
h th
e co
nstr
ucti
on o
f wat
erw
ays,
st
rate
gic
bore
hole
s an
d ot
her
wat
er h
arve
stin
g st
ruct
ures
to
ens
ure
avai
labi
lity
of w
ater
du
ring
dry
sea
sons
Und
erta
ke a
pplie
d w
ater
re
sour
ce R
esea
rch
Prom
ote
safe
use
of
agro
chem
ical
s of
wat
er
catc
hmen
t are
as
SUB
TOTA
L
Prom
ote
rain
wat
er h
arve
stin
g at
hou
seho
ld a
nd in
stit
utio
nal
leve
l
Prom
ote
rain
wat
er h
arve
stin
g at
farm
leve
l for
live
stoc
k an
d ir
riga
tion
Build
ing
capa
city
for
wat
er
qual
ity
mon
itor
ing
incl
udin
g tr
aini
ng p
erso
nnel
to p
rote
ct
wat
ersh
eds
and
mon
itor
wat
er
qual
ity
Impl
emen
t 2 p
roje
cts
(dam
, pa
n) p
er s
ub-c
atch
men
t at 5
m
x 20
00 x
20
year
s
Proj
ects
on
rese
arch
in fo
rest
hy
drol
ogy,
wat
er re
cycl
ing,
po
lluti
on c
ontr
ol, l
and
man
agem
ent a
t Kes
. 100
m
illio
n gr
ant t
o re
sear
ch
inst
itut
ions
for
20 y
ears
Impl
emen
t pro
ject
s (s
afe
use
at fa
rm le
vel,
man
ufac
ture
r, m
onit
orin
g in
wat
er b
odie
s) a
t Ke
s. 1
0 m
illio
n fo
r 20
yrs
Pilo
t pro
ject
s on
sur
face
and
un
derg
roun
d st
orag
e in
200
0 su
b-ca
tchm
ents
at K
es. 2
m
illio
n fo
r 10
yrs
Pilo
t pro
ject
s on
sur
face
st
orag
e in
200
0 su
b-ca
tchm
ents
at K
es. 5
mill
ion
for
10 y
rs
see
outp
ut 4
200,
000
2,00
0
200
332,
190
40,0
00
100,
000
0
0 100
10 2,14
5
5,00
0
10,0
00
0
50,0
00
600
60 115,
720
20,0
00
50,0
00
0
50,0
00
600
60 74,9
50
15,0
00
40,0
00
0
50,0
00
400
40 72,0
10
0 0 0
50,0
00
300
30 67,3
65
0 0 0

156 Master Plan for Water Catchment Areas
Out
put
MTP
1 20
08-
2012
Am
ount
(m
illio
n)
Kes.
Inpu
tsA
ctiv
ity
MTP
2 20
13-
2017
MTP
3 20
18-
2022
MTP
4 20
23-
2027
MTP
5 20
28-
2032
Out
put 9
: Im
prov
ed
man
agem
ent
of u
rban
and
in
dust
rial
was
te
and
sani
tati
on
harm
onis
ed a
nd
enfo
rced
8.4
8.5
8.6
9.1
9.2
9.3
De-
silti
ng r
iver
s an
d da
ms
to
impr
ove
carr
ying
cap
acit
y,
wat
er s
tora
ge a
nd w
ater
qu
alit
y
Cons
truc
t wat
erin
g in
fras
truc
ture
(ra
mps
, tr
ough
s) to
pre
vent
de
stru
ctio
n of
wat
er p
ans
and
bore
hole
s by
wat
erin
g liv
esto
ck
Prom
ote
wat
er u
se e
ffic
ienc
y e.
g. b
y dr
ip ir
riga
tion
, pr
oduc
tion
of h
igh
valu
e cr
ops
and
lives
tock
.
SUB
TOTA
L
Man
agem
ent i
nclu
ding
re
cycl
ing
and
use
of
cons
truc
ted
wet
land
s of
indu
stri
al, U
rban
and
m
unic
ipal
was
te
Dev
elop
was
tew
ater
trea
tmen
t an
d so
lid w
aste
faci
litie
s in
cl.
wet
land
s fo
r 20
tow
ns fo
r 10
yea
rs a
t 1 b
illio
n (J
usti
fy
sele
ctio
n)
Man
agem
ent o
f dom
esti
c,
hum
an a
nd s
olid
was
te
Und
erta
ke d
urin
g ea
ch y
ear
10km
riv
er d
esilt
ing,
10
larg
e da
ms,
10
med
ium
dam
s, a
nd
20 s
mal
l dam
s at
ove
rall
cost
of
2 b
illio
n fo
r 20
yea
rs e
very
5
year
s
Und
erta
ke d
urin
g ea
ch y
ear
100
proj
ects
for
lives
tock
wat
erin
g at
ove
rall
cost
of K
es. 2
mill
ion
for
20 y
ears
Pilo
t pro
ject
s on
dri
p ir
riga
tion
, ad
opti
on o
f hig
h va
lue
crop
s, in
20
00 s
ub-c
atch
men
ts a
t Kes
. 5
mill
ion
for
10 y
rs
Upg
radi
ng a
nd m
oder
nise
w
aste
wat
er a
nd s
olid
was
te
trea
tmen
t fac
iliti
es in
cl.
cons
truc
ted
wet
land
s fo
r 10
to
wns
for
10 y
ears
at 1
bill
ion
(jus
tify
sel
ecti
on)
Allo
cate
1 b
illio
n fo
r 20
tow
ns
for
10 y
ears
Dev
elop
eco
san
(def
ine)
toile
ts
(1m
x 2
00 p
er y
ear)
40,0
00
4,00
0
40,0
00
224,
000
10,0
00
20,0
00
4,00
0
0 0 0 15,0
00
0 0 200
20,0
00
1,00
0
10,0
00
101,
000
5,00
0
10,0
00
1,00
0
20,0
00
1,00
0
10,0
00
86,0
00
5,00
0
10,0
00
1,00
0
0 1,00
0
10,0
00
11,0
00
0 0 1,00
0
0 1,00
0
10,0
00
11,0
00
0 0 800

157Master Plan for Water Catchment Areas
Out
put
MTP
1 20
08-
2012
Am
ount
(m
illio
n)
Kes.
Inpu
tsA
ctiv
ity
MTP
2 20
13-
2017
MTP
3 20
18-
2022
MTP
4 20
23-
2027
MTP
5 20
28-
2032
Out
put 1
0:
Alte
rnat
ive
livel
ihoo
ds fo
r su
stai
nabl
e re
sour
ce u
se in
w
ater
cat
chm
ent
cons
erva
tion
pr
ogra
mm
es
supp
orte
d
9.4
9.5
10.1
10.2
10.3
10.4
Clea
ner
prod
ucti
on
tech
nolo
gy to
min
imis
e in
dust
rial
pol
luti
on
Dev
elop
and
sep
arat
ion
of
was
te a
nd re
cycl
ing
of a
t lea
st
coun
ties
at K
es.
SUB
TOTA
L
Carr
y ou
t a n
eeds
ass
essm
ent
in 4
0 ca
tchm
ent a
reas
Esta
blis
h ec
o to
uris
m c
entr
es
and
equi
p th
em w
ith
faci
litie
s
Dev
elop
Nat
ure
base
d en
terp
rise
s (B
eeke
epin
g,
butt
er fl
y fa
rmin
g, fi
sh
farm
ing,
silk
wor
m fa
rmin
g,
stev
ia fa
rmin
g et
c) in
all
catc
hmen
t are
as
Dev
elop
con
trac
t bas
ed
mar
keti
ng s
yste
ms
Vent
ilate
d Im
prov
ed P
it la
trin
e -
VIP
Lat
rine
s (1
0000
x 5
0,00
0 pe
r ye
ar)
Mod
erni
se fa
ctor
ies
to
min
imis
e po
lluti
on g
ener
atio
n at
200
m x
47
fact
orie
s x
10
year
s
Lin
k to
out
put 3
(c
omm
unic
atio
n st
rate
gy)
Allo
cate
5 m
illio
n pe
r ca
tchm
ent f
or 4
0 su
b-ca
tchm
ents
Allo
cate
10
mill
ion
per
catc
hmen
t for
40
sub-
catc
hmen
ts
Allo
cate
10
mill
ion
per
catc
hmen
t for
40
sub-
catc
hmen
ts
Cons
ulta
ncy
cost
ing
5 m
illio
n
6,00
0
94,0
00
0 134,
000
200
400
400
5
500
0 0 700
10 20 20 5
1,50
0
47,0
00
0 64,5
00
50 100
100
0
1,50
0
47,0
00
0 64,5
00
50 100
100
0
1,50
0
0 0 2,50
0
50 100
100
0
1,00
0
0 0 1,80
0
40 80 80 0

158 Master Plan for Water Catchment Areas
Out
put
MTP
1 20
08-
2012
Am
ount
(m
illio
n)
Kes.
Inpu
tsA
ctiv
ity
MTP
2 20
13-
2017
MTP
3 20
18-
2022
MTP
4 20
23-
2027
MTP
5 20
28-
2032
10.5
11.1
11.2
11.3
11.4
11.5
11.6
11.7
11.8
11.9
Com
mer
cial
isat
ion
of
com
mun
ity
prod
ucts
to
incr
ease
thei
r pr
ices
SUB
TOTA
L
Supp
ort t
he u
se o
f sol
ar e
nerg
y fo
r ha
lf of
Ken
ya’s
hou
seho
lds
to m
eet t
he e
nerg
y de
man
ds o
f ru
ral p
opul
atio
ns
Carr
y ou
t fea
sibi
lity
stud
ies
to
iden
tify
the
pote
ntia
l of w
ind
ener
gy in
Ken
ya
Inst
all 1
0 w
ind
ener
gy
equi
pmen
t per
yea
r
Supp
ort g
row
th tr
ee g
row
ing
in fa
rms
and
fore
sts
to s
usta
in
woo
d fu
el re
quir
emen
ts
Prom
ote
the
use
of e
nerg
y sa
ving
app
lianc
es
Enha
nce
the
Hyd
ro p
ower
pr
oduc
tion
of t
he c
ount
ry
Dev
elop
the
coun
try’
s ge
othe
rmal
pow
er p
rodu
ctio
n
Prom
ote
the
use
of s
olar
en
ergy
and
rech
arge
able
ba
tter
ies
for
mot
orcy
cles
Dev
elop
the
coun
try’
off
shor
e w
ave
ener
gy h
arve
stin
g
Allo
cate
5 m
illio
n pe
r ca
tchm
ent f
or 4
0 su
b-ca
tchm
ents
Allo
cate
10,
000
x 4,
000,
000
hous
ehol
ds
Cons
ulta
ncy
for
20,0
00
Allo
cate
10,
000,
000
per
win
d en
ergy
sou
rce
See
outp
ut 5
Allo
cate
5 m
illio
n pe
r co
unty
x
20 y
rs
Allo
cate
1 b
illio
n pe
r ye
ar x
20
yrs
Allo
cate
1 b
illio
n pe
r ye
ar x
20
yrs
Allo
cate
5 m
illio
n pe
r co
unty
x
20 y
rs
Allo
cate
1 b
illio
n pe
r ye
ar x
20
yrs
400
1,40
5
40,0
00
20 2,00
0
0 4,70
0
20,0
00
20,0
00
4,70
0
20,0
00
20 75 2,00
0
0 0 0 175
1,00
0
1,00
0
175
1,00
0
100
350
10,0
00
20 1,00
0
0 1,17
5
5,00
0
5,00
0
1,17
5
5,00
0
100
350
10,0
00
0 1,00
0
0 1,17
5
5,00
0
5,00
0
1,17
5
5,00
0
100
350
10,0
00
0 0 0 1,17
5
5,00
0
5,00
0
1,17
5
5,00
0
80 280
8,00
0
0 0 0 1,00
0
4,00
0
4,00
0
1,00
0
4,00
0
Out
put 1
1:
Rene
wab
le e
nerg
y te
chno
logi
es
iden
tifie
d,
deve
lope
d an
d pr
omot
ed

159Master Plan for Water Catchment Areas
Out
put
MTP
1 20
08-
2012
Am
ount
(m
illio
n)
Kes.
Inpu
tsA
ctiv
ity
MTP
2 20
13-
2017
MTP
3 20
18-
2022
MTP
4 20
23-
2027
MTP
5 20
28-
2032
Out
put 1
2:
Gen
der,
yout
h an
d vu
lner
able
gro
ups
mai
nstr
eam
ed in
W
CA a
ctiv
itie
s
11.1
0
11.1
1
12.1
12.2
12.3
12.4
12.5
12.6
12.7
12.8
Dev
elop
and
pro
mot
e bi
ofue
ls
Dev
elop
and
pro
mot
e bi
ogas
te
chno
logi
es
SUB
TOTA
L
Hol
d re
gula
r se
nsit
isat
ion
wor
ksho
ps
Dev
elop
cap
acit
y bu
ildin
g m
anua
l
Gen
der
trai
ning
on
tech
nica
l as
pect
s, p
ropo
sals
, and
oth
er
aspe
cts
of W
CA p
rogr
amm
e
Trai
ning
of y
outh
and
spe
cial
in
tere
st g
roup
s on
WCA
as
pect
s
Esta
blis
h tr
ee s
eedl
ing
capa
city
nur
seri
es fo
r yo
uth
grou
ps
Esta
blis
h tr
ee s
eedl
ing
capa
city
nur
seri
es fo
r w
omen
gr
oups
Use
wom
en g
roup
s to
co
mm
unic
ate
WCA
issu
es
(See
als
o 5.
15)
Use
you
th g
roup
s to
co
mm
unic
ate
WCA
issu
es (
see
5.15
)
Allo
cate
1 b
illio
n pe
r ye
ar x
20
yrs
Allo
cate
1 b
illio
n pe
r ye
ar x
20
yrs
Link
to o
utpu
t 4
Link
to o
utpu
t 4
Allo
cate
50
mill
ion
for
20 y
ears
Allo
cate
d 50
mill
ion
for
20
year
s
Allo
cate
50
mill
ion
for
20 y
ears
Allo
cate
50
mill
ion
for
20 y
ears
Allo
cate
2 m
illio
n
Allo
cate
2 m
illio
n
20,0
00
20,0
00
151,
420
0 0 1,00
0
1,00
0
1,00
0
1,00
0
40 40
1,00
0
1,00
0
7,35
0
0 0 50 50 50 50 2 2
5,00
0
5,00
0
38,3
70
0 0 250
250
250
250
10 10
5,00
0
5,00
0
38,3
50
0 0 250
250
250
250
10 10
5,00
0
5,00
0
37,3
50
0 0 250
250
250
250
10 10
4,00
0
4,00
0
30,0
00
0 0 200
200
200
200
8 8

160 Master Plan for Water Catchment Areas
Out
put
MTP
1 20
08-
2012
Am
ount
(m
illio
n)
Kes.
Inpu
tsA
ctiv
ity
MTP
2 20
13-
2017
MTP
3 20
18-
2022
MTP
4 20
23-
2027
MTP
5 20
28-
2032
Out
put 1
3:
Wat
er c
atch
men
t ar
eas
fund
ing
mec
hani
sms
stre
amlin
ed a
nd
mai
nstr
eam
ed
in b
udge
ts a
t all
leve
ls.
12.9
12.1
0
12.1
1
13.1
13.2
13.3
13.4
13.5
13.6
Esta
blis
h ge
nder
m
ains
trea
min
g st
rate
gy
Esta
blis
h yo
uth,
phy
sica
lly
chal
leng
ed a
nd o
ther
vu
lner
able
gro
ups
stra
tegy
Was
te m
anag
emen
t pro
ject
s fo
r w
omen
, you
th a
nd s
peci
al
inte
rest
gro
ups
SUB
TOTA
L
Revi
ew h
arm
onis
e an
d (a
nd e
nfor
ce)
cons
olid
ate
envi
ronm
ent r
esto
rati
on fu
nds
Iden
tify
cur
rent
and
pot
enti
al
sour
ces
of fu
ndin
g
List
the
prio
rity
are
as b
ased
on
WCA
pro
gram
mes
Rati
onal
ise
WCA
fund
ing
requ
irem
ents
bas
ed o
n pr
iori
ties
Dev
elop
a fi
nanc
ial,
proc
urem
ent a
nd
man
agem
ent h
andb
ook
for
WCA
at a
ll le
vels
Revi
ew a
nd e
valu
ate
the
curr
ent f
undi
ng m
echa
nism
s an
d st
ream
line
thei
r op
erat
ions
Allo
cate
10,
000,
000
Allo
cate
20,
000,
000
Allo
cate
200
mill
ion
for
20
year
s
Cons
ulta
ncy
@20
mill
ion
Des
k st
udy
@ 1
mill
ion
Des
k st
udy
TOR
for
13.2
Des
k st
udy
TOR
13.2
Cons
ulta
ncy
@ 4
mill
ion
TOR
for
13.1
10 20 4,00
0
8,11
0
20 1 0 0 4 0
0 0 200
404
0 0 0 0 0 0
10 20 1,00
0
2,05
0
20 1 0 0 4 0
0 0 1,00
0
2,02
0
0 0 0 0 0 0
0 0 1,00
0
2,02
0
0 0 0 0 0 0
0 0 800
1,61
6
0 0 0 0 0 0

161Master Plan for Water Catchment Areas
Out
put
MTP
1 20
08-
2012
Am
ount
(m
illio
n)
Kes.
Inpu
tsA
ctiv
ity
MTP
2 20
13-
2017
MTP
3 20
18-
2022
MTP
4 20
23-
2027
MTP
5 20
28-
2032
13.7
13.8
13.9
13.1
0
13.1
1
13.1
2
13.1
3
Dev
elop
mec
hani
sms/
way
s of
al
loca
ting
fund
s to
WCA
s at
all
leve
ls
Stre
ngth
en a
nd p
ublic
ise
all
WCA
sou
rces
of f
unds
Dev
elop
and
cir
cula
te a
di
rect
ory
of W
CA fu
ndin
g so
urce
s
Esta
blis
h a
WCA
fund
co
ordi
nati
ng b
ody
Esta
blis
h/St
reng
then
and
op
erat
iona
lise
appl
icat
ion
of
paym
ent o
f eco
syst
em s
ervi
ces
(PES
)
Crea
te/e
stab
lish
a W
CA c
entr
e of
exc
elle
nce
for
rese
arch
and
m
anag
emen
t
Intr
oduc
e co
nser
vanc
y le
vy
and
paym
ent f
or e
cosy
stem
se
rvic
es
Tor
for
13.1
5 D
onor
foru
ms
@ 5
00,0
00
20 S
emin
ars
@60
0,00
0
Publ
ish
dire
ctor
y @
4 m
illio
n
Mee
ting
s fo
r st
akeh
olde
rs =
10
mill
ion
Off
ice
spac
e @
1.2
mill
ion
annu
ally
for
20 y
ears
Cons
ulta
ncy
@ 1
0 m
illio
n
Set u
p in
exi
stin
g in
stit
utio
n –
100
mill
ion
Ann
ual b
udge
t 100
mill
ion
x 20
ye
ars
Cons
ulta
ncy
@ 5
mill
ion
0 3 12 4 10 24 10 100
2,00
0
5
0 1 1 0 0 1 0 0 0 0
0 1 3 4 10 6 10 100
500
5
0 1 3 0 0 6 0 0 500
0
0 1 3 0 0 6 0 0 500
0
0 1 2 0 0 5 0 0 500
0

162 Master Plan for Water Catchment Areas
Out
put
MTP
1 20
08-
2012
Am
ount
(m
illio
n)
Kes.
Inpu
tsA
ctiv
ity
MTP
2 20
13-
2017
MTP
3 20
18-
2022
MTP
4 20
23-
2027
MTP
5 20
28-
2032
Out
put 1
4:
Wat
er c
atch
men
t ar
eas
mon
itor
ing
and
eval
uati
on
syst
ems
inte
grat
ed a
nd
stre
ngth
ened
.
13.1
4
14.1
14.2
14.3
14.4
14.5
14.6
14.7
Stre
ngth
en w
ater
man
agem
ent
WCA
and
fund
s co
mm
ittee
at
dist
rict
(w
ards
) an
d co
unty
le
vels
wit
h au
diti
ng m
echa
nism
pu
t in
plac
e
SUB
TOTA
L
Dev
elop
ME
tool
s fo
r na
tura
l re
sour
ce u
sers
gro
ups
and
othe
r le
gally
con
stit
uted
WCA
s su
ppor
ting
com
mun
ity
grou
ps
Dev
elop
and
ope
rati
onal
ise
M&
E fr
amew
ork
tailo
red
to
nati
onal
and
cou
nty
Supp
ort p
ublic
atio
n an
d di
ssem
inat
ion
of W
CA a
nnua
l re
port
Inst
all w
ater
cat
chm
ent M
&E
syst
ems
in a
ll ca
tchm
ents
Mon
thly
dat
a co
llect
ion
in a
ll W
CA’s
Build
NRU
As
and
othe
r le
gally
co
nsti
tute
d or
gani
sati
ons
capa
city
in m
onit
orin
g
Equi
p al
l NRU
A’s
and
othe
r le
gally
con
stit
uted
or
gani
sati
ons
wit
h m
onit
orin
g to
ols
Trai
ning
(an
nual
ly)
5 m
illio
n x
20 y
ears
1000
00 p
er c
ount
y fo
r 47
= 4
.7
mill
ion
Cons
ulta
ncy
10 m
illio
n
Cons
ulta
ncy
@4
mill
ion
47 c
ount
ies
@5
mill
ion
= 23
5 m
illio
n
Mon
thly
@50
,000
= 4
7 x
12 x
20
yea
rs
Link
to o
utpu
t 14.
2
Link
to o
utpu
t 14.
2
100
2,29
3
5 10 4 235
564
0 0
0 2 0 0 0 0 35 0 0
25 689
5 10 4 118
141
0 0
25 535
0 0 0 118
141
0 0
25 535
0 0 0 0 141
0 0
25 533
0 0 0 0 106
0 0

163Master Plan for Water Catchment Areas
Out
put
MTP
1 20
08-
2012
Am
ount
(m
illio
n)
Kes.
Inpu
tsA
ctiv
ity
MTP
2 20
13-
2017
MTP
3 20
18-
2022
MTP
4 20
23-
2027
MTP
5 20
28-
2032
14.8
14.9
14.1
0
14.1
1
14.1
2
14.1
3
14.1
4
14.1
5
14.1
6
14.1
7
Regu
lar
upda
tes
for
each
ca
tchm
ent a
rea
at c
ount
y an
d di
stri
ct le
vels
.
Iden
tify
and
list
all
mon
itor
ing
and
repo
rtin
g sy
stem
wit
hin
WCA
Eval
uate
thei
r pe
rfor
man
ce
and
valid
ity
and
reco
mm
end
impr
ovem
ent
Dev
elop
M&
E st
rate
gy th
at
invo
lves
dev
elop
men
t of
inst
rum
ents
, pre
test
ing,
st
anda
rds
and
repo
rtin
g fr
amew
ork
Cond
uct p
re-
mon
itor
ing,
m
idte
rm a
nd e
nd o
f pr
ogra
mm
e M
&E
proc
ess
Sens
itis
e an
d tr
ain
stak
ehol
ders
on
M&
E
Dev
elop
an
M&
E m
anua
l for
na
tura
l res
ourc
e us
er g
roup
s
Supp
ly in
stal
l and
com
mis
sion
ad
diti
onal
dat
a co
llect
ion
equi
pmen
ts
Impl
emen
t reg
ular
M&
E in
W
CA
Inco
rpor
ate
PC in
WCA
pr
ogra
mm
es
Mon
thly
Rep
orts
20,
000
per
coun
ty x
12
x 20
yea
rs
TOR
Cons
ulta
ncy
see
14.2
TOR
for
14.2
TOR
for
14.2
Cons
ulta
ncy
12 m
illio
n (4
m
illio
n pe
r pa
rt)
Trai
n 50
pax
in 4
7 co
unti
es @
50
,000
x 2
0 ye
ars
Cons
ulta
ncy
@ 5
mill
ion
Link
to o
utpu
t 14.
4
Link
to o
utpu
t 14.
4
Link
to o
utpu
t 14.
4
226
0 0 0 12 2,23
3
5 0 0 0
14 0 0 0 0 140
0 0 0 0
56 0 0 0 4 558
5 0 0 0
56 0 0 0 4 558
0 0 0 0
56 0 0 0 0 558
0 0 0 0
42 0 0 0 4 419
0 0 0 0

164 Master Plan for Water Catchment Areas
Out
put
MTP
1 20
08-
2012
Am
ount
(m
illio
n)
Kes.
Inpu
tsA
ctiv
ity
MTP
2 20
13-
2017
MTP
3 20
18-
2022
MTP
4 20
23-
2027
MTP
5 20
28-
2032
14.1
8
14.1
9
14.2
0
Enfo
rcin
g se
lf m
onit
orin
g by
re
sour
ce u
sers
Mid
-ter
m R
evie
w o
f the
M
aste
r Pl
an a
fter
10
year
s
End
term
revi
ew o
f the
Mas
ter
Plan
Link
to o
utpu
t 14.
4
Allo
cate
40
mill
ion
for
the
year
20
20
Allo
cate
50
mill
ion
for
the
year
20
30
SUB
TOTA
L
GRA
ND
TO
TAL
0 40 50 3,38
3
941,
234
0 0 0 189
30,3
22
0 0 0 901
353,
128
0 40 0 917
288,
100
0 0 0 756
143,
799
0 0 50 621
125,
885

165Master Plan for Water Catchment Areas


For further information, contact:
The Permanent Secretary,Ministry of Environment and Mineral Resources,
NHIF Building, Ragati Road, Upperhill,P.O. Box 30126 00100 Nairobi.
Tel: +254 020 2730808Email: [email protected]
Web: www.environment.go.ke
REPUBLIC OF KENYA