republic of kenya agriculture, rural and urban …
TRANSCRIPT
REPUBLIC OF KENYA
AGRICULTURE, RURAL AND URBAN DEVELOPMENT (ARUD) SECTOR REPORT
MEDIUM TERM EXPENDITURE FRAMEWORK2016/17-2018/19
NOVEMBER, 2015

i
TABLE OF CONTENTS
LIST OF TABLES...............................................................................................................................................III
LIST OF ACRONYMS........................................................................................................................................IV
EXECUTIVE SUMMARY.............................................................................................................................VII
CHAPTER ONE .................................................................................................................................................1
1. INTRODUCTION ..................................................................................................................................... 1
1.1 BACKGROUND ..............................................................................................................................................11.2 SECTOR VISION AND MISSION..........................................................................................................................41.3 STRATEGIC GOALS/OBJECTIVES OF THE SECTOR ...................................................................................................41.4 SUB-SECTORS AND THEIR MANDATES................................................................................................................41.5 AUTONOMOUS AND SEMI-AUTONOMOUS GOVERNMENT AGENCIES (SAGAS) AND TRAINING INSTITUTIONS..................61.6 ROLE OF SECTOR STAKEHOLDERS......................................................................................................................9
CHAPTER TWO .............................................................................................................................................. 11
2. PROGRAMME PERFORMANCE REVIEW FOR THE PERIOD 2012/13-2014/15 ........................................ 11
3.1 REVIEW OF SECTOR PROGRAMMES/SUB PROGRAMMES PERFORMANCE –DELIVERY OFOUTPUTS/ KPI/TARGETS (2012/13-2014/15) ..........................................................................................................................................................113.2 EXPENDITURE ANALYSIS................................................................................................................................25
3.2.1 Analysis of Programme Expenditure.............................................................................................253.2.2 Analysis of programme expenditure by economic classification ..................................................283.2.3 Analysis of Capital Projects by Programmes.................................................................................32
3.3 REVIEW OF PENDING BILLS............................................................................................................................323.3.1 Recurrent Pending Bills .................................................................................................................323.3.2 Development Pending Bills ...........................................................................................................33
CHAPTER THREE ............................................................................................................................................ 34
3. MEDIUM TERM PRIORITIES AND FINANCIAL PLAN 2016/17-2018/19 .................................................. 34
3.1 PRIORITIZATION OF PROGRAMMES AND SUB-PROGRAMMES................................................................................343.1.1 Programmes and their Objectives ................................................................................................343.1.2 Programmes, Sub-programmes, Expected Outcomes, Outputs, and Key Performance Indicatorsfor the Sector...............................................................................................................................................353.1.3 Programmes by Order of Ranking ................................................................................................61
3.2 ANALYSIS OF RESOURCE REQUIREMENT VERSUS ALLOCATION BY SECTOR................................................................623.2.1 Sector Recurrent ...........................................................................................................................623.2.2 Sector Development......................................................................................................................633.2.3 Analysis of resource requirement versus allocation by Sub-sector ..............................................633.2.4 Programmes and sub-programmes resource requirements .........................................................653.2.5 Programmes and Sub-programmes resource allocation 2016/17-2018/19 .................................703.2.6 Programmes and sub-programmes allocation by economic classification..................................74
3.3 ANALYSIS OF RESOURCE REQUIREMENT VS ALLOCATION FOR SAGAS IN 2016/17-2018/19.....................................873.3.1 Semi-autonomous government agencies .....................................................................................87
3.4 RESOURCE ALLOCATION CRITERIA...................................................................................................................91
CHAPTER FOUR ............................................................................................................................................. 93
4. CROSS SECTOR LINKAGES AND EMERGING ISSUES AND CHALLENGES.................................................. 93
4.1 CROSS SECTOR LINKAGES..............................................................................................................................93

ii
4.2 EMERGING ISSUES AND CHALLENGES.............................................................................................................. 95
CHAPTER FIVE ............................................................................................................................................... 98
5. CONCLUSION ....................................................................................................................................... 98
CHAPTER SIX ................................................................................................................................................. 99
6. RECOMMENDATIONS .......................................................................................................................... 99
REFERENCES................................................................................................................................................ 100
APPENDICES................................................................................................................................................ 101
ANNEX I: CAPITAL PROJECTS ................................................................................................................................ 101

iii
LIST OF TABLES
Table 1: Semi-Autonomous Government Agencies ................................................................. 6Table 2:Training Institutions..................................................................................................... 8Table 3: Sector Programme Performance Reviews ................................................................ 11Table 4: Programme/Sub-Programme Expenditure Analysis ................................................. 26Table 5: Analysis of programme expenditure by economic classification ............................. 28Table 6: Sector recurrent pending bills ................................................................................... 32Table 7: Sector Development pending Bills ........................................................................... 33Table 8: Programmes, Sub-Programmes, Expected Outcomes, Outputs, and Key Performance
Indicators for the Sector ............................................................................................ 35Table 9: Analysis of resource requirement versus allocation- Recurrent ............................... 63Table 10: Analysis of Resource Requirement Versus Allocation-Development.................... 63Table 11: Analysis of recurrent resource requirement versus allocation................................ 63Table 12: Analysis of Development resource requirement versus allocation......................... 64Table 13: Analysis of programme expenditure resource requirement (Ksh. Millions) .......... 65Table 14: Analysis of programme expenditure resource allocation(Kshs.Million) ................ 70Table 15: Analysis of Programmes Expenditure by economic classification......................... 74

iv
LIST OF ACRONYMSADC - Agricultural Development CorporationADR - Alternative Dispute ResolutionAGRA - Strengthening Fertilizer Quality and Regulatory StandardsAFFA - Agriculture, Fisheries and Food AuthorityAHITI - Animal Health Training InstituteAIRC - Agricultural Information Resource CentreAIA - Appropriation in AidARUD - Agriculture, Rural and Urban DevelopmentARUD - Agricultural Rural and Urban DevelopmentASAL APRP Arid and Semi-Arid Land Agricultural Productivity Research ProjectASDSP - Agricultural Sector Development Support ProgrammeBMU - Beach Management UnitsBROP - Budget Review Outlook PaperCCTV - Closed Circuit TV SurveillanceCLMB’s - County land Management BoardCPP - Coffee Productivity ProjectCSHS - Civil Servants Housing SchemeDFZ - Disease Free ZoneDRSLP - Drought Resilience and Sustainable Livelihood ProgrammeDVAM - Division of Value Addition and MarketingEAAPP - Eastern Africa Agricultural Productivity ProjectEEZ - Exclusive Economic ZoneESP - Economic Stimulus ProgrammeFIQA - Fish Inspection Quality AssuranceFY - Financial YearGDP - Gross Domestic ProductGIS - Geographical Information SystemGMOs - Genetically Modified OrganismsGNP - Gross National ProductHIV/AIDs - Human Immune Virus/ Acquires Immuno Deficiency SyndromeICT - Information Communication TechnologyISUDP - Integrated Strategic Urban Development PlansKACCAL - Kenya Adaptation to Climate Change in Arid and Semi-Arid LandsKAGRC - Kenya Animal Genetic Resources CentreKALRO - Kenya Agricultural and Livestock Research OrganizationKAPAP - Kenya Agricultural Productivity and Agribusiness ProjectKAPSLM Kenya Agricultural Productivity and Sustainable Land Management
ProjectKBRC - Kenya Building Research CentreKCDP - Kenya Coastal Development ProjectKCEP - Kenya Cereals Enhancement ProjectKDB - Kenya Dairy BoardKMFRI - Kenya Marine Fisheries and Research InstituteKENTTEC - Kenya Tsetse and Trypanosomiasis Eradication CouncilKEPHIS - Kenya Plant Health Inspectorate Service

v
KEVEVAPI - Kenya Veterinary Vaccines Production InstituteKIBT - Kenya Institute of Business TrainingKISIP - Kenya Informal Settlement Improvement ProjectKISM - Kenya Institute of Surveying and MappingKM - Kilo MetreKMC - Kenya Meat CommissionKSA - Kenya School of AgricultureKSC - Kenya Seed CompanyKshs - Kenya ShillingsKVB - Kenya Veterinary BoardM&E - Monitoring and EvaluationMCS - Monitoring, Control and SurveillanceMOLHUD - Ministry of Land, Housing and Urban DevelopmentMT - Metric TonesMTEF - Medium Term Expenditure FrameworkMTP - Medium Term PlanMTP II - Second Medium Term PlanNAAIAP - National Accelerated Agricultural Inputs Access ProgrammeNCA - National Construction AuthorityNHC - National Housing CorporationNLC - National Land CommissionNLIMS - National Land Information Management SystemsNMK - Njaa Marufuku KenyaNMR - Nairobi Metro RegionNMT - Non Motorized TransportNUP - National Urban PolicyOPV - Offshore Patrol VesselPCPB - Pest Control Products BoardPEGRES - Project on Enhancing Gender Responsive Extension ServicesPPP - Public Private PartnershipRPLRP - Regional Pastoral Livelihood Resilience ProjectRV - Research VesselSAGAs - Semi Autonomous Government AgenciesSATREPS - Science and Technology Research Programme SupportSDCP - Small Holder Dairy Commercialization ProgrammeSEA - Strategic Environmental AssessmentSHDP - Small Scale Horticulture Development ProjectSHEPUP - Smallholder Horticulture Empowerment Promotion Unit ProjectSIDEMAN-SAL Sustainable Smallholder Irrigation Development and ManagementSIPMK - Smallholder Irrigation Programme Mt. KenyaSLM - Sustainable Land ManagementSMAP - Standards Market Access ProgrammeSNP - Sustainable Neighborhood ProjectSONY - South Nyanza Sugar CompanyT&T - Tsetse and Trypanosomiasis eradicationTDR - Traditional Resolution Alternative

vi
THVC - Traditional High Value CropsTPS - Tradable Permit SchemeVC - Value ChainsVCOs - Value Chain Organizations

vii
EXECUTIVE SUMMARY
This report has been prepared in line with the National Treasury Circular Number 15/2015 of13th August 2015 and in accordance with the provisions of the Public Financial ManagementAct, 2012. The Programme Performance Review report findings and National Prioritiesoutlined in MTP II and Vision 2030 have informed the MTEF budgetary allocations. Focushas been given on efficiency and effectiveness of public spending by assessing whether valuefor money was obtained in previous allocations and which programmes to be given priorityin terms of funding. The inputs of key stakeholders have been taken into account inpreparation of this sector report.
The Agriculture, Rural and Urban Development (ARUD) Sector comprises of five sub-sectors namely: State Departments of Agriculture; Livestock; Fisheries; Ministry of Land,Housing and Urban Development; and the National Land Commission. The sector has twentyfive (25) Semi-Autonomous Government Institutions (SAGAs) and nine (9) TrainingInstitutions.
The goal of the sector is to attain food security, sustainable land management, affordablehousing and sustainable urban infrastructure development. The Constitution, under Article 43on the Bills of Rights, provides for accessibility of adequate food of acceptable quality andaccessible and adequate housing. This is in line with the aspirations of Second Medium TermPlan (MTP) (2013-2017) of Vision 2030 and the Jubilee Manifesto. The key objectives of thesector are to: raise agricultural productivity through value addition; increase market accessand adoption of technologies; increase commercialization of the sector activities; exploit thepotential of Exclusive Economic Zone (EEZ); create an enabling policy and legal framework,improve efficiency and effectiveness of sector institutions; ensure effective administrationand management of land and land based resources; enhance urban development; developdecent Government buildings and affordable housing and sustainably manage resources inthe sector.
The key achievements realized by the sector during the review period (2012/13 -2014/15)include: 439,396 metric tons of subsidized fertilizer availed to farmers; establishment ofLivestock Insurance scheme; Provided 2.2 million dozes of semen and 115,000,000 doses ofvaccine for livestock disease control; Enhanced strategic food reserve by 3.1 Million 90 kgbags; Registered 2.2 million title deeds; Constructed 729 housing units; Granted loans to 497civil servants for purchase/construction of houses; Refurbished 2,691 housing units;Completed 200 wholesale and retail markets; Produced 485,263 metric tons of fish;Restocked 5 water bodies with 340,000 fingerlings; Acquired Research Vessel (RV Mtaviti),Established 42 and 15 cold chain facilities for milk & fish respectively and 3 mini fishprocessing plants; Developed 6,000 acres of irrigation (Galana kulalu) food security projectand 48,258 acres under small holder irrigation programmes; Reviewed 1000Grants/Dispositions and 6685 letters of allotment and Acquired the National LandInformation Management Systems (NLIMS) infrastructure.
Despite the above achievements, the sector is faced with the challenges of: Inadequate anddelay of exchequer releases; Impact of climate change; Insecurity; High cost of inputs, Pests

viii
and Diseases and Low absorption of new technology. Some of these challenges will beaddressed through the sector programmes.
In the 2016/17- 2018/19 Medium Term Expenditure Framework (MTEF) period, the sectorwill implement the following programmes: General Administration, Planning and SupportServices for State Department of Agriculture, Ministry of Land, Housing and UrbanDevelopment (MOLHUD) and National Land Commission (NLC); Crop Development andManagement; Agribusiness and Information Management; Fisheries Management andDevelopment; Livestock Resources Management and Development; Land Policy andPlanning; Housing Development and Human Settlement; Government Buildings; CoastlineInfrastructure and pedestrian access; Urban Development and Metropolitan Development;Land Administration and Management; National Land Information Management Systems(NLIMS); and Land Disputes and Conflict resolutions.
To undertake these programmes, the sector requires Kshs.154.3 billion in the next financialyear 2016/17 with Kshs. 38.6 billion being Recurrent and Kshs. 115.7 billion forDevelopment. This against an allocation of Kshs. 69.2 billion of which Kshs.16.1 billion isfor Recurrent and Kshs. 53 billion is for Development expenditures. Further, the sector willrequire Kshs. 143.7 billion for 2017/18 and Kshs. 152.1 billion for 2018/19.
To sustain the Sector’s contribution to the economy and achievement of the Vision 2030, anumber of interventions and strategies need to be put in place. These include: Adequate andtimely release of allocated funds for effective and efficient implementation of projects andprograms; Finanilization of pending policies and legal frameworks; Enhancing linkages andbuilding stronger collaboration with stakeholders; Developing a framework that will entrenchthe role of Alternative Dispute Resolution (ADR) and Traditional Dispute Resolution (TDR)mechanism in resolving land disputes; Fast tracking climate change mitigation andadaptation measures implementation in line with Kenya Climate Change Response Strategy2010 and National Action Plan 2013-2017; Fast tracking completion of stalled ESP projectsand other projects and handing them over to respective counties; and Strengtheningmonitoring and evaluation for efficient utilization of resources.

1
CHAPTER ONE1. INTRODUCTION
1.1 BackgroundThe Agriculture, Rural and Urban Development (ARUD) Sector comprises of five (5) sub-sectors namely: State Departments of Agriculture, State Department of Livestock, StateDepartment of Fisheries, Ministry of Land, Housing and Urban Development and theNational Land Commission. The Agriculture, Rural and Urban Development (ARUD) Sectorcomprises of five sub-sectors namely: State Departments of Agriculture; Livestock;Fisheries; Ministry of Land, Housing and Urban Development; and the National LandCommission. The sector has twenty five (25) Semi-Autonomous Government Agencies(SAGAs) and nine (9) Training Institutions.
The sector comprises of key sub-sectors that are considered key drivers for Kenya’seconomic growth and critical for attainment of the 10 percent economic growth rateenvisaged under the Kenya Vision 2030. It directly contributes to the national economythrough enhancing food security, income generation, employment and wealth creation,foreign exchange earnings as well as enhancing accessibility and connectivity. It furthercontributes indirectly to economic growth through forward and backward linkages with othersectors.
In terms of contribution to Gross Domestic Products (GDP), the Agricultural sector directlycontributes 25.9 percent of the GDP valued at Kshs 1.39 trillion (Economic Survey 2015).The sector also contributes approximately 27 percent to GDP through linkages withmanufacturing, distribution and other service related sectors. It further accounts for about 65percent of Kenya’s total exports, 18 percent and 60 percent of the formal and totalemployment respectively (Economic Survey 2014). ARUD sector has been identified as oneof the six sectors aimed at delivering the 10 percent economic growth rate under the Vision2030.
Land as a factor of production is critical to economic, social, political and culturaldevelopment. Secure access to land, sustainable land use planning and equitable distributionof land remain immensely important for food security, employment creation and the socio-economic development of the country. In view of the foregoing, the National LandCommission and Ministry of Lands Housing and Urban Development (MOLHUD) inpartnership with other stakeholders are working towards improving the policy and legalframework governing land with the primary goal of facilitating land reforms and improvingland tenure security especially for those living in informal settlements, rural poor andmarginalized communities. This is as per the provisions of National Land Policy 2009,Article 67 of the Constitution and the relevant land laws.

2
Shelter is a basic human need and Article 43 1(b) of the Constitution of Kenya 2010emphasizes the right of every person to accessible and adequate housing, and to reasonablestandards of sanitation. Housing is a means of promoting and mobilizing savings, expandingemployment opportunities and economic activities which have multiplier effects in theeconomy.
Urban areas and cities are an important component of the country’s social economicdevelopment. Since independence urbanization has taken place at a very high rates. The 2009census indicated that 34% of the population of Kenya lived in urban areas and cities. Thisgrowth is projected in the Kenya Vision 2030 to reach 60% of the population of Kenya bythe year 2030.
Whereas urban areas and cities hold the future for the country’s development sufficientresources have not been invested to provide adequate infrastructure and services. As a resultthese areas have mushrooming slums, traffic jams, inadequate water and other utilities as theorder of the day.
Articles 176 and 184 of the Constitution of Kenya 2010 emphasize the importance ofurbanization in Kenya’s development process. Urban-based economic activities account formore than 85 per cent of Gross National Product (GNP) in high income countries and morethan 70 per cent in middle income countries indicating a positive correlation between levelsof urbanization and national economic development. Urbanization reduces pressure from theavailable agricultural land by creating non-agricultural employment and businessopportunities.
Public works facilitates development, maintenance and rehabilitation of GovernmentBuildings and Other Public Works infrastructure in the country. This includes constructionand maintenance of coastline infrastructure i.e. jetties and seawalls to improve watertransport through provision of landing infrastructure and protecting land and property in lowlying areas from erosion and flooding and sea wave action respectively.
Research and Development institutions in the sector play a critical role in strategic researchof national importance. They undertake research and disseminate technologies, informationand knowledge aimed at increasing productivity and competitiveness in the sector. The sectoralso has a number of SAGAs that contribute to national development through carrying outregulatory, commercial, service and training functions.
At advent of devolution, the Government of Kenya in collaboration with developmentpartners had a number of programmes and project that were ongoing. Some of these

3
programmes and projects fall under the category of the devolved functions. The nationalgovernment in collaboration with the County Governments and development partners willrequire to complete the ongoing programmes and projects portfolio within the transitionperiod. In addition, the national Government will to continue give capacity building andtechnical assistance as provided by function 32 part1 of the fourth schedule of Kenya’sConstitution 2010.
The ARUD sector is faced with the challenges of inadequate and outdated policy and legalframeworks; low provision of low cost housing and low investment in urban infrastructureand services. In addition, about 56% of the country’s population is food insecure and nearly 2million Kenyans are constantly on food relief with the figure rising to almost 4 millionduring periods of shock such as drought and floods (National Food and Nutrition Policy,2011). Farmers and pastoralists are faced with a number of challenges that limit theircapacity to fully exploit their land and animal resources for sustainable economic and socialdevelopment. The challenges include plant and livestock diseases, impacts of climate change,degradation of environment, and low adoption of technology, underperforming institutionscoupled with inadequate technical and financial capacities. Investment in agriculture being arisky venture has also been constrained by limited access to insurance services. In addition,Kenyan farmers continue to export semi processed, low-value produce, which accounts for91 percent of total agricultural exports. The limited ability to add value to agriculturalproduce, coupled with high production costs makes the country’s exports less competitive inthe global markets.
This report outlines medium term priorities and corresponding resources in line with theSecond Medium Term Plan (MTP II, 2013-2017) of the Kenya Vision 2030. It furtheroutlines the broad development policies, plans and programmes for the FY 2016/17-2018/19Medium Term budget. In preparation of the report, the Programme Performance Reviewreports findings have informed the MTEF budgetary allocations. Focus has been given onefficiency and effectiveness of public spending by assessing whether value for money wasobtained in previous allocations and which programmes to be given priority in terms offunding. The inputs of key stakeholders have been taken into account in preparation of thissector report.
This Sector report is organized into six (6) chapters based on the National Treasury CircularNumber 15/2015 of 13th August 2015 and in accordance with the provisions of the PublicFinancial Management Act, 2012. Chapter one covers the introduction and background to thesector while chapter two provides detailed analysis of performance of sector programmesfor 2012/2013 – 2014/2015 Financial Year (FY). Chapter three provides medium termpriorities and financial requirements of the various programmes in the 2016/2017 -2018/2019FY. On the other hand, chapter four gives details of cross sector linkages and emerging

4
issues/ challenges that face the sector whereas chapter five and chapter six providesconclusion and key recommendations respectively.
1.2 Sector Vision and Mission
Sector Vision: “A food secure nation with sustainable land management, modern urbaninfrastructure and affordable and quality housing.”
Sector Mission: “To facilitate attainment of food security, affordable housing, modernurban infrastructure and sustainable land management for socio-economic development.”
1.3 Strategic goals/Objectives of the SectorThe overall goal of the sector is to attain food security, sustainable land management anddevelopment of affordable housing and urban infrastructure.
The specific objectives include:1. Create an enabling environment for Sector development.2. Increase productivity and outputs in the sector.3. Improve market access and trade.4. Ensure national food security5. Strengthen institutional capacity for efficient and effective in service delivery.6. Enhance the role of youth and women in the sector.7. Ensure accessibility, equity and sustainable management of Land resource for social –
economic development8. Facilitate the provision of decent and affordable housing and enhanced estates
management services9. Develop and maintain cost effective public buildings and other public works.10. Improve infrastructure development, connectivity and accessibility, safety and security
within urban areas and Metropolitan Regions.11. Enhance secure storage, access and retrieval of land and land resource data and
information.
1.4 Sub-Sectors and their MandatesThe sector has five sub-sectors namely; State Department of Agriculture, State Departmentof Livestock, State Department of Fisheries, Ministry of Land, Housing and UrbanDevelopment and National Land Commission.
I. State Department of Agriculture Sub-SectorThe mandate of the sub-sector as articulated in Executive Order No. 2/2013 of May 2013 isto ensure sustainable development of agriculture for food security and economicdevelopment. This includes; Agricultural Policy and Services, National Food Security Policy,Agricultural Land Resources Inventory and Management, Phytosanitary services, CottonDevelopment, Crop Research and Development, Agricultural Mechanisation Services, Food

5
Safety and Inspections, Food Security, Policy on Land Consolidation for AgriculturalBenefit, Agricultural Insurance Policy, Strategic Food Reserve and Bio-Safety Management.
II. State Department of LivestockThe State Department of Livestock is mandated to promote, regulate and facilitate livestockproduction for socio-economic development and industrialization. Its broad objective is toenhance food security and safety, generate incomes and create employment for enhancedgrowth and socio-economic development through enabling livestock Policies and Services,National Food Security Policy, Sanitary and Phyto-Sanitary services, Livestock Research andDevelopment, Development of Livestock Industry, Livestock Marketing, RangeDevelopment and Management, Veterinary Services and Disease Control Policy, Livestockidentification and traceability, Promotion of bee keeping industry, Livestock TrainingInstitutes, Promotion of tannery Industry, Promotion of Dairy Industry, Food Safety andInspections, Food Security, Livestock insurance policy, Strategic Food Reserve and Bio-Safety Management.
III.State Department of FisheriesThe mandate of the fisheries sub-sector flows from that of entire Ministry of Agriculture,Livestock and Fisheries as articulated in the Executive Order No. 2/2013 of May 2013. Inparticular, the core functions of the subsector include: Fisheries Policy, Fishing Licensing,Development of Fisheries, Fisheries Marketing, Fish quality Assurance and Value Addition,Protection of Fisheries in Exclusive Economic Zones (EEZ), Protection and Regulation ofMarine Ecosystems, Fish Safety and Inspections, Strategic Food Reserve, and National FoodSecurity Policy.
IV. Ministry of Land, Housing and Urban DevelopmentThe sub-sector is mandated to provide policy direction on matters related to land, housingand urban development. In discharging its functions, the sub-sector is guided by detailedmandate through Executive Order No. 2/2013 of May 2013 notably; Lands PolicyManagement, Physical Planning, Land Transactions, Survey and Mapping, LandAdjudication, Settlement Matters, Rural Settlement planning i.e. eco-villages, LandReclamation, National Spatial Data Infrastructure, Land Registration, Land and PropertyValuation Services, Administration of public land as designated by the constitution, LandInformation System, Housing Policy Management, Public Works Policy and planning,Development and Promotion of affordable housing policy, Management of Building andConstruction standards and codes, National Secretariat for Human Settlement, Managementof Housing for Civil Servants and Disciplined Forces, Management of Civil ServantsHousing Scheme, Development and Management of Government Housing, Development andManagement of public buildings, Public Office Accommodation Lease Management, PublicWorks Planning, Maintenance of Inventory of Government Property, Overseeing Provisionof Mechanical and Electrical (Building) Services to public Buildings, Supplies Branch andCo-ordination of Procurement of Common-User Items by Government Ministries,Registration of Contractors and Materials Suppliers, Registration of Civil, Building andElectro-Mechanical Contractors, Registration of Architects and Quantity Surveyors andOther Public Works. Other functions include: Slum Upgrading and Prevention, Urban policy,Planning and Development and Nairobi Metropolitan Planning and Development.

6
V. National Land CommissionThe mandate of the NLC sub-sector is to enhance efficiency in land management andadministration. According to the Constitution of Kenya Article 67 (2) and the National LandCommission Act, 2012, the NLC is mandated to manage public land on behalf of theNational and County Governments; recommend a National Land Policy to the NationalGovernment; advise the National Government on a comprehensive program for registrationof title in land throughout Kenya; conduct research related to land and the use of naturalresources and make recommendations to appropriate authorities; initiate investigations on itsown initiative or on a complaint into present or historical land injustices and recommendappropriate redress; encourage the application of Traditional Dispute Resolution mechanismsin land conflicts; assess tax on land and premiums on immovable property in any areadesignated by law; monitor and have oversight responsibility over land use planningthroughout the Country; alienate public land; monitor the registration of all the rights andinterests in land; ensure sustainable management of land for their intended purpose and forfuture generation; develop and maintain an effective land information management system atNational and County levels; manage and administer all unregistered trust land andunregistered community land on behalf of the county governments and develop andencourage Alternative Dispute Resolution mechanisms in land dispute handling andmanagement.
1.5 Autonomous and Semi-Autonomous Government Agencies (SAGAs) andTraining Institutions
The sector has twenty six Semi-Autonomous Government Agencies and nine TrainingInstitutions as shown in Tables 1 and 2 below.
Table 1: Semi-Autonomous Government AgenciesCategory SAGA Mandate
1. ResearchInstitutions
Kenya Agricultural andLivestock ResearchOrganization (KALRO)
To promote, streamline, coordinate and regulateresearch in crops and livestock.
Kenya MarineFisheries ResearchInstitute (KEMFRI)
To undertake research in marine and freshwaterfisheries, aquaculture, environmental and ecologicalstudies; marine research including chemical andphysical oceanography, in order to provide scientificdata and information for sustainable exploitation,management and conservation of Kenya’s fisheriesresources and aquatic environment, and contribute toNational strategies towards food security, povertyalleviation, and creation of employment.
2. Commercial /ManufacturingCorporations
Kenya Seed Company(KSC)
To carry out focused research, promote and facilitateproduction of high yielding, better quality certifiedseed to farmers and stakeholders
Nyayo Tea ZonesDevelopmentCorporation
To effectively protect the gazetted forest cover,achieve high quality tea and fuel wood production.

7
Category SAGA MandateMiwani SugarCompany(in receivership)
To produce high quality sugar as part of a nationalstrategy for achieving self-sufficiency in foodproduction
Muhoroni SugarCompany (underreceivership)
To produce high quality sugar as part of a nationalstrategy for achieving self-sufficiency in foodproduction
Nzoia Sugar Company To produce high quality sugar as part of a nationalstrategy for achieving self-sufficiency in foodproduction
Chemelil SugarCompany
To produce high quality sugar as part of a nationalstrategy for achieving self-sufficiency in foodproduction
South Nyanza SugarCompany (SONY)
To produce high quality sugar as part of a nationalstrategy for achieving self-sufficiency in foodproduction
Agro Chemical andFood Company
Production of high quality spirit for industrial anddomestic use
AgriculturalDevelopmentCorporation (ADC)
To ensure the continued existence of the breeds andthe availability of quality stock through productionand supply of quality seed, technological transfersand training
Kenya MeatCommission (KMC)
To procure livestock, operate abattoirs, process meatand by products for export or consumption in Kenya
National Housing Corporation(NHC)
To develop and facilitate development of decent andaffordable housing for Kenyans.
Kenya VeterinaryVaccines ProductionInstitute (KEVEVAPI)
To produce high quality animal vaccines fordistribution locally and abroad
3. Regulatory Agriculture, Fisheriesand Food Authority(AFFA)
To promote best practices, in and regulate, theproduction, processing, marketing, grading, storage,collection and warehousing of agricultural andaquatic products
Kenya Plant HealthInspectorate Service(KEPHIS)
To provide an effective and efficient science-basedregulatory service for assurance on quality ofagricultural inputs and produce
Pest Control ProductsBoard (PCPB)
To provide professional, efficient and effectiveregulatory service for manufacture, trade, safe useand disposal of pest control products
National Bio-SafetyAuthority
To regulate research and commercial activitiesinvolving Genetically Modified Organisms (GMOs)with a view to ensuring safety of human and animalhealth and provision of an adequate level ofprotection of the environment.
Kenya Dairy Board To regulate, develop and promote the dairy industry

8
Category SAGA Mandate(KDB) in KenyaKenya VeterinaryBoard (KVB)
To regulate, develop and promote the veterinaryprofession in Kenya
National ConstructionAuthority (NCA)
To oversee the construction industry and coordinateits development in Kenya. This is achieved throughregistration of contractors, accreditation ofconstruction workers and site supervisors,registration of construction projects and carrying outcapacity building initiatives and research on mattersrelated to construction industry.
4. TrainingInstitution
Bukura AgriculturalCollege
To Provide Quality Agricultural Education throughTraining, Innovation and Extension Services
5. StatutoryBoards
AgriculturalInformation ResourceCentre
To provide quality agricultural information to thefarming community and other stakeholders usingintegrated platforms.
6. Service Kenya Tsetse andTrypanosomiasisEradication Council(KENTTEC)
To coordinate eradication of tsetse andtrypanosomiasis in the Country.
Kenya Animal GeneticResources Centre(KAGRC)
To promote optimum productivity of the nationalanimal population through provision of high qualitydisease free animal germ plasm and related breedingservices
Table 2: Training InstitutionsCategory Name MandateTrainingInstitutions
Animal Health TrainingInstitute (AHITI) Kabete
To train categories of veterinary para-professionalsfor provision of Veterinary Services.
AHITI Ndomba To train categories of veterinary para-professionalsfor provision of Veterinary Services.
AHITI Nyahururu To train categories of veterinary para-professionalsfor provision of Veterinary Services.
Dairy Training Institute– Naivasha
To train both pre-service and in-service technicalstaff and other stakeholders along the dairy valuechain.
Meat Training Institute To train Meat Industry personnel forimproved meat hygiene standards.
GRIFTU PastoralTraining Centre
Training of pastoral farmers
Pastoral Areas TrainingCentre - Narok
Training pastoral and agro-pastoral farmers
Mobile Pastoral TrainingUnit
Training of pastoral farmers
Kenya Institute ofSurveying and Mapping
Training of land surveyors, cartographers,photogrammetrists and photo-lithographer

9
Category Name Mandate(KISM)
1.6 Role of Sector StakeholdersThe Constitution of Kenya, 2010 provides for public participation and engagement in thebudget making processes to enhance openness, accountability and transparency in publicfinance. The Sector has a wide range of stakeholders in the implementation of programmesand projects. Successful discharge of sector mandates calls for effective partnerships,collaboration and participation of both public and private partners because their involvementis critical in the achievement of the sector goals. The major stakeholders and their roles areoutlined below:
I. Public/CitizensPublic participation in the budget process is a Constitutional legal requirement as stipulatedin Article 201 (a) of the Constitution of Kenya. It is through public participation processwhere stakeholders give their views and input on the proposed programmes and projects.Public participation creates a widespread support for programmes and projects, and thisincreases the acceptance and legitimacy policy plans and establishes the necessary sense ofownership.
II. Research and Academic InstitutionsThe Sector needs human capital which is competent enough to deliver on its mandate.Research institutions, universities and other institutions of higher learning play a critical rolein capacity building for the sector in terms of technical training at all levels and creation ofknowledge through research. A close collaboration between the sector and these institutionsis important in development of relevant training programs and research activities whichwould lead to optimum performance of the sector.
III. Government Ministries, Departments and Agencies (MDAs)The sector works closely with several government ministries, departments and agencieswhile implementing its mandate and functions. The MDAs include the National Treasury,Ministry of Devolution and Planning, Ministry of Transport and Infrastructure, Ministry ofLand, Housing and Urban Development among others. There is general support from publicadministration. This support is expected to be strengthened under the new governancestructure. Other agencies like Ethics and Anti-Corruption Commission, Auditor General, theoffice of the Ombudsman, Commission of Administrative Justice provide oversight in the useof resources in the sector.
IV. Private Sector Organizations and Professional BodiesThese stakeholders are endowed with both human and financial resources that could betapped into for resource mobilization and advocacy. They promote professional management;improve innovation, research and development as well as policy analysis. These stakeholdersalso ensure quality services are provided through their established standards and code ofethics. Example is the Kenya Private Sector Alliance.
V. Civil Societies and Non-Governmental Organizations
10
The Civil Society Organizations (CSOs) including Non-Governmental Organizations(NGOs), Community Based Organizations (CBOs), Faith Based Organizations (FBOs,) andother special interest groups participate and support programmes in the sector. The CivilSociety Organizations (CSOs) are involved in resource mobilization, communityempowerment and technical support. They also provide avenues for public participation inthe sector projects and programs.
VI. Development Partners and International OrganizationsDevelopment Partners and International Organizations provide financial and technicalsupport; capacity development of the communities on the importance of environmentconservation and give strategic initiatives. The sector collaborates with development partnersin the implementation of its programmes. Some of these organizations include UnitedNations Environmental Program (UNEP), United Nations Development Program (UNDP),Danish Development Agency (DANIDA), African Development Bank (ADB), JapanInternational Corporation Agency (JICA), Food and Agriculture Organization (FAO), theGovernment of Finland and Department for International Development (DFID) amongothers.
VII. ParliamentThe policies and legislative issues from the sub-sectors are approved by Parliament. The timetaken to approve policies directly affects the timing and extent of implementation of theprojects /programmes that require a legislative framework. The sector relies on Parliamentfor enactment of crucial bills. Parliament plays a key role in the budgetary process includingapprovals and oversight.
VIII. County GovernmentsAccording to the Constitution of Kenya (fourth schedule) the county governments are taskedwith implementation of specific national government policies on natural resources andenvironmental conservation including water and sanitation services. The NationalGovernment through the sector and in consultation with County Governments is alternativelytasked with protection of the environment and natural resources with a view to establishing adurable and sustainable system of development, including protection of animals and wildlife,waste management and pollution control, provision of water, hydraulic engineering and thesafety of dams among others.
11
CHAPTER TWO
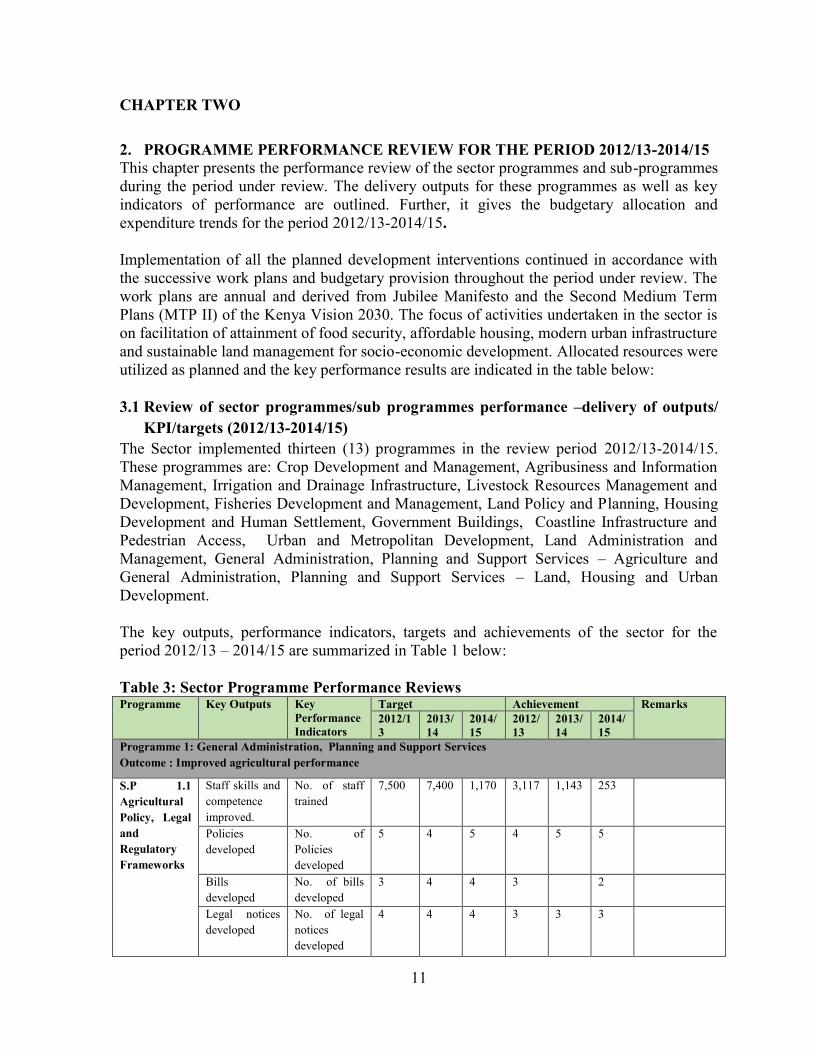
2. PROGRAMME PERFORMANCE REVIEW FOR THE PERIOD 2012/13-2014/15This chapter presents the performance review of the sector programmes and sub-programmesduring the period under review. The delivery outputs for these programmes as well as keyindicators of performance are outlined. Further, it gives the budgetary allocation andexpenditure trends for the period 2012/13-2014/15.
Implementation of all the planned development interventions continued in accordance withthe successive work plans and budgetary provision throughout the period under review. Thework plans are annual and derived from Jubilee Manifesto and the Second Medium TermPlans (MTP II) of the Kenya Vision 2030. The focus of activities undertaken in the sector ison facilitation of attainment of food security, affordable housing, modern urban infrastructureand sustainable land management for socio-economic development. Allocated resources wereutilized as planned and the key performance results are indicated in the table below:
3.1 Review of sector programmes/sub programmes performance –delivery of outputs/KPI/targets (2012/13-2014/15)
The Sector implemented thirteen (13) programmes in the review period 2012/13-2014/15.These programmes are: Crop Development and Management, Agribusiness and InformationManagement, Irrigation and Drainage Infrastructure, Livestock Resources Management andDevelopment, Fisheries Development and Management, Land Policy and Planning, HousingDevelopment and Human Settlement, Government Buildings, Coastline Infrastructure andPedestrian Access, Urban and Metropolitan Development, Land Administration andManagement, General Administration, Planning and Support Services – Agriculture andGeneral Administration, Planning and Support Services – Land, Housing and UrbanDevelopment.
The key outputs, performance indicators, targets and achievements of the sector for theperiod 2012/13 – 2014/15 are summarized in Table 1 below:
Table 3: Sector Programme Performance ReviewsProgramme Key Outputs Key
PerformanceIndicators
Target Achievement Remarks2012/13
2013/14
2014/15
2012/13
2013/14
2014/15
Programme 1: General Administration, Planning and Support ServicesOutcome : Improved agricultural performance
S.P 1.1AgriculturalPolicy, LegalandRegulatoryFrameworks
Staff skills andcompetenceimproved.
No. of stafftrained
7,500 7,400 1,170 3,117 1,143 253
Policiesdeveloped
No. ofPoliciesdeveloped
5 4 5 4 5 5
Billsdeveloped
No. of billsdeveloped
3 4 4 3 2
Legal noticesdeveloped
No. of legalnoticesdeveloped
4 4 4 3 3 3

12
Programme Key Outputs KeyPerformanceIndicators
Target Achievement Remarks2012/13
2013/14
2014/15
2012/13
2013/14
2014/15
S.P 1.2AgriculturalPlanning &FinancialManagement
Financialservices
% budgetutilization
100 100 100 95 87 90
Programme 2: Crop Development and ManagementOutcome: Increased food security and Income
SP2.1: Landand cropsDevelopment
2KR project(Kennedy 2ndRound ofNegotiation)-RiceMechanizationImproved
No. ofmachineryprocured
0 15No.80HPTractorswithimplements, 5No.,30HPTractorswithimplements,22No.Rippers,20Nomotorizedthreshersand16Nocombinedharvesters
49No.,80HPTractorswithimplements, 3No.,60HPTractorswithimplements,49No.Rippers,33No.Trailersand45No.Threshers
0 15No.80HPTractorswithimplements, 5No.,30HPTractorswithimplements,22No.Rippers,20No.motorizedthreshersand16No.combineharvesters
49No.,80HPTractorswithimplements, 3No.,60HPTractorswithimplements,49No.Rippers,33No.Trailers (5Toneseach)and45No.Threshers
Theseimplements areto bedistributed toMwea,Bunyala,Ahero, WestKano, Pekerraand Ewani/WemaIrrigationSchemes.
Storage andPost-HarvestManagement-Improvedcommunitygrain dryingand storage
No. of storesconstructedand handedover,
0 0 13 0 0 7 7 No.Constructedandcommissioned;6 No. are yet tobe completed

13
Programme Key Outputs KeyPerformanceIndicators
Target Achievement Remarks2012/13
2013/14
2014/15
2012/13
2013/14
2014/15
facilitiesSP2.2: FoodSecurityInitiatives
Strategic FoodReservesimproved.
No. of bags ofmaize bagsprocured(million)
0.5 0.5 0.5 0.5 1 1.6
Fertilizersubsidy
No. of MTfertilizersubsidized
70,000 100,000
200,000
66,275
166,166
206,955
TraditionalHigh ValueCrops (THVC)
Assorteddroughttolerant foodcrops seed(MT)
2,800 665 380 3,161 665 361
GroupsSupported onCommunityDriven FoodSecurityImprovementInitiatives(farmersgroups, schoolsand privatesectororganizations)
No. of groupssupported
150 1,500 1,500 1,000 1,000 1,000
SP 2.3:QualityAssuranceandMonitoringOutreachServices
Inclusivelinkages alongthe ValueChains (VC)improved(vertical andhorizontal
No. of Valuechainorganizations(VCOs)formed
141 282 2216 141 2216 2350 The overachievementwas as a resultof additionalfunds duringthesupplementaryestimates
Agriculturalengineeringtechnologiespromoted
Number oftechnologiespromoted
3 3 3 3 3 3
SP 2.4AgriculturalResearch
Production andproductivityincreased
No ofVarietiesreleased aftercertificationby KEPHS
- - 35 - - 35
No of soilsamplesanalyzed
- - 29,050
29,050
35,140
29,050
No ofaflatoxinmanagementfacilitiesestablished
- - 1 - - 1

14
Programme Key Outputs KeyPerformanceIndicators
Target Achievement Remarks2012/13
2013/14
2014/15
2012/13
2013/14
2014/15
Programme 3: Agribusiness and Information ManagementOutcome: Increased agricultural productionS.P 3.1Agribusinessand MarketDevelopment
Enhancedinformation toclients
MarketInformationSystemsestablished.
0 0 1 0 0 1
Increasenumber ofproducersaccessingfinancialservicesincludinginsuranceschemes
Number ofproducersaccessingcredit andfinancialeducation
20,000 20,000
20,000
10,174
1,731 2,394 The project hadchallenges ofresourceavailability
S.P 3.2AgriculturalInformationandManagement
Agriculturalmarketinginformationservices
No. of radioprogrammesaired
52 52 52 52 52 0
Programme 4: Irrigation, Drainage and Mechanization InfrastructureOutcome: Increased agricultural production
NationalExpandedIrrigationProject-increasedproduction andproductivity
Increasedacreage underirrigation(acres)
0 20,000
24,000
.0 21,515
25,143
SmallholderIrrigationProgrammeMT. Kenya(SIPMK) -increasedproduction andproductivity
Increasedacreage underirrigation
0 0 300 0 0 300
SustainableSmallholderIrrigationDevelopmentandManagement (SIDEMAN-SAL) -increasedproduction andproductivity
Increasedacreage underirrigation
0 0 2,000 0 0 900
Programme 5: Fisheries Development and ManagementSP 5.1Aquaculture
Increased fishproduction
Metric tons ofannual
45,000 - - 21,000
- - The target setwas a bit too

15
Programme Key Outputs KeyPerformanceIndicators
Target Achievement Remarks2012/13
2013/14
2014/15
2012/13
2013/14
2014/15
Development fromaquacultureandmariculture
aquacultureproduction
high given theavailableresources
AquacultureGuidelines andStandardsdeveloped
Number ofaquacultureguidelinesdeveloped
- 1 1 - 1 1
Number ofaquaculturestandardsdeveloped/reviewed
- 1 1 - 1 1 A ResidueMonitoringPlan was alsodeveloped
Researchdrivenaquaculturedevelopmentand technologytransferenhanced
Number ofappliedresearch,hatcheries andregionalfacilitiesdeveloped
- 2 2 - 2 2 The facilitieswere developedat Sagana andKiganjodeveloped
Number ofmarket outletsinnovationsdeveloped/established
- 10 10 - 10 2 The other 8were notpurchased dueto lack ofexchequer
SP 5.2Fisheriespolicy,strategy andcapacitybuilding
PoliciesDeveloped
% of NationalOceans andFisheriesPolicy2008reviewed
- 10 100 10 100 A Zero Draft ofthe revisedNationalOceans andFisheriesprepared
TunaManagementandDevelopmentStrategydeveloped andlaunched
Number ofstrategiesdevelopedand launched
- - 1 - - 1
SP 5.3ManagementandDevelopmentof CaptureFisheries
Fisheriesmonitoring,control andsurveillanceunit (MCS)established
% level ofconstructionof OffshorePatrol Vessel
5 10 40 5 10 40
Degradedfisheries stocksand habitatsrestored
Number offisheriesstocks andhabitatsrestored
- 5 5 1 5 5 Rivers Maaraand Koitabus,and Kiambere,Kamburu andmasinga dams
16
Programme Key Outputs KeyPerformanceIndicators
Target Achievement Remarks2012/13
2013/14
2014/15
2012/13
2013/14
2014/15
restockedNumber offisheriesframe surveysconducted
2 - 2 2 - 2
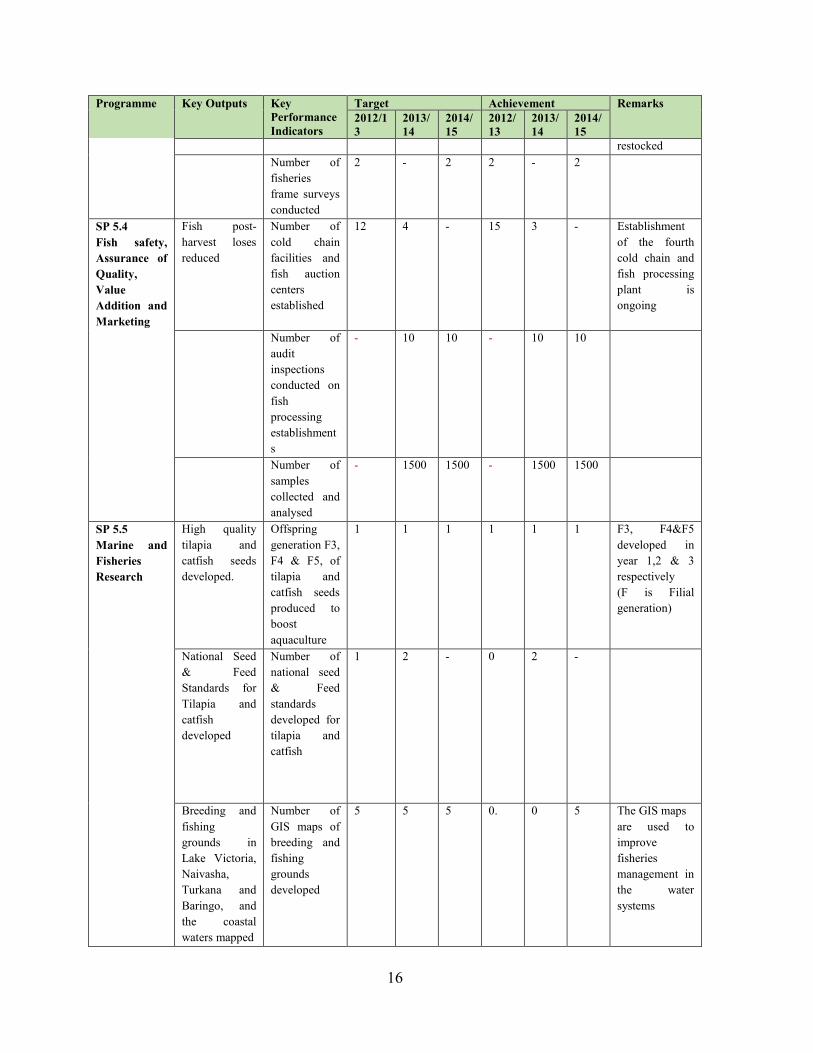
SP 5.4Fish safety,Assurance ofQuality,ValueAddition andMarketing
Fish post-harvest losesreduced
Number ofcold chainfacilities andfish auctioncentersestablished
12 4 - 15 3 - Establishmentof the fourthcold chain andfish processingplant isongoing
Number ofauditinspectionsconducted onfishprocessingestablishments
- 10 10 - 10 10
Number ofsamplescollected andanalysed
- 1500 1500 - 1500 1500
SP 5.5Marine andFisheriesResearch
High qualitytilapia andcatfish seedsdeveloped.
Offspringgeneration F3,F4 & F5, oftilapia andcatfish seedsproduced toboostaquaculture
1 1 1 1 1 1 F3, F4&F5developed inyear 1,2 & 3respectively(F is Filialgeneration)
National Seed& FeedStandards forTilapia andcatfishdeveloped
Number ofnational seed& Feedstandardsdeveloped fortilapia andcatfish
1 2 - 0 2 -
Breeding andfishinggrounds inLake Victoria,Naivasha,Turkana andBaringo, andthe coastalwaters mapped
Number ofGIS maps ofbreeding andfishinggroundsdeveloped
5 5 5 0. 0 5 The GIS mapsare used toimprovefisheriesmanagement inthe watersystems

17
Programme Key Outputs KeyPerformanceIndicators
Target Achievement Remarks2012/13
2013/14
2014/15
2012/13
2013/14
2014/15
Innovativetechniques forreducing post-harvest lossesdeveloped anddisseminated.
Number ofinnovativetechniques forreducing post-harvest lossesdevelopedanddisseminated.
3 1 4 3 1 4
Programme 6 :Land Policy and PlanningSP 6.1:Modernization of landregistries
Secured andaccessible landrecords
No. of landregistriesconstructed
4 0 0 4 3 3
No. of landregistriesrehabilitated
4 7 10 4 7 8
No. of landregistriesreorganized
0 1 10 0 1 20
No. of landregistriesdigitized
0 0 10 0 0 13
SP 6.2: LandSurvey
National andInternationalBoundariessecured
No. ofnational andinternationalboundariespillarssecured
410 450 500 537 500 115
No. oftopographicaland thematicmaps updated
30 30 30 32 32 25
SP 6. 3:Land Use
NationalSpatial plan
% of NationalSpatial Planprepared
60 95 100 55 95 98
SP 6.4 – LandSettlement
Parcels of landregistered
No. of titledeedsprocessed
300,000
540,000
1,500,000
345,091
646,546
1,212,504
No. ofadjudicationandsettlementparcelsfinalized forregistration
150,000
200,000
400,000
100,000
150,000
220,000
Programme 7 :Housing Development and Human SettlementSP 7.1:Housingdevelopment
Housing units % completionof 822housing units
50 70 100 45 65 97

18
Programme Key Outputs KeyPerformanceIndicators
Target Achievement Remarks2012/13
2013/14
2014/15
2012/13
2013/14
2014/15
in SowetoZone AKiberacompleted% completionof 462 No.SustainableNeighborhoodProject(SNP)in Mavokocompleted
- - 70 - - 64
% completionof 678housing unitsunder CivilServantsscheme(CSHS) inNgara andKileleshwa,Nairobi
95 100 - 98 100 -
% completionof 51 housingunits inShauriMoyo,Kisumu
- - 100 - - 100
% completionof 250housing unitsfor CivilServantsTenantPurchase inKisumu
- - 20 - - 5
Social andphysicalinfrastructurein slums andinformalsettlements(classrooms,market sheds,access roads,drainageworks, ablutionblocks, highmast floodlighting)
% completionlevel ofmarket sheds& ablutionblock atLangasmarket inEldoret
60 75 80 55 65 70
% completionlevel of 10classrooms,offices &sanitaryfacilities inMukhaweliprimaryschool in
50 60 100 45 - 65

19
Programme Key Outputs KeyPerformanceIndicators
Target Achievement Remarks2012/13
2013/14
2014/15
2012/13
2013/14
2014/15
Bungoma% completionlevel of Ziwala NgombeHealth Centrein Bombolulu,Mombasa
55 80 100 45 58 70
No. ofablutionblockscompleted
- 15 15 - - 21
No. of Kmsewer lineconstructed
- 25 25 - - 13.62
No. of Kms.of accessroadsconstructedwithin 14selectedcounties
- 55 55 - - 26
No. of highmast lightsinstalledwithin 14selectedcounties
- 21 21 - - 21
Housinginfrastructureto open up forland forhousingdevelopments
No. of Km ofaccess roadsconstructedacross thecountry
21.6 21.6 21.6 17.9 17.9 17.9
No. of Km oftrunk sewerline installed
2 2 1 2 2 2
No. of Km oftrunk waterline installed
2 2 1 8 8 2.7
S.P 7.2:EstateManagement
Governmentofficesrenovated/refurbished
% of workscompleted inBima Towers(Mombasa)and
0 0 100 0 0 47
% of workscompleted inCrescentHouse(Nairobi)Phase II
0 0 100 0 0 100
Governmenthousing units
No. of UnitsRefurbished
1,800 1,800 1,800 1,465 742 484

20
Programme Key Outputs KeyPerformanceIndicators
Target Achievement Remarks2012/13
2013/14
2014/15
2012/13
2013/14
2014/15
refurbishedProgramme 8: Government BuildingsSP 8.1:Stalled andnewGovernmentbuildings
Governmentbuildingscompleted/rehabilitated
No. of stalledGovernmentbuildingscompleted
9 4 4 7 0 0
No. ofGovernmentbuildingsrehabilitated
50 50 50 90 56 42
SP 8.2:BuildingStandardsand Research
Researchappropriatebuilding andconstructiontechnologies
No. ofresearchconductedanddisseminated
1 1 1 1 1 1
Contractorsregister
No. ofContractorsregistered
- 20,000
20,000
- 20,000
15,995
Constructionsite supervisorsaccredited
No.of sitesupervisorsaccredited
0 15,000
15,000
0 15,000
15,164
Skilledconstructcionworkersaccredited
No. ofconstructcionworkersaccredited
0 31,000
32,000
0 31,150
31,190
Regulatedconstructionindustry
No. of newcontractorsregistered
- 10,000
5,000 3,854 9,337 4,395
No. of newskilledconstructionworkersaccredited
- - 300,000
- - 138,586
Programme 9 : Coastline Infrastructure and pedestrian accessSP 9.1:CoastlineInfrastructureDevelopment
Jettiesconstructed/rehabilitated
No. of jettiesconstructed/Rehabiltated
3 2 2 2 0 0
Seawallsconstructedandrehabilitated inlow lying areasalong thecoastline
Meters ofseawallconstructed/rehabilitated
1,500 1,000 1,000 1,462 0 33
SP: 9.2Pedestrianaccess
Footbridges No. ofongoingfootbridgescompleted
60 30 25 28 27 18
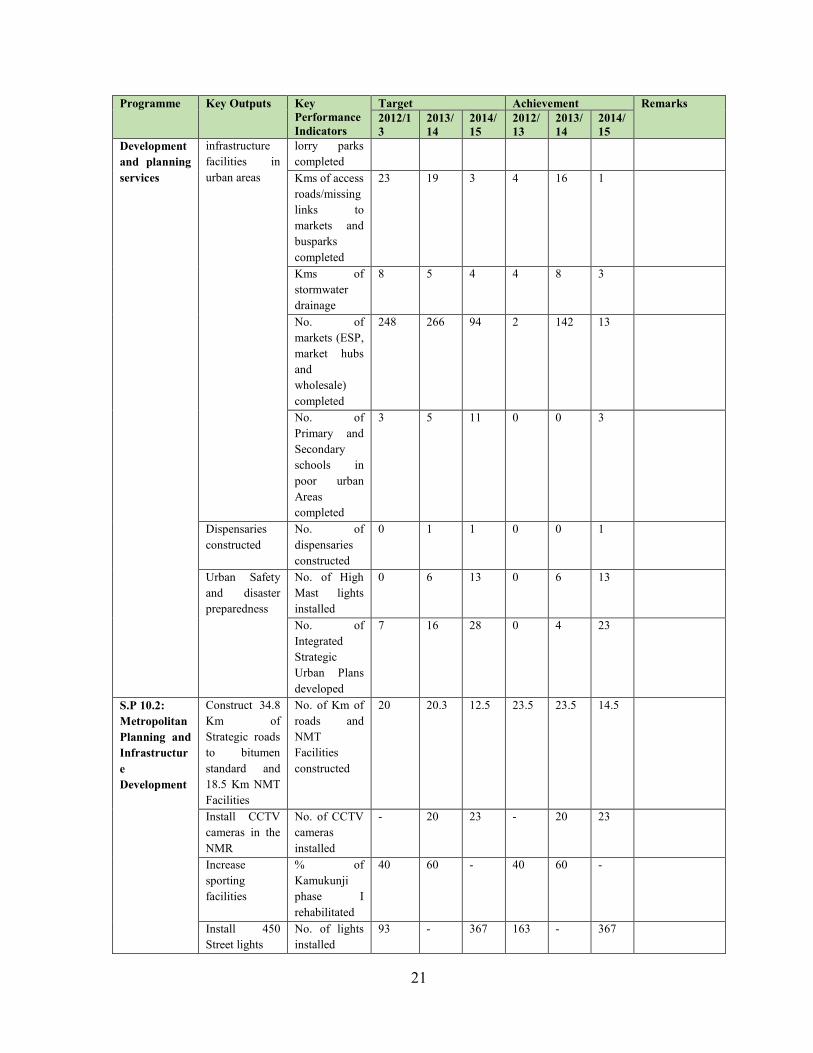
Programme 10: Urban and Metropolitan DevelopmentSP 10.1:Urban
Social andphysical
No. oftrailer,bus and
4 8 8 3 3 3
21
Programme Key Outputs KeyPerformanceIndicators
Target Achievement Remarks2012/13
2013/14
2014/15
2012/13
2013/14
2014/15
Developmentand planningservices
infrastructurefacilities inurban areas
lorry parkscompletedKms of accessroads/missinglinks tomarkets andbusparkscompleted
23 19 3 4 16 1
Kms ofstormwaterdrainage
8 5 4 4 8 3
No. ofmarkets (ESP,market hubsandwholesale)completed
248 266 94 2 142 13
No. ofPrimary andSecondaryschools inpoor urbanAreascompleted
3 5 11 0 0 3
Dispensariesconstructed
No. ofdispensariesconstructed
0 1 1 0 0 1
Urban Safetyand disasterpreparedness
No. of HighMast lightsinstalled
0 6 13 0 6 13
No. ofIntegratedStrategicUrban Plansdeveloped
7 16 28 0 4 23
S.P 10.2:MetropolitanPlanning andInfrastructureDevelopment
Construct 34.8Km ofStrategic roadsto bitumenstandard and18.5 Km NMTFacilities
No. of Km ofroads andNMTFacilitiesconstructed
20 20.3 12.5 23.5 23.5 14.5
Install CCTVcameras in theNMR
No. of CCTVcamerasinstalled
- 20 23 - 20 23
Increasesportingfacilities
% ofKamukunjiphase Irehabilitated
40 60 - 40 60 -
Install 450Street lights
No. of lightsinstalled
93 - 367 163 - 367

22
Programme Key Outputs KeyPerformanceIndicators
Target Achievement Remarks2012/13
2013/14
2014/15
2012/13
2013/14
2014/15
Procure andfire engines/Land Roversdistributewithin NMR
No. of fireengines andLand roversprocured
1 7 14 1 7 7
DevelopCapacities ofofficers withinNMR ondisastermanagement
No. ofofficerstrained
40 40 40 40 50 50
Programme 11: General Administration, Planning and Support Services (MLHUD)SP 11.1:Administration andSupportServices
Monitoringand evaluation
No. ofQuarterlyreports
4 4 4 4 4 4
SP.11.2:D1evelopmentPlanning andLandReforms
ReviewedLand Laws
No. of landlegislationsenacted
4 4 3 3 3 3
Land clinics No. of landclinicsconducted
4 4 4 4 4 4
SP 11.3:Procurement,warehousingand supply
Rehabilitatedadministrationblock, stockcontrol block,main warehouse atSuppliesBranch,Nairobi
% ofcompletion
- - 100 - - 95
Programme 12: Land Administration and ManagementSP 12.1:GeneralAdministration
EstablishedCLMB’s
No. ofCLMBsestablishedandoperational
- - 47 - - 39 Composition ofsome CLMBwas challengedin court.
Monitoringand evaluationpolicyframework inplace
Quarterlyreports onM&Erecommendation’s
- - 5 - - 2 Commissionplans toenhancecapacity of M& Edepartment.
Staff strengthenhanced
Number ofstaffestablishment
- 1447 1336 - 110 481

23
Programme Key Outputs KeyPerformanceIndicators
Target Achievement Remarks2012/13
2013/14
2014/15
2012/13
2013/14
2014/15
recruitedSP 12.2. LandAdministration, valuationandcompulsoryacquisition
Leases andgrantsexecuted,reviewed andrevoked
Number ofgrants andleasesexecuted,reviewed andrevoked
- - 3000 - - 1500 -There was achallenge inexecution ofleases due tothe ongoingcourt casebetween NLCand MoLHUD
Number ofallotmentlettersreceived andverified.
- - 8000 - - 711 6685 letters ofallotmentapplications forverificationwere received.Out of thisexercise 711have beenconfirmed to bevalid and areawaitingauthority forissuance of newletters
Number ofapplicationsfrom acquiringbodies
- - 34 - - 26 Staffcapacityconstraintslimited theno. ofprojectsthatcouldbeacquired.Majorityof theprojectsareon-going.
Rules andregulationsdeveloped toguide land
- - 2 - - 1 Target wasnotcarrie
24
Programme Key Outputs KeyPerformanceIndicators
Target Achievement Remarks2012/13
2013/14
2014/15
2012/13
2013/14
2014/15
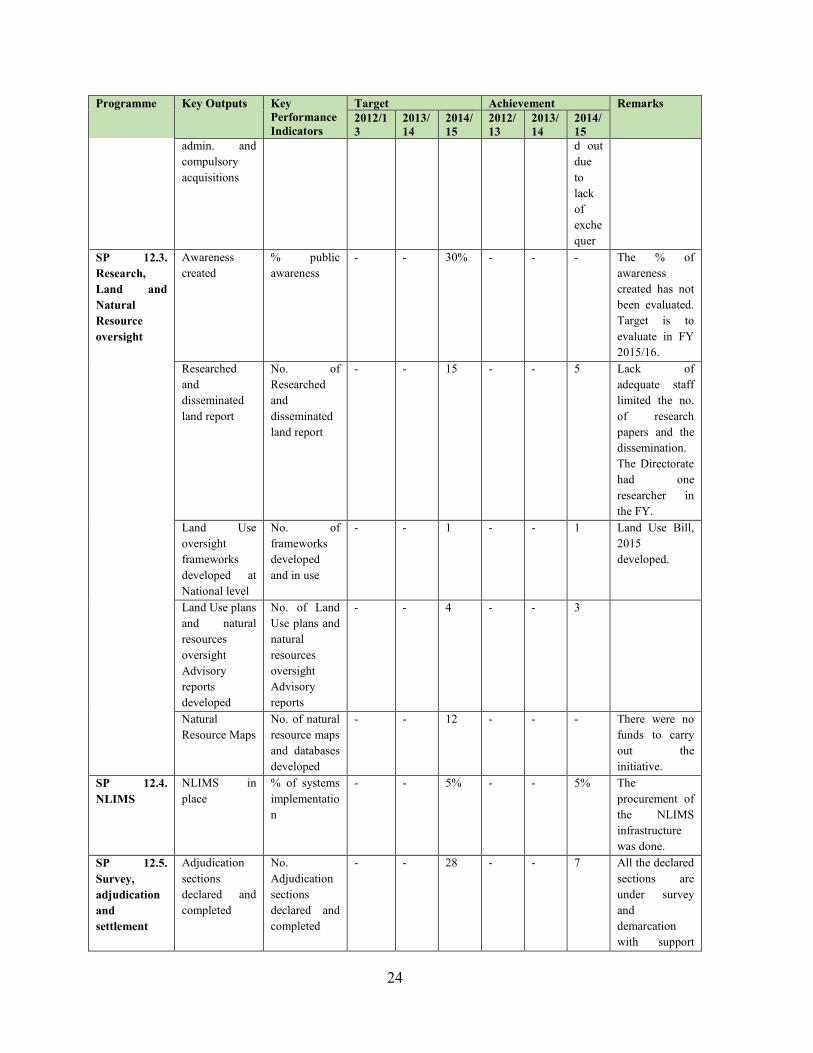
admin. andcompulsoryacquisitions
d outduetolackofexchequer
SP 12.3.Research,Land andNaturalResourceoversight
Awarenesscreated
% publicawareness
- - 30% - - - The % ofawarenesscreated has notbeen evaluated.Target is toevaluate in FY2015/16.
Researchedanddisseminatedland report
No. ofResearchedanddisseminatedland report
- - 15 - - 5 Lack ofadequate stafflimited the no.of researchpapers and thedissemination.The Directoratehad oneresearcher inthe FY.
Land Useoversightframeworksdeveloped atNational level
No. offrameworksdevelopedand in use
- - 1 - - 1 Land Use Bill,2015developed.
Land Use plansand naturalresourcesoversightAdvisoryreportsdeveloped
No. of LandUse plans andnaturalresourcesoversightAdvisoryreports
- - 4 - - 3
NaturalResource Maps
No. of naturalresource mapsand databasesdeveloped
- - 12 - - - There were nofunds to carryout theinitiative.
SP 12.4.NLIMS
NLIMS inplace
% of systemsimplementation
- - 5% - - 5% Theprocurement ofthe NLIMSinfrastructurewas done.
SP 12.5.Survey,adjudicationandsettlement
Adjudicationsectionsdeclared andcompleted
No.Adjudicationsectionsdeclared andcompleted
- - 28 - - 7 All the declaredsections areunder surveyanddemarcationwith support
25
Programme Key Outputs KeyPerformanceIndicators
Target Achievement Remarks2012/13
2013/14
2014/15
2012/13
2013/14
2014/15
from therespectiveCountyGovernments.
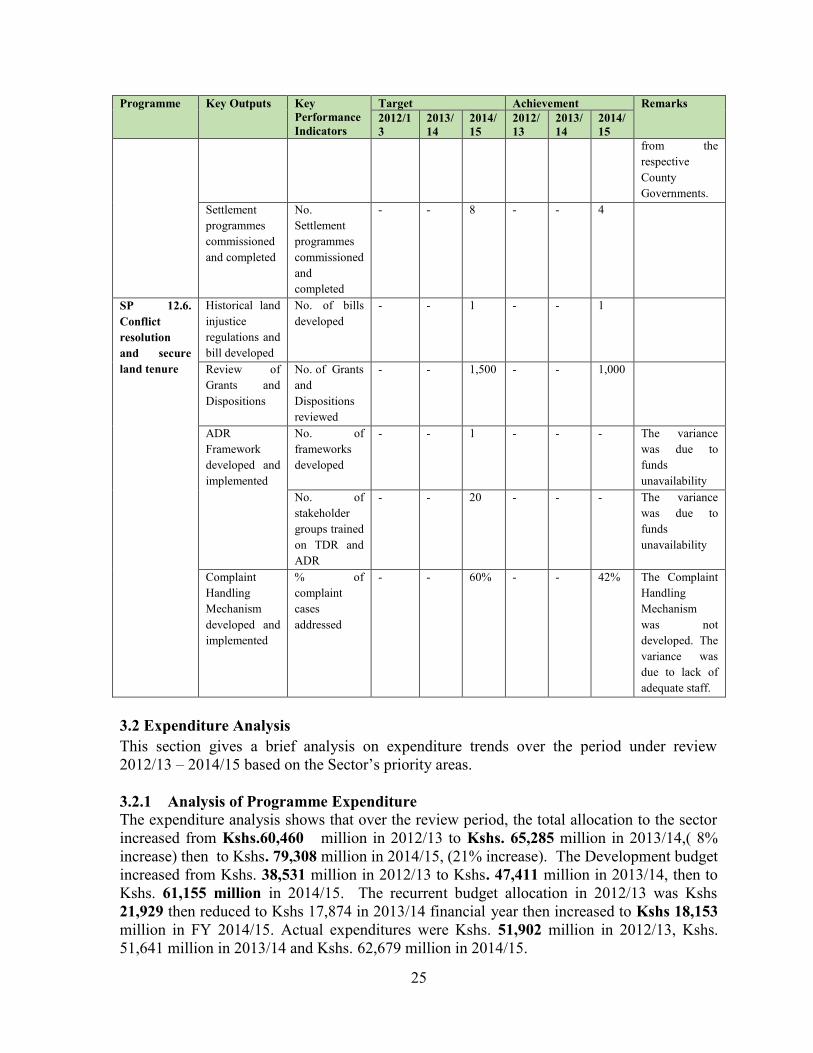
Settlementprogrammescommissionedand completed
No.Settlementprogrammescommissionedandcompleted
- - 8 - - 4
SP 12.6.Conflictresolutionand secureland tenure
Historical landinjusticeregulations andbill developed
No. of billsdeveloped
- - 1 - - 1
Review ofGrants andDispositions
No. of GrantsandDispositionsreviewed
- - 1,500 - - 1,000
ADRFrameworkdeveloped andimplemented
No. offrameworksdeveloped
- - 1 - - - The variancewas due tofundsunavailability
No. ofstakeholdergroups trainedon TDR andADR
- - 20 - - - The variancewas due tofundsunavailability
ComplaintHandlingMechanismdeveloped andimplemented
% ofcomplaintcasesaddressed
- - 60% - - 42% The ComplaintHandlingMechanismwas notdeveloped. Thevariance wasdue to lack ofadequate staff.
3.2 Expenditure AnalysisThis section gives a brief analysis on expenditure trends over the period under review2012/13 – 2014/15 based on the Sector’s priority areas.
3.2.1 Analysis of Programme ExpenditureThe expenditure analysis shows that over the review period, the total allocation to the sectorincreased from Kshs.60,460 million in 2012/13 to Kshs. 65,285 million in 2013/14,( 8%increase) then to Kshs. 79,308 million in 2014/15, (21% increase). The Development budgetincreased from Kshs. 38,531 million in 2012/13 to Kshs. 47,411 million in 2013/14, then toKshs. 61,155 million in 2014/15. The recurrent budget allocation in 2012/13 was Kshs21,929 then reduced to Kshs 17,874 in 2013/14 financial year then increased to Kshs 18,153million in FY 2014/15. Actual expenditures were Kshs. 51,902 million in 2012/13, Kshs.51,641 million in 2013/14 and Kshs. 62,679 million in 2014/15.

26
The overall average absorption capacity of the Sector for the FY 2014/15 was 96%, thiscomprises absorption for Recurrent at 96% and Development at 74%. The variance inabsorption rate was caused by late approval of the Supplementary II Estimates and lack ofexchequer releases at the closure of financial year resulting to pending bills that form the firstcharge in the following financial year. A detailed analysis of programme/ sub programmeexpenditure is as shown in Table 2
Table 4: Programme/Sub-Programme Expenditure AnalysisSUB PROGRAMME APPROVED
ESTIMATESACTUAL EXPENDITURE
2012/13 2013/14 2014/15 2012/13 2013/14 2014/15
Programme 1: General Administration, Planning and Support ServicesSP 1.1 Agricultural Policy, Legal andRegulatory Frameworks
1,588 565 894 1,574 515 775
SP 1.2 Agricultural Planning and FinancialManagement
1,781 654 942 1,211 591 672
Total Expenditure Programme 1 3,369 1,219 1,836 2,785 1,106 1,447Programme 2: Crop Development and ManagementSP 2.1 -Land And Crops Development 3,701 1,951 2,326 2,005 1,616 1,902SP 2.2 Food Security Initiatives 280 2,360 6,090 269 1,955 5,939
SP 2.3 -Agriculture Extension Services 6,687, 4,662 5,744 5,634 3,861 4,883
SP 2.4 -Agricultural Research 5,129 4,005 2,400 3,845 3,317 2,109
Total Expenditure Programme 2 15,798 12,978 16,560 11,753 10,748 14,833Programme 3: Agribusiness and Information Management,S.P 3.1 Agribusiness and Market Development 3,925 11,373 4,724 3,821 8,882 4,622
S.P 3.2 Agricultural Information andManagement
94 589 45 91 460 40
Total Expenditure Programme 3 4,019 11,962 4,769 3,912 9,342 4,663Programme 4: Irrigation and Drainage InfrastructureSP 4.1 Irrigation and Drainage Infrastructure - 12,092 15,897 - 9,370 9,090
Total Expenditure Programme 4 - 12,092 15,897 - 9,370 9,090Programme 5: Livestock Resources Management and DevelopmentSP 5.1 Livestock policy development andcapacity building programme
21 21
Total Expenditure Programme 5 21 21Total Expenditure Vote 1161 23,186 38,251 39,085 18,451 30,566 30,055Programme 6: Livestock Resources Management and DevelopmentSP 6.1: Livestock Policy Development andcapacity building Programme
1,777 1,892 2,392 1,736 1,586 2,354
SP 6.2: Livestock Production and Management 1,880 568 767 1,837 413 804

27
SUB PROGRAMME APPROVEDESTIMATES
ACTUAL EXPENDITURE
2012/13 2013/14 2014/15 2012/13 2013/14 2014/15
SP 6.3: Livestock Products Value Addition andMarketing
773 455 606 755 429 506
SP 6.4: Food Safety and Animal ProductsDevelopment
1,556 597 705 1,521 483 640
SP 6.5: Livestock Disease Management andControl
1,506 1,166 1156 1,472 1,060 863
Total programme 7,492 4,678 5625 7,321 3,971 5167
Total Vote 7,492 4,678 5,625 7,321 3,971 5167
Programme 7: Fisheries Development and Management
SP 7.1 Fisheries policy, Strategy and capacitybuilding
275 199 168 266 191 147
SP 7.2 Aquaculture Development 1571 205 242 1556 196 218SP 7.3 Management and Development ofCapture Fisheries
935 1247 1165 916 636 1165
SP 7.4 Assurance of Fish Safety, Value additionand Marketing
93 21 54 91 20 38
SP 7.5 Marine and Fisheries Research 1122 1210 1589 688 1019 1589Total Programme 3996 2882 3218 3517 2062 3157TOTAL VOTE 3996 2882 3218 3517 2062 3157Programme 8: :Land Policy and PlanningSP 8.1 Development Planning and land Reforms 1,682 583 1,778 1418 523 1,737SP 8.2 Modernization of Land Registries 818 516 1,339 690 511 1,340SP 8.3 Land Survey 1398 2,543 3,369 1179 1559 3,312SP 8.4 Land Use 322 183 231 271 182 226SP 8.5 Land Adjudication 560 284 390 472 283 412Total programme 4,780 4,109 7,107 4,030 3,058 7,027P9:Housing Development and Human SettlementSP 9.1 Housing Development 3164 5,495 5,196 2,286 3,307 3,785SP 9.2 Estate Management 1179 596 1,717 1,127 585 1,601Total programme 4,343 6,091 6,913 3,413 3,892 5,386P.10 Government Buildings
SP 10.1 Stalled and new Government Buildings 3,994 2208 1,880 3,638 2,213 1,878SP 10.2 Building Standards and Research 48 44 32 35 38 32Total programme 4042 2252 1912 3672 2252 1910Programme 11. Coastline Infrastructure Development
SP 11.1 Coastline Infrastructure Development 994 172 371 960 168 346SP 11.2 Pedestrian Access 81 - - 74 - -Total programme 1075 172 371 1034 168 346Programme 12 Urban and Metropolitan Development
SP 12.1 Metropolitan Planning & InfrastructureDevelopment
3,018 5,296 6,444 2,918 2,133 2,418
SP 12.2 Urban Development and PlanningServices
6,533 4,424 6,288 6,205 3,062 5,339
Total Programme 9,551 9,720 12,732 9,123 5,195 7,757

28
SUB PROGRAMME APPROVEDESTIMATES
ACTUAL EXPENDITURE
2012/13 2013/14 2014/15 2012/13 2013/14 2014/15
Programme 13 General Administration Planning and Support
SP 13.1 Administration, Planning & SupportServices
1,716 562 482 1,368 467 471
SP 13.2 Procurement, Warehousing and Supply 47 31 168 36 29 167Total Programme 1,762 593 650 1,404 495 638TOTAL VOTE 25,553 25,218 29,685 22,675 15,060 23,064Programme 14 Land Administration and Management
SP 14.1 Land Administration and Management- -
1,535- - 1,080
Total Expenditure of Programme - - 1,535 - - 1,080TOTAL VOTE ARUD SECTOR 60,460 65,285 79,308 51,902 51,641 62,679
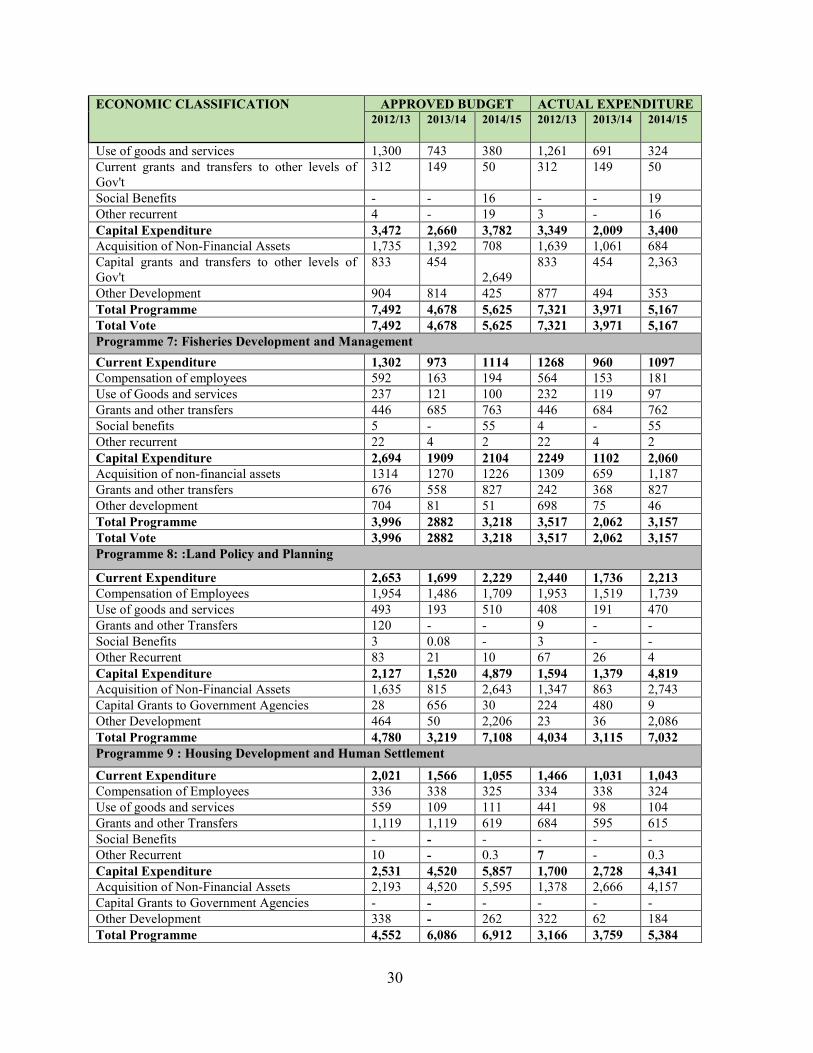
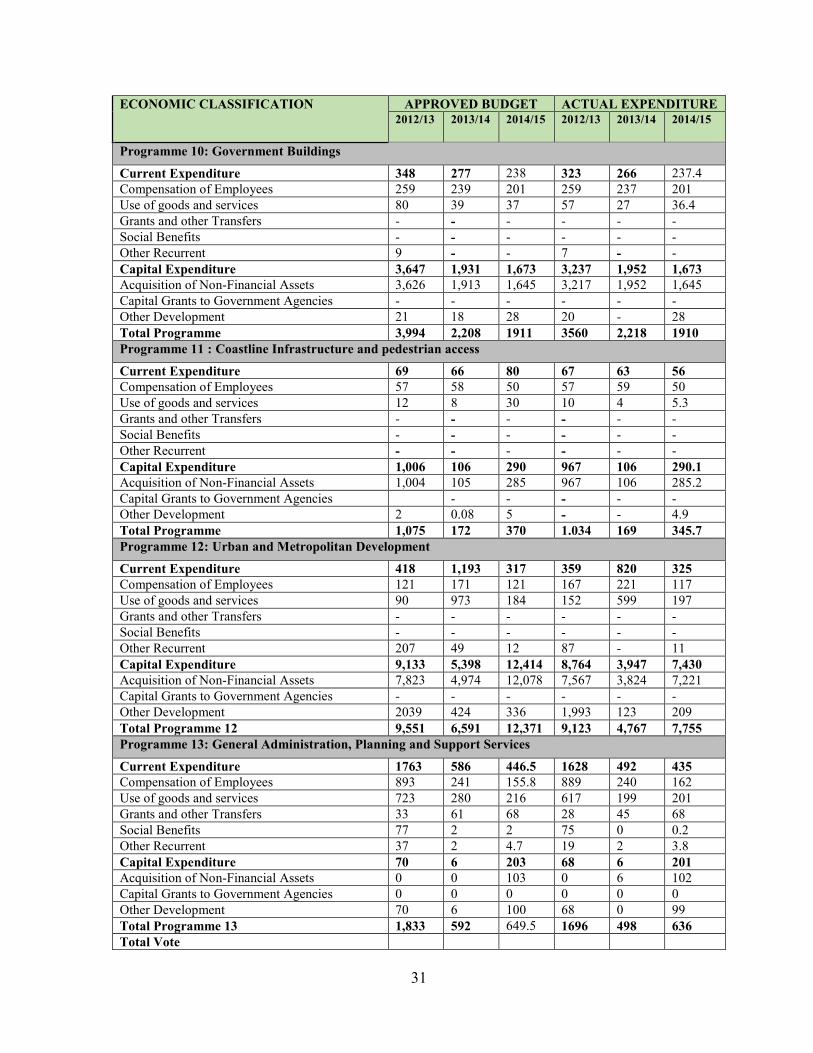
3.2.2 Analysis of programme expenditure by economic classification
Table 5: Analysis of programme expenditure by economic classificationECONOMIC CLASSIFICATION APPROVED BUDGET ACTUAL EXPENDITURE
2012/13 2013/14 2014/15 2012/13 2013/14 2014/15
Programme 1: General Administration, Planning and Support services
Recurrent Expenditure 1,796 786 746 1,790 714 711
Compensation to Employees 304 273 273 302 268 247
Use of Goods and services 291 174 207 288 168 204
Current transfers Govt Agencies 1,201 331 253 1,200 278 253
Social Benefits 0 0 5 0 0 5
Other Recurrent 0 8 8 0 0 2
Development Expenditure 1,524 433 1,092 950 392 736
Acquisition of Non- Financial Assets 1,271 0 13 697 0 9
Capital Transfers to Government Agencies 253 433 1,079 253 392 727
Other Development 0 0 0 0 0 0
Total 3,320 1,219 1,837 2,740 1,106 1,447
Programme 2: Crop Development and Management
Recurrent Expenditure 7,249 6,511 8,379 6,559 5,351 8,283
Compensation to Employees 4,000 494 470 3,937 468 468
Use of Goods and services 926 692 1,163 304 521 1,078
Current transfers Govt Agencies 2,323 3,073 2,994 2,318 2,260 2,987
Social Benefits 0 0 0 0 0 0
Other Recurrent 0 2,252 3,752 0 2,102 3,750

29
ECONOMIC CLASSIFICATION APPROVED BUDGET ACTUAL EXPENDITURE2012/13 2013/14 2014/15 2012/13 2013/14 2014/15
Development Expenditure 8,599 6,467 8,181 5,240 5,397 6,550
Acquisition of Non- Financial Assets 5,331 129 844 3,146 122 776
Capital Transfers to Government Agencies 3,218 6,188 7,240 2,094 5,200 5,677
Other Development 0 150 97 0 75 97
Total 15,798 12,978 16,561 11,754 10,748 14,833
Programme 3: Agribusiness and Information Management
Recurrent Expenditure 290 856 172 266 796 150
Compensation to Employees 69 117 93 62 109 91
Use of Goods and services 203 0 57 196 0 40
Current transfers Govt Agencies 18 739 18 8 687 17
Social Benefits 0
Other Recurrent 0 0 4 0 0 2
Development Expenditure 3,728 11,106 4,597 3,646 8,546 4,513
Acquisition of Non- Financial Assets 3,028 4,376 25 2,946 2,746 0
Capital Transfers to Government Agencies 700 6730 72 700 5800 64
Other Development 0 0 4,500 0 0 4,449
Total 4,018 11,962 4,769 3,912 9,342 4,663Programme 4 Irrigation and Drainage Infrastructure
Recurrent Expenditure 0 856 649 0 824 246
Compensation to Employees 0 199 117 0 192 116
Use of Goods and Services 0 0 5 0 0 4
Current Transfers to Govt. Agencies 0 657 526 0 632 126
Social Benefits
Other Recurrent 0 0 1 0 0 0Development Expenditure 0 11,236 15,248 0 8,546 8,844Acquisition of Non-Financial Assets 0 4,376 4,588 0 3,210 2,606
Capital Grants to Govt. Agencies 0 6,860 10,660 0 5,336 6,238
Other Development 0 0 0 0 0 0
Total Expenditure 0 12,092 15,897 0 9,370 9,090Programme 5: Livestock Resources Management and Development
Current Expenditure 21 21Compensation to Employees 21 21Total Programme 21 21Total Vote 23,186 38,251 39,085 18,451 30,566 30,055Programme 6: Livestock Resources Management and DevelopmentCurrent Expenditure 4,020 2,018 1,843 3,972 1,962 1,767Compensation of employees 2,404 1,126 1,378 2,396 1,122 1,358
30
ECONOMIC CLASSIFICATION APPROVED BUDGET ACTUAL EXPENDITURE2012/13 2013/14 2014/15 2012/13 2013/14 2014/15
Use of goods and services 1,300 743 380 1,261 691 324Current grants and transfers to other levels ofGov't
312 149 50 312 149 50
Social Benefits - - 16 - - 19Other recurrent 4 - 19 3 - 16Capital Expenditure 3,472 2,660 3,782 3,349 2,009 3,400Acquisition of Non-Financial Assets 1,735 1,392 708 1,639 1,061 684Capital grants and transfers to other levels ofGov't
833 4542,649
833 454 2,363
Other Development 904 814 425 877 494 353Total Programme 7,492 4,678 5,625 7,321 3,971 5,167Total Vote 7,492 4,678 5,625 7,321 3,971 5,167Programme 7: Fisheries Development and ManagementCurrent Expenditure 1,302 973 1114 1268 960 1097Compensation of employees 592 163 194 564 153 181Use of Goods and services 237 121 100 232 119 97Grants and other transfers 446 685 763 446 684 762Social benefits 5 - 55 4 - 55Other recurrent 22 4 2 22 4 2Capital Expenditure 2,694 1909 2104 2249 1102 2,060Acquisition of non-financial assets 1314 1270 1226 1309 659 1,187Grants and other transfers 676 558 827 242 368 827Other development 704 81 51 698 75 46Total Programme 3,996 2882 3,218 3,517 2,062 3,157Total Vote 3,996 2882 3,218 3,517 2,062 3,157Programme 8: :Land Policy and Planning
Current Expenditure 2,653 1,699 2,229 2,440 1,736 2,213Compensation of Employees 1,954 1,486 1,709 1,953 1,519 1,739Use of goods and services 493 193 510 408 191 470Grants and other Transfers 120 - - 9 - -Social Benefits 3 0.08 - 3 - -Other Recurrent 83 21 10 67 26 4Capital Expenditure 2,127 1,520 4,879 1,594 1,379 4,819Acquisition of Non-Financial Assets 1,635 815 2,643 1,347 863 2,743Capital Grants to Government Agencies 28 656 30 224 480 9Other Development 464 50 2,206 23 36 2,086Total Programme 4,780 3,219 7,108 4,034 3,115 7,032Programme 9 : Housing Development and Human Settlement
Current Expenditure 2,021 1,566 1,055 1,466 1,031 1,043Compensation of Employees 336 338 325 334 338 324Use of goods and services 559 109 111 441 98 104Grants and other Transfers 1,119 1,119 619 684 595 615Social Benefits - - - - - -Other Recurrent 10 - 0.3 7 - 0.3Capital Expenditure 2,531 4,520 5,857 1,700 2,728 4,341Acquisition of Non-Financial Assets 2,193 4,520 5,595 1,378 2,666 4,157Capital Grants to Government Agencies - - - - - -Other Development 338 - 262 322 62 184Total Programme 4,552 6,086 6,912 3,166 3,759 5,384
31
ECONOMIC CLASSIFICATION APPROVED BUDGET ACTUAL EXPENDITURE2012/13 2013/14 2014/15 2012/13 2013/14 2014/15
Programme 10: Government Buildings
Current Expenditure 348 277 238 323 266 237.4Compensation of Employees 259 239 201 259 237 201Use of goods and services 80 39 37 57 27 36.4Grants and other Transfers - - - - - -Social Benefits - - - - - -Other Recurrent 9 - - 7 - -Capital Expenditure 3,647 1,931 1,673 3,237 1,952 1,673Acquisition of Non-Financial Assets 3,626 1,913 1,645 3,217 1,952 1,645Capital Grants to Government Agencies - - - - - -Other Development 21 18 28 20 - 28Total Programme 3,994 2,208 1911 3560 2,218 1910Programme 11 : Coastline Infrastructure and pedestrian access
Current Expenditure 69 66 80 67 63 56Compensation of Employees 57 58 50 57 59 50Use of goods and services 12 8 30 10 4 5.3Grants and other Transfers - - - - - -Social Benefits - - - - - -Other Recurrent - - - - - -Capital Expenditure 1,006 106 290 967 106 290.1Acquisition of Non-Financial Assets 1,004 105 285 967 106 285.2Capital Grants to Government Agencies - - - - -Other Development 2 0.08 5 - - 4.9Total Programme 1,075 172 370 1.034 169 345.7Programme 12: Urban and Metropolitan Development
Current Expenditure 418 1,193 317 359 820 325Compensation of Employees 121 171 121 167 221 117Use of goods and services 90 973 184 152 599 197Grants and other Transfers - - - - - -Social Benefits - - - - - -Other Recurrent 207 49 12 87 - 11Capital Expenditure 9,133 5,398 12,414 8,764 3,947 7,430Acquisition of Non-Financial Assets 7,823 4,974 12,078 7,567 3,824 7,221Capital Grants to Government Agencies - - - - - -Other Development 2039 424 336 1,993 123 209Total Programme 12 9,551 6,591 12,371 9,123 4,767 7,755Programme 13: General Administration, Planning and Support Services
Current Expenditure 1763 586 446.5 1628 492 435Compensation of Employees 893 241 155.8 889 240 162Use of goods and services 723 280 216 617 199 201Grants and other Transfers 33 61 68 28 45 68Social Benefits 77 2 2 75 0 0.2Other Recurrent 37 2 4.7 19 2 3.8Capital Expenditure 70 6 203 68 6 201Acquisition of Non-Financial Assets 0 0 103 0 6 102Capital Grants to Government Agencies 0 0 0 0 0 0Other Development 70 6 100 68 0 99Total Programme 13 1,833 592 649.5 1696 498 636Total Vote
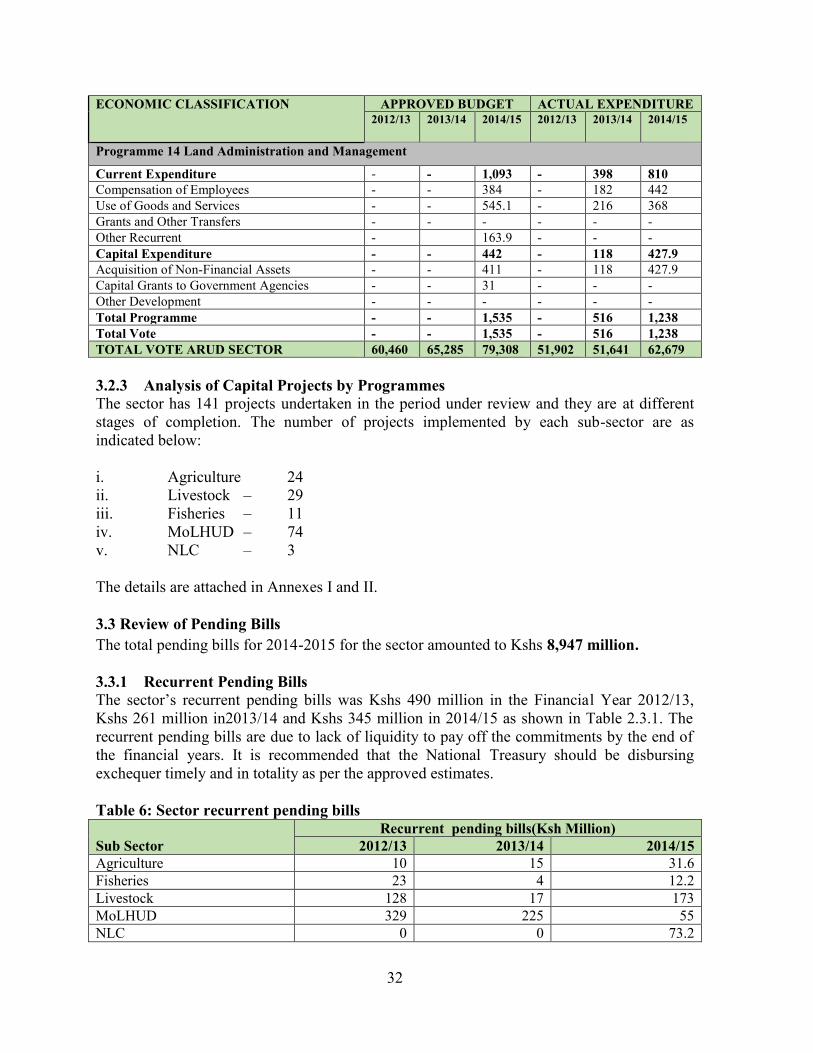
32
ECONOMIC CLASSIFICATION APPROVED BUDGET ACTUAL EXPENDITURE2012/13 2013/14 2014/15 2012/13 2013/14 2014/15
Programme 14 Land Administration and Management
Current Expenditure - - 1,093 - 398 810Compensation of Employees - - 384 - 182 442Use of Goods and Services - - 545.1 - 216 368Grants and Other Transfers - - - - - -Other Recurrent - 163.9 - - -Capital Expenditure - - 442 - 118 427.9Acquisition of Non-Financial Assets - - 411 - 118 427.9Capital Grants to Government Agencies - - 31 - - -Other Development - - - - - -Total Programme - - 1,535 - 516 1,238Total Vote - - 1,535 - 516 1,238TOTAL VOTE ARUD SECTOR 60,460 65,285 79,308 51,902 51,641 62,679
3.2.3 Analysis of Capital Projects by ProgrammesThe sector has 141 projects undertaken in the period under review and they are at differentstages of completion. The number of projects implemented by each sub-sector are asindicated below:
i. Agriculture 24ii. Livestock – 29iii. Fisheries – 11iv. MoLHUD – 74v. NLC – 3
The details are attached in Annexes I and II.
3.3 Review of Pending BillsThe total pending bills for 2014-2015 for the sector amounted to Kshs 8,947 million.
3.3.1 Recurrent Pending BillsThe sector’s recurrent pending bills was Kshs 490 million in the Financial Year 2012/13,Kshs 261 million in2013/14 and Kshs 345 million in 2014/15 as shown in Table 2.3.1. Therecurrent pending bills are due to lack of liquidity to pay off the commitments by the end ofthe financial years. It is recommended that the National Treasury should be disbursingexchequer timely and in totality as per the approved estimates.
Table 6: Sector recurrent pending bills
Sub SectorRecurrent pending bills(Ksh Million)
2012/13 2013/14 2014/15Agriculture 10 15 31.6Fisheries 23 4 12.2Livestock 128 17 173MoLHUD 329 225 55NLC 0 0 73.2
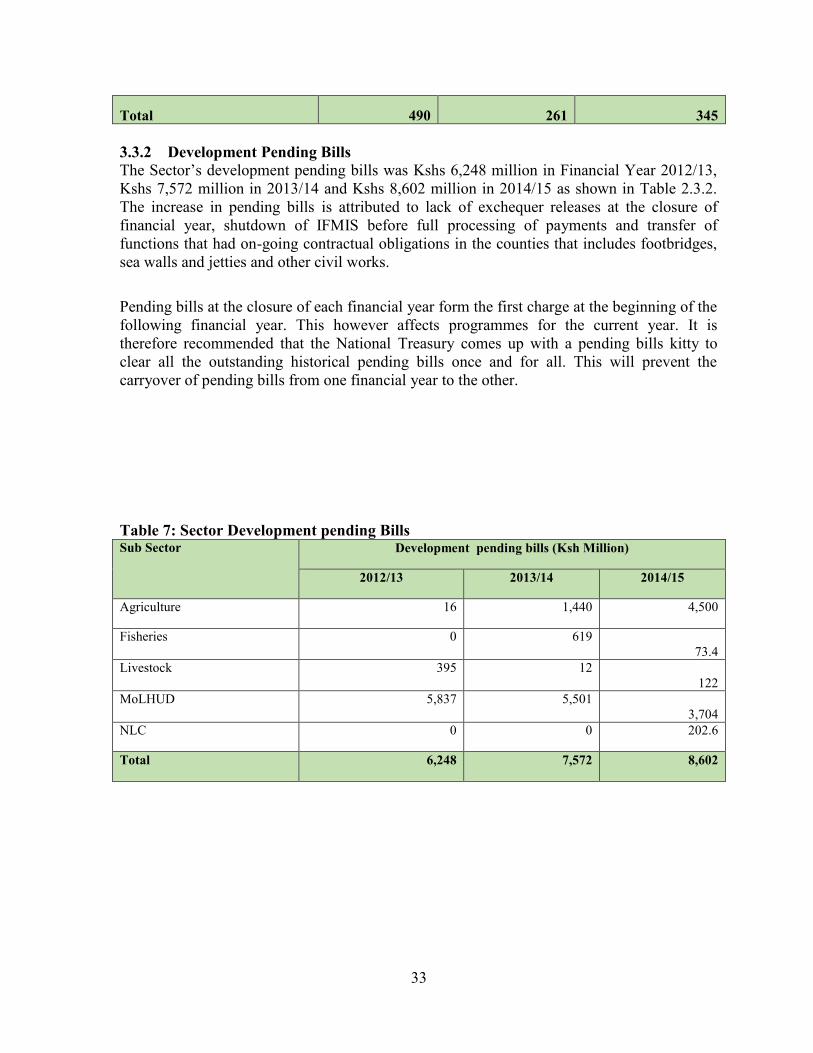
33
Total 490 261 345
3.3.2 Development Pending BillsThe Sector’s development pending bills was Kshs 6,248 million in Financial Year 2012/13,Kshs 7,572 million in 2013/14 and Kshs 8,602 million in 2014/15 as shown in Table 2.3.2.The increase in pending bills is attributed to lack of exchequer releases at the closure offinancial year, shutdown of IFMIS before full processing of payments and transfer offunctions that had on-going contractual obligations in the counties that includes footbridges,sea walls and jetties and other civil works.
Pending bills at the closure of each financial year form the first charge at the beginning of thefollowing financial year. This however affects programmes for the current year. It istherefore recommended that the National Treasury comes up with a pending bills kitty toclear all the outstanding historical pending bills once and for all. This will prevent thecarryover of pending bills from one financial year to the other.
Table 7: Sector Development pending BillsSub Sector Development pending bills (Ksh Million)
2012/13 2013/14 2014/15
Agriculture 16 1,440 4,500
Fisheries 0 61973.4
Livestock 395 12122
MoLHUD 5,837 5,5013,704
NLC 0 0 202.6
Total 6,248 7,572 8,602
34
CHAPTER THREE3. MEDIUM TERM PRIORITIES AND FINANCIAL PLAN 2016/17-2018/19The Chapter identifies programmes, sub-programmes, outputs, key performance indicatorsand budgetary requirement for the Sector implementation in MTEF period 2016/17 -2018/19.The resource requirement/allocation under the sector targets priorityprogrammes/projects outlined in the MTP II and its Kenya Vision 2030 including the currentGovernment’s key flagship projects.
3.1 Prioritization of programmes and Sub-ProgrammesIn the MTEF period 2016/2017-2018/2019 the Sector has prioritized programmes and sub-programmes intended to facilitate attainment of food security, affordable housing, modernurban infrastructure and sustainable land management for socio-economic development.”The Sector has three Sub-Sectors with a total of fifteen (15) programmes
3.1.1 Programmes and their Objectives
1. General Administration, Planning and Support Services
Objective: To provide efficient and effective support services
2. Crop Development and Management
Objective: To increase agricultural productivity and outputs
3. Agribusiness and Information Management
Objective: To promote market access and product development
4. Livestock Resources Management and Development
Objective: To promote, regulate and facilitate livestock production for socio-economicdevelopment and industrialization.
5. Fisheries Development and Management
Objective: To maximize the contribution of fisheries to poverty reduction, food securityand creation of employment and wealth.
6. Land Policy and Planning
Objective: To ensure efficient and effective administration and sustainable managementof land resource.
7. Housing Development and Human Settlement
Objective: To facilitate the production of decent and affordable housing and enhancedestates management services and tenancy relations.
8. Government buildings
Objective: To develop and maintain cost effective public buildings and other publicworks.
9. Coastline Infrastructure and pedestrian access

35
Objective: To protect land and property from sea wave action, flooding and erosion andenhance accessibility between human settlements in and out of waters.
10. Urban and Metropolitan Development
Objective: To improve infrastructure development, connectivity and accessibility,safety and security within urban areas and Metropolitan Regions.
11. General Administration, Planning and Support Services
Objective: To provide efficient and effective support services for sustainable land,housing and urban development.
12. Land Administration and Management
Objective: To facilitate access and use of land for socio-economic development andenvironmental sustainability.
13. National Land Information Management Systems
Objective: Efficient land information management system
14. Land Disputes and Conflict Resolutions
Objective: To facilitate an equitable and secure access to land based resources
15. General Administration, Planning and Support Services
Objective: To develop the capacity, enhance efficiency and transparency in servicedelivery
3.1.2 Programmes, Sub-programmes, Expected Outcomes, Outputs, and KeyPerformance Indicators for the Sector
Table 8: Programmes, Sub-Programmes, Expected Outcomes, Outputs, and KeyPerformance Indicators for the SectorProgram
meDelivery
UnitKey
OutputsKey
PerformanceIndicators
Target ActualAchieve
ment
Baseline
Target
2014/15 2014/15 2015/16 2016/17 2017/18 2018/19Programme 1: General Administration, Planning and Support Services-SDAOutcome: Improved agricultural performanceSP1.1AgriculturalPolicy,LegalandRegulatoryFrameworks
AgriculturalpolicyandRegulationsDirectorate
Policiesdeveloped
No. ofPoliciesdeveloped
6 4 5 5 5 5
Legalnoticesdeveloped
No. of legalnoticesdeveloped
4 2 4 4 4 4
CropInsuranceschemeestablished
No. of farmercovered
0 0 1,500 1,800 2,000 2,200
SP 1.2AgriculturalPlanning&Financial
Sharedfunctionsdivision
Financialmanagement improved
% budgetutilization
100 87 100 100 100 100

36
Programme
DeliveryUnit
KeyOutputs
KeyPerformance
Indicators
Target ActualAchieve
ment
Baseline
Target
2014/15 2014/15 2015/16 2016/17 2017/18 2018/19ManagementProgramme 2: Crop Development and ManagementOutcome: Increased food security and IncomeSP 2.1:LandandcropsDevelopment
DroughtResilience andLivelihoodsProgramme(DRSLP)
Construction/rehabilitation oflivestocksale yards
No oflivestock saleyardsconstructed
0 0 0 17 3 0
Construction/rehabilitation of haysheds/fodder banks
No of haysheds/fodderbanksconstructed
0 7 9 2 0 0
MechanizationDirectorate
Storage andPost-HarvestManagement Improved
No. of storesconstructedand handedover
13 7 6 6 6 6
AgriculturalEngineeringServices
NationalAgriculturalMachineryTestingCentresestablished
No. ofNationalMachineryTestingCentres
N/A N/A N/A 10 10 10
NationalSoil andwaterconservation strategydeveloped
% completionof NationalSoil and waterconservationstrategy
N/A N/A NationalAgricultural SoilandwaterManagementPolicy
30 70 100
Nationalland usemaster plandeveloped
% completionof Nationalland usemaster plandeveloped
N/A N/A 25 75 100 0
SP 2.2:FoodSecurityInitiatives
D/CropsResources,Agribusiness andMarketingDevelopment
StrategicFoodReservesimproved
No. of 90Kgbags of maizeprocured(million)
0.5 1.6 0.87 1 1 1
No. of 90kgbags of beansprocured(million)
0 0 0 0.8 0.4 0.4
No. of MT ofrice procured
0 0 0 13,000 2,500 2,500
Fertilizersubsidy
No. of MTfertilizersubsidized
200,000 206,955 130,000 130,000 130,000 130,000
cropproductionandproductivityimproved
No. ofseasonal foodsecurityassessmentsdone
2 1 2 2 2 2

37
Programme
DeliveryUnit
KeyOutputs
KeyPerformance
Indicators
Target ActualAchieve
ment
Baseline
Target
2014/15 2014/15 2015/16 2016/17 2017/18 2018/19NjaaMarufuku Kenya
GroupsSupportedonCommunityDrivenFoodSecurityImprovementInitiatives
No. of groupssupported
150 0 1,500 1,500 1,500 1,500
D/CropResources,Agribusiness andMarketDevelopment-Traditional HighValeCropsProject
Assortedbasic seedbulked &distributedtovulnerablehouseholds
Quantity ofassorteddroughttolerant foodcrops seed(MT)
380 361 370 1,045 1,419 1,993
D/CropResources,Agribusiness andMarketDevelopment
Integratedcluster fordiversifiedcrop,aquacultureandlivestockproductionin ASALareas andcountiesaffected by(MLND)
Quantity ofagriculturalmaterials andsuppliespurchased anddistributed
Maize (Kg)
Beans(Kg)
Fertilizer(50Kg bags)
Dairy goats(No.)
Dairy bucks(No.)
Indigenouspoultry (No.)
65,900
90,000
65,900
5,000
13
6,290
62,900
88,060
62,900
5,000
13
6,290
31,450
47,175
0
500
0
580
31,450
47,175
0
500
50
1,500
15,725
23,588
1,500
1,000
50
1,500
15,725
23,588
1,500
1,000
50
1,500
SP 2.3QualityAssurance andMonitoring ofOutreachServices
AgriculturalSectorDevelopmentSupportProgramme(ASDSP)
Inclusivelinkagesalong theVCsimproved(verticalandhorizontal
No. of Valuechainorganizations(VCOs)formed
141 282 2,216 141 2,216 2,350
Kenya Technical No. of staff 60 71 100 120 140 160
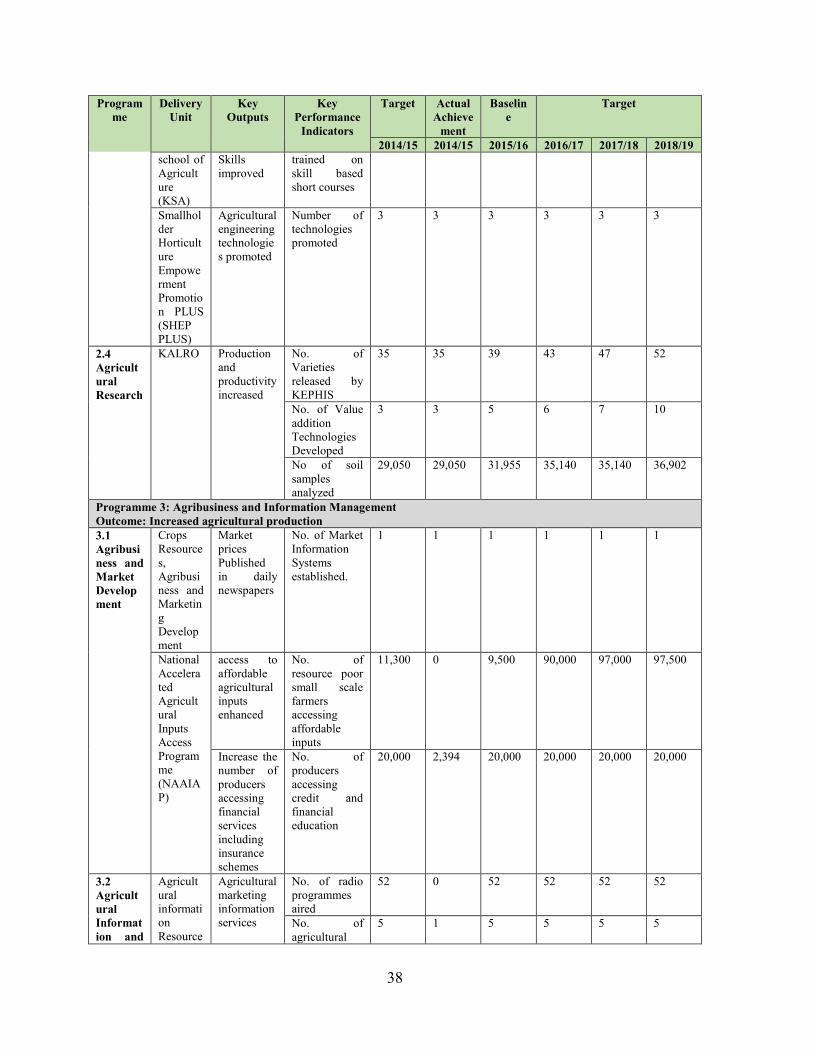
38
Programme
DeliveryUnit
KeyOutputs
KeyPerformance
Indicators
Target ActualAchieve
ment
Baseline
Target
2014/15 2014/15 2015/16 2016/17 2017/18 2018/19school ofAgriculture(KSA)
Skillsimproved
trained onskill basedshort courses
SmallholderHorticultureEmpowermentPromotion PLUS(SHEPPLUS)
Agriculturalengineeringtechnologies promoted
Number oftechnologiespromoted
3 3 3 3 3 3
2.4AgriculturalResearch
KALRO Productionandproductivityincreased
No. ofVarietiesreleased byKEPHIS
35 35 39 43 47 52
No. of ValueadditionTechnologiesDeveloped
3 3 5 6 7 10
No of soilsamplesanalyzed
29,050 29,050 31,955 35,140 35,140 36,902
Programme 3: Agribusiness and Information ManagementOutcome: Increased agricultural production3.1Agribusiness andMarketDevelopment
CropsResources,Agribusiness andMarketingDevelopment
MarketpricesPublishedin dailynewspapers
No. of MarketInformationSystemsestablished.
1 1 1 1 1 1
NationalAcceleratedAgriculturalInputsAccessProgramme(NAAIAP)
access toaffordableagriculturalinputsenhanced
No. ofresource poorsmall scalefarmersaccessingaffordableinputs
11,300 0 9,500 90,000 97,000 97,500
Increase thenumber ofproducersaccessingfinancialservicesincludinginsuranceschemes
No. ofproducersaccessingcredit andfinancialeducation
20,000 2,394 20,000 20,000 20,000 20,000
3.2AgriculturalInformation and
AgriculturalinformationResource
Agriculturalmarketinginformationservices
No. of radioprogrammesaired
52 0 52 52 52 52
No. ofagricultural
5 1 5 5 5 5

39
Programme
DeliveryUnit
KeyOutputs
KeyPerformance
Indicators
Target ActualAchieve
ment
Baseline
Target
2014/15 2014/15 2015/16 2016/17 2017/18 2018/19Management
Centre videoprogrammesdevelopedNo. ofagriculturalbookspublished
5 4 6 6 6 6
Programme 4: Livestock Resources Management and DevelopmentOutcome: Improved perfomance of the livestock industrySP 4.1Livestock PolicyDevelopmentandCapacityBuilding
FinanceandProcurementServices
FinancialManagement enhanced
Financialmanagementimproved
%budgetutilization
100 93 100 100 100
HeadquartersAdministrativeTechnicalServices
Enhancedfoodsecurity
Tonnage ofbeef marketedlocally andexported(MT)
0 0 6,500 11,000 11,000 11,000
MT of cannedbeef instrategic foodreserves
0 0 2,000 3,000 4,000 4,000
Bull stationin the NorthRiftestablished
% Completion 10 10 50 80 100 0
DevelopmentPlanningServices
Project andprogrammemanagement improved
No. of M & Ereports
4 4 4 4 4 4
LivestockResources andMarketDevelopmentServices
LivestockDevelopment andMarketingServicesimproved
No. of policiesand strategiesdeveloped
4 4 2 2 3 4
No. of milkcoolerscommissionedalong the milkcorridors
8 8 15 10 10 10
RegionalPastoralResourceCentres
Humanresourcedevelopment forincreasedlivestockproductivityandmarketing
No of 1100 1100 1050 1150 1300 1300stakeholderstrained
DairyTrainingSchool
No. of skilledmanpowerproduced
120 120 150 150 150 150
LivestockTechnicalAdvisoryServices
No oftechnicalguidelines andstandardsdeveloped anddisseminated
2 2 3 3 3 3
ProjectDevelopment
Projectdevelopment and
No. of projectproposalsdeveloped
1 1 2 2 2 2

40
Programme
DeliveryUnit
KeyOutputs
KeyPerformance
Indicators
Target ActualAchieve
ment
Baseline
Target
2014/15 2014/15 2015/16 2016/17 2017/18 2018/19Monitoring andEvaluation
planningServicesimproved
VeterinaryHeadquarters
An enablingenvironment fordevelopment of thelivestockindustrycreated
No. ofpolicies,legislationsguidelines andStrategiesreviewed anddeveloped
4 4 3 3 3 3
No of annualinspectionsand licensingdone
6 6 6 6 6 6
No offacilitiesinspected andlicensed
400 400 500 500 500 500
% ofqualifiedanimal healthgraduatesregistered
100 100 100 100 100 100
No. of animalhealth internsengaged
0 0 95 950 950 950
AHITI Graduatesin AnimalHealthtrained
No. of Skilledmanpowerproduced inlivestocktraininginstitutions
450 450 450 550 650 650
MeatTrainingSchool
MeatInspectorstrained
No. of MeatInspectorstrained
60 60 60 100 150 150
4.2LivestockProduction andManagement
SheepandGoatsBreedingFarms
Qualitylivestockbreedingstock andgeneticmaterialsproducedand availedto farmersLivestockBreedingservicesimproved
No. of qualitysheep andgoats availedtostakeholders
400 400 400 450 500 600
BreedingandLivestockResearchfarm
No of qualitycattle stockbreed availedtostakeholders
130 130 200 200 200 250
AnimalResourceDevelopmentServices
No. of qualitybreedingrabbits availedtostakeholders
500 500 600 700 800 1,000
RangeEcosystemsDevelopment
Improvedproductivityin therangelands
No. ofstrategic stockroutesdeveloped
2 2 3 3 3 3
% completion 0 0 0 60 100 0

41
Programme
DeliveryUnit
KeyOutputs
KeyPerformance
Indicators
Target ActualAchieve
ment
Baseline
Target
2014/15 2014/15 2015/16 2016/17 2017/18 2018/19Services of Beef
industry MaterplanNo. OfGuidelines forRangelivestockgrazingdeveloped
0 0 1 2 2 2
Apiculture andEmergingLivestockServices
Improvedapicultureproductivity
No. ofapiculture andemerginglivestockguidelines
1 1 2 2 2 2
No of bee-bulking sitesestablishedandmaintained
2 2 3 3 5 5
AnimalBreedingandReproductiveregulatoryServices
LivestockBreedingservicesimproved
No. of semenstrawsproduced andavailed tofarmers(millions)
1.2 1.2 1.2 1.6 2.0 2.0
No ofStakeholderstrained inmodernbreedingtechnologies
1,500 1,563 550 550 550 600
No of semendistributionpremises andembryoproductionfacilitiesinspected andlicensed
0 0 14 14 14 14
% of importedsemen testedfor qualityassurance
100 100 100 100 100 100
Smallholder DairyCommercialization
Economicempowerment ofsmallholderdairyoperators
Volume ofmilk bulkedand sold (million litres)
20 20 25 30 35 40
No. ofvulnerablegroupssupportedwith dairygoats
46 55 57 63 0 0
MainstreamingSustainable Land
Degradedrangelandsreseeded inASALs
Hectare ofland reseededin pastoral andagro pastoral
2,172 2,172 2,500 3000 3,500 4,000

42
Programme
DeliveryUnit
KeyOutputs
KeyPerformance
Indicators
Target ActualAchieve
ment
Baseline
Target
2014/15 2014/15 2015/16 2016/17 2017/18 2018/19Management(SLM) inagro-pastoralproductionsystem
areas
4.3LivestockProductsValueadditionandMarketing
LivestockResourceandMarketDevelopmentServices
Quality ofdairyproducts inthe marketImproved
No of milkhandlingpremisesinspected
4,500 4,750 8,640 9,300 10,000 10,000
Foodsecurityimproved
MT of milkpowder instrategic foodreserves
0 0 4,000 22,000 22,000 22,000
Livestock MarketandAgribusinessDevelopmentServices
Livestockproductionandmarketingservices
% increase intrade volumein Livestockand livestockproducts
7 7 7 8 8 10
LivestockInsuranceSchemeexpanded
No of TropicalLivestockUnits insured
5,000 5,000 47,500 50,000 100,000 200,000
RegionalPastoralLivelihoodResilience Project(RPLRP)
Marketingof livestockandlivestockproductsimproved inASALs
% increase innumber ofanimals tradedin ASAL
0 0 2 2 2 2
Veterinary publichealth,hides andskins andleatherqualitycontrol
Quality ofHides,Skins andLeatherproductsimproved
% completionof Institute ofLeatherScience
3 3 10 50 75 100
4.4 FoodSafetyandAnimalProductsDevelopment
NationalBeekeepingInstitute
Quality ofhoney andbeeproductsimproved
Number ofhoney samplesanalyzed
200 200 300 350 400 500
No ofstakeholderstrained on beekeeping
500 500 600 700 800 800
LivestockBreedingandLaboratoryService
Quality ofbreedingherdsimproved
No of herdsevaluated
10 10 12 12 12 12
Number ofMilk samplesanalyzed
5,600 6,200 7000 7500 7800 8000
Veterinary
Quality ofAnimal
% inspectionof input
100 100 100 100 100 100

43
Programme
DeliveryUnit
KeyOutputs
KeyPerformance
Indicators
Target ActualAchieve
ment
Baseline
Target
2014/15 2014/15 2015/16 2016/17 2017/18 2018/19Medicines&Immuno-BiologicalProductsControl
healthinputsimproved
outlets andserviceproviders
Standards MarketAccessSMAP
Marketaccess foranimal andanimalproductsenhanced
Number ofstandards andregulations onanimalproductsdeveloped
2 2 2 1 1 1
Number ofveterinarylaboratoriesrehabilitatedand equipped
1 1 9 9 9 9
4.5Livestock DiseaseManagementandControl
VeterinaryLaboratoryInvestigationServices
Incidencesof animaldiseasesreduced
No. ofsamplesanalyzed foranimaldiseases
60,000 60,891 65,000 65,000 65,000 65,000
VeterinaryDiagnostics andEfficacyTrialCentres
Efficacy ofanimalhealthproductscertified
% of animalheath inputstested
100 100 100 100 100 100
VectorRegulatory andZoologicalServices
Incidencesof vectorbornediseasereduced
No. ofsamplesanalyzed forpests andvectors
200 208 500 550 600 600
Number ofrisk maps onvectordiversity anddistributiondeveloped andreviewed
0 0 1 1 1 1
NationalAnimalDiseasestrategiesandPrograms
Animalhealthvaccinesproducedand availed
Doses ofvaccinesproduced foranimal diseasecontrol andexport(millions)
30 48 50 60 70 70
Foot andmouthdiseasenationalreferencelaborator
Incidencesof Foot andMouthdiseasereduced
No of samplesanalyzed forFoot andmouth disease
4,300 4,564 5,000 5,000 5,000 5,000

44
Programme
DeliveryUnit
KeyOutputs
KeyPerformance
Indicators
Target ActualAchieve
ment
Baseline
Target
2014/15 2014/15 2015/16 2016/17 2017/18 2018/19yDiseaseFreeZoneunit
DiseaseFree Zoneestablished
% completionof disease freezone facilitiesin Bachuma,Kurawa andMiritini
45 45 50 60 80 100
Ports ofEntryandBorderPostVeterinaryInspectionServices
Crossborder tradein livestockandlivestockproductsenhanced
No of ports ofentry and onestop borderpostsequipped
0 0 10 4 4 4
KenyaTse-TseandTrypanosomiasisEradicationCouncil
Tsetse flycontrolled
Number ofbelts targetedfor tsetseeradication
5 5 5 5 5 5
Programme 5. Fisheries Development and ManagementOutcome: Food Security5.1Fisheriespolicystrategyandcapacitybuilding
Headquarters andAdministrativeservices
NationalOceans andFisheriesandNationalAquaculturePoliciesrevised
% of NationalOceans andFisheriesPolicyreviewed
0 0 40 100 0 0
FisheriesManagementPlandeveloped
Numberofmanagementplans
2 2
Regulationstooperationilize FisheriesManagement andDevelopment Act of2015developed
No. ofregulationsdeveloped
0 0 0 3 2 1
5.2AquacultureDevelopment
AquacultureTechnologyDevelopment
Innovationsandtechnologies promoted
Number ofaquacultureinnovationsandtechnologiespromoted
1 1 1 2 2 2
Intensivefishproductiontechnologie
Number ofintensiveproductiontechnologies
1 1 1 2 2 2

45
Programme
DeliveryUnit
KeyOutputs
KeyPerformance
Indicators
Target ActualAchieve
ment
Baseline
Target
2014/15 2014/15 2015/16 2016/17 2017/18 2018/19s systemspromoted
systemspromoted
Nationalcold water,warm waterandmariculturegene bankdeveloped
Number ofgene banksdeveloped
1 0 1 3 4 0
Fishquarantinefacilitydeveloped
Number ofquarantinefacilities
1 0 0 2 2 0
Fish diseasemanagement systemdeveloped
Number ofdiseasemanagementsystems
1 0 0 1 1 1
Fish seedand feedstandardsdeveloped
Number offish seedstandards
2 2 0 2 2 3
Number offish feedstandards
1 1 2 2 2 2
StandardOperatingProceduresforhatcheriesdeveloped
Number ofstandardOperatingProcedure s
1 1 0 3 1 1
Hatcheriesauthenticated
Number ofhatcheriesauthenticated
100 120 100 20 20 20
Newbreeds/strains fortilapia,Labeo,catfish, Nileperch,freshwatereel andcommoncarpdeveloped
Number offish cultureBreeds/strains
1 2 1 2 2 2
New breedsand strainsformariculturespeciesdeveloped
Number ofmariculturebreeds andstrains
1 0 0 2 2 2
Mariculturedevelopment andInternational Nile PerchCentresestablished
Percentage ofcompletion
10 0 0 20 70 100
Percentage ofcompletion
10 0 0 20 70 100

46
Programme
DeliveryUnit
KeyOutputs
KeyPerformance
Indicators
Target ActualAchieve
ment
Baseline
Target
2014/15 2014/15 2015/16 2016/17 2017/18 2018/19Level of Percapita fishconsumption increased
No of Kgs offish consumedper person peryear
3 3.75 8 10 12 17
FarmedFish andFishProductsDevelopment andMarketingOutlets
Number offish marketingoutlets
10 0 10 10 10 10
5.3ManagementandDevelopment ofCaptureFisheries
DMCand DIR
Trainedtechnicalofficers onnavigationandMonitoring,Control andsurveillance(MCS)capability
No. ofFisheriesManagerstrained
N/A N/A 30 30 N/A N/A
Fisheriessurveillancecapabilitybyacquisitionof OffshorePatrolVessel(OPV),MCSCommandCentre andVesselMonitoringSystem(VMS)established
% completionofconstructionof theOffshorePatrol Vessel
Kelllayingand50%hullcompletion
Kelllayingand50%hullcompletion
100%hullcompletion
Superstructureandhelideck
Launching andex-yarddelivering ofthevessel
Maintenance
Maintenanceandinsurance
Number ofoffshorepatrols andinspections
0 0 1 4 4 4
Number ofinshorepatrols forcoastal fisherywaters
0 0 100 100 120 140
Number ofportsinspected
6 8 6 8 10 12
UpgradedVesselMonitoringSystem(VMS)
0 0 0 1 0 0
Fleetmanagement plan anddomesticfishingfleet/companydeveloped
Number oflocally ownedmulti-dayfishing craftstargetingpelagicoffshore
0 0 0 5 25 25

47
Programme
DeliveryUnit
KeyOutputs
KeyPerformance
Indicators
Target ActualAchieve
ment
Baseline
Target
2014/15 2014/15 2015/16 2016/17 2017/18 2018/19resourcesNumber ofJointventures/leaseagreementsbetweenprivate foreignvessels andlocal fishingcompanies
0 0 0 5 10 10
Optimalmanagement objectiveforsustainablemarineresourceutilizationdeveloped
Number ofquarterlycatchassessments
4 4 4 4 4 4
Number offrame surveysconducted formarine andfresh water
1 1 0 2 1 1
TradablePermitScheme(TPS)developed
Number ofartisanalfishinglicensesgranted
2,100 2,100 2,150 2,150 2,200 2,540
Fish portinfrastructure at Lamu,promoted
Percentageproportion ofLamu fish portcompleted
0 0 5 10 15 20
Number ofincentiveschemestargeted tosupportlandings inMombasa Port
0 0 0 1 1 1
Fish stocksin waterbodiesenhanced
Number ofwater bodiesrestocked
5 20 20 20 20
DevelopedManagement Plans forInlandwatersystems
Number ofmanagementplansdeveloped
0 0 0 1 1 1
Strengthened thecapacity ofBeachManagement Units rolein Co-management
Number oftrained BMUsin selectedBMU modulesbased oncapacity needsassessment
20 10 24 9 9 9

48
Programme
DeliveryUnit
KeyOutputs
KeyPerformance
Indicators
Target ActualAchieve
ment
Baseline
Target
2014/15 2014/15 2015/16 2016/17 2017/18 2018/19Coordinatedimplementation of aFisheriesManagement Plan forLakeTurkana
reports N/A N/A N/A N/A 1 1
5.4Assurance of FishSafety,Valueadditionandmarketing
FIQAandDVAM
Fish andfisheryproductscertified
Percentage ofFish andfisheryproductscertified
100 100 100 100 100 100
NationalandInternational fish safetycomplied
Number ofauditinspectionsconducted
10 14 14 36 36 36
Fish qualitycontrollaboratoriesestablished
% completionof 3laboratories
- - 30 55 80 100
Fish post-harvestlossesreduced
No of fishstakeholderstrainings onfish handlingandprocessing
2 0 0 2 2 2
Countypersonneltrained onadoption ofvalueadditiontechnologies
Number ofcountytechnicalofficerstrained
N/A N/A 47 47 47 47
Number ofPPPpromotionscarried out
N/A N/A 4 4 4 4
Fishmarketingstrategydeveloped
% of FishMarketingstrategy
N/A N/A 0 20 45 100
Regionalandinternational trade inFish andfisheryproductaccess
Number ofnew Marketsaccessed
N/A N/A 1 1 1 1
5.5MarineandFisheriesResearch
KMFRI Feeds fordifferentspecies andstages offishformulated
Number ofnew diets forgrow-out andlarval stagesof fishdeveloped
4 4 4 4 5 6
National Number of 2 2 2 2 2 2

49
Programme
DeliveryUnit
KeyOutputs
KeyPerformance
Indicators
Target ActualAchieve
ment
Baseline
Target
2014/15 2014/15 2015/16 2016/17 2017/18 2018/19fish seedcertificationstandardsdeveloped
seedcertificationstandardsdeveloped
Breedingand fishinggroundsestablished
Number ofGIS maps offishing andbreedinggrounds
4 4 5 5 6 6
Annualsuperiortide tablesproduced
Number ofannualsuperior tidetablesproduced foruse in sea-basedactivities
50 50 100 120 130 140
ElectronicFish MarketInformationSystemdeveloped
Number offish landingbeachesreportingthrough theplatform
30 30 50 70 100 120
Programme 6: Land Policy and PlanningOutcome: Improved land management for sustainable development6.1:Modernization oflandregistries
Lands Secured andaccessibleland records
No. of landregistriesconstructed
NA NA 7 7 5 5
No. of landregistriesrehabilitated
10 8 12 14 12 10
No. of landregistriesdigitized
10 13 10 13 10 10
6.2:LandSurvey
SecuredNationalandInternationalBoundaries
Kms ofboundarymaintained
200 290 300 310 300 300
GeospatialDatabase(Cadastralandtopographical)
% of Cadastraldatabasedeveloped
10 5 15 35 65 100
6.3:LandUse
Optimalutilizationof land
%. of NationalSpatial Planprepared
15 15 5 0 0 0
No. ofregionalphysicaldevelopmentplans prepared
6 6 6 7 8 9
Countiesprovided
No. ofcounties
5 5 15 13 9 5

50
Programme
DeliveryUnit
KeyOutputs
KeyPerformance
Indicators
Target ActualAchieve
ment
Baseline
Target
2014/15 2014/15 2015/16 2016/17 2017/18 2018/19withtechnicalsupport inphysicalplanning
supported
6.4:LandSettlement
Adjudication andsettlementparcelsfinalized forregistration
No. ofAdjudicationand settlementparcelsfinalized
400,000 220,022 400,000 400,000 450,000 450,000
NationalLand TitleRegisterestablished
No. of titledeeds issued
1.5Million
1.2Million
1Million
1.1Million
1.2Million
1.4Million
No. of plotsGeo-referenced onthe nationalmap
250,000 280,000 300,000 350,000 380,000 400,000
Programme 7: Housing Development and Human SettlementOutcome: Increased access to affordable and decent housing as well as enhanced estates management services andtenancy relations.7.1:HousingDevelopment
Housing Housingunits
% completionof 462housing unitsunderSustainableNeighbourhood Project(SNP) inMavoko
70 64 80 100 0 0
% completionof SowetoEast-Zone “B”at Kibera,Nairobi byconstructing2,000 housingunits
- - 15 55 85 100
% completionof Mariguiniinformalsettlement,South BNairobi byconstructing1,500 housingunits
- - 15 55 85 100
NationalSlum andInformalSettlementsDatabase
% of databasedeveloped
10 10 50 70 85 100
NationalSlumUpgradingandPrevention
% of policycompleted
80 80 90 100 0 0

51
Programme
DeliveryUnit
KeyOutputs
KeyPerformance
Indicators
Target ActualAchieve
ment
Baseline
Target
2014/15 2014/15 2015/16 2016/17 2017/18 2018/19PolicySocial andphysicalinfrastructure facilitiesin urbanareas
No. of highmastfloodlightsinstalled
23 23 65 40 40 40
No. ofmarketsconstructed
1 0 1 2 2 2
% of 33km.Of sewer linecompleted inIsiolo,Bungoma andother slumsand informalsettlements
- - 40 60 80 100
No. of kms ofaccess roadscompleted inslum areas
- - 2 6 6 6
No. of schoolscompleted invarious slumsand informalsettlements
- - - 2 2 2
No. of kms offootpathupgraded topavedstandards
- - 1.5 1.5 - -
CivilServantsHousingScheme
Housingunits
% completionof 250housing unitsdeveloped inShauri Moyo,Kisumu
- - 50 100 - -
No. ofbeneficiariesgranted withloans topurchase/construct houses
250 259 250 250 250 250
% completionof 920housing unitsdeveloped inMachakos(250), Embu(200), Kiambu(300) andNyeri (170)
- - 20 70 100 -
% completionof790 housingunitsdeveloped inKakamega(170), Isiolo
- - 30 80 100 -

52
Programme
DeliveryUnit
KeyOutputs
KeyPerformance
Indicators
Target ActualAchieve
ment
Baseline
Target
2014/15 2014/15 2015/16 2016/17 2017/18 2018/19(170),Nakuru(250)and Lamu(200)% completionof 650housing unitsdeveloped inThika(200),Bungoma (200)andEldoret(250)
- - - - 30 80
% completionof 540housing unitsdeveloped inNanyuki(200),Ngong(170) andKilifi(170)
- - - - - 30
% completionof 10,000housing unitsdevelopedunder PPP inPark Road,Starehe andShauri MoyoNairobi
- - 20 55 90 100
% completionof 1,050housing unitsdevelopedunder PPPin Hobley,Mombasa(300) andMugugaGreen,Nairobi (450)and Kisumu(300)
- - - 60 80 100
Housing Housinginfrastructure facilitiesinstalled toopen upnew areasfor housingdevelopment
No. of kms ofsewer lineconstructed
5 6 9.2 3.5 2 2
No. of kms ofaccess roadsconstructed
65 53.7 32 53 53 53
Establishedsub-regionaland sub-countyABTcentres
No. of ABTcentresestablished
- - 10 12 14 16
% completionof Phase II ofRegional ABTcentre at
- - 40 60 80 100

53
Programme
DeliveryUnit
KeyOutputs
KeyPerformance
Indicators
Target ActualAchieve
ment
Baseline
Target
2014/15 2014/15 2015/16 2016/17 2017/18 2018/19Mavokoconstructed
NationalandInternational housingand humansettlementCoordinated
No. ofengagementsfora
6 6 6 9 7 6
KenyaInformalSettlementsImprovementProject(KISIP)
Pipedhouseholdwaterconnections
No. of pipedhouseholdwaterconnections
2,000 5,700 1,620 - - -
Sewer lineconstructed
No. of Kms.of sewer lineconstructed
25 28.59 5.25 5.08 - -
Accessroadsconstructed
No. of Kms.of accessroads
55 35.5 12.5 26 50.3 -
Streetsecuritylightsinstalled
No. of highmast lightsinstalled
21 21 30 53 16 -
Ablutionblocksconstructed
No. ofablutionblocksconstructed
15 15 36 4 - -
7.2:EstateManagement
Estates Housing forNationalPolice andKenyaPrisonServices
% completionof 80,000housing unitsconstructed
- - 40 60 80 100
60-storeyoffice blockconstructed
% completionof the block
- - 5 40 50 60
TelepostaHouse inNairobiacquired
Purchase ofthe building
- - - 1 - -
Refurbishedgovernmenthouses
No. of poolhousingrenovated inState Houseand statelodges
- - 2 3 2 2
No. ofgovernmenthousesrefurbished
600 484 600 1,800 1,800 1,800
Programme 8: Government BuildingsOutcome: Improved working conditions in Government buildings8.1:Stalledand newGovernment
PublicWorks
Government buildingscompleted/rehabilitated
No. of stalledbuildingscompleted
4 Nyamira PoliceDivisionalHeadqu
4 10 10 9
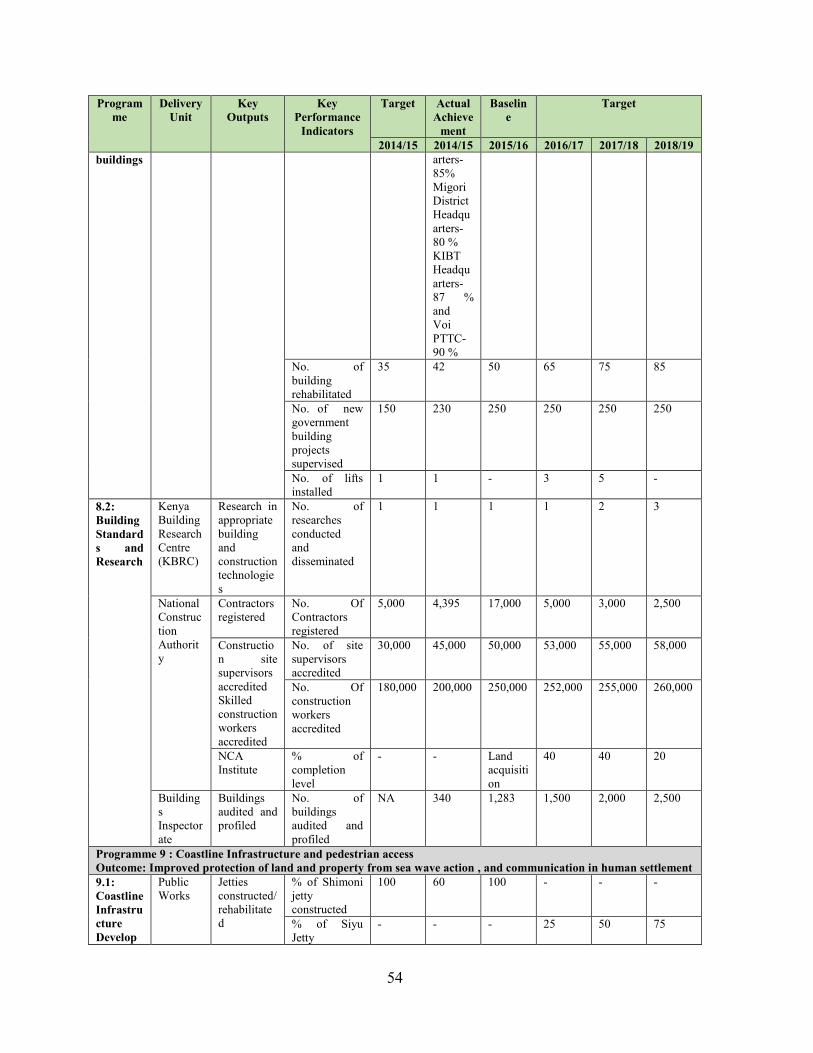
54
Programme
DeliveryUnit
KeyOutputs
KeyPerformance
Indicators
Target ActualAchieve
ment
Baseline
Target
2014/15 2014/15 2015/16 2016/17 2017/18 2018/19buildings arters-
85%MigoriDistrictHeadquarters-80 %KIBTHeadquarters-87 %andVoiPTTC-90 %
No. ofbuildingrehabilitated
35 42 50 65 75 85
No. of newgovernmentbuildingprojectssupervised
150 230 250 250 250 250
No. of liftsinstalled
1 1 - 3 5 -
8.2:BuildingStandards andResearch
KenyaBuildingResearchCentre(KBRC)
Research inappropriatebuildingandconstructiontechnologies
No. ofresearchesconductedanddisseminated
1 1 1 1 2 3
NationalConstructionAuthority
Contractorsregistered
No. OfContractorsregistered
5,000 4,395 17,000 5,000 3,000 2,500
Construction sitesupervisorsaccreditedSkilledconstructionworkersaccredited
No. of sitesupervisorsaccredited
30,000 45,000 50,000 53,000 55,000 58,000
No. Ofconstructionworkersaccredited
180,000 200,000 250,000 252,000 255,000 260,000
NCAInstitute
% ofcompletionlevel
- - Landacquisition
40 40 20
BuildingsInspectorate
Buildingsaudited andprofiled
No. ofbuildingsaudited andprofiled
NA 340 1,283 1,500 2,000 2,500
Programme 9 : Coastline Infrastructure and pedestrian accessOutcome: Improved protection of land and property from sea wave action , and communication in human settlement9.1:CoastlineInfrastructureDevelop
PublicWorks
Jettiesconstructed/rehabilitated
% of Shimonijettyconstructed
100 60 100 - - -
% of SiyuJetty
- - - 25 50 75

55
Programme
DeliveryUnit
KeyOutputs
KeyPerformance
Indicators
Target ActualAchieve
ment
Baseline
Target
2014/15 2014/15 2015/16 2016/17 2017/18 2018/19ment constructed
% MokoweJettyrehabilitation
- - - - 25 50
Seawallsconstructedandrehabilitated
Meters ofseawallconstructed/rehabilitated inNdau,Mbwajumwali, Pate andMkokoni
500 0 500 1,400 1,400 1,500
RiverProtectionWorks
% ofcompletionalong RiverSuam
Complete PhaseI
Phase Icompleted
10 25 75 100
9.2Pedestrian access
PublicWorks
Footbridges No. offootbridgescompleted
18 18 21 25 10 0
Programme 10: Urban and Metropolitan DevelopmentOutcome: Improved access to physical and social infrastructure in urban areas10.1:UrbanDevelopmentandplanningservices
UrbanDevelopment
Social andphysicalinfrastructure facilitiesin urbanareas
No. ofbus/lorryparkscompleted
8 6 6 5 4 4
Kms of accessroads/missinglinkscompleted
4 4 5 5 5 4
Kms of stormwater drainagecompleted
7 7 20 24 24 30
No. of solidwastemanagementsitescompleted
1 0 2 2 2 2
No. of stadiacompleted
1 1 1 2 2 1
No. of socialhallscompleted
1 1 1 1 1 1
No. ofmarkets (ESP,market hubsandwholesale)completed
90 90 73 6 5 5
No. ofPrimary andSecondaryschools inpoor urbanAreasconstructed
2 3 3 6 5 0
Support indevelopmen
No. of Designand standards
0 0 0 6 3 3

56
Programme
DeliveryUnit
KeyOutputs
KeyPerformance
Indicators
Target ActualAchieve
ment
Baseline
Target
2014/15 2014/15 2015/16 2016/17 2017/18 2018/19t of urbanservice andinfrastructure standard s
manualsdeveloped
Urbanwater ways
Kms ofurbanwaterwaysdeveloped
0 0 0 5 6 6
Dispensariesconstructed
No. ofdispensariesconstructed
10
1 0 0 1
UrbanSafety anddisasterpreparedness
No. of HighMast lightsinstalled
15
15
15
15 15 15
% of UrbanSafety Policydeveloped
10 0 10 60 100 -
No of Urbanrisk andhazard areasprofiled
2 0 2 10 10 10
No. Of firestationsupgraded
0 0 3 2 1 0
NationalUrbanPolicy(NUP)
% Policydeveloped
80 80 90 100 - -
Prepare billforamendment(Urban Areasand CitiesAct) andRegulations
% of amendedbill
- - 80 90 100 -
Profiled andclassifiedUrban areas
No. of Urbanareas profiledand classified
- - 0 2,000 2,000 0
Investmentzoning
No. ofinvestmentzonesdesignatedand planned
- - - 4 4 4
PlannedUrbanAreas
No. of UrbanAreasStrategicEnvironmentalAssessment(SEA)conducted
- - 5 10 20 20
No. ofIntegratedStrategicUrban Plansdeveloped
27 7 20 9 9 9
Setting upof Urban
% ofobservatory
- - 20 50 70 100
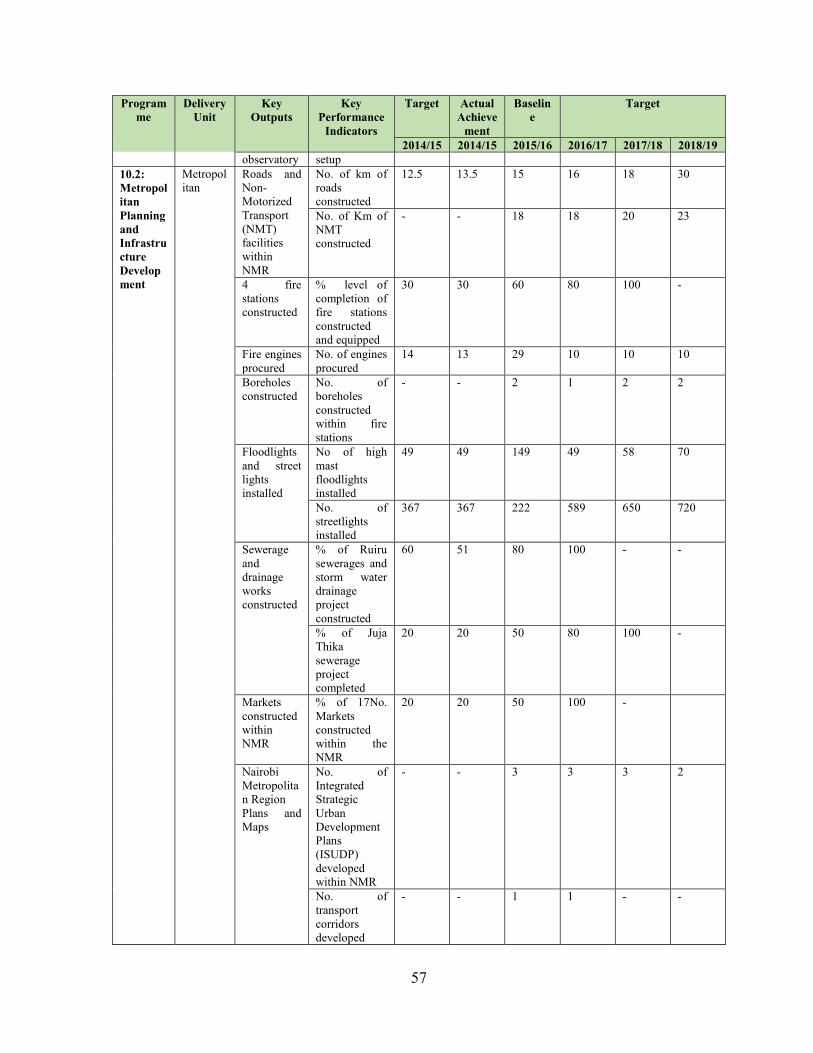
57
Programme
DeliveryUnit
KeyOutputs
KeyPerformance
Indicators
Target ActualAchieve
ment
Baseline
Target
2014/15 2014/15 2015/16 2016/17 2017/18 2018/19observatory setup
10.2:MetropolitanPlanningandInfrastructureDevelopment
Metropolitan
Roads andNon-MotorizedTransport(NMT)facilitieswithinNMR
No. of km ofroadsconstructed
12.5 13.5 15 16 18 30
No. of Km ofNMTconstructed
- - 18 18 20 23
4 firestationsconstructed
% level ofcompletion offire stationsconstructedand equipped
30 30 60 80 100 -
Fire enginesprocured
No. of enginesprocured
14 13 29 10 10 10
Boreholesconstructed
No. ofboreholesconstructedwithin firestations
- - 2 1 2 2
Floodlightsand streetlightsinstalled
No of highmastfloodlightsinstalled
49 49 149 49 58 70
No. ofstreetlightsinstalled
367 367 222 589 650 720
Sewerageanddrainageworksconstructed
% of Ruirusewerages andstorm waterdrainageprojectconstructed
60 51 80 100 - -
% of JujaThikasewerageprojectcompleted
20 20 50 80 100 -
MarketsconstructedwithinNMR
% of 17No.Marketsconstructedwithin theNMR
20 20 50 100 -
NairobiMetropolitan RegionPlans andMaps
No. ofIntegratedStrategicUrbanDevelopmentPlans(ISUDP)developedwithin NMR
- - 3 3 3 2
No. oftransportcorridorsdeveloped
- - 1 1 - -

58
Programme
DeliveryUnit
KeyOutputs
KeyPerformance
Indicators
Target ActualAchieve
ment
Baseline
Target
2014/15 2014/15 2015/16 2016/17 2017/18 2018/19within NMR% ofIntegratedStrategic Solidwasteinvestmentplansdeveloped
10 10 50 100 - -
Redeveloped NairobiEastlands.
% level ofurban renewalplandeveloped.
10 10 40 80 100 -
Land useandtransportanalysiswithin theNMR.
% of Reportoninterdisciplinary land useand transportmetropolitananalysis
10 10 50 100 - -
Physicaladdresssystem forNairobi,Thika andKiambuCBDs
% of Physicaladdresssystemdeveloped
30 30 60 80 100 -
RevenueEnhancement studiesforMachakos,Kiambuand Kajiado
% level of thereportdeveloped
10 10 50 100 - -
GIS andICT needsassessmentwithinNairobiMetropolitan Region.
No. of reportson GIS/ICTneedsassessmentreport for theNMR.
1 1 2 1 1 -
Metropolitan AreasPolicy andAct
% of Policyand Actdeveloped
50 50 90 100 - -
Programme 11: General Administration, Planning and Support Services (MLHUD)Outcome: Effective and efficient service delivery11.1:AdministrationandSupportServices
CentralAdministrativeServices
Monitoringandevaluation
No. ofQuarterlyreports
4 4 4 4 4 4
11.2:DevelopmentPlanningand
LandReformTransformationUnit
ReviewedLand Laws
No. of landlegislationsenacted
4 4 3 3 3 3
Land clinics No. of landclinics
2 4 4 4 4 4

59
Programme
DeliveryUnit
KeyOutputs
KeyPerformance
Indicators
Target ActualAchieve
ment
Baseline
Target
2014/15 2014/15 2015/16 2016/17 2017/18 2018/19LandReforms
conducted
11.3:Procurement,warehousing andsupply
SuppliesBranch
Rehabilitated facilitiesat SuppliesBranch,Nairobi andother depots
No. ofSuppliesBranchDepotsrehabilitated
1 1 1 2 2 2
Termcontractsfor thesupply ofcommonuser items
Number ofterm contractsawarded
45 45 45 45 45 45
Programme 12: Land Administration and ManagementObjective; Enhanced access and use of land for social economic and environmental sustainability12.1:LandAdministration,
LandAdministrationandmanagement.
Leases andgrantsPrepared
No. of grantsand leases.
5,000 200 6,000 4,500 4,000 3,500
Grants anddispositionsreviewed
No. of Grantsanddispositionsreviewed
3,000 1,500 2,500 2,500 2,000 2,000
Allotmentlettersverified
No. of verifiedallotmentletters
8,000 711 5,000 6,000 8,000 9,000
Rules andregulationsdeveloped
No. of rulesandregulationsdeveloped
4 2 2 3 3 3
12.2:Research,Advocacy andNaturalResourceoversight
ResearchLand useplanningNaturalresourcemanagement
Researchedanddisseminated landreportAndAdvocacyprogrammes
No. of landreports
4 5 9 12 15 18
No. ofAdvocacyprogrammesdeveloped anddisseminated
20 15 20 24 24 25
Land Useoversightframeworksdeveloped
No. offrameworksdeveloped
1 1 2 2 2 2
Land Useplans andnaturalresourcesoversightAdvisoryreports
No. of LandUse plans andnaturalresourcesoversightAdvisoryreports
20 7 20 25 30 35
NaturalResourceMaps
No. of naturalresource mapsand databasesdeveloped
8 2 9 10 10 10
12.3:Valuation,Taxation
Valuation andtaxation
CompulsoryAcquisitions
No. ofapplicationsfrom
35 28 40 45 56 75

60
Programme
DeliveryUnit
KeyOutputs
KeyPerformance
Indicators
Target ActualAchieve
ment
Baseline
Target
2014/15 2014/15 2015/16 2016/17 2017/18 2018/19andcompulsoryacquisition
acquiringbodiesprocessed
12.4:Oversight onLandUsePlanning
LandUsePlanning
-State ofLand UsePlanning inKenyaReport
No. of clusterreports
- - - 7 - -
12.5:Survey,adjudication andsettlement
Survey,Landadjudication andSettlementDirectorate
Adjudication sectionscompleted
No. ofAdjudicationsectionscompleted
20 30 40 40
Settlementschemescompleted
No. ofSettlementschemescompleted
10 14 17 21
Programme 13: National Land Information Management System (NLIMS)Outcome: Efficient Land information management system13.1:NLIMS
NLIMSDirectorate
NLIMS inPlace
% of systemdeveloped andimplemented
5 5 20 40 20 10
Programme 14: Land Disputes and Conflict ResolutionOutcome: Peaceful resolutions of complaints14.1:Conflictresolution andsecurelandtenure
Legal &EnforcementDirectorate, landadministrationdirectorate,Valuation andTaxation
Historicallandinjusticeregulationsand billdeveloped
No. of billsdeveloped
1 1 - - - -
ADRFrameworkdevelopedandimplemented
No. offrameworksdeveloped
2 2 0 0
No of casesresolvedthrough ADR
4,680 394 5,640 5,640 6,000 6,000
No. ofstakeholdergroups trainedon TDR andADR
8 - 10 12 10 15
ComplaintHandlingMechanismdevelopedandimplemented
% ofcomplaintcasesaddressed
15 20 25 30 34 40
Programme 15: General Administration, Planning and Support Services-NLCOutcome: Effective and Efficient Commission on execution of its mandate15.1: GeneralAdministration
Finance&Admin. ,HumanResource
EstablishedCLMB’s
No. ofCLMBsestablishedandoperational
47 39 8 - - -

61
Programme
DeliveryUnit
KeyOutputs
KeyPerformance
Indicators
Target ActualAchieve
ment
Baseline
Target
2014/15 2014/15 2015/16 2016/17 2017/18 2018/19, LandAdministration,ICTDirectorate
Monitoringandevaluationframework
M&Eframework
- - - 1 - -
M&E reports - - - 4 4 4
Audit andRiskManagement Reports
No. of Auditand RiskManagementReports
4 3 4 4 4 4
AutomatedNLCprocessesandprocedure
% ofprocessed andproceduresautomated
20 50 20 10 - -
3.1.3 Programmes by Order of RankingAll programmes for the sector are critical, inter-related and address aspects of Kenya Vision2030, the MTP II and sectoral mandates. The programmes were ranked as indicated in thetable below based on the following factors:
A. The findings of the Programme Performance Review for the on-going programmes.B. Linkage of the programme with the objectives of the Second Medium Term Plan of
Vision 2030.C. Linkage of the programme to the Jubilee administration flagship projects/interventions.D. Degree to which a programme addresses core poverty interventions.E. Degree to which the programme is addressing the core mandate of the MDA.F. Expected outputs and outcomes from a programme.G. Linkage of a programme with other programmes.H. Cost effectiveness and sustainability of the programme andI. Immediate response to the requirements and furtherance of the implementation of the
Constitution.
Programs by order of rankingRank Programmes Criteria Total
scoreNo. ofoutputs
AveragescoreA B C D E F G H I
1. Programme 3:Agribusiness andInformationManagement
3 3 3 3 3 3 3 3 3 27 3 9
2. Programme 13: NationalLand InformationManagement System(NLIMS)
1 1 1 1 1 1 1 1 1 9 1 9
3. Programme 4: LivestockResources Managementand Development
30 29 24 30 30 30 30 30 29 262 30 8.73
4. Programme 6: LandPolicy and Planning
7 7 3 7 7 7 7 7 7 59 7 8.42

62
Rank Programmes Criteria Totalscore
No. ofoutputs
AveragescoreA B C D E F G H I
5. Programme 1: GeneralAdministration,Planning and SupportServices-SDA
4 4 1 4 4 4 4 4 4 33 4 8.25
6. Programme 8:Government Buildings
7 6 6 1 7 7 7 7 7 55 7 7.85
7. Programme 9 : CoastlineInfrastructure andpedestrian access
4 4 0 4 3 4 4 4 4 31 4 7.75
8. Programme 15: GeneralAdministration,Planning and SupportServices-NLC
4 2 2 3 4 4 4 4 4 31 4 7.75
9. Programme 11: GeneralAdministration,Planning and SupportServices (MLHUD)
5 4 1 1 5 5 5 5 5 36 5 7.2
10. Programme 5. FisheriesDevelopment andManagement
31 29 19 31 30 31 31 31 31 264 37 7.13
11. Programme 12: LandAdministration andManagement
11 9 6 10 11 11 11 11 11 91 13 7
12. Programme 14: LandDisputes and ConflictResolution
3 0 0 3 3 3 3 3 3 21 3 7
13. Programme 2: CropDevelopment andManagement
14 11 10 14 13 14 14 14 14 118 17 6.94
14. Programme 7: HousingDevelopment andHuman Settlement
14 13 8 10 14 14 14 14 13 114 18 6.33
15. Programme 10: Urbanand MetropolitanDevelopment
24 21 4 13 12 24 24 24 24 170 28 6.07
3.2 Analysis of Resource Requirement versus allocation by SectorTo effectively deliver the strategic mandates of the sector, key interventions have beenidentified for implementation during 2016/17 - 2018/19 MTEF period. Outlined below areresource requirement and allocation:
3.2.1 Sector RecurrentThe Sector requires a total of Kshs.154.281 billion in the FY 2016/17 for its proposedprojects and programmes of which Kshs.38.629 billion is for recurrent vote andKShs.115.652 billion is for development vote. Tables 6a and 6b provide a summary of theresource requirements.

63
Table 9: Analysis of resource requirement versus allocation- RecurrentSector Name Economic
ClassificationBaseline2015/16
REQUIREMENT ALLOCATION
2016/17 2017/18 2018/19 2016/17 2017/18 2018/19
ARUDSECTOR
Gross 16,672 38,629 42,126 45,041 16,121 16,771 17,252AIA 466 66 66 66 66 66 66Net 16,206 38,563 42,060 44,975 16,055 16,705 17,186Compensation toEmployees 6,033 7,149 7,594 7,918 6,085 6,267 6,455Transfers 5,424 13,608 14,093 15,842 4,821 4,880 4,892Other Recurrent 5,215 17,872 20,439 21,281 5,215 5,624 5,905
3.2.2 Sector Development
Table 10: Analysis of Resource Requirement versus Allocation-DevelopmentSub-SectorName
EconomicClassification
Baseline REQUIREMENT ALLOCATION
2015/16 2016/17 2017/18 2018/19 2016/17 2017/18 2018/19
ARUDSECTOR
Gross 63,021 115,652 101,547 107,011 53,047 54,887 55,111GoK 34,202 87,152 79,525 87,828 24,228 26,068 26,292Loans 22,067 21,127 15,348 12,571 22,067 22,067 22,067Grants 6,215 6,836 6,137 6,075 6,215 6,215 6,215Local AIA 537 537 537 537 537 537 537
3.2.3 Analysis of resource requirement versus allocation by Sub-sector
Table 11: Analysis of recurrent resource requirement versus allocationSub-SectorName
EconomicClassification
BASELINE REQUIREMENT ALLOCATION
2015/16 2016/17 2017/18 2018/19 2016/17 2017/18 2018/19SDA Gross 8,315 23,773 24,158 25,852 7,608 7,761 7,857
AIA 429 29 29 29 29 29 29NET 7,886 23,745 24,129 25,823 7,579 7,732 7828Compensation toEmployees
1,078 1,042 1,073 1,105 982 1,010 1,041
Transfers 4,141 11,512 11,850 13,496 3,536 3,579 3,587Other Recurrent 3,096 11,219 11,235 11,251 3,090 3,172 3,229
SDL Gross 1,948 3,541 3,824 4,130 1,997 2,125 2,227AIA 24 24 24 24 24 24 24Net 1,924 3,517 3,800 4,106 1,973 2,101 2,203Compensation toEmployees
1,456 1,796 1,940 2,095 1,500 1,545 1,591
Transfers 62 434 468 506 64 65 65Other Recurrent 430 1,311 1,416 1,529 433 515 571

64
Sub-SectorName
EconomicClassification
BASELINE REQUIREMENT ALLOCATION
2015/16 2016/17 2017/18 2018/19 2016/17 2017/18 2018/19SDF Gross 1369 3,777 6,214 6,255 1,378 1,478 1,543
AIA 0 0 0 0 0 0 0Net 1369 3,777 6,214 6,255 1,378 1,478 1,543Compensation toEmployees
213 252 263 273 219 226 233
Transfers 997 1,354 1,439 1,467 997 1,009 1,011Other Recurrent 159 2,171 4,512 4,515 162 243 299
MoLHUD Gross 3,939 4,800 5,095 5,267 4,024 4,197 4,345A.I.A 13 13 13 13 13 13 13Net 3,926 4,788 5,082 5,254 4,011 4,184 4,332Compensation ofemployees
2,839 2,959 3,163 3,232 2,924 3,012 3,102
Transfers 224 308 336 373 224 227 229
Other Recurrent 876 1,533 1,596 1,663 876 958 1,014NLC Gross 1,101 2,738 2,835 3,537 1,114 1,210 1,280
AIA - - - - - - -
Net 1,101 2,738 2,835 3,537 1,114 1,210 1,280Compensation toEmployees
447 1,100 1,155 1,213 460 474 488
Transfers - - - - - - -Other Recurrent 654 1,638 1,680 2,324 654 736 792
Table 12: Analysis of Development resource requirement versus allocationSub-SectorName
EconomicClassification
Baseline Requirement Allocation
2015/16 2016/17 2017/18 2018/19 2016/17 2017/18 2018/19SDA Gross 26,153 25,535 26,335 25,089 17,505 17,739 17,539
GOK 15,640 14,585 15,115 13,489 6,992 7,226 7,026Loans 5,926 6,150 6,220 6,300 5,926 5,926 5,926Grants 4,587 4,800 5,000 5,300 4,587 4,587 4,587Local AIA - - - - - - -
SDL Gross 5,171 9,803 8,908 9,586 5,420 6,278 6,583GOK 2,879 8,066 7,397 8,140 3,128 3,986 4,291Loans 2,015 1,527 1,328 1,271 2,015 2,015 2,015Grants 277 210 183 175 277 277 277Local AIA - - - - - - -
SDF Gross 3,139 5,726 5,648 13,824 3,977 3,357 3,410GOK 1,125 4,627 4,814 11,410 1,963 1,343 1,396LOANS 1,724 0 0 0 1,724 1,724 1,724GRANTS 290 1,099 834 400 290 290 290LOCAL AIA - - - - - - -
MoLHUD Gross 28,119 67,503 57,251 53,964 25,279 26,457 26,478GOK 14,119 52,789 48,794 48,227 11,279 12,457 12,478Loans 12,401 13,450 7,800 5,000 12,401 12,401 12,401Grants 1,062 727 120 200 1,062 1,062 1,062Local AIA 537 537 537 537 537 537 537

65
Sub-SectorName
EconomicClassification
Baseline Requirement Allocation
2015/16 2016/17 2017/18 2018/19 2016/17 2017/18 2018/19NLC Gross 439 7,085 3,405 4,548 866 1,056 1,101
GoK 439 7,085 3,405 4,548 866 1,056 1,101Loans - - - - - - -Grants - - - - - - -Local AIA - - - - - - -
3.2.4 Programmes and sub-programmes resource requirements
Table 13: Analysis of programme expenditure resource requirement (Kshs. Millions)Programme 2016/17 2017/18 2018/19
Current Capital Total Current Capital Total Current Capital Total
Programme 1: General Administration, Planning and Support Services
SP1.1Development/Review ofAgriculturalPolicy, Legaland RegulatoryFrameworks
5,334 4,573 9,907 6,133 5,540 11,673 7,615 4,301 11,916
SP1.2AgriculturalPlanning andFinancialManagement
72 20 92 46 30 76 49 - 49
TotalProgramme 1
5,406 4,593 9,999 6,179 5,570 11,749 7,664 4,301 11,965
Programme 2: Crop Development and Management
SP2.1 -LandAnd CropsDevelopment
372 5,171 5,543 319 5,149 5,468 332 5,283 5,615
SP 2.2 FoodSecurityInitiatives
10,796 10,621 21,417
10,781 10,659 21,440 10,82 10,540 21,322
SP 2.3 -AgricultureExtensionServices
1,322 1,927 3,249 1,305 1,714 3,019 1,339 1,989 3,328
SP 2.4 -AgriculturalResearch
5,645 1,291 6,936 5,351 1,291 6,642 5,511 991 6,502
TotalProgramme 2
18,135 19,010 37,145 17,756 18,813 36,569 17,964 18,803 36,767

66
Programme 2016/17 2017/18 2018/19
Current Capital Total Current Capital Total Current Capital Total
Programme 3: Agribusiness and Information Management
SP 3.1-Agribusinessand MarketDevelopment
182 1,917 2,099 172 1,937 2,109 172 1,970 2,142
SP 3.2AgriculturalInformationManagement
50 15 65 51 15 66 52 15 67
TotalProgramme 3
232 1,932 2,164 223 1,952 2,175 224 1,985 2,209
Total Vote 23,773 25,535 49,308 24,158 26,335 50,493 25,852 25,089 50,941
Programme 4: Livestock Resources Management and Development
SP4.1:LivestockPolicyDevelopmentand capacitybuildingProgramme
1,868 1,702 3,570 1,517 1,093 2,610 1,679 1,300 2,979
SP 4.2:LivestockProduction andManagement
331 1,032 1,363 357 759 1,116 386 787 1,173
SP 4.3:LivestockProducts ValueAddition andMarketing
506 3,276 3,782 546 3,366 4,007 1,639 2,928 4,567
SP 4.4: FoodSafety andAnimalProductsDevelopment
457 739 1,196 494 798 1,292 533 862 1,395
SP 4.5:LivestockDiseaseManagementand Control
379 3,054 3,433 409 3,298 3,708 442 3,560 4,002
Totalprogramme 4
3,541 9,803 13,344
3,824 8,908 12,732 4,130 9,586 13,716
Total Vote1162
3,541 9,803 13,344
3,824 8,908 12,732 4,130 9,586 13,716
Programme 5: Fisheries Development and Management

67
Programme 2016/17 2017/18 2018/19
Current Capital Total Current Capital Total Current Capital Total
SP 5.1:Fisheries policy,Strategy andcapacitybuilding
978 500 1,478 1,767 700 2,467 1,707 1,045 2,752
SP 5.2:AquacultureDevelopment
435 1180 1615 447 1180 1,627 469 915 1384
SP 5.3:ManagementandDevelopment ofCaptureFisheries
857 883 1740 2,379 870 3249 2,399 9,400 11799
SP 5.4:Assurance ofFish Safety,Value additionand Marketing
158 1,050 1,208 187 1,050 1,237 218 1,050 1,268
SP 5.5: Marineand FisheriesResearch
1,349 2,113 3,462 1,434 1,848 3,282 1,462 1,414 2,876
TotalProgramme 5
3,777 5,726 9,503 6,214 5,648 11,862 6,255 13,824 20,079
Programme 6: Land Policy and Planning
SP 6.1:DevelopmentPlanning andland Reforms
457 586 1,043 550 590 1,140 505 595 1,100
SP 6.2:Modernizationof LandRegistries
732 990 1,722 769 1,060 1,829 806 1,080 1,886
SP 6.3: LandSurvey
799 4,800 5,599 855 3,893 4,748 886 2060 2,946
SP 6.4: LandUse
231 200 431 208 210 418 217 215 432
SP 6.5: LandAdjudication
529 1,930 2,459 553 940 1,493 579 940 1,519
TotalProgramme 6
2,748 8,506 11,253 2,935 6,693 9,628 2,993 4,890 7,883
Programme 7: Housing Development and Human Settlement
SP 7.1: HousingDevelopment
161 12,405 12,565 166.7 9861 10,028 174 8893 9,066
SP 7.2: EstateManagement
394 9,175 9,570 419.4 5,100 5,519 444 4,900 5,345
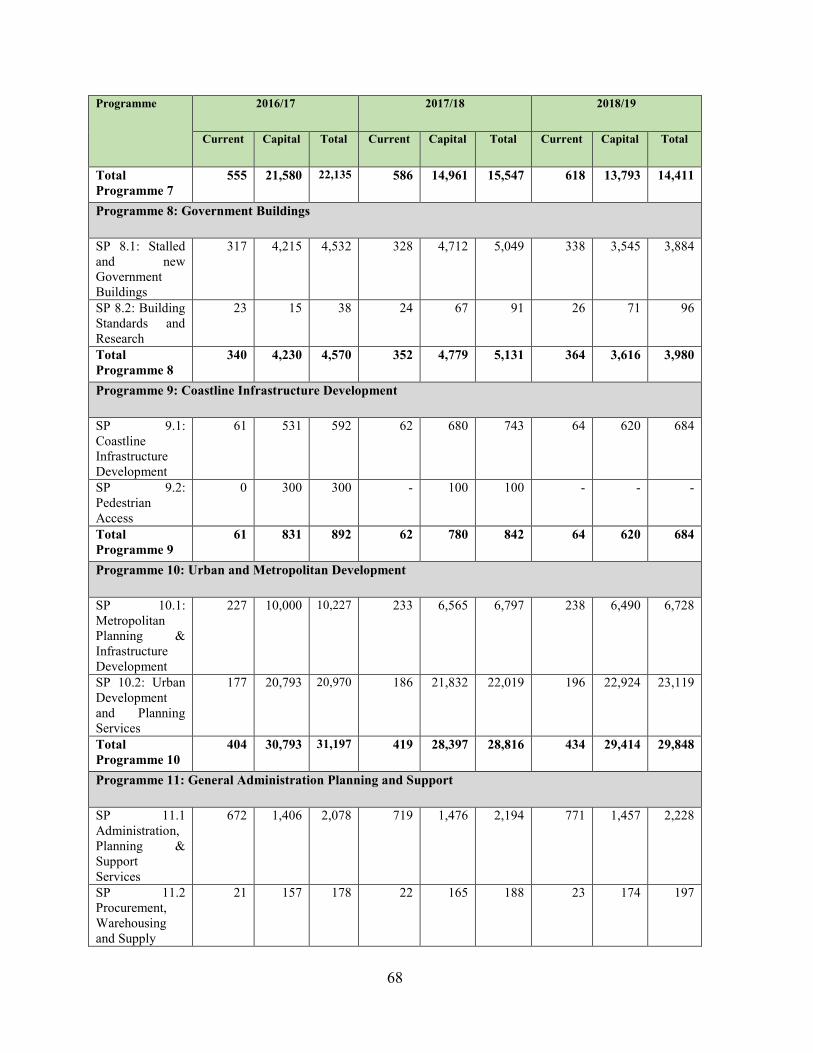
68
Programme 2016/17 2017/18 2018/19
Current Capital Total Current Capital Total Current Capital Total
TotalProgramme 7
555 21,580 22,135 586 14,961 15,547 618 13,793 14,411
Programme 8: Government Buildings
SP 8.1: Stalledand newGovernmentBuildings
317 4,215 4,532 328 4,712 5,049 338 3,545 3,884
SP 8.2: BuildingStandards andResearch
23 15 38 24 67 91 26 71 96
TotalProgramme 8
340 4,230 4,570 352 4,779 5,131 364 3,616 3,980
Programme 9: Coastline Infrastructure Development
SP 9.1:CoastlineInfrastructureDevelopment
61 531 592 62 680 743 64 620 684
SP 9.2:PedestrianAccess
0 300 300 - 100 100 - - -
TotalProgramme 9
61 831 892 62 780 842 64 620 684
Programme 10: Urban and Metropolitan Development
SP 10.1:MetropolitanPlanning &InfrastructureDevelopment
227 10,000 10,227 233 6,565 6,797 238 6,490 6,728
SP 10.2: UrbanDevelopmentand PlanningServices
177 20,793 20,970 186 21,832 22,019 196 22,924 23,119
TotalProgramme 10
404 30,793 31,197 419 28,397 28,816 434 29,414 29,848
Programme 11: General Administration Planning and Support
SP 11.1Administration,Planning &SupportServices
672 1,406 2,078 719 1,476 2,194 771 1,457 2,228
SP 11.2Procurement,Warehousingand Supply
21 157 178 22 165 188 23 174 197

69
Programme 2016/17 2017/18 2018/19
Current Capital Total Current Capital Total Current Capital Total
TotalProgramme 11
693 1,563 2,256 741 1,641 2,382 794 1,631 2,425
Total Vote
Programme 12: General Administration, Planning and Support Services
SP12.1:GeneralAdministration,Planning andSupportServices
1,711 1,260 2,971 1,844 1,386 3,230 2,609 1,525 4,134
Programme 13: Land Administration and Management
SP13.1:Research and Advocacy
181 0 181 152 0 152 132 0 132
SP13.2:Sustainable NaturalResourceManagement
43 150 193 98 392 490 109 432 540
SP13.3:LandTenure Security
250 4,000 4,250 252 0 252 163 953 1,116
SP13.4:Valuation and Taxation
48 20 68 52 22 74 58 24 82
SP13.5:LandAdjudicationand Settlement
100 1,000 1,100 110 1,100 1,210 121 1,210 1,331
Programme 14: National Land Information Management System
SP14.1:National LandInformationManagementsystem
41 655 696 45 505 550 50 404 453
Programme 15:Land Disputes and Conflict Management
SP15.1:Landdisputes andconflictresolutions
364 0 364 282 0 282 295 0 295

70
3.2.5 Programmes and Sub-programmes resource allocation 2016/17-2018/19
Table 14: Analysis of programme expenditure resource allocation (Kshs. Million)StateDepartment ofAgriculture
2016/17 2017/18 2018/19
Current Capital Total Current Capital Total Current Capital Total
Programme 1: General Administration, Planning and Support Services
SP1.1Development/Review ofAgriculturalPolicy, Legaland RegulatoryFrameworks
1,129 2,800 3,929 1,123 2,800 3,923 1,189 2,800 3,989
SP1.2AgriculturalPlanning andFinancialManagement
332 0 332 396 - 396 430 - 430
TotalProgramme 1
1,461 2,800 4,261 1,520 2,800 4,320 1,620 2,800 4,420
Programme 2: Crop Development and Management
SP2.1 -LandAnd CropsDevelopment
404 650 1,054 442 650 1,092 463 650 1,113
SP 2.2 FoodSecurityInitiatives
2,726 13,046 15,772
2,719 13,280 15,999 2,722 13,080 15,802
SP 2.3 -AgricultureExtensionServices
559 670 1,229 550 670 1,220 562 670 1,232
SP 2.4 -AgriculturalResearch
2,281 339 2,620 2,350 339 2,689 2,308 339 2,647
TotalProgramme 2
5,970 14,705 20,675 6,061 14,939 21,000 6,055 14,739 20,794
Programme 3: Agribusiness and Information Management
SP 3.1-Agribusinessand MarketDevelopment
133 0 133 135 0 134 135 0 135
SP 3.2AgriculturalInformationManagement
44 0 44 45 0 45 46 0 46
TotalProgramme 3
177 0 177 180 0 180 182 0 182

71
StateDepartment ofAgriculture
2016/17 2017/18 2018/19
Current Capital Total Current Capital Total Current Capital Total
Total Vote 7,608 17,505 25,113 7,761 17,739 25,500 7,857 17,539 25,396Programme 4: Livestock Resources Management and Development
SP4.1:LivestockPolicyDevelopmentand capacitybuildingProgramme
1,095 542 1,637 1,167 820 1,987 1,227 865 2,092
SP 4.2:LivestockProduction andManagement
267 1,014 1,281 283 690 973 295 690 985
SP 4.3:LivestockProducts ValueAddition andMarketing
197 2,928 3,125 209 3,366 3,575 217 3,626 3,843
SP 4.4: FoodSafety andAnimalProductsDevelopment
232 252 484 249 252 501 262 252 514
SP 4.5:LivestockDiseaseManagementand Control
206 684 890 217 1,150 1,367 226 1,150 1,376
Totalprogramme 4
1,997 5,420 7,417 2,125 6,278 8,403 2,227 6,583 8,810
Programme 5: Fisheries Development and Management
SP 5.1:Fisheries policy,Strategy andcapacitybuilding
140 38 178 224 212 436 283 371 654
SP 5.2:AquacultureDevelopment
76 422 498 77 440 517 78 410 488
SP 5.3:ManagementandDevelopment ofCaptureFisheries
119 883 1,002 121 400 521 123 100 223

72
StateDepartment ofAgriculture
2016/17 2017/18 2018/19
Current Capital Total Current Capital Total Current Capital Total
SP 5.4:Assurance ofFish Safety,Value additionand Marketing
51 1,050 1,101 52 1,050 1,102 53 1,059 1,112
SP 5.5: Marineand FisheriesResearch
992 1,584 2,576 1004 1,246 2,250 1006 1,294 2,300
TotalProgramme 5
1,378 3,977 5,355 1,478 3,357 4,835 1,543 3,410 4,953
Programme 6: Land Policy and Planning
SP 6.1:DevelopmentPlanning andland Reforms
531 1,782 2,313 631 1,582 2,213 663 1,882 2,545
SP 6.2:Modernizationof LandRegistries
661 850 1,511 661 720 1,381 661 850 1,511
SP 6.3: LandSurvey 600 1,850 2,450 600 1,550 2,150 600 1,750 2,350SP 6.4: LandUse 218 50 268 122 50 172 122 50 172SP 6.5: LandAdjudication 347 240 587 401 340 741 439 400 839TotalProgramme 6 2,357 4,772 7,129 2,415 4,242 6,657 2,485 4,932 7,417Programme 7: Housing Development and Human Settlement
SP 7.1: HousingDevelopment 158 7,559 7,717 158 5,389 5,547 158 8,273 8,431SP 7.2: EstateManagement 300 500 800 289 1,020 1,309 291 1,220 1,511TotalProgramme 7 458 8,059 8,517 447 6,409 6,856 449 9,493 9,942Programme 8: Government Buildings
SP 8.1: Stalledand newGovernmentBuildings
306 739 1,045 306 836 1,142 306 481 787
SP 8.2: BuildingStandards andResearch
22 800 822 22 967 989 22 966 988
TotalProgramme 8 328 1,539 1,867 328 1,803 2,131 328 1,447 1,775

73
StateDepartment ofAgriculture
2016/17 2017/18 2018/19
Current Capital Total Current Capital Total Current Capital Total
Programme 9: Coastline Infrastructure Development
SP 9.1:CoastlineInfrastructureDevelopment
59 40 99 59 400 459 59 680 739
SP 9.2:PedestrianAccess
0 1 1 0 280 280 0 300 300
TotalProgramme 9
59 41 100 59 680 739 59 980 1,039
Programme 10: Urban and Metropolitan Development
SP 10.1:MetropolitanPlanning &InfrastructureDevelopment
202 4,290 4,492 232 5,283 5,515 252 411 663
SP 10.2: UrbanDevelopmentand PlanningServices
95 6,578 6,673 95 7,944 8,039 95 9,112 9,207
TotalProgramme 10 297 10,868 11,165 327 13,227 13,554 347 9,523 9,870Programme 11: General Administration Planning and Support
SP 11.1Administration,Planning &SupportServices
501 - 501 597 96 693 653 103 756
SP 11.2Procurement,Warehousingand Supply
24 - 24 24 - 24 24 - 24
TotalProgramme 11 525 - 525 621 96 717 677 103 780Total Vote 4,024 25,279 29,303 4,197 26,457 30,654 4,345 26,478 30,823
Programme 12: General Administration, Planning and Support Services
SP12.1:GeneralAdministration,Planning andSupportServices
860 416 1,276 884 323 1,207 905 410 1315
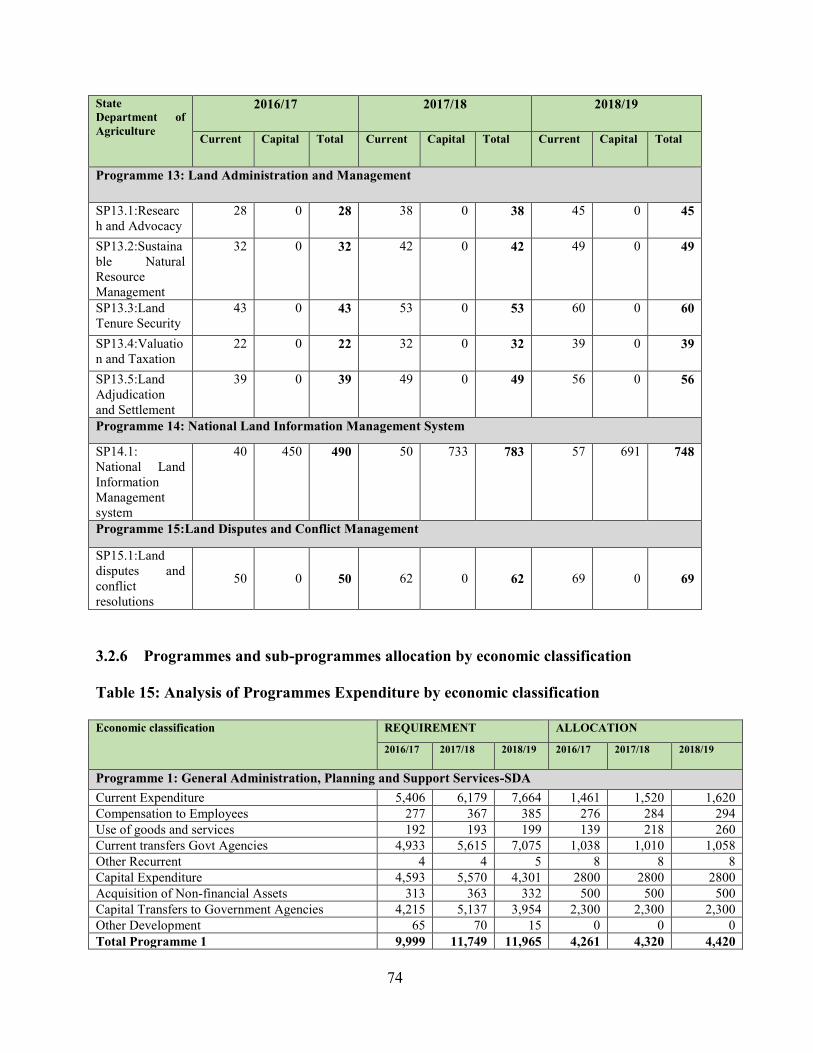
74
StateDepartment ofAgriculture
2016/17 2017/18 2018/19
Current Capital Total Current Capital Total Current Capital Total
Programme 13: Land Administration and Management
SP13.1:Research and Advocacy
28 0 28 38 0 38 45 0 45
SP13.2:Sustainable NaturalResourceManagement
32 0 32 42 0 42 49 0 49
SP13.3:LandTenure Security
43 0 43 53 0 53 60 0 60
SP13.4:Valuation and Taxation
22 0 22 32 0 32 39 0 39
SP13.5:LandAdjudicationand Settlement
39 0 39 49 0 49 56 0 56
Programme 14: National Land Information Management System
SP14.1:National LandInformationManagementsystem
40 450 490 50 733 783 57 691 748
Programme 15:Land Disputes and Conflict Management
SP15.1:Landdisputes andconflictresolutions
50 0 50 62 0 62 69 0 69
3.2.6 Programmes and sub-programmes allocation by economic classification
Table 15: Analysis of Programmes Expenditure by economic classification
Economic classification REQUIREMENT ALLOCATION
2016/17 2017/18 2018/19 2016/17 2017/18 2018/19
Programme 1: General Administration, Planning and Support Services-SDACurrent Expenditure 5,406 6,179 7,664 1,461 1,520 1,620Compensation to Employees 277 367 385 276 284 294Use of goods and services 192 193 199 139 218 260Current transfers Govt Agencies 4,933 5,615 7,075 1,038 1,010 1,058Other Recurrent 4 4 5 8 8 8Capital Expenditure 4,593 5,570 4,301 2800 2800 2800Acquisition of Non-financial Assets 313 363 332 500 500 500Capital Transfers to Government Agencies 4,215 5,137 3,954 2,300 2,300 2,300Other Development 65 70 15 0 0 0Total Programme 1 9,999 11,749 11,965 4,261 4,320 4,420
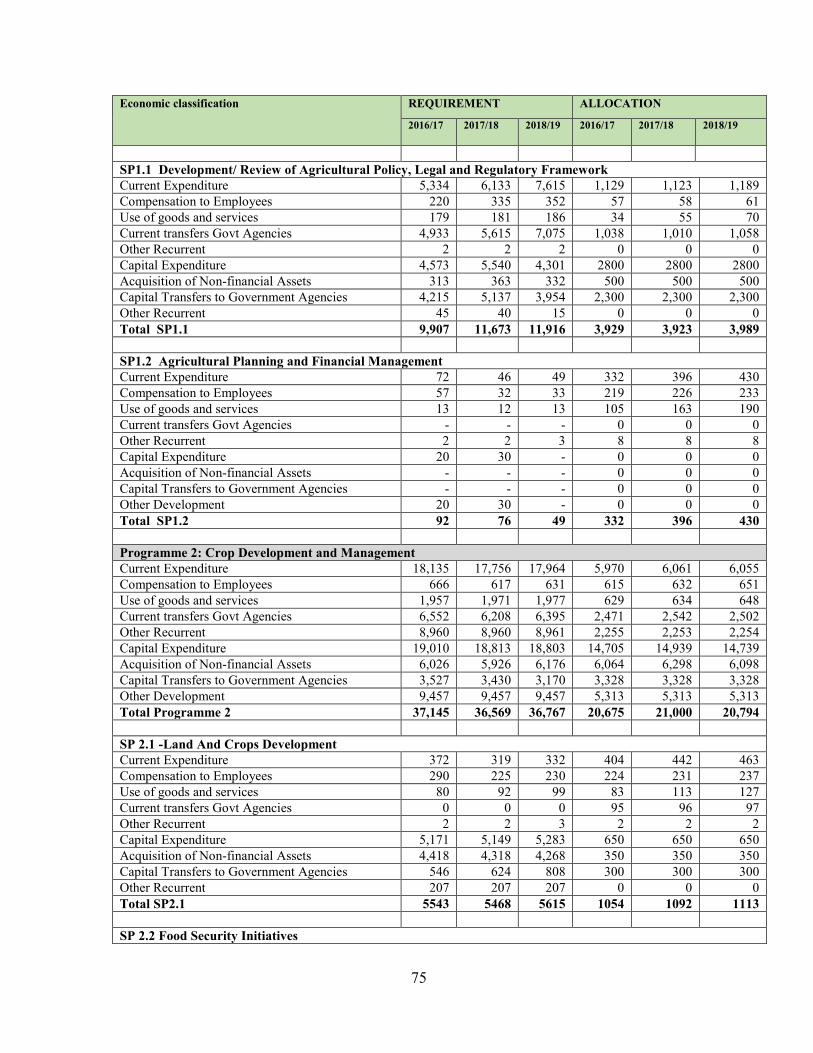
75
Economic classification REQUIREMENT ALLOCATION
2016/17 2017/18 2018/19 2016/17 2017/18 2018/19
SP1.1 Development/ Review of Agricultural Policy, Legal and Regulatory FrameworkCurrent Expenditure 5,334 6,133 7,615 1,129 1,123 1,189Compensation to Employees 220 335 352 57 58 61Use of goods and services 179 181 186 34 55 70Current transfers Govt Agencies 4,933 5,615 7,075 1,038 1,010 1,058Other Recurrent 2 2 2 0 0 0Capital Expenditure 4,573 5,540 4,301 2800 2800 2800Acquisition of Non-financial Assets 313 363 332 500 500 500Capital Transfers to Government Agencies 4,215 5,137 3,954 2,300 2,300 2,300Other Recurrent 45 40 15 0 0 0Total SP1.1 9,907 11,673 11,916 3,929 3,923 3,989
SP1.2 Agricultural Planning and Financial ManagementCurrent Expenditure 72 46 49 332 396 430Compensation to Employees 57 32 33 219 226 233Use of goods and services 13 12 13 105 163 190Current transfers Govt Agencies - - - 0 0 0Other Recurrent 2 2 3 8 8 8Capital Expenditure 20 30 - 0 0 0Acquisition of Non-financial Assets - - - 0 0 0Capital Transfers to Government Agencies - - - 0 0 0Other Development 20 30 - 0 0 0Total SP1.2 92 76 49 332 396 430
Programme 2: Crop Development and ManagementCurrent Expenditure 18,135 17,756 17,964 5,970 6,061 6,055Compensation to Employees 666 617 631 615 632 651Use of goods and services 1,957 1,971 1,977 629 634 648Current transfers Govt Agencies 6,552 6,208 6,395 2,471 2,542 2,502Other Recurrent 8,960 8,960 8,961 2,255 2,253 2,254Capital Expenditure 19,010 18,813 18,803 14,705 14,939 14,739Acquisition of Non-financial Assets 6,026 5,926 6,176 6,064 6,298 6,098Capital Transfers to Government Agencies 3,527 3,430 3,170 3,328 3,328 3,328Other Development 9,457 9,457 9,457 5,313 5,313 5,313Total Programme 2 37,145 36,569 36,767 20,675 21,000 20,794
SP 2.1 -Land And Crops DevelopmentCurrent Expenditure 372 319 332 404 442 463Compensation to Employees 290 225 230 224 231 237Use of goods and services 80 92 99 83 113 127Current transfers Govt Agencies 0 0 0 95 96 97Other Recurrent 2 2 3 2 2 2Capital Expenditure 5,171 5,149 5,283 650 650 650Acquisition of Non-financial Assets 4,418 4,318 4,268 350 350 350Capital Transfers to Government Agencies 546 624 808 300 300 300Other Recurrent 207 207 207 0 0 0Total SP2.1 5543 5468 5615 1054 1092 1113
SP 2.2 Food Security Initiatives

76
Economic classification REQUIREMENT ALLOCATION
2016/17 2017/18 2018/19 2016/17 2017/18 2018/19
Current Expenditure 10,796 10,781 10,782 2,726 2,719 2,722Compensation to Employees 25 10 11 10 10 12Use of goods and services 1,821 1,821 1,821 466 466 466Current transfers Govt Agencies 0 0 0 0 0 0Other Recurrent 8,950 8,950 8,950 2,250 2,243 2,244Capital Expenditure 10,621 10,659 10,540 13,046 13,280 13,080Acquisition of Non-financial Assets 2 2 2 5,714 5,948 5,748Capital Transfers to Government Agencies 1369 1407 1288 2619 2619 2619Other Development 9,250 9,250 9,250 4,713 4,713 4,713Total SP 2.2 21,417 21,440 21,322 15,772 16,539 16,354
SP 2.3 -Agriculture Extension ServicesCurrent Expenditure 1,322 1,305 1,339 559 550 562Compensation to Employees 351 382 390 381 391 402Use of goods and services 56 58 57 80 55 55Current transfers Govt Agencies 93 93 93 95 96 97Other Recurrent 8 8 8 3 8 8Capital Expenditure 1,927 1,714 1,989 670 670 670Acquisition of Non-financial Assets 1,606 1,606 1,906 0 0 0Capital Transfers to Government Agencies 321 108 83 70 70 70Other Development - - - 600 600 600Total SP 2.3 3,249 3,019 3,328 1,229 1,220 1,232
SP 2.4 -Agricultural ResearchCurrent Expenditure 5645 5351 5511 2,281 2,350 2,308Compensation to Employees 0 0 0 0 0 0Use of goods and services 0 0 0 0 0 0Current transfers Govt Agencies 764 764 764 2,281 2,350 2,308Other Recurrent 0 0 0 0 0 0Financial Assets 0 0 0 0 0 0Capital Expenditure 1,291 1,291 991 339 339 339Acquisition of Non-financial Assets - - - 0 0 0Capital Transfers to Government Agencies 764 764 764 339 339 339Other Development - - - 0 0 0Total SP 2.4 6,936 6,642 6,502 2,620 2,689 2,647
Programme 3: Agribusiness and Information ManagementCurrent Expenditure 232 223 224 177 180 182Compensation to Employees 99 88 90 91 94 96Use of goods and services 105 107 107 58 58 58Current transfers Govt Agencies 27 27 27 27 27 27Other Recurrent 1 1 1 1 1 1Financial Assets - - - 0 0 0Capital Expenditure 1,932 1,952 1,985 0 0 0Acquisition of Non-financial Assets 881 888 919 0 0 0Capital Transfers to Government Agencies 1,051 1,065 1,065 0 0 0Other Development - - -Total Programme 3 2,164 2,175 2,209 177 179 182

77
Economic classification REQUIREMENT ALLOCATION
2016/17 2017/18 2018/19 2016/17 2017/18 2018/19
SP 3.1-Agribusiness and Market DevelopmentCurrent Expenditure 182 172 173 133 134 135Compensation to Employees 65 54 55 57 59 60Use of goods and services 89 91 91 48 48 48Current transfers Govt Agencies 27 27 27 27 27 27Other Recurrent 1 1 1 1 1 1Financial Assets - - - - - -Capital Expenditure 1,917 1,937 1,970 0 0 0Acquisition of Non-financial Assets 881 888 919 0 0 0Capital Transfers to Government Agencies 1036 1050 1050 0 0 0Other Development 0 0 0 0 0 0Total SP 3.1 2,099 2,109 2,142 133 134 135
SP 3.2 Agricultural Information ManagementCurrent Expenditure 50 51 52 44 45 46Compensation to Employees 34 34 35 34 35 36Use of goods and services 16 16 16 10 10 10Current transfers Govt Agencies - - - 0 0 0Other Recurrent 0 0 0 0 0 0Capital Expenditure 15 15 15Acquisition of Non-financial Assets 0 0 0 0 0 0Capital Transfers to Government Agencies 15 15 15 0 0 0Other Development - - - 0 0 0Total SP 3.2 65 66 67 44 45 46
Programme 4 :Livestock Resource Management and DevelopmentCurrent Expenditure 3,541 3,824 4,130 1,997 2,125 2,227Compensation of employees 1,796 1,940 2,095 1,500 1,545 1,591Use of good and services 1,284 1,387 1,498 411 490 543Current grants and transfers to other levels of Gov't 434 468 506 64 65 65Social Benefits 0 0 0 0 0 0Other recurrent 27 29 31 22 25 28Capital Expenditure 9,803 8,908 9,586 5,420 6,278 6,583Acquisition of Non-Financial Assets 1,255 1,355 1,461 237 923 1,183Capital grants and transfers to other levels of Gov't 3,989 4,193 4,529 5,183 5,165 5,165Other Development 4,559 3,360 3,597 0 190 235Total for programme 4 13,344 12,732 13,716 7,417 8,403 8,810
SP 4.1: Livestock Policy Development and capacity building ProgrammeCurrent Expenditure 1,868 1,518 1,679 1,095 1,167 1,227Compensation to Employees 919 993 1,072 849 874 901Use of goods and services 914 487 566 228 273 305Grants and Other Transfers 21 23 24 8 8 8Other Recurrent 14 15 16 10 12 13Capital Expenditure 2,402 1,093 1,300 542 820 865Acquisition of Non-Financial Assets 821 886 957 142 230 230Capital Grants to Government Agencies 1404 1516 1637 400 400 400Other Development 177 191 206 - 190 235Total Expenditure SP 4.1 4,270 2,610 2,979 1,637 1,987 2,092
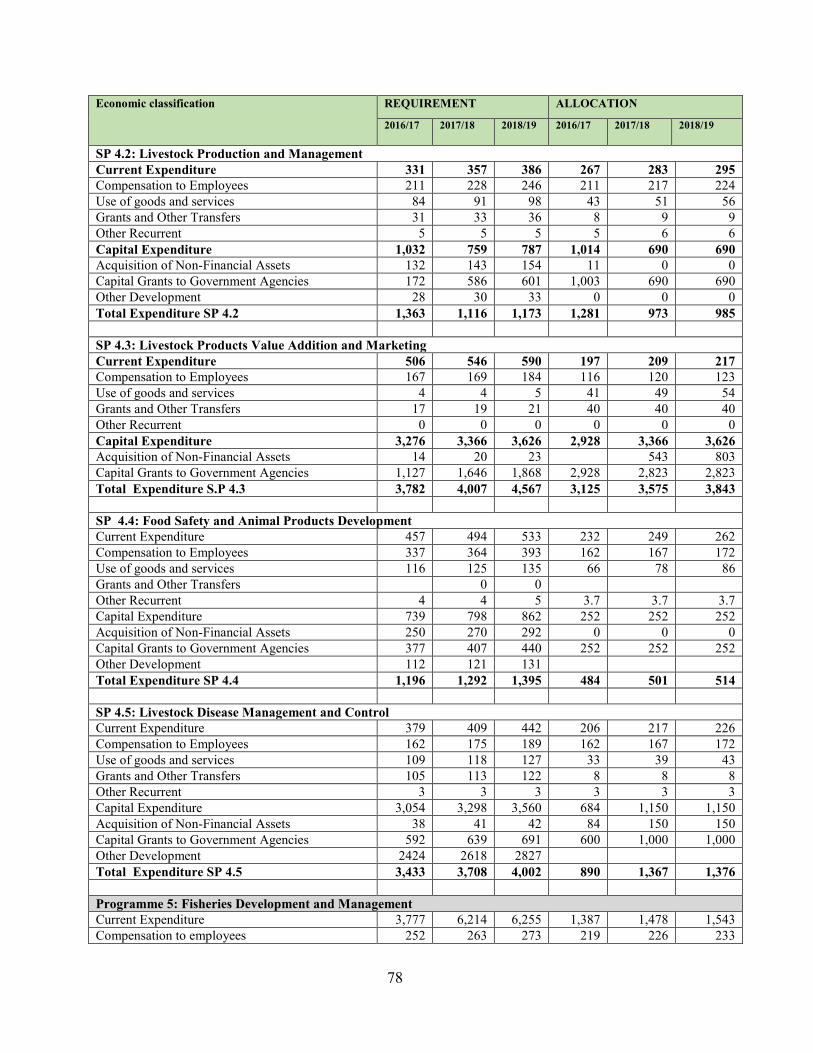
78
Economic classification REQUIREMENT ALLOCATION
2016/17 2017/18 2018/19 2016/17 2017/18 2018/19
SP 4.2: Livestock Production and ManagementCurrent Expenditure 331 357 386 267 283 295Compensation to Employees 211 228 246 211 217 224Use of goods and services 84 91 98 43 51 56Grants and Other Transfers 31 33 36 8 9 9Other Recurrent 5 5 5 5 6 6Capital Expenditure 1,032 759 787 1,014 690 690Acquisition of Non-Financial Assets 132 143 154 11 0 0Capital Grants to Government Agencies 172 586 601 1,003 690 690Other Development 28 30 33 0 0 0Total Expenditure SP 4.2 1,363 1,116 1,173 1,281 973 985
SP 4.3: Livestock Products Value Addition and MarketingCurrent Expenditure 506 546 590 197 209 217Compensation to Employees 167 169 184 116 120 123Use of goods and services 4 4 5 41 49 54Grants and Other Transfers 17 19 21 40 40 40Other Recurrent 0 0 0 0 0 0Capital Expenditure 3,276 3,366 3,626 2,928 3,366 3,626Acquisition of Non-Financial Assets 14 20 23 543 803Capital Grants to Government Agencies 1,127 1,646 1,868 2,928 2,823 2,823Total Expenditure S.P 4.3 3,782 4,007 4,567 3,125 3,575 3,843
SP 4.4: Food Safety and Animal Products DevelopmentCurrent Expenditure 457 494 533 232 249 262Compensation to Employees 337 364 393 162 167 172Use of goods and services 116 125 135 66 78 86Grants and Other Transfers 0 0Other Recurrent 4 4 5 3.7 3.7 3.7Capital Expenditure 739 798 862 252 252 252Acquisition of Non-Financial Assets 250 270 292 0 0 0Capital Grants to Government Agencies 377 407 440 252 252 252Other Development 112 121 131Total Expenditure SP 4.4 1,196 1,292 1,395 484 501 514
SP 4.5: Livestock Disease Management and ControlCurrent Expenditure 379 409 442 206 217 226Compensation to Employees 162 175 189 162 167 172Use of goods and services 109 118 127 33 39 43Grants and Other Transfers 105 113 122 8 8 8Other Recurrent 3 3 3 3 3 3Capital Expenditure 3,054 3,298 3,560 684 1,150 1,150Acquisition of Non-Financial Assets 38 41 42 84 150 150Capital Grants to Government Agencies 592 639 691 600 1,000 1,000Other Development 2424 2618 2827Total Expenditure SP 4.5 3,433 3,708 4,002 890 1,367 1,376
Programme 5: Fisheries Development and ManagementCurrent Expenditure 3,777 6,214 6,255 1,387 1,478 1,543Compensation to employees 252 263 273 219 226 233
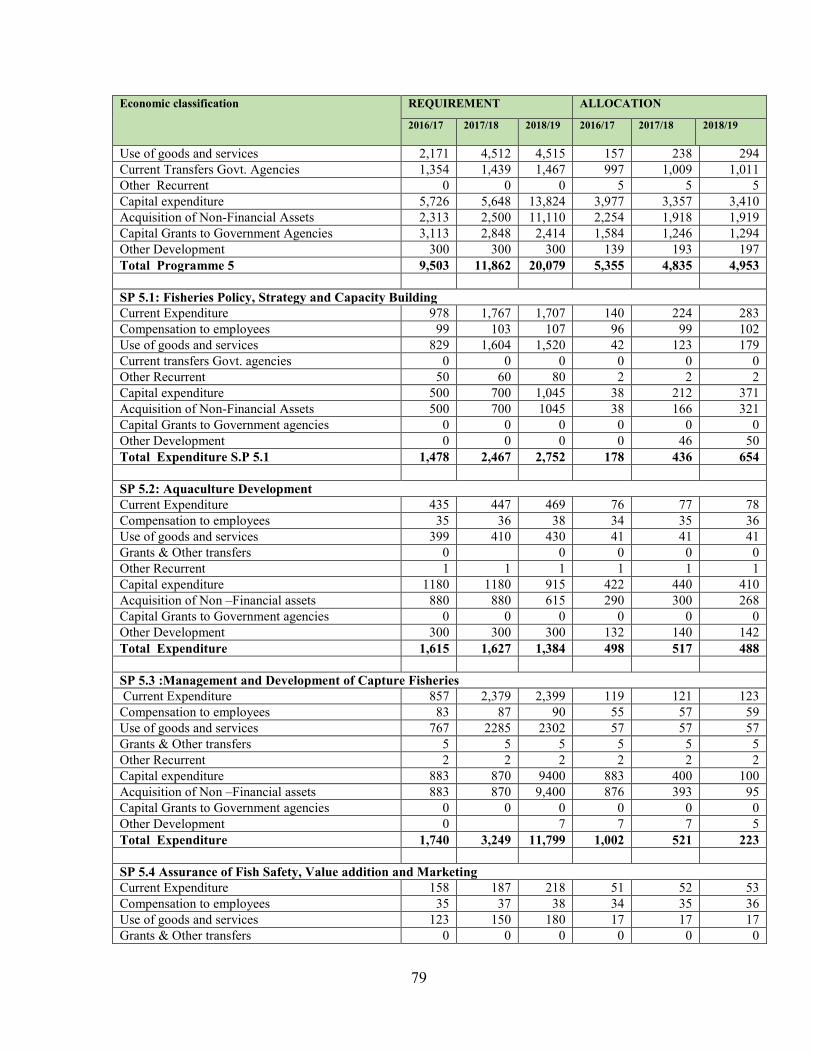
79
Economic classification REQUIREMENT ALLOCATION
2016/17 2017/18 2018/19 2016/17 2017/18 2018/19
Use of goods and services 2,171 4,512 4,515 157 238 294Current Transfers Govt. Agencies 1,354 1,439 1,467 997 1,009 1,011Other Recurrent 0 0 0 5 5 5Capital expenditure 5,726 5,648 13,824 3,977 3,357 3,410Acquisition of Non-Financial Assets 2,313 2,500 11,110 2,254 1,918 1,919Capital Grants to Government Agencies 3,113 2,848 2,414 1,584 1,246 1,294Other Development 300 300 300 139 193 197Total Programme 5 9,503 11,862 20,079 5,355 4,835 4,953
SP 5.1: Fisheries Policy, Strategy and Capacity BuildingCurrent Expenditure 978 1,767 1,707 140 224 283Compensation to employees 99 103 107 96 99 102Use of goods and services 829 1,604 1,520 42 123 179Current transfers Govt. agencies 0 0 0 0 0 0Other Recurrent 50 60 80 2 2 2Capital expenditure 500 700 1,045 38 212 371Acquisition of Non-Financial Assets 500 700 1045 38 166 321Capital Grants to Government agencies 0 0 0 0 0 0Other Development 0 0 0 0 46 50Total Expenditure S.P 5.1 1,478 2,467 2,752 178 436 654
SP 5.2: Aquaculture DevelopmentCurrent Expenditure 435 447 469 76 77 78Compensation to employees 35 36 38 34 35 36Use of goods and services 399 410 430 41 41 41Grants & Other transfers 0 0 0 0 0Other Recurrent 1 1 1 1 1 1Capital expenditure 1180 1180 915 422 440 410Acquisition of Non –Financial assets 880 880 615 290 300 268Capital Grants to Government agencies 0 0 0 0 0 0Other Development 300 300 300 132 140 142Total Expenditure 1,615 1,627 1,384 498 517 488
SP 5.3 :Management and Development of Capture FisheriesCurrent Expenditure 857 2,379 2,399 119 121 123
Compensation to employees 83 87 90 55 57 59Use of goods and services 767 2285 2302 57 57 57Grants & Other transfers 5 5 5 5 5 5Other Recurrent 2 2 2 2 2 2Capital expenditure 883 870 9400 883 400 100Acquisition of Non –Financial assets 883 870 9,400 876 393 95Capital Grants to Government agencies 0 0 0 0 0 0Other Development 0 7 7 7 5Total Expenditure 1,740 3,249 11,799 1,002 521 223
SP 5.4 Assurance of Fish Safety, Value addition and MarketingCurrent Expenditure 158 187 218 51 52 53Compensation to employees 35 37 38 34 35 36Use of goods and services 123 150 180 17 17 17Grants & Other transfers 0 0 0 0 0 0

80
Economic classification REQUIREMENT ALLOCATION
2016/17 2017/18 2018/19 2016/17 2017/18 2018/19
Other Recurrent 0 0 0 0 0 0Capital expenditure 1050 1050 1050 1050 1059 1235Non –Financial assets 1050 1050 1050 1050 1059 1235Capital transfers to Government agencies 0 0 0 0 0 0Other Development 0 0 0 0 0 0Total Expenditure 1,208 1,237 1,268 1,101 1,111 1,288
SP5.5: Marine and Fisheries ResearchCurrent Expenditure 1,349 1,434 1,462 992 1,004 1,006Compensation to employees 0 0 0 0 0 0Use of goods and services 0 0 0 0 0 0Grants & Other transfers 1,349 1,434 1,462 992 1,004 1,006Other Recurrent 0 0 0 0 0 0Capital expenditure 2,113 1,848 1,414 1,584 1,246 1,294Acquisition of Non –Financial assets 0 0 0 0 0 0Capital Grants to Government agencies 2,113 1,848 1,414 1,584 1,246 1,294Other Development 0 0 0 0 0 0Total Expenditure 3,462 3,282 2,876 2,576 2,250 2,300
Programme 6: Land Policy and PlanningCurrent Expenditure 2,748 2,935 2,993 2,357 2,415 2,485Compensation to Employees 2,028 2,199 2,236 2,086 2,144 2,214Use of goods & services 665 711 728 251 251 251Grants and Other Transfers 15 15 20 10 10 10Other Recurrent 41 10 11 10 10 10Capital Expenditure 8,506 6,693 4,890 4,772 4,242 4,932Acquisition of Non-Financial Assets 4,650 830 835 1,246 816 1,126Capital Transfers to Govt. Agencies 86 90 95 82 82 82Other Development 3,770 5,773 3,960 3,444 3,344 3,724Total Expenditure Programme 6 11,253 9,628 7,883 7,129 6,657 7,417
SP 6.1 Development, Planning and Land ReformsCurrent Expenditure 656 680 704 531 631 663Compensation to Employees 554 572 791 438 538 570Use of goods & services 99 104 109 89 89 89Grants and Other Transfers - - - - - -Other Recurrent 3 4 4 4 4 4Capital Expenditure 2,386 4,273 2,395 1,782 1,582 1,882Acquisition of Non-Financial Assets - - - - - -Capital Transfers to Govt. Agencies 86 90 95 82 82 82Other Development 2,300 4,183 2,300 1,700 1,500 1,800Total Expenditure Sub-Programme 6.1 3,042 4,953 3,099 2,313 2,213 2,545
SP 6.2 Modernization of land registriesCurrent Expenditure 732 769 806 661 661 661Compensation to Employees 592 622 652 564 564 564Use of goods & services 140 147 154 95 95 95Grants and Other Transfers - - - - - -Other Recurrent - - 2 2Capital Expenditure 990 1,060 1,080 850 720 850

81
Economic classification REQUIREMENT ALLOCATION
2016/17 2017/18 2018/19 2016/17 2017/18 2018/19
Acquisition of Non-Financial Assets 450 500 500 250 120 250Capital Transfers to Govt. Agencies - - - - - -Other Development 540 560 580 600 600 600Total Expenditure Sub-Programme 6.2 1,722 1,829 1,886 1,511 1,381 1,511
SP 6.3 Land SurveyCurrent Expenditure 799 855 886 600 600 600Compensation to Employees 504 530 556 531 531 531Use of goods & services 277 307 307 57 57 57Grants and Other Transfers 15 15 20 10 10 10Other Recurrent 3 3 3 2 2 2Capital Expenditure 4,800 2,010 2,060 1,850 1,550 1,750Acquisition of Non-Financial Assets 3,000 110 110 930 630 810Capital Transfers to Govt. Agencies - - - - - -Other Development 1,800 1,900 1,950 920 920 940Total Expenditure Sub-Programme 6.3 5,599 2,865 2,946 2,450 2,150 2,350
SP6.4 Land UseCurrent Expenditure 231 208 217 218 122 122Compensation to Employees 118 124 130 208 112 112Use of goods & services 78 80 83 8 8 8Grants and Other Transfers - - - - - -Other Recurrent 35 4 4 2 2 2Capital Expenditure 200 210 215 50 50 50Acquisition of Non-Financial Assets 200 210 215 50 50 50Capital Transfers to Govt. Agencies - - - - - -Other Development - - - - - -
Total Expenditure Sub-Programme 6.4 431 418 432 268 172 172
SP 6.5 Land SettlementCurrent Expenditure 529 553 579 347 401 439Compensation to Employees 458 481 505 345 399 437Use of goods & services 71 72 74 2 2 2Grants and Other Transfers - - - - - -Other Recurrent - - - - - -Capital Expenditure 1,930 940 940 240 340 400Acquisition of Non-Financial Assets 1,000 10 10 16 16 16Capital Transfers to Govt. Agencies - - - - - -Other Development 930 930 930 224 324 384Total Expenditure Sub-Programme 6.5 2,459 1,493 1,519 587 741 839
Programme 7:Housing Development and Human SettlementsCurrent Expenditure 555 586 618 458 447 449Compensation to Employees 343 357 371 336 336 336Use of goods & services 194 210 227 106 95 97Grants and Other Transfers 18 19 20 16 16 16Other Recurrent - - - - - -Capital Expenditure 21,580 14,961 13,794 8,059 6,409 9,493Acquisition of Non-Financial Assets 17,894 11,235 10,813 5,329 3,368 6,451

82
Economic classification REQUIREMENT ALLOCATION
2016/17 2017/18 2018/19 2016/17 2017/18 2018/19
Capital Transfers to Govt. Agencies 3,204 3,220 2,450 2,600 2,600 2,600Other Development 482 506 531 130 441 442Total Expenditure Programme 7 22,135 15,547 14,412 8,517 6,856 9,942SP7.1 Housing DevelopmentCurrent Expenditure 160 167 173 158 158 158Compensation to Employees 120 125 130 122 122 122Use of goods & services 22 23 24 20 20 20Grants and Other Transfers 18 19 20 16 16 16Other Recurrent - - - - - -Capital Expenditure 12,405 9,861 8,893 7,559 5,389 8,273Acquisition of Non-Financial Assets 9,094 6,529 6,326 4,929 2,748 5,631Capital Transfers to Govt. Agencies 3,204 3,220 2,450 2,600 2,600 2,600Other Development 107 112 118 30 41 42Total Expenditure Sub-Programme 7.1 12,565 10,028 9,067 7,717 5,547 8,431SP 7.2 Estates ManagementCurrent Expenditure 395 419 445 300 289 291Compensation to Employees 223 232 241 214 214 214Use of goods & services 172 188 203 86 75 77Grants and Other Transfers - - - - - -Other Recurrent - - - - - -Capital Expenditure 9,175 5,100 4,900 500 1,020 1,220Acquisition of Non-Financial Assets 8,800 4,706 4,487 400 620 820Capital Transfers to Govt. Agencies - - - - - -Other Development 375 394 413 100 400 400Total Expenditure Sub-Programme 7.2 9,570 5,519 5,345 800 1,309 1,511Programme 8: Government BuildingsCurrent Expenditure 340 352 364 328 328 328Compensation of employees 278 284 289 272 272 272Use of goods and services 62 68 75 56 56 56Current Transfers - - - - - -Other Recurrent - - - - - -Capital Expenditure 4,230 4,779 3,616 1,539 1,803 1,447Acquisition of Non-financial assets 4,200 4,747 3,601 727 891 536Capital Grants to Government Agencies - - - 800 900 900Other Development 30 32 15 12 12 11Total Expenditure Programme 8 4,570 5,131 3,980 1,867 2,131 1,775SP 8.1Current Expenditure 317 328 339 306 306 306Compensation of employees 263 268 273 257 257 257Use of goods and services 54 60 66 49 49 49Current Transfers - - - - - -Other Recurrent - - - - - -Capital Expenditure 4,215 4,712 3,545 739 836 481Acquisition of Non-financial assets 4,185 4,680 3,530 727 824 470Capital Grants to Government Agencies - - - - - -Other Development 30 32 15 12 12 11Total Expenditure Sub-Programme 8.1 4,532 5,040 3,883 1,045 1,142 787SP 8.2 Building Standards and ResearchCurrent Expenditure 23 24 25 22 22 22Compensation of employees 16 16 16 15 15 15

83
Economic classification REQUIREMENT ALLOCATION
2016/17 2017/18 2018/19 2016/17 2017/18 2018/19
Use of goods and services 8 8 9 7 7 7Current Transfers - - - - - -Other Recurrent - - - - - -Capital Expenditure 15 67 71 800 967 966Acquisition of Non-financial assets 15 67 71 - 67 66Capital Grants to Government Agencies - - - 800 900 900Other Development - - - - - -Total Expenditure SP 8.2 38 91 96 822 989 988Programme 9: Coastline Infrastructure and Pedestrian AccessCurrent Expenditure 61 63 65 59 59 59Compensation of employees 53 54 55 52 52 52Use of goods and services 8 9 10 7 7 7Current Transfer - - - - - -Other Recurrent - - - - - -Capital Expenditure 831 780 620 41 680 980Acquisition of Non-financial assets 831 780 620 41 680 980Capital Grants to Government Agencies - - - - - -Other Development - - - -- - -Total Expenditure Programme 9 892 842 684 100 739 1,039SP 9.1 Coastline InfrastructureCurrent Expenditure 61 63 64 59 59 59Compensation of employees 53 54 55 52 52 52Use of goods and services 8 9 9 7 7 7Current Transfer - - - - - -Other Recurrent - - - - - -Capital Expenditure 531 680 620 40 400 680Acquisition of Non-financial assets 531 680 620 40 400 680Capital Grants to Government Agencies - - - - - -Other Development - - - - - -Total Expenditure SP 9.1 591 743 684 99 459 739
SP 9.2 Pedestrian AccessCurrent Expenditure 0 0 0 0 0 0Compensation of employees 0 0 0 0 0 0Use of goods and services 0 0 0 0 0 0Current Transfer 0 0 0 0 0 0Other Recurrent 0 0 0 0 0 0Capital Expenditure 300 100 - 1 280 300Acquisition of Non-financial assets 300 100 - 1 280 300Capital Grants to Government Agencies - - - - - -Other Development - - - - - -Total Expenditure SP 9.2 300 100 - 1 280 300
Programme 10: Urban and Metropolitan DevelopmentCurrent Expenditure 404 419 433 297 327 347Compensation to Employees 169 176 183 100 130 150Use of goods & services 218 225 232 184 184 184Grants and Other Transfers 1 1 1 1 1 1Other Recurrent 16 17 17 12 12 12Capital Expenditure 30,793 28,397 29,414 10,868 13,227 9,523
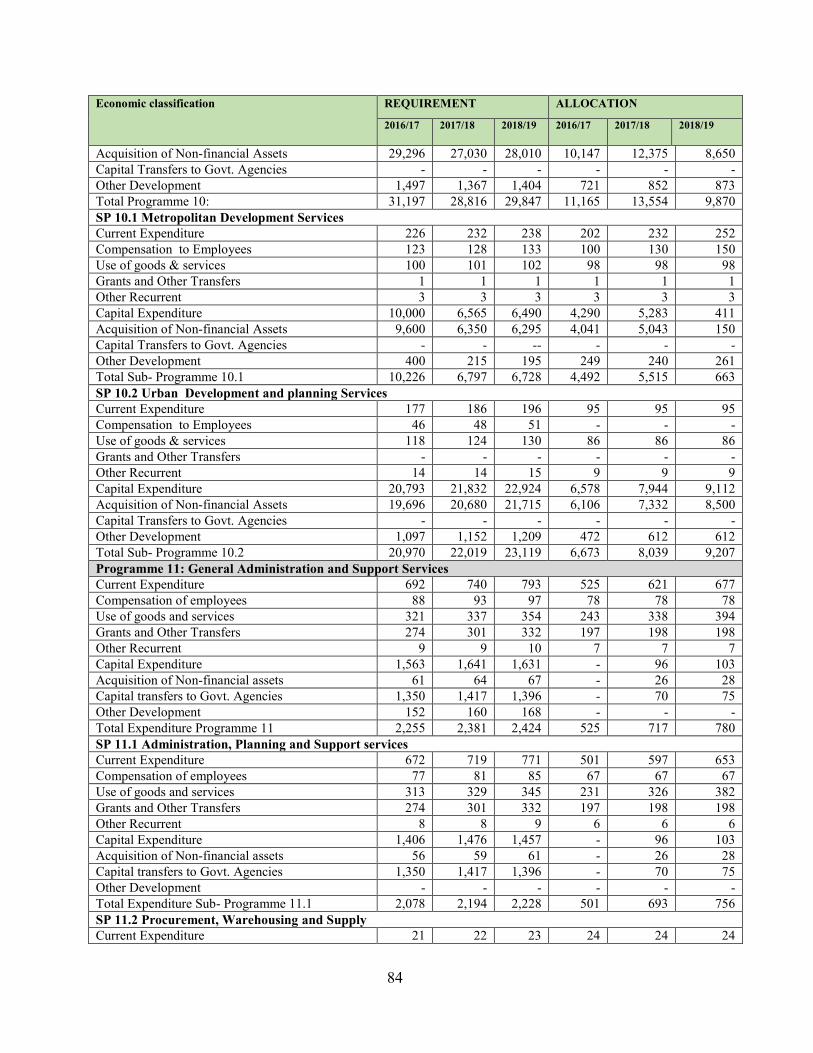
84
Economic classification REQUIREMENT ALLOCATION
2016/17 2017/18 2018/19 2016/17 2017/18 2018/19
Acquisition of Non-financial Assets 29,296 27,030 28,010 10,147 12,375 8,650Capital Transfers to Govt. Agencies - - - - - -Other Development 1,497 1,367 1,404 721 852 873Total Programme 10: 31,197 28,816 29,847 11,165 13,554 9,870SP 10.1 Metropolitan Development ServicesCurrent Expenditure 226 232 238 202 232 252Compensation to Employees 123 128 133 100 130 150Use of goods & services 100 101 102 98 98 98Grants and Other Transfers 1 1 1 1 1 1Other Recurrent 3 3 3 3 3 3Capital Expenditure 10,000 6,565 6,490 4,290 5,283 411Acquisition of Non-financial Assets 9,600 6,350 6,295 4,041 5,043 150Capital Transfers to Govt. Agencies - - -- - - -Other Development 400 215 195 249 240 261Total Sub- Programme 10.1 10,226 6,797 6,728 4,492 5,515 663SP 10.2 Urban Development and planning ServicesCurrent Expenditure 177 186 196 95 95 95Compensation to Employees 46 48 51 - - -Use of goods & services 118 124 130 86 86 86Grants and Other Transfers - - - - - -Other Recurrent 14 14 15 9 9 9Capital Expenditure 20,793 21,832 22,924 6,578 7,944 9,112Acquisition of Non-financial Assets 19,696 20,680 21,715 6,106 7,332 8,500Capital Transfers to Govt. Agencies - - - - - -Other Development 1,097 1,152 1,209 472 612 612Total Sub- Programme 10.2 20,970 22,019 23,119 6,673 8,039 9,207Programme 11: General Administration and Support ServicesCurrent Expenditure 692 740 793 525 621 677Compensation of employees 88 93 97 78 78 78Use of goods and services 321 337 354 243 338 394Grants and Other Transfers 274 301 332 197 198 198Other Recurrent 9 9 10 7 7 7Capital Expenditure 1,563 1,641 1,631 - 96 103Acquisition of Non-financial assets 61 64 67 - 26 28Capital transfers to Govt. Agencies 1,350 1,417 1,396 - 70 75Other Development 152 160 168 - - -Total Expenditure Programme 11 2,255 2,381 2,424 525 717 780SP 11.1 Administration, Planning and Support servicesCurrent Expenditure 672 719 771 501 597 653Compensation of employees 77 81 85 67 67 67Use of goods and services 313 329 345 231 326 382Grants and Other Transfers 274 301 332 197 198 198Other Recurrent 8 8 9 6 6 6Capital Expenditure 1,406 1,476 1,457 - 96 103Acquisition of Non-financial assets 56 59 61 - 26 28Capital transfers to Govt. Agencies 1,350 1,417 1,396 - 70 75Other Development - - - - - -Total Expenditure Sub- Programme 11.1 2,078 2,194 2,228 501 693 756SP 11.2 Procurement, Warehousing and SupplyCurrent Expenditure 21 22 23 24 24 24

85
Economic classification REQUIREMENT ALLOCATION
2016/17 2017/18 2018/19 2016/17 2017/18 2018/19
Compensation of employees 12 12 13 11 11 11Use of goods and services 8 8 9 12 12 12Grants and Other Transfers - - - - - -Other Recurrent 1 1 1 1 1 1Capital Expenditure 157 166 174 - - -Acquisition of Non-financial assets 5 6 6 - - -Capital transfers to Govt. Agencies - - - - - -Other Development 152 160 168 - - -Total Expenditure Programme 11.2 178 188 197 24 24 24
Programme 12:General Administration, Planning and Support ServicesSub Programme 12.1: General Administration , Planning and Support ServicesCurrent Expenditure 1,711 1,844 2,609 860 884 905Compensation to Employees 1,100 1,200 1,300 460 474 488Use of Goods & Services 611 644 1,309 400 410 417Current Transfers Govt. Agencies 0 0 0 0 0 0Other recurrent 0 0 0 0 0 0Capital Expenditure 1,260 1,386 1,525 416 323 410Acquisition of Non-Financial Assets 1,260 1,386 1,524.6 171 73 200Capital Transfers to Govt. Agencies 0 0 0Other Development 0 0 0 245 250 210Total Expenditure for Sub- programme 12.1 2,971 3,230 4,134 1,276 1,207 1,315
Programme 13: Public Land Administration and ManagementSub Programme 13.1: Research and AdvocacyCurrent Expenditure 181 152 132 28 38 45Compensation to Employees 0 0 0 0 0 0Use of Goods & Services 181 152 132 28 38 45Current Transfers Govt. Agencies 0 0 0 0 0 0Other recurrent 0 0 0 0 0 0Capital Expenditure 0 0 0 0 0 0Acquisition of Non-Financial Assets 0 0 0 0 0 0Capital Transfers to Govt. Agencies 0 0 0 0 0 0Other Development 0 0 0 0 0 0Total Expenditure sub-programme 13.1 181 152 132 28 38 45
Sub Programme 13.2: Sustainable Natural Resource ManagementCurrent Expenditure 43 98 109 32 42 49Compensation to Employees 0 0 0 0 0 0Use of Goods & Services 43 98 109 32 42 49Current Transfers Govt. Agencies 0 0 0 0 0 0Other recurrent 0 0 0 0 0 0Capital Expenditure 150 392 432 0 0 0Acquisition of Non-Financial Assets 0 0 0 0 0 0Capital Transfers to Govt. Agencies 0 0 0 0 0 0Other Development 150 392 432 0 0 0Total Sub- programme 13.2 193 490 541 32 42 49
Sub Programme 13.3. Land Tenure SecurityCurrent Expenditure 250 252 163 43 53 60

86
Economic classification REQUIREMENT ALLOCATION
2016/17 2017/18 2018/19 2016/17 2017/18 2018/19
Compensation to Employees 0 0 0 0 0 0Use of Goods & Services 250 252 163 43 53 60Current Transfers Govt. Agencies 0 0 0 0 0 0Other recurrent 0 0 0 0 0 0Capital Expenditure 4,000 0 953 0 0 0Acquisition of Non-Financial Assets 0 0 0 0 0 0Capital Transfers to Govt. Agencies 0 0 0 0 0 0Other Development 4,000 0 953 0 0 0Total Sub Programme 13.3. 4,250 252 1,116 43 53 60
Sub Programme 13.4: Valuation and TaxationCurrent Expenditure 48 52 58 22 32 39Compensation to Employees 0 0 0 0 0 0Use of Goods & Services 48 52 58 22 32 39Current Transfers Govt. Agencies 0 0 0 0 0 0Other recurrent 0 0 0 0 0 0Capital Expenditure 20 22 24 0 0 0Acquisition of Non-Financial Assets 0 0 0 0 0 0Capital Transfers to Govt. Agencies 0 0 0 0 0 0Other Development 20 22 24 0 0 0Total Sub Programme 13.4 68 74 82 22 32 39
Sub Programme 13.5: Land Adjudication and SettlementCurrent Expenditure 100 110 121 39 49 56Compensation to Employees 0 0 0 0 0 0Use of Goods & Services 100 110 121 39 49 56Current Transfers Govt. Agencies 0 0 0 0 0 0Other recurrent 0 0 0 0 0 0Capital Expenditure 1,000 1,100 1,210 0 0 0Acquisition of Non-Financial Assets 0 0 0 0 0 0Capital Transfers to Govt. Agencies 0 0 0 0 0 0Other Development 1,000 1,100 1,210 0 0 0Total Sub Programme 13.5 1,100 1,210 1,331 39 49 56
Programme 14:National Land Information Management SystemSub Programme 14.1: National Land Information Management SystemCurrent Expenditure 41 45 50 40 50 57Compensation to Employees 0 0 0 0 0 0Use of Goods & Services 41 45 50 40 50 57Current Transfers Govt. Agencies 0 0 0 0 0 0Other recurrent 0 0 0 0 0 0Capital Expenditure 655 505 404 450 733 691Acquisition of Non-Financial Assets 655 505 404 450 733 691Capital Transfers to Govt. Agencies 0 0 0 0 0 0Other Development 0 0 0 0 0 0Total Sub Programme 14.1 696 550 453 490 783 748
Programme 15: Land Disputes and Conflict ManagementSub Programme 15.1: Land Disputes and Conflict ManagementCurrent Expenditure 364 282 295 50 62 69
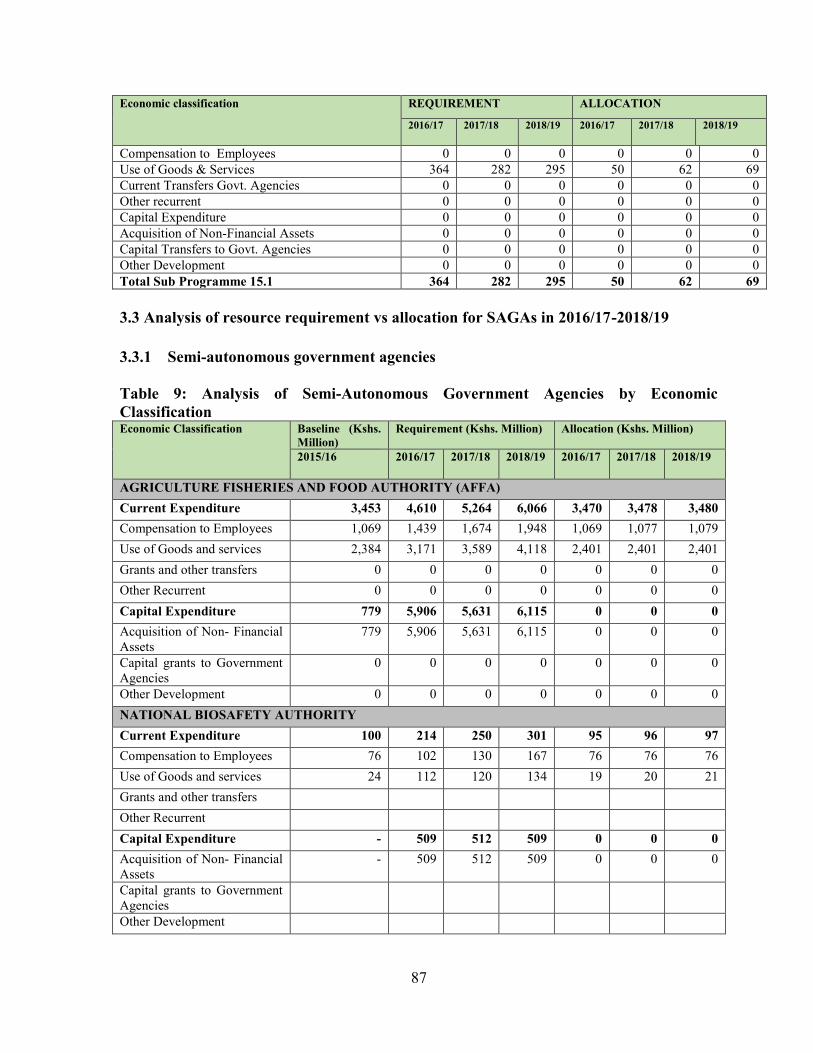
87
Economic classification REQUIREMENT ALLOCATION
2016/17 2017/18 2018/19 2016/17 2017/18 2018/19
Compensation to Employees 0 0 0 0 0 0Use of Goods & Services 364 282 295 50 62 69Current Transfers Govt. Agencies 0 0 0 0 0 0Other recurrent 0 0 0 0 0 0Capital Expenditure 0 0 0 0 0 0Acquisition of Non-Financial Assets 0 0 0 0 0 0Capital Transfers to Govt. Agencies 0 0 0 0 0 0Other Development 0 0 0 0 0 0Total Sub Programme 15.1 364 282 295 50 62 69
3.3 Analysis of resource requirement vs allocation for SAGAs in 2016/17-2018/19
3.3.1 Semi-autonomous government agencies
Table 9: Analysis of Semi-Autonomous Government Agencies by EconomicClassificationEconomic Classification Baseline (Kshs.
Million)Requirement (Kshs. Million) Allocation (Kshs. Million)
2015/16 2016/17 2017/18 2018/19 2016/17 2017/18 2018/19
AGRICULTURE FISHERIES AND FOOD AUTHORITY (AFFA)Current Expenditure 3,453 4,610 5,264 6,066 3,470 3,478 3,480Compensation to Employees 1,069 1,439 1,674 1,948 1,069 1,077 1,079Use of Goods and services 2,384 3,171 3,589 4,118 2,401 2,401 2,401Grants and other transfers 0 0 0 0 0 0 0Other Recurrent 0 0 0 0 0 0 0Capital Expenditure 779 5,906 5,631 6,115 0 0 0Acquisition of Non- FinancialAssets
779 5,906 5,631 6,115 0 0 0
Capital grants to GovernmentAgencies
0 0 0 0 0 0 0
Other Development 0 0 0 0 0 0 0NATIONAL BIOSAFETY AUTHORITYCurrent Expenditure 100 214 250 301 95 96 97Compensation to Employees 76 102 130 167 76 76 76Use of Goods and services 24 112 120 134 19 20 21Grants and other transfersOther RecurrentCapital Expenditure - 509 512 509 0 0 0Acquisition of Non- FinancialAssets
- 509 512 509 0 0 0
Capital grants to GovernmentAgenciesOther Development

88
Economic Classification Baseline (Kshs.Million)
Requirement (Kshs. Million) Allocation (Kshs. Million)
2015/16 2016/17 2017/18 2018/19 2016/17 2017/18 2018/19
PEST CONTROL PRODUCTS BOARD
Current Expenditure 164 297 327 359 164 170 175Compensation to Employees 98 166 183 201 98 104 109Use of Goods and services 66 131 144 158 66 66 66Grants and other transfersOther RecurrentCapital Expenditure 70 250 565 939 0 0 0Acquisition of Non- FinancialAssets
70 250 565 939 0 0 0
Capital grants to GovernmentAgencies
0 0 0 0 0 0 0
Other Development 0 0 0 0 0 0 0KENYA PLANT HEALTH INSPECTION SERVICES (KEPHIS)Current Expenditure 910 1,100 1,128 1,145 910 911 912Compensation to Employees 504 630 646 662 504 505 506Use of Goods and services 406 470 482 483 406 406 406Grants and other transfersOther RecurrentCapital Expenditure - - - - - - -Acquisition of Non- FinancialAssetsCapital grants to GovernmentAgenciesOther DevelopmentKENYA AGRICULTURAL AND LIVESTOCK RESEARCH ORGANIZATION (KALRO)Current Expenditure 3,688 8,664 9,476 10,156 3,869 4,002 4,062Compensation to Employees 3,251 4,991 5,041 5,092 3,321 3,348 3,351Use of Goods and services 437 3,673 4,435 5,064 549 654 712Grants and other transfers - - - - - - -Other RecurrentCapital Expenditure 626 2,788 2,054 1,856 728 728 744Acquisition of Non- FinancialAssets
626 2,788 2,054 1,856 728 728 744
Capital grants to GovernmentAgencies
- - - - - - -
Other Development - - - - -- - -TOTAL VOTE 9,790 24,338 25,207 27,446 3,869 4,002 4,062KENYA VETERINARY VACCINES PRODUCTION INSTITUTE (KEVEVAPI)Current Expenditure 475 550 636 735 475 475 475Compensation of Employees 50 60 60 60 50 50 50
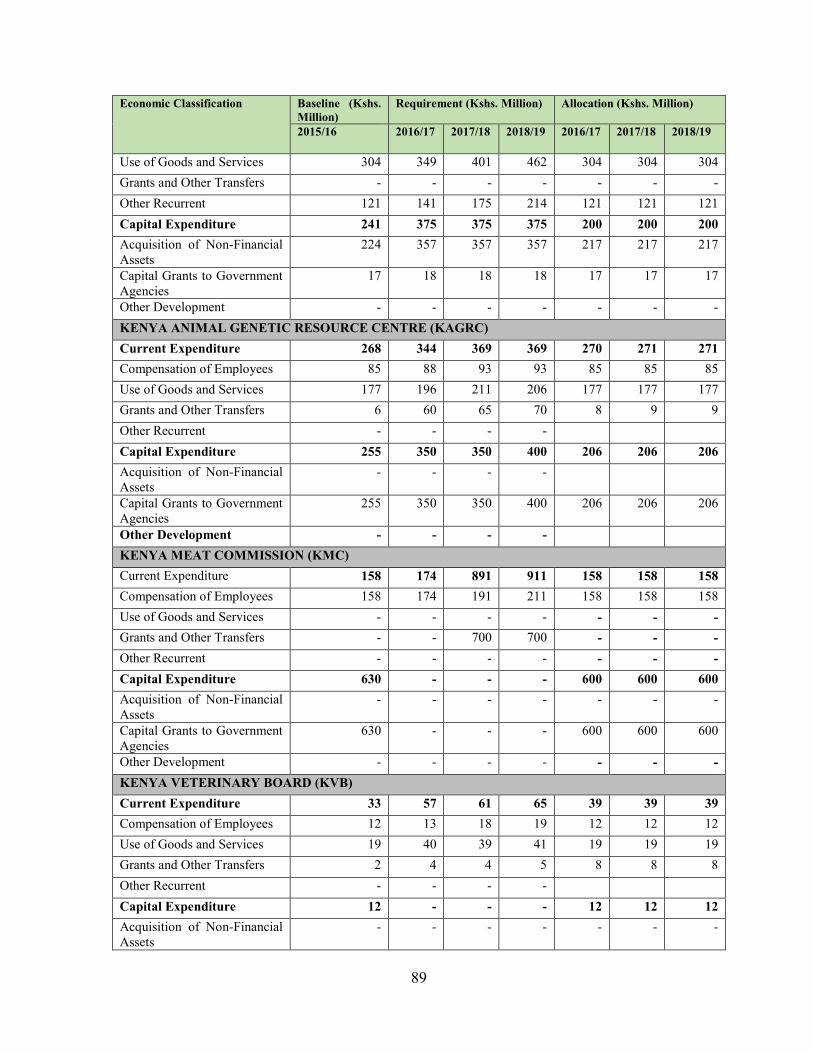
89
Economic Classification Baseline (Kshs.Million)
Requirement (Kshs. Million) Allocation (Kshs. Million)
2015/16 2016/17 2017/18 2018/19 2016/17 2017/18 2018/19
Use of Goods and Services 304 349 401 462 304 304 304Grants and Other Transfers - - - - - - -Other Recurrent 121 141 175 214 121 121 121Capital Expenditure 241 375 375 375 200 200 200Acquisition of Non-FinancialAssets
224 357 357 357 217 217 217
Capital Grants to GovernmentAgencies
17 18 18 18 17 17 17
Other Development - - - - - - -KENYA ANIMAL GENETIC RESOURCE CENTRE (KAGRC)Current Expenditure 268 344 369 369 270 271 271Compensation of Employees 85 88 93 93 85 85 85Use of Goods and Services 177 196 211 206 177 177 177Grants and Other Transfers 6 60 65 70 8 9 9Other Recurrent - - - -Capital Expenditure 255 350 350 400 206 206 206Acquisition of Non-FinancialAssets
- - - -
Capital Grants to GovernmentAgencies
255 350 350 400 206 206 206
Other Development - - - -KENYA MEAT COMMISSION (KMC)Current Expenditure 158 174 891 911 158 158 158Compensation of Employees 158 174 191 211 158 158 158Use of Goods and Services - - - - - - -Grants and Other Transfers - - 700 700 - - -Other Recurrent - - - - - - -Capital Expenditure 630 - - - 600 600 600Acquisition of Non-FinancialAssets
- - - - - - -
Capital Grants to GovernmentAgencies
630 - - - 600 600 600
Other Development - - - - - - -KENYA VETERINARY BOARD (KVB)Current Expenditure 33 57 61 65 39 39 39Compensation of Employees 12 13 18 19 12 12 12Use of Goods and Services 19 40 39 41 19 19 19Grants and Other Transfers 2 4 4 5 8 8 8Other Recurrent - - - -Capital Expenditure 12 - - - 12 12 12Acquisition of Non-FinancialAssets
- - - - - - -

90
Economic Classification Baseline (Kshs.Million)
Requirement (Kshs. Million) Allocation (Kshs. Million)
2015/16 2016/17 2017/18 2018/19 2016/17 2017/18 2018/19
Capital Grants to GovernmentAgencies
12 - - - 12 12 12
Other Development - - - - - - -AGRICULTURAL DEVELOPMENT CORPORATION (ADC)Current Expenditure - 100 170 180 - - -Compensation of Employees - - 20 25 - - -Use of Goods and Services - - 50 55 - - -Grants and Other Transfers - 100 100 100 - - -Other Recurrent - - - - - - -Capital Expenditure 200 100 100 100 350 350 350Acquisition of Non-FinancialAssets
- - - - - - -
Capital Grants to GovernmentAgencies
200 100 100 100 350 350 350
Other Development - - - - - - -KENYA DAIRY BOARD (KDB)Current Expenditure 307 316 333 344 40 40 40Compensation of Employees 147 154 162 170Use of Goods and Services 99 101 103 105Grants and Other Transfers - - - - 40 40 40Other Recurrent 61 61 68 69 - - -Capital Expenditure - - - - - - -Acquisition of Non-FinancialAssets
- - - - - - -
Capital Grants to GovernmentAgencies
- - - - - - -
Other Development - - - - - - -KENYA TSETSE AND TRYPANOSOMIASIS ERADICATION COUNCILCurrent Expenditure 320 900 990 1,079 320 320 320Compensation of Employees 41 82 82 82 41 41 41Use of Goods and Services 180 700 778 854 180 180 180Grants and Other Transfers - - - - - - -Other Recurrent 99 118 130 143 99 118 130Capital Expenditure 400 600 610 621 400 400 400Acquisition of Non-FinancialAssetsCapital Grants to GovernmentAgencies
400 600 610 621 400 400 400
Other Development - - - - - - -KENYA MARINE AND FISHERIES RESEARCH INSTITUTECurrent Expenditure 1,349 1,434 1,462 1,349 9,92 1,004 1,006Compensation of employees 667 694 722 750 652 664 666

91
Economic Classification Baseline (Kshs.Million)
Requirement (Kshs. Million) Allocation (Kshs. Million)
2015/16 2016/17 2017/18 2018/19 2016/17 2017/18 2018/19
Use of Goods and Services 682 740 740 599 340 340 340Grants and Other Transfers - - - - - - -Other Recurrent - - - - - - -Capital Expenditure 2,113 1,848 1,414 2,113 1,584 1,246 1,294Acquisition of Non-financialAssets
- - - - - - -
Capital Grants to GovernmentAgencies
2,113 1,848 1,414 2,113 1,584 1,246 1,294
Other Development - - - - - - -Total Vote 3,462 3,282 2,876 3,462 2,576 2,250 2,300NATIONAL CONSTRUCTION AUTHORITYCurrent Expenditure 2,182 3,380 4,761 4,951 2,496 3,942 5,630Compensation of Employees 802 1,376 1,968 2,050 885 1,513 2,255Use of Goods and Services 1,156 1,835 2,624 2,733 1,387 2,202 3,148Grants and Other Transfers 224 168 168 168 224 227 227Other Recurrent 0 0 0 0 0 0 0Capital Expenditure 973 1,572 1,839 1,922 1,743 2,138 2,529Acquisition of Non-FinancialAssets
190 310 250 250 228 319 446
Capital Grants to GovernmentAgencies
90 500 750 750 500 500 500
Other Development 693 762 839 922 1,015 1,319 1,583TOTAL VOTE 3,155 4,952 6,600 6,873 4,239 6,080 8,159
3.4 Resource Allocation Criteria
This sector will continue to rationalize expenditure with a view to shifting resources fromnone core areas to capital investment and core priority programmes. The following generalprinciples have guided the process: Linkage of programmes with the objectives of Medium Term Plan II of Kenya Vision
2030 Core poverty interventions Linkages to Government flagship projects Degree to which the programme is addressing the core mandate of MDAs Expected outputs and outcomes from the programme Linkages with other programmes Cost effectiveness and sustainability of the programme Response to the requirements of the Constitution Ongoing activities of the strategic interventions

92
Specifically, the following criteria was developed and applied:
A. Recurrent Resource Allocation CriteriaThe recurrent resource ceilings was shared in the following categories:
I. Personnel EmolumentsII. Current Grants and TransfersIII. Other Recurrent
B. Development Resource Allocation Criteria
Sharing of the resources was based on projects according to the following criteria.
I. GoK Counterpart FundingII. Dedicated Allocation/One off /Expenditure/Consensus Allocations/ Court Award
III. Flagship/Presidential Delivery Unit/Cabinet DecisionsIV. On-going ProjectsV. Stalled Projects
VI. Projects under Economic Stimulus Programme

93
CHAPTER FOUR4. CROSS SECTOR LINKAGES AND EMERGING ISSUES ANDCHALLENGES
4.1 Cross Sector Linkages
The performance of the ARUD sector is dependent upon linkages between the various sub-sectors and other sectors. The Second Medium Term Plan 2013-2017, provides theframework for intra and inter-sector linkages for attainment of the sector goals as identifiedin the Vision 2030. For example, proper land use planning provides for a balance in thegrowth of crops, livestock and fisheries sub sectors thereby ensuring food security andincreased earnings from marketed produce. Urban centers on the other hand provide a readymarket for agricultural products.
Security of land tenure is crucial to the development of the other subsectors. Land ownershipdocuments facilitate access to financial services for farmers and development activities in theurban sub-sector.
The AR&UD sector has linkages with other sectors of the economy namely; Energy,Infrastructure and ICT; General Economic and Commercial Affairs; Health; Education;Governance, Justice, Law and Order; Public Administration and International Relations;National Security; Social Protection, Culture and Recreation; Environment Protection, Waterand Natural Resources. The linkages of these sectors are as highlighted below:
I. Energy, Infrastructure and ICTThe sector has a strong linkage with the Energy, Infrastructure and ICT sector. This is crucialif the sector is to perform efficiently and effectively. For instance, energy is critical to thesuccess of the sector in the provision of renewable and non-renewable energy. Further, ICTlinkage to the sector is essential for dissemination of market information and improved andadaptive technologies. In addition, the sector benefits though use of railway, road and airtransport to move inputs for production and outputs to the market. ARUD sector on its partfacilitates the Energy, Infrastructure and ICT sector through ensuring food security, landadministration and management.
II. General Economic and Commercial AffairsThe ARUD sector produces the bulk of the country’s exports and raw materials for themanufacturing industries as well as food for the tourism industry. Another vital input towardsthe General Economic and Commercial Affairs is land governance, which is critical toeconomic and social development. Equally, the sector’s success depends on the applicationof sound industrial relations and expanded regional and international markets facilitated bythe General, Economic and Commercial affairs

94
III. HealthHuman health is important as it affects labour force and productivity in the sector.Pandemics such as malaria, cancer, diabetes and HIV/AIDS pose a big threat to the supply oflabour to the sector. AR&UD sector on its part provides food which is vital for a healthynation. Land is also essential for human settlement which impacts on health.
IV. EducationThe Education sector works closely with the sector in terms of capacity building, technologydevelopment and dissemination. Conversely the AR&UD sector supports the EducationSector by ensuring food security, land administration and management.
V. Governance, Justice, Law and Order (GJLO)The sector relies on the GJLO sector for legal support and corporate governance. These arecrucial towards ensuring administration of justice, resolution of disputes, maintenance of lawand order which are essential for the performance of the sector. The sector supports theGJLO sector in areas such as securing land tenure, administrative boundaries, national andinternational boundaries. This safeguards peaceful coexistence between individual neighbors,communities and neighboring countries. Further, the sector facilitates GJLO sector bysafeguarding food security.
VI. Administration and International Relations (PAIR)The sector collaborates with PAIR for policy direction, fulfillment of national andinternational goals by providing an enabling environment. Further, PAIR facilitates resourcemobilization for the sector and overall national development planning and public expendituremanagement. In addition, the sector is crucial as it provides macroeconomic policy which isessential for the performance of the AR&UD sector. The PAIR sector facilitates creation ofnew markets for the sector’s products and foreign direct investment. The AR&UD sectorsupports PAIR through collection of Appropriations in Aid (AIA), revenue and facilitation offoreign investments.
VII. National SecuritySecurity is important for the sector as it creates an enabling environment for investments.The national security promotes public security and minimizes conflicts in the sector resultingin increased productivity. The AR&UD sector on its part supports National Security bysafeguarding food security and provision of land information.
VIII. Social Protection, Culture and RecreationThe sector is supported by the Social Protection, Culture and Recreation Sector in terms of aworking environment which is conducive for the development of sector activities. Accurateinformation on gender imbalance, vulnerable groups, youth talents and viable areas of
95
investment is critical for proper planning in the sector. The AR&UD sector on its partprovides planning for recreational facilities and employment opportunities.
IX. Environment Protection, Water and Natural ResourcesThe sector works with the Environment Protection, Water and Natural Resources sector forpurposes of environmental sustainability. Sustainable environmental management is essentialfor maintenance of the sector’s productivity, mitigation and adaptation of climate change.Vegetation cover helps in reducing soil erosion, increase water availability and landproductivity. Water is important for irrigation of crop and fodder thereby increasing foodsecurity. The ARUD sector also documents fragile ecosystems for conservation andprotection thus enhancing environmental sustainability.
4.2 Emerging Issues and ChallengesSome of the emerging issues/challenges affecting the sector include;
i) Inadequate funding to the sectorThe current level of government funding to the sector is generally low compared to theresource requirements and this hampers the performance of the sector. For instance resourceshave not been availed to implement provisions in the constitution and new legislations suchas conversion of freehold land belonging to foreigners and lease land from 999 to 99 years.
ii) Delays in disbursement of exchequerDelays and non-disbursement of exchequer has also impacted negatively on implementationof the sector programmes resulting to pending bills. For instance, in the last financial year(2014/15 FY) supplementary estimates were approved towards the end of the financial year(end of June) making it difficult for the sector to undertake planned programmes. Therequirement that pending bills form the first charge at the beginning of the financial yearaffects implementation of planned activities
iii) Approval of policies and enactment of billsThere have been delays in approval of policies and enactment of bills in the sector henceaffecting issues of compensation and execution of mandate. Examples include MetropolitanAreas Bill, Community Land Bill, Eviction and Resettlement Procedure Bill, PhysicalPlanning Bill, and amendments of Land Act and Land Registration Act. The rules andregulations to operationalize the National Land Commission Act, Land Registration Act andthe Land Act have not been passed by parliament.
iv) Land succession managementLand succession cases especially for deceased persons take too long to be finalized thereforeimpacting negatively on land tenure. This further affect utilization and development of land.
v) Competing land useCompeting land use due to rapid population growth and urbanization has resulted to landfragmentation and environmental degradation thus impacting negatively on the sector.
96
vi) High poverty levelsHigh poverty level in the ARUD sector is a challenge to adoption of appropriate technology,investment and sustainable production.
vii) Inadequate markets and infrastructureMarketing of the sector’s produce is affected by inadequate market information, marketinfrastructure, and supportive infrastructure such as roads, cold storage facilities and energyleading to post harvest losses. The dependence on a few external market outlets makesagricultural exports vulnerable to changes in the demand and unexpected non-trade barriersby foreign markets.
viii) Limited use of appropriate technologyThe potential of research and development in the sector is not fully exploited. Although thecountry has a well-developed research and development infrastructure, there is a weakresearch-extension linkage and low adoption of technology and innovations. This has led tolow productivity and inefficiency in the sector.
ix) Limited access to financial servicesThe current high interest rates make it difficult for most sector stakeholders to accessfinancial and credit services. Further, the formal financial system is yet to develop financialproducts and services that are particularly suitable to the sector activities and pro-poor.
x) High incidence of HIV/AIDS, malaria and other diseasesThere is a high incidence of HIV/AIDs and other diseases in the country. These diseases haveresulted in the loss of productive human resources hence reducing productivity of the sector.
xi) InsecurityThe country has experienced insecurity that has affected the sector negatively. The recentterrorism threats affected the tourism industry which is a key market for the sectors products.Fishing in deep seas is also hampered by insecurity denying the country much neededrevenue. In addition conflicts among pastoralist communities over pasture and water havealso impacted negatively on livestock development.
xii) High cost of productionMost of the inputs used by the sector are imported. These imports are expensive and faceprice fluctuations due to fluctuating changes in foreign exchange rates. This makes the costof production high hence reducing earnings for producers in the sector.
xiii) Climate ChangeClimate change is as a result of global warming. The manifestation of climate changeincludes extreme and unpredictable weather patterns and rise of sea level. This is causingchallenges such as frequent and prolonged droughts, frost, floods and emerging new pestsand diseases which impact negatively on the sustainability of the sector activities.

97
xiv) Transition issuesAfter devolution of functions to the counties as per schedule IV of the constitution, someprojects that had been initiated by the National Government stalled due to failure by CountyGovernments to take over the projects. Examples are the Economic Stimulus Projects (ESP)that had been initiated to spur up to the economy. Other challenges include conflictinginterpretation of current legislations that has hampered implementation of certain provisionsin the constitutions within the sector.

98
CHAPTER FIVE5. CONCLUSIONAgriculture Rural and Urban Development (ARUD) Sector plays a key role in acceleratingeconomic growth through enhancing food security, income generation, employment andwealth creation, foreign exchange earnings as well as enhancing accessibility andconnectivity. The sector directly contributes 25.9 percent of the GDP and approximately 27percent to GDP through linkages with manufacturing, distribution and other service relatedsectors. It further accounts for about 65 percent of Kenya’s total exports, 18 percent and 60percent of the formal and total employment respectively. ARUD sector has been identified asone of the six sectors aimed at delivering the 10 percent economic growth rate under theVision 2030.
During the period 2012/13, 2013/14 and 2014/15, the Sector’s total allocation wasKsh.60,227 million, 68,748 million and Ksh.79,146 million against actual expendituretotaling to Ksh.51,659 million, Ksh.51,659 million and Ksh.62,522 million respectively.These translates into absorption rates of 85.8%, 75.1% and 79% for the three financial yearsconsecutively.
Out of the allocated funds for the period, the Sector was able to achieve the following:created a conducive business environment; invested in agricultural transformation and foodsecurity; supported the devolution for better services; adoption of research and innovation toenhance production; and enhanced economic development through pro- poor initiatives.
Despite endeavors to achieve its objectives, the Sector has over the period under reviewexperienced various challenges including: delays in disbursement of exchequer resulting topending bills; limited access to financial and credit services; competing land use; inadequatemarkets and infrastructure; and delayed enactment of enabling legislation.
Sector resource requirement for 2016/17 is Ksh154,281 million that is Ksh.38,629 million forRecurrent and Kshs. 115,652 million for Development against a ceiling of Ksh.16,121million for Recurrent and Kshs. 53,047 million for Development expenditures.
As per the Vision 2030 targets, the Sector aims at raising incomes in agriculture, livestockand fisheries even as industrial production and the service sector expand. This will beaccomplished through innovative, commercially oriented and modern agriculture, livestockand fisheries sector. The Sector also targets to implement the land reforms for socialeconomic and political development. The sector will also continue to partner, collaborate andnetwork with other stakeholders in implementation of these programmes.
99
CHAPTER SIX6. RECOMMENDATIONSThe sector has a number of programmes to implement so as to enhance service delivery tothe public. As such the sector will require increased funding to enable implementation of thekey programmes/projects. For the sector to achieve these, the following are keyrecommendations:
1. The National Treasury needs to ensure adequate and timely release of allocated funds foreffective and efficient implementation of projects and programs. The delay in thedisbursement of funds needs to be addressed as it results to pending bills.
2. There is need to fast track finanilization of pending policies and legal frameworks.
3. There is need to enhance linkages and build stronger collaboration with stakeholders tominimize duplication of activities and ensure sustainable food security and efficientservice delivery.
4. Develop a framework that will entrench the role of Alternative Dispute Resolution (ADR)and Traditional Dispute Resolution (TDR) mechanism in resolving land disputes.
5. Fast track climate change mitigation and adaptation measures implementation in linewith Kenya Climate Change Response Strategy 2010 and National Action Plan 2013-2017.
6. Fast track completion of stalled ESP projects and other projects and handing them over torespective counties.
7. Monitoring and evaluation framework should be strengthened for efficient utilization ofresources.

100
REFERENCES
1. The Constitution of the Republic of Kenya2. Kenya Vision 2030 and its Second MTP 2013-20173. Handbook of National Reporting Indicators4. Agriculture, Rural & Urban Development Sector Report 2015/16.5. Treasury Circular No. 15/2015 of 13th August, 20156. Treasury Circular No. 17/2015 of 14th September, 20157. Programme Performance Review Reports for 2011/12-2013/148. Programme Based Budget for 2015/169. Ministerial Monitoring & Evaluation reports10. Programme Based Budgeting manual11. Country-wide county consultation report, 2011

101
APPENDICESAnnex I: Capital ProjectsCAPITAL PROJECTSPROJECT 1:AGRICULTURE SECTOR DEVELOPMENT SUPPORT PROGRAMME (ASDSP)Contract date: 2012Contract Cost: 6.087 billionCompletion Stage 2012/13: 16%Budget Provision 2012/13: Kshs1,000 million
Contract Completion date:2017Expected Final Cost: 6.087billionCompletion Stage 2013/14:31.8%Budget Provision 2013/14 :Kshs1,000 million
Location: NationwideExpected Completion date: 2017Completion Stage 2014/15 44.8%Budget Provision 2014/15:Kshs1,559.5 million
Brief overview of the specific needs to be addressed by the project: To support the transformation ofKenya’s Agricultural sector into an innovative, commercially oriented, competitive and modern industry thatwill contribute to poverty reduction and improved food security in rural and urban Kenya.Project 2:SMALL SCALE HORTICULRE DEVELOPMENT PROJECT (SHDP)Contract date: 2008Contract Cost: 2,075.5 MillionCompletion Stage 2012/13 (70%)Budget Provision 2012/13: Kshs565.5 million
Contract Completion date:2014Expected Final Cost: 2,075.5Million.Completion Stage 2013/14(95%) Budget Provision2013/14 (Kshs) 300,million
Expected Completion date: 2015Completion Stage 2014/15 (95%)
Budget Provision 2014/15 (Kshs)474,458,040
Brief overview of the specific needs to be addressed by the project: To contribute to poverty reduction andfood security in rural Kenya through increasing household incomes of small-scale horticultural producers in theproject area by increasing production of horticultural products and enhanced marketing.
Project 3: SMALLHOLDER HORTICULTURE MARKETING PROGRAMME (SHoMaP)Contract date: 2007Contract Cost: 2.3 billionCompletion Stage 2012/13 (60 %)Budget Provision 2012/13: Kshs973.8 million
Contract Completion date:2014Expected Final Cost: 2.3BillionCompletion Stage 2013/14 (79%)Budget Provision 2013/14(Kshs) 646million
Location:7 countiesExpected Completion date:2015Completion Stage 2014/15 (98%)
Budget Provision 2014/15 (Kshs)651million
Brief overview of the specific needs to be addressed by the project: To increase incomes and reducepoverty among poor rural households in medium/high potential areas for which horticulture is a source oflivelihood; and increase the health and welfare of Kenyans by improving the quality and increasing the quantityof horticultural produce consumed within the country.
Project 4:KENYA AGRICULTURAL PRODUCTIVITY AND AGRIBUSINESS PROJECT(KAPAP)Contract date: 2010Contract Cost: 6.7 billionCompletion Stage 2012/13 (58%)Budget Provision 2012/13(Kshs)400milllion
Contract Completion date:2014Expected Final Cost: 6.7 BCompletion Stage 2013/14(65%)Budget Provision 2013/14(Kshs)2.591billion
Location: 20 countiesExpected Completion date: 2015Completion Stage 2014/15 (80%)Budget Provision 2014/15(Kshs)1.0664 billion
Brief overview of the specific needs to be addressed by the project: To contribute positively towardsimproved livelihoods of 2.5 million smallholder farmers, through the promotion of access, utilization of farminputs and provision of support servicesProject 5:EASTERN AFRICA AGRICULTURAL PRODUCTIVITY PROJECT(EAAPP)

102
CAPITAL PROJECTSContract date: Feb 2009Contract Cost: Kshs. 2 BillionCompletion Stage 2012/13: 55%Budget Provision 2012/13:Kshs400milllion
Contract Completion date:Feb 2015Expected Final Cost: Kshs2BillionCompletion Stage 2013/14:63%Budget Provision 2013/14:Kshs 468 million
Expected Completion date: Feb 2015Completion Stage 2014/15: 80%Budget Provision 2014/15: Kshs901.2 million
Brief overview of the specific needs to be addressed by the project: To increase agricultural productivityand growth by enhancing regional specialization in agricultural research and to facilitate increased sharing ofidentified agricultural technologies.Project 6:KENYA AGRICULTURAL PRODUCTIVITY AND SUSTAINABLE LANDMANAGEMENT PROJECT (KAPSLM)Contract date: November 2010Contract Cost: 1 billionCompletion Stage 2012/13: 56%Budget Provision 2012/13: Kshs431 million
Contract Completion date:December 2014Expected Final Cost: 1 billionCompletion Stage 2013/14:72%Budget Provision 2013/14:Kshs 152 million
Expected Completion date: December2014 Completion Stage2013/14: 90%Budget Provision 2013/14 (Kshs)158.5 million
Brief overview of the specific needs to be addressed by the project: To promote sustainable use of naturalresources for higher productivity and incomes for the rural farmers of Kenya and the maintenance of criticalecosystem function in degraded and environmentally sensitive areas. This is done by assisting agriculturalproducers to adopt environmentally-sound land management practices without sacrificing their economicwelfare in the targeted operational areas.Project 7: DROUGHT RESILLIENCE AND SUSTAINABLE LIVELIHOOD PROGRAMME IN THEHORN OF AFRICA(DRSLP)Contract date: July, 2013Contract Cost: 5,479 million.Completion Stage 2012/13 N/ABudget Provision 2012/13 (Kshs)N/A
Contract Completion date:June, 2018Expected Final Cost: 5,479Billion.Completion Stage 2013/14:6%Budget Provision 2013/14:
Kshs 324 million
Expected Completion date: June,2018Completion Stage 2014/15: 11.3%Budget Provision 2014/15Kshs 295 million
Brief overview of the specific needs to be addressed by the project: To contribute to poverty reduction, foodsecurity and accelerated sustainable economic growth in the Horn of Africa (HOA) through enhanced ruralincomes by enhancing drought resilience and improve sustainable livelihoods of the communities in the aridand semi- arid lands of KenyaPROJECT 8: KENYA CEREALS ENHANCEMENT PROJECT (KCEP)Contract date: 2014Contract Cost: Kshs 3 billionCompletion Stage 2012/13 (%)N/ABudget Provision 2012/13: (Kshs)N/A
Contract Completion date:2022Expected Final Cost: Kshs 3BCompletion Stage 2013/14 (%)N/ABudget Provision 2013/14(Kshs) N/A
Expected Completion date:2022
Completion Stage 2014/15: 1%Budget Provision 2014/15: Kshs 96.5million
Brief overview of the specific needs to be addressed by the project: Support to commercialization of cerealvalue chainsPROJECT 9: KENYA ADAPTATION TO CLIMATE CHANGE IN ARID AND SEMI ARID LANDS(KACCAL)Contract date: 2012Contract Cost:550 millionCompletion Stage 2012/13: 15%
Contract Completion date:2016Expected Final Cost: 550 M
Expected Completion date: 2016Completion Stage 2014/15: 29 %Budget Provision 2014/15: Kshs240

103
CAPITAL PROJECTSBudget Provision 2012/13: Kshs80.7 million
Completion Stage 2013/14:20%Budget Provision 2013/14:Kshs 258 million
million
Brief overview of the specific needs to be addressed by the project: Mitigation of effects of climate changein ASALS to increase agricultural productivity and improve livelihoodsPROJECT 10: PROJECT ON ENHANCING GENDER RESPONSIVE EXTENSION SERVICES(PEGRES)Contract date: Sept 2014Contract Cost: Kshs 396.8 MCompletion Stage 2012/13 (%)N/ABudget Provision 2012/13: (Kshs)N/A
Contract Completion date:Aug 2017Expected Final Cost: 396.8 MCompletion Stage 2013/14 (%)N/ABudget Provision 2013/14:(Kshs) N/A
Expected Completion date: Aug 2017Completion Stage 2014/15:12.8%Budget Provision 2014/15 (Kshs):86.8 M
Brief overview of the specific needs to be addressed by the project: Closing the gender gap in agricultureto achieve gender equity in resource access and control for agricultural production.PROJECT 11: SMALL HOLDER HORTICULTURE EMPOWERMENT PROJECT UNIT PROJECT(SHEP-UP)Contract date: 2009Contract Cost: Kshs 389 millionCompletion Stage 2012/13 42%Budget Provision 2012/13: Kshs 80million
Contract Completion date:Expected Final Cost: Kshs389 M Completion Stage2013/14 62%Budget Provision 2013/14:Kshs88 million
Expected Completion date:2015Completion Stage 2014/15: 83%Budget Provision 2014/15: Kshs 80million
Brief overview of the specific needs to be addressed by the project: Improve incomes of small holdersthrough technology transfer
PROJECT 12: STRENGTHENING FERTILIZER QUALITY AND REGULATORY STANDARDS(AGRA)Contract date: 2014Contract Cost: Ksh.41 MillionCompletion Stage 2012/13 (%)N/ABudget Provision 2012/13 (Kshs)N/A
Contract Completion date:Expected Final Cost: 2017Completion Stage 2013/14 (%)N/ABudget Provision 2013/14(Kshs)N/A
Expected Completion date:2017/18Completion Stage 2014/15 : 1.2 %Budget Provision 2014/15 (Kshs):25million
Brief overview of the specific needs to be addressed by the project: To improve crop productivity andsmallholder incomes through strengthening fertilizer quality and regulatory standards.Brief overview of the specific needs to be addressed by the project: To improve incomes of small holderfarmers through technology transfer and peer learning through upscaling the experiences and successes theproject predecessor, SHEP -UP.
PROJECT 13: 2KR AGRICULTURAL MACHINERY PROJECTContract date: 2013Contract Cost:KSh433 millionCompletion Stage 2012/13 (%)N/ABudget Provision 2012/13: (Kshs)N/A
Contract Completiondate:2015Expected Final Cost:Kshs 433 millionCompletion Stage 2013/14:7%Budget Provision 2013/14Kshs7.5 million
Expected Completion date: 2015Completion Stage 2014/15 : 100%Budget Provision 2014/15: Kshs:250million
Brief overview of the specific needs to be addressed by the project: Facilitate availability of agriculturalmachinery to increase efficiency of agricultural operations for improved agricultural productivity, outputs andfood security.

104
CAPITAL PROJECTSPROJECT 14: SCIENCE AND TECHNOLOGY RESEARCH PROGRAMME SUPPORT –(SATREPS)Contract date: 2014Contract Cost: KSh300MCompletion Stage 2012/13 (%)N/ABudget Provision 2012/13(Kshs)N/A
Contract Completion date:2017Expected Final Cost: KshsCompletion Stage 2013/14 (%)N/ABudget Provision 2013/14(Kshs)N/A
Expected Completion date: 2017Completion Stage 2014/15 : 18%Budget Provision 2014/15(Kshs):53.1million
Brief overview of the specific needs to be addressed by the project: Strengthen Rice Based Agriculturalresearch for improved productivity and outputsPROJECT 15: FOOD SECURITY AND DROUGHT RESILIENCE PROJECTContract date: 2014Contract Cost: Kshs 1 billionCompletion Stage 2012/13: (%)N/ABudget Provision 2012/13(Kshs)Nil
Contract Completion date:2018Expected Final Cost: Kshs 1billionCompletion Stage 2013/14:(%) N/ABudget Provision 2013/14(Kshs)Nil
Expected Completion date:Completion Stage 2014/15 : 10%Budget Provision 2014/15: Kshs 300million
Brief overview of the specific needs to be addressed by the project: To diversify agricultural enterprise forfood security and incomes with focus in Oil crops, Cassava and Soya beans value chainsPROJECT16: FOOD SECURITY DIVERSIFICATION PROJECTContract date: 2014Contract Cost:KSh1,395millionCompletion Stage 2012/13 (%)N/ABudget Provision 2012/13(Kshs)N/A
Contract Completion date:Expected Final Cost:Kshs 1,395 millionCompletion Stage 2013/14(%) N/ABudget Provision 2013/14(Kshs)N/A
Location: Baringo, KiambuExpected Completion date: 2019Completion Stage 2014/15 : 20%Budget Provision 2014/15 (Kshs):279million
Brief overview of the specific needs to be addressed by the project: Diversification of agriculturalenterprises to mitigate against the effects of Maize Lethal Necrosis Disease (MLND) and for food securityimprovement.PROJECT 17: SMALLHOLDER IRRIGATION PROGRAMME MT KENYA REGION –(SIPMIK)Contract date: 2005Contract Cost: Kshs 1550MCompletion Stage 2012/13: N/A%Budget Provision 2012/13: Kshs:Nil
Contract Completion date:2018Expected Final Cost:Kshs 1550 millionCompletion Stage 2013/14:N/ABudget Provision 2013/14Kshs: Nil
Location: Mt. Kenya RegionExpected Completion date: 2018Completion Stage 2014/15 : 29%Budget Provision 2014/15: Kshs 450million
Brief overview of the specific needs to be addressed by the project: To increase household incomes ofsmall holder farmers through introduction of intensive irrigated farmingPROJECT 18: SUSTAINABLE SMALL HOLDER IRRIGATION DEVELOPMENT ANDMANAGEMENT (SIDEMAN- SAL)Contract date: 2013Contract Cost: Kshs 2,500 millionCompletion Stage 2012/13: N/ABudget Provision 2012/13: KshsNil
Contract Completiondate:2018Expected Final Cost:Kshs2500millionCompletion Stage 2013/14:N/ABudget Provision 2013/14:Kshs Nil
Expected Completion date: 2018Completion Stage 2014/15:18%Budget Provision 2014/15: Kshs 445million
Brief overview of the specific needs to be addressed by the project: Improve food security and income of

105
CAPITAL PROJECTSKenyans through sustainable rice production, marketing and utilization by doubling rice production in bothrain-fed and irrigated ecologies by 2018.Project 19: SMALL HOLDER IRRIGATION PROGRAMMEContract date: 2013Contract Cost: 2.9 billionCompletion Stage 2012/13: 26%Budget Provision 2012/13: Kshs500 million
Contract Completiondate:2018Expected Final Cost:2.9BCompletion Stage 2013/14 (%)35%Budget Provision 2013/14:Kshs 500million
Location: 17 countiesExpected Completion date: 2018Completion Stage 2014/15 (%): 40%Budget Provision 2014/15: Kshs1,000million
Brief overview of the specific needs to be addressed by the project: To improve agricultural productivitynational food security by expansion of smallholder agriculture and reduce reliance on rain fed agriculture.
PROJECT 20: GALANA KULALU FOOD SECURITY PROJECT
Contract date: 2013Contract Cost: Kshs250 billionCompletion Stage2012/13: (%)N/ABudget Provision2012/13: (Kshs) N/A
Contract Completion date: 2017Expected Final Cost: Kshs 495 billionCompletion Stage 2013/14: 5%Budget Provision 2013/14 Kshs 4.5 billion
Location: Tana River and KilificountiesExpected Completion date: 2018Completion Stage 2014/15 : 40%Budget Provision 2014/15: Kshs 3.5billion
Brief overview of the specific needs to be addressed by the project: To address food security throughopening up 1 million acres for irrigation targeting diversified investments on whole value chain approach,starting with a 10,000 acre model farm.PROJECT 21: ASAL AGRICULTURAL PRODUCTIVITY RESEARCH PROJECT (ASAL APRP)Contract Date: 1 May2012Contract Cost: Kshs839millionCompletion stage2012/13: 10%Budget Provisions2012/13 KES 208million
Contract Completion date: 1st
May 2017Expected Final Cost: Kshs838.8 millionCompletion Stage: 2013/1425%Budget provision: 2013/14
152 million
Location: All ASAL areasExpected Completion date: 1st May 2017Completion Stage 2014/15: 50%Budget Provision 2014/15:Kshs 280 million
Brief overview of the specific needs to be addressed by the project: Increase agricultural productivity ofthe ASAL areas through production and distribution and application of appropriate technologiesPROJECT 22: STATE OF THE ART TEA RESEARCH AND DEVELOPMENT FACTORYContract Date: July2014Contract Cost: Kshs276 millionCompletion stage2012/13: 0%Budget Provisions2012/13: Kshs 0
Contract Completion date:May 2017Expected Final Cost: 276millionCompletion Stage 2013/14:24%Budget provision 2013/14
Kshs 66 million
Location: KALRO TRI -,KerichoExpected Completion date: June 2016Completion Stage 2014/15: 67%Budget Provision 2014/15: Kshs 119.7 million
Brief overview of the specific needs to be addressed by the project: Tea Quality Improvement forenhancement of tea earnings, creating a tea research reference facility in KenyaPROJECT 23: COFFEE PRODUCTIVITY PROJECT (CPP)Contract Date: 17th
June 2013Contract Cost :EurosKES 226.26m)Completion stage
Contract Completion date:17th June 2017Expected Final Cost: KES226.26m Completion Stage2013/14:9.4%
Location: All coffee growing counties/areasExpected Completion date: 17th June 2017Completion Stage 2014/15: 35%Budget Provision 2014/15 (KES): 50 million

106
CAPITAL PROJECTS2012/13: 0%Budget Provisions2012/13: 0
Budget provision 2013/14:KES 75.04million
Brief overview of the specific needs to be addressed by the project: Contribute to reduction of rural povertythrough increasing the income levels of coffee growers and to increase coffee export revenues throughincreased coffee production at the household and national levelPROJECT 24:THE NATIONAL EXPANDED IRRIGATION PROGRAMMEContract date: 2013Contract Cost: 20.8BCompletion Stage2012/13: 12%Budget Provision2012/13: Kshs 4 billion
Contract Completion date:2018Expected Final Cost: 20.8billionCompletion Stage 2013/14:
20%Budget Provision 2013/14:Kshs 4.5 billion
Location: NationwideExpected Completion date:2018Completion Stage 2014/15: 25%Budget Provision 2014/15: Kshs 5 billion
Brief overview of the specific needs to be addressed by the project: To improve Agricultural production,productivity and national food security by expansion of irrigated agriculture.PROJECT 25: CONSTRUCTION AND REFURBISHMENT – AHITI-KABETEContract date: July2012Contract Cost: Kshs140 millionContract CompletionStage 2012/13: 5%Budget Provision2012/13: Kshs. 17million
Completion date: 30.06.2020Expected Final Cost: Kshs 200millionBudget Provision 2013/14:Kshs. 52 millionCompletion Stage 2013/14:15%
Expected Completion date:30.06.2020Completion Stage 2014/15: 45%Budget Provision 2014/15: Kshs. 22 million
Brief overview of the specific needs to be addressed by the project: construction of perimeter wall,refurbishment of hostels, classrooms, laboratories, offices, improvement of sewerage and water system.PROJECT 26: CONSTRUCTION – AHITI- NYAHURURU (NEW SITE)Contract date: 07.07.2012 Contract Completion date: 30.06.2020: Expected Completion date:30.06.2020Contract Cost: Kshs 275 million Expected Final Cost: Kshs 275 millionCompletion Stage 2012/13:5% Completion Stage 2013/14 (20%) Completion Stage 2014/15: 22%Budget Provision2012/13: Kshs.29million
Budget Provision 2013/14Kshs14 millions)
Budget Provision 2014/15: Kshs 12 million
Brief overview of the specific needs to be addressed by the project: Construction of buildings(administration block , classrooms, laboratories, kitchen and dining hall , hostels and other infrastructure forrelocation of the institute and staff housesPROJECT 27: CONSTRUCTION AND REFURBISHMENT – AHITI-NDOMBAContract date: 12.08.2012 Contract Completion date: 30.09.2018 Expected Completion date:30.09.2018Contract Cost: Kshs 120 million Expected Final Cost: Kshs 150 millionCompletion Stage 2012/13:15% Completion Stage 2013/14: 28% Completion Stage 2014/15: 57%Budget Provision2012/13: Kshs 28million
Budget Provision 2013/14:Kshs. 14 millions
Budget Provision 2014/15: Kshs. 11 millions
Brief overview of the specific needs to be addressed by the project: Refurbishment of hostels, class rooms,library, kitchen and dining hall, water supplies, farm development.PROJECT 28: CONSTRUCTION AND REFURBISHMENT – MEAT TRAINING INSTITUTEContract date: Sept 2012 Contract Completion date: Dec 2016 Expected Completion date: Dec 2016Contract Cost: Kshs 110.7 million Expected Final Cost: Kshs 150 millionCompletion Stage 2012/13: 14.4% Completion Stage 2013/14: 21.7% Completion Stage 2014/15 (44%)Budget Provision2012/13: Kshs 16
Budget Provision 2013/14:Kshs. 8 million
Budget Provision 2014/15: Kshs 27 million

107
CAPITAL PROJECTSmillionsBrief overview of the specific needs to be addressed by the project: construction of hostels , classrooms ,laboratories and other infrastructure developmentPROJECT 29: : CONSTRUCTION AND REFURBISHMENT – REGIONAL PASTORAL TRAININGCENTRE – GRIFTUContract date: 18.07.2012 Contract Completion date: 30.18.2018 Expected Completion date:30.08.2018Contract Cost: Kshs 150 million Expected Final Cost: Kshs 150 millionCompletion Stage 2012/13: 35% Completion Stage 2013/14 (46%) Completion Stage 2014/15: 52%Budget Provision2012/13: Kshs. 53million
Budget Provision 2013/14:Kshs. 16 million
Budget Provision 2014/15: Kshs. 14 million
Brief overview of the specific needs to be addressed by the project: Construction of hostels , laboratoriesand farm developmentPROJECT 30: CONSTRUCTION AND REFURBISHMENT – DAIRY TRAINING INSTITUTEContract date: 09.08.2013 Contract Completion date: 28.12.2016 Expected Completion date:28.12.2016Contract Cost: 100M Expected Final Cost: 150MCompletion Stage 2012/13 (%) Completion Stage 2013/14 (11%) Completion Stage 2014/15 (25%)Budget Provision2012/13: Kshs. 0
Budget Provision 2013/14:Kshs. 14 millions
Budget Provision 2014/15: Kshs.24millions
Brief overview of the specific needs to be addressed by the project: Refurbishment of hostels, laboratories ,perimeter fencing , construction of conference facilities and farm developmentPROJECT 31: CONSTRUCTION AND REFURBISHMENT – REGIONAL PASTORAL TRAININGCENTRE - NAROKContract date: Nov 2012 Contract Completion date: Dec 2017 Expected Completion date: Dec .2017Contract Cost: 20M Expected Final Cost: 40MCompletion Stage 2012/13: 9% Completion Stage 2013/14: 17% Completion Stage 2014/15:24%Budget Provision2012/13: Kshs. 4millions
Budget Provision 2013/14:Kshs. 3 million
Budget Provision 2014/15: Kshs. 3millions
Brief overview of the specific needs to be addressed by the project: Rehabilitation of hostels and farmdevelopmentPROJECT 32: : LIVESTOCK INSURANCE SCHEMEContract date: 2014 Contract Completion date: Dec 2018 Expected Completion date: Dec 2018Contract Cost: Kshs. 20 million Expected Final Cost: Kshs. 2 billionCompletion Stage 2012/13 Completion Stage 2013/14 Completion Stage 2014/15 (1%)Budget Provision2012/13 (Kshs.) Nil
Budget Provision2013/14(Kshs.) Nil
Budget Provision 2014/15 (Kshs. 22 millions
Brief overview of the specific needs to be addressed by the project: To cushion Kenyan pastoralcommunities against drought related loss of livestock through insurance coverPROJECT 33: SMALL HOLDER DAIRY COMMERCIALIZATION PROGRAMME (SDCP)Contract date: July 2006 Contract Completion date: March 2016 Expected Completion date: Sept2015Contract Cost: Kshs 1.5 billion Expected Final Cost: Kshs 1.5 billion Completion Stage2012/13(82%) Completion Stage 2013/14: 85% Completion Stage 2014/15: 54%Budget Provision2012/13: Kshs. 276million
Budget Provision 2013/14:Kshs. 278 million
Budget Provision 2014/15: Kshs. 405 million
Brief overview of the specific needs to be addressed by the project: Improve the financial return of marketoriented production and trade activities by small holder operators. Enable more rural households to createemployment through expanded opportunities for market oriented dairy activitiesPROJECT 34: CONSTRUCTION AND REFURBISHMENT – SHEEP & GOAT BREEDING FARMS
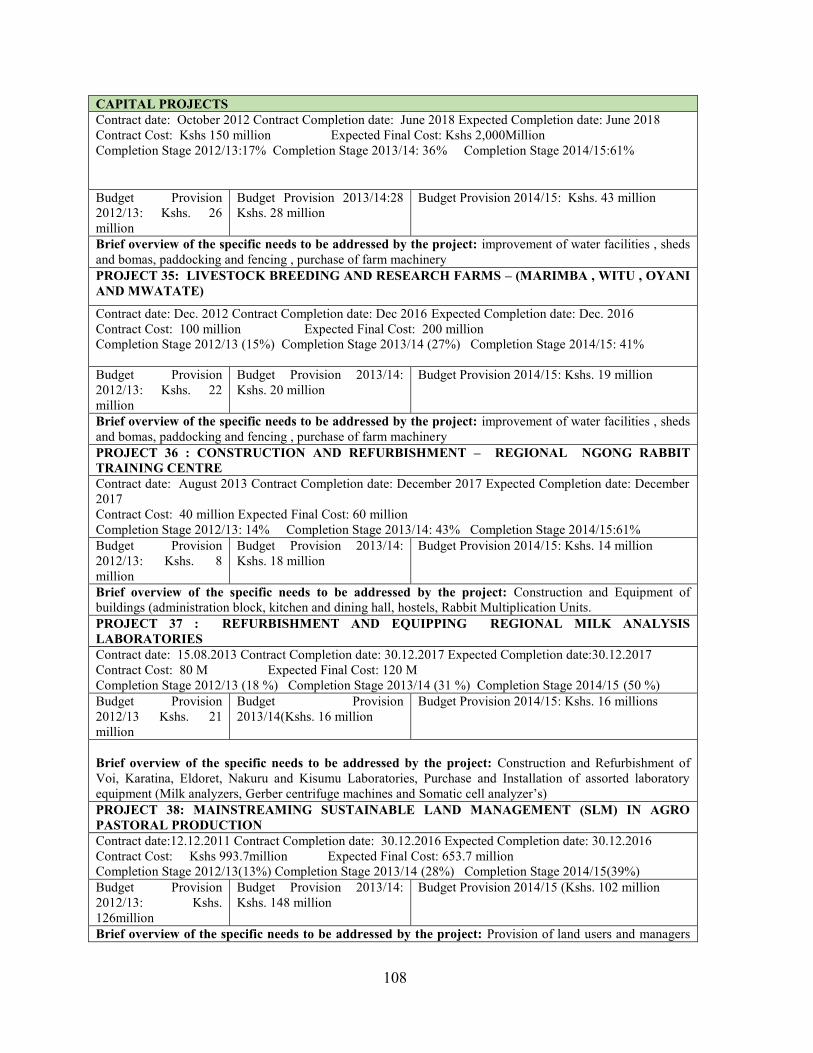
108
CAPITAL PROJECTSContract date: October 2012 Contract Completion date: June 2018 Expected Completion date: June 2018Contract Cost: Kshs 150 million Expected Final Cost: Kshs 2,000MillionCompletion Stage 2012/13:17% Completion Stage 2013/14: 36% Completion Stage 2014/15:61%
Budget Provision2012/13: Kshs. 26million
Budget Provision 2013/14:28Kshs. 28 million
Budget Provision 2014/15: Kshs. 43 million
Brief overview of the specific needs to be addressed by the project: improvement of water facilities , shedsand bomas, paddocking and fencing , purchase of farm machineryPROJECT 35: LIVESTOCK BREEDING AND RESEARCH FARMS – (MARIMBA , WITU , OYANIAND MWATATE)
Contract date: Dec. 2012 Contract Completion date: Dec 2016 Expected Completion date: Dec. 2016Contract Cost: 100 million Expected Final Cost: 200 millionCompletion Stage 2012/13 (15%) Completion Stage 2013/14 (27%) Completion Stage 2014/15: 41%
Budget Provision2012/13: Kshs. 22million
Budget Provision 2013/14:Kshs. 20 million
Budget Provision 2014/15: Kshs. 19 million
Brief overview of the specific needs to be addressed by the project: improvement of water facilities , shedsand bomas, paddocking and fencing , purchase of farm machineryPROJECT 36 : CONSTRUCTION AND REFURBISHMENT – REGIONAL NGONG RABBITTRAINING CENTREContract date: August 2013 Contract Completion date: December 2017 Expected Completion date: December2017Contract Cost: 40 million Expected Final Cost: 60 millionCompletion Stage 2012/13: 14% Completion Stage 2013/14: 43% Completion Stage 2014/15:61%Budget Provision2012/13: Kshs. 8million
Budget Provision 2013/14:Kshs. 18 million
Budget Provision 2014/15: Kshs. 14 million
Brief overview of the specific needs to be addressed by the project: Construction and Equipment ofbuildings (administration block, kitchen and dining hall, hostels, Rabbit Multiplication Units.PROJECT 37 : REFURBISHMENT AND EQUIPPING REGIONAL MILK ANALYSISLABORATORIESContract date: 15.08.2013 Contract Completion date: 30.12.2017 Expected Completion date:30.12.2017Contract Cost: 80 M Expected Final Cost: 120 MCompletion Stage 2012/13 (18 %) Completion Stage 2013/14 (31 %) Completion Stage 2014/15 (50 %)Budget Provision2012/13 Kshs. 21million
Budget Provision2013/14(Kshs. 16 million
Budget Provision 2014/15: Kshs. 16 millions
Brief overview of the specific needs to be addressed by the project: Construction and Refurbishment ofVoi, Karatina, Eldoret, Nakuru and Kisumu Laboratories, Purchase and Installation of assorted laboratoryequipment (Milk analyzers, Gerber centrifuge machines and Somatic cell analyzer’s)PROJECT 38: MAINSTREAMING SUSTAINABLE LAND MANAGEMENT (SLM) IN AGROPASTORAL PRODUCTIONContract date:12.12.2011 Contract Completion date: 30.12.2016 Expected Completion date: 30.12.2016Contract Cost: Kshs 993.7million Expected Final Cost: 653.7 millionCompletion Stage 2012/13(13%) Completion Stage 2013/14 (28%) Completion Stage 2014/15(39%)Budget Provision2012/13: Kshs.126million
Budget Provision 2013/14:Kshs. 148 million
Budget Provision 2014/15 (Kshs. 102 million
Brief overview of the specific needs to be addressed by the project: Provision of land users and managers

109
CAPITAL PROJECTSwith the financial incentives, enabling policy, institutional capacity for effective adoption of sustainable landmanagement practices.PROJECT 39: BEE BULKING PROJECT – APICULTURE AND EMERGING LIVESTOCKSERVICESContract date: 08 08 2014 Contract Completion date: 30.12.2018 Expected Completion date:30.12.2018Contract Cost: Kshs 80 million Expected Final Cost: Kshs 43 millionCompletion Stage 2012/13: N/A Completion Stage 2013/14: N/A Completion Stage 2014/15:1 %Budget Provision 2012/13 (Kshs).Nil
Budget Provision 2013/14:(Kshs.) Nil
Budget Provision 2014/15 (Kshs. 3million
Brief overview of the specific needs to be addressed by the project: Improve honey and crop production inthe country.PROJECT 40: ESTABLISHMENT OF A BULL STATION AT ADC SABWANI COMPLEXContract date: 30: 09: 2014 Contract Completion date: 30.12.2017 Expected Completion date:30 06:19Contract Cost: Kshs 80 million Expected Final Cost: Kshs 700 millionCompletion Stage 2012/13 (0) Completion Stage 2013/14: N/A Completion Stage 2014/15: 30%Budget Provision 2012/13: (Kshs.)Nil
Budget Provision 2013/14:(Kshs) Nil
Budget Provision 2014/15: Kshs. 200million
Brief overview of the specific needs to be addressed by the project: Enhance capacity for semen productionin the countryPROJECT 41: CONSTRUCTION AND REFURBISHMENT – LEATHER SCIENCE INSTITUTEContract date: 15.08.2013 Contract Completion date: 30.12.2021 Expected Completion date:30.12.19Contract Cost: Kshs. 350 million Expected Final Cost: Kshs 350 millionCompletion Stage 2012/13: N/A Completion Stage 2013/14: N/A Completion Stage 2014/15: 3%Budget Provision 2012/13: (Kshs.)Nil
Budget Provision 2013/14:(Kshs) Nil
Budget Provision 2014/15: Kshs. 10million
Brief overview of the specific needs to be addressed by the project: Construction of buildings(administration block, classrooms, laboratories, kitchen and dining hall , hostels , staff houses and tanneryPROJECT 42: MODERNIZATION AND REHABILITATION OF KENYA MEATCOMMISSION(KMC)Contract date: 15.08.2013 Contract Completion date: 30.12.2021 Expected Completion date: 30. 12.19Contract Cost: Kshs 350 million Expected Final Cost: Kshs 3,100 millionCompletion Stage 2012/13: Completion Stage 2013/14 (%) Completion Stage 2014/15 (30%)Budget Provision 2012/13 (Kshs.)Nil
Budget Provision 2013/14:(Kshs. 300 million
Budget Provision 2014/15: Kshs.700million
Brief overview of the specific needs to be addressed by the project: Enhance processing of meat and meatproducts for export and local market.PROJECT 43: REGIONAL PASTORAL LIVELIHOODS RESILIENCE PROJECTContract date: 18.03.2014 Contract Completion date: 30.06.2019 Expected Completion date:30.06.2019Contract Cost: Kshs 8.5 billion Expected Final Cost: Kshs 8.5 billionCompletion Stage 2012/13: (%) N/A Completion Stage 2013/14: 1.5% Completion Stage 2014/15: 4.1%Budget Provision 2012/13 (Kshs):Nil
Budget Provision 2013/14:Kshs. 123 million
Budget Provision 2014/15 (Kshs.218 million
Brief overview of the specific needs to be addressed by the project: Enhanced livelihood resilience ofpastoral and agro pastoral communities in cross border drought prone areas and improve the capacity of thecountries to respond promptly and effectively to an eligible crisis or emergency.PROJECT 44: STANDARDS AND MARKETS ACCESS PROGRAMMEContract date: 01.06.2014 Contract Completion date: 31.12.2016 Expected Completion date:31.12.2016Contract Cost: Kshs 417 million Expected Final Cost: Kshs 417 millionCompletion Stage 2012/13: (%) N/A Completion Stage 2013/14(%) Completion Stage 2014/15(30%)Budget Provision 2012/13 (Kshs.)Nil
Budget Provision 2013/14:Kshs. 29 million
Budget Provision 2014/15: Kshs.212million
Brief overview of the specific needs to be addressed by the project: To enhance market access andcompetiveness of Kenya’s animal and plant based products through creator adoption of relevant international

110
CAPITAL PROJECTSstandards and improved regulations and enforcement in the country.PROJECT 45 : REFURBISHMENT EQUIPPING – NATIONAL BEE-KEEPING INSTITUTEContract date: 15.08.2013 Contract Completion date: 30.12.2017 Expected Completion date:30.12.2017Contract Cost: Kshs 80 million Expected Final Cost: Kshs 120 millionCompletion Stage 2012/13: N/A Completion Stage 2013/14 (48%) Completion Stage 2014/15 (74.8%)Budget Provision 2012/13: (Kshs.)Nil
Budget Provision 2013/14:Kshs. 59 million
Budget Provision 2014/15: Kshs. 16million
Brief overview of the specific needs to be addressed by the project: Construction of perimeter fence at theinstitute, purchase and installation of Liquid and Gas Mass Spectrometry and purchase of laboratory materialsPROJECT 46: ESTABLISHMENT OF DISEASE FREE ZONE (DFZ)Contract date: 27.08.2011 Contract Completion date: 30.06.2020 Expected Completion date:30.06.2020Contract Cost: Kshs 7,500 million Expected Final Cost: Kshs 7,500 millionCompletion Stage 2012/13: 5% Completion Stage 2013/14: 20% Completion Stage 2014/15: 45%Budget Provision 2012/13: Kshs.413 million
Budget Provision 2013/14:Kshs. 59 million
Budget Provision 2014/15: Kshs. 278million
Brief overview of the specific needs to be addressed by the project: Construction of Disease Free ZoningFacilities – Bachuma Livestock Export Zone, Miritini and Kurawa Quarantine stationsPROJECT 47 : EQUIPPING REFURBISHMENT AND CONSTRUCTION OF GUEST HOUSE-KIBOKOContract date: 15.08.2014 Contract Completion date: 30.12.19 Expected Completion date:30.12.19Contract Cost: Kshs 90 million Expected Final Cost: Kshs 90 millionCompletion Stage 2012/13 (%) Completion Stage 2013/14 (%) Completion Stage 2014/15 (6%)Budget Provision 2012/13 (Kshs.):Nil
Budget Provision2013/14(Kshs) Nil
Budget Provision 2014/15: Kshs. 5million
Brief overview of the specific needs to be addressed by the project: Enhancement of diagnostic capacity ofthe zoological laboratory and host visiting scientist at the stationPROJECT 48 : CONSTRUCTION AND REFURBISHMENT – CENTRAL VETERINARYLABORATORY – KABETEContract date: 25.05.2012 Contract Completion date: 30.12.2020 Expected Completion date:30.12.2020Contract Cost: Kshs 250 million Expected Final Cost: Kshs 350 millionCompletion Stage 2012/13: 19% Completion Stage 2013/14: 38% Completion Stage 2014/15 46%Budget Provision 2012/13: Kshs. 65million
Budget Provision 2013/14:(Kshs. 67 million
Budget Provision 2014/15: Kshs.29millions
Brief overview of the specific needs to be addressed by the project: Construction of BSL3 Laboratory ,refurbishment of old Kabete office blockPROJECT 49: CONSTRUCTION AND REFURBISHMENT – FOOT & MOUTH DISEASENATIONAL REFERENCE LABORATORYContract date: 15.07.2011 Contract Completion date: 30.12.2018 Expected Completion date:30.12.2018Contract Cost: Kshs. 253 million Expected Final Cost: Kshs 253 millionCompletion Stage 2012/13: (5%) Completion Stage 2013/14(16%) Completion Stage 2014/15 (23%)Budget Provision 2012/13 (Kshs):Nil
Budget Provision 2013/14:Kshs. 40 million
Budget Provision 2014/15: Kshs.19millions
Brief overview of the specific needs to be addressed by the project: Refurbishment of cold rooms, electricalworks, water and gas piping systems, animal houses and laboratory rooms. Construction of perimeter wallfence, re-roofing and replacement of old obsolete equipmentPROJECT 50: CONSTRUCTION AND REFURBISHMENT – REGIONAL VETERINARYINVESTIGATION LABORATORIESContract date: 18.08.2011 Contract Completion date: 15.05.2020 Expected Completion date:15.05.2020Contract Cost:400M Expected Final Cost: 500MCompletion Stage 2012/13: N/A Completion Stage 2013/14: 27% Completion Stage 2014/15: 47%Budget Provision 2012/13: (Kshs.)Nil
Budget Provision2013/14(Kshs. 106 millions
Budget Provision 2014/15: Kshs. 122million
Brief overview of the specific needs to be addressed by the project: Construction works at Garissa, Wituand Ukunda VILs and refurbishment of buildings & purchase of laboratory equipment for VlLs

111
CAPITAL PROJECTSPROJECT 51: CONSTRUCTION AND REFURBISHMENT – VETERINARY DIAGNOSTIC ANDEFFICACY TRIAL CENTRES - (KABETE, MACHAKOS , NGONG AND MASENO)Contract date: 20.01.2012 Contract Completion date: 30.09.2018 Expected Completion date:30.09.2018Contract Cost: Kshs 163 million Expected Final Cost: Kshs 215 millionCompletion Stage 2012/13:15% Completion Stage 2013/14:29% Completion Stage 2014/15: 38%Budget Provision 2012/13: Kshs. 15million
Budget Provision 2013/14:Kshs 17 million
Budget Provision 2014/15: Kshs. 19million
Brief overview of the specific needs to be addressed by the project: Farm infrastructure development ,purchase of farm machineryPROJECT 52: UPGRADE OF FOOT AND MOUTH DISEASE LABORATORY - KEVEVAPIContract date: 18.08.2014 Contract Completion date: 15.05.2020 Expected Completion date:15.05.19Contract Cost: Kshs 1,750 million Expected Final Cost: Kshs 1,750 millionCompletion Stage 2012/13: N/A Completion Stage 2013/14: N/A Completion Stage 2014/15: 20 %Budget Provision 2012/13 (Kshs.millions): Nil
Budget Provision 2013/14:(Kshs.) Nil
Budget Provision 2014/15: Kshs. 350million
Brief overview of the specific needs to be addressed by the project: Enhanced capacity for vaccineproduction for local and export marketPROJECT 53: TSETSE ERADICATION - KENTTECContract date: August 2014:Contract Completion date: May2020 Expected Completion date:May 2019Budget Provision 2012/13: Kshs. Nil
Contract Cost:1,960 0MExpected Final Cost: Kshs1,960 millionBudget Provision 2013/14:Kshs. 600millionCompletion Stage 2013/14 :12%
Completion Stage 2012/13: N/ACompletion Stage 2014/15: 20 %Budget Provision 2014/15: Kshs.400millions
Brief overview of the specific needs to be addressed by the project: Reclaim tsetse infested areas foragricultural usePROJECT 54: MANUFACTURE, SUPPLY AND COMMISSIONING OF TWO MEDIUM SIZEPATROL BOATSContract date: 2010/2011Contract Cost: Kshs 115 millionCompletion stage: 2012/13: 70 %Budget Provision 2012/13: Kshs 80million
Contract completion date:2012/13Expected Final Cost: Kshs 115millionCompletion Stage 2013/14:100%Budget Provision 2013/14:Kshs.70million
Location: Kisumu and TurkanaExpected completion date : 2012/13Completion Stage 2014/2015: N/ABudget Provision 2014/2015: N/A
Brief overview of the specific needs to be addressed by the project: To undertake surveillance andenforcement in Lake Victoria and TurkanaPROJECT 55: DESIGNING, BUILDING, SUPPLY AND COMMISSION OF AN OFFSHOREPATROL VESSELContract date: May 2012Contract Cost: Kshs 3.5 billionCompletion stage 2012/13: 5%Budget Provision 2012/13: Kshs 560million
Contract completion date:2016/17Expected final Cost: Kshs3.5BCompletion stage 2013/14:25%Budget Provision2013/14:Kshs 578.9 million
Location: BangladeshExpected completion date: 2016/17Completion stage 2014/15: 50%Budget Provision 2014/15: Kshs 800million
Brief overview of the specific needs to be addressed by the project: The project will enhance Monitoring,Control and Surveillance in Indian Ocean and enforce compliance of Fisheries Act, Cap. 378PROJECT 56: CONSTRUCTION OF QUALITY LABORATORYContract date: 2012/2013Contract Cost: Kshs 700 million
Contract completion date:2012/2013
Location: NairobiExpected completion date: July 2018
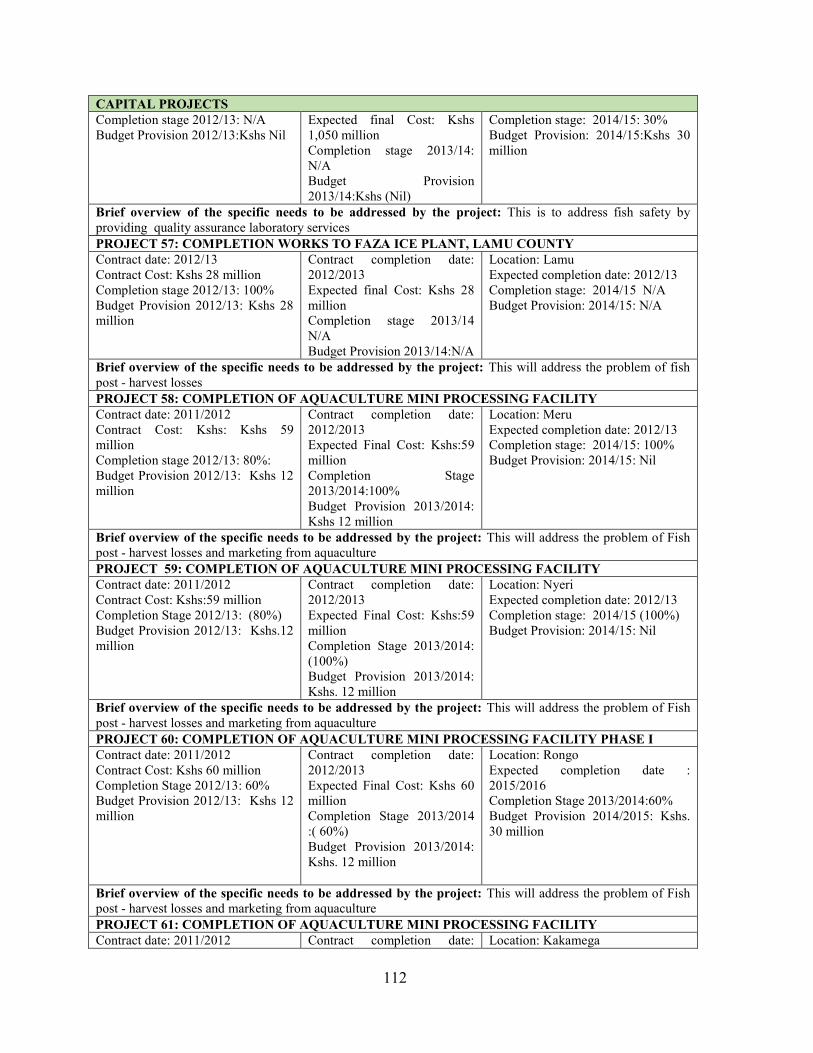
112
CAPITAL PROJECTSCompletion stage 2012/13: N/ABudget Provision 2012/13:Kshs Nil
Expected final Cost: Kshs1,050 millionCompletion stage 2013/14:N/ABudget Provision2013/14:Kshs (Nil)
Completion stage: 2014/15: 30%Budget Provision: 2014/15:Kshs 30million
Brief overview of the specific needs to be addressed by the project: This is to address fish safety byproviding quality assurance laboratory servicesPROJECT 57: COMPLETION WORKS TO FAZA ICE PLANT, LAMU COUNTYContract date: 2012/13Contract Cost: Kshs 28 millionCompletion stage 2012/13: 100%Budget Provision 2012/13: Kshs 28million
Contract completion date:2012/2013Expected final Cost: Kshs 28millionCompletion stage 2013/14N/ABudget Provision 2013/14:N/A
Location: LamuExpected completion date: 2012/13Completion stage: 2014/15 N/ABudget Provision: 2014/15: N/A
Brief overview of the specific needs to be addressed by the project: This will address the problem of fishpost - harvest lossesPROJECT 58: COMPLETION OF AQUACULTURE MINI PROCESSING FACILITYContract date: 2011/2012Contract Cost: Kshs: Kshs 59millionCompletion stage 2012/13: 80%:Budget Provision 2012/13: Kshs 12million
Contract completion date:2012/2013Expected Final Cost: Kshs:59millionCompletion Stage2013/2014:100%Budget Provision 2013/2014:Kshs 12 million
Location: MeruExpected completion date: 2012/13Completion stage: 2014/15: 100%Budget Provision: 2014/15: Nil
Brief overview of the specific needs to be addressed by the project: This will address the problem of Fishpost - harvest losses and marketing from aquaculturePROJECT 59: COMPLETION OF AQUACULTURE MINI PROCESSING FACILITYContract date: 2011/2012Contract Cost: Kshs:59 millionCompletion Stage 2012/13: (80%)Budget Provision 2012/13: Kshs.12million
Contract completion date:2012/2013Expected Final Cost: Kshs:59millionCompletion Stage 2013/2014:(100%)Budget Provision 2013/2014:Kshs. 12 million
Location: NyeriExpected completion date: 2012/13Completion stage: 2014/15 (100%)Budget Provision: 2014/15: Nil
Brief overview of the specific needs to be addressed by the project: This will address the problem of Fishpost - harvest losses and marketing from aquaculturePROJECT 60: COMPLETION OF AQUACULTURE MINI PROCESSING FACILITY PHASE IContract date: 2011/2012Contract Cost: Kshs 60 millionCompletion Stage 2012/13: 60%Budget Provision 2012/13: Kshs 12million
Contract completion date:2012/2013Expected Final Cost: Kshs 60millionCompletion Stage 2013/2014:( 60%)Budget Provision 2013/2014:Kshs. 12 million
Location: RongoExpected completion date :2015/2016Completion Stage 2013/2014:60%Budget Provision 2014/2015: Kshs.30 million
Brief overview of the specific needs to be addressed by the project: This will address the problem of Fishpost - harvest losses and marketing from aquaculturePROJECT 61: COMPLETION OF AQUACULTURE MINI PROCESSING FACILITYContract date: 2011/2012 Contract completion date: Location: Kakamega
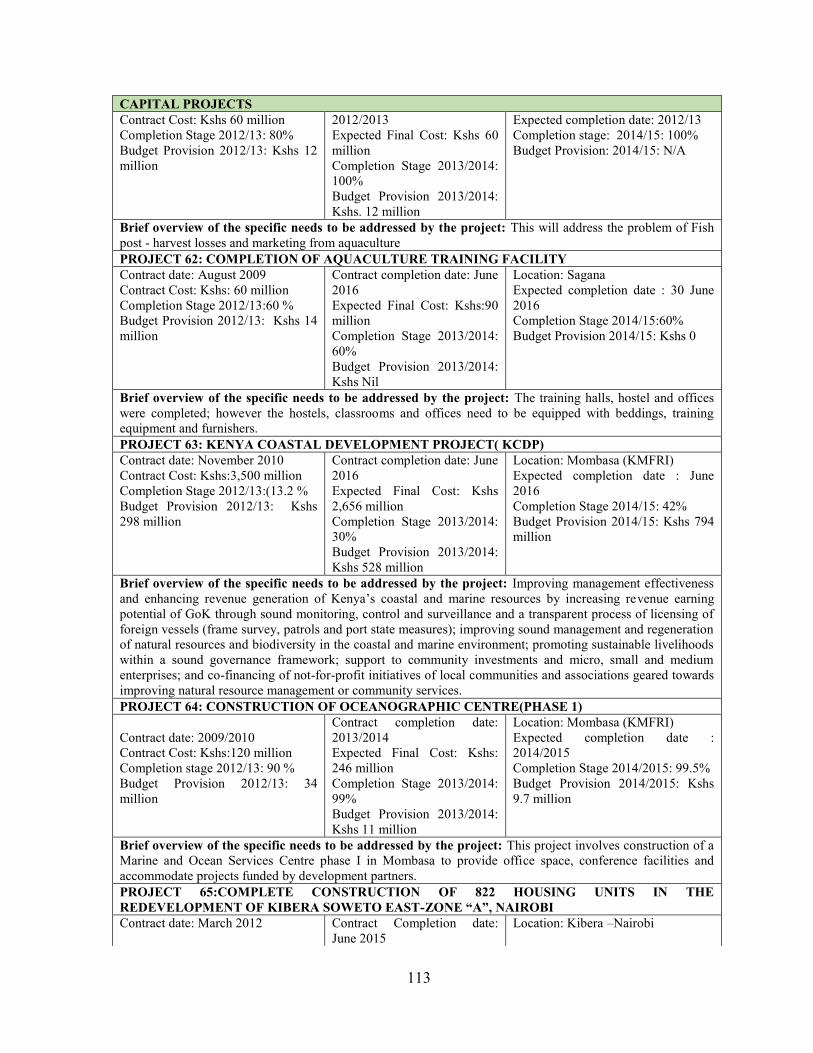
113
CAPITAL PROJECTSContract Cost: Kshs 60 millionCompletion Stage 2012/13: 80%Budget Provision 2012/13: Kshs 12million
2012/2013Expected Final Cost: Kshs 60millionCompletion Stage 2013/2014:100%Budget Provision 2013/2014:Kshs. 12 million
Expected completion date: 2012/13Completion stage: 2014/15: 100%Budget Provision: 2014/15: N/A
Brief overview of the specific needs to be addressed by the project: This will address the problem of Fishpost - harvest losses and marketing from aquaculturePROJECT 62: COMPLETION OF AQUACULTURE TRAINING FACILITYContract date: August 2009Contract Cost: Kshs: 60 millionCompletion Stage 2012/13:60 %Budget Provision 2012/13: Kshs 14million
Contract completion date: June2016Expected Final Cost: Kshs:90millionCompletion Stage 2013/2014:60%Budget Provision 2013/2014:Kshs Nil
Location: SaganaExpected completion date : 30 June2016Completion Stage 2014/15:60%Budget Provision 2014/15: Kshs 0
Brief overview of the specific needs to be addressed by the project: The training halls, hostel and officeswere completed; however the hostels, classrooms and offices need to be equipped with beddings, trainingequipment and furnishers.PROJECT 63: KENYA COASTAL DEVELOPMENT PROJECT( KCDP)Contract date: November 2010Contract Cost: Kshs:3,500 millionCompletion Stage 2012/13:(13.2 %Budget Provision 2012/13: Kshs298 million
Contract completion date: June2016Expected Final Cost: Kshs2,656 millionCompletion Stage 2013/2014:30%Budget Provision 2013/2014:Kshs 528 million
Location: Mombasa (KMFRI)Expected completion date : June2016Completion Stage 2014/15: 42%Budget Provision 2014/15: Kshs 794million
Brief overview of the specific needs to be addressed by the project: Improving management effectivenessand enhancing revenue generation of Kenya’s coastal and marine resources by increasing revenue earningpotential of GoK through sound monitoring, control and surveillance and a transparent process of licensing offoreign vessels (frame survey, patrols and port state measures); improving sound management and regenerationof natural resources and biodiversity in the coastal and marine environment; promoting sustainable livelihoodswithin a sound governance framework; support to community investments and micro, small and mediumenterprises; and co-financing of not-for-profit initiatives of local communities and associations geared towardsimproving natural resource management or community services.PROJECT 64: CONSTRUCTION OF OCEANOGRAPHIC CENTRE(PHASE 1)
Contract date: 2009/2010Contract Cost: Kshs:120 millionCompletion stage 2012/13: 90 %Budget Provision 2012/13: 34million
Contract completion date:2013/2014Expected Final Cost: Kshs:246 millionCompletion Stage 2013/2014:99%Budget Provision 2013/2014:Kshs 11 million
Location: Mombasa (KMFRI)Expected completion date :2014/2015Completion Stage 2014/2015: 99.5%Budget Provision 2014/2015: Kshs9.7 million
Brief overview of the specific needs to be addressed by the project: This project involves construction of aMarine and Ocean Services Centre phase I in Mombasa to provide office space, conference facilities andaccommodate projects funded by development partners.PROJECT 65:COMPLETE CONSTRUCTION OF 822 HOUSING UNITS IN THEREDEVELOPMENT OF KIBERA SOWETO EAST-ZONE “A”, NAIROBIContract date: March 2012 Contract Completion date:
June 2015Location: Kibera –Nairobi
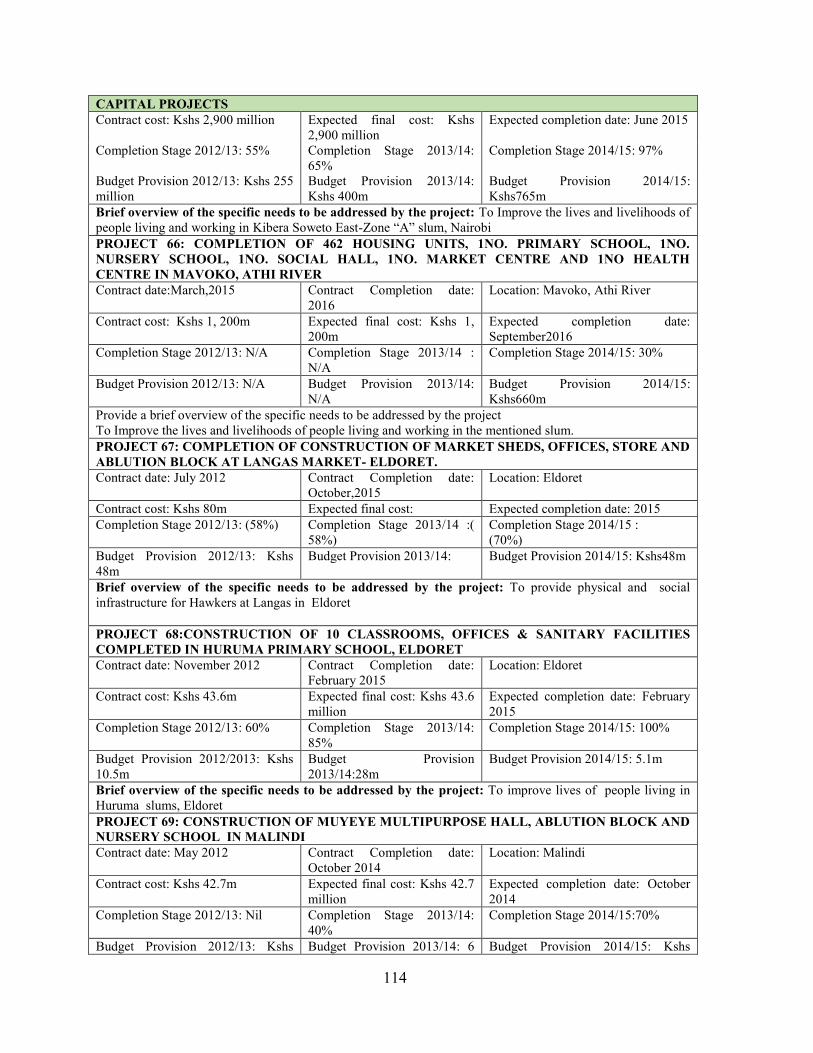
114
CAPITAL PROJECTSContract cost: Kshs 2,900 million Expected final cost: Kshs
2,900 millionExpected completion date: June 2015
Completion Stage 2012/13: 55% Completion Stage 2013/14:65%
Completion Stage 2014/15: 97%
Budget Provision 2012/13: Kshs 255million
Budget Provision 2013/14:Kshs 400m
Budget Provision 2014/15:Kshs765m
Brief overview of the specific needs to be addressed by the project: To Improve the lives and livelihoods ofpeople living and working in Kibera Soweto East-Zone “A” slum, NairobiPROJECT 66: COMPLETION OF 462 HOUSING UNITS, 1NO. PRIMARY SCHOOL, 1NO.NURSERY SCHOOL, 1NO. SOCIAL HALL, 1NO. MARKET CENTRE AND 1NO HEALTHCENTRE IN MAVOKO, ATHI RIVERContract date:March,2015 Contract Completion date:
2016Location: Mavoko, Athi River
Contract cost: Kshs 1, 200m Expected final cost: Kshs 1,200m
Expected completion date:September2016
Completion Stage 2012/13: N/A Completion Stage 2013/14 :N/A
Completion Stage 2014/15: 30%
Budget Provision 2012/13: N/A Budget Provision 2013/14:N/A
Budget Provision 2014/15:Kshs660m
Provide a brief overview of the specific needs to be addressed by the projectTo Improve the lives and livelihoods of people living and working in the mentioned slum.PROJECT 67: COMPLETION OF CONSTRUCTION OF MARKET SHEDS, OFFICES, STORE ANDABLUTION BLOCK AT LANGAS MARKET- ELDORET.Contract date: July 2012 Contract Completion date:
October,2015Location: Eldoret
Contract cost: Kshs 80m Expected final cost: Expected completion date: 2015Completion Stage 2012/13: (58%) Completion Stage 2013/14 :(
58%)Completion Stage 2014/15 :(70%)
Budget Provision 2012/13: Kshs48m
Budget Provision 2013/14: Budget Provision 2014/15: Kshs48m
Brief overview of the specific needs to be addressed by the project: To provide physical and socialinfrastructure for Hawkers at Langas in Eldoret
PROJECT 68:CONSTRUCTION OF 10 CLASSROOMS, OFFICES & SANITARY FACILITIESCOMPLETED IN HURUMA PRIMARY SCHOOL, ELDORETContract date: November 2012 Contract Completion date:
February 2015Location: Eldoret
Contract cost: Kshs 43.6m Expected final cost: Kshs 43.6million
Expected completion date: February2015
Completion Stage 2012/13: 60% Completion Stage 2013/14:85%
Completion Stage 2014/15: 100%
Budget Provision 2012/2013: Kshs10.5m
Budget Provision2013/14:28m
Budget Provision 2014/15: 5.1m
Brief overview of the specific needs to be addressed by the project: To improve lives of people living inHuruma slums, EldoretPROJECT 69: CONSTRUCTION OF MUYEYE MULTIPURPOSE HALL, ABLUTION BLOCK ANDNURSERY SCHOOL IN MALINDIContract date: May 2012 Contract Completion date:
October 2014Location: Malindi
Contract cost: Kshs 42.7m Expected final cost: Kshs 42.7million
Expected completion date: October2014
Completion Stage 2012/13: Nil Completion Stage 2013/14:40%
Completion Stage 2014/15:70%
Budget Provision 2012/13: Kshs Budget Provision 2013/14: 6 Budget Provision 2014/15: Kshs

115
CAPITAL PROJECTS43million million 8millionBrief overview of the specific needs to be addressed by the project: To provide physical and socialinfrastructure for people living in Muyeye slums, Malindi
PROJECT 70: CONSTRUCTION OF 10 CLASSROOMS, OFFICES & SANITARY FACILITIES-MUKHAWELI PRIMARY SCHOOL, BUNGOMAContract date: Sept2012
Contract Completion date:Oct 2015
Location: Mukhaweli, Bungoma
Contract cost: 38.3m Expected final cost: Expected completion date: Oct 2015Completion Stage2012/13: 30%
Completion Stage 2013/14 :55%
Completion Stage 2014/15: 65%
Budget Provision2012/13: Kshs 20m
Budget Provision 2013/14:Nil
Budget Provision 2014/15: Kshs 30m
Brief overview of the specific needs to be addressed by the project: To provide physical and socialinfrastructure for people living in Mukhaweli slums, BungomaPROJECT 71: INSTALLATION OF HIGH MAST FLOODLIGHTING STRUCTURES
Contract date: April2014
Contract Completion date:July 2015
Location: Mombasa, Makueni, Kakamega, Isiolo,Bungoma, Eldoret, Maua, Malindi, Nakuru andEmbu urban areas.
Contract cost: Kshs53.2 million
Expected final cost: Kshs53.2 million
Expected completion date: July 2015
Completion Stage2012/13: NA
Completion Stage 2013/14:85%
Completion Stage 2014/15: 90%
Budget Provision2012/13: Kshs45million
Budget Provision 2013/14:Kshs 39 million
Budget Provision 2014/15: Kshs 99.8million
Brief overview of the specific needs to be addressed by the project: To provide physical and socialinfrastructure for people living in Mombasa, Makueni, Kakamega, Isiolo, Bungoma, Eldoret, Maua, Malindi,Nakuru and Embu informal settlements.PROJECT 72:INSTALLATION OF PHYSICAL INFRASTRUCTURE IN INFORMALSETTLEMENTS IN SELECTED TOWNS(ELDORET, NAKURU AND MOMBASA) UNDER KENYAINFORMAL SETTLEMENT IMPROVEMENT PROJECT (KISIP)Contract date: April2013
Contract Completion date:December 2014
Location: Mombasa, Eldoret and Nakuru urban areas
Contract cost: Kshs2,500 million
Expected final cost: Kshs2,500 million
Expected completion date: December 2014
Completion Stage2012/13: (N/A)
Completion Stage 2013/14:50%
Completion Stage 2014/15:70%
Budget Provision2012/13: Kshs 1,000 m
Budget Provision 2013/14:Kshs 1,000 m
Budget Provision 2014/15: Kshs 940.2million
Brief overview of the specific needs to be addressed by the project: To improve lives of people living ininformal settlementsPROJECT 73:COMPLETION OF ZIWA LA NGOMBE HEALTH CENTRE IN BOMBOLULU,MOMBASAContract date: March2013
Contract Completion date:Oct. 2014
Location: Mombasa
Contract cost: Kshs29m
Expected final cost: Expected completion date: Oct. 2014
Completion Stage2012/13: N/A
Completion Stage 2013/14:65%
Completion Stage 2014/15: 75%
Budget Provision2012/13: Nil
Budget Provision 2013/14:Kshs. 11 million
Budget Provision 2014/15: Kshs. 7million
Brief overview of the specific needs to be addressed by the project: To improve lives of people living in

116
CAPITAL PROJECTSZiwa la Ngombe slums, Bombolulu, MombasaPROJECT 74: CONSTRUCTION OF 678 HOUSING UNITS UNDER CIVIL SERVANTS HOUSINGSCHEME(CSHS) FOR SALE TO CIVIL SERVANTSContract date: 2008 Contract Completion
date: 2012Location: Ngara and Kileleshwa,Nairobi
Contract cost: Kshs. 1,900m
Expected final cost:Kshs. Kshs. 1,900 m
Expected completion date: 2013
Completion Stage2012/13: 98%
Completion Stage2013/14: 100%
Completion Stage 2014/15: 100%
Budget Provision2012/13: Kshs 80.8m
Budget Provision2013/14: Kshs 28.5m
Budget Provision 2014/15: Kshs 237.2m
Brief overview of the specific needs to be addressed by the project: The project addresses the specific needsof providing social housing especially to the low income civil servants. The provision of social housing notonly addresses the issues related to housing stress but also improves the national housing stock and the livingenvironmentPROJECT 75: CONSTRUCTION OF 52 HOUSING UNITS DECANTING SITE PROJECT UNDERCIVIL SERVANTS HOUSING SCHEME(CSHS) IN SHAURI MOYO, KISUMUContract date: August2014
Contract Completiondate: January 2015
Location: Shauri moyo,Kisumu
Contract cost: Kshs 24.4million
Expected final cost: Kshs28 million
Expected completion date: January 2015
Completion Stage2012/2013: (N/A)
Completion Stage 2013/14: (N/A)
Completion Stage 2014/15: (99%)
Budget Provision2012/2013: NA
Budget Provision2013/14: NA
Budget Provision 2014/15: Kshs 24.3 m
Provide a brief overview of the specific needs to be addressed by the project
The project addresses the specific needs of providing social housing especially to the low income civilservants. The provision of social housing not only addresses the issues related to housing stress but alsoimproves the national housing stock and the living environmentPROJECT 76: CONSTRUCTION OF 250 HOUSING UNITS UNDER CIVIL SERVANTS HOUSINGSCHEME(CSHS) IN KISUMUContract date: June2015
Contract Completion date:Jan 2017
Location: Shauri moyo,Kisumu
Contract cost: Kshs764.84 m
Expected final cost: Kshs764.84 m
Expected completion date: Jan 2017
Completion Stage2012/2013: (N/A)
Completion Stage 2013/14:(N/A)
Completion Stage 2014/15: 5%
Budget Provision2012/2013: NA
Budget Provision 2013/14:NA
Budget Provision 2014/15: Kshs 2 m
Brief overview of the specific needs to be addressed by the project: The project addresses the specific needsof providing social housing especially to the low income civil servants. The provision of social housing notonly addresses the issues related to housing stress but also improves the national housing stock and the livingenvironmentPROJECT 77: CONSTRUCTION OF 10,000 HOUSING UNITS UNDER PUBLIC PRIVATEPARTNERSHIP (PPP) IN NAIROBIContract date: July 2015 Contract Completion
date: July 2018Location: Nairobi
Contract cost: Kshs22,000m
Expected final cost: Kshs22,000m
Expected completion date: July 2018
Completion Stage2012/13: (N/A)
Completion Stage2013/14: (N/A)
Completion Stage 2014/15: (40%)
Budget Provision Budget Provision Budget Provision 2014/15: Kshs 50m

117
CAPITAL PROJECTS2012/13: N/A 2013/14: N/ABrief overview of the specific needs to be addressed by the project: The project addresses the specific needsof providing social housing especially to the low income civil servants. The provision of social housing notonly addresses the issues related to housing stress but also improves the national housing stock and the livingenvironmentPROJECT 78:INSTALLATION OF HOUSINGINFRASTRUCTURAL FACILITIES (trunksewerage, water lines and access roads) in urban areas
Location: Eldoret, Isiolo, Embu, Ongata Rongai,Garissa, Meru and Mavoko
Contract date: July 2013 Contract Completiondate: Dec 2015
Expected completion date: Dec 2015
Contract cost: Kshs 268m Expected final cost: Kshs268m
Completion Stage2012/13: 20%
Completion Stage2013/14:55%
Completion Stage 2014/15: 64%
Budget Provision2012/13: Kshs 60m
Budget Provision2013/14: Kshs 300m
Budget Provision 2014/15: Kshs 300m
Brief overview of the specific needs to be addressed by the project: To open up land for housingdevelopment through provision of infrastructural servicesPROJECT 79: REFURBISHMENT AND MAINTENANCE GOVERNMENT HOUSESContract date: continuous Contract Completion
date: continuousLocation: Countrywide
Contract cost: Expected final cost: Expected completion date: continuousCompletion Stage2012/13: 81%
Completion Stage2013/14: 82%
Completion Stage 2014/15: 54%
Budget Provision2012/13: Kshs 430m
Budget Provision2013/14: Kshs 427m
Budget Provision 2014/15:Kshs 265m
Brief overview of the specific needs to be addressed by the project: To improve the living conditions andlongevity of the housesPROJECT 80: PARTITIONING OF BIMA TOWERS MOMBASA AND ALTERATION ANDRENOVATION OF CRESCENT HOUSE NAIROBIContract date: 2/9/2011 Contract Completion
date: 2/3/2013Location: Mombasa, Nairobi
Contract Cost: Kshs 328million
Expected final cost: Kshs328 million
Expected completion date: 2015
Completion Stage2012/13: N/A
Completion Stage2013/14: 47%
Completion stage 2014/15: 47%
Budget Provision2012/13: Kshs 250 million
Budget Provision2013/14:Nill
Budget provision 2014/15: Kshs Nil million
Brief overview of the specific needs to be addressed by the project: To provide office accommodation forGovernment Ministries, departments and AgenciesPROJECT 81 : COMPLETION OF KIBABII PTTCContract date:26/05/2008
Contract completion date:26/05/12
Location : Bungoma County
Contract cost:Kshs. 2,237 m
Expected final cost:Kshs. 2,237 m
Expected completion date: 26/05/14
Completion stage2012/13: 98%
Completion stage 2013/14:100%
Completion stage 2014/15: 100%
Budget provision2012/13: Kshs.500,000,000
Budget provision 2013/14:Kshs. 157 m
Budget provision 2014/15: Kshs. 165.7 m
Brief overview of the specific needs to be addressed by the project: To provide learning centre andfacilities for educationPROJECT 82: KERICHO ARDHI HOUSE - OFFICE BLOCKContract date: Contract completion date: Location : Kericho County
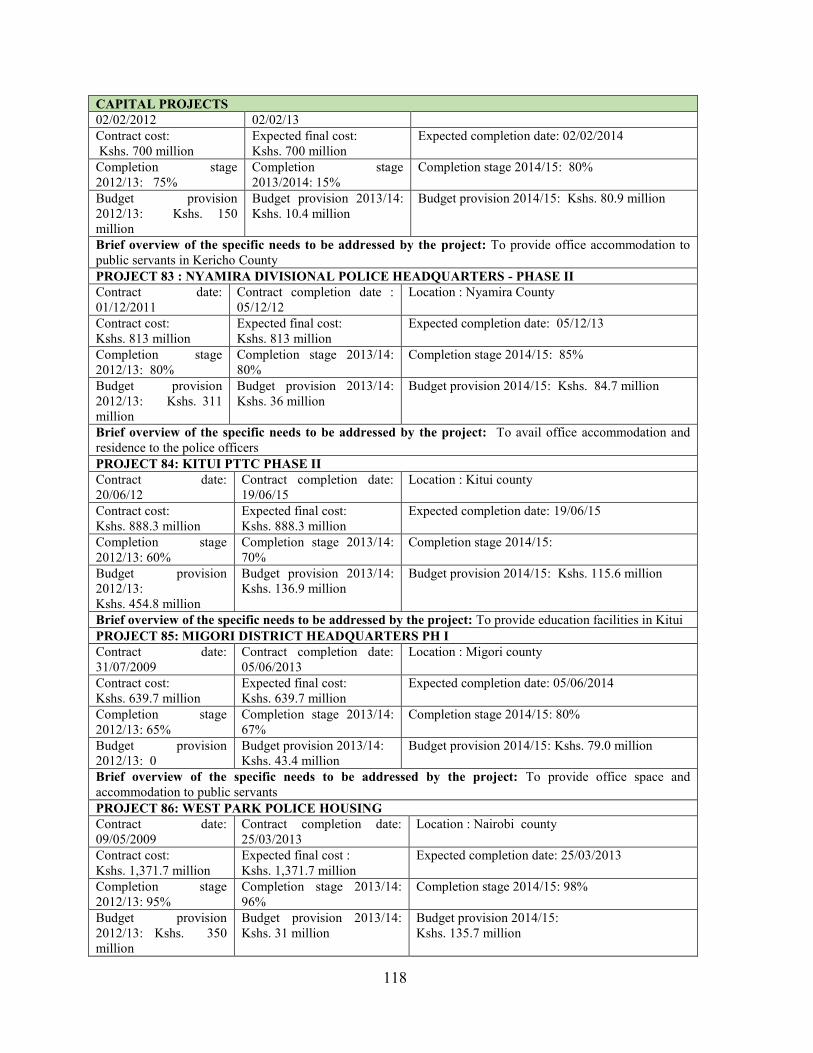
118
CAPITAL PROJECTS02/02/2012 02/02/13Contract cost:Kshs. 700 million
Expected final cost:Kshs. 700 million
Expected completion date: 02/02/2014
Completion stage2012/13: 75%
Completion stage2013/2014: 15%
Completion stage 2014/15: 80%
Budget provision2012/13: Kshs. 150million
Budget provision 2013/14:Kshs. 10.4 million
Budget provision 2014/15: Kshs. 80.9 million
Brief overview of the specific needs to be addressed by the project: To provide office accommodation topublic servants in Kericho CountyPROJECT 83 : NYAMIRA DIVISIONAL POLICE HEADQUARTERS - PHASE IIContract date:01/12/2011
Contract completion date :05/12/12
Location : Nyamira County
Contract cost:Kshs. 813 million
Expected final cost:Kshs. 813 million
Expected completion date: 05/12/13
Completion stage2012/13: 80%
Completion stage 2013/14:80%
Completion stage 2014/15: 85%
Budget provision2012/13: Kshs. 311million
Budget provision 2013/14:Kshs. 36 million
Budget provision 2014/15: Kshs. 84.7 million
Brief overview of the specific needs to be addressed by the project: To avail office accommodation andresidence to the police officersPROJECT 84: KITUI PTTC PHASE IIContract date:20/06/12
Contract completion date:19/06/15
Location : Kitui county
Contract cost:Kshs. 888.3 million
Expected final cost:Kshs. 888.3 million
Expected completion date: 19/06/15
Completion stage2012/13: 60%
Completion stage 2013/14:70%
Completion stage 2014/15:
Budget provision2012/13:Kshs. 454.8 million
Budget provision 2013/14:Kshs. 136.9 million
Budget provision 2014/15: Kshs. 115.6 million
Brief overview of the specific needs to be addressed by the project: To provide education facilities in KituiPROJECT 85: MIGORI DISTRICT HEADQUARTERS PH IContract date:31/07/2009
Contract completion date:05/06/2013
Location : Migori county
Contract cost:Kshs. 639.7 million
Expected final cost:Kshs. 639.7 million
Expected completion date: 05/06/2014
Completion stage2012/13: 65%
Completion stage 2013/14:67%
Completion stage 2014/15: 80%
Budget provision2012/13: 0
Budget provision 2013/14:Kshs. 43.4 million
Budget provision 2014/15: Kshs. 79.0 million
Brief overview of the specific needs to be addressed by the project: To provide office space andaccommodation to public servantsPROJECT 86: WEST PARK POLICE HOUSINGContract date:09/05/2009
Contract completion date:25/03/2013
Location : Nairobi county
Contract cost:Kshs. 1,371.7 million
Expected final cost :Kshs. 1,371.7 million
Expected completion date: 25/03/2013
Completion stage2012/13: 95%
Completion stage 2013/14:96%
Completion stage 2014/15: 98%
Budget provision2012/13: Kshs. 350million
Budget provision 2013/14:Kshs. 31 million
Budget provision 2014/15:Kshs. 135.7 million

119
CAPITAL PROJECTSSpecific needs to be addressed by the project: To provide accommodation and residence to the policeofficersPROJECT 87: KENYA INSTITUTE OF BUSINESS TRAINING HEADQUARTERSContract date:02/01/09
Contract completion date :02/01/2014
Location : Nairobi county
Contract cost:Kshs. 629.9m
Expected final cost:Kshs. 629.9m
Expected completion date: 02/01/2014
Completion stage2012/13: 85%
Completion stage 2013/14:85%
Completion stage 2014/15: 87%
Budget provision2012/13: Kshs. 100million
Budget provision 2013/14:Kshs. 238 million
Budget provision 2014/15: Kshs. 128 million
Brief overview of the specific needs to be addressed by the project: To provide office accommodation toofficers at Kenya Business Training InstitutePROJECT 88: MEDICAL TRAINING CENTRE, KABARNETContract date:11/02/10
Contract completion date:28/05/13
Location : Baringo county
Contract cost: Kshs.267.1 million
Expected final cost: Kshs.267.1 million
Expected completion date: 28/05/14
Completion stage2012/13: 65%
Completion stage 2013/14:65%
Completion stage 2014/15: 65%
Budget provision2012/13: 0
Budget provision 2013/14:Ksh.2.2 million
Budget provision 2014/15: 0
Brief overview of the specific needs to be addressed by the project: To improve the healthcare facilities inBaringo CountyPROJECT 89: KITI Nakuru Phase IIContract date:02/08/11
Contract completion date:07/09/2013
Location :Nakuru county
Contract cost:Kshs. 396.5 million
Expected final cost :Kshs. 396.5 million
Expected completion date: 07/09/2013
Completion stage2012/13: 50%
Completion stage 2013/14:50%
Completion stage 2014/15: 50%
Budget provision2012/13: 86.2 million
Budget provision 2013/14:Kshs. 23.6 million
Budget provision 2014/15:Ksh.0.84 million
Brief overview of the specific needs to be addressed by the project: To provide a centre for industrialtraining and educational facilitiesPROJECT 90: KIBISH POLICE STATION & GSU BASE CAMP + DIVISIONALContract date: 01/12/10 Contract completion date:
12/01/13Location : Turkana County
Contract cost:Kshs. 2,111m
Expected final cost:Kshs. 2,111m
Expected completion date: 12/01/2013
Completion stage2012/13: 65%
Completion stage 2013/14:65%
Completion stage 2014/15: 65%
Budget provision2012/13: Kshs. 357.4m
Budget provision 2013/14:Kshs. 76.3m
Budget provision 2014/15: Kshs. 114.5m
Brief overview of the specific needs to be addressed by the project: To provide office accommodation tothe police officersPROJECT 91: Voi PTTC Phase IIContract date:08/05/2012
Contract completion date:27/09/2013
Location : Voi
Contract cost:Kshs. 410.9m
Expected final cost :Kshs. 410.9m
Expected completion date:30/06/2016
Completion stage2012/13: 85%
Completion stage 2013/14:85%
Completion stage 2014/15: 90%

120
CAPITAL PROJECTSBudget provision2011/12:Kshs. 159.2m
Budget provision 2013/14:Ksh.137.4m
Budget provision 2014/15: Kshs. 80.5m
Brief overview of the specific needs to be addressed by the project: To provide learning facilities to primaryteachersPROJECT 92: VOI POOL HOUSINGContract date:01/12/12
Contract completion date :30/11/14
Location : Voi
Contract cost:Kshs. 747.2m
Expected final cost:Kshs. 747.2m
Expected completion date: 30/11/14
Completion stage2012/13: 35%
Completion stage 2013/14:36%
Completion stage 2014/15: 37%
Budget provision2012/13: Kshs. 27.7m
Budget provision 2013/14:Ksh.20.1m
Budget provision 2014/15: Kshs. 67.3m
Brief overview of the specific needs to be addressed by the project: To provide accommodation facilities topublic servantsPROJECT 93: KERICHO POOL HOUSINGContract date:14/08/2012
Contract completion date:16/09/2014
Location : Kericho
Contract cost:Kshs. 436.1m
Expected final cost:Kshs. 436.1m
Expected completion date: 16/09/2014
Completion stage2012/13: 10%
Completion stage 2013/14:10%
Completion stage 2014/15:10%
Budget provision2012/13: Kshs. 30.9m
Budget provision 2013/14: 0 Budget provision 2014/15: 0
Brief overview of the specific needs to be addressed by the project: To provide accommodation facilities topublic servantsPROJECT 94: KAPSABET POOL HOUSINGContract date: Contract completion date: Location : Nandi CountyContract cost: Expected final cost : Expected completion date:Completion stage2012/13: NA
Completion stage 2013/14:NA
Completion stage 2014/15:3%
Budget provision2012/13: NA
Budget provision 2013/14:NA
Budget provision 2014/15: Ksh.9.0m
Brief overview of the specific needs to be addressed by the project: To provide learning facilities to primaryteachersPROJECT 95: MATHARE NYAYO HOSPITALContract date:27/08/2012
Contract completion date:26/08/2015
Location : Nairobi
Contract cost:Kshs. 1,212million
Expected final cost:Kshs. 1,212million
Expected completion date: 26/08/2015
Completion stage2012/13: 15%
Completion stage 2013/14:15%
Completion stage 2014/15: 20%
Budget provision2012/13: Kshs.100.0million
Budget provision 2013/14:Ksh.60.8million
Budget provision 2014/15: Kshs. 107.5million
Brief overview of the specific needs to be addressed by the project: To provide health care facilities to thosewho are mentally disturbedPROJECT 96: CONSTRUCTION OF FOOTBRIDGESContract date: Various Contract completion date:
VariousLocation : National
Contract cost: Various Expected final cost: Various Expected completion date: VariousCompletion stage Completion stage Completion stage 2014/15(%):Various
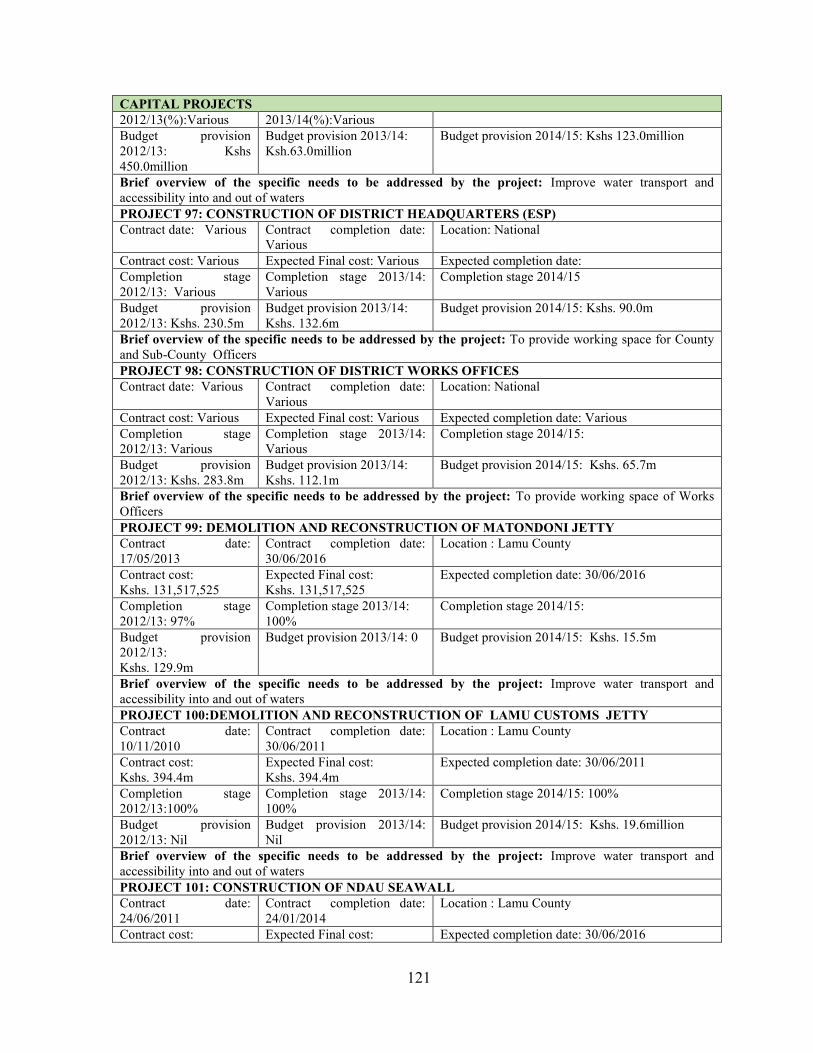
121
CAPITAL PROJECTS2012/13(%):Various 2013/14(%):VariousBudget provision2012/13: Kshs450.0million
Budget provision 2013/14:Ksh.63.0million
Budget provision 2014/15: Kshs 123.0million
Brief overview of the specific needs to be addressed by the project: Improve water transport andaccessibility into and out of watersPROJECT 97: CONSTRUCTION OF DISTRICT HEADQUARTERS (ESP)Contract date: Various Contract completion date:
VariousLocation: National
Contract cost: Various Expected Final cost: Various Expected completion date:Completion stage2012/13: Various
Completion stage 2013/14:Various
Completion stage 2014/15
Budget provision2012/13: Kshs. 230.5m
Budget provision 2013/14:Kshs. 132.6m
Budget provision 2014/15: Kshs. 90.0m
Brief overview of the specific needs to be addressed by the project: To provide working space for Countyand Sub-County OfficersPROJECT 98: CONSTRUCTION OF DISTRICT WORKS OFFICESContract date: Various Contract completion date:
VariousLocation: National
Contract cost: Various Expected Final cost: Various Expected completion date: VariousCompletion stage2012/13: Various
Completion stage 2013/14:Various
Completion stage 2014/15:
Budget provision2012/13: Kshs. 283.8m
Budget provision 2013/14:Kshs. 112.1m
Budget provision 2014/15: Kshs. 65.7m
Brief overview of the specific needs to be addressed by the project: To provide working space of WorksOfficersPROJECT 99: DEMOLITION AND RECONSTRUCTION OF MATONDONI JETTYContract date:17/05/2013
Contract completion date:30/06/2016
Location : Lamu County
Contract cost:Kshs. 131,517,525
Expected Final cost:Kshs. 131,517,525
Expected completion date: 30/06/2016
Completion stage2012/13: 97%
Completion stage 2013/14:100%
Completion stage 2014/15:
Budget provision2012/13:Kshs. 129.9m
Budget provision 2013/14: 0 Budget provision 2014/15: Kshs. 15.5m
Brief overview of the specific needs to be addressed by the project: Improve water transport andaccessibility into and out of watersPROJECT 100:DEMOLITION AND RECONSTRUCTION OF LAMU CUSTOMS JETTYContract date:10/11/2010
Contract completion date:30/06/2011
Location : Lamu County
Contract cost:Kshs. 394.4m
Expected Final cost:Kshs. 394.4m
Expected completion date: 30/06/2011
Completion stage2012/13:100%
Completion stage 2013/14:100%
Completion stage 2014/15: 100%
Budget provision2012/13: Nil
Budget provision 2013/14:Nil
Budget provision 2014/15: Kshs. 19.6million
Brief overview of the specific needs to be addressed by the project: Improve water transport andaccessibility into and out of watersPROJECT 101: CONSTRUCTION OF NDAU SEAWALLContract date:24/06/2011
Contract completion date:24/01/2014
Location : Lamu County
Contract cost: Expected Final cost: Expected completion date: 30/06/2016

122
CAPITAL PROJECTSKshs. 365.1m Kshs. 365.1mCompletion stage2012/13: 64%
Completion stage 2013/14:64%
Completion stage 2014/15:64%
Budget provision2012/13: Nil
Budget provision 2013/14:Nil
Budget provision 2014/15: Kshs. 23.0million
Brief overview of the specific needs to be addressed by the project:: to protect land and property from seawave erosionPROJECT 102: REHABILITATION OF SHIMONI FISHERIES JETTYContract date:08/08/2012
Contract completion date:07/08/2014
Location : Kwale County
Contract cost:Kshs. 327.8m
Expected Final cost:Kshs. 327.8m
Expected completion date: 30/06/2016
Completion stage2012/13: 46%
Completion stage 2013/14:46%
Completion stage 2014/15:54%
Budget provision2012/13:
Budget provision 2013/14: 0 Budget provision 2014/15: Kshs. 71.4m
Brief overview of the specific needs to be addressed by the project: Improve water transport andaccessibility into and out of watersPROJECT 103: REPAIR OF MANDA JETTYContract date: Contract completion date: Location : Lamu CountyContract cost:Kshs. 5.0m
Expected Final cost:Kshs. 5.0m
Expected completion date: 30/06/2015
Completion stage2012/13: NA
Completion stage 2013/14:NA
Completion stage 2014/15:100%
Budget provision2012/13: NA
Budget provision 2013/14:NA
Budget provision 2014/15: Kshs. 5.0m
Brief overview of the specific needs to be addressed by the project: Improve water transport andaccessibility into and out of watersPROJECT 104: RIVER PROTECTION WORKS AT KONG’ELAI (ALONG SUAM RIVER)Contract date:01/02/2012
Contract completion date:26/06/2013
Location : West Pokot County
Contract cost:Kshs. 184.5m
Expected Final cost:Kshs. 184.5m
Expected completion date: 30/06/2015
Completion stage2012/13: 85%
Completion stage 2013/14:100%
Completion stage 2014/15:100%
Budget provision2012/13:Kshs. 151.5m
Budget provision 2013/14: 0 Budget provision 2014/15: Kshs. 33.0m
Brief overview of the specific needs to be addressed by the project: Protection of land and property fromriver erosionPROJECT 105:REFURBISHMENT OF FACILITIES AT SUPPLIES BRANCH, NAIROBIContract date:15/01/2015
Contract completion date:30/06/2015
Location : Nairobi County
Contract cost:Kshs. 79.2m
Expected Final cost:Kshs. 79.2m
Expected completion date: 30/06/2015
Completion stage2012/13: NA
Completion stage 2013/14:NA
Completion stage 2014/15:95%
Budget provision2012/13: NA
Budget provision 2013/14:NA
Budget provision 2014/15: Kshs. 79.3m
Brief overview of the specific needs to be addressed by the project: To improve working conditions ofofficers at Supplies Branch, NairobiPROJECT 106: REHABILITATION AND RENOVATION OF OLENGURUONE STADIUMContract date: Contract completion Location: NAROK
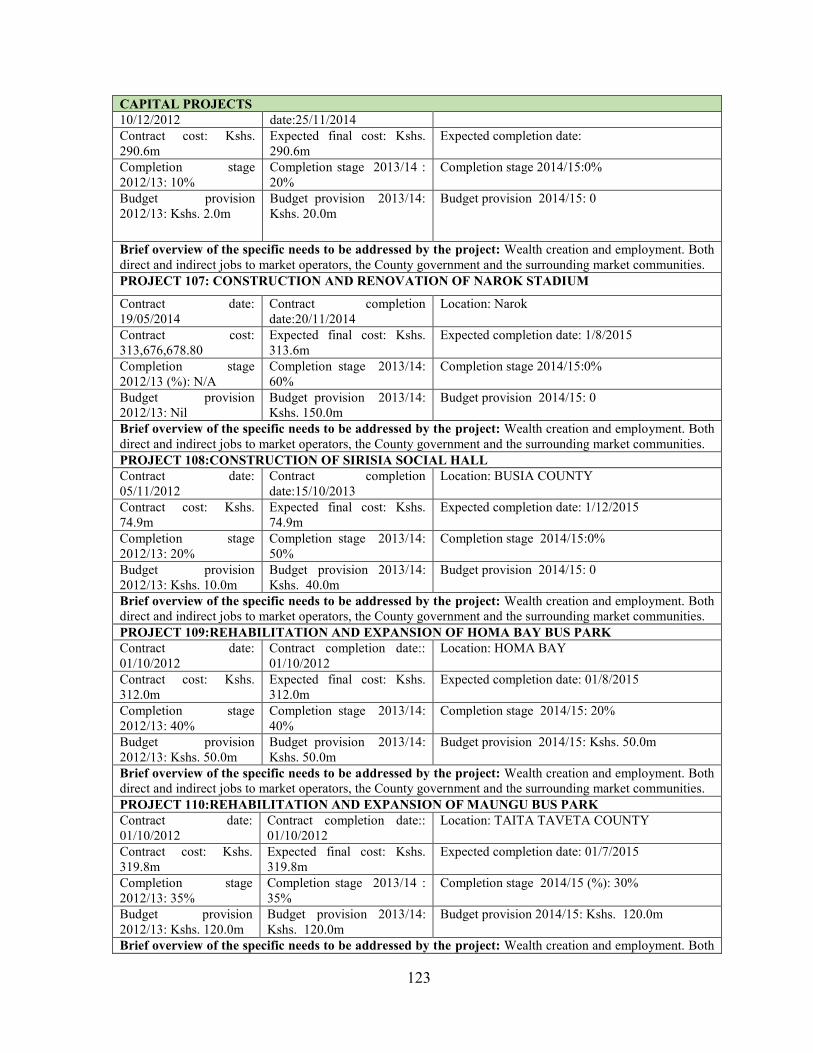
123
CAPITAL PROJECTS10/12/2012 date:25/11/2014Contract cost: Kshs.290.6m
Expected final cost: Kshs.290.6m
Expected completion date:
Completion stage2012/13: 10%
Completion stage 2013/14 :20%
Completion stage 2014/15:0%
Budget provision2012/13: Kshs. 2.0m
Budget provision 2013/14:Kshs. 20.0m
Budget provision 2014/15: 0
Brief overview of the specific needs to be addressed by the project: Wealth creation and employment. Bothdirect and indirect jobs to market operators, the County government and the surrounding market communities.PROJECT 107: CONSTRUCTION AND RENOVATION OF NAROK STADIUM
Contract date:19/05/2014
Contract completiondate:20/11/2014
Location: Narok
Contract cost:313,676,678.80
Expected final cost: Kshs.313.6m
Expected completion date: 1/8/2015
Completion stage2012/13 (%): N/A
Completion stage 2013/14:60%
Completion stage 2014/15:0%
Budget provision2012/13: Nil
Budget provision 2013/14:Kshs. 150.0m
Budget provision 2014/15: 0
Brief overview of the specific needs to be addressed by the project: Wealth creation and employment. Bothdirect and indirect jobs to market operators, the County government and the surrounding market communities.PROJECT 108:CONSTRUCTION OF SIRISIA SOCIAL HALLContract date:05/11/2012
Contract completiondate:15/10/2013
Location: BUSIA COUNTY
Contract cost: Kshs.74.9m
Expected final cost: Kshs.74.9m
Expected completion date: 1/12/2015
Completion stage2012/13: 20%
Completion stage 2013/14:50%
Completion stage 2014/15:0%
Budget provision2012/13: Kshs. 10.0m
Budget provision 2013/14:Kshs. 40.0m
Budget provision 2014/15: 0
Brief overview of the specific needs to be addressed by the project: Wealth creation and employment. Bothdirect and indirect jobs to market operators, the County government and the surrounding market communities.PROJECT 109:REHABILITATION AND EXPANSION OF HOMA BAY BUS PARKContract date:01/10/2012
Contract completion date::01/10/2012
Location: HOMA BAY
Contract cost: Kshs.312.0m
Expected final cost: Kshs.312.0m
Expected completion date: 01/8/2015
Completion stage2012/13: 40%
Completion stage 2013/14:40%
Completion stage 2014/15: 20%
Budget provision2012/13: Kshs. 50.0m
Budget provision 2013/14:Kshs. 50.0m
Budget provision 2014/15: Kshs. 50.0m
Brief overview of the specific needs to be addressed by the project: Wealth creation and employment. Bothdirect and indirect jobs to market operators, the County government and the surrounding market communities.PROJECT 110:REHABILITATION AND EXPANSION OF MAUNGU BUS PARKContract date:01/10/2012
Contract completion date::01/10/2012
Location: TAITA TAVETA COUNTY
Contract cost: Kshs.319.8m
Expected final cost: Kshs.319.8m
Expected completion date: 01/7/2015
Completion stage2012/13: 35%
Completion stage 2013/14 :35%
Completion stage 2014/15 (%): 30%
Budget provision2012/13: Kshs. 120.0m
Budget provision 2013/14:Kshs. 120.0m
Budget provision 2014/15: Kshs. 120.0m
Brief overview of the specific needs to be addressed by the project: Wealth creation and employment. Both

124
CAPITAL PROJECTSdirect and indirect jobs to market operators, the County government and the surrounding market communities.PROJECT 111:REHABILITATION AND EXPANSION OF ISIBANIA BUS PARKContract date:01/10/2012
Contract completion date::01/10/2012
Location: MIGORI COUNTY
Contract cost:216,270,161.05
Expected final cost:216,270,161.05
Expected completion date: 01/9/2015
Completion stage2012/13: 35%
Completion stage 2013/14:35%
Completion stage 2014/15: 25%
Budget provision2012/13: Kshs. 60.0m
Budget provision 2013/14:Kshs. 60.0m
Budget provision 2014/15: Kshs. 60.0m
Brief overview of the specific needs to be addressed by the project: Wealth creation and employment. Bothdirect and indirect jobs to market operators, the County government and the surrounding market communities.PROJECT 112:REHABILITATION AND EXPANSION OF BUNGOMA BUSPARKContract date:05/10/2012
Contract completiondate:14/01/2013
Location: BUNGOMA COUNTY
Contract cost: Kshs.146.8m
Expected final cost: Kshs.146.8m
Expected completion date: 30/11/2015
Completion stage2012/13: 35%
Completion stage 2013/14:50%
Completion stage 2014/15:15%
Budget provision2012/13: Kshs. 60.0m
Budget provision 2013/14:Kshs. 30.0m
Budget provision 2014/15: Kshs. 56.8m
Brief overview of the specific needs to be addressed by the project: Wealth creation and employment. Bothdirect and indirect jobs to market operators, the County government and the surrounding market communities.PROJECT 113: REHABILITATION OF KIANGO INTERGRATED BUSPARKContract date:15/01/2013
Contract completion date::15/01/2013
Location: KISII COUNTY
Contract cost: Kshs.79.7m
Expected final cost: Kshs.79.7m
Expected completion date: 15/01/2016
Completion stage2012/13: 40%
Completion stage 2013/14:30%
Completion stage 2014/15 : 10%
Budget provision2012/13: Kshs. 20.0m
Budget provision 2013/14:Kshs. 20.0m
Budget provision 2014/15: Kshs. 20.0m
Brief overview of the specific needs to be addressed by the project: Wealth creation and employment. Bothdirect and indirect jobs to market operators, the County government and the surrounding market communities.PROJECT 114: REHABILITATION OF ELDAMA RAVINE BUSPARKContract date:01/10/2012
Contract date: 01/10/2012 Location: BARINGO COUNTY
Contract cost: Kshs.208.2m
Expected final cost: Kshs.208.2m
Expected completion date: 01/10/2015
Completion stage2012/13: 30%
Completion stage 2013/14:30%
Completion stage 2014/15: 30%
Budget provision2012/13: Kshs. 80.0m
Budget provision 2013/14:Kshs. 80.0m
Budget provision 2014/15: Kshs. 80 million
Brief overview of the specific needs to be addressed by the project: Wealth creation and employment. Bothdirect and indirect jobs to market operators, the County government and the surrounding market communities.PROJECT 115:REHABILITATION OF SELECTED KISII TOWN ROADSContract date:12/12/2012
Original Contract completiondate:
Location: KISII COUNTY
Contract cost: Kshs.175.1m
Contract cost: Kshs. 175.1m Expected completion date: 12/6/2017
Completion stage2012/13:10%
Completion stage2013/14:10%
Completion stage 2014/15:10%

125
CAPITAL PROJECTSBudget provision2012/13: Kshs. 10.0m
Budget provision 2013/14:Kshs. 10.0m
Budget provision 2014/15: Kshs. 10.0m
Brief overview of the specific needs to be addressed by the project: Wealth creation and employment. Bothdirect and indirect jobs to market operators, the County government and the surrounding market communities.PROJECT 116 :DIGITAL MAPPING AND PREPARATION OF STRATEGIC URBANDEVELOPMENT PLANS FOR KISII TOWNContract date:17/06/2011
Contract completiondate:28/04/2013
Location: KISII COUNTY
Contract cost: Kshs.61.2m
Expected final cost: Kshs.61.2m
Expected completion date: 28/03/2015
Completion stage2012/13: 25%
Completion stage 2013/14:50%
Completion stage 2014/15: 25%
Budget provision2012/13: Kshs. 15.0m
Budget provision 2013/14:Kshs. 35.0m
Budget provision 2014/15: Kshs. 11.2m
Brief overview of the specific needs to be addressed by the project: Create development and Environmentalcontrol frame works, develop economic, CIP and financial Strategies for the counties.PROJECT 117: DIGITAL MAPPING AND PREPARATION OF STRATEGIC URBANDEVELOPMENT PLANS FOR LAMU COUNTYContract date:23/04/2012
Contract completiondate:23/04/2014
Location: LAMU COUNTY
Contract cost: Kshs.99.2m
Expected final cost: 99.2m Expected completion date: 28/03/2015
Completion stage2012/13: 30%
Completion stage 2013/14 :50%
Completion stage 2014/15 (%): 20%
Budget provision2012/13: Kshs. 25.0m
Budget provision 2013/14:Kshs. 45.0m
Budget provision 2014/15: Kshs. 29.2m
Brief overview of the specific needs to be addressed by the project: Create development and Environmentalcontrol frame works, develop economic, CIP and financial Strategies for the counties.PROJECT 118: DIGITAL MAPPING AND PREPARATION OF STRATEGIC URBANDEVELOPMENT PLANS FOR MERU TOWNContract date:17/06/2011
Contract completiondate:12/07/2013
Location: MERU COUNTY
Contract cost: Kshs.61.6m
Expected final cost: Kshs.61.6m
Expected completion date: 28/03/2015
Completion stage2012/13: 30%
Completion stage 2013/14:50%
Completion stage 2014/15: 20%
Budget provision2012/13: Kshs. 20.0m
Budget provision 2013/14:Kshs. 25.0m
Budget provision 2014/15: Kshs. 16.5m
Brief overview of the specific needs to be addressed by the project: Create development and Environmentalcontrol frame works, develop economic, CIP and financial Strategies for the counties.PROJECT 119: DIGITAL MAPPING AND PREPARATION OF STRATEGIC URBANDEVELOPMENT PLANS FOR LODWAR TOWNContract date:17/06/2011
Contract completiondate:12/07/2013
Location: TURKANA COUNTY
Contract cost: Kshs.56.8m
Expected final cost: Kshs.56.8m
Expected completion date: 28/03/2015
Completion stage2012/13 : 30%
Completion stage 2013/14:50%
Completion stage 2014/15: 20%
Budget provision2012/13: Kshs. 20.0m
Budget provision 2013/14:Kshs. 25.0m
Budget provision 2014/15: 11
Brief overview of the specific needs to be addressed by the project: Create development and Environmentalcontrol frame works, develop economic, CIP and financial Strategies for the counties.PROJECT 120:DIGITAL MAPPING AND PREPARATION OF STRATEGIC URBANDEVELOPMENT PLANS FOR MURANGA COUNTY

126
CAPITAL PROJECTSContract date:23/04/2012
Contract completiondate:14/04/2014
Location: MURANGA COUNTY
Contract cost: Kshs.101.1m
Expected final cost: 101.1m Expected completion date: 28/03/2015
Completion stage2012/13: 30%
Completion stage 2013/14:50%
Completion stage 2014/15 (%): 20%
Budget provision2012/13: Kshs. 20.0m
Budget provision 2013/14:Kshs. 5.0m
Budget provision 2014/15: Kshs. 10.0m
Brief overview of the specific needs to be addressed by the project: Create development and Environmentalcontrol frame works, develop economic, CIP and financial Strategies for the counties.PROJECT 121:DIGITAL MAPPING AND PREPARATION OF STRATEGIC URBANDEVELOPMENT PLANS FOR VIHIGA COUNTYContract date:23/04/2012
Contract completiondate:14/04/2014
Location: VIHIGA COUNTY
Contract cost: Kshs.98.0m
Expected final cost: Kshs.98.0m
Expected completion date: 28/03/2015
Completion stage2012/13: 30%
Completion stage 2013/14:50%
Completion stage 2014/15: 10%
Budget provision2012/13: Kshs. 23.5m
Budget provision 2013/14:Kshs. 23.5m
Budget provision 2014/15: Kshs. 23.5m
Brief overview of the specific needs to be addressed by the project: Create development and Environmentalcontrol frame works, develop economic, CIP and financial Strategies for the countiesPROJECT 122: DIGITAL MAPPING AND PREPARATION OF STRATEGIC URBANDEVELOPMENT PLANS FOR NANYUKIContract date:23/04/2012
Contract completiondate:14/04/2014
Location: NANYUKI
Contract cost: Expected final cost: Kshs.73.0m
Expected completion date: 28/12/2015
Completion stage2012/13: 30%
Completion stage 2013/14 :50%
Completion stage 2014/15:10%
Budget provision2012/13: Kshs. 19.5m
Budget provision 2013/14:Kshs. 19.5m
Budget provision 2014/15: Kshs. 19.5m
Brief overview of the specific needs to be addressed by the project: Create development and Environmentalcontrol frame works, develop economic, CIP and financial Strategies for the counties.PROJECT 123:DIGITAL MAPPING AND PREPARATION OF STRATEGIC URBANDEVELOPMENT PLANS FOR WAJIR COUNTYContract date:23/04/2012
Contract completiondate:14/04/2014
Location: WAJIR COUNTY
Contract cost: Kshs.108.0m
Expected final cost: Kshs.108.0m
Expected completion date: 28/12/2015
Completion stage2012/13 : 30%
Completion stage 2013/14 :50%
Completion stage 2014/15 : 10%
Budget provision2012/13: Kshs. 28.8m
Budget provision 2013/14:Kshs. 28.8m
Budget provision 2014/15: Kshs. 28.8m
Brief overview of the specific needs to be addressed by the project: Create development and Environmentalcontrol frame works, develop economic, CIP and financial Strategies for the counties
PROJECT 124: DIGITAL MAPPING AND PREPARATION OF STRATEGIC URBANDEVELOPMENT PLANS FOR SIAYA COUNTYContract date:23/04/2012
Contract completiondate:14/04/2014
Location: SIAYA COUNTY
Contract cost: Kshs.56.0m
Expected final cost: Kshs.56.0m
Expected completion date: 28/12/2015

127
CAPITAL PROJECTSCompletion stage2012/13 : 30%
Completion stage 2013/14:50%
Completion stage 2014/15: 10%
Budget provision2012/13: Kshs. 14.9m
Budget provision 2013/14:Kshs. 14.9m
Budget provision 2014/15: Kshs. 14.9m
Brief overview of the specific needs to be addressed by the project: Create development and Environmentalcontrol frame works, develop economic, CIP and financial Strategies for the counties.PROJECT 125:DIGITAL MAPPING AND PREPARATION OF STRATEGIC URBANDEVELOPMENT PLANS FOR MACHAKOS COUNTYContract date:23/04/2012
Contract completiondate:14/04/2014
Location: MACHAKOS COUNTY
Contract cost: Kshs.128 million
Expected final cost: Kshs.128.0million
Expected completion date: 28/12/2015
Completion stage2012/13: 30%
Completion stage 2013/14:50%
Completion stage 2014/15: 10%
Budget provision2012/13: 3 Kshs. 4.1m
Budget provision 2013/14:Kshs. 34.1million
Budget provision 2014/15: Kshs. 34.1m
Brief overview of the specific needs to be addressed by the project: Create development and Environmentalcontrol frame works, develop economic, CIP and financial Strategies for the countiesPROJECT 126:DIGITAL MAPPING AND PREPARATION OF STRATEGIC URBANDEVELOPMENT PLANS FOR MARAKWET COUNTYContract date:23/04/2012
Contract completiondate:1/04/2014
Location: ELGEYO MARAKWET COUNTY
Contract cost: Kshs.70.5m
Expected final cost: Kshs.70.5m
Expected completion date: 28/03/2015
Completion stage2010/11: 30%
Completion stage 2011/12:50%
Completion stage 2012/13: 10%
Budget provision2012/13: Kshs. 20.0m
Budget provision 2013/14:Kshs. 5.0m
Budget provision 2014/15: Kshs. 10.0m
Brief overview of the specific needs to be addressed by the project: Create development and Environmentalcontrol frame works, develop economic, CIP and financial Strategies for the counties.PROJECT 127: REHABILITATION OF NAROK STORMWATER DRAINAGE AND ASSOCIATEDWORKS
Contract date:15/10/2012
Contract completiondate:14/11/2014
Location: NAROK COUNTY
Contract cost: Kshs.277.8m
Expected final cost: Kshs.277.8m
Expected completion date: 30/12/2014
Completion stage2012/13: 20%
Completion stage 2013/14 :20%
Completion stage 2014/15 :20%
Budget provision2012/13: Kshs. 30.0m
Budget provision 2013/14:Kshs. 70.0m
Budget provision 2014/15: Kshs. 177.8m
Brief overview of the specific needs to be addressed by the project: Create development and Environmentalcontrol frame works, develop economic, CIP and financial Strategies for the counties.PROJECT 128: REHABILITATION OF MTWAPA STORMWATER DRAINAGE ANDASSOCIATED WORKSContract date:15/09/2012
Contract completiondate:14/10/2014
Location: KILIFI COUNTY
Contract cost: Kshs.277.5m
Expected final cost: Kshs.277.5m
Expected completion date: 30/12/2014
Completion stage2012/13 : 15%
Completion stage 2013/14 :15%
Completion stage 2014/15: 20%
Budget provision2012/13: Kshs. 20.0m
Budget provision 2013/14:Kshs. 50.0m
Budget provision 2014/15: Kshs. 217.5m
Brief overview of the specific needs to be addressed by the project: Create development and Environmental
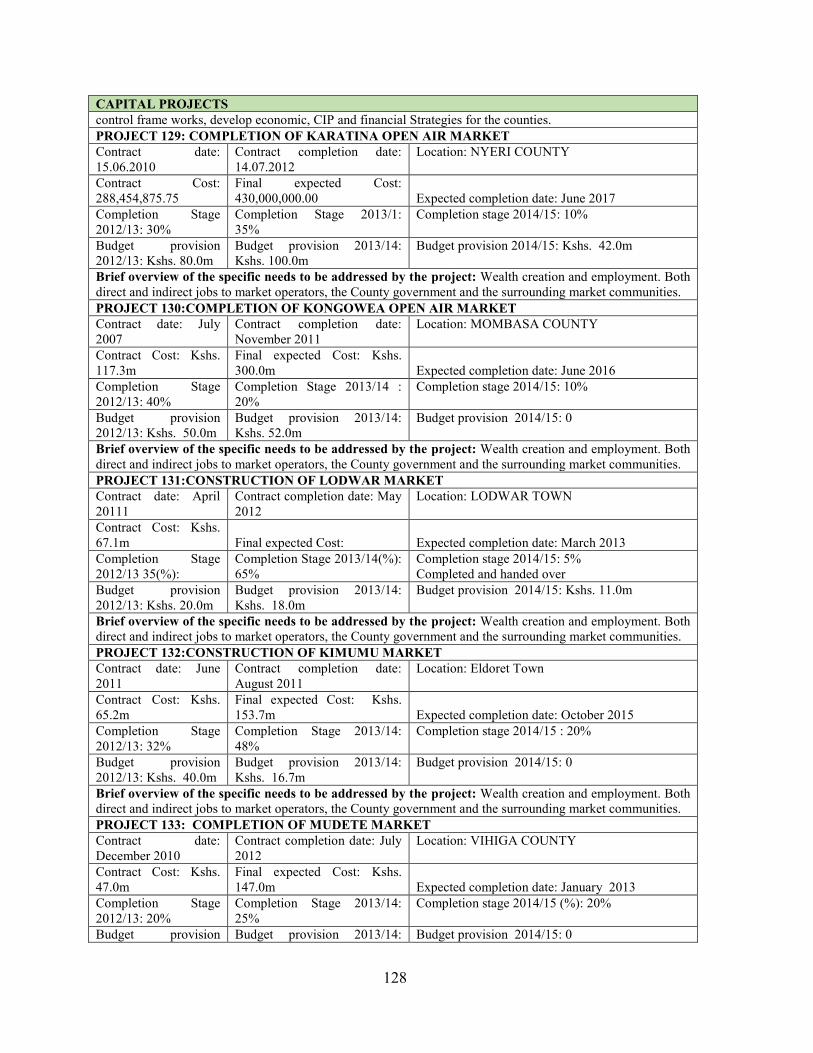
128
CAPITAL PROJECTScontrol frame works, develop economic, CIP and financial Strategies for the counties.PROJECT 129: COMPLETION OF KARATINA OPEN AIR MARKETContract date:15.06.2010
Contract completion date:14.07.2012
Location: NYERI COUNTY
Contract Cost:288,454,875.75
Final expected Cost:430,000,000.00 Expected completion date: June 2017
Completion Stage2012/13: 30%
Completion Stage 2013/1:35%
Completion stage 2014/15: 10%
Budget provision2012/13: Kshs. 80.0m
Budget provision 2013/14:Kshs. 100.0m
Budget provision 2014/15: Kshs. 42.0m
Brief overview of the specific needs to be addressed by the project: Wealth creation and employment. Bothdirect and indirect jobs to market operators, the County government and the surrounding market communities.PROJECT 130:COMPLETION OF KONGOWEA OPEN AIR MARKETContract date: July2007
Contract completion date:November 2011
Location: MOMBASA COUNTY
Contract Cost: Kshs.117.3m
Final expected Cost: Kshs.300.0m Expected completion date: June 2016
Completion Stage2012/13: 40%
Completion Stage 2013/14 :20%
Completion stage 2014/15: 10%
Budget provision2012/13: Kshs. 50.0m
Budget provision 2013/14:Kshs. 52.0m
Budget provision 2014/15: 0
Brief overview of the specific needs to be addressed by the project: Wealth creation and employment. Bothdirect and indirect jobs to market operators, the County government and the surrounding market communities.PROJECT 131:CONSTRUCTION OF LODWAR MARKETContract date: April20111
Contract completion date: May2012
Location: LODWAR TOWN
Contract Cost: Kshs.67.1m Final expected Cost: Expected completion date: March 2013Completion Stage2012/13 35(%):
Completion Stage 2013/14(%):65%
Completion stage 2014/15: 5%Completed and handed over
Budget provision2012/13: Kshs. 20.0m
Budget provision 2013/14:Kshs. 18.0m
Budget provision 2014/15: Kshs. 11.0m
Brief overview of the specific needs to be addressed by the project: Wealth creation and employment. Bothdirect and indirect jobs to market operators, the County government and the surrounding market communities.PROJECT 132:CONSTRUCTION OF KIMUMU MARKETContract date: June2011
Contract completion date:August 2011
Location: Eldoret Town
Contract Cost: Kshs.65.2m
Final expected Cost: Kshs.153.7m Expected completion date: October 2015
Completion Stage2012/13: 32%
Completion Stage 2013/14:48%
Completion stage 2014/15 : 20%
Budget provision2012/13: Kshs. 40.0m
Budget provision 2013/14:Kshs. 16.7m
Budget provision 2014/15: 0
Brief overview of the specific needs to be addressed by the project: Wealth creation and employment. Bothdirect and indirect jobs to market operators, the County government and the surrounding market communities.PROJECT 133: COMPLETION OF MUDETE MARKETContract date:December 2010
Contract completion date: July2012
Location: VIHIGA COUNTY
Contract Cost: Kshs.47.0m
Final expected Cost: Kshs.147.0m Expected completion date: January 2013
Completion Stage2012/13: 20%
Completion Stage 2013/14:25%
Completion stage 2014/15 (%): 20%
Budget provision Budget provision 2013/14: Budget provision 2014/15: 0
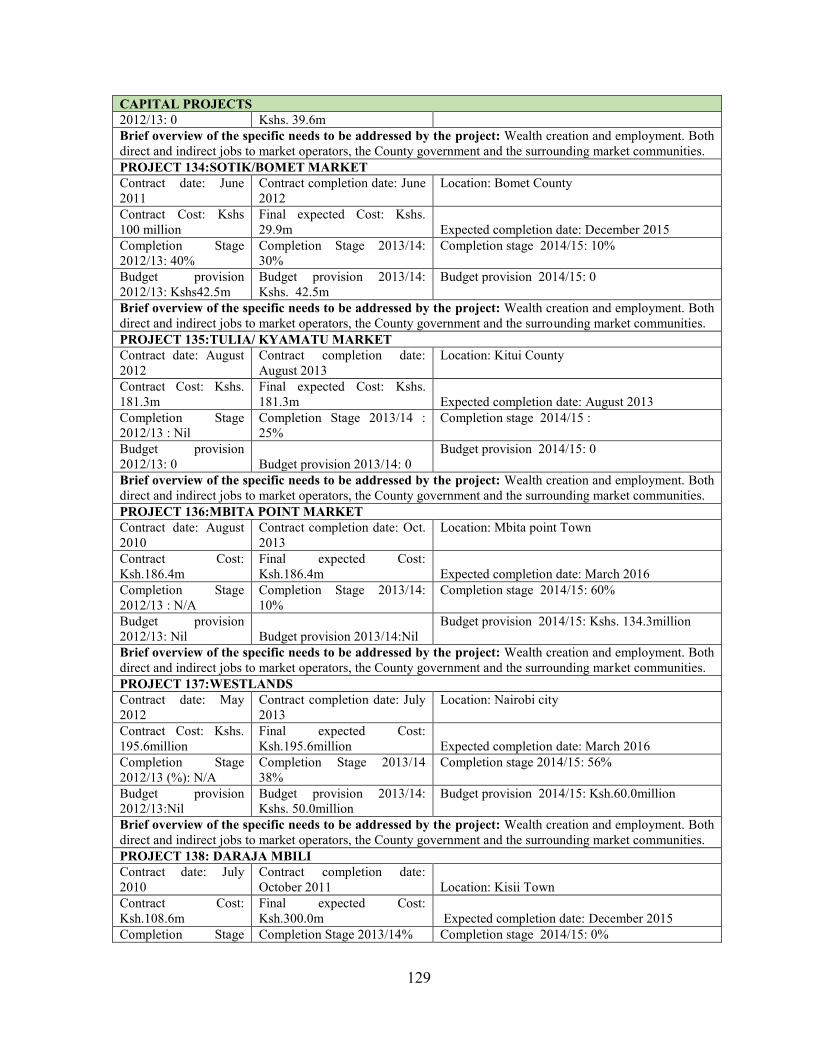
129
CAPITAL PROJECTS2012/13: 0 Kshs. 39.6mBrief overview of the specific needs to be addressed by the project: Wealth creation and employment. Bothdirect and indirect jobs to market operators, the County government and the surrounding market communities.PROJECT 134:SOTIK/BOMET MARKETContract date: June2011
Contract completion date: June2012
Location: Bomet County
Contract Cost: Kshs100 million
Final expected Cost: Kshs.29.9m Expected completion date: December 2015
Completion Stage2012/13: 40%
Completion Stage 2013/14:30%
Completion stage 2014/15: 10%
Budget provision2012/13: Kshs42.5m
Budget provision 2013/14:Kshs. 42.5m
Budget provision 2014/15: 0
Brief overview of the specific needs to be addressed by the project: Wealth creation and employment. Bothdirect and indirect jobs to market operators, the County government and the surrounding market communities.PROJECT 135:TULIA/ KYAMATU MARKETContract date: August2012
Contract completion date:August 2013
Location: Kitui County
Contract Cost: Kshs.181.3m
Final expected Cost: Kshs.181.3m Expected completion date: August 2013
Completion Stage2012/13 : Nil
Completion Stage 2013/14 :25%
Completion stage 2014/15 :
Budget provision2012/13: 0 Budget provision 2013/14: 0
Budget provision 2014/15: 0
Brief overview of the specific needs to be addressed by the project: Wealth creation and employment. Bothdirect and indirect jobs to market operators, the County government and the surrounding market communities.PROJECT 136:MBITA POINT MARKETContract date: August2010
Contract completion date: Oct.2013
Location: Mbita point Town
Contract Cost:Ksh.186.4m
Final expected Cost:Ksh.186.4m Expected completion date: March 2016
Completion Stage2012/13 : N/A
Completion Stage 2013/14:10%
Completion stage 2014/15: 60%
Budget provision2012/13: Nil Budget provision 2013/14:Nil
Budget provision 2014/15: Kshs. 134.3million
Brief overview of the specific needs to be addressed by the project: Wealth creation and employment. Bothdirect and indirect jobs to market operators, the County government and the surrounding market communities.PROJECT 137:WESTLANDSContract date: May2012
Contract completion date: July2013
Location: Nairobi city
Contract Cost: Kshs.195.6million
Final expected Cost:Ksh.195.6million Expected completion date: March 2016
Completion Stage2012/13 (%): N/A
Completion Stage 2013/1438%
Completion stage 2014/15: 56%
Budget provision2012/13:Nil
Budget provision 2013/14:Kshs. 50.0million
Budget provision 2014/15: Ksh.60.0million
Brief overview of the specific needs to be addressed by the project: Wealth creation and employment. Bothdirect and indirect jobs to market operators, the County government and the surrounding market communities.PROJECT 138: DARAJA MBILIContract date: July2010
Contract completion date:October 2011 Location: Kisii Town
Contract Cost:Ksh.108.6m
Final expected Cost:Ksh.300.0m Expected completion date: December 2015
Completion Stage Completion Stage 2013/14% Completion stage 2014/15: 0%
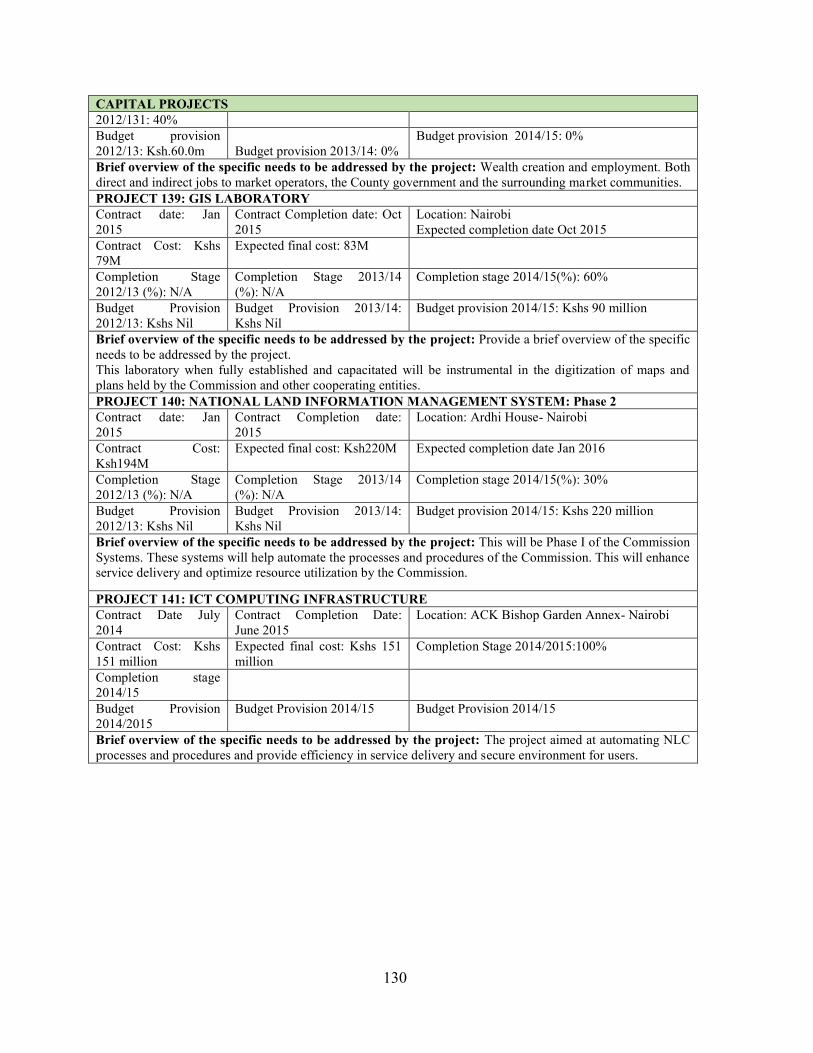
130
CAPITAL PROJECTS2012/131: 40%Budget provision2012/13: Ksh.60.0m Budget provision 2013/14: 0%
Budget provision 2014/15: 0%
Brief overview of the specific needs to be addressed by the project: Wealth creation and employment. Bothdirect and indirect jobs to market operators, the County government and the surrounding market communities.PROJECT 139: GIS LABORATORYContract date: Jan2015
Contract Completion date: Oct2015
Location: NairobiExpected completion date Oct 2015
Contract Cost: Kshs79M
Expected final cost: 83M
Completion Stage2012/13 (%): N/A
Completion Stage 2013/14(%): N/A
Completion stage 2014/15(%): 60%
Budget Provision2012/13: Kshs Nil
Budget Provision 2013/14:Kshs Nil
Budget provision 2014/15: Kshs 90 million
Brief overview of the specific needs to be addressed by the project: Provide a brief overview of the specificneeds to be addressed by the project.This laboratory when fully established and capacitated will be instrumental in the digitization of maps andplans held by the Commission and other cooperating entities.PROJECT 140: NATIONAL LAND INFORMATION MANAGEMENT SYSTEM: Phase 2Contract date: Jan2015
Contract Completion date:2015
Location: Ardhi House- Nairobi
Contract Cost:Ksh194M
Expected final cost: Ksh220M Expected completion date Jan 2016
Completion Stage2012/13 (%): N/A
Completion Stage 2013/14(%): N/A
Completion stage 2014/15(%): 30%
Budget Provision2012/13: Kshs Nil
Budget Provision 2013/14:Kshs Nil
Budget provision 2014/15: Kshs 220 million
Brief overview of the specific needs to be addressed by the project: This will be Phase I of the CommissionSystems. These systems will help automate the processes and procedures of the Commission. This will enhanceservice delivery and optimize resource utilization by the Commission.
PROJECT 141: ICT COMPUTING INFRASTRUCTUREContract Date July2014
Contract Completion Date:June 2015
Location: ACK Bishop Garden Annex- Nairobi
Contract Cost: Kshs151 million
Expected final cost: Kshs 151million
Completion Stage 2014/2015:100%
Completion stage2014/15Budget Provision2014/2015
Budget Provision 2014/15 Budget Provision 2014/15
Brief overview of the specific needs to be addressed by the project: The project aimed at automating NLCprocesses and procedures and provide efficiency in service delivery and secure environment for users.