republic of armenia - world bankdocuments.worldbank.org/curated/en/367551468207280159/... ·...
TRANSCRIPT

Republic of ArmeniaAccumulation, Competition, and Connectivity
April 2013
Poverty Reduction and Economic Management UnitEurope and Central Asia Region
Pub
lic D
iscl
osur
e A
utho
rized
Pub
lic D
iscl
osur
e A
utho
rized
Pub
lic D
iscl
osur
e A
utho
rized
Pub
lic D
iscl
osur
e A
utho
rized
Pub
lic D
iscl
osur
e A
utho
rized
Pub
lic D
iscl
osur
e A
utho
rized
Pub
lic D
iscl
osur
e A
utho
rized
Pub
lic D
iscl
osur
e A
utho
rized

Republic of ArmeniaAccumulation, Competition, and Connectivity
April 2013
Poverty Reduction and Economic Management Unit
Europe and Central Asia Region


Contents | v
Contents
Acknowledgments . . . . . . . . . . . . . . . . . . . . . . . . . . . . . . . . . . . . . . . . . . . . . . . . . . . . . . . . . . . . . . . . . . . . . . . . . . . . . ix
Acronyms and Abbreviations . . . . . . . . . . . . . . . . . . . . . . . . . . . . . . . . . . . . . . . . . . . . . . . . . . . . . . . . . . . . . . . . . . . . xi
Executive Summary . . . . . . . . . . . . . . . . . . . . . . . . . . . . . . . . . . . . . . . . . . . . . . . . . . . . . . . . . . . . . . . . . . . . . . . . . . xiii
Armenia’s New Growth Model . . . . . . . . . . . . . . . . . . . . . . . . . . . . . . . . . . . . . . . . . . . . . . . . . . . . . . . . . . . . . . . . . . . . xiv
Higher Investment, and Better Financial Intermediation . . . . . . . . . . . . . . . . . . . . . . . . . . . . . . . . . . . . . . . . . . . . . . xv
Better Use of Human Resources . . . . . . . . . . . . . . . . . . . . . . . . . . . . . . . . . . . . . . . . . . . . . . . . . . . . . . . . . . . . . . . . . xvii
Enhancing Competition in Armenia’s Markets . . . . . . . . . . . . . . . . . . . . . . . . . . . . . . . . . . . . . . . . . . . . . . . . . . . . . . . xix
Improving Land Connectivity . . . . . . . . . . . . . . . . . . . . . . . . . . . . . . . . . . . . . . . . . . . . . . . . . . . . . . . . . . . . . . . . . . . . xxiii
Improving Air Connectivity . . . . . . . . . . . . . . . . . . . . . . . . . . . . . . . . . . . . . . . . . . . . . . . . . . . . . . . . . . . . . . . . . . . . . . xxiv
Improving Internet and Communication Technology (ICT) . . . . . . . . . . . . . . . . . . . . . . . . . . . . . . . . . . . . . . . . . . . xxvi
Previous Growth Studies . . . . . . . . . . . . . . . . . . . . . . . . . . . . . . . . . . . . . . . . . . . . . . . . . . . . . . . . . . . . . . . . . . . . . . xxvii
Overview . . . . . . . . . . . . . . . . . . . . . . . . . . . . . . . . . . . . . . . . . . . . . . . . . . . . . . . . . . . . . . . . . . . . . . . . . . . . . . . . . . . . xxvii
1. Macroeconomic Developments and Outlook . . . . . . . . . . . . . . . . . . . . . . . . . . . . . . . . . . . . . . . . . . . . . . . . . . . . 1
Economic Growth Before the Global Financial Crisis . . . . . . . . . . . . . . . . . . . . . . . . . . . . . . . . . . . . . . . . . . . . . . . . . . 1
The Global Economic Crisis and Armenia’s Recovery 2009–12 . . . . . . . . . . . . . . . . . . . . . . . . . . . . . . . . . . . . . . . . . . 4
Macroeconomic Outlook . . . . . . . . . . . . . . . . . . . . . . . . . . . . . . . . . . . . . . . . . . . . . . . . . . . . . . . . . . . . . . . . . . . . . . . . . 8
2. Saving, Investment and Financial Intermediation . . . . . . . . . . . . . . . . . . . . . . . . . . . . . . . . . . . . . . . . . . . . . . . 11
Determinants of Aggregate Private Saving . . . . . . . . . . . . . . . . . . . . . . . . . . . . . . . . . . . . . . . . . . . . . . . . . . . . . . . . . 11
Microeconomic Determinants of Household Saving . . . . . . . . . . . . . . . . . . . . . . . . . . . . . . . . . . . . . . . . . . . . . . . . . . 14
Financial Sector Development . . . . . . . . . . . . . . . . . . . . . . . . . . . . . . . . . . . . . . . . . . . . . . . . . . . . . . . . . . . . . . . . . . . . 15
Foreign Direct Investment . . . . . . . . . . . . . . . . . . . . . . . . . . . . . . . . . . . . . . . . . . . . . . . . . . . . . . . . . . . . . . . . . . . . . . . 21
Policy Recommendations . . . . . . . . . . . . . . . . . . . . . . . . . . . . . . . . . . . . . . . . . . . . . . . . . . . . . . . . . . . . . . . . . . . . . . . . 26
3. Human Resources . . . . . . . . . . . . . . . . . . . . . . . . . . . . . . . . . . . . . . . . . . . . . . . . . . . . . . . . . . . . . . . . . . . . . . . . . . 29
Labor Market Trends . . . . . . . . . . . . . . . . . . . . . . . . . . . . . . . . . . . . . . . . . . . . . . . . . . . . . . . . . . . . . . . . . . . . . . . . . . . . 29
Challenges to Armenia’s Labor Market . . . . . . . . . . . . . . . . . . . . . . . . . . . . . . . . . . . . . . . . . . . . . . . . . . . . . . . . . . . . 33
Policy Recommendations . . . . . . . . . . . . . . . . . . . . . . . . . . . . . . . . . . . . . . . . . . . . . . . . . . . . . . . . . . . . . . . . . . . . . . . . 37
Promoting Diaspora Engagement . . . . . . . . . . . . . . . . . . . . . . . . . . . . . . . . . . . . . . . . . . . . . . . . . . . . . . . . . . . . . . . . . 37
vi | Republic of Armenia: Accumulation, Competition, and Connectivity
4. Competition . . . . . . . . . . . . . . . . . . . . . . . . . . . . . . . . . . . . . . . . . . . . . . . . . . . . . . . . . . . . . . . . . . . . . . . . . . . . . . . 43
Competition Indicators . . . . . . . . . . . . . . . . . . . . . . . . . . . . . . . . . . . . . . . . . . . . . . . . . . . . . . . . . . . . . . . . . . . . . . . . . . 44
Barriers to Competition in Key Economic Sectors . . . . . . . . . . . . . . . . . . . . . . . . . . . . . . . . . . . . . . . . . . . . . . . . . . . . 46
Sector Case Study: Prices of Food Products . . . . . . . . . . . . . . . . . . . . . . . . . . . . . . . . . . . . . . . . . . . . . . . . . . . . . . . . 48
The Competition Policy Framework . . . . . . . . . . . . . . . . . . . . . . . . . . . . . . . . . . . . . . . . . . . . . . . . . . . . . . . . . . . . . . . 52
Policy Recommendations . . . . . . . . . . . . . . . . . . . . . . . . . . . . . . . . . . . . . . . . . . . . . . . . . . . . . . . . . . . . . . . . . . . . . . . . 61
5. Land Connectivity . . . . . . . . . . . . . . . . . . . . . . . . . . . . . . . . . . . . . . . . . . . . . . . . . . . . . . . . . . . . . . . . . . . . . . . . . . 63
The Transit Situation . . . . . . . . . . . . . . . . . . . . . . . . . . . . . . . . . . . . . . . . . . . . . . . . . . . . . . . . . . . . . . . . . . . . . . . . . . . . 64
Comparison of Road Transit Options . . . . . . . . . . . . . . . . . . . . . . . . . . . . . . . . . . . . . . . . . . . . . . . . . . . . . . . . . . . . . . 64
Logistics and Trucking Services . . . . . . . . . . . . . . . . . . . . . . . . . . . . . . . . . . . . . . . . . . . . . . . . . . . . . . . . . . . . . . . . . . . 68
Policy Recommendations . . . . . . . . . . . . . . . . . . . . . . . . . . . . . . . . . . . . . . . . . . . . . . . . . . . . . . . . . . . . . . . . . . . . . . . . 69
6. Air Connectivity . . . . . . . . . . . . . . . . . . . . . . . . . . . . . . . . . . . . . . . . . . . . . . . . . . . . . . . . . . . . . . . . . . . . . . . . . . . . 71
Institutional Set-up . . . . . . . . . . . . . . . . . . . . . . . . . . . . . . . . . . . . . . . . . . . . . . . . . . . . . . . . . . . . . . . . . . . . . . . . . . . . . 71
Business Environment . . . . . . . . . . . . . . . . . . . . . . . . . . . . . . . . . . . . . . . . . . . . . . . . . . . . . . . . . . . . . . . . . . . . . . . . . . . 72
Benchmarking Armenia’s Air Connectivity . . . . . . . . . . . . . . . . . . . . . . . . . . . . . . . . . . . . . . . . . . . . . . . . . . . . . . . . . . 73
Likely Impacts of Liberalization . . . . . . . . . . . . . . . . . . . . . . . . . . . . . . . . . . . . . . . . . . . . . . . . . . . . . . . . . . . . . . . . . . . 82
Policy Recommendations . . . . . . . . . . . . . . . . . . . . . . . . . . . . . . . . . . . . . . . . . . . . . . . . . . . . . . . . . . . . . . . . . . . . . . . . 84
7. Internet and Communications Technology (ICT) . . . . . . . . . . . . . . . . . . . . . . . . . . . . . . . . . . . . . . . . . . . . . . . . 95
The IT-based Services Industry in Armenia . . . . . . . . . . . . . . . . . . . . . . . . . . . . . . . . . . . . . . . . . . . . . . . . . . . . . . . . . . 95
Policy Recommendations . . . . . . . . . . . . . . . . . . . . . . . . . . . . . . . . . . . . . . . . . . . . . . . . . . . . . . . . . . . . . . . . . . . . . . 100
References . . . . . . . . . . . . . . . . . . . . . . . . . . . . . . . . . . . . . . . . . . . . . . . . . . . . . . . . . . . . . . . . . . . . . . . . . . . . . . . . . . 103
TAbLES
Table 1 . Price Differences for Food Articles, Armenia and selected CIS countries, 2010 . . . . . . . . . . . . . . . . . . . . xxi
Table 2 . Summary of Policy Recommendations . . . . . . . . . . . . . . . . . . . . . . . . . . . . . . . . . . . . . . . . . . . . . . . . . . . . . xxix
Table 1 .1 . Macroeconomic Trends and Projections . . . . . . . . . . . . . . . . . . . . . . . . . . . . . . . . . . . . . . . . . . . . . . . . . . . . 2
Table 1 .2 . GDP Growth Decomposition from Employment Changes, 2003–08 . . . . . . . . . . . . . . . . . . . . . . . . . . . . . 5
Table 1 .3 . Debt Reducing Primary Balances . . . . . . . . . . . . . . . . . . . . . . . . . . . . . . . . . . . . . . . . . . . . . . . . . . . . . . . . . . 9
Table 2 .1 . Determinants of Aggregate Saving (2002q1–2011q2) . . . . . . . . . . . . . . . . . . . . . . . . . . . . . . . . . . . . . . . . 13
Table 2 .2 . Error Correction Model Specification . . . . . . . . . . . . . . . . . . . . . . . . . . . . . . . . . . . . . . . . . . . . . . . . . . . . . 13
Table 2 .3 . Monthly Household Income, Consumption and Saving . . . . . . . . . . . . . . . . . . . . . . . . . . . . . . . . . . . . . . 14
Table 3 .1 . Impact of Diaspora Members: Armenia in Light of Relevant Benchmarks . . . . . . . . . . . . . . . . . . . . . . . 40
Table 4 .1 . Presence of State Owned Enterprises . . . . . . . . . . . . . . . . . . . . . . . . . . . . . . . . . . . . . . . . . . . . . . . . . . . . . 46
Table 4 .2 . Summary of Main Market Characteristics and Results of Price Comparisons Industry . . . . . . . . . . . . . 50
Table 4 .3 Price Comparison Analysis, Armenia vs . CIS Countries . . . . . . . . . . . . . . . . . . . . . . . . . . . . . . . . . . . . . . . 50
Table 4 .4 . Price Differences for Selected Food Products, as Compared to Selected CIS Countries . . . . . . . . . . 51
Table 4 .5 . A Comprehensive Competition Policy Framework . . . . . . . . . . . . . . . . . . . . . . . . . . . . . . . . . . . . . . . . . . 53
Table 4 .6 . Defining an “Economic Entity” for the Implementation of the Competition Law . . . . . . . . . . . . . . . . . 56

Contents | vii
Table 4 .7 . Elements For Designing Merger Control Policies . . . . . . . . . . . . . . . . . . . . . . . . . . . . . . . . . . . . . . . . . . . 57
Table 4 .8 . Competition Indicators for Select Markets . . . . . . . . . . . . . . . . . . . . . . . . . . . . . . . . . . . . . . . . . . . . . . . . . 58
Table 4 .9 . Example of Direct and Indirect Support to Firms . . . . . . . . . . . . . . . . . . . . . . . . . . . . . . . . . . . . . . . . . . . 59
Table 5 .1 . Armenia’s Merchandise Trade Partners, by Region, 2010 . . . . . . . . . . . . . . . . . . . . . . . . . . . . . . . . . . . . . 64
Table 5 .2 . Trade Complementarity Index, Armenia and Selected Trading Partners, 2008–10 . . . . . . . . . . . . . . . . 66
Table 5 .3 . Estimated Costs to Export One Truckload: Yerevan to Moscow (via Poti) . . . . . . . . . . . . . . . . . . . . . . . . 67
Table 5 .4 . Ro-Ro Service Average Rates for a Full Truck . . . . . . . . . . . . . . . . . . . . . . . . . . . . . . . . . . . . . . . . . . . . . . . 68
Table 5 .5 . Import Costs from China to Yerevan (via Bandar Abbas), 20' and 40' Containers, 2012 . . . . . . . . . . . . 68
Table 6 .1 . Base of Operations and Size of Selected Carriers in CIS Countries . . . . . . . . . . . . . . . . . . . . . . . . . . . . . 81
Table A6 .1 . Pooled OLS Regression Results, Aggregate Fare Elasticities . . . . . . . . . . . . . . . . . . . . . . . . . . . . . . . . 85
Table A6 .2 . Pooled OLS Regression Results, Economy and Business Class Fare Elasticities . . . . . . . . . . . . . . . . . 87
Table A6 .3 . Instrumental Variables Regression Results, Aggregate Fare Elasticities . . . . . . . . . . . . . . . . . . . . . . . . 88
Table A6 .4 . OLS Regression Results, Fare Elasticities by Market . . . . . . . . . . . . . . . . . . . . . . . . . . . . . . . . . . . . . . . . 88
Table A6 .5 . Pooled OLS Regression Results, Determinants of Fares . . . . . . . . . . . . . . . . . . . . . . . . . . . . . . . . . . . . . 90
Table 6 .2 . Summary of Selected Studies on Air Transport Liberalization . . . . . . . . . . . . . . . . . . . . . . . . . . . . . . . . . 93
FIguRES
Figure 1 . Saving, Armenia and Selected Countries, 2003–10 . . . . . . . . . . . . . . . . . . . . . . . . . . . . . . . . . . . . . . . . . . . xv
Figure 2 . Lending-to-Deposit Rate Spreads, Armenia and Selected Countries, 2010 . . . . . . . . . . . . . . . . . . . . . . xvi
Figure 3 . Armenia: Labor Force Participation and Employment, 2000–2010 . . . . . . . . . . . . . . . . . . . . . . . . . . . . . xviii
Figure 4 . Number of Firms in Each Sector, Market, or Market Segment . . . . . . . . . . . . . . . . . . . . . . . . . . . . . . . . . xx
Figure 5 . Concentration Levels for Selected Armenian Food Products, HHI . . . . . . . . . . . . . . . . . . . . . . . . . . . . . xxii
Figure 6 . Merchandise Trade by Mode of Transport, 2011 . . . . . . . . . . . . . . . . . . . . . . . . . . . . . . . . . . . . . . . . . . . . xxiii
Figure 7 . Number of Destinations by Frequency of Service from CIS Countries’ Capitals, 2012 . . . . . . . . . . . . . xxiv
Figure 8 . Lowest Available Fares from (left) and to (right) Yerevan and Tbilisi Direct and non-stop routes . . . . xxv
Figure 9 . Total Turnaround Charges, for an Airbus A320-200 . . . . . . . . . . . . . . . . . . . . . . . . . . . . . . . . . . . . . . . . . . xxvi
Figure 1 .1 . Growth, Capital Formation, Exports, and Consumption in Armenia and Low Income Countries . . . . 3
Figure 1 .2 . Current Account Balance, Construction, Investment, and Components of Growth . . . . . . . . . . . . . . . 4
Figure 1 .3 . Real GDP and its Components, Q1-2008 to Q2-2012 . . . . . . . . . . . . . . . . . . . . . . . . . . . . . . . . . . . . . . . . 5
Figure 1 .4 . External Trade and Capital Flows, 2006–11 . . . . . . . . . . . . . . . . . . . . . . . . . . . . . . . . . . . . . . . . . . . . . . . . . 6
Figure 1 .5 . Key Fiscal Indicators, 2008–2012 . . . . . . . . . . . . . . . . . . . . . . . . . . . . . . . . . . . . . . . . . . . . . . . . . . . . . . . . . . 7
Figure 1 .6 . Policy Rate and 12-month Inflation, 2008–2012 . . . . . . . . . . . . . . . . . . . . . . . . . . . . . . . . . . . . . . . . . . . . . 8
Figure 1 .7 . Public Sector Debt, 2012–32 . . . . . . . . . . . . . . . . . . . . . . . . . . . . . . . . . . . . . . . . . . . . . . . . . . . . . . . . . . . . . 9
Figure 2 .1 . Saving, Armenia and Selected Countries, 2003–10 . . . . . . . . . . . . . . . . . . . . . . . . . . . . . . . . . . . . . . . . . 12
Figure 2 .2 . Armenia : Composition of Domestic Saving, 2002–10 . . . . . . . . . . . . . . . . . . . . . . . . . . . . . . . . . . . . . . . 12
Figure 2 .3 . Armenia: Peer Comparison on Financial Sector Depth . . . . . . . . . . . . . . . . . . . . . . . . . . . . . . . . . . . . . . 16
Figure 2 .4 . Composition of Bank Deposits, 2000–12 . . . . . . . . . . . . . . . . . . . . . . . . . . . . . . . . . . . . . . . . . . . . . . . . . . 16
Figure 2 .5 . Corporate Leverage Ratios, Armenia and Selected Countries, 2011 . . . . . . . . . . . . . . . . . . . . . . . . . . . 17
Figure 2 .6 . Lending-to-Deposit Rate Spreads, Armenia and Selected Countries, 2010 . . . . . . . . . . . . . . . . . . . . . 18

viii | Republic of Armenia: Accumulation, Competition, and Connectivity
Figure 2 .7 . Government Bond Yields and Lending Rates, Armenia and Regional Comparators, 2011 . . . . . . . . 19
Figure 2 .8 . Stock Market Capitalization, Armenia and Selected Countries, 2010 . . . . . . . . . . . . . . . . . . . . . . . . . . 20
Figure 2 .9 . Projection of Individual Pension Invested Funds, 2014–2020 . . . . . . . . . . . . . . . . . . . . . . . . . . . . . . . . . 20
Figure 2 .10 . Armenia: Savings Gap and Foreign Direct Investment, 2001–2011 . . . . . . . . . . . . . . . . . . . . . . . . . . . 21
Figure 2 .11 . Armenia: FDI Inflows during the 2000s . . . . . . . . . . . . . . . . . . . . . . . . . . . . . . . . . . . . . . . . . . . . . . . . . . 22
Figure 2 .12 . Capital Accumulation and FDI Inflows, 2000–2010 . . . . . . . . . . . . . . . . . . . . . . . . . . . . . . . . . . . . . . . . . 23
Figure 2 .13 . Sectoral Contribution to Total Gross value Added, 2000–2010 . . . . . . . . . . . . . . . . . . . . . . . . . . . . . . 25
Figure 3 .1 . Armenia: Labor Force Participation and Employment, 2010 . . . . . . . . . . . . . . . . . . . . . . . . . . . . . . . . . . 30
Figure 3 .2 . Armenia’s Drivers of Employment, by Sector, 2002–10 . . . . . . . . . . . . . . . . . . . . . . . . . . . . . . . . . . . . . . 31
Figure 3 .3 . Employment Ratios in International Comparison . . . . . . . . . . . . . . . . . . . . . . . . . . . . . . . . . . . . . . . . . . 32
Figure 3 .4 . Skills and Labor Demand, 2008 . . . . . . . . . . . . . . . . . . . . . . . . . . . . . . . . . . . . . . . . . . . . . . . . . . . . . . . . . . 34
Figure 3 .5 . Armenia: Labor Force Participation and Employment, 2010 . . . . . . . . . . . . . . . . . . . . . . . . . . . . . . . . . . 36
Figure 4 .1 . Number of Firms in Each Sector, Market, or Market Segment . . . . . . . . . . . . . . . . . . . . . . . . . . . . . . . . 44
Figure 4 .2 . Market Structure, 2009 . . . . . . . . . . . . . . . . . . . . . . . . . . . . . . . . . . . . . . . . . . . . . . . . . . . . . . . . . . . . . . . . . 45
Figure 4 .3 . Price Controls Across Professions in the EU and OECD Countries . . . . . . . . . . . . . . . . . . . . . . . . . . . . 48
Figure 4 .4 . Concentration Levels for Selected Armenian Food Products, HHI . . . . . . . . . . . . . . . . . . . . . . . . . . . . 49
Figure 4 .5 . The Role of Competition Policy . . . . . . . . . . . . . . . . . . . . . . . . . . . . . . . . . . . . . . . . . . . . . . . . . . . . . . . . . 52
Figure 5 .1 . Merchandise Trade by Mode of Transport, 2011 . . . . . . . . . . . . . . . . . . . . . . . . . . . . . . . . . . . . . . . . . . . 64
Figure 5 .2 . Armenia Trade and Transport Facilitation Performance, 2007–2012 . . . . . . . . . . . . . . . . . . . . . . . . . . . 65
Figure 6 .1 . Capacity Distribution (seats) from Yerevan . . . . . . . . . . . . . . . . . . . . . . . . . . . . . . . . . . . . . . . . . . . . . . . . 73
Figure 6 .2 . Number of Destinations by Frequency of Service from Yerevan . . . . . . . . . . . . . . . . . . . . . . . . . . . . . . 74
Figure 6 .3 . Number of Destinations by Frequency of Service from CIS Countries’ Capitals . . . . . . . . . . . . . . . . . 74
Figure 6 .4 . Lowest Available Fares . Yerevan and Tbilisi Direct and non-stop routes . . . . . . . . . . . . . . . . . . . . . . . . 75
Figure 6 .5 . Lowest Available Fares from Yerevan, Tbilisi, Baku and Almaty Direct and non-stop routes . . . . . . . 77
Figure 6 .6 . Turnaround Costs for an Airbus A320-200 Paid by Airlines . . . . . . . . . . . . . . . . . . . . . . . . . . . . . . . . . . . 77
Figure 6 .7 . Total Turnaround Charges paid by Passengers for an Airbus A320-200 . . . . . . . . . . . . . . . . . . . . . . . . 78
Figure 6 .8 . Total Turnaround Charges, for an Airbus A320-200 . . . . . . . . . . . . . . . . . . . . . . . . . . . . . . . . . . . . . . . . . 79
Figure 6 .9 . Spatial Concentration and Schedule (time) Coordination of CIS Carrier Operations . . . . . . . . . . . . . 82
Figure 7 .1 . Overall Location Readiness Index (LRI) for IT/ITES . . . . . . . . . . . . . . . . . . . . . . . . . . . . . . . . . . . . . . . . . . 97
Figure 7 .2 . Armenia’s Ready-to-Hire Population . . . . . . . . . . . . . . . . . . . . . . . . . . . . . . . . . . . . . . . . . . . . . . . . . . . . . 98
Figure 7 .3 . Armenia Cost of Operations . . . . . . . . . . . . . . . . . . . . . . . . . . . . . . . . . . . . . . . . . . . . . . . . . . . . . . . . . . . . 99
bOxES
Box 3 .1 . First Mover Institutions in Emerging Economies Created with the Help of Diasporas . . . . . . . . . . . . . . . 41
Box 4 .1 . Review of the current draft of the amendments to Armenia’s Competition Law . . . . . . . . . . . . . . . . . . . 55
Box 4 .2 . EU Assessment Methodology and Checklist to Ensure That State Aid is Non-distortionary . . . . . . . . . 60
Box 6 .1 . Criteria for Counting Valid ‘hits’ on Connecting Flights . . . . . . . . . . . . . . . . . . . . . . . . . . . . . . . . . . . . . . . . 80

Acknowledgments | ix
This report was prepared by a team initially led by Sou-leymane Coulibaly and then by Ulrich Bartsch from the World Bank‘s Eastern Europe and Central Asia (ECA) regional department . The lead authors have a large team to thank for their inputs and insights, including colleagues from inside and outside the World Bank . We wish to extend our gratitude to Tania Begazo, Mohamed Diaby, Gohar Gyulumyan, Artsvi Khacha-tryan, Tigran Kostanyan, Yevgeny Kuznetsov, Martha Martinez Licetti, Vilas Pathikonda, Iulian Pogor, Geor-giana Pop, Siddhartha Raja, Sandra Sargent, Daniel Saslavsky, Evgenia Shumilkina, Ramya Sundaram, Er-win Tiongson and staff of EV consulting .
Acknowledgments
The study benefited from regular feedback from the Republic of Armenia‘s Ministry of Finance, the Ministry of Economy, the General Directorate of Civil Aviation and the Central Bank of Armenia . Useful comments were also received from the IMF and USAID .
The Bank‘s team benefited also from the guidance and comments of senior World Bank managers and colleagues, including Asad Alam, Henry Kerali, Yvonne Tsikata, Kazi Matin, Ivailo Izvorski, Pedro Luis Rodriguez, Rashmi Shankar, Jean-Michel Happi, Palo-ma Anos Casero, Daniel Ledermann, Ndiame Diop, Deepak Mishra, Pablo Saavedra, and Raju Singh . Zakia Nekaien-Nowrouz and Nelli Kachatryan provided ex-cellent support to the team .


Acronyms and Abbreviations | xi
Acronyms and Abbreviations
ACRA Accounting and Corporate Regulatory Authority
ADB Asian Development BankAEA Armavia and Atlantis European AirwaysASA Air Service AgreementAMD Armenian DramASM Average Seat MilesAUA American University of ArmeniaBEEPS Business Environment and Enterprise
Performance SurveyCBA Central Bank of Armenia
CEE Central and Eastern European CountriesCIS Commonwealth Independent StateCPI Consumer Price IndexCSA Czech AirlinesDSA Debt Sustainability AnalysisECA Europe and Central AsiaECF Extended Credit FacilityEFF Extended Fund FacilityEIF Enterprise Incubator foundation
ETF European Training FoundationEU European UnionFBP Family Benefit ProgramFDI Foreign Direct InvestmentGCI Global Competitiveness IndexGDCA General Department of Civil AviationGDP Gross Domestic Product
GFCF Gross Fixed Capital Formation
GVA Gross Value AddedIFS International Financial StatisticsICT Information and Communication TechnologyIDA International Development AssociationILCS Integrated Living Conditions Survey
ILO International Labor OrganizationIMF International Monetary FundIT Information TechnologyITES IT-Enabled Services
LPI Logistics Performance IndexLRI Location Readiness IndexMNC Multinational CorporationMSME Micro, Small and Medium Enterprise
NACE National Association of Colleges and Empoyers
NGO Non-governmental OrganizationNSRC North-South Road CorridorNSS National Statistical ServiceOECD Organization for Economic DevelopmentPER Public Expenditure ReviewPES Armenia’s Public Employment ServicesPPP Public Private PartnershipPMR Product Market RegulationsPSRC Public Service Regulatory CommissionR&D Research and Development
ROA Republic of ArmeniaSCPEC State Commission for the Protection of
CompetitionSRC State Revenue CommissionSME Small and Medium EnterpriseSOE State-owned enterprises
TA Technical AssistanceUSAID United States Agency for International
DevelopmentUSD US dollarVAT Value Added TaxWTO World Trade Organization
WEF World Economic Forum


Executive Summary | xiii
Executive Summary
by 2013, the Armenian economy has left behind most of the hangover from the global financial crisis and a look at medium- to long-term growth driv-ers is therefore in order. Real GDP growth reached 7 .2 percent in 2012, and the current account deficit narrowed, although it remained high . Macroeconom-ic buffers have been rebuilt to some extent, although the public debt-to-GDP ratio, at 44 percent, remains too high to relax fiscal restraints . The rebound came after a severe recession in 2009 and low but increasing growth rates in 2010 and 2011 . Still, the double-digit growth performance before the global crisis seems a long way off, and the altered international environ-ment means that a return to the same pattern of high growth is unlikely .
The central tenet of this report is that the govern-ment’s job creation agenda requires a different growth model than the one followed before the global crisis. The government’s Armenia Development Strategy (ADS) for 2012–25 gives highest priority to job creation . It emphasizes strong employment expansion in “high-quality and decently paid” jobs . The strategy rightly highlights the need to improve the business en-vironment and investment climate, through strength-ening financial intermediation, investment promotion, and competition policy enforcement . We point out in this report that the high growth before the global crisis failed to solve Armenia’s employment problem, and that unsustainable macroeconomic imbalances were built up . The high growth was based on a foreign fi-nanced expansion of the construction sector and do-mestic services, while exports lagged behind .
Reaching the goals of the government’s strategy will require a combination of four factors. First,
higher investment and better financial intermediation between savers and investors . Second, better utiliza-tion of the labor force, including the largely untapped resource of Armenians abroad . Third, stronger com-petitive pressures in the markets for goods and ser-vices, which will improve incentives for companies to innovate, adopt new technologies, and become more efficient . Fourth, enhanced connections of the land-locked Armenian economy with world markets, includ-ing through land, air, and through internet and com-munication technologies .
The return to decent growth rates therefore should not lead to complacency: Armenia’s government now needs to act to reach its goals. The growth spurt of 2003–08 was narrowly based on an expansion of residential construction, domestic services, and for-eign exchange inflows . Although many jobs were cre-ated in the construction sector, overall employment expanded very little, and unemployment continued to be rampant, in particular among young job seekers . Moreover, the boom ended in a massive contraction in 2009 when capital inflows stopped and investor confidence nose-dived . The downturn of course led to a significant increase in unemployment, and set the clock back by several years with regards to poverty reduction efforts . The goal is now to create favorable conditions for a different, more sustainable pattern of economic growth by increasing Armenia’s internation-al competitiveness .
uncertainties in the international economic envi-ronment make it more urgent to design policies in support of the new growth model. Armenia’s economy faces important headwinds, in particular a possible new recession in its main trading partner,

xiv | Republic of Armenia: Accumulation, Competition, and Connectivity
the European Union . In addition, adjustments of the still-too-large construction sector will continue, and agricultural sector growth, which buoyed over-all growth in 2011–12, will return to its historic 3–4 percent annual expansion pace . Growth drivers will therefore have to be industry and modern services competing in international markets . Within industry, the manufacturing sector is the most likely sector to create employment . Labor productivity is significantly higher in manufacturing than in, for example, agricul-ture, and its production technology is much more la-bor intensive than that of heavy industry and modern services . The manufacturing sector is therefore rightly targeted in the ADS as the sector in which high quali-ty, decently paid jobs will be created . Higher produc-tivity in this context means higher growth and faster poverty reduction .
This report’s theoretical framework emphasizes structural reforms to drive growth. Economic growth theory distinguishes between accumulation of the fac-tors of production and enhancing the productivity with which these factors are employed . Both need to work in tandem for economic growth to occur and be sus-tainable . The report highlights that this was not the case in the run-up to and during the global financial crisis . Going forward, growth should be broader based and led by tradable sectors capable of creating jobs for the large number of—mostly young—unemployed Armenians .
The choice of topics follows the logic of developing policies for structural reforms in line with the goals of the ADS. The chapters therefore support higher accumulation of factors of production—capital and labor—and making them more productive through more competition and better connectivity of the Ar-menian economy with the rest of the world . In the rest of this summary, we present the main areas of analysis, and the policy messages resulting from them .
Armenia’s New Growth ModelArmenia’s economy grew by 3 percent per year on average between 1991 and 2012, but the average masks large fluctuations. Armenia outperformed oth-er lower middle income countries, but was hit harder than others by the global crisis in 2008–09 . We can dis-tinguish four phases:
1 . Post independence . The economy contracted by half between 1990 and 1993, because of the break-down of the Soviet Union’s production val-ue chains . Economic displacement and structur-al transformation continued until the end of the 1990s .
2 . Transition . Strong economic growth during 1999–2003 was built on high productivity growth and exports . Favorable inflation and exchange rate dy-namics led to a depreciation of the real exchange rate by 15 percent . The economy regained its pre-independence size in about 2003 .
3 . Irrational exuberance.1 In 2003, the government started actively seeking investments from Arme-nians living abroad (the diaspora) into real estate in Armenia . This created a construction-centered growth model supported by foreign exchange in-flows . Double-digit economic growth rates were underpinned by high rates of investment, which peaked at 35 percent of GDP . High growth was led by residential construction and domestic ser-vices . Construction sector value-added multiplied 5 .5 times and accounted for more than a third of real GDP growth . The real exchange rate appre-ciated by nearly 60 percent and outward orienta-tion of the economy declined . Despite the rapid construction of residential units, prices increased manifold, which in turn increased the attractive-ness of real estate for investors—a classic bubble . The currency appreciation going along with for-eign exchange inflows hampered export expan-sion . Productivity growth sagged, and unemploy-ment remained high despite impressive job cre-ation in the construction industry . When the global financial crisis at the end of 2008 brought a sharp decline in remittances and investor sentiment, the construction industry collapsed and the economy shrank by 14 percent .
4 . Recession and recovery. As a result of the global economic crisis, Armenia’s economy contracted by 14 percent in 2009 . In that year, remittances declined by 35 percent, investment declined 31 percent, and the construction industry contract-ed by 41 .6 percent . Since then, a modest, but
1 Phrase coined by US Federal Reserve Chairman Alan Greenspan in December 1996 during the dotcom bubble . The phrase was interpreted as a warning that the market was over-valued .

Executive Summary | xv
accelerating recovery has taken hold. Real GDP expanded by 4 .7 percent in 2011 and 7 .2 percent in 2012 buoyed by high prices for base metals and high agricultural output . The decline in the con-struction sector seems to have bottomed out, and a strong growth in exports contributed to an im-proving external balance . The average growth rate of merchandise exports was 45 percent in US dol-lar terms during 2010–2011, while imports grew by only 14 percent . Merchandise exports expanded strongly partly because of high commodity prices for Armenia’s metals and minerals .
Coming out of the crisis, the dependence of the economy on domestic demand is easing. The con-traction of domestic consumption and exchange rate depreciation allowed exports to expand . Net ex-ports contributed 1 percent to GDP growth in 2012, a strong turn-around from the negative contribution to GDP growth of about 10 percent in 2007 and 2008 . In the wake of the crisis, exports grew significantly faster than GDP, and the export to GDP ratio rose quickly to about 25 percent in 2012 . The construction sec-tor stabilized in 2012 . However, it is still significantly larger than construction sectors in other lower middle income countries .
Slower growth abroad, and a return to trend in ag-ricultural growth suggest a slowdown of economic growth over the medium term. With the effects of the good agricultural harvest waning, GDP growth is projected to moderate to 5 percent during 2013–2015 . With a modest outlook for construction and the agriculture sector’s return to its historic 3–4 percent annual expansion pace, growth drivers will have to come from industry and modern services .
The current account deficit is expected to improve with growing remittances and as a result of struc-tural shifts in the economy. Policies geared to in-dustrial development and export promotion should lead to faster growth of tradable sectors . Together with continuing growth in remittance inflows, this will support a reduction in the current account defi-cit to single digits . The macroeconomic framework also takes into account gradual depreciation of the exchange rate to support an improvement in the cur-rent account balance .
Higher Investment, and Better Financial IntermediationInvestment was very high before the global crisis, but most of it was not directed to productive sec-tors. Domestic saving increased from around 5 per-cent of GDP in the beginning of the decade, to 35 per-cent of GDP in 2006, significantly above regional peers (Figure 1) . Public saving contributed about 5 percent of GDP to this rise . Foreign direct investment signifi-cantly supplemented domestic savings . The global financial crisis led to a fall in the saving-to-GDP and investment-to-GDP ratios by about 15 percentage points during 2009–11, but the level of saving is still higher than the regional average . Public saving de-clined when revenue dropped in line with falling GDP and spending was maintained in an attempt to sup-port aggregate demand .
Figure 1. Saving, Armenia and Selected Countries, 2003–10(in percent of GDP)
2003 2004 2008 2006 2007 2008 2009 2010
40
30
20
10
0
ArmeniaAlbaniaPoland
MoldovaEstonia
GeorgiaMacedonia, FYR
Sources: WDI.
Public investment in infrastructure is low and has been falling. While public investment was increased to 6 .7 percent of GDP in 2009 from 5 .1 percent in 2008, it has since fallen to 3 .8 percent of GDP in 2012 . From 22 .4 percent of total spending in 2008, capital spend-ing was only 13 .2 percent of total spending in 2012 . Armenia is ranked 71st in quality of infrastructure in the Global Competitiveness Report 2012–13 .
High investment and a stable, manageable cur-rent account deficit are crucial for high economic growth rates. As the Growth Report (2008) pointed out, economies that had sustained 7 percent or higher growth since the 1950s had investment rates of 20–25

xvi | Republic of Armenia: Accumulation, Competition, and Connectivity
percent, while maintaining the current account deficit at manageable levels . Foreign saving is an imperfect substitute for domestic saving, because of the vulner-ability to capital flow volatility that it creates . Foreign direct investment (FDI) has often proved less volatile than other forms of foreign saving, and high domestic saving and FDI are therefore important inputs to high and stable growth rates .
Armenia’s recent experience has shown that the sectoral allocation of investment matters and there-fore the intermediation between saving and invest-ment. The residential investment boom of 2003–08 left the economy vulnerable to the external shock of the global crisis . Armenia’s financial system is dom-inated by banks, while equity and securities markets are rudimentary . Banks account for 92 percent of the financial system’s assets, while credit organizations ac-count for 5 .5 percent . The public bond market is more established than the private bond market, and the Ar-menian government has created a system of regular public bond placements in the primary market, which mainly consists of banks . The volume of public debt outstanding has been increasing at a rate of about 20 percent per annum over recent years to reach about 6 percent of GDP in 2012 compared with 3 percent in 2003 . The private bond market capitalization is less than 1 percent of GDP .
The banking system is sound and has been grow-ing rapidly, but it still lags behind most of its peers in size, efficiency, and innovation. The banking system is fragmented with 21 relatively small banks . Private sector credit to GDP remains relatively low at about 38 percent compared to the median of the ECA region of 42 percent in 2010 .2 Armenia compares unfavorably to similar countries in terms of indicators for financial system efficiency (interest rate spreads, net interest margin, and overhead-to-assets ratio, Figure 2) . Deposits are predominantly held in U .S . dollars, and access to donor funds reduces banks’ incentives to offer attractive saving rates . The banks give mostly plain vanilla corporate loans to large corporate clients, and micro, small and medium
2 World Development Indicators database for 2010 . CBA re-ports 38 percent credit to GDP for 2012, but the methodology is not the same and shows a higher ratio than the one calculated for WDI .
enterprises’ (MSMEs) face difficulties accessing loans. MSMEs often lack the necessary skills to be consid-ered creditworthy because of insufficient accounting and reporting, and difficulties in posting collateral . While the collateral regime has improved in recent years, shortcomings remain in several areas, including registration and foreclosure .
Figure 2. Lending-to-Deposit Rate Spreads, Armenia and Selected Countries, 2010(in percent)
0% 2% 4% 6% 8% 10% 12% 14% 16%
Armenia 2012** Armenia 2010
Georgia Albania
Moldova Ukraine
Macedonia Poland* Estonia
Lower middle income countries Middle income countries
World
Source: CBA, WDI.
Financial market development will likely receive a significant boost from the inflow of funds ex-pected from the new mandatory individual pen-sion accounts. Investible resources are projected to rise to nearly $2 billion by 2020, a significant sum for Armenia, where total banking assets in 2010 were about $6 billion . The new pension accounts provide tremendous opportunities, but the government and the CBA still have to design the rules and regulations and the financial infrastructure to make them a suc-cess .
Reforms to boost investment cover four areas: the macroeconomic environment, financial interme-diation, remittances, and FDI. The significance of income in determining the saving rate implies that a growth-enabling macroeconomic environment is a necessary condition for high domestic saving and reduces reliance on foreign capital for investment . A macroeconomic environment that ensures low infla-tion, a sustainable fiscal deficit and a sustainable cur-rent account deficit enables growth . Monetary, fiscal and trade policies need to be closely coordinated .
Executive Summary | xvii
Deeper financial intermediation stimulates invest-ment. Credit services are available to a relatively small group of companies, which are mostly large, modern sector entities, while micro-, small-, and medium-scale companies rely to a large extent on retained earnings to finance working capital and expansions . Micro-sav-ings and -credit institutions can overcome size con-straints, particularly in small towns and rural areas . To further expand credit services, measures could include the following:
¾ Building capacity with MSMEs and banks on how to access credit and provide loans .
¾ Improving the collateral registration and realiza-tion process .
¾ Promotion and expansion of microfinance . ¾ Regulatory modifications to expand financial ser-
vices and credit products, including hedging, fac-toring, and leasing .
¾ Outreach, awareness building, and financial litera-cy initiatives to deepen understanding of financial products .
Equity and securities markets could supplement fi-nancial intermediation offered through banks. De-veloping initiatives for increasing the supply of capital market securities will require a multi-pronged effort versus a traditional ‘organic’ growth of markets . This may include:
¾ Securities regulation to increase financial market access and product development .
¾ Institution-specific initiatives, such as increasing the role of the national mortgage company and Pan Armenian Bank in issuing securities .
¾ Deeper government debt management to in-crease the depth of AMD government securities to provide a benchmark for indexed bonds .
¾ Using cashflow backed project bonds to finance public infrastructure investments .
Attracting more FDI requires improving the invest-ment climate and the connectivity to external mar-kets. Armenia’s size disadvantage calls for being prag-matic and realistic: establish a target list of reputable multinationals in manufacturing and tradable services and lobby them to relocate some of their activities to Armenia .
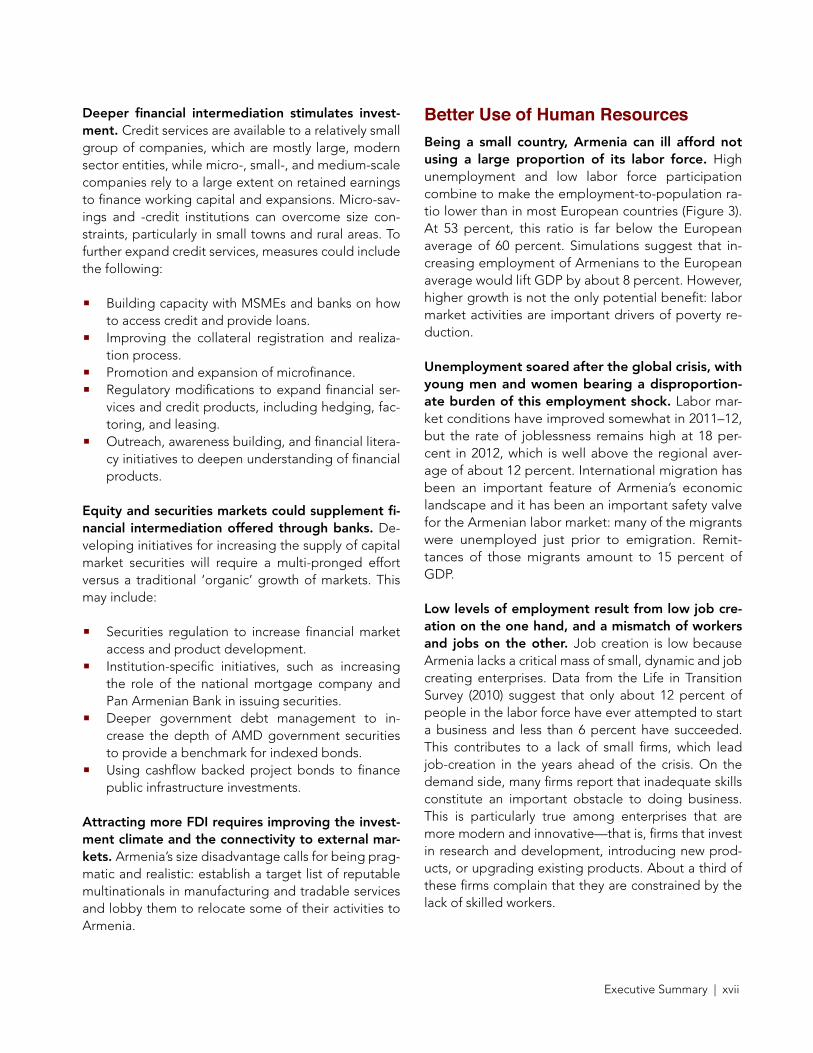
Better Use of Human Resourcesbeing a small country, Armenia can ill afford not using a large proportion of its labor force. High unemployment and low labor force participation combine to make the employment-to-population ra-tio lower than in most European countries (Figure 3) . At 53 percent, this ratio is far below the European average of 60 percent . Simulations suggest that in-creasing employment of Armenians to the European average would lift GDP by about 8 percent . However, higher growth is not the only potential benefit: labor market activities are important drivers of poverty re-duction .
unemployment soared after the global crisis, with young men and women bearing a disproportion-ate burden of this employment shock. Labor mar-ket conditions have improved somewhat in 2011–12, but the rate of joblessness remains high at 18 per-cent in 2012, which is well above the regional aver-age of about 12 percent . International migration has been an important feature of Armenia’s economic landscape and it has been an important safety valve for the Armenian labor market: many of the migrants were unemployed just prior to emigration . Remit-tances of those migrants amount to 15 percent of GDP .
Low levels of employment result from low job cre-ation on the one hand, and a mismatch of workers and jobs on the other. Job creation is low because Armenia lacks a critical mass of small, dynamic and job creating enterprises . Data from the Life in Transition Survey (2010) suggest that only about 12 percent of people in the labor force have ever attempted to start a business and less than 6 percent have succeeded . This contributes to a lack of small firms, which lead job-creation in the years ahead of the crisis . On the demand side, many firms report that inadequate skills constitute an important obstacle to doing business . This is particularly true among enterprises that are more modern and innovative—that is, firms that invest in research and development, introducing new prod-ucts, or upgrading existing products . About a third of these firms complain that they are constrained by the lack of skilled workers .

xviii | Republic of Armenia: Accumulation, Competition, and Connectivity
In this environment, Armenia’s Public Employment Services (PES) have played a very limited role. Few of the unemployed workers—less than 10 percent—find it worthwhile to register with the PES . A smaller fraction use PES resources to find jobs, relying instead on friends and family members to obtain information on jobs vacancies . In fact, the effectiveness of PES job placement services is severely limited . Currently, there are 11 to 12 unemployed workers per vacancy report-ed to the PES office (the so-called unemployment/va-cancy ratio), suggesting that at best the PES office can place less than a 10th of unemployed workers .
Addressing low employment will require a multi-pronged approach. The labor market is character-ized by weak labor demand, an inadequately qualified workforce and the poor matching of job seekers to employers . As a result, a large proportion of Armenia’s human resources are not productively employed .
¾ The creation of employment in the modern econ-omy requires lower impediments to firm entry and business start-ups, and an improved busi-ness environment . Crucially, more competition in the Armenian market for goods and services is
Figure 3. Armenia: Labor Force Participation and Employment, 2000–2010
a: Employment by sector, thousand b: Participation and employment rates, percent, 2009
0
200
400
600
800
1000
1200
2002
2003
2004
2005
2006
2007
2008
2009
2010
Non-tradable Services
Public Administration
Tradable Services
Mining and quarrying
Manufacturing
Electricity, gas and water
Albania
Armenia
Azerbaijan
Belarus
BiH
Bulgaria
Croatia
Czech
Estonia Georgia
Moldova
Kazakhstan
Kyrgyz
Latvia
Russia
ECA
40
50
60
70
40 50 60 70 80
Empl
oym
ent r
ate
Participation rate
c: Youth vs. adult employment rates, percent d: Female vs. male employment rates, percent
42.8
41.3
44.5
42.5
40.4 41.2
42.0 41.6
40.8 40.2
41.2
0
10
20
30
40
50
60
38
39
40
41
42
43
44
45
Total (LHS) Youth (RHS) Adult (RHS)
2000
2001
2002
2003
2004
2005
2006
2007
2008
2009
2010
42.8
41.2
44.5
42.5
40.4
41.2
42.0 41.6
40.8
40.2
41.2
0
10
20
30
40
50
60
37
38
39
40
41
42
43
44
45 20
00
2001
2002
2003
2004
2005
2006
2007
2008
2009
2010
Total (LHS) Female (RHS) Male (RHS)
Source: WDI, ILO and NSS.

Executive Summary | xix
likely to promote innovation, and allow new, more productive firms to enter markets which are now dominated by old, slow companies not likely to create many new jobs . Better connectivity of the Armenian economy with the rest of the world will increase pressures on Armenian firms to compete with the rest of the world .
¾ The quality of Armenia’s workforce needs to be strengthened by engaging employers in the de-sign of academic curricula, instituting apprentice-ships, and creating quality assurance mechanisms . However, with the generally high level of educa-tion already achieved, learning on the job would be the most efficient way of enhancing human capital, and hence, this brings us back to the pre-vious point on job creation .
¾ Job matching services provided by PES need to be improved .
One way to overcome institutional bottlenecks and skill shortages is Armenia’s diaspora. Members of the diaspora are best placed to identify opportunities in Ar-menia with their combination of outside know-how and intimate knowledge of the home country . They can be an important source for innovation, and can work with policymakers to alleviate constraints . The usual policy focus of home country authorities when looking at large diaspora populations—encourage return of talent to the home country—is often neither realistic nor neces-sary: members of skilled diasporas can just as effectively engage in joint projects with the home country without permanently relocating back to it . The key conceptual framework is to look at diaspora engagement as pro-moting search networks, and help them scale up and institutionalize innovative ideas—a concept described as guided serendipity . The goal would be to introduce linkages between members of the diaspora and home country agencies to benefit from the dynamism and external experience in shaping domestic institutions, removing barriers to growth, and fostering innovation .
Enhancing Competition in Armenia’s MarketsIn Armenia’s small market with important barriers to trade, domestic competition is of crucial importance for the dynamism of the economy. Key sectors of the Armenian economy are dominated by limited numbers
of firms (Figure 4) . Indicators for Armenia of the inten-sity of local market competition, the extent of market dominance, and the effectiveness of competition pol-icy therefore lag behind other countries in the region . According to the Global Competitiveness Index (GCI), Armenia ranks lowest among ECA countries in the ef-fectiveness of antimonopoly policy and the intensity of local competition . This low ranking goes a long way to explaining the lack of dynamism of the Armenian econ-omy, which leads to low employment and low incomes . Insufficient competition affects regulated sectors such as utilities and natural monopolies, and certain markets with a small number of firms, such as petroleum, sugar, wheat, and cut flowers . Competition is limited because of barriers to entry, ownership concentration, market dominance, and vertical and horizontal integration .
Pro-competition sectoral reforms and effective im-plementation of antitrust rules can lead to signifi-cant productivity gains and consumer savings. Ro-bust competition provides firms with strong incentives to reduce costs and innovate to become more efficient and productive . Competition may be stifled by the be-havior of market participants, for example through the formation of cartels and price fixing, through product market regulation, distortive state aid, and the pres-ence of powerful state-owned enterprises . Regulations have an impact on market structure—for example, by limiting the number of competitors or raising barriers to entry—and also on the firms’ ability to compete, through price controls and coercive regulations which do not create incentives for efficiency .
State-owned enterprises (SOEs) and government participation still play a dominant role in many im-portant sectors. The government owns the largest firms in electricity generation and transmission, water, postal services, railways, and operation of road infra-structure . The Armenian nuclear power plant and the water systems of national relevance are considered of strategic importance .3 National, state or provincial governments control at least one firm in 5 sectors . While SOE presence is not unusual in certain econo-mies, especially in certain segments of network indus-tries, the Armenian government should not intervene
3 Law on Energy of the Republic of Armenia, Article 6 and Water Code of the Republic of Armenia, Article 4, respectively .

xx | Republic of Armenia: Accumulation, Competition, and Connectivity
in sectors and market segments that are typically open to private sector .
The Armenian government has granted state aid to support economic entities, but the selection process lacks clear criteria to analyze impacts on competition. State aid has consisted of deferral of tax payments, sub-sidies, guarantees, government loans, and subsidies for interest payments . Business projects that satisfy certain criteria can benefit from government support programs, including both financial and technical assistance .
barriers to competition exist in different sectors, partly because of the characteristics of government contracts, discriminatory rules and inadequate reg-ulations, and particular aspects of market structure. A few selected sectors described here provide import-ant inputs for production in Armenia, and also prod-ucts and services directly to households .
¾ Air transport: Policy making, its implementation, and economic and technical regulation are carried out by the General Department of Civil Aviation (GDCA), an unusual concentration of power . The current regulatory practices favor the two Arme-nian incumbents in the aviation sector, Armavia
and Atlantis European Airways (AEA) .4 With the exception of Russian routes, only one carrier per country (either Armavia or AEA on the Armenian side) is allowed to operate on a reciprocal basis in a particular market . Lack of competition leads to significantly higher ticket prices to and from Arme-nia compared to similar countries .
¾ Railways: There is only one railway operator, which has a concession for providing rail services . While in principle open access to the infrastructure exists, methods for calculation of access charges and the actual charges have not yet been published, and no competitor has been established . Vertical integra-tion of the railway operator, SCR, with major ferry and trucking companies further curtails competition .
¾ gas: Only one company imports and distributes gas .5 The current regulatory framework is not pro-
4 Armavia ceased operations in April 2013 after this report was finalized . Atlantis European Airways serves as a marketing agent of Austrian Airlines and Czech Airlines and does not oper-ate any aircraft itself .
5 Armenia does not produce natural gas . Import of gas is be-ing conducted by Russian-Armenian CJSC “Hay-RusGazArd” in which the Armenian Government has 10 percent equity share . Previously the government had 20 percent equity share; 10 per-cent was sold to the major shareholder .
Figure 4. Number of Firms in Each Sector, Market, or Market Segment
Min
ing
Oil a
nd g
as
Agric
ultu
re
Fore
stry
Light
man
ufac
turin
g
Food
pro
ducts
Phar
mac
eutic
als
Fixe
d lin
e in
frastr
uctu
re
Fixe
d lin
e te
leph
ony
Wire
less
/mob
ile in
frastr
uctu
re
Wire
less
/mob
ile se
rvice
s
Coa
l gen
erat
ion
Hydr
o ge
nera
tion
Biom
ass g
ener
atio
n
Sola
r gen
erat
ion
Win
d ge
nera
tion
Trans
miss
ion
Distr
ibut
ion
Bank
ing
Insu
ranc
e
Railw
ay fr
eigh
t
Inte
rnat
iona
l air
Airp
ort o
pera
tion
Tele
visio
n br
oadc
astin
g
News
pape
r
Cons
tructi
on
Heal
thca
re
Reta
il di
strib
utio
n se
rvice
s
Tour
ism
Was
te m
anag
mt a
nd re
cycli
ng
Mining,oil, gas
Agri,forestry
Manufacturing Telecom Electric power Financialsector
Transport Media Other services
Many firms
Few firms
One firm
Source: Investment Across Borders, 2010.
Executive Summary | xxi
viding adequate, non-discriminatory third-party access to the gas transmission grid .
¾ Electricity: There are numerous generators of electricity in Armenia, but transmission and distri-bution is in the hands of only one company . The sector does not have a retail choice provision and liberalized electricity wholesale pool, which re-strain consumers’ choices .
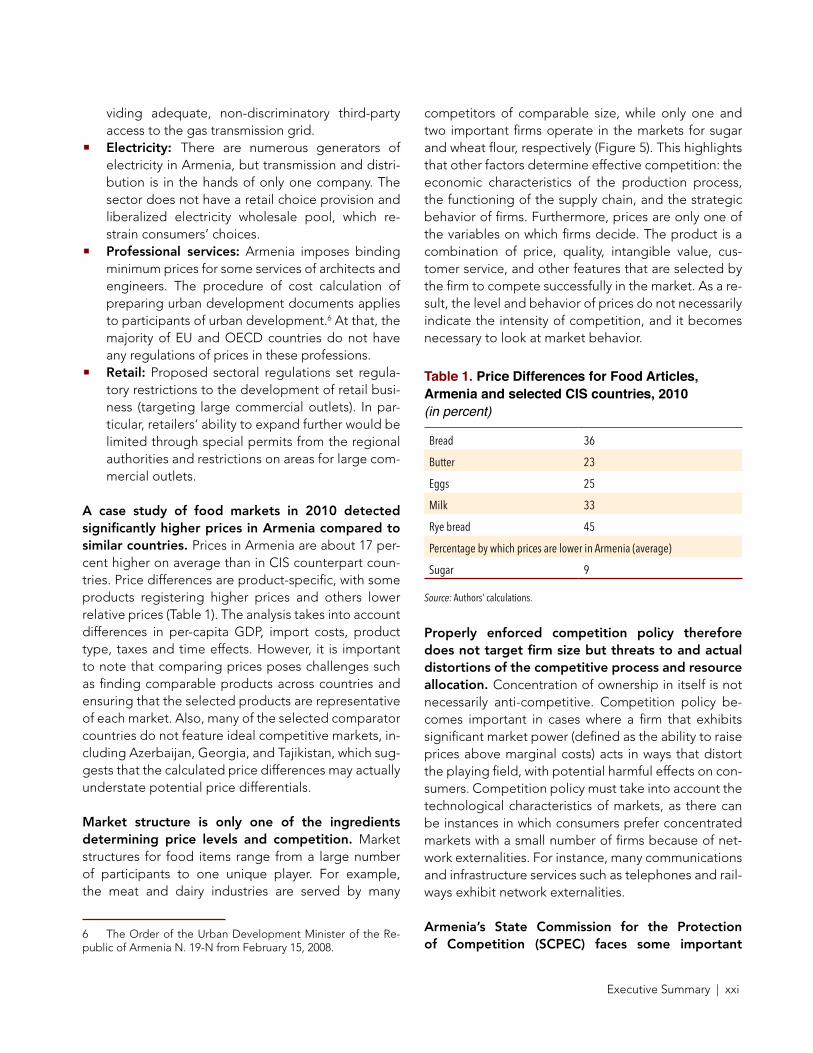
¾ Professional services: Armenia imposes binding minimum prices for some services of architects and engineers . The procedure of cost calculation of preparing urban development documents applies to participants of urban development .6 At that, the majority of EU and OECD countries do not have any regulations of prices in these professions .
¾ Retail: Proposed sectoral regulations set regula-tory restrictions to the development of retail busi-ness (targeting large commercial outlets) . In par-ticular, retailers‘ ability to expand further would be limited through special permits from the regional authorities and restrictions on areas for large com-mercial outlets .
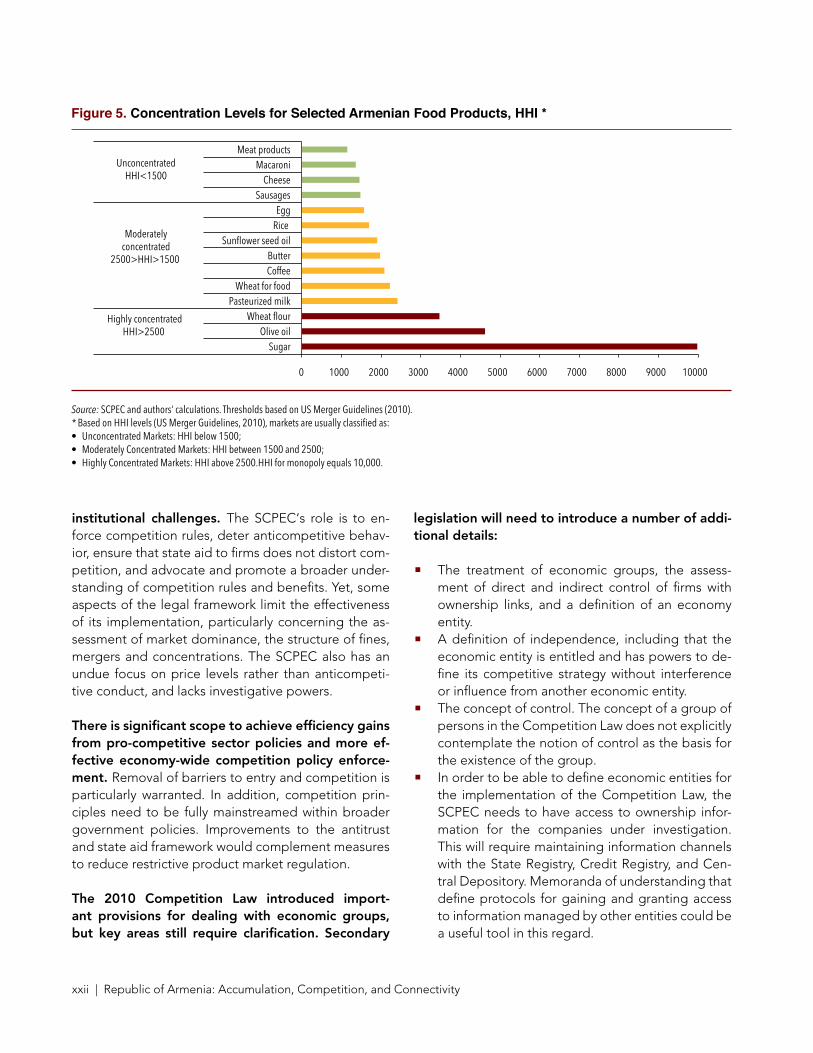
A case study of food markets in 2010 detected significantly higher prices in Armenia compared to similar countries. Prices in Armenia are about 17 per-cent higher on average than in CIS counterpart coun-tries . Price differences are product-specific, with some products registering higher prices and others lower relative prices (Table 1) . The analysis takes into account differences in per-capita GDP, import costs, product type, taxes and time effects . However, it is important to note that comparing prices poses challenges such as finding comparable products across countries and ensuring that the selected products are representative of each market . Also, many of the selected comparator countries do not feature ideal competitive markets, in-cluding Azerbaijan, Georgia, and Tajikistan, which sug-gests that the calculated price differences may actually understate potential price differentials .
Market structure is only one of the ingredients determining price levels and competition. Market structures for food items range from a large number of participants to one unique player . For example, the meat and dairy industries are served by many
6 The Order of the Urban Development Minister of the Re-public of Armenia N . 19-N from February 15, 2008 .
competitors of comparable size, while only one and two important firms operate in the markets for sugar and wheat flour, respectively (Figure 5) . This highlights that other factors determine effective competition: the economic characteristics of the production process, the functioning of the supply chain, and the strategic behavior of firms . Furthermore, prices are only one of the variables on which firms decide . The product is a combination of price, quality, intangible value, cus-tomer service, and other features that are selected by the firm to compete successfully in the market . As a re-sult, the level and behavior of prices do not necessarily indicate the intensity of competition, and it becomes necessary to look at market behavior .
Table 1. Price Differences for Food Articles, Armenia and selected CIS countries, 2010(in percent)
Bread 36
Butter 23
Eggs 25
Milk 33
Rye bread 45
Percentage by which prices are lower in Armenia (average)
Sugar 9
Source: Authors’ calculations.
Properly enforced competition policy therefore does not target firm size but threats to and actual distortions of the competitive process and resource allocation. Concentration of ownership in itself is not necessarily anti-competitive . Competition policy be-comes important in cases where a firm that exhibits significant market power (defined as the ability to raise prices above marginal costs) acts in ways that distort the playing field, with potential harmful effects on con-sumers . Competition policy must take into account the technological characteristics of markets, as there can be instances in which consumers prefer concentrated markets with a small number of firms because of net-work externalities . For instance, many communications and infrastructure services such as telephones and rail-ways exhibit network externalities .
Armenia’s State Commission for the Protection of Competition (SCPEC) faces some important
xxii | Republic of Armenia: Accumulation, Competition, and Connectivity
institutional challenges. The SCPEC‘s role is to en-force competition rules, deter anticompetitive behav-ior, ensure that state aid to firms does not distort com-petition, and advocate and promote a broader under-standing of competition rules and benefits . Yet, some aspects of the legal framework limit the effectiveness of its implementation, particularly concerning the as-sessment of market dominance, the structure of fines, mergers and concentrations . The SCPEC also has an undue focus on price levels rather than anticompeti-tive conduct, and lacks investigative powers .
There is significant scope to achieve efficiency gains from pro-competitive sector policies and more ef-fective economy-wide competition policy enforce-ment. Removal of barriers to entry and competition is particularly warranted . In addition, competition prin-ciples need to be fully mainstreamed within broader government policies . Improvements to the antitrust and state aid framework would complement measures to reduce restrictive product market regulation .
The 2010 Competition Law introduced import-ant provisions for dealing with economic groups, but key areas still require clarification. Secondary
legislation will need to introduce a number of addi-tional details:
¾ The treatment of economic groups, the assess-ment of direct and indirect control of firms with ownership links, and a definition of an economy entity .
¾ A definition of independence, including that the economic entity is entitled and has powers to de-fine its competitive strategy without interference or influence from another economic entity .
¾ The concept of control . The concept of a group of persons in the Competition Law does not explicitly contemplate the notion of control as the basis for the existence of the group .
¾ In order to be able to define economic entities for the implementation of the Competition Law, the SCPEC needs to have access to ownership infor-mation for the companies under investigation . This will require maintaining information channels with the State Registry, Credit Registry, and Cen-tral Depository . Memoranda of understanding that define protocols for gaining and granting access to information managed by other entities could be a useful tool in this regard .
Figure 5. Concentration Levels for Selected Armenian Food Products, HHI *
0 1000 2000 3000 4000 5000 6000 7000 8000 9000 10000
Sugar Olive oil
Wheat flour Pasteurized milk
Wheat for food Coffee Butter
Sunflower seed oil Rice Egg
Sausages Cheese
Macaroni Meat products
Highly concentratedHHI>2500
Moderatelyconcentrated
2500>HHI>1500
UnconcentratedHHI<1500
Source: SCPEC and authors‘ calculations. Thresholds based on US Merger Guidelines (2010). * Based on HHI levels (US Merger Guidelines, 2010), markets are usually classified as:• Unconcentrated Markets: HHI below 1500;• Moderately Concentrated Markets: HHI between 1500 and 2500;• Highly Concentrated Markets: HHI above 2500.HHI for monopoly equals 10,000.

Executive Summary | xxiii
¾ To improve merger control policy, merger notifi-cation procedures should be simplified and cur-rent thresholds for merger notification should be revised .
¾ The current structure of fines and sanctions and SCPEC‘s investigative powers are too limited to deter anticompetitive conduct; efforts are under-way to define fine calculation methods in the sec-ondary legislation .7
¾ The SCPEC’s implementation of competition pol-icy should refocus on market contestability rather than on price monitoring .
¾ The SCPEC does not have the necessary instru-ments to pursue advocacy vis-à-vis sector regula-tors and other government bodies .
Improving Land ConnectivityArmenia has few options for transporting goods over land. With closed borders with Turkey and Azer-baijan, exports can only use transit corridors to the north through Georgia, and to the south through Iran . On both routes, Armenia’s mountainous terrain poses additional challenges, and roads become impassable at times in the winter . In addition to the roads, a railway line extends to Georgia and the Black Sea coast .
7 SCPEC is currently developing guidelines on fines calcula-tion to address these concerns, particularly to take into account the nature of the infringement, its gravity and duration .
Despite the geopolitical challenges, more than 80 percent of goods exported from Armenia travel over land. Roads account for about 32 percent of Ar-menia’s exports by value (Figure 6), while the railway line to Georgia carries 40 percent, mainly resource-based exports such as stones and mining products . Electric-ity accounts for about 8 percent of exports and uses high-voltage transmission lines . Air transport is used for a limited set of items with a high value-to-weight ratio such as fresh fruit, diamonds and jewelry, and ac-counts for about 19 percent of exports .
The trucking industry in Armenia consists of 2–3 sizeable firms and a handful of smaller players. For-eign operators are present, especially Georgian, Turk-ish and Iranian firms . Fixed costs for Armenian truck-ing companies are high and they are spread over few shipments . Trucking companies complain that acquir-ing more trucks is difficult . In particular, they point out that obtaining bank financing is difficult and rates can range up to 15 percent, and that customs duties and VAT add significant costs . Market regulation may be a factor that limits competition and raises prices . Export-ers on the other hand feel they are being overcharged by trucking companies .
Ratifying all relevant international conventions could increase Armenia’s leverage over transit partners. Armenia has not signed the UN Conven-tion on Transit Trade of Landlocked States, one of a small number of landlocked countries which have not
Figure 6. Merchandise Trade by Mode of Transport, 2011
0
10
20
30
40
50
60
70
IM EX IM EX
By Value (%) By Weight (%)
Perc
ent S
hare
Rail Road Air Stationary (i.e. pipeline, transmission line)
Source: Armenian Customs Service.

xxiv | Republic of Armenia: Accumulation, Competition, and Connectivity
done so . This agreement offers signatories the right to “freedom of transit”, and specifies, inter alia, that tran-sit goods should not be subject to any customs duty or special taxes and should have access to storage facili-ties as would domestic goods .
Armenian trade would greatly benefit from im-provements on the transit route through georgia. These would include upgrades to the road to Batumi port as an alternative to Poti, road-clearing services at the Upper Lars crossing to Russia to allow for year-round operations, and a dedicated freight pavilion in Poti for goods traveling to and from Armenia . Nego-tiations could also aim at improving the reliability and reducing the costs of the Black Sea ferries . The new Baku-Tbilisi-Kars railway line, which bypasses Armenia, could nevertheless open a new transit route when it is completed in the near future, if Armenian trucks were to shuttle goods to Akhalkalaki in Georgia .
Improving Air ConnectivityThere is little Armenia’s policy makers can do about it being a landlocked country, however, it is currently “policy locked” as well through restrictive policies in aviation. Frequency and capacity of air links between Armenia and the rest of the world are relatively low,
while prices are relatively high because of the restrictive environment in which the sector operates . Different lev-els of restrictiveness are currently in force for different markets, giving a confusing picture of Armenia’s avia-tion policy . While competition is present on the Russian routes, most destinations are served by one Armenian and one foreign airline on a reciprocal basis .
Flights to and from Armenia offer lower flexibili-ty compared with regional peers. Among major CIS capitals, Yerevan offers the lowest levels of flexibility, measured by the share of markets served with two weekly frequencies or less (highest in the sample), and the percentage of routes with two or more daily fre-quencies (lowest in the sample, see Figure 7) . More-over, few choices are available in terms of carriers from Yerevan: a sole market is served by four airlines (Mos-cow), followed by three other markets within Russia, where three carriers operate (Rostov, Sochi and Miner-alnye Vody) . In turn, seventy percent of the markets are served by one or two carriers at most . Effective com-petition in the densest markets might be even lower: due to the protective stance towards Armavia, capac-ity in Air Service Agreements (ASAs) is split artificially between airlines, or commercial agreements on code-sharing and blockspacing consolidate seat inventory and reduce competition .
Figure 7. Number of Destinations by Frequency of Service from CIS Countries’ Capitals, 2012(as percentage of total destinations served)
Graphs by year
1–2 3–6 7–13 14+
.8
.6
.4
.2
.0
Almaty
Almaty
Almaty
Almaty
Moscow
Moscow
Moscow
Moscow
MinskMinsk
MinskMinsk
Bishkek
Bishkek
Bishkek
Bishkek
Tbilisi
Tbilisi
Tbilisi
Tbilisi
Kiev
Dushanbe
Dushanbe
Dushanbe
Dushanbe
Ashkhabad
Ashkhabad
Ashkhabad
AshkhabadBaku
Tashkent
Yerevan
YerevanYerevan
Yerevan
Tashkent
Tashkent
TashkentKiev
KievKiev
BakuBaku
Baku
CIS DomesticExtra-CIS
Source: Authors’ calculations based on DIIO data (June 2012).

Executive Summary | xxv
Flights to and from Armenia are significantly more expensive than to and from neighboring georgia. In contrast with Armenia, Georgia imposes no restrictions on capacity, airline and point designation . The compar-ison shows that the lowest fares to and from Yerevan are systematically higher than those to and from Tbilisi across the selected sample of markets (Figure 8) . When compared with other CIS capitals such as Almaty and Baku, outbound flights are also found to be more ex-pensive in Yerevan . In spite of the increased compe-tition in connecting markets via major hubs, average fares continue to be higher from Yerevan as compared to Tbilisi, although the premium seems lower . This is the result of a benchmarking of air fares in 47 direct and non-stop markets from the Armenian capital and 28 markets from Georgia, equivalent to 99 percent of all available destinations for the traveler in each case .
A benchmarking exercise of infrastructure and non-infrastructure charges at Yerevan airport shows that charges are relatively high, although compara-ble to those in Tbilisi and baku. Yerevan stands after Baku as the third most expensive airport in the sample with over $5,000 in total charges, and followed closely by Tbilisi (approx . $4,400) and Minsk ($4,100) (Figure 9) .
Higher prices and limited flexibility impose costs on air passengers and cargo, and on the economy through lost opportunities for connecting people
and goods. Our estimates show that a reduction in concentration by half on a specific destination reduces observed prices for the economy class segment in the range of 20 to 28 percent on average . Assuming an overall reduction of 25 percent in price and an aver-age elasticity between –0 .9 and –1 .08, the aggregate welfare gains for the consumer would add up to 1 .4 percent of GDP . The welfare gain would obviously be quite small for travel to and from Russia, because the competitive environment on these routes means liber-alization would not lead to big changes .
The restrictive aviation environment is largely de-termined by the practice of regulation of the sec-tor. Currently, all decision making, monitoring and regulation of the aviation sector is concentrated in one agency, and restrictive practices protect the two Ar-menian airlines against competition . All governmental matters regarding aviation are handled by the Gener-al Department of Civil Aviation (GDCA) . It is de facto policy maker and regulator . It negotiates ASAs, des-ignates Armenian carriers, and defines all market ac-cess rules for airlines (frequencies, number of allowed destinations, etc) . It also carries out the functions of technical regulator (licensing, monitoring and enforce-ment of safety and security) and manages the PPP con-tract with the company that won the airport conces-sion in 2001 . Armavia, the ‘national flag carrier’, plays an unofficial but nevertheless large role in influencing
Figure 8. Lowest Available Fares from (left) and to (right) Yerevan and Tbilisi Direct and non-stop routes(in US dollars/km)
0
0.1
0.2
0.3
0.4
0.5
0.6
0.7
0 500 1000 1500 2000 2500 3000 3500 4000
EVN
TBS
EVN
TBS
0
0.1
0.2
0.3
0.4
0.5
0.6
0.7
0 500 1000 1500 2000 2500 3000 3500 4000
Source: Authors, based on available published fares of airlines (third week of November 2012 or closest date available) Note: Fares do not include air charges, security fees or taxes.

xxvi | Republic of Armenia: Accumulation, Competition, and Connectivity
regulatory decisions, as well as discussions of bilateral air services agreements . Armavia won exclusive rights through an investment agreement with the govern-ment in 2003 for a period of ten years .
Liberalization of aviation would boost growth in air passenger and cargo traffic in Armenia, and boost economic growth. Liberalization of Armenia’s aviation sector requires:
¾ A clear policy statement outlining the govern-ment’s commitment to a competitive environment,
¾ A better separation of policy making and its im-plementation,
¾ Independence of regulators from interference from regulated entities,
¾ Industry consultation and complaint handling mechanisms,
¾ Capacity building to help the Armenian regulator better monitor and enforce contracts, including the airport management concession, and
¾ Greater transparency with regard to contracts and agreements to level the playing field for actual and potential market participants .
Improving Internet and Communication Technology (ICT)While exports of goods are facing an uphill struggle against Armenia’s high transport costs, exports of services, especially those offered through ICT, have tremendous potential. Although Armenia’s ICT sec-tor is comparatively small, its rapid development and prospects attract foreign investments . Local compa-nies are starting to become more active in engineer-ing, systems development, and R&D . In 2010, the size of the domestic market totaled $91 million and the turnover of the software and services sector reached $150 million and the sector employed nearly 5,000 pro-fessionals with above-average salaries .
Figure 9. Total Turnaround Charges, for an Airbus A320-200(in US dollars)
a: without fuel costs b: with fuel costs
0
2,000
4,000
6,000
8,000
10,000
12,000
Other OPS Handling Navigation
Landing andParking
Passenger(PFC+security+Oth. Taxes)
Moscow (D
ME)
Moscow (S
VO) Kiev
Almaty
Tashkent
Dushanbe
Bishkek
Minsk
Yerevan Tbilis
i Baku
Ashghabat
Moscow (D
ME)
Moscow (S
VO) Kiev
Almaty
Tashkent
Dushanbe
Bishkek
Minsk
Yerevan Tbilis
i Baku
Ashghabat 0
5,000
10,000
15,000
20,000
25,000
30,000
35,000
Other OPS Fuel Handling
Navigation Landingand Parking
Passenger(PFC+security+Oth. Taxes)
Source: Authors based on ICAO and IATA Manual on Airport and Air Navigation Charges Manual and country AIPs.

Executive Summary | xxvii
The ICT sector can play an important role in boost-ing economic growth. It can support job creation, es-pecially in information technology (IT) and IT-enabled services (ITES) . It can also foster economic integration by ensuring ubiquitous, high-quality, and affordable telecommunications regionally and domestically . In-deed, by reducing the economic distance between Armenia and global markets and overcoming domes-tic and international division, ICT promotes economic density .8
The ICT sector in Armenia has an opportunity for expansion. Innovative strategies could help it to break into the league of leading global destinations . The strategies should address policies, processes and in-stitutions, access to finance, infrastructure, and skills development .
¾ Improve intellectual property protection and ensure business data confidentiality, as well as strengthen relevant regulation and law enforce-ment to raise the confidence of foreign and do-mestic investors in the country’s IT-based services sector .
¾ Intensify its export and industry promotion efforts to raise awareness of foreign investors about the opportunities in the Armenian IT-based services market and as a result increase the country’s in-volvement in the global market for IT products and services .
¾ Create incentives for the private sector to engage with higher education institutions to better incor-porate the changing demands of the fast devel-oping industry through developing joint programs and initiatives .
¾ Work further to identify specific market niche op-portunities in the IT-based services industry where Armenia has strong competitive advantages com-pared to other markets in terms of labor costs and professional skills .
¾ Stimulate competition and reduce barriers to entry to create internal demand for advanced IT products and high-value services, as well as to make these products and services competitive internationally .
8 See World Development Report Framework (2009), http://siteresources .worldbank .org/INTWDR2009/Resources/Outline .pdf .
Previous Growth Studies The 2007 Country Economic Memorandum ti-tled “The Caucasian Tiger: Sustaining Economic growth in Armenia” focused on the double-digit real growth phase. The study made the case that this impressively consistent performance was to be attributed to the steadfast pursuit of market-oriented reforms, assisted by large external inflows on grant or soft terms . This economic success reduced pov-erty as seen in the sharp increase in consumption of poorer quintiles facilitated by an effective safety net program, the Family Poverty Benefit, although the impact on employment was somehow muted . The study identified the causes of the weak response of employment to investment and growth to lie in in-flexible labor, inadequate skills among unemployed and incomplete structural reforms and inadequate in-stitutions and practices that encourage competition . The study concluded that reforms were needed to improve the business environment and fight corrup-tion, redirect budget resources to public investments, sharpen competition and create infrastructures en-couraging firms to engage in international trade (World Bank 2007) .
The 2002 Country Economic Memorandum titled “growth Challenges and government Policies in Armenia” covered the transition catch-up phase of the Armenian economy. The study made the case that economic expansion in 1995–2000 was fueled by a recovery from the severe contraction of the early 1990s . The factors that contributed to growth includ-ed the recovery in electricity supply, the expansion of external private transfers stimulating domestic demand and a large aid inflow complementing low domestic savings to maintain investments at a com-fortable level . Economic growth was also supported by a relatively strong recovery in agriculture backed by a privatization of rural land early in transition and considerable import substitution in food consump-tion . The study concluded that these factors were not long-term engines of economy-wide growth and recommended to strengthen the quality of macro-economic management, improve the quality of the business environment, expand training opportunities in management and business owners, and establish institutions to facilitate economic restructuring and new entry (World Bank 2002) .

xxviii | Republic of Armenia: Accumulation, Competition, and Connectivity
OverviewThe report starts in chapter 1 with a presentation of recent economic developments. Growth has re-covered to 7 .2 percent in 2012, up from 4 .7 percent in 2011 . Macroeconomic buffers have largely been re-built, although public debt remains on the high side . Looking forward, growth is likely to weaken because of return to trend of agricultural growth and global eco-nomic headwinds .
Chapter 2 presents challenges to capital accumula-tion. The report investigates the determinants of ag-gregate and household saving . It also highlights the low state of development of financial and capital mar-kets, which is an impediment to growth . These markets could develop to better intermediate between savers and investors, and make sure that funds are invested in sectors producing high economic and social returns . We propose reforms which would increase access to credit, and improve the environment for corporate debt and equity issues . We also discuss FDI flows to Armenia .
Chapter 3 looks at labor market outcomes. Labor force participation in Armenia is low, and unemploy-ment is high . There are challenges to labor demand, supply, and matching of jobs and workers . Labor demand is subdued because of a lack of dynamism of domestic firms . Entrepreneurship is low, as evi-denced by a low rate of new business registration, and a low survival rate of new businesses . On the labor supply side, firms complain about insufficient availability of skilled labor . There is also evidence of low domestic mobility of workers, as evidenced by persistent wage differences . The chapter also high-lights opportunities for engaging Armenia’s large diaspora better in shaping domestic institutions and supporting innovation .
The following four chapters highlight structural im-pediments to high factor productivity growth. We point out avenues for increasing the competitiveness of the Armenian economy, and in particular that of the tradable sectors .
Chapter 4 discusses competition in Armenia’s markets for goods and services . While market structure is relat-ed to the small size of the Armenian economy, more sectors are dominated by one or two companies than could be expected . We discuss the impact of state owned enterprises, rules and regulations, and state aid on competition . We also present a case study of com-petition in food markets, which concludes that prices of a number of important food items are significantly higher in Armenia than could be expected .
Chapter 5 looks at the costs of transporting goods through Georgia by road and rail, and through Iran by road . We propose a set of policy initiatives which Armenia could pursue with neighboring countries to lower these costs . Policies are clearly important in de-termining Armenia’s air connectivity .
Chapter 6 points out that compared with similar air-ports in the region, flying in and out of Yerevan airport is significantly more expensive and Yerevan has rela-tively few and infrequent connections, with less flexibil-ity for onward connections . The institutional structure of governance of aviation issues gives rise for con-cerns, because it concentrates all matters in one agen-cy, the General Department of Civil Aviation, which is policy maker, implementer, and economic and safety regulator at the same time .
Chapter 7 is devoted to information and communi-cation technology . The digital revolution has trans-formed businesses around the world since the start of the Millennium . We look at Armenia’s readiness to join the world of digital commerce .
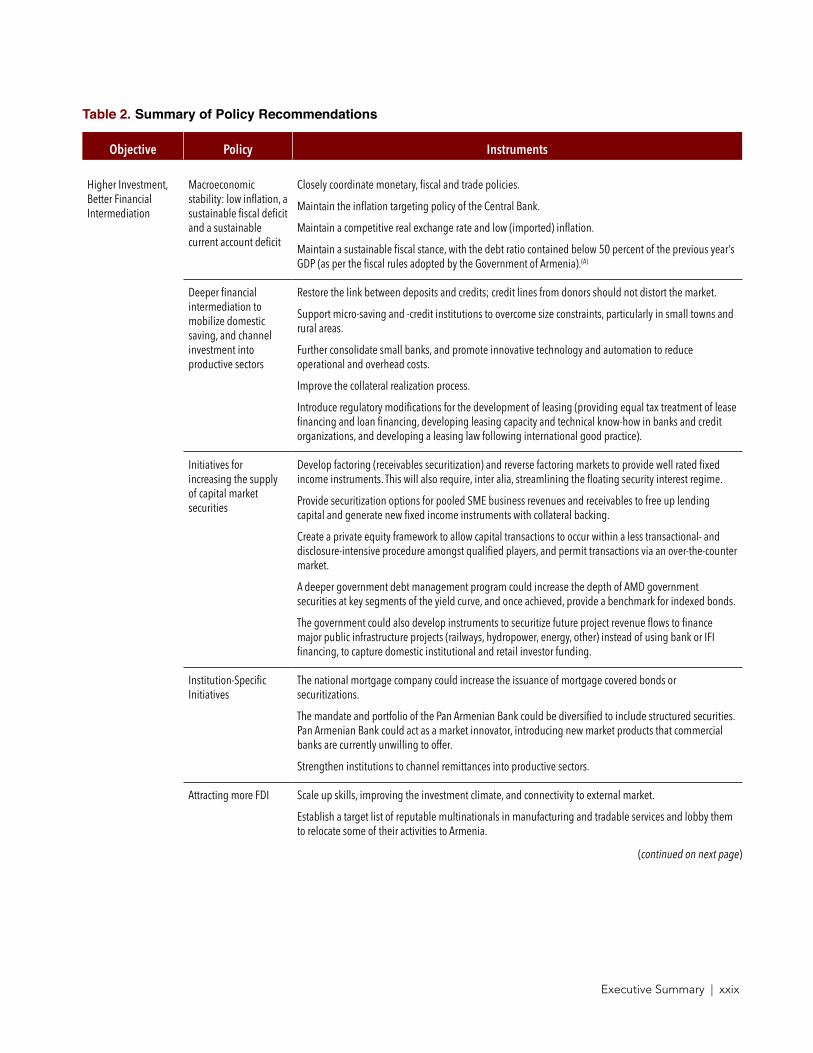
Executive Summary | xxix
Table 2. Summary of Policy Recommendations
Objective Policy Instruments
Higher Investment, Better Financial Intermediation
Macroeconomic stability: low inflation, a sustainable fiscal deficit and a sustainable current account deficit
Closely coordinate monetary, fiscal and trade policies.
Maintain the inflation targeting policy of the Central Bank.
Maintain a competitive real exchange rate and low (imported) inflation.
Maintain a sustainable fiscal stance, with the debt ratio contained below 50 percent of the previous year’s GDP (as per the fiscal rules adopted by the Government of Armenia).(A)
Deeper financial intermediation to mobilize domestic saving, and channel investment into productive sectors
Restore the link between deposits and credits; credit lines from donors should not distort the market.
Support micro-saving and -credit institutions to overcome size constraints, particularly in small towns and rural areas.
Further consolidate small banks, and promote innovative technology and automation to reduce operational and overhead costs.
Improve the collateral realization process.
Introduce regulatory modifications for the development of leasing (providing equal tax treatment of lease financing and loan financing, developing leasing capacity and technical know-how in banks and credit organizations, and developing a leasing law following international good practice).
Initiatives for increasing the supply of capital market securities
Develop factoring (receivables securitization) and reverse factoring markets to provide well rated fixed income instruments. This will also require, inter alia, streamlining the floating security interest regime.
Provide securitization options for pooled SME business revenues and receivables to free up lending capital and generate new fixed income instruments with collateral backing.
Create a private equity framework to allow capital transactions to occur within a less transactional- and disclosure-intensive procedure amongst qualified players, and permit transactions via an over-the-counter market.
A deeper government debt management program could increase the depth of AMD government securities at key segments of the yield curve, and once achieved, provide a benchmark for indexed bonds.
The government could also develop instruments to securitize future project revenue flows to finance major public infrastructure projects (railways, hydropower, energy, other) instead of using bank or IFI financing, to capture domestic institutional and retail investor funding.
Institution-Specific Initiatives
The national mortgage company could increase the issuance of mortgage covered bonds or securitizations.
The mandate and portfolio of the Pan Armenian Bank could be diversified to include structured securities. Pan Armenian Bank could act as a market innovator, introducing new market products that commercial banks are currently unwilling to offer.
Strengthen institutions to channel remittances into productive sectors.
Attracting more FDI Scale up skills, improving the investment climate, and connectivity to external market.
Establish a target list of reputable multinationals in manufacturing and tradable services and lobby them to relocate some of their activities to Armenia.
(continued on next page)

xxx | Republic of Armenia: Accumulation, Competition, and Connectivity
Objective Policy Instruments
Generosity of incentives (fiscal benefits, serviced land provision, risk guarantees) should be in line with the potential impact and spillovers on the domestic economy in terms of job creation, knowledge transfer, and supply-demand linkages with SMEs.
Better Use of Human Resources
Employment creation Improve the business environment (reducing the costs of doing business, limiting the number of business inspections and opportunities for extortion, and reducing incentives to join the informal sector).
Enhance competition to create more economic dynamism, encourage the entry and growth of new firms.
Enhancing skills Engage employers in the design of academic curricula, instituting apprenticeships, and creating quality assurance mechanisms that allow both students and employers to assess the relevance and quality of academic training provided by various institutions.
Improve job matching Build the Public Employment Services’ capacity to provide intermediation services, including training and job counseling.
Engage the diaspora Support search networks to pair dynamic domestic institutions with skilled diaspora.
Be proactive in creating more selective diaspora leadership groups with more strategic views of home country development in line with the model of alumni organizations of US universities.
Create a competitive contest to fund innovative pilot activities following clear principles (focus on knowledge rather than money as entry point; on joint project rather than the return of the diaspora; and on sectoral ministries as focal points rather than foreign or diaspora ministries).
Enhancing Competition
Limiting potential anticompetitive behavior and ensuring a level playing field
Remove barriers to entry and competition.
Mainstream competition principles within broader government policies.
Improve the antitrust and state aid framework with complementary measures to reduce restrictive product market regulation.
Improve the competition environment in transportation (airlines and railroads).
Eliminate barriers to competition in professional services.
Improve competition in electricity and gas markets.
Refrain from adopting unnecessary restrictive regulation in the retail sector.
Increase the effectiveness of the competition framework and its implementation (specific amendments to the competition law and its enforcement aimed at clarifying the definition of economic entities, anticompetitive agreements and market dominance, updating the criteria to determine the existence of a dominant firm, strengthening the investigation powers of the agency and improving the structure of and criteria for imposing fines).
SCPEC needs to move away from focusing on price fluctuations in favor of focusing on actual and potential barriers to entry and market contestability (including during public procurement).
Systematically and pro-actively pursue advocacy activities by strengthening SCPEC‘s advocacy mandate to tackle anticompetitive government interventions and regulations that harm the development of competition.
Strengthen the state aid provisions and their enforcement to minimize potential distortive effects on competition; promote a better understanding of competition principles vis-à-vis other government bodies, public procurement officials and judges.
Introduce transparency and access to data to guarantee competitive neutrality between market participants to avoid market distortions.
(continued on next page)

Executive Summary | xxxi
Objective Policy Instruments
Improving Land Connectivity
Working more closely with bilateral partners
Sign bilateral transit agreements (tackle the issue of road tax in Iran).
Ratify relevant international conventions to gain leverage over transit partners (e.g. UN Convention on Transit Trade of Landlocked Countries).
Negotiate improvements on the transit route through Georgia, a dedicated freight terminal in Poti, improving the reliability of the Black Sea ferries.
Access new Baku-Tbilisi-Kars railway line in Georgia.
Improving Air Connectivity
Liberalization of aviation
Issue a clear policy statement outlining the government’s commitment to a competitive environment.
Provide a better separation of policy making and its implementation.
Ensure independence of regulators from interference from regulated entities.
Introduce industry consultation and complaint handling mechanisms.
Build capacity to help the Armenian regulator better monitor and enforce contracts, including the airport management concession.
Create greater transparency with regard to contracts and agreements to level the playing field for actual and potential market participants.
Improving Internet and Communications Technology
Innovative strategies to help Armenia join the league of leading investment destinations
Improve intellectual property protection and ensure business data confidentiality, as well as strengthen relevant regulation and law enforcement to raise the confidence of foreign and domestic investors in the country’s IT-based services sector.
Intensify export and industry promotion efforts to raise awareness of foreign investors about the opportunities in the Armenian IT-based services market and as a result increase the country’s involvement in the global market for IT products and services.
Create incentives for the private sector to engage with higher education institutions to better incorporate the changing demands of the fast developing industry through developing joint programs and initiatives.
Identify specific market niche opportunities in the IT-based services industry where Armenia has strong competitive advantages compared to other markets in terms of labor costs and professional skills.
Increase bandwidth and improve connectivity.
Stimulate infrastructure sharing.
Build on the experience of other countries in developing ICT parks.
(A) Armenia adopted a rule in 2008, which stipulates that debt cannot exceed 60 percent of GDP; if debt exceeds 50 percent of GDP, then the fiscal balance


Macroeconomic Developments and Outlook | 1
1. Macroeconomic Developments and Outlook
by 2013, the Armenian economy had left behind most of the hangover from the global financial cri-sis. Real GDP growth reached 7 .2 percent in 2012, and the current account deficit narrowed, although it re-mained high (Table 1 .1) . Macroeconomic buffers have been rebuilt to some extent, although the public debt-to-GDP ratio, at 44 percent, remains too high to relax fiscal restraints . The rebound came after double-digit growth rates in the 2003–08 period, a severe recession in 2009, and low but increasing growth rates in 2010 and 2011 . This chapter gives an overview of Armenia’s economic growth story starting in the 1990s, and some pointers for likely developments in the medium term .
Economic Growth Before the Global Financial CrisisArmenia’s economy outperformed those of similar countries once it had overcome its post- indepen-dence slump (Figure 1.1).9 The economy contracted by half between 1990 and 1993, because of the break-down of the Soviet Union’s production value chains . Economic displacement and structural transformation continued until the end of the 1990s . However, strong economic growth during 1999–2003 was built on high productivity growth and exports . The economy re-gained its pre-independence size in about 2003 .
Economic growth and investment rates were high in the 2000s, but outward orientation of the econ-omy declined. Since 2003, Armenia’s gross capital
9 The World Bank defines lower middle income countries as those with average per capita incomes of $1,006 to $3,975 (2011) . There are 54 lower middle income countries .
formation as a share of GDP consistently exceeded that of other lower middle income countries, and it peaked at about 35 percent in 2008 . However, in line with the domestic focus of growth, the exports-to-GDP ratio declined significantly during 2003–08, and was only a little over half that of the average in 2008 . While exports per capita stagnated, consumption rose from about $900 per capita in 2003 to about $1,500 per capita in 2008 .
The real estate boom and foreign inflows led to a sharp appreciation of the real exchange rate. Af-ter depreciating in the early 2000s, the real effective exchange (REER) appreciated by nearly 60 percent between 2003 and 2008 . The decline in outward orien-tation, which the Armenian economy experienced in these years, is a reflection of this loss of competitive-ness of the tradable sectors . Remarkably, the global financial crisis and sharp recession in Armenia led to depreciation in the real exchange rate by only about 8 percent in 2009, and it has remained stable at that high level since . The IMF in its 2012 Article IV consultation with Armenia considered the nominal exchange rate overvalued by about 10 percent .
Investable resources to a large extent were chan-neled into construction. In 2003, the government started actively seeking investments from Armenians living abroad (the diaspora) into real estate in Armenia . This created a construction-centered growth model supported by foreign exchange inflows . Double-dig-it economic growth rates were underpinned by high rates of investment, which peaked at 35 percent of GDP (Figure 1 .2) . High growth was led by residential con-struction and domestic services, and with real exchange rate appreciation came a decline in outward orientation

2 | Republic of Armenia: Accumulation, Competition, and Connectivity
Table 1.1. Macroeconomic Trends and Projections(in percent of GDP unless otherwise specified)
2008 2009 2010 2011 2012 2013 2014 2015
In percent of GDP, unless otherwise specified Actuals Projections
National income and prices
Real GDP (percent change) 6.9 –14.1 2.2 4.7 7.2 5.0 5.0 5.0
Gross domestic product (in millions of US dollars)
11,662 8,648 9,260 10,142 9,950 10,609 11,440 12,335
Gross national income per capita, Atlas method (in US dollars)
3,330 3,080 3,240 3,340 3,540 3,730 3,880 4,200
Consumer price index (percent change) 9.0 3.4 8.2 7.7 2.6 3.6 4.2 4.6
Investment and saving
Investment 39.8 36.4 33.4 26.3 26.6 27.7 28.0 32.2
Public 5.1 6.7 5.5 4.6 3.8 4.2 4.4 4.5
Private 34.7 29.7 27.9 21.6 22.8 23.5 23.6 27.7
National savings 29.1 18.5 18.1 16.9 17.8 20.3 21.0 25.4
Domestic savings 15.3 7.1 8.4 4.3 6.7 7.8 7.3 10.0
Government operations
Revenue and grants 22.0 21.5 21.6 23.3 22.7 23.5 24.2 24.8
Of which: tax revenue 19.7 19.4 19.3 20.6 22.0 22.7 23.4 24.3
grants 0.4 0.7 0.9 1.6 0.4 0.4 0.3 0.2
Expenditures 22.7 29.2 26.6 26.1 24.4 26.2 26.4 26.7
Current expenditures 20.1 22.4 21.1 21.5 21.7 21.9 21.9 22.1
Of which: interest payments 0.3 0.5 0.9 0.3 1.0 1.4 1.4 1.4
Capital expenditures 2.6 6.7 5.5 4.6 2.7 4.3 4.5 4.6
Overall balance –0.7 –7.6 –5.0 –2.8 –1.7 –2.7 –2.2 –1.9
Primary balance –0.4 –7.1 –4.1 –2.5 –0.7 –1.2 –0.8 –0.5
External sector
Exports of goods and services 15.1 15.5 20.9 23.7 24.5 28.3 27.9 27.6
Imports of goods and services 40.7 42.6 45.5 47.3 49.2 50.3 50.7 52.0
Net remittances 13.2 10.4 8.7 11.1 10.9 12.0 13.0 14.8
Current account –11.8 –15.8 –14.8 –10.9 –10.6 –9.6 –9.4 –9.4
Net foreign direct investments 7.9 8.4 6.1 4.4 4.4 4.3 4.4 4.5
Change in gross international reserves (in millions of US dollars)
233.5 –600.3 111.5 –132.9 — — — —
Gross international reserves (in months of imports)
4.0 6.5 5.3 5.6 5.0 4.6 4.6 4.6
Public debt 16.1 40.2 39.2 42.1 44.4 43.1 41.7 39.5
Sources: Armenian authorities and Bank staff calculations.

Macroeconomic Developments and Outlook | 3
of the economy . The inward orientation of the econ-omy resulted in a rising current account deficit . While the current account deficit was closing before 2003, the trend reversed thereafter . The construction sector saw an unusual expansion in the run-up to the global cri-sis . It expanded 5 .5 times in real terms and contributed more than one third to real GDP growth over 2003–08 . The number of people employed in this sector and its share in total employment increased by around 67 percent during the same period . Despite the building boom, mostly of high-end apartments in Yerevan, real estate prices increased 8 .4 times in U .S . dollar terms during 2003–08, which in turn increased the attractive-ness of real estate for investors—a classic bubble .
The construction and domestic services boom was accompanied by a decline in factor productivity growth. A growth decomposition exercise indicates that during 1997–2002, factor productivity growth contributed 92 percent of GDP growth, while physi-cal capital accumulation and human capital (years of schooling) contributed 12 and 5 percent, respectively . Employment contracted during these years, and the impact on growth was a negative 10 percent . During 2003–08, the contribution of total factor productivity to growth decreased to 39 percent, while the contri-bution of physical capital increased to reach 46 per-cent .
Figure 1.1. Growth, Capital Formation, Exports, and Consumption in Armenia and Low Income Countries
a: Real growth rate, percent b: Gross Capital Formation, percent of GDP
–20
–15
–10
–5
0
5
10
15
20
2000 2001
2002 2003
2004 2005
2006 2007
2008 2009
2010 2011
Armenia Lower middle income countries
0 5
10 15 20 25 30 35 40 45
2000 2001
2002 2003
2004 2005
2006 2007
2008 2009
2010 2011
Armenia Lower middle income countries
c: Export of Goods and Services, percent of GDP d: Consumption and Exports, in US dollars per capita
0
5
10
15
20
25
30
35
2000 2001
2002 2003
2004 2005
2006 2007
2008 2009
2010 2011
Armenia Lower middle income countries
0
200
400
600
800
1000
1200
1400
1600
1997 1998
1999 2000
2001 2002
2003 2004
2005 2006
2007 2008
2009 2010
2011
GDP per capita, constant 2000 USD
Export per capita, constant 2000 USD
Source: World Bank Development Indicators, 2012.

4 | Republic of Armenia: Accumulation, Competition, and Connectivity
The inward shift can also be seen in the rising im-portance of employment in non-tradable sectors in the growth performance (Table 1.2). While growth was broad-based during 1997–2002, it became con-centrated in the non-tradable sector thereafter . This explains the large contribution of the construction sector in the increase of labor productivity during that period . Although labor shedding continued in agricul-ture, workers who left the sector moved to the energy and mining sector, rather than the manufacturing sec-tors, which are the traditional labor-intensive sectors,
or the construction sector, which was enjoying the highest intra-sectoral productivity .
The Global Economic Crisis and Armenia’s Recovery 2009–12The impact of the global economic crisis on Ar-menia was a 14 percent economic contraction in 2009. In that year, remittances declined by 35 percent, investment declined 31 percent, and the construc-tion industry contracted by 41 .6 percent . Household
Figure 1.2. Current Account Balance, Construction, Investment, and Components of Growth
a: Current Account Balance, percent of GDP (4-quarter moving average)
c: Total Investment, percent of GDP (4-quarter moving average)
–40 –35 –30 –25 –20 –15 –10
–5 0 5
1993
:1
1993
:4
1994
:3
1995
:2
1996
:1
1996
:4
1997
:3
1998
:2
1999
:1
1999
:4
2000
:3
2001
:2
2002
:1
2002
:4
2003
:3
2004
:2
2005
:1
2005
:4
2006
:3
2007
:2
2008
:1
2008
:4
2009
:3
2010
:2
2011
:1
2011
:4 0
5101520253035404550
1993
:1
1994
:1
1995
:1
1996
:1
1997
:1
1998
:1
1999
:1
2000
:1
2001
:1
2002
:1
2003
:1
2004
:1
2005
:1
2006
:1
2007
:1
2008
:1
2009
:1
2010
:1
2011
:1
b: Construction, percent of GDP d: Contribution to Growth (Growth = 100)
0
5
10
15
20
25
30
2000
2001
2002
2003
2004
2005
2006
2007
2008
2009
2010
201 1
–20
0
20
40
60
80
100
120
1997–2003 2004–2008
Physical Capital Human Capital Labor TFP
Source: Ministry of Finance, World Development Indicators 2012 and authors’ calculations.

Macroeconomic Developments and Outlook | 5
consumption also contracted, although to a lesser ex-tent (–1 percent of GDP), while fiscal stimulus compen-sated somewhat for the downturn, with a contribution to GDP growth of 2 percent .
The recovery from the 2009 recession is ongoing. Real GDP expanded by 4 .7 percent in 2011, and growth reached 7 .2 percent for 2012 . Growth was driven by industry and manufacturing with double digit growth
rates, and a stabilization of the construction sector, which expanded by 3 percent in 2012 compared with a 12 .5 percent decline in 2011 (Figure 1 .3) . High prices for base metals have supported growth in the mining sector . The mining sector grew by 22 .5 percent in real terms in 2011, and grown by 15 .5 percent in 2012 . Ag-riculture recovered robustly after a 16 percent slump in 2010, with growth of 14 and 9 .5 percent in 2011 and 2012, respectively .
Table 1.2. GDP Growth Decomposition from Employment Changes, 2003–08 (in percent)
Contribution of within sector changes in output
per worker
Contribution of changes in employment
Contributions of inter-sectoral shifts Total
Agriculture 16.6 –3.9 1.0 13.7
Manufacturing 7.5 –2.9 –2.2 2.5
Construction 22.3 –0.8 –1.8 19.7
Energy and Mining 9.9 2.6 9.9 22.5
Transport and Communications 2.1 –0.1 0.0 2.0
Trade 5.7 0.0 –0.1 5.6
Other Services 24.9 2.0 0.0 26.9
Total 89.0 –3.0 6.8 92.8
Source: National Statistics Service and authors’ calculations.
Figure 1.3. Real GDP and its Components, 2008 Q1–2012 Q3(year-on-year change in percent)
–60
–50
–40
–30
–20
–10
0
10
20
30
40
2008
Q1
2008
Q2
2008
Q3
2008
Q4
2009
Q1
2009
Q2
2009
Q3
2009
Q4
2010
Q1
2010
Q2
2010
Q3
2010
Q4
2011
Q1
2011
Q2
2011
Q3
2011
Q4
2012
Q1
2012
Q2
2012
Q3
GDP Agriculture Industry Services
Source: NSS data and Bank staff calculations.
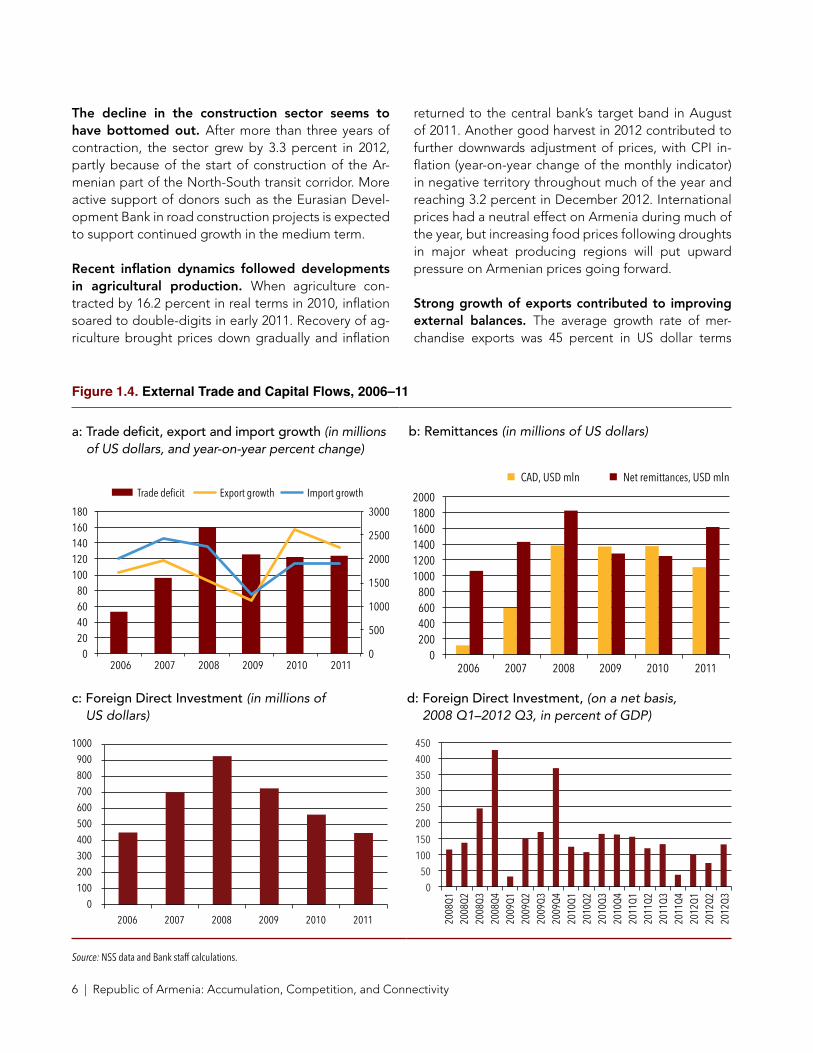
6 | Republic of Armenia: Accumulation, Competition, and Connectivity
The decline in the construction sector seems to have bottomed out. After more than three years of contraction, the sector grew by 3 .3 percent in 2012, partly because of the start of construction of the Ar-menian part of the North-South transit corridor . More active support of donors such as the Eurasian Devel-opment Bank in road construction projects is expected to support continued growth in the medium term .
Recent inflation dynamics followed developments in agricultural production. When agriculture con-tracted by 16 .2 percent in real terms in 2010, inflation soared to double-digits in early 2011 . Recovery of ag-riculture brought prices down gradually and inflation
returned to the central bank’s target band in August of 2011 . Another good harvest in 2012 contributed to further downwards adjustment of prices, with CPI in-flation (year-on-year change of the monthly indicator) in negative territory throughout much of the year and reaching 3 .2 percent in December 2012 . International prices had a neutral effect on Armenia during much of the year, but increasing food prices following droughts in major wheat producing regions will put upward pressure on Armenian prices going forward .
Strong growth of exports contributed to improving external balances. The average growth rate of mer-chandise exports was 45 percent in US dollar terms
Figure 1.4. External Trade and Capital Flows, 2006–11
a: Trade deficit, export and import growth (in millions of US dollars, and year-on-year percent change)
b: Remittances (in millions of US dollars)
0
500
1000
1500
2000
2500
3000
0 20 40 60 80
100 120 140 160 180
2006 2007 2008 2009 2010 2011
Trade deficit Export growth Import growth
0 200 400 600 800
1000 1200 1400 1600 1800 2000
2006 2007 2008 2009 2010 2011
CAD, USD mln Net remittances, USD mln
c: Foreign Direct Investment (in millions of US dollars)
d: Foreign Direct Investment, (on a net basis, 2008 Q1–2012 Q3, in percent of GDP)
0
100
200
300
400
500
600
700
800
900
1000
2006 2007 2008 2009 2010 2011
0 50
100 150 200 250 300 350 400 450
2008
Q1
2008
Q2
2008
Q3
2008
Q4
2009
Q1
2009
Q2
2009
Q3
2009
Q4
2010
Q1
2010
Q2
2010
Q3
2010
Q4
2011
Q1
2011
Q2
2011
Q3
2011
Q4
2012
Q1
2012
Q2
2012
Q3
Source: NSS data and Bank staff calculations.

Macroeconomic Developments and Outlook | 7
during 2010–2011, while imports grew by only 14 per-cent (Figure 1 .4) . The high growth of exports helped nar-row the trade deficit from 24 .1 percent of GDP in 2009 to 20 .5 percent in 2011 . After shrinking by 30 percent during the crisis, inflows of remittances revived quickly to a level about 11 percent below the pre-crisis maxi-mum . Remittances helped ease pressures on the current account, which is gradually narrowing after reaching 15 .8 percent of GDP in 2009 . The strong growth of export and continuing recovery of remittances will contribute to further improvement of the current account deficit, which narrowed to 10 .6 percent of GDP in 2012 .
At the same time, FDI inflows remained weak, in particular those from Russia. During 2012, FDI in-flows reached $489 .4 million, declining by 6 .9 percent year-on-year . FDI went primarily into the mining sector (including production of base metals) and the telecom industry, which attracted 16 .7 percent and 49 .8 percent of FDI inflows in the real sector, respectively .
Foreign exchange reserves increased slightly during 2012. When ‘leaning against the wind’ became un-tenable in March 2009, the Central Bank of Armenia (CBA) allowed a one-off 20 percent depreciation of the dram against the U .S . dollar . Once the CBA halted heavy interventions in currency markets to stem depre-ciation of the dram, multilateral and bilateral partners extended financial support to Armenia which resulted in an increase in gross official reserves by $600 million in 2009 . In 2012, pressure on the exchange rate result-ed in some unexpected reserve losses in June 2012, but they were reversed toward the end of the year . The CBA’s foreign exchange reserves reached $1 .8 billion at end-2012 . In its latest Article IV consultation based on discussions in September 2012, the IMF considered the exchange rate overvalued by 5–10 percent .
Fiscal consolidation is continuing at a faster-than-ex-pected pace. The fiscal deficit declined to 2 .8 percent of GDP in 2011, well below the initial target of 4 .1 per-cent, and contracted to 1 .7 percent of GDP in 2012 (Figure 1 .5) . The fiscal consolidation was achieved mainly through expenditure compression . Expendi-ture compression of 4 .3 percent of GDP during the 2010–12 period was achieved through under-spending on capital, while priority social spending was largely protected . Lending from multilateral and bilateral do-nors remains the key source of deficit financing .
Figure 1.5. Key Fiscal Indicators, 2008–2012(percent of GDP)
Expenditures
–10 –5 0 5
10 15 20 25 30 35
2008 2009 2010 2011 2012
Revenues and grants Tax revenue
Overall balance
Source: MOF, NSS and Bank staff calculations.
Higher tax revenue helped reduce government borrowing. Macroeconomic recovery allowed meet-ing the nominal targets for tax revenues in 2010–2011 . For 2012, the government set an ambitious target of increasing tax revenues by AMD 100 billion supported by amendments to the tax legislation . The amendments included bringing taxation of fuel under the general tax regime, a higher personal in-come tax rate for salaries exceeding AMD 2 million, and introduction of excise tax on luxury cars . After large increases during the crisis, net borrowing from abroad declined to $214 million and the external public debt-to-GDP ratio stayed at 35 .2 percent in 2011 . The public debt increased slightly to about 38 percent of GDP in 2012 .
Monetary policy has followed the CbA’s inflation targeting regime. With inflation decelerating to be-low the CBA’s target band (year-on-year CPI inflation of 4 percent, plus or minus 1 .5 percent), the policy in-terest rate was lowered by 50 basis points to 8 percent in September 2011 . The rate has remained unchanged since then . The CBA pointed out that exchange rate depreciation during May-June 2012 had already eased monetary conditions and a further lowering or rates was not warranted because of likely pass-through effects of the depreciation on inflation . The financial sector remained buoyant and well capitalized . Despite some increase in non-performing loans during 2012, the banking sector remains sound . The capital ade-quacy ratios are generally higher than required by the central bank’s regulations .

8 | Republic of Armenia: Accumulation, Competition, and Connectivity
Macroeconomic OutlookComing out of the crisis, the inward orientation of the economy is reversing. The contraction of do-mestic consumption and exchange rate depreciation allowed exports to expand . Net exports contribut-ed 1 percent to GDP growth in 2012, a strong turn-around from the negative contribution to GDP growth of about 10 percent in 2007 and 2008 . In the wake of the crisis, exports grew significantly faster than GDP, and the ratio rose quickly to about 25 percent in 2012 . The construction sector stabilized in 2012 . However, it is still significantly larger than construction sectors in other lower middle income countries .
Slower growth abroad, and a return to trend in ag-ricultural growth suggest a slowdown of economic growth over the medium term. With the effects of the good agricultural harvest waning, GDP growth is projected to moderate to 5 percent during 2013–2015 . With a modest outlook for construction and the agri-culture sector’s return to its historic 3–4 percent annual expansion pace, growth drivers will have to come from industry and modern services .
The current account deficit is expected to improve with growing remittances and as a result of structur-al shifts in the economy. Policies geared to industri-al development and export promotion should lead to faster growth of tradable sectors . Together with con-tinuing growth in remittance inflows, this will support a reduction in the current account deficit to single digits . The macroeconomic framework also takes into account gradual depreciation of the exchange rate to support an improvement in the current account balance .
Moderation in growth and fiscal consolidation will ensure low inflation, but international food prices will remain a source of external shocks. In the me-dium term, inflation is expected to stabilize around the CBA’s target of 4 percent as a result of a narrow-ing current account deficit, and fiscal consolidation . In this case, the CBA will maintain its interest rate at 8 percent, which it considers a neutral policy stance (Figure 1 .6) . However, pass-through of rising world food prices, especially for wheat following unfavorable weather conditions in 2012 in Russia, Kazakhstan, and the United States, is expected to become evident in Armenia in 2013 .
Figure 1.6. Policy Rate and 12-month Inflation, 2008–2012(in percent)
0
2
4
6
8
10
12
14
2008
:1
2008
:4
2008
:7
2008
:10
2009
:1
2009
:4
2009
:7
2009
:10
2010
:1
2001
0:4
2010
:7
2010
:10
2011
:1
2011
:4
2011
:7
2011
:10
2012
:1
2012
:4
2012
:7
2012
:10
2013
:1
12-months inflation Policy rate
Source: CBA.
Fiscal consolidation based largely on reducing cap-ital expenditure—as happened in recent years—is not sustainable. Protection of social spending is im-portant to alleviate poverty which has been worsening during 2009–10, but continuous overlooking of capital spending may undermine growth prospects, as well as put additional pressures on the state budget, when the infrastructure would require higher maintenance costs . The government is conscious of the need to increase public investment to crowd in private investment . To balance the need for adequate capital funding with fiscal consolidation and pro-poor stance, the govern-ment needs to continue the reforms in public finance management to ensure higher value for money .
The latest debt sustainability analysis (DSA) con-ducted jointly with the IMF identified a low level of debt distress, even after taking into account the significant private sector debt burden. The public sector DSA suggests that Armenia’s overall public sec-tor debt dynamics are sustainable in light of the cur-rent size of the debt stock .
Nevertheless, the rapid accumulation of public debt since the onset of the global crisis calls for continu-ing the pursuit of fiscal consolidation over the me-dium term. Public external debt was only about 16 percent of GDP at end-2008, but reached 35 percent of GDP at end-2011, and is expected to decline if fis-cal consolidation is successful and economic growth remains buoyant . While the projected debt-to-GDP

Macroeconomic Developments and Outlook | 9
levels do not breach the indicative thresholds, the ra-tios remain at much higher levels than prior to the cri-sis, pointing to a permanently lower resilience of the Armenian economy to exogenous shocks .
by targeting a fiscal deficit of less than 2 percent over the long term, the authorities could rebuild the macroeconomic buffers used during the crisis and increase the resilience of the economy. A one per-cent deficit, for example, would reduce the ratio of the present value (PV) of debt to GDP by half compared to the baseline scenario by the end of the projection period in 2032 (Table 1 .3 and Figure 1 .7) . However, this would come at the cost of either compressing expen-ditures further, or making more strenuous efforts to increase the revenue-to-GDP ratio . Alternatively, if Ar-menia was able to attain a higher growth trajectory, a two percent deficit target would allow for an increase in fiscal space and a more rapid increase in buffers . If real GDP growth were to average 6 percent rather than the 4 percent assumed in the baseline, which would still be significantly under the 10-year historical average, the PV debt-to-GDP ratio would fall steadily from 35 per-cent of GDP in 2012 to 26 percent at the end of the pro-jection period, instead of remaining broadly constant as under the baseline .
gross external financing is assumed to average just under 3 percent of gDP in line with the average in the decade prior to the crisis. This implies net external financing of about two percent of GDP after amortization or one percent after amortization and Armenian external lending . During the recent IDA-16
Mid-Term Review, Armenia and a few similar countries were deemed ineligible for concessional financing un-der IDA-17 .10 However, Armenia applied for deferral of its graduation . Eventually, lending terms are projected to harden as Armenia graduates from IFI concessional financing into the non-concessional lending windows over the medium term, and then further harden as Armenia begins to access the commercial bond mar-kets . The DSA assumes that the government gradu-ally begins to access loans on fully commercial terms from 2018 onwards, although official non-concessional financing is expected to make up the bulk of the bor-rowing until the late 2020s .
Figure 1.7. Public Sector Debt, 2012–32(simulations, in percent of GDP)
Baseline 1% deficit 6% growth
2012 2014 2016 2018 2020 2022 2014 2016 2018 2030 2032
40PV of Debt-to-GDP Ratio
353025201510
50
Baseline 1% deficit 6% growth
2012 2014 2016 2018 2020 2022 2014 2016 2018 2030 2032
40PV of Debt-to-GDP Ratio
353025201510
50
Source: Armenia: 2012 Article IV Staff Report, IMF (2012).
10 IDA (2012), “IDA16 Mid-Term Review Graduation Pa-per”, Concessional Finance and Global Partnership (CFP), World Bank, September 2012 .
Table 1.3. Debt Reducing Primary Balances(to reduce debt to 30 percent of GDP in 10 years)
Real Interest Rate, Percent
Real Growth, Percent 0.00 1.00 2.00 3.00 4.00 5.00
2.00 –2.33 –1.97 –1.60 –1.23 –0.86 –0.48
3.00 –2.69 –2.33 –1.96 –1.60 –1.23 –0.86
4.00 –3.03 –2.68 –2.32 –1.96 –1.60 –1.24
5.00 –3.37 –3.02 –2.67 –2.31 –1.96 –1.60
Source: Armenia PER (2012).


Saving, Investment and Financial Intermediation | 11
2. Saving, Investment and Financial Intermediation
the microeconomic determinants of saving . Section C discusses aspects of financial and capital market de-velopment . Section D looks at the composition and effects of foreign direct investment . The last section gives policy recommendations .
Determinants of Aggregate Private SavingOver the last decade, Armenia has seen a tremen-dous rise in domestic saving and investment fol-lowed by a precipitous decline. Domestic saving increased from around 5 percent of GDP in the begin-ning of the decade, to 35 percent of GDP in 2006 (see Figure 2 .1) . Private investment increased in a similar fashion by 20 percentage points of GDP over the same period and reached 35 percent of GDP in 2008 . The strong rise in domestic saving was supplemented by growing inflows of remittances and good export per-formance, and the current account deficit narrowed up to 2008 . The global financial crisis led to a fall in the saving-to-GDP and investment-to-GDP ratios by about 15 percentage points during 2009–11 .
A part of the increase in overall saving was due to the improvement in public saving. The fiscal balance improved from negative rates in 2002 to around 3 per-cent of GDP on average from then on until the global crisis (Figure 2 .2) . Following the global crisis, public saving became negative with the deterioration of fiscal balances in 2009, but has since increased to 2 percent of GDP because of strong efforts at fiscal consolida-tion . Household saving was negative except during the boom years 2006–08, while the bulk of saving was provided by non-financial corporations .
High investment and a stable, manageable cur-rent account deficit are crucial for high economic growth rates. As the Growth Report (2008) pointed out, economies that had sustained 7 percent or higher growth since the 1950s had investment rates of 20–25 percent, while maintaining the current account deficit at manageable levels . Foreign saving is an imperfect substitute for domestic saving, because of the vulner-ability to capital flow volatility that it creates . Foreign direct investment (FDI) has often proved less volatile than other forms of foreign saving, and high domestic saving and FDI are therefore important inputs to high and stable growth rates . However, Armenia’s recent experience has shown that the sectoral allocation of investment matters: the residential investment boom of 2003–08 left the economy vulnerable to the external shock of the global crisis . Hence, the financial system and capital markets, which intermediate between sav-ing and investment, come under scrutiny .
Armenia’s financial market is dominated by banks, while equity and bond markets are rudimentary. Banks are relatively inefficient, do not innovate, and small businesses in particular face difficulties accessing loans . Government bonds are sold mostly to banks, but are not auctioned effectively for the establishment of a benchmark yield curve . Private bond and equity issues suffer from weak corporate governance and transparency . The recent introduction of mandatory in-dividual pension accounts will create significant long-term funds for investment in the capital markets .
This chapter looks at the determinants of saving and financial and capital market development. Section A looks at aggregate saving in the short and long run . Section B analyses household data to find

12 | Republic of Armenia: Accumulation, Competition, and Connectivity
Figure 2.1. Saving, Armenia and Selected Countries, 2003–10(in percent of GDP)
2003 2004 2008 2006 2007 2008 2009 2010
40
30
20
10
0
ArmeniaAlbaniaPoland
MoldovaEstonia
GeorgiaMacedonia, FYR
Sources: NSS, WDI.
Figure 2.2. Armenia : Composition of Domestic Saving, 2002–10(in millions of US dollars, left, and in percent of GDP, right)
0% 5% 10% 15% 20% 25% 30% 35%
–2,000–1,000
1,0002,000
0
3,0004,000
2002 2003 2004 2005 2006 2007 2008 2009 2010
Public savings Households savings Non-financial corporations savings Financial corporations savings Gross savings, share in GDP
Source: NSS.
Determinants of private household saving have been the subject of a large body of research. The theoretical and empirical literature on this topic has relied mainly on the life cycle model developed by Modigliani (1970) according to which rational agents save in order to smooth consumption and maximize inter-temporal utility . The literature finds that aggre-gate saving are usually determined by GDP per capita, the time deposit rate, openness of the economy, the real exchange rate, and the public deficit (see for ex-ample, Jongwanich, 2009; Montiel and Servèn, 2007) . The results of numerous studies of the determinants of saving can be summarized as follows:
¾ GDP per capita has a positive impact on saving—higher incomes result in higher saving .
¾ The time deposit rate has an ambiguous impact: on the one hand, higher interest rates lead to an increase in saving as they become more attractive relative to consumption (substitution effect), on the other hand, higher interest rates lead to higher incomes for those who saved in the past, and they could be enticed to spend more of it on consump-tion (income effect) . The effect of interest rates on saving therefore depends on whether the substitu-tion or income effect dominates .
¾ Openness has a positive impact through its stim-ulation of GDP (most studies show a positive rela-tion between a higher proportion of trade relative to GDP and the level of GDP) .
¾ Real appreciation has a positive impact on sav-ing, because it increases the wealth of individuals (wealth effect) .
¾ The public deficit has a positive impact on private saving, because it creates the expectation that public debt will have to be repaid at some point and taxes therefore will have to be raised (Ricard-ian equivalence) .
The Long-Run Saving Rate
The determinants of aggregate saving in Arme-nia conform to those highlighted in the literature. Based on our regressions, the aggregate saving rate (saving as a percentage of GDP) is determined by GDP per capita, the time deposit rate and the real exchange rate . A dummy variable for the global fi-nancial crisis (with a value 0 before 2009 and 1 after-ward) is also found to be significant (Table 2 .1) .11 GDP per capita and the time deposit rate have a positive impact on the saving rate, while real appreciation and the crisis have negative impacts . We also estimate a significant negative impact of the crisis on the sav-ing rate, which indicates that households believed the reduction in incomes they experienced during the crisis was temporary, and that they reduced their saving to maintain the desired consumption level through the crisis . From this, we would expect saving to recover with the economic recovery once house-holds have reached incomes similar to what they had prior to the crisis .
11 GDP per capita and the real effective exchange rate are entered in logs .

Saving, Investment and Financial Intermediation | 13
As expected, an increase in gDP per capita has a positive impact on saving. In our specification, a 10 percent increase in GDP per capita leads to a 3 .7 percentage points increase in the saving rate in the long run (i .e . if the initial saving rate was 5 percent, after a 10 percent increase in GDP per capita, the sav-ing rate becomes 8 .7 percent) . Also, a 1 percentage point increase in the time deposit rate leads to a 0 .02 percentage points increase in the total saving rate . A positive sign on the coefficient for the time deposit rate shows that the substitution effect dominates the income effect . This might be explained by low initial assets resulting in a smaller income effect . There is also a negative and significant impact of the real ex-change rate (REER) . In fact, we found that a 10 percent increase in the REER (appreciation) leads to a 3 .7 per-centage point decrease in the saving rate in the long run . The transmission of REER changes and saving is via exports: an appreciation of the REER decreases net
exports and aggregate output, which in turn decreases the saving rate . However, intuitive determinants such as openness of the economy and the public deficit do not appear to have significant effects on saving in the long run . This might be due to the fact that these vari-ables have experienced dramatic changes during and after the crisis, so that their effects are directly cap-tured by the crisis dummy variable .
The Short-Run Saving Rate
In the short-run, only changes in gDP per capita and economic openness matter. This results from an analysis of an Error Correction Model to find the de-terminants of the change in gross domestic saving, with the change in GDP per capita, economic openness, the real exchange rate, and the time deposit rate as inde-pendent variables . In addition, we added the lag of the residuals of the long-run relationship to measure the speed of return to the long-run relationship after a uni-tary shock (Table 2 .2) .12 The estimated coefficients for the change in GDP per capita and the long-run relation-ship suggest a strong short-run reaction of the saving rate to a shock and a quick return to the long-run equi-librium . The positive coefficient for openness shows that for instance a surge in minerals exports leads to an increase in the aggregate saving rate if the resulting surge in foreign currency is sterilized .
12 This coefficient must be negative in order to ensure a return to the long run relationship, which is the case (see Hamilton, 1994) .
Table 2.2. Error Correction Model Specification
∆s = –0.012 + 0.49 g + 0.15 ∆open – 0.94 ECM-1 Dependent variable ∆(sr)
Independent variable Coefficient t statistic
Constant –0.012** –2.1
∆(gdpc) = growth rate g of GDP per capita 0.49*** 13.5
∆(OPEN) 0.15** 2.0
lag(ECM) –0.94*** –6.1
Period: 2002q2–2011q2; N° observation = 37; R = 0.96; Durbin Watson = 1.96; *** 1%; ** 5% significance
Source: Authors' calculations.
Table 2.1. Determinants of Aggregate Saving (2002 q1–2011 q2)
Constant –2.88 (0.27)
GDP per capita 0.37 (0.02)
Time deposit rate 0.02 (0.006)
Real Effective Exchange Rate –0.36 (0.066)
Crisis dummy –0.2 (0.025)
Source: Authors.Note: Figures in brackets show standard errors. No. obs. = 38; R2 = 0.90; F(4;33 ) = 77.85; Durbin Watson = 2.2, Dickey Fuller on residuals test statistic = –6.8 (critical value at 1% = –3.67); Johansen Test trace statistic (for rank 0) = 193.6 (critical value at 1% = 68.5).

14 | Republic of Armenia: Accumulation, Competition, and Connectivity
Microeconomic Determinants of Household SavingHouseholds save for heterogeneous motives. Mod-els of the inter-temporal allocation of resources pre-dict that saving should respond positively to higher incomes, as well as to higher uncertainty in future in-come . Household characteristics such as education or employment types viewed as securing a more stable flow of income should decrease saving (assuming a constant income level) . The availability of financial in-struments, assets such as land, livestock, machines and cash-holdings and liquidity constraints are important determinants of saving (Schmidt-Hebbel et al ., 1996; Kulikov et al ., 2007; Abdelkhalek et al ., 2009) . Educa-tional levels along with the number of children per working adult are also important predictors of house-hold saving (Edwards, 1996; Horioka and Wan, 2007) . Finally, Kulikov et al . (2007) find that urbanization, a proxy for income stability, and ownership of large du-rable goods such as vehicles and real estate negatively impact saving .
These determinants are modeled by a multivariate function, which is estimated with various cross-sec-tion econometric models. Household saving are modeled as a linear function of five general classes of determinants: income, volatility of income, volatility of financial returns on potential investment, house-hold characteristics, and regional and time dummies .
Appendix A2 .1 presents the full list of the variables . We estimated the function using a pooled multivari-ate regression, and tested robustness using alternative specifications . Armenia’s Integrated Living Conditions Surveys (ILCS) conducted in 2004, 2006, 2008 and 2010 provided the data on household income and spend-ing behavior, and parameters measuring household characteristics . Saving rates are imputed from house-hold diaries by taking the difference between report-ed household disposable income and detailed con-sumption records observed during a month . Following Kulikov et al . (2007) and Denizer et al . (2002), both in-come and consumption exclude the purchase or sale of lumpy goods such as real-estate, land, vehicles or electro-domestic appliances .13
The determinants of saving at the individual house-hold level are in line with those of aggregate saving (Table 2.3). Inflation-adjusted household income and saving rates increased in all four periods . Kernel density plots of household saving rates suggest a similar evo-lution of saving over time, with an upward trend of the mean household saving rate . Saving rates increase by between 3 .7 and 4 .1 percentage points when incomes increase by 10 percent . Variables approximating the
13 The monthly saving rate is constrained between -150 per-cent and (by definition) 100 percent to minimize the effect of outliers . The excluded observations are re-introduced in the least absolute deviations (LAD) specifications that are less sensi-tive to extremes .
Table 2.3. Monthly Household Income, Consumption and Saving (deflated values, base year 2004)
Value (drams) 2004 2006 2008 2010
Y 89,887.6 (303,483.9)
105,866.9 (235,371.6)
101,334.2 (148,615.7)
90,062.76 (156,364.9)
C 57,329.02 (50,038.2)
64,118.47 (52,684.3)
70,669.8 (52,111.26)
61,480.02 (44,842.79)
S 32,558.6 (299,965.9)
41,748.47 (231,837.3)
30,664.44 (140,565.8)
28,582.74 (151,807.7)
Saving Rate 0.0845 (0.526)
0.111 (0.490)
0.124 (0.393)
0.130 (0.343)
N (Households) 6,122 4,752 7,545 7,453
Source: ILCS, various years, authors’ calculation.Note: Standard deviation in brackets.

Saving, Investment and Financial Intermediation | 15
variability of income yield mixed results: for instance, indicators of the type of work undertaken by the head of the household show no consistent pattern as the income stream expected from a class of work becomes more variable .14 The education level displays consis-tently negative and significant coefficients, confirm-ing that it is a good proxy for a secure future income stream .
Access to financial products lowers the saving rate. While this may be presented as evidence that households with access to formal or informal cred-it find it less necessary to save, it may also be ex-plained by a number of other mechanisms . For ex-ample, it seems likely that households taking on debt perceive some greater need for present liquidity . If these households are more likely to spend all avail-able resources (either on consumption or debt ser-vicing payments), estimated coefficients should be negative . Remittances, however, seem to be treat-ed as income with a positive effect on saving rather than an access to finance, in which case their impact would have been negative . Households who own homes of higher quality are less likely to save, which indicates on the one hand that saving are accumulat-ed to purchase durable assets, and on the other that ownership of assets reduces incentives for saving for precautionary reasons .
Household characteristics have differentiated im-pacts on saving. Larger households, both in terms of number of children and number of adults, appear to save less . The larger number of people in a household increases the probability of having some future income streams, and offspring secure retirement income .15 There are life-cycle effects on saving, with younger people saving significantly less than older ones, while there is also evidence of generational change with older cohorts acting more frugally than younger ones . Life-cycle and generational changes are influenced by changes in the national pension system .
14 Note that the work class omitted to avoid perfect collin-earity is salaried employment . It would then be expected, for consistency with the permanent income hypothesis, that riskier employment types be associated with higher saving levels . No consistent pattern of this kind is observed, although the number of individuals reporting to be in each income class is quite small .
15 See also Orteba, 2006, for this explanation .
Financial Sector DevelopmentArmenia’s financial sector is dominated by banks, while bond and equity markets are rudimentary. Banks account for 92 percent of the financial system’s assets, while credit organizations account for 5 .5 per-cent . The public bond market is more established than the private bond market, and the Armenian govern-ment has established a system of regular public bond placements in the primary market, which mainly con-sists of banks . The volume of public debt outstanding has been increasing at a rate of about 20 percent per annum over recent years to reach about 6 percent of GDP in 2012 compared with 3 percent in 2003 . The pri-vate bond market capitalization is less than 1 percent of GDP . In January 2013, only 8 private bonds were list-ed on Armenia’s exchange, Nasdaq-OMX, with matur-ities ranging from 6 months to 3 years . Private bonds in foreign currencies were allowed in 2012, and there have been three issues since then . They offer yields 3–4 percentage points lower than domestic currency bonds .
Status of the Financial Sector
The banking system has been growing rapidly and is sound, however, it still lags behind most of its peers in size and efficiency. Between 2005 and 2012 banking assets grew over 6-fold . There are 21 commercial banks in Armenia and one development bank as of January 2013, which together own more than 90 percent of the country’s financial assets, thus dominating the financial system . There are 32 credit organizations, however, they account for a tiny share in a country’s financial assets . Private sector credit to GDP reached about 38 percent in 2012,16 compared to the ECA17 median of 41 .9 percent . Lending is concen-trated in Yerevan: about one-third of the adult popu-lation resides in Yerevan, but Yerevan accounts for 66 percent of bank lending and 56 percent for credit or-ganizations . Armenia ranks 51th among 144 countries in WEF’s Global Competitiveness Report 2012–13 by
16 Regional comparison based on WDI data for 2010 . Data for Armenia for 2012 is from CBA, which uses a different methodol-ogy from WDI resulting in a higher ratio .
17 Europe and Central Asia (“Europe” includes only EU new member states) .

16 | Republic of Armenia: Accumulation, Competition, and Connectivity
soundness of banks indicator, and is thus ahead most of its peers and behind only Estonia .
The penetration of deposit services in Armenia re-mains among the lowest in the region. Banks are the only licensed providers of deposit services in the country . At end 2010, the deposit-to-GDP ratio was 23 percent, compared to the ECA median of 40 .3 percent (Figure 2 .3) . In 2010, there were 589 deposit accounts per 1,000 adults, compared to 914 for ECA . Deposits are held mostly in US dollars because of low confi-dence in the local currency following the 2009 deval-uation . As a result, the cost of mobilizing deposits is high . About 10 percent of bank funding comes from low-cost credit lines through the German Armenian Fund .18 Such credit lines have the potential to crowd out AMD deposits unless they are priced according-ly with interest rates proportional to such lines’ longer maturities . Only 5 of the 29 universal credit (and micro-finance) organizations are able to tap into the German Armenian Fund, compared to 19 of 21 banks .
Figure 2.3. Armenia: Peer Comparison on Financial Sector Depth
0% 20% 40% 60% 80% 100% 120%
Armenia 2012** Armenia 2010**
Georgia Moldova
Macedonia Ukraine Albania Estonia
Poland* Lower middle income countries
Middle income countries World
38%23%
29%32%
44%62%
36% 100%
43%30%
33%41%
Source: CBA, WDI.
Household saving in the banking system are high-ly dollarized. Deposits in US dollars make up about 70 percent of all deposits in Armenian banking sector (Figure 2 .4) . The high rates of dollarization of savings
18 The German Armenian Fund was established in 2001 by CBA to administer an SME credit line from KfW . It has since evolved to administer other credit lines . It currently administers eight active credit lines, including five from KfW, one from the World Bank, and two from the government . Outstanding loans as of January 31, 2012, amount to AMD 116 billion .
are partly due to high levels of remittances from Di-aspora and partly to general distrust toward national currency and fear of devaluation . Due to the targeted policy of the central bank the dollarization in the econ-omy had been decreasing before the crisis . After the national currency’s devaluation in the crisis year of 2009 the savings in dollar again jumped in share, although it remains lower than a decade ago . The interest rate differential between loans (deposits) denominated in the national currency and in US dollars averaged 4–6 percent .
Figure 2.4. Composition of Bank Deposits, 2000–12(in percentage share, and US dollars and AMD)
0%
20%
40%
60%
80%
100%
2002 2003 2004 2005 2006 2007 2008 2009 2010 2011 2012
Deposits in US$ Deposits in AMD
Source: CBA, EV analysis.
2002 2003 2004 2005 2006 2007 2008 2009 2010 2011 2012
Deposits in US$, million Deposits in AMD, billion
0
500
1,000
1,500
2,000
2,500
Source: CBA, EV analysis.
Corporate loans dominate the banks’ loan portfo-lio. Corporate loans make up two–thirds of the banks’ lending portfolio, making them the biggest product group for banks . Introduction of new financial products is slow due to low awareness levels of the corporate sector and the high costs of educating and promoting for the banks . Plain-vanilla collateral-backed loans are therefore the dominant lending instrument on offer . Credit instruments such as factoring and leasing make

Saving, Investment and Financial Intermediation | 17
up less than 1 percent of the banking sector assets . Mi-cro, small, and medium sized enterprises (MSMEs) find it difficult to access formal credit . About 22 percent of banking sector lending and 33 percent of corporate lending goes to MSMEs .19 However, this is lower than the share of MSMEs contribution to GDP, which is about 40–50 percent .
Figure 2.5. Corporate Leverage Ratios, Armenia and Selected Countries, 2011
0.00 0.20 0.40 0.60 0.80 1.00 1.20 1.40 1.60 1.80
United States United Kingdom
Czech Republic Belgium
Luxembourg France
Hungary Chile
Poland Armenia
Slovak Republic Denmark
Estonia Netherlands
Sweden Germany Australia
Italy Portugal
Austria Slovenia Finland Ireland
Spain Norway Greece
Quoted shares-to-equity ratio Debt-to-equity ratio*
Source: OECD.* The debt-to-equity ratio is calculated as the ratio of long-term bank loans and bor-rowings to the total equity. The sample included 450 of the largest companies in Armenia. The source of information is the published financial reports. The statistics is calculated for non-financial organizations.
Armenia’s corporate sector has low levels of lever-age compared to those in similar countries. The debt-to-equity ratio in Armenian companies was about 0 .4 as of 2011 (Figure 2 .5) . Although the average ratio is low for Armenia, the distribution of companies is highly polarized with several sectors having close to zero level of leverage and with others having very high levels of leverage . The sectors with low level of lever-ages are those with high profits (such as mining) as well
19 Beck et al (2008) show that about 20 percent of bank lend-ing goes to MSMEs in emerging markets .
as branches of international companies that finance operations through international sources . Low levels of leverage at Armenian companies indicate that busi-ness lending absorption capacity is still high . However, many businesses find bank lending conditions to be highly unfavorable . High interest rate and collateral re-quirements are the two main factors cited by Armenian businesses that impede their access to bank loans .
Micro, small and medium enterprises’ (MSMEs) ac-cess to loans is limited due to lack of capacity and mistrust both in MSMEs and lenders. MSMEs often lack the necessary skills to be considered creditworthy . For example, they may lack technical know-how or skills in financial management and marketing . They may also either lack skills to produce reliable financial reports on which a lender can rely, or they may be sus-picious of sharing financial information with a bank or credit organizations . In turn, lenders often have low trust in the information provided by MSME loan appli-cants, or lack the skills to work with MSMEs to assess their credit applications . Moreover, many lenders are somewhat complacent, being satisfied to compete for a relatively narrow pool of proven good clients . While there are MSME development programs in place to support access to finance, they have not achieved sig-nificant scale due to the costs of expanding .20
While the collateral regime has improved in recent years, shortcomings remain in several areas, lim-iting the realization of using collateral to expand credit. First, there appears to be a limitation in law or practice on the registration of floating security inter-ests (e .g ., accounts receivable or inventory) . Either le-gal amendments should be adopted to allow security interests to attach to such classes of goods, or train-ing of judges and financial institutions should be con-ducted to clarify that it is already allowed . Second, the process of registering collateral is costly and time-con-suming, requiring several steps that typically take over a week and several physical movements of the lender and borrower to deliver or retrieve documents . The cadaster is in the process of establishing an online registration system, to be rolled out in March 2012, fol-lowing pending government authorizations . However,
20 For example, the SME National Development Center pro-vides TA and loan guarantees to about 800 SMEs, but this rep-resents less than 1 percent of Armenia’s registered SMEs .

18 | Republic of Armenia: Accumulation, Competition, and Connectivity
the online system will still require similar steps, some of which would be considered unnecessary by inter-national standards (e .g ., obtaining a report of non-en-cumbrance, obtaining notarization of the contract, and obtaining a decision to accept or reject the registra-tion by the cadaster) . The cadaster and the authorities should continue to study international good practice to simplify and accelerate the process .
The process of foreclosing on the collateral of a de-faulting borrower, taking possession of the prop-erty, and selling it is risky and time-consuming. The step of foreclosure has been partially addressed through the option of arbitration rather than going through the courts . Once there is an arbitration deci-sion and confirmation by the court which is conducted relatively speedily, the process of taking possession and selling the collateral, however, is a second stage and reverts to the court requiring notification to the borrower, which can easily be evaded . Banks and credit organizations report that the entire process can take up to three years . The costly and time-consuming process has adverse effects on lending . First, it makes lenders excessively conservative in their lending deci-sions, approving loans only to the highest-quality and well known borrowers . Indeed, some banks reported that competition among banks is largely limited to these borrowers, rather than expanding to new bor-rowers . Second, it limits the use of moveable collateral to secure loans, as moveable collateral is more subject to reductions in value, or being hidden or sold, during the lengthy process . Lenders therefore often lend only to premium clients with high-quality immoveable col-lateral, resulting in low NPLs but commensurately low outreach .
All of the shortcomings in the collateral regime also affect the development of leasing. Indeed, despite the fact that a leasing company maintains legal owner-ship of the leased property throughout the life of the lease, notification to the lessee is required to retake possession of the collateral . Moreover, leases may be registered only in the cadaster’s Yerevan office . Leas-ing is also currently subjected to a disadvantageous tax treatment compared to traditional bank borrowing: If a firm leases equipment, then the leasing compa-ny must immediately pay the VAT, but if a firm takes a bank loan and purchases equipment, the firm may defer the VAT for up to three years .
Banking System
Armenia’s banking sector is fragmented and on the whole has low efficiency. The concentration of assets among the banks is relatively low with the share of three leading banks in total assets being only 30 .2 percent as of 2012 . Most banks are small, and even the biggest bank in Armenia has shareholder capital of only about $100 million . Considering single-borrow-er exposure limits at 20 percent, the largest loan the biggest bank can give will be lower than $20 million . The local commercial banks are therefore not well po-sitioned to finance large-scale investment projects . According to experts, there is a potential to decrease the interest rate by up to 1 .5 percent by increasing the sector’s efficiency with improvements such as introduc-tion of advanced IT technologies . Also, the small size of banks results in high operational overheads . The overhead costs to assets ratio for Armenian banks is about 4 .2 compared to 3 .8 on average in lower mid-dle income countries, while the return on assets (ROA) is 1 .7 compared to 1 .3 for the lower middle income country group .
Figure 2.6. Lending-to-Deposit Rate Spreads, Armenia and Selected Countries, 2010(in percent)
0% 2% 4% 6% 8% 10% 12% 14% 16%
Armenia 2012**
Armenia 2010
Georgia
Albania
Moldova
Ukraine
Macedonia
Poland*
Estonia
Lower middle income countries
Middle income countries
World 6.3
6.3
8.0
6.7
3.2
2.4
5.3
8.7
6.4
15.0
10.3
8.2
Source: CBA and WDI.Notes: *Data for Poland is for 2006, ** Armenia 2012 is CBA data.
Interest rate spread is still high, but shows a de-clining trend, affected by increasing competition among banks. The weighted average cost of fund-ing for Armenian banks has been growing over recent

Saving, Investment and Financial Intermediation | 19
years and was about 6 .5 percent at end-2012 . Over the last decade, the interest rate spread has declined and the trend seems to continue . Armenia’s spread indica-tor is now more favorable than that of Georgia, howev-er, it is still higher than in some of its peers (Figure 2 .6) . Still high spreads can be explained by abundantly accessible financing from international financial insti-tutions limiting banks’ competition for deposits . One of the implications is a very high credit-to-deposits ra-tio . There is also increasing competition among banks for larger customers . Banks often offer lower rates to selected, big customers because of cost efficiency of serving big clients and cross-selling opportunities . There is a notable certain difference of spreads be-tween the consumer loans and corporate loans, which reflects the competition for big clients .
Bond Market
The market is dominated by primary auctions of public bonds. These follow pre-determined annu-al schedules, and semi-annual and annual reports on public debt management are published . The law on public debt of 2008 regulates the sector . Banks are the main players in the market, holding about 60 percent of the total bonds outstanding, while the CBA holds about 30, which it acquires in the secondary market or through its repo window .
Liquidity in the secondary market is low with most investors holding bonds to maturity or exchang-ing them bilaterally without using the exchange. In 2011, the CBA conducted 73 transactions in the sec-ondary public bond market with a total value of AMD 13 .6 million, or about 6 percent of total public bonds outstanding . Less than 5 percent of secondary trans-actions are carried out on the exchange . This impedes the development of market forces and liquidity in sec-ondary markets .
government bonds offer relatively high yield and crowd out private bonds. A regional comparison shows that both Armenian public bond yields and lending rates are significantly higher than those in Es-tonia, Poland, and Albania, but lower than in Moldo-va (Figure 2 .7) . The yield curve for government bonds shows higher yields for longer maturities, while corpo-rate loans are priced in opposite fashion (this may re-flect a selection bias in corporate loan pricing, whereby
longer-maturity loans are only given to prime clients, who pay lower interests rates) . The government often redeems long-maturity bonds after 2–3 years, which makes high-yield, long bonds effectively 2–3-year ma-turity bonds with distortive effects on the yield curve .
Figure 2.7. Government Bond Yields and Lending Rates, Armenia and Regional Comparators, 2011
0% 5% 10% 15% 20%
Armenia
Moldova
Albania
Poland*
Estonia
Lending interest rate T-bills yield
Source: IMF. * Data for Poland is for 2006.
The development of a private bond market is im-peded by a number of factors. These relate to the general investment climate, with challenges in investor protection and corporate governance and transparen-cy, and institutional issues, including the absence of the benchmark yield curve usually provided by gov-ernment bonds, the small size of institutional investors, and extensive paperwork and long processing times at the central depository .
Equity Market
The equity market is virtually non-existent. Arme-nia lags behind its peers in stock market capitaliza-tion, which is only about 1 percent of GDP (Figure 2 .8) . The arrival of a foreign investor in the market, Nas-daq-OMX in 2009 has so far not resulted in a major revival despite a number of technical improvements to the trading platform . The central depository which deals with securities clearance and settlement, how-ever, still needs some operational improvements and particularly reduction of paperwork and operations processing time . The low liquidity is the consequence of a rudimentary state of the market forces including lack of institutional investors managing long money,

20 | Republic of Armenia: Accumulation, Competition, and Connectivity
and lack of transparency of companies . For compa-nies, costs of going public still outweigh the perceived benefits . They do not have a sufficient level of maturity in terms of corporate governance and other manage-ment issues, in order to qualify for stock market place-ment . They do not have the will nor feel the pressure to go public . The corporate sector is still predominant-ly family owned who are not embracing the culture of diversifying the shareholding, as well as separating the management from the ownership .
Stock market development was impeded by the failure to channel privatization through the capi-tal markets. Privatization had a significant role in the development of the capital market in many transition economies, in particular through listing of formerly state owned infrastructure companies . However, many of the currently government owned companies in Ar-menia are making losses and are not attractive enough for a successful public placement . Only 3–4 of about 100 state owned companies today can be identified as possible targets for public placement .
Lack of institutional investors with long-term invest-ment profiles has been one of the major hurdles up to now. There have been promising reforms in the insurance sector which would lead to the emergence of life insurance, which is generally a major source for capital market investments . The pension fund reform with individual investment accounts to start in 2014
will create demand for more financial instruments (Figure 2 .9) . The government and CBA are putting in place rules and regulations and the infrastructure needed to administer the individual accounts and safely invest funds . Over the next five years, invested funds are projected to rise to close to $2 billion, which is a very sizeable amount given that total banking as-sets are around $6 billion today . The projections show both the opportunities created by the pension reform and the urgency to move ahead with the accompany-ing reforms in order to create the financial assets for pension funds, because otherwise the funds can only be invested in government bonds . Such an outcome would negate the benefits of the pension reform, be-cause it would not allow moving pension liabilities away from the government budget .
Figure 2.9. Projection of Individual Pension Invested Funds, 2014–2020(in millions of U.S. dollars)
113.3 264.6 460.3
707.6 1,012.7
1,378.3
1,807.8
0
500
1,000
1,500
2,000
2014 2015 2016 2017 2018 2019 2020
Source: USAID Pension and Labor Market Reform Project.
Figure 2.8. Stock Market Capitalization, Armenia and Selected Countries, 2010
a: in relation to GDP, in percent b: in relation to private credit-to-GDP ratio
0% 5% 10% 15% 20% 25% 30% 35% 40%
Armenia
Georgia
Estonia
Macedonia
Ukraine
Poland
Stock market capitalization to GDP ratiobenchmark, 2010*
0
5
10
15
20
25
30
35
40
0 20 40 60 80 100 120
Stoc
k Mar
ket C
ap.
Credit to GDP Ratio
Armenia
Estonia
Georgia
Macedonia
Poland
Ukraine
Source: World Bank’s Global Financial Development database.

Saving, Investment and Financial Intermediation | 21
Foreign Direct InvestmentArmenia needs to attract foreign saving into the tradable sectors to grow sustainably. Since 2005, the gap between domestic saving and investment has been widening as shown by the deteriorating current account balance (Figure 2 .10) . The current account deficit was mainly financed by FDI inflows . To maintain a high level of investment, domestic saving need to be complemented with a steady flow of FDI . To grow sustainably, FDI has to be channeled to the tradable sectors . Yet, the share of FDI flowing to the tradable sectors sharply decreased during 2003–08 .
FDI has positive productivity spillovers in the man-ufacturing sector. Multiple surveys suggest a posi-tive relationship between FDI and economic growth, stressing its role in supplying capital to countries with low domestic saving and inefficient financial interme-diation mechanisms, and its technology transfer ef-fects . Multinational corporations (MNCs) are seen to
Figure 2.10. Armenia: Savings Gap and Foreign Direct Investment, 2001–2011
a: Saving, Investment and CAB, percent of GDP b: Capital Flows CAB, in millions of US dollars
-18.0-16.0-14.0-12.0-10.0-8.0-6.0-4.0-2.00.0
0.05.0
10.015.020.025.030.035.040.045.0
2001 2002 2003 2004 2005 2006 2007 2008 2009 2010 2011
Savings Investments (gross capital formation) CAB
–600
–400
–200
0
200
400
600
2005
20
06
2007
:1
2007
:2
2007
:3
2007
:4
2008
:1
2008
:2
2008
:3
2008
:4
2009
:1
2009
:2
2009
:3
2009
:4
2010
:1
2010
:2
2010
:3
2010
:4
2011
:1
2011
:2
2011
:3
2011
:4
Portfolio invetsment FDI CAD
c: FDI Aggregate Distribution, percent d: FDI in Tradables, in million of US dollars
0% 10% 20% 30% 40% 50% 60% 70% 80% 90%
100%
2001 2002 2003 2004 2005 2006 2007 2008 2009 2010 2011
FDI in tradables Non tradable
0
100
200
300
400
500
2001 2002 2003 2004 2005 2006 2007 2008 2009 2010 2011
Post and telecommunications
Financial intermediation
Mining and quarrying
Manufacturing
Real estate activities
Other tradables (incl. computer, R&D)
Agriculture, forestry and fishing
FDI in tradables
Source: Armenia National Statistical Service and authors’ calculations.

22 | Republic of Armenia: Accumulation, Competition, and Connectivity
be a vital source of up-to-date technologies, and ben-efit from scale economies .21
Since the 2009 crisis, there is a shift of FDI toward the manufacturing sector. Before the 2009 crisis, tele-com, finance and mining were attracting the most FDI inflows to the tradables sector . After the crisis, manu-facturing ranked among the top-3 tradable sectors at-tracting FDI . But the share of FDI going to the tradable sectors as a whole is still significantly below its peak level of 91 percent in 2003 .
based on the characteristics of Armenia’s FDI in-flows, this chapter proposes policies to sustain the shift of FDI toward manufacturing. After analyzing the impact of FDI inflows on growth and uncovering FDI patterns across multiple dimensions, some policy measures are proposed to stimulate job creation .
FDI and Growth in Armenia
Armenia has attracted much more FDI in the sec-ond half of the 2000s compared to the first half. FDI inflows picked up from 2005 and constituted sizeable amounts in proportion to GDP . During 2006–10, cumu-lative FDI inflows stood at about 7 .5 percent of GDP, a remarkable level that positioned Armenia among the top performers in the Commonwealth of Independent States (CIS) and Central and Eastern European (CEE) countries .22
growth has been positively correlated with FDI inflows. Generally, high growth periods were accom-panied with increasing but more volatile FDI inflows . During 2001–05, high growth rates were associated with increasing but still moderate volumes of FDI . In the subsequent three years, FDI picked up as the con-struction-led growth model was thriving . In the crisis
21 The literature is quite positive on higher productivity of foreign firms, e .g . Lipsey, 2002 . However, the evidence on pro-ductivity spillovers is mixed and depends on a number of fac-tors including the sector, the host country policies and financial development level, see e .g . Alfaro, 2003 . Alfaro’s cross-country study suggests that FDI had positive impact on manufacturing, negative on primary industries and mixed on services .
22 This should be assessed on the backdrop of the sharpest decline in GDP in 2009, one of the largest among the bench-marked countries .
years, economic activity dropped significantly and FDI plummeted (Figure 2 .11) .
Figure 2.11. Armenia: FDI Inflows during the 2000s
a: FDI inflows by period, percent of GDP
Albania Armenia
Belarus
Bulgaria
Croatia
Czech Republic
Estonia
Georgia
Hungary
Kazakhstan
Kyrgyz Republic Latvia
Lithuania
Macedonia Moldova
Montenegro
OECD members
Poland Romania Russia
Serbia Slovak Republic
Slovenia
Tajikistan
Turkey
Turkmenistan
Ukraine
Uzbekistan
–4%
–2%
0%
2%
4%
6%
8%
10%
12%
14%
16%
18%
–2% 3% 8% 13% 18%
Inwa
rd FD
I 200
6–20
10,%
of G
DP
Inward FDI 2000–2005,% of GDP
b: GDP per capita and FDI inflows
–40.
8 –6
.6 8.
0 9.1
7.6
4.6 8.
2 3.
9 6.4 9.
9 13.4
14.1
10.4
13
.7
13.1
13.6
6.
7
–14.
3 1.
9 –50
–40
–30
–20
–10
0
10
20
0 100 200 300 400 500 600 700 800 900
1,000
1992
19
93
1994
19
95
1996
19
97
1998
19
99
2000
20
01
2002
20
03
2004
20
05
2006
20
07
2008
20
09
2010
GDP per capita annual growth, % Inward FDI flows, mln USD
Source: UnctadStat, WDI.
Capital Accumulation and FDI Inflows
Armenia’s recent growth was driven by capital ac-cumulation. During 2000–10, Armenia’s capital accu-mulation rate was around 33 percent higher than in CIS, CEE and OECD countries, except for Belarus and Turkmenistan (Figure 2 .12) . However, the construction sector represented between 51 and 68 percent of the gross fixed capital formation . While its share has
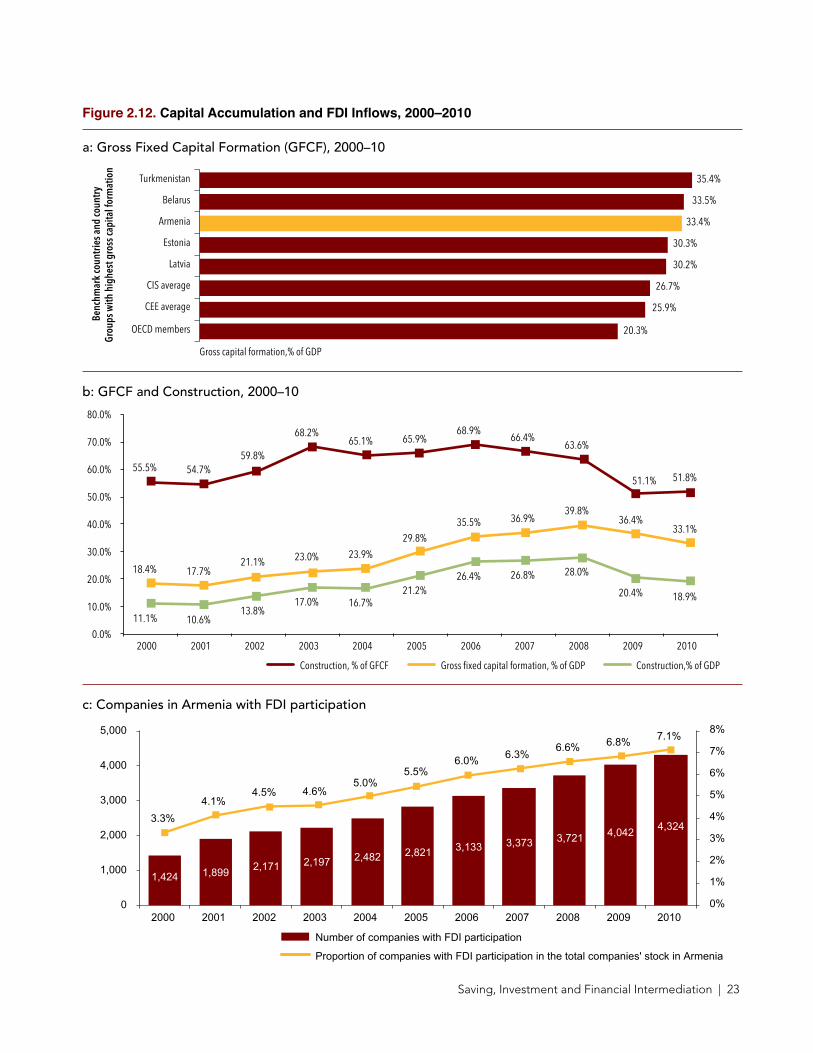
Saving, Investment and Financial Intermediation | 23
Figure 2.12. Capital Accumulation and FDI Inflows, 2000–2010
18.4% 17.7% 21.1% 23.0% 23.9%
29.8% 35.5% 36.9%
39.8% 36.4%
33.1%
11.1% 10.6% 13.8%
17.0% 16.7% 21.2%
26.4% 26.8% 28.0%
20.4% 18.9%
55.5% 54.7% 59.8%
68.2% 65.1% 65.9%
68.9% 66.4%
63.6%
51.1% 51.8%
0.0%
10.0%
20.0%
30.0%
40.0%
50.0%
60.0%
70.0%
80.0%
2000 2001 2002 2003 2004 2005 2006 2007 2008 2009 2010
Gross fixed capital formation, % of GDP Construction,% of GDP Construction, % of GFCF
1,424 1,899 2,171 2,197 2,482 2,821 3,133 3,373 3,721 4,042 4,324 3.3%
4.1% 4.5% 4.6%
5.0% 5.5%
6.0% 6.3% 6.6% 6.8% 7.1%
0%
1%
2%
3%
4%
5%
6%
7%
8%
0
1,000
2,000
3,000
4,000
5,000
2000 2001 2002 2003 2004 2005 2006 2007 2008 2009 2010
Number of companies with FDI participation
Proportion of companies with FDI participation in the total companies' stock in Armenia
a: Gross Fixed Capital Formation (GFCF), 2000–10
b: GFCF and Construction, 2000–10
c: Companies in Armenia with FDI participation
20.3%
25.9%
26.7%
30.2%
30.3%
33.4%
33.5%
35.4%
OECD members
CEE average
CIS average
Latvia
Estonia
Armenia
Belarus
Turkmenistan
Benc
hmar
k co
untri
es a
nd co
untry
Gr
oups
with
hig
hest
gro
ss ca
pita
l for
mat
ion
Gross capital formation,% of GDP

24 | Republic of Armenia: Accumulation, Competition, and Connectivity
dropped after the crisis, it still accounts for nearly 50 percent of GFCF . Construction in Armenia expanded due to the boost of residential construction mainly in Yerevan and road construction supported by donor funding . However, capital accumulation was mainly driven by foreign savings . Domestic savings rates were relatively low .
As a result, the number of companies with FDI in-creased substantially. FDI volume growth has been accompanied by the growth of the share of companies with foreign capital in the total universe of companies in Armenia . Since 2000, this share steadily increased from 3 .3 to 7 .1 percent implying that the growth in the number of companies with FDI participation signifi-cantly exceeded the rate of creation of “purely local” companies . This is an indication of increasing dyna-mism of the business with enhanced interest from for-eign investors .23
23 However, this must be interpreted with caution given that many non-resident company founders are former Armenian citi-zens who migrated out .
FDI Inflow and Sectoral Productivity
Four sectors attract most of the FDI. These are trans-port and telecommunication, electricity, gas and water, financial intermediation and mining . Together they ac-counted for 72 .5 percent of total cumulative FDI over 2000–2010 (Figure 2 .13) . FDI levels in these sectors have been high in relation to their respective gross val-ue added on cumulative terms - from 71 percent in fi-nancial intermediation to 102 percent in electricity, gas & water sector . In terms of FDI per employee, these sectors also outpace the rest .24
24 The industry classification is based on NACE 1 .1, GVA fig-ures are available only for first level industry categories which significantly limits the depth of the analysis . Thus, for example IT industry is distinguished with a high presence of foreign capital and high productivity . However, GVA figures and accurate FDI statistics are not available for the industry . The official statistics states that in the period of 1998–2010 the sector of software development and IT services attracted over $65 million of FDI to the economy which accounted for 1 percent of the country’s total FDI for the same period . However, this maybe a substantial underestimate given the nature of foreign investment transac-tions in the industry .
Armenia
Albania
Belarus
Bulgaria
Croatia
Czech Republic Estonia
Georgia
Hungary
Kazakhstan
Kyrgyz Republic
Latvia
Lithuania
Macedonia
Moldova
Montenegro
OECD members Poland
Romania
Russian Federation
Serbia
Slovak Republic
Slovenia
Tajikistan
Turkey Ukraine
Turkmenistan
–20%
–10%
0%
10%
20%
30%
40%
50%
0% 5% 10% 15% 20% 25% 30% 35% 40% 45% 50%
Gros
s Sav
ings
, % o
f GDP
Gross fixed capital, % of GDP
d: Gross Savings and GFCF, 2000–10
Source: WDI, NSS.

Saving, Investment and Financial Intermediation | 25
Figure 2.13. Sectoral Contribution to Gross Value Added, 2000–2010
a: Contribution to total GVA growth b: Cumulative share in GVA
0.0%
0.4%
1.0%
1.1%
1.9%
3.6%
3.6%
4.4%
4.6%
4.9%
5.4%
7.1%
7.4%
16.0%
16.3%
22.3%
Other
Fishery
Restaurants and hotels
Electricity, water and gas
Social and personal service activities, other
Mining and quarrying
Education
Public administration
Health and social work
Financial intermediation
Real estate, renting and business services
Manufacturing
Transport and communications
Wholesale and retail trade
Agriculture
Construction
Sector contribution to GDP change
Real
Sec
tors
of I
ndus
try
0.1%
0.5%
4.7%
1.7%
2.3%
3.4%
3.3%
2.9%
2.8%
4.3%
12.4%
7.2%
12.7%
20.8%
21.1%
Fishery
Restaurants and hotels
Electricity, water and gas
Social and personal service activities, other
Mining and quarrying
Education
Public administration
Health and social work
Financial intermediation
Real estate, renting and business services
Manufacturing
Transport and communications
Wholesale and retail trade
Agriculture
Construction
Sector contribution to GDP change
Real
Sec
tors
of I
ndus
try
c: Sector’s GVA growth
other
4056%
841%
30%
199%
1012%
223%
282%
809%
560%
259%
91%
219%
347%
151%
469%
Fishery
Restaurants and hotels
Electricity, water and gas
Social and personal service activities,
Mining and quarrying
Education
Public administration
Health and social work
Financial intermediation
Manufacturing
Transport and communications
Wholesale and retail trade
Agriculture
Construction
Real estate, renting and business services
Sector contribution to GDP change
Real
Sec
tors
of I
ndus
try
Source: NSS.

26 | Republic of Armenia: Accumulation, Competition, and Connectivity
However, the contribution of these sectors to eco-nomic growth during 2000–10 has been modest. They contributed only 12 percent to the total growth in the observed period, due to their relatively small size in the economy . For instance, mining which grew by 1012 percent contributed only 3 .6 percent to total Gross Value Added (GVA) growth . By virtue of their large share in GDP, the largest contributors to the total GVA growth were construction, agriculture and whole-sale and retail trade .
Lead FDI sectors have been net contributors to job creation. Despite high growth, net job creation in the 2000s was insignificant, while intra-sectoral shifts have been significant . Thus, manufacturing shed jobs, as well as the service sectors . The biggest job creation took place in construction and the public sector . Lead FDI sectors created about 20,000 jobs during this period .
Policy RecommendationsReform areas to boost saving and investment cov-er four areas: the macroeconomic environment, fi-nancial intermediation, remittances, and FDI. The significance of income in determining the saving rate implies that a growth-enabling macroeconomic envi-ronment is a necessary condition for high domestic saving . Thus, real appreciation and the 2009 crisis had a strong negative impact on the aggregate saving rate . Interest rates on time deposits stimulate saving, as do remittances . A macroeconomic environment that en-sures low inflation, a sustainable fiscal deficit and a sustainable current account deficit enables growth . Monetary, fiscal and trade policies need to be closely coordinated . The inflation targeting policy of the Cen-tral Bank should be maintained and strengthened to anchor inflation expectations . The exchange rate pol-icy needs to support an export-led growth strategy, with a competitive real exchange rate and low (import-ed) inflation . The fiscal stance needs to be sustainable, with the debt ratio contained below 50 percent of the previous year’s GDP (as per the fiscal rules adopted by the Government of Armenia) .25 Revenue mobilization efforts would help increase fiscal saving and invest-ment into growth-enhancing infrastructure and human capital .
25 Armenia adopted a rule in 2008, which stipulates that debt cannot exceed 60 percent of GDP then the fiscal balance .
Deeper financial intermediation stimulates saving. While households seem to borrow more when they have access to the banking system, the banking sec-tor currently receives sizeable funds from donors in the form of credit lines . To the extent that these credit lines are priced below market, they reduce the banks’ in-centives to offer attractive deposit rates to savers . Mi-cro-saving and -credit institutions can overcome size constraints, particularly in small towns and rural areas . Banking for Armenia’s corporate sector could expand significantly .
High intermediation spreads seem to be a result of the characteristics of the financial system. They are a function of the additional risk charges on holding dollar denominated assets and loans, an insufficiency of dram deposit funding, and the relatively small size of banks with commensurate larger operational over-heads . As such, the main feasible area for cost reduc-tion, which the authorities could consider supporting would be further consolidation of small banks where feasible, and promoting innovative technology and automation to reduce operational and overhead costs, and secure electronic based service delivery channels that could enhance efficiency and reduce operational and administrative costs .
To further expand credit and deposit services, mea-sures could include the following:
¾ Improving the Collateral Realization Process. Modernizing registering and repossessing collat-eral (foreclosure, seizure, and sale of collateral) could greatly expand access to credit by SMEs .
¾ Promotion and Expansion of Microfinance. De-fining ‘microfinance’ in the law, regulations and sector references and including the universal cred-it organizations more clearly as microfinance insti-tutions would raise their profile . Qualified univer-sal credit organizations should also have a greater role in donor and government credit programs . Technical assistance programs and possibly credit guarantee schemes to SMEs would enhance their bankability—areas for technical assistance could include accounting, financial management, busi-ness planning, and marketing .
¾ Regulatory Modifications to Expand Financial Services and Credit Products. The development of leasing would benefit from: (i) providing at least

Saving, Investment and Financial Intermediation | 27
equal tax treatment of lease financing and loan fi-nancing; (ii) developing leasing capacity and tech-nical know-how in banks and credit organizations, either in-house or from international donors; and (iii) developing a leasing law following internation-al good practice .
Equity and securities markets could supplement financial intermediation offered through banks. The recent pension reform will create individual, de-fined-contribution pension funds from 2014 . Devel-oping initiatives for increasing the supply of capital market securities will require a multi-pronged effort versus a traditional ‘organic’ growth of markets giv-en Armenia’s small ‘financial space’ and should thus include various simultaneous initiatives to generate competition and innovation in the sector . These may include several spheres of intervention to generate more liquidity and competition in securities markets:
¾ Securities Regulation. To increase financial mar-ket access and product development, factoring (receivables securitization) and reverse factoring markets could develop safe and well-rated fixed income instruments and generate additional local securities in the market . This will also require, inter alia, streamlining the floating security interest re-gime . Exploring securitization options for pooled SME business revenues and receivables could free up lending capital and generate new fixed income instruments with collateral backing . The development of a private equity framework could allow capital transactions to occur within a less transactional- and disclosure-intensive procedure amongst qualified players, and permit transac-tions via an over-the-counter market . Once some of these instruments have started to develop, and equities or bonds increase in circulation, the de-sign of an Armenian market index fund of major securities should be developed as a benchmark index for the domestic market .
¾ Institution-Specific Initiatives. The national mort-gage company could increase the issuance of mortgage covered bonds or securitizations . The mandate and portfolio of the Pan Armenian Bank could be diversified to include structured secu-rities . Pan Armenian Bank could act as a market innovator, introducing new market products that commercial banks are currently unwilling to offer .
¾ government Sector Strategic Initiatives. A deeper government debt management program could in-crease the depth of AMD government securities at key segments of the yield curve, and once achieved, provide a benchmark for indexed bonds .26
¾ Infrastructure Financing with Project bonds. To increase the availability of long-maturity bonds, the government could finance major public infra-structure projects with semi-private bonds secured with project cashflow (e .g . road tolls, or fees) rath-er than budgetary resources . The government would set up special purpose vehicles, possibly as public-private partnerships, and could kick-start project finance and give a major impetus to bond market development .27
With regard to foreign saving, remittances can be channeled to productive activities if the proper in-stitutions are put in place. More than 80 percent of Armenia’s remittances come from Russia . Nearly 10 per-cent of these inflows are already being used for business investment . Another 10 percent going to ‘other’ uses can be channeled to investment if the right institutions are in place . As of now, remittances come into Armenia through narrow banking channels which do not offer the full range of services of deposit taking banks .
Attracting more FDI requires scaling up skills, im-proving the investment climate, and connectivity to external market. This means being pragmatic and realistic: establish a target list of reputable mul-tinationals in manufacturing and tradable services and lobby them to relocate some of their activities to Armenia .
The government needs to be proactive and bold to be successful in its FDI attraction policy. The generosity of incentives (fiscal benefits, serviced land provision, risk guarantees) should be in line with the potential impact and spillovers on the domestic econ-omy in terms of job creation, knowledge transfer, and supply-demand linkages with SMEs .
26 An IMF/World Bank Team produced a technical advisory re-port covering several such issues: “Developing a Medium Term Debt Management Strategy,” December 2011 .
27 This idea was first proposed in the 2012 IMF/WB Financial Sector Assessment Program discussions .

Human Resources | 29
3. Human Resources28
28 This chapter draws heavily on Rutkowski, Jan (2012), Promot-ing Productive Employment in Armenia, Report No . 72907-AM; analysis of emigration and the labor force in CIS countries by Sau-mik Paul, and analysis of BEEPS data by Charles Udomsaph .
Armenia’s economy has been sluggish in producing jobs, even in the high-growth period in the 2000s. Faced with increasing demand for output, firms raised labor productivity, rather than employment . The rate of joblessness soared after the global crisis, and even af-ter the improvements over three years of recovery, un-employment still affects 18 percent of the labor force in 2012 . High unemployment and low labor force par-ticipation combine to make the employment-to-popu-lation ratio lower than in most European countries . At 53 percent, this ratio is far below the European aver-age of 60 percent .
High rates of unemployment, and low-productivi-ty employment have adverse implications for both economic growth and poverty reduction. To sustain growth in economic activity, human resources need to be used efficiently and allocated to the most produc-tive sectors . In contrast, Armenia’s labor market shows very little reallocation from agriculture to modern sec-tors of the economy, and high differences in rural and urban unemployment suggest little spatial mobility of labor . At the same time, labor market activities are im-portant drivers of poverty reduction .
Armenia’s labor market confronts challenges that affect demand (number of jobs), supply (number of workers) and matching of the two. Given the high unemployment, the emphasis should fall squarely on the first . Job creation will respond to removal of imped-iments to firm entry and business start-ups, because new firms are mostly more innovative and creative and create more jobs than existing firms . Improvements to the business environment enhance competitive-ness and help all firms . On the supply side, improv-ing skills requires engaging employers in the design
of academic curricula, instituting apprenticeships, and creating quality assurance mechanisms .
This chapter draws from recent analyses of the la-bor force and the enterprise sector. The first sec-tion reviews recent developments in the labor market through the global financial crisis . The second section reviews current challenges facing Armenia’s labor mar-ket, and the third section discusses policy options .
This chapter also provides a fresh look at an aspect of Armenian human resources, which is usually not included in this concept: the Armenian diaspora. It represents a largely untapped resource, but the right approach for engaging them has to be found . Many engagements are about entrepreneurship and risk taking in expectation of higher than usual returns . As such, it can and should not be mandated, adminis-tered or directed by the state . However, it can be nour-ished and supported . The literature refers to this as the paradox of guided serendipity—creating a framework where unplanned innovations thrive . The fourth sec-tion therefore looks at ways to engage the dynamism and outside experiences of the Armenian diaspora as an extension of the Armenian labor force .
Labor Market TrendsStarting in 2006, overall employment increased for the first time since Armenia’s emergence from the Soviet union. For most of the transition process,

30 | Republic of Armenia: Accumulation, Competition, and Connectivity
Armenia shed jobs, mainly in the public sector, when unprofitable enterprises shut down, and even surviv-ing firms reduced employment . Employment plunged from about 1 .6 million in 1990 to 1 .1 million in 2006 along with substantial structural changes in the econo-my . This is consistent with the experience of other tran-sition countries, where job flows mirrored enterprise restructuring . Between 2006 and 2008, Armenia ex-perienced a modest recovery in employment, fueled in large part by the construction boom . Employment increased modestly from 1 .092 million in 2006 to 1 .117
million just before the global financial crisis in 2008 . Data from the enterprise sector suggest that employ-ment growth was led by newly-created firms: Arme-nian enterprises created after 2003 increased employ-ment by over 20 percent, far above the ECA average of about 12 percent .29
29 BEEPS data from the 2008–09 round are weighted and are deemed to be representative of the enterprise sector in each country . The most recent round of the BEEPS is being conduct-ed this year .
Figure 3.1. Armenia: Labor Force Participation and Employment, 2010
a: Employment by sector, thousand b: Participation and employment rates, percent, 2009
0
200
400
600
800
1000
1200
2002
2003
2004
2005
2006
2007
2008
2009
2010
Non-tradable Services
Public Administration
Tradable Services
Mining and quarrying
Manufacturing
Electricity, gas and water
Albania
Armenia
Azerbaijan
Belarus
BiH
Bulgaria
Croatia
Czech
Estonia Georgia
Moldova
Kazakhstan
Kyrgyz
Latvia
Russia
ECA
40
50
60
70
40 50 60 70 80
Empl
oym
ent r
ate
Participation rate
c: Youth vs. adult employment rates, percent d: Female vs. male employment rates, percent
42.8
41.3
44.5
42.5
40.4 41.2
42.0 41.6
40.8 40.2
41.2
0
10
20
30
40
50
60
38
39
40
41
42
43
44
45
Total (LHS) Youth (RHS) Adult (RHS)
2000
2001
2002
2003
2004
2005
2006
2007
2008
2009
2010
42.8
41.2
44.5
42.5
40.4
41.2
42.0 41.6
40.8
40.2
41.2
0
10
20
30
40
50
60
37
38
39
40
41
42
43
44
45 20
00
2001
2002
2003
2004
2005
2006
2007
2008
2009
2010
Total (LHS) Female (RHS) Male (RHS)
Source: WDI, ILO and NSS.

Human Resources | 31
The incipient job creation was overtaken by the global crisis and a modest recovery. The unemploy-ment rate soared after the crisis, with young men and women bearing a disproportionate burden of this em-ployment shock . Although labor market conditions have improved in 2011–12, the rate of joblessness re-mains high . Meanwhile, many of Armenia’s workers—including highly-educated workers—find themselves employed in low-paid, low-productivity sectors and occupations .
Employment growth was driven mainly by the con-struction boom. Between 2000 and 2008, the construc-tion sector’s share of GDP surged from 10 to 25 per-cent . This rapid expansion went along with a doubling of employment in the sector, which offset employment decreases elsewhere (such as in agriculture and man-ufacturing, Figure 3 .2) . Anecdotal evidence suggests that the real employment effects of the construction boom may have been underreported, because of the difficulties in capturing a high share of informality in the sector in the official data .
Figure 3.2. Armenia’s Drivers of Employment, by Sector, 2002–10
–50000 –30000 –10000 10000 30000
Employment 2002 Manufacturing
Health and social work Education
Social and personal service Mining and quarrying
Agriculture Electricity and water
Fishery Financial intermediation Real estate, renting and
Wholesale and retail trade Restaurants and hotels
Transport and communications Public administration
Employment 2010
Source: NSS.
Enterprise sector data provides complementary evidence of the role played by construction firms in the growth of employment. Data from the Busi-ness Environment and Enterprise Performance Survey
(BEEPS) show that employment in construction firms grew by 18 percent between 2004 and 2007, which is well above the average employment growth of 13 per-cent for all reporting firms in Armenia, and in the re-gion . The rate of employment growth in the construc-tion sector of the EU10 was 5 percent, the Western Bal-kans 7 percent, and the CIS countries 5 to 7 percent .
Despite the construction boom, the unemployment rate remained high up to 2008, and expanded again after the global financial crisis. Household sur-vey data indicates that it grew to 19 percent in 2010,30 which is well above the regional average of about 12 percent .31 In 2011, the unemployment rate fell slight-ly to 18 .4 and some further decline is likely for 2012 . In addition to the survey-based unemployment rate, another measure of unemployment—the ‘augment-ed’ unemployment rate, which takes into account the number of people who are available for work but re-port themselves to be not actively looking for jobs be-cause they are already discouraged and do not expect to find jobs—indicates joblessness affects close to 30 percent of working age individuals .32
The youth have been disproportionately affected by the crisis. Youth unemployment soared in 2009 and re-mains high .33 The unemployment rate grew from about 40 percent to 60 percent, among workers age 15–19, and from 35 to 36 percent among workers age 20–24 . This compares unfavorably with the global average of youth unemployment (age 15–24), which was about 13 percent in the same year . Youth unemployment in ad-vanced countries was 12 percent on average in 2009,
30 Statistical Yearbook of Armenia (various issues) . There is a statistical break as the NSS calculated the unemployment rate based on the standard ILO definition only from 2008 onwards, thus restricting comparisons over time .
31 Koettl and others (2011) .
32 There is a third measure of unemployment, the registered unemployment rate (sometimes referred to as the “official” unemployment rate), which is based on the number of people registered with the public employment services office . This rate held steady at 7 percent in 2009–10 and then fell slightly thereaf-ter . Unlike other countries in the region, officially registered un-employment in Armenia is lower than survey-based unemploy-ment . The disparity may reflect differences in the generosity of unemployment benefits—namely, the cash assistance to unem-ployed workers . In other words, workers do not feel compelled to register, because the unemployment benefits are too low .
33 Statistical Yearbook of Armenia (various issues) .

32 | Republic of Armenia: Accumulation, Competition, and Connectivity
while in other ECA countries it was 21 percent .34 The youth unemployment rate in Armenia has since fallen marginally; in absolute terms, however, the number of unemployed youth rose from 75,000 to 76,000 .
High youth unemployment also reflects difficulties in labor market entry. Evidence from the 2010 round of the Integrated Living Conditions Survey (ILCS, a household survey) suggests that the majority of unem-ployed workers are new entrants to the labor market . A new Labor Code enacted in 2004 to facilitate job flows has made it easier to terminate contracts, but also put new restrictions on fixed-term hiring . A recent assessment, using aggregate time-series data analysis through 2009, provides some evidence that the new Code may have hampered hiring activities .35
High unemployment and low labor force participa-tion combine to make the employment-to-popula-tion ratio lower than in most European countries. At 53 percent, this ratio is far below the European average of 60 percent (Figure 3 .3) . Simulations from 2007 suggest that increasing employment of Arme-nians to the European average would lift GDP by
34 ILO (2011) .
35 Hartwell (2010) .
about 8 percent . At the time, it was also estimated that about 120,000 jobs were needed to sustain labor force participation rates between 2008 and 2015 . About 320,000 jobs would be needed to raise participation rates to EU15 levels .36
An education does not guarantee employment. Individuals with general secondary education but no technical skills represent the largest fraction of the un-employed, but many unemployed also have technical, occupation-specific skills . In urban areas, about a quar-ter of all unemployed workers have secondary, and/or technical education and another quarter finished ter-tiary education . In rural areas, the fraction of skilled individuals among the unemployed is smaller, but remains substantial . There is no evidence that social programs, such as the Family Benefit Program (FBP), create disincentives to work .37
36 World Bank (2007) . This is based on the working-age pop-ulation forecast then of 2 .4 million by 2015 and a constant em-ployment-to-population rate of 56 percent . Raising participation levels to those of the EU15 assumed a 65 percent employment rate . These were simulations through 2015 produced in 2007; the need for significant numbers of new jobs may possibly be offset by the projected decline of the economically active popu-lation through the longer-run . See Table 9 in World Bank (2007) .
37 World Bank (2011b) .
Figure 3.3. Employment Ratios in International Comparison (in percent)
0
10
20
30
40
50
60
70
80
Armenia
Croatia
Hungary Italy
Lithuania
Spain
Slovakia
Romania
Poland Latvia
Greece
Bulgaria
Ireland
Estonia
Belgium
Georgia
France
Czech R.
Portugal
Slovenia
Finland U.K.
Germany
Austria
Sweden
Denmark
Netherlands
Source: ILO.
Human Resources | 33
Complementary evidence also suggests a high underemployment rate in Armenia. Recent data from a global survey conducted by Gallup to mea-sure underemployment rates—or the percentage of workers who would prefer to work longer hours but cannot, for one reason or another—indicate that the incidence of underemployment in Armenia is high . In 2011, the world underemployment rate was about 17 percent, with the ECA region comparing favorably with other regions in the world . However, Armenia is counted among those with very high underemploy-ment rates, estimated to be 35 percent or higher, along with other economies in the South Caucasus region .
Moreover, many of Armenia’s workers remain employed in low-productivity jobs.38 Close to half of all employed workers are in agriculture, a sector which has not recovered its pre-transition productivi-ty level . The consequences for aggregate productiv-ity are substantial .
It is not clear what role domestic and internation-al labor mobility has played in easing (or exacer-bating) labor market pressures in recent years. In-ternational migration has been an important feature of Armenia’s economic landscape and remittances represent 15 percent of GDP . However, the share of households with international migrant members has fallen from about 20 percent before the crisis to 12 percent in 2009 .39 The majority of Armenian mi-grants are in Russia (about three quarters) and Rus-sia’s economy experienced a 12 percent contraction in 2009 .
38 World Bank (2007) . See also ETF (2010) .
39 Karapetyan, Susanna and others (2011) “Armenia: Social Protection and Social Inclusion” (Caucasus Research Resource Centers) . The World Bank’s Migration and Remittances Factbook 2011 reports that about 870,000 are currently abroad, represent-ing 28 percent of the population . The number of emigrants is difficult to estimate, given the extent of undocumented migra-tion and the disparity between administrative and survey data . The number of emigrants abroad also include permanent mi-grants, including entire households that have moved overseas . Thus the smaller percentage of households with international migrants, reflects in part the difference between seasonal and permanent migration .
Challenges to Armenia’s Labor Market 40
This section explores the challenges of labor de-mand, supply, and matching of workers and jobs. It draws on the analysis of ILCS data and refers to recent, related empirical literature whenever relevant . In addi-tion, it explores the role of the regulatory environment, where applicable, and whether social programs distort job-seeking behavior . Finally, it explores the role of labor mobility—both domestic and international mi-gration—and whether such geographic movement, or lack thereof, ease or exacerbate labor market pres-sures .
Weak Labor Demand
Job creation in the formal sector has not kept pace with the growth of the working age population. Sus-tained economic growth prior to the global financial crisis did not produce a sufficient number of new jobs; instead, gains in labor productivity led to rising wages . The construction boom prior to the crisis translated into employment growth, but proved unsustainable .
Armenia lacks a critical mass of small, dynamic and job creating enterprises. New, small firms led job-cre-ation in the years ahead of the crisis, according to BEEPS data . As new business registration fell in 2008 and 2009 because of the global crisis, job creation in Armenia has become more challenging . The lack of small firms is partly explained by a low level of entrepreneurship: few in Armenia’s labor force ever attempt to start a business and among those who do, few succeed . Data from the Life in Transition Survey (2010) suggest that only about 12 percent of the labor force has ever attempted to start a business and less than 6 percent have succeeded . This contributes to a lack of small firms that can generate enough new jobs to offset job losses in the older, more traditional sectors . Low entrepreneurship and lack of small dynamic firms are also indicators of a difficult busi-ness environment; barriers to growth such as the com-petition environment and connectivity are discussed in the other chapters of this report .
Chapter 4 of this report points out that more robust competition would contribute to the dynamism
40 Unless otherwise indicated, this section is drawn mostly from Rutkowski (2012) .

34 | Republic of Armenia: Accumulation, Competition, and Connectivity
needed to increase employment. Competition pro-vides firms with strong incentives to reduce costs and innovate to become more efficient and productive . They offer competitive prices, higher quality, and new and better services for the benefit of the entire economy . In addition, well-functioning complemen-tary markets (for example, logistics services and util-ities) contribute to firms’ efficiency, which in compet-itive markets is reflected in lower prices and better deals for consumers . Innovation and cost cutting also enable firms to compete globally . Experience shows that pro-competition sectoral reforms and effective implementation of antitrust rules lead to significant productivity gains and consumer savings .41
Deficiencies in the Quality of Labor Supply
Many firms report that inadequate skills constitute an important obstacle to doing business.42 This is particularly true among enterprises that are more modern and innovative—that is, firms that have been found to be investing in research and development, introducing new products, or upgrading existing products (Figure 3 .4) . About a third of these firms complain that they are constrained by the lack of skilled workers . At the same time, about 10–20 per-cent of the more traditional firms also complain about the quality of workers .
It is not immediately clear what explains the lack of skilled workers. There are several possibilities: First, more detailed characteristics of unemployed workers —particularly their educational attainment and what fraction possesses technical skills likely to be of use to expanding firms—may help shed light on the qual-ity of the workforce . Second, the quality of education matters—that is, unemployed workers may have the required diplomas, but not necessarily the specific skills required by firms .43 Third, government programs may be affecting the incentive to seek employment,
41 For a detailed summary of the impact of competition pol-icies, see Kitzmuller, M . and Licetti, M . Competition Policy- En-couraging Thriving Markets for Development . Viewpoint # 331 . World Bank Group, August 2012 .
42 It should be noted, however, that the level of complaints in Armenia is lower than the average for the ECA region .
43 That is, “skills, not diplomas” are critical, following the 2011 ECA Flagship Report on Skills .
including both skilled and unskilled workers alike . We explore each possibility below .
Individuals with general secondary education—with no technical skills—represent the largest fraction of unemployed workers. Detailed profiles on the unemployed drawn from ILCS data suggest that workers with no technical skills abound in both urban and rural areas alike . In urban areas, such work-ers represent about 40 percent of the unemployed and in rural areas, 60 percent of the unemployed . Meanwhile, nearly 10 percent of unemployed work-ers in both urban and rural areas have little or no ed-ucation .
Figure 3.4. Skills and Labor Demand, 2008(percentage of firms which identified inadequately educated workforce as an obstacle)
0
5
10
15
20
25
30
35
Yes No Yes No Yes No
Invested in R&D Introduced new products Upgraded existing product
Major obstacle Very severe obstacle
Source: BEEPS, 2008.
On the other hand, many unemployed possess technical, occupation-specific skills. In urban areas, about a quarter of all unemployed workers have sec-ondary, technical education and another quarter fin-ished tertiary education . In rural areas, the fraction of skilled individuals among the unemployed is smaller, about 35 percent, but remains substantial . For these workers, the challenge then is securing jobs that match their skills (see the next sub-section, on Matching) . On the other hand, some workers may possess the re-quired qualifications on paper, but lack the actual skills demanded by modern firms . The challenge for the

Human Resources | 35
educational system therefore is to identify skills that are required by employers .
The skills shortage is not likely due to any work disincentives created by existing social programs. Some have suggested that beneficiaries of govern-ment transfers may be deliberately withdrawing from the labor force, including individuals who are otherwise qualified and employable among those currently job-less . However, there is no evidence to date that social programs, such as the Family Benefit Program (FBP), creates disincentives to work .44 In fact, less than a fifth of members of FBP beneficiary households can be con-sidered able-bodied,45 working age individuals; most of these beneficiary households have higher numbers of dependents compared to the average households . Fur-thermore, the labor market characteristics of members of beneficiary households—in particular, those who are able-bodied and are of working age—are essentially the same as those of their counterparts in non-beneficiary households . In other words, they are as equally likely to be employed, unemployed or inactive as members of non-beneficiary households, though the employed workers among the FBP beneficiaries are more likely to be working part-time and in the informal sector .
Poor Matching and the Employment of Workers in Low-Productivity Sectors
There are large geographic disparities in employ-ment rates as well as the quality of employment. The employment rate in rural areas is 69 percent, which compares favorably with those of other countries, while the urban employment rate is 44 percent . The unemployment rate in urban areas is, at 28 percent, over 4 times the rural unemployment rate . However, these figures conceal some of the disparities in the quality of employment . Most rural work tends to be seasonal, part-time, and low-paid .46 The 2007 Armenia labor market assessment found that only about two-thirds of employed workers have permanent jobs; the rest have temporary jobs or are engaged in seasonal work, mostly in the informal sector .
44 World Bank (2011b) .
45 About a quarter of the inactive population are reportedly disabled (Armenia Statistical Yearbook, various issues) .
46 World Bank (2007) .
In this environment, Armenia’s Public Employment Services (PES) office has played a very limited role. In principle, PES offices can play a key role in facil-itating matches between job seekers and jobs that match their qualifications . In addition, PES can pro-vide additional training to reduce skills mismatches and skills shortages . In the case of Armenia, how-ever, few of the unemployed workers—less than 10 percent—find it worthwhile to register with the PES office . A smaller fraction use PES resources to find jobs, relying instead on friends and family members to obtain information on jobs vacancies . In fact, the effectiveness of PES job placement services is severe-ly limited . Currently there are 11 to 12 unemployed workers per vacancy reported to the PES office (the so-called unemployment/vacancy ratio), suggesting that at best the PES office can place less than a 10th of unemployed workers .
Migration and the Domestic Labor Force
The large discrepancy in urban and rural unemploy-ment rates is consistent with a limited role played by domestic labor mobility. Although some of this disparity in labor market outcomes is masked by the quality of employment in rural areas, as discussed in the previous section, the persistence of such disparity may reflect in the part the limited number of workers moving to where job opportunities are available . The emerging results of ongoing analyses of geographic immobility in the ECA region suggest that about two-thirds of the adult population in Armenia surveyed in the 2010 wave of the Life in Transition Survey have lived in the same community since birth . Although this is about equal to the ECA average, it is double that of the European comparator average .
The links between international emigration and the domestic labor market are not clear. A large frac-tion of households receive remittances—until recent-ly about a third of households—and remittances may cushion households from adverse shocks, such as the financial crisis, but they may also alter their job search and labor market incentives . Emigration (and remit-tance inflows) may raise domestic reservation wages and thus dampen labor market activity . More gener-ally, an emigration shock can be modeled as a labor supply shock; the wages of workers in the domestic la-bor market should therefore rise, holding other things

36 | Republic of Armenia: Accumulation, Competition, and Connectivity
constant . Alternatively, emigration may promote great-er entrepreneurship and thus promote job creation . While there are no necessary policy implications from the labor market patterns associated with emigration —as these are labor market activities reflecting private choices and preferences—a deeper understanding of the links between emigration and domestic labor mar-ket activity may serve to clarify distinct features of the Armenian labor market .
Some evidence suggests measurable declines in domestic labor market activity among members of migrant households. Using household survey data, we find evidence of declining labor market activity among members of migrant households in Armenia as well as in other neighboring countries in the region . The analysis is based on a probit regression analysis, including selected household and individual-level control variables .47 The labor market effects are much more pronounced among households with permanent migrants . The data are from a cross-sectional survey collected by the Asian Development Bank in a sample
47 This is from an ongoing analysis of household survey data led by Saumik Paul . As is well known, such an analysis is subject to selection bias . The research paper (forthcoming) controls for such biases using statistical matching methods .
of CIS economies before the global financial crisis . They preclude a more detailed analysis of the impact of emigration over time .
This could be driven by income and selection ef-fects. The decline in labor market activity could come from income effects as households can afford to work fewer hours when they receive remittances . The effect is likely to be more pronounced among households with permanent migrants with larger and more stable remittances . Another possibility is that it is in fact the most productive members of households who leave for work overseas . Their emigration is associated with diminished labor market activity among household members left behind in the domestic market .
At the same time, there is little evidence to suggest that emigration flows have been associated with rising wages in Armenia (Figure 3.5). This is in stark contrast with recent evidence drawn from Moldova and Lithuania and in countries outside the ECA region (Mexico and Puerto Rico) that suggests measurable in-creases in domestic wages associated with emigration of the domestic labor force . Armenia’s experience may be explained in part by the profile of the emigrants: many of them were in fact unemployed just prior to emigration . Compared to other migrant-sending
Figure 3.5. Armenia: Labor Force Participation and Employment, 2010
a: Sectoral Employment and Productivity, 2004–09
b: HH Labor Force Participation with and without Migration
Agriculture
Industry
Services
0
1,000
2,000
3,000
4,000
5,000
6,000
7,000
8,000
9,000
0 10 20 30 40 50 60 70 80 90 100
Cumulative Sectoral Shares of Employment
Sect
oral
Pro
duct
ivity
(200
0 US
$)
–0.73 –0.6
–0.37 –0.45 –0.43
–0.32
0.408
–0.31
–0.91
–0.68 –0.56
–0.41
Armenia Azerbaijan Kyrgyz Republic Tajikistan
All HH w. migrants
HH w. seasonal migrants
HH w. permanent migrants
Source: NSS, ADB.

Human Resources | 37
countries, Armenia’s emigrants also tend to be older . In this respect, at least, emigration may be helping ease labor market pressures, without elevating domes-tic wage levels .
Policy RecommendationsArmenia’s labor market confronts multiple challeng-es which will require a multi-pronged response. The labor market is characterized by weak labor demand, an inadequately qualified workforce and the poor matching of job seekers to employers . As a result, a large proportion of Armenia’s human resources are not productively employed .
¾ The creation of employment in the modern sec-tor is a priority. This requires the removal of im-pediments to firm entry and business start-ups . A major role will have to be played by competition advocacy and enforcement, as outlined in Chap-ter 4 . Better connectivity of the Armenian econ-omy will increase competitiveness, as discussed in Chapters 5–7 . Efforts to improve the business environment—such as by reducing the costs of doing business, limiting the number of business inspections and opportunities for extortion, and reducing incentives to join the informal sector—can also help raise the rate of firm entry and job creation .
¾ The quality of Armenia’s workforce needs be strengthened. This would require engaging employers in the design of academic curricula, instituting apprenticeships, and creating quality assurance mechanisms that allow both students and employers to assess the relevance and quali-ty of academic training provided by various insti-tutions .
¾ Job matching services provided by PES need to be improved. Two forces are mutually rein-forcing: First, employers need to be satisfied with the services that PES provides and report a large proportion of existing vacancies to PES (in other words, a high vacancy penetration ra-tio) . Second, the unemployed need to be confi-dent that PES will indeed help secure jobs com-mensurate with their expertise so that more job seekers will register with PES . A high vacancy penetration ratio helps ensure that more of the unemployed workers find jobs . The ability of PES
to find qualified workers also boosts employer confidence in the PES . All these require build-ing the PES capacity to provide intermediation services, including training and job counseling . They also need to be complemented by similar efforts in the private sector .
Promoting Diaspora EngagementArmenia’s talent pool is small and it therefore faces a shortage of competent individuals. However, there are many skilled Armenian’s abroad—the diaspora . As in many other countries, the best and brightest, which are crucial for innovation and growth, have often left the country in search of better opportunities . The usual policy focus—encourage return of talent to the home country—is often neither realistic nor necessary: members of skilled diasporas can just as effectively en-gage in joint projects with the home country without permanently relocating to it: a phenomenon called ‘brain circulation .’
Mobilization of diasporas has shown a tremendous potential, yet putting this promise into practice has proven to be elusive. This frustration is particularly visible in Armenia: diaspora initiatives beyond financial transfers (remittances and philanthropy) proved to be difficult to sustain . There is also a promise: the history of diaspora engagement reveals a diverse portfolio of promising private-public initiatives in the IT sector, fi-nancial sector, and tourism .
Armenia needs to confront two central paradoxes of diaspora engagement. First, many diaspora proj-ects are about entrepreneurship . This entails risk-tak-ing in expectation of higher than usual returns, which can be defined in non-monetary terms such as rec-ognition, self-esteem and intrinsic motivation . Hence it cannot be mandated, administered or directed but can be nourished and supported . Second, all the strength and brilliance of the diaspora notwithstand-ing, domestic institutions appear to determine the success of diaspora projects, particularly of complex and long-term projects . To articulate projects with high development impact, diaspora members need to search for people and institutions to engage with . Diaspora members thus can help to identify dynamic domestic institutions and individuals to unblock bind-ing constraints on development .

38 | Republic of Armenia: Accumulation, Competition, and Connectivity
The diaspora is defined in many ways, but the most important factor is a deep attachment to the home-land. We define diaspora as a non-resident population who share a national, civic or ethnic identity with their homeland through being born there and migrating or being the descendants of emigrants . One implication of this definition is the heterogeneity of diasporas and an imperative to focus on a small, dynamic and entre-preneurial segment of diasporas .
Diasporas do not need to be large to produce an impact. The fact that skilled expatriates can create enormous benefits for their countries of origin has come to attention in recent years through the contri-butions that the large, highly skilled, manifestly pros-perous and well organized Chinese and Indian dias-poras have made to their home countries, but smaller countries also have benefited from their much smaller diasporas . For example:
¾ Ramón L . García, a Chilean applied geneticist and biotechnology entrepreneur, contacted Fun-dación Chile, a private-public entity charged with technology transfer in the area of renewable re-sources in 1997 . After jointly reviewing their port-folios of initiatives, Fundación and Ramón’s com-pany Interlink, founded a new, co-owned compa-ny to undertake long term R&D projects . These projects were needed to transfer technologies to Chile that was a key to the continuing competi-tiveness of its rapidly growing agribusiness sector . Without Ramón’s combination of deep knowl-edge of Chile, advanced US education, exposure to US managerial practice and experience as an entrepreneur, the new company would have been inconceivable .
¾ When the Taiwanese government decided to pro-mote the venture capital (VC) industry in the be-ginning of the 80s, it had neither the capabilities, nor a blueprint to do that . Many were opposed to the idea because the concept of venture capital was foreign to traditional Taiwanese investment practices, in which family members closely con-trolled all of a business’ financial affairs . Through a process of intense interactions with the Taiwanese Diaspora in Silicon Valley, a Seed Fund provided matching capital contributions to private venture capital (VC) funds . Two American-style venture funds were also created in the mid-80s . They were
managed by US-educated overseas Chinese who received invitations to relocate to Taiwan . Once the first venture funds proved successful, do-mestic IT firms created their own VC funds . Once those started to pay-off, even the conservative family groups started to invest in VC funds and IT businesses .
¾ Armenia can boast similar promising and success-ful cases . The first international five-star hotel was opened with the help of the Armenian diaspora in 2001 (Yerevan Marriott) . Medium-term success and even more significant long-term promise of the Armenian IT cluster are unthinkable without the first-generation diaspora . Significantly, Ar-menia shows examples of the first-mover role of the diaspora in creating new private industries similar to the Taiwanese venture capital story . For instance, high achievers from the diaspora were instrumental in creating a credit reporting indus-try in Armenia . In January 2004, ACRA Credit re-porting LLC, the first credit bureau in Armenia was founded . Only one year after its foundation, ACRA already attracted reputable institutional investors, Dun and Bradstreet International (USA) and D&B SAME (UAE) . Today, ACRA is owned by leading lo-cal banks and the Central Bank .
¾ More recently, the Tumo Center for Creative Tech-nologies opened its doors to teenagers and pre-teens interested in activities at the intersection of technology and art . This is an initiative of the Si-monian Educational Foundation led by the New York-based Diaspora-Armenian Sam Simonyan .48 Since August 2011, the center has been offering children an intensive exposure to new ways of working and new tools of learning, planting the seeds of a career in a competitive field . The center is focusing on four areas that are attractive to kids and have career potential: digital video and audio, game design, computer animation and web devel-opment . The center is equipped with a state of the art computer center, cinema hall, game room and cafeteria .
48 This resource center is located in one of the central Ajap-nyak districts of Yerevan . It aims at providing professional ed-ucational programs for youth aged between 12–18 years on a completely free of charge basis and boosts the IT sector in the future .
Human Resources | 39
Conceptual Framework of Diaspora Engagement
The key conceptual framework is to look at dias-pora engagement as promoting search networks. In the case of Taiwan, the search network consisted initially of key dynamic and forward-looking members of the Taiwanese government and leading overseas Chinese engineers in Silicon Valley who were central in the emergence of this modern VC industry in a place dominated by conservative and risk-averse business groups .49
The extension from co-founding joint firms to co-creating institutional infrastructure with the help of the diaspora is natural. The initial objectives of Ra-mon Garcia and his peers from Taiwan were both mod-est and specific: to advance their professional interests by setting up technology firms in their home countries . Yet as the constraints of the home country institutional environment became apparent to them, they engaged in advancing institutional reform to remedy some of the constraints . Significant in this transition is that only a small number of diaspora members with knowledge, motivation and institutional resources are involved . Yet it is not possible to rely on the bottom-up creativity of diaspora members and their networks alone . To have an impact, informal networks need to be scaled up and institutionalized .
Properly leveraged, the diaspora is part of a coun-try’s endowment. Relevant expertise can be drawn upon for peer review of proposals and mentoring of their subsequent implementation . For example, in the biotechnology department of India’s Ministry of Sci-ence and Technology, diaspora members are relied upon as ‘sounding boards’ and ‘antennas’ when deci-sions are made on allocation of funds for research and technology development . Engagement with diaspora has become a routine part of the department’s orga-nizational practices . Skilled diasporas are viewed and relied upon pragmatically, for specific tools and pur-poses, as an extension and continuation of sector-spe-cific agendas . As such, engagement with diasporas becomes a part of everyday management practice .
49 A search network in this context is defined as a network to identify successive constraints and then people or institutions that help mitigate, at least in part, the difficulties associated with these constraints .
Another prominent example for this approach is Ire-land, which relies on the diaspora in many areas: FDI promotion, education, science and technology . Rele-vant government agencies incorporate the diaspora into everyday management practice by promoting a variety of search networks, which are not diaspora net-works per se but include diaspora members .
Rather than promoting search networks, govern-ments are often proactive, establishing a bewilder-ing number of programs and institutions. In part, the variety of programs reflects the sheer diversity of forms of diaspora engagement and contributions (Table 3 .1) . However, the diversity and contextuality of engagement makes most centralized interventions too crude to be successful . They tend to stifle rather than promote innovation, and consolidate entrenched interests rather than coordinate .
Micro-Reforms and How to Scale Them Up
Armenia does not lack examples of micro-reforms in specific sectors and fields. Marriott was such a micro-reform, which brought international best prac-tices to the hotel industry . Enterprise Incubator Foun-dation (EIF), which collaborates closely with the di-aspora in Silicon Valley, brought many micro-reforms to the IT industry . American University of Armenia (AUA), led traditionally by prominent diaspora mem-bers, is a micro-reform in Armenian higher education: it is a paragon of many international best practices and programs .
The challenge is to make sure those micro-reforms diffuse and scale up. Domestic institutions and the domestic environment need to be conducive to diffu-sion and scaling up . The institutional environment of Armenia can be made more conducive to such micro reforms: diaspora members capable of learning and searching need to find partners and pragmatic ways to diffuse their efforts . There are always better performing and more dynamic segments . Through a collaborative effort between such domestic dynamic segments and high achievers from the diaspora, many constraints of the domestic environment can be unblocked .
Some sectors are more conducive than others to achieve pragmatic consensus for action and to con-struct problem-solving search networks. Education

40 | Republic of Armenia: Accumulation, Competition, and Connectivity
and more generally skill development in higher educa-tion is particularly promising . Higher education orga-nizations such as AUA can become crucial institutional platforms to diffuse higher education reforms . Box 3 .1 illustrates how this can be done in institutional environ-ments which are similar to the one in Armenia .
Administrative to Instrumental Approaches
Administrative and instrumental diaspora policies are both needed and they complement each other. Instrumental approaches focus on a pragmatic search
for solutions and search networks which help to find such solutions . ‘Diasporas for what?’ is a key question of the instrumental approach . It can be contrasted with diaspora engagement as an end in itself, which is the administrative diaspora agenda . It includes fa-miliar diaspora ministries, Ministries of Foreign Re-lations and related NGOs . These are entry points of diaspora engagement that also play a coordination role: advocate a reasonable institutional environment for diaspora engagement and maintain dialogue with diasporas . These are diaspora ‘embassies’ in the home countries . But just like embassies are just entry points
Table 3.1. Impact of Diaspora Members: Armenia in Light of Relevant Benchmarks
Type of impact Country paragons and numbers
involved (A) Armenia Type of Entrepreneurship and their
motivation
Remittances El Salvador diaspora, 1.3 million, remittances of 3.6 US$B (15.7% of GDP)
Lebanese diaspora remittances, 8.1 US$B, (22% of GDP).
Armenian diaspora 7 mln, remittances of $1.8 bn (18 percent of GDP) (B)
Subsistence entrepreneur: (typically) subsistence motivation.
Donations and collective remittances
Mexican municipalities matching program of collective remittances for public investments.
Millions of ethnic Armenians worldwide contribute to large charities, such as Hayastan Foundation, that primarily finance projects in Armenia (cumulatively over $235.8 mln since its establishment in 1992).(C)
‘Feel Good’ entrepreneur: motivation to belong.
Investments Chinese diaspora of 8.3M includes thousands of investors in mainland.
FDI flows are 3 times less than remittances received by the country. The infrastructure and telecom sectors – recipients of more than 70 percent of FDI. The share of Diaspora-driven FDI still tiny and centered around a few projects (Airport, Logistics Center).
Conventional (conservative) entrepreneur.
Profit maximization.
Knowledge and innovation agenda
India. The diaspora equates to only 0.9% of Indian population, but 4.3% of the India’s tertiary educated live abroad, and remittances are 3.9% of GDP. Influential Indians in the US have been very instrumental in influencing US multinationals to start knowledge-process outsourcing in India, see Kuznetsov, 2006 for overview.
Good track-record of the American University of Armenia (AUA) California-based affiliate.
French University, Slavonic University.
Knowledge transfer, managerial skills transfer and innovation made by IT companies (Synopsys).
Technology entrepreneur and senior manager.
Professional credibility and growth.
Institutional development and reform agenda
Taiwan and India, see Saxenian, 2008 for an overview.
Armenia: Credit bureau (see below) Institutional and policy entrepreneurs. Self-actualization.
Source: Migration and Remittances Fact book 2011 . Second edition . The World Bank.(A) Data refers to 2010 unless stated otherwise .(B) Data refers to 2011 .(C) The cumulative data refers to January 2012

Human Resources | 41
Box 3.1. First Mover Institutions in Emerging Economies Created with the Help of Diasporas
Morocco: International University of Rabat
In the Middle East region, the International University of Rabat (IUR) is one of the first private universities in Moroc-co. It is led by a member of the Moroccan diaspora, a former professor at the Polytechnic University of Nantes. Started in 2006 in the framework of a new law, the IUR is an internationally oriented, R&D-driven university housed in the Technopolis of Rabat, an industrial area that aspires to host high-tech industries. The university began providing its first undergraduate and graduate courses in English and French in 2012, at high ($10,000) but inter-nationally competitive fees. The target is mostly elite students from the whole African continent, who would nor-mally study in Europe. UIR is under contract with the Government of Morocco, a public-private partnership which allows it to use academic personnel from the public sector and acquire recognition on the part of the Ministry of higher education of its degrees and diplomas. In addition, the university enjoys the patronage of a powerful segment of the local economy: it is built on land donated by the King, and counts leading local financial institu-tions and companies among its board and financers. However, the institution’s autonomous status is the crucial element of its success.
IUR draws extensively from the Moroccan diaspora, leveraging attractive salaries (roughly double of that given in public universities), good working conditions and other intangibles. More than 90 percent of its current teaching staff is Moroccans working in various parts of the world. The CCME (Conseil de la Communauté Marocaine à l’Etranger) proved to be highly useful on top of personal contacts the academic staff has.
Indian Business School (IBS)
In 1996, an eminent group of business leaders and academicians recognized the need for a top-ranked and distinctive business school in India. Among those, a good number of what we consider to be the typical over-achiever such as Rajat Kumar Gupta, a member of the Indian Diaspora and McKinsey’s first managing director born outside of the US. Through their collective networks, the founders inspired the very best in business and ac-ademia to see their vision and join their cause. These champions of the diaspora matched with home-country champions of institutional change and leadership.
In less than a year, the Executive Board was formed to be followed shortly by the formation of the International Academic Council. Diaspora members such as Gupta himself were involved in the board. Things moved fast from then on, with academic associations with two of the world leading business schools - Kellogg School of Management and the Wharton School. The London Business School followed closely before the launch of the first Post Graduate Program. The Government of Andhra Pradesh welcomed the ISB into Hyderabad, laying the foundation stone for the campus in 1999. The Post Graduate Program was launched in 2001 with the first batch of 128 students, followed shortly by the launch of the first Executive Education programs.
In the course of the last few years, the school has set up five Centers of Excellence, each with a particular focus on issues relevant to emerging markets. The Centers work closely with industry through conferences, seminars and workshops creating a vibrant research environment at the School.
Sirindhorn International Institute of Technology (SIIT), Thailand
SIIT is a top-tier school in Thailand. It was founded about 12 years ago with an enormous involvement of the Thai Diaspora. Among others, a former US-based IBM High level employee was involved. SIIT’s mission was to create an efficient, autonomous university, which, at that point, constituted a novelty in Thailand. Negotiation of the Diaspora-members brought SIIT to the point of autonomy. They strategically used their knowledge of the coun-try and their relations, and cultural awareness to reach their objective. For instances they named the university buildings after the current Thai-princess at the time, Sirindhorn, to indicate their sub ordinance in a demonstrative way, while at the same time remaining independent in their management, curricula and funding.
Source: Authors.

42 | Republic of Armenia: Accumulation, Competition, and Connectivity
to the governments, one needs a diaspora agenda in the instrumental sense, that is, a process of engage-ment with specialized government agencies (Minis-tries of Health, Education, Science and Technology) and agents to elicit credible commitments between the agents with resources and expertise at home and relevant diaspora members .
Developing a Portfolio of Promising Stories
Alumni mobilization programs of Ivy League uni-versities in the uS provide a useful benchmark of diaspora mobilization. Diaspora networks can be usefully compared with alumni networks .50 Well-run alumni programs generate substantial contributions . As in venture capital networks, financial contributions are important, but they are not the only crucial factor: defining a promising project is as important as financ-ing it . Successful alumni programs at elite institutions can bring in contributions worth many times the cost of running the program .
While all alumni are asked for support, actual sup-port is highly concentrated. Typically, 1 percent of the alumni base provides 90 percent of contributed resources . The universities are highly skilled at iden-tifying this group of alumni and maintaining contacts with them through individually crafted programs . More specifically, universities are very careful in select-ing and cultivating a small core of alumni who form a group of intellectual leaders for the entire alumni community . These intellectual leaders can be critically important for the success of alumni mobilization . This core group consists of an exclusive community of the institution’s most valuable supporters . The alumni as a whole must have high regard for these members’ professional achievements . Intensive personal inter-action among group members leads to major syner-gies: through group discussions, members gain better understanding of the needs of their universities . This helps them to produce better institutional develop-ment proposals and ultimately, they will become more generous in their financial support . Internal competi-tion within the group often increases the average size of members’ contributions .
50 The discussion of alumni mobilization program is due to Lev Freinkman and Richard Devane .
Formation of alumni leadership groups according to these principles could be difficult for many dias-pora communities. The leaders of many expatriate as-sociations are volunteers (often political appointees), but their status and resources do not qualify them to be major development partners . Most diaspora orga-nizations were created to support the local needs of expatriate communities in their new countries, not to support development of the homeland .
While leveraging the diaspora offers important op-portunities, it also presents challenges. Many en-gagements are about entrepreneurship and risk taking in expectation of higher than usual returns . As such, it can and should not be mandated, administered or di-rected by the state . However, it can be nourished and supported . The literature refers to this as the paradox of guided serendipity—creating a framework where unplanned occurrences can occur on a regular basis .
The goal of guided serendipity is to introduce link-ages between diaspora and home country agen-cies. This can take the form of building on established links, broadening the range of existing activities or in-troducing new activities to an established partnership, or be a first time relationship between new partners .
A way to overcome these paradoxes is to create a competitive contest to fund innovative pilot activi-ties. It would focus on a pragmatic search for solutions to sector specific needs of domestic agents and on di-aspora search networks as institutions that help to find such solutions . 51 The contest would invite innovative solutions emerging from collaboration between indi-viduals and or institutions in more than one country .
The contests should follow clear principles. They should focus on knowledge rather than money as en-try point; on joint project rather than the return of the diaspora; and on sectoral ministries as focal points rather than foreign or diaspora ministries . Consortia of this type have become an established part of interna-tional collaborations in academic and pre-competitive research programs, such as those funded through the EU S&T Framework program .
51 To remind, search networks are defined as a network to identify successive constraints and then people or institutions that can help mitigate the these constraints .

Competition | 43
4. Competition
rules lead to significant productivity gains and con-sumer savings .52
The State Commission for the Protection of Eco-nomic Competition (SCPEC) is charged with en-hancing competition, but it faces some important institutional challenges in achieving this mandate. The SCPEC‘s role is to enforce competition rules, deter anticompetitive behavior, ensure that state aid to firms does not distort competition, and advocate and promote a broader understanding of competition rules and benefits . Yet the current legal framework is insufficient, and the SCPEC faces capacity constraints .
There is significant scope to achieve efficiency gains from pro-competition sector policies and more effective economy-wide competition poli-cy enforcement. In a case study, we show that food prices in Armenia are significantly higher than in com-parable countries . Removal of barriers to entry and competition is particularly warranted . In addition, competition principles need to be fully mainstreamed within broader government policies . Finally, improve-ments to the antitrust and state aid framework would complement measures to reduce restrictive product market regulation .
This chapter looks at competition in product and service markets in Armenia. It provides insights into competition and government regulations and policies that affect competition, including the effectiveness of
52 For a detailed summary of the impact of competition pol-icies, see Kitzmuller, M . and Licetti, M . Competition Policy- En-couraging Thriving Markets for Development . Viewpoint # 331 . World Bank Group, August 2012 .
Competition in Armenia‘s markets for goods and services is hampered by market structure, restric-tive regulation, distortive state aid, the presence of strong state-owned companies, and ineffective enforcement of competition rules. According to the Global Competitiveness Index (GCI), Armenia ranks lowest among ECA countries in the effective-ness of antimonopoly policy and the intensity of lo-cal competition . This low ranking goes a long way to explaining the lack of dynamism of the Armenian economy, which leads to low employment and low in-comes . Key sectors are dominated by one or a small number of firms to a stronger degree than in other, comparable countries . State regulation and govern-ment contracts create barriers to entry for new firms and therefore to competition in several sectors, in-cluding, crucially, in aviation, railways, and profes-sional services . State aid has consisted of deferral of tax payments, guarantees, government loans, and subsidies for interest payments . Finally, the govern-ment owns the largest firms in electricity generation and transmission, water, postal services, railways, and operation of road infrastructure .
Robust competition provides firms with strong in-centives to reduce costs and innovate to become more efficient and productive. They offer competi-tive prices, higher quality, and new and better services for the benefit of the entire economy . In addition, well-functioning complementary markets (for exam-ple, logistics services and utilities) contribute to firms’ efficiency, which in competitive markets is reflected in lower prices and better deals for consumers . Inno-vation and cost cutting also enable firms to compete globally . Experience shows that pro-competition sec-toral reforms and effective implementation of antitrust

44 | Republic of Armenia: Accumulation, Competition, and Connectivity
the competition and antitrust framework . The first sec-tion gives an overview of competition in Armenia, fol-lowed by a look at barriers to competition in selected sectors . We then present a case study of the prices of food products . The fourth section presents Armenia’s competition policy framework, which encompasses economy-wide and sector specific regulatory provi-sions, followed by conclusions and recommendations . The chapter builds on competition policy assessments developed by the World Bank, in particular the Com-petition Policy Approach53 and the Viewpoint Note on Competition Policy .54 It benefited from guidance provided by the methodology of the OECD Regula-tory indicators questionnaire developed for the OECD Product Market Regulation (PMR) . The PMR measures the degree to which policies promote or inhibit com-petition in areas of the product market where compe-tition is viable .
53 World Bank Investment Climate Competition Practice “Competition Policy to improve the Investment Climate”, 2011 .
54 Kitzmuller M . and M . Licetti, “Competition Policy: Encour-aging Thriving Markets for Development” Viewpoint Note Num-ber 331, World Bank Group Financial and Private Sector Devel-opment Vice Presidency, August 2012 .
Competition IndicatorsKey sectors of the Armenian economy are domi-nated by a limited number of firms. Market struc-ture—the number of firms and the size of firms com-pared to their competitors’ sizes—affects the degree of competition that can be attained, though it is not the only determinant . In Armenia, important sectors that provide key inputs for other activities and where there is potential for competition—telecommunica-tions, and transport—consist of few firms or only one firm (Figure 4 .1) .
Armenia has a greater share of monopolies than other economies in the region. According to the latest Business Environment and Enterprise Perfor-mance Survey (BEEPS), markets exhibit high levels of concentration (Figure 4 .2), and 19 percent of markets are dominated by monopolies, as compared to an av-erage of 6 percent for other economies in the region . Moreover, 60 percent of Armenian markets covered in the survey exhibit an oligopolistic or monopolistic market structure . A small number of firms should not come as a surprise in an economy as small as that of Armenia, however, there are examples of small econo-mies with fewer monopolies, with FYR Macedonia and Montenegro providing two such examples .
Figure 4.1. Number of Firms in Each Sector, Market, or Market Segment
Min
ing
Oil a
nd g
as
Agric
ultu
re
Fore
stry
Light
man
ufac
turin
g
Food
pro
ducts
Phar
mac
eutic
als
Fixe
d lin
e in
frastr
uctu
re
Fixe
d lin
e te
leph
ony
Wire
less
/mob
ile in
frastr
uctu
re
Wire
less
/mob
ile se
rvice
s
Coa
l gen
erat
ion
Hydr
o ge
nera
tion
Biom
ass g
ener
atio
n
Sola
r gen
erat
ion
Win
d ge
nera
tion
Trans
miss
ion
Distr
ibut
ion
Bank
ing
Insu
ranc
e
Railw
ay fr
eigh
t
Inte
rnat
iona
l air
Airp
ort o
pera
tion
Tele
visio
n br
oadc
astin
g
News
pape
r
Cons
tructi
on
Heal
thca
re
Reta
il di
strib
utio
n se
rvice
s
Tour
ism
Was
te m
anag
mt a
nd re
cycli
ng
Mining,oil, gas
Agri,forestry
Manufacturing Telecom Electric power Financialsector
Transport Media Other services
Many firms
Few firms
One firm
Source: Investment Across Borders, 2010.

Competition | 45
Indicators of the intensity of local market compe-tition, the extent of market dominance, and the effectiveness of competition policy lag behind oth-er countries in the region. According to the Global Competitiveness Index (GCI), Armenia ranks lowest among ECA countries in the effectiveness of antimo-nopoly policy and the intensity of local competition . Insufficient competition affects regulated sectors such as utilities and natural monopolies, and certain markets with a small number of firms, such as petroleum, sugar, wheat, and cut flowers . Competition is limited because of barriers to entry, ownership concentration, market dominance, and vertical and horizontal integration .
State-owned enterprises (SOEs55) and government participation are present in several sectors and
55 SOE is defined as a company where state or provincial gov-ernments (not including local governments or municipalities) hold, either directly or indirectly through a government-con-trolled company, the largest single share of the firm‘s equity capital . Publicly-controlled firms include also government enti-ties not organized as companies, but operating in business or market activities .
network industries. The government owns the largest firms in electricity generation and transmission, water, postal services, railways, and operation of road infra-structure Table 4 .1) . The Armenian nuclear power plant and the water systems of national relevance are consid-ered of strategic importance .56 National, state or provin-cial governments control at least one firm in 7 sectors .
Particularly relevant is the SOE presence in services that are typically open to competition and private sector participation. Even though the SOEs’ market shares appear to be relatively low, direct participation in restaurants and hotels, financial institutions, and other business activities, including construction ser-vices is prevalent .57 However, SOEs have market shares above 50 percent in at least one segment or market of the electricity and railroad sectors . The state also owns some restaurants, hotels and financial institutions .
56 Law on Energy of the Republic of Armenia, Article 6 and Water Code of the Republic of Armenia, Article 4, respectively .
57 SOE is defined as a company where the state has 50 per-cent or more of equity shares .
Figure 4.2. Market Structure, 2009(market shares in percent)
0
10
20
30
40
50
60
70
80
90
100
Armenia
Kyrgyz
Rep.
Moldova
Azerbaijan
Slovak Rep.
Estonia
Kazakhstan
Poland
Montenegro
Mongolia
FYR Macedonia
Russia
Bosnia and Herzegovin
a
Romania Latvia
Lithuania
Slovenia
Hungary
Kosovo
Czech Rep.
Serbia
Bulgaria
More than 6 Oligopoly (3–6) Duopoly Monopoly
Source: BEEPS.

46 | Republic of Armenia: Accumulation, Competition, and Connectivity
In addition to government participation, foreign ownership is restricted in some sectors. Limitations to foreign ownership reduce the possibility of entry in these sectors, which may have a negative effect on the development of competition . In Armenia’s oil and gas and transportation sectors, foreign owners are not al-lowed to control firms (the maximum shareholding is 49 percent) . In forestry, no private participation is al-lowed . In principle, there are no limits to foreign own-ership in other sectors .
Barriers to Competition in Key Economic Sectorsbarriers to competition exist in different sectors, partly because of government contracts, rules, and regulations, partly because of particular as-pects of market structure. A few selected sectors are
described in this section . These sectors are important input providers for production in Armenia, and also provide products and services directly to households . The lack of competition in these crucial sectors raises the general price level, which lowers consumer wel-fare and the competitiveness of Armenian production relative to other countries . The lack of innovation that the monopoly positions allow incumbent companies reduces growth of the Armenian economy .
Air Transport58
The provision of passenger air transportation ser-vices is characterized by a number of restrictions that serve to protect the interests of the two Arme-nian airlines, Armavia and Atlantis European Airways
58 For a more detailed discussion see chapter 6 .
Table 4.1. Presence of State Owned Enterprises
National, state or provincial government controls at least one firm in: Yes No
Manufacture of refined petroleum products X
Manufacture of basic metals X
Manufacture of fabricated metal products X
Electricity generation/import, electricity transmission, electricity distribution, electricity supply X
Gas production/import, gas transmission, gas distribution, gas supply X
Wholesale trade, incl. motor vehicles X
Restaurants and hotels X
Railways passenger transport, freight railway transport, operation of railway infrastructure X
Other urban, suburban and interurban passenger transport X
Freight transport by road X
Operation of road infrastructure X
Air transport X
Operation of air transport infrastructure X
Telecommunications fixed-line services, fixed-line services X
Water transport, operation of water transport infrastructure X
Financial institutions (not central banks) X
Insurance X
Motion picture distribution and projection X
Total 5 13
Source: PMR (OECD) template survey 2012 conducting for Armenia by EV consulting.

Competition | 47
(AEA).59 With the exception of Russian routes, only one carrier per country (either Armavia or AEA on the Arme-nian side) is allowed to operate on a reciprocal basis in a particular market . In case of Russian routes, four carri-ers serve the Yerevan-Moscow route, and three carriers serve routes to other Russian cities .
Current regulatory practices favor incumbents in the aviation sector. The General Department of Civil Avia-tion (GDCA) negotiates bilateral air service agreements (ASAs) with other countries . Although the ASAs with most countries allow for multiple airlines, the GDCA designates either Armavia or AEA for any given route, and the partner country designates one airline from its side on a reciprocal basis . In 2003, the government entered into an investment agreement with Armavia, which gives it certain exclusive rights as the ‘national carrier’ . Since then, Armavia’s consent is usually sought regarding any changes in bilateral agreements, which provides the incumbent with protection and advantag-es to the detriment of developing competition .
Railways
There is only one railway operator despite open access provisions. The company, SCR, manages Ar-menian Railways, which is owned by the government as a concession . According to the concession agree-ment, open access charges are set by the Public Ser-vice Regulatory Commission (PSRC), but the methods for their calculation and the actual charges have not yet been published . The Railways Law expands on the principles for setting infrastructure usage fees and of-fers guidelines on the procedures for setting tariffs and fees, mentioning non-discriminatory treatment as a key principle . Limited competition in ground transpor-tation for bulk cargo affects the cost of final products, particularly bread given that inadequately regulated prices for railway services are paid to transport wheat and there is no alternative transport due to its volume .
Vertical integration along transport routes may fur-ther restrain competition. SCR has signed coopera-tion agreements with and owns shares in major ferry
59 Armavia ceased operations in April 2013 after this report was finalized . Atlantis European Airways serves as a marketing agent of Austrian Airlines and Czech Airlines and does not oper-ate any aircraft itself .
and trucking companies, allowing it to offer multi-modal services and new routes . Another example of potential competition problems is the integration of transport and customs warehousing services provided by the freight forwarding company, Apaven, at SCR’s Yerevan station, which gives the company a location advantage .
The PSRC is in charge of developing and approv-ing the methodology for calculating and approving fees. Fee calculations should include operation and maintenance expenses, depreciation, justified loan services, insurance, costs of compliance with environ-mental standards, and reasonable profit . Rather than presenting clear rules and fees based thereupon, the PSRC has issued a regulation, which provides for re-view of fees recommended by SCR .60
Gas and Electricity
In spite of the fact that the Armenian government opened gas import and distribution to the private sector, there is only one company serving the sec-tor.61 An integrated company imports gas and distrib-utes if households and businesses . In this case, an ade-quate regulatory framework would prevent abusive or unfair behavior that might have a negative impact on end consumers, but the regulatory framework is cur-rently not facilitating new entrants in the gas sector . It is not providing adequate, non-discriminatory third party access to the gas transmission grid .
In the case of electricity, additional measures will support the development of efficient electricity markets and increase consumer choices. There are numerous generators of electricity in Armenia, but transmission and distribution is in the hands of only one company . The sector does not have a retail choice provision and liberalized electricity wholesale pool, which restrain consumers’ choices .
60 Public Services Regulatory Commission of the Republic of Armenia, Decision 2008 No . 731A, December 24, 2008 .
61 There is no gas production in Armenia . Import of gas is being conducted by Russian-Armenian CJSC “Hay-RusGazArd” where the Armenian Government has 10 percent equity share . Previously the government had 20 percent equity share; 10 per-cent was sold to the major shareholder .

48 | Republic of Armenia: Accumulation, Competition, and Connectivity
Retail sector
It is important to ensure that the regulatory frame-work of the retail sector enhances competition. Pro-posed regulations of the retail sector (namely, the draft amendments to the Law on Trade and Services and the draft Law on Specification of Location Criteria for Big Commercial Objects in Yerevan City) institute regulatory restrictions to the development of retail business . These will include special permits from the regional authorities and impose restrictions on areas for large commercial outlets . According to the OECD (2008), planning and zoning regulation creates the most severe competition problems when regulations: (i) prevent new firms from entering in markets where there is market power; (ii) im-pede low-cost firms from entering in markets where ex-isting firms exhibit high-cost; (iii) reduce the total supply of a good or service; (iv) unduly delay the arrival of a good or service that consumers would value (such as one resulting from innovation or differentiation) .
Professional Services
Armenia imposes binding minimum prices for some services of architects and engineers. A procedure of cost calculation of preparing urban development doc-uments applies to participants in urban development projects .62 At that, the majority of EU and OECD coun-tries do not have any regulations of prices in these pro-fessions (Figure 4 .3) .
Sector Case Study: Prices of Food ProductsThis section presents a systematic review of price levels in the food sector in Armenia relative to oth-er countries in the region. The analysis focuses on the food sector for three reasons: (i) complaints about high prices center mostly on food products; (ii) food products are important for the average Armenian con-sumer, accounting for nearly half of the consumption basket; and (iii) food processing is an important sec-tor in Armenia, with food manufacturing comprising one-third of industrial production and food products accounting for 60 percent of retail trade .
62 The Order of the Urban Development Minister of the Re-public of Armenia N . 19-N from February 15, 2008 .
The empirical and econometric analysis explores whether food prices in Armenia are higher than in comparable countries and, if so, what the effects are in terms of consumer welfare. The analysis takes into account differences in per-capita GDP, import costs, product type, and time effects . However, it is important to note that comparing prices poses chal-lenges such as finding comparable products across countries and ensuring that the selected products are representative of each market .
The selection of products was therefore done with great care. Food products were selected on the ba-sis of: (i) their importance in the consumption basket; (ii) public concerns about high prices for the product; (iii) data availability; (iv) ease of comparability among different markets; and (v) the variability of market con-ditions . We conducted two studies, the first comparing
Figure 4.3. Price Controls Across Professions in the EU and OECD Countries
82.4%
Accountants
61.8%
Architects
64.7%
Engineers
58.8%
Lawyers
No regulationOther regulationNon-binding recommended prices on all servicesNon-binding recommended prices on some services
Maximum prices on all services
Maximum prices on some services
Minimum prices on all services
Minimum prices on some services
Source: OECD Product Market Regulation Database, 2008.

Competition | 49
prices across countries, and the second comparing prices across cities in Armenia . The products included in the cross-country sample represent 16 .9 percent of the consumption basket in Armenia, and those con-sidered for comparing across cities account for 25 .6 percent of the consumption basket .
Competition concerns have been raised in the se-lected markets. Armenia’s competition commission, SCPEC, has assessed the markets for sugar, wheat flour, sunflower seeds, oil, eggs, and dairy, the first four of which were evaluated as a result of apparent anti-competitive practices . In addition, recent news reports have called attention to the prices of bread, eggs, beef, and sugar . We have included only products for which monthly data were available for all CIS coun-tries or for major Armenian cities from January 2005 to July 2010 . The analysis considers that average cal-culated prices refer to a similar product, thus focusing on products that are relatively homogenous in order to reduce differences associated with price discrimina-tion and product characteristics . The products belong to markets with varying structures and competition conditions . For example, meat and dairy markets are less concentrated than sugar or wheat flour markets . Sugar, wheat flour, rice, and coffee markets depend
on imports, whereas eggs, bread, and dairy are mostly produced at home .
As in the selection of products, it is necessary to choose countries for which price comparisons are meaningful. Prices may differ across countries for several reasons, including demand and supply of the products in the area . To determine whether prices in Armenia are relatively high or low, it is therefore use-ful to draw comparisons with countries that share a similar economic environment . For this reason, the comparison group includes the other CIS countries . These countries are related geographically and share common economic ties, so that in the absence of eco-nomic barriers one might expect prices to be similar across countries . Consumer preferences are also ex-pected to be similar across these nations, increasing the comparability of prices across markets . Finally, the data on CIS countries were gathered from a single source (CISStat), which applied a common method-ology in gathering price data across countries, thus bolstering the comparability of price information used in this analysis .
It is important to note, however, that many of the selected countries do not feature ideal competitive
Figure 4.4. Concentration Levels for Selected Armenian Food Products, HHI
0 1000 2000 3000 4000 5000 6000 7000 8000 9000 10000
Sugar Olive oil
Wheat flour Pasteurized milk
Wheat for food Coffee Butter
Sunflower seed oil Rice Egg
Sausages Cheese
Macaroni Meat products
Highly concentratedHHI>2500
Moderatelyconcentrated
2500>HHI>1500
UnconcentratedHHI<1500
Source: SCPEC and authors‘ calculations. Thresholds based on US Merger Guidelines (2010). * Based on HHI levels (US Merger Guidelines, 2010), markets are usually classified as:• Unconcentrated Markets: HHI below 1500;• Moderately Concentrated Markets: HHI between 1500 and 2500;• Highly Concentrated Markets: HHI above 2500.HHI for monopoly equals 10,000.

50 | Republic of Armenia: Accumulation, Competition, and Connectivity
Table 4.2. Summary of Main Market Characteristics and Results of Price Comparisons Industry
ProductsNumber of
CompetitorsImportance of
Imports
Market Share of the Main Player in the Product
Segment/Market
(percent)
Armenian Prices vs. CIS Counterparts
(2005–2010)
Meat Beef, poultry, pork High Medium n.a. Difference not statistically significant
Dairy products Milk, cheese Relatively high Low Milk: 44.54,
Curd Cheese: 77.5
Higher for milk
Wheat products (bread, pasta)
White bread, rye bread of high and low (first) quality wheat flour, macaroni
High Low n.a. Higher for bread; not statistically different for pasta
Wheat flour Wheat flour of high and low (first) quality
Low High 47.3 Higher for wheat flour
Sugar Granulated sugar Low (monopoly) High 99.9 Lower
Eggs Hen’s eggs in shell Relatively high Low 26.06 Higher
Butter and oils Butter, sunflower oil, olive oil
Relatively low High Butter: 35.04
Sunflower & corn oil: 7.5
Olive oil: 66
Higher but only statistically significant for butter
Source: Business Survey 2009, SCPEC (Oct. 2010), UN ComTrade, NSS.
Table 4.3 Price Comparison Analysis, Armenia vs. CIS Countries
Variable Regression with controls Regression with controls 2 Regression with controls 3
Coeff t-stat Coeff t-stat Coeff t-stat
Armenia Dummy 0.1085 (**) 2.7 0.1565 (**) 2.92 0.1179 (***) 4.63
Log (GDPpc) 0.0927 (**) 2.7 0.1158 (**) 3.17 0.0916 (***) 3.47
Log (Cost of import) 0.1821 (*) 2.42
Log (Distance to coast or river) 0.0471 (**) 2.75
Specification includes:
Year fixed effects X X X
Monthly fixed effects X X X
Product fixed effects X X X
Year*month fixed effects X X X
Source: Authors’ calculations.Note: (***) Significance at 99%, (**) Significance at 95%, (*) Significance at 90%.
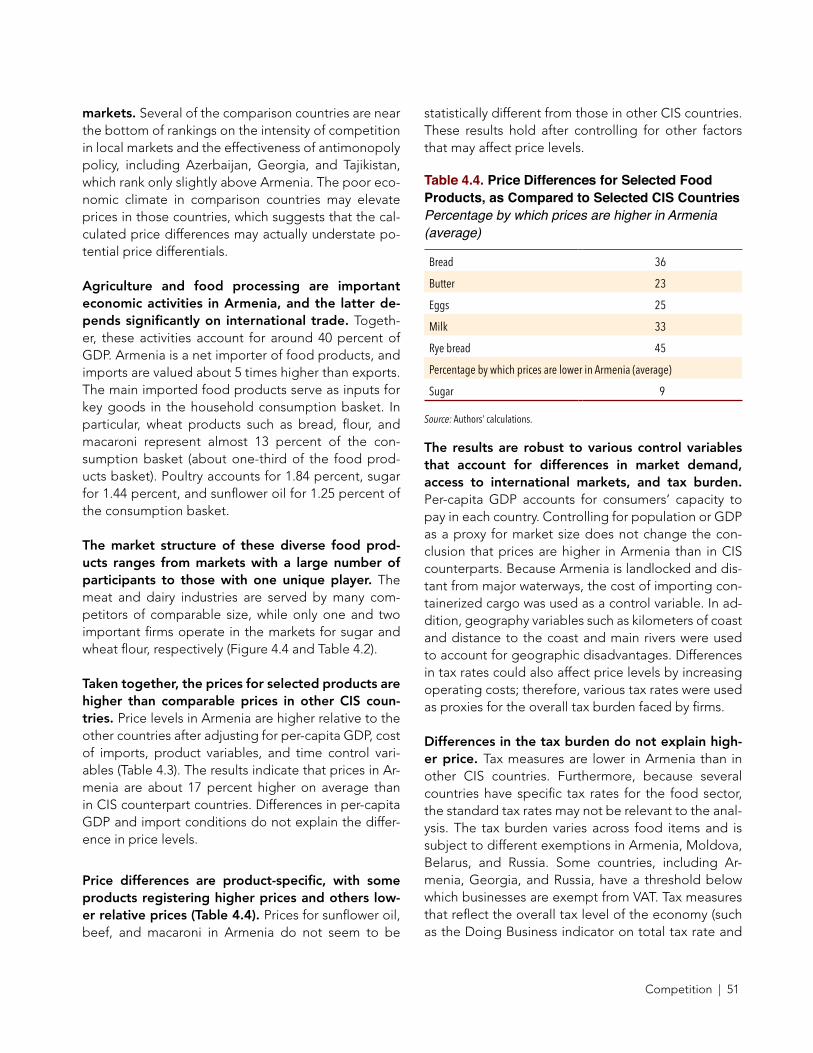
Competition | 51
markets. Several of the comparison countries are near the bottom of rankings on the intensity of competition in local markets and the effectiveness of antimonopoly policy, including Azerbaijan, Georgia, and Tajikistan, which rank only slightly above Armenia . The poor eco-nomic climate in comparison countries may elevate prices in those countries, which suggests that the cal-culated price differences may actually understate po-tential price differentials .
Agriculture and food processing are important economic activities in Armenia, and the latter de-pends significantly on international trade. Togeth-er, these activities account for around 40 percent of GDP . Armenia is a net importer of food products, and imports are valued about 5 times higher than exports . The main imported food products serve as inputs for key goods in the household consumption basket . In particular, wheat products such as bread, flour, and macaroni represent almost 13 percent of the con-sumption basket (about one-third of the food prod-ucts basket) . Poultry accounts for 1 .84 percent, sugar for 1 .44 percent, and sunflower oil for 1 .25 percent of the consumption basket .
The market structure of these diverse food prod-ucts ranges from markets with a large number of participants to those with one unique player. The meat and dairy industries are served by many com-petitors of comparable size, while only one and two important firms operate in the markets for sugar and wheat flour, respectively (Figure 4 .4 and Table 4 .2) .
Taken together, the prices for selected products are higher than comparable prices in other CIS coun-tries. Price levels in Armenia are higher relative to the other countries after adjusting for per-capita GDP, cost of imports, product variables, and time control vari-ables (Table 4 .3) . The results indicate that prices in Ar-menia are about 17 percent higher on average than in CIS counterpart countries . Differences in per-capita GDP and import conditions do not explain the differ-ence in price levels .
Price differences are product-specific, with some products registering higher prices and others low-er relative prices (Table 4.4). Prices for sunflower oil, beef, and macaroni in Armenia do not seem to be
statistically different from those in other CIS countries . These results hold after controlling for other factors that may affect price levels .
Table 4.4. Price Differences for Selected Food Products, as Compared to Selected CIS Countries Percentage by which prices are higher in Armenia (average)
Bread 36
Butter 23
Eggs 25
Milk 33
Rye bread 45
Percentage by which prices are lower in Armenia (average)
Sugar 9
Source: Authors’ calculations.
The results are robust to various control variables that account for differences in market demand, access to international markets, and tax burden. Per-capita GDP accounts for consumers’ capacity to pay in each country . Controlling for population or GDP as a proxy for market size does not change the con-clusion that prices are higher in Armenia than in CIS counterparts . Because Armenia is landlocked and dis-tant from major waterways, the cost of importing con-tainerized cargo was used as a control variable . In ad-dition, geography variables such as kilometers of coast and distance to the coast and main rivers were used to account for geographic disadvantages . Differences in tax rates could also affect price levels by increasing operating costs; therefore, various tax rates were used as proxies for the overall tax burden faced by firms .
Differences in the tax burden do not explain high-er price. Tax measures are lower in Armenia than in other CIS countries . Furthermore, because several countries have specific tax rates for the food sector, the standard tax rates may not be relevant to the anal-ysis . The tax burden varies across food items and is subject to different exemptions in Armenia, Moldova, Belarus, and Russia . Some countries, including Ar-menia, Georgia, and Russia, have a threshold below which businesses are exempt from VAT . Tax measures that reflect the overall tax level of the economy (such as the Doing Business indicator on total tax rate and
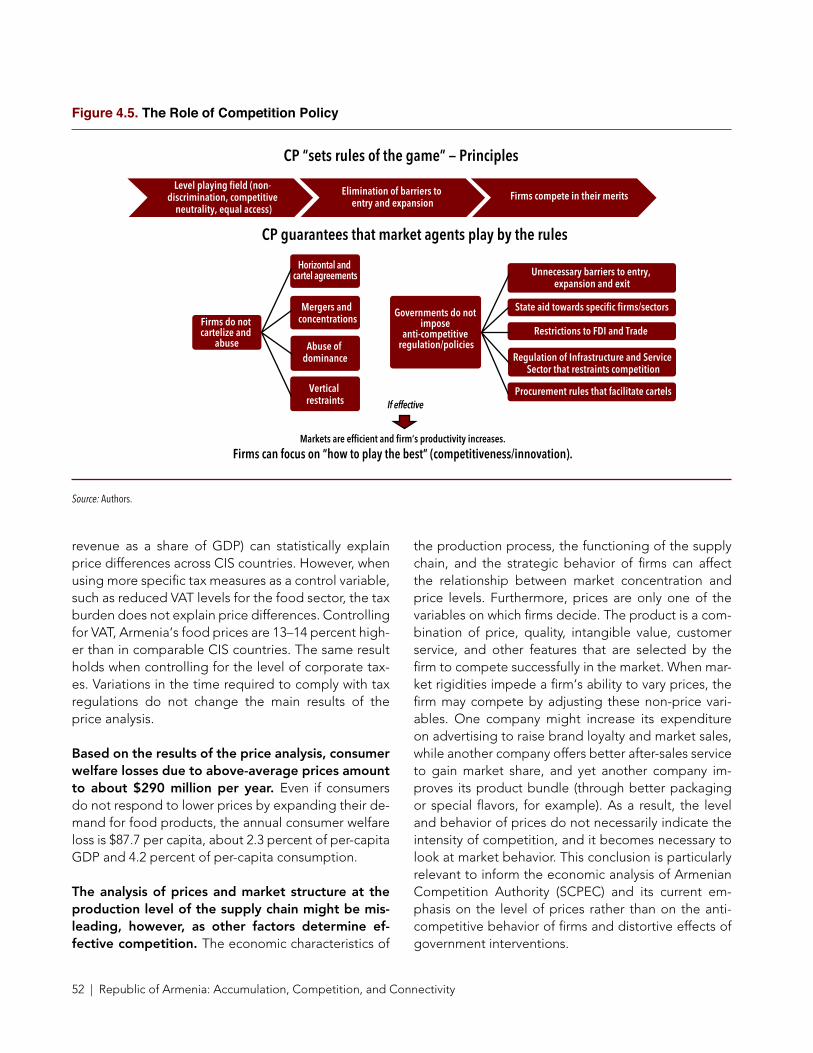
52 | Republic of Armenia: Accumulation, Competition, and Connectivity
revenue as a share of GDP) can statistically explain price differences across CIS countries . However, when using more specific tax measures as a control variable, such as reduced VAT levels for the food sector, the tax burden does not explain price differences . Controlling for VAT, Armenia‘s food prices are 13–14 percent high-er than in comparable CIS countries . The same result holds when controlling for the level of corporate tax-es . Variations in the time required to comply with tax regulations do not change the main results of the price analysis .
based on the results of the price analysis, consumer welfare losses due to above-average prices amount to about $290 million per year. Even if consumers do not respond to lower prices by expanding their de-mand for food products, the annual consumer welfare loss is $87 .7 per capita, about 2 .3 percent of per-capita GDP and 4 .2 percent of per-capita consumption .
The analysis of prices and market structure at the production level of the supply chain might be mis-leading, however, as other factors determine ef-fective competition. The economic characteristics of
the production process, the functioning of the supply chain, and the strategic behavior of firms can affect the relationship between market concentration and price levels . Furthermore, prices are only one of the variables on which firms decide . The product is a com-bination of price, quality, intangible value, customer service, and other features that are selected by the firm to compete successfully in the market . When mar-ket rigidities impede a firm‘s ability to vary prices, the firm may compete by adjusting these non-price vari-ables . One company might increase its expenditure on advertising to raise brand loyalty and market sales, while another company offers better after-sales service to gain market share, and yet another company im-proves its product bundle (through better packaging or special flavors, for example) . As a result, the level and behavior of prices do not necessarily indicate the intensity of competition, and it becomes necessary to look at market behavior . This conclusion is particularly relevant to inform the economic analysis of Armenian Competition Authority (SCPEC) and its current em-phasis on the level of prices rather than on the anti-competitive behavior of firms and distortive effects of government interventions .
Figure 4.5. The Role of Competition Policy
CP guarantees that market agents play by the rules
CP “sets rules of the game” — Principles
Level playing field (non- discrimination, competitive
neutrality, equal access)
Elimination of barriers to entry and expansion
Firms compete in their merits
Firms do not cartelize and
abuse
Horizontal and cartel agreements
Mergers and concentrations
Abuse of dominance
Vertical restraints
Governments do not impose
anti-competitive regulation/policies
Unnecessary barriers to entry, expansion and exit
State aid towards specific firms/sectors
Restrictions to FDI and Trade
Regulation of Infrastructure and Service Sector that restraints competition
Procurement rules that facilitate cartels
Markets are efficient and firm’s productivity increases.Firms can focus on “how to play the best” (competitiveness/innovation).
If effective
Source: Authors.

Competition | 53
The Competition Policy Framework An effective competition policy framework levels the playing field for all firms, facilitates entry of new firms, and penalizes anticompetitive behav-ior (Figure 4.5). The competition policy framework comprises of policies and laws that ensure that com-petition in the marketplace is not restricted in such a way as to reduce economic welfare . In practical terms, competition policy usually involves the enforcement of antitrust laws (typically rules against abuse of dom-inance and anticompetitive agreements, and mergers regulation) and the promotion of measures to enable firm entry and rivalry, typically called competition ad-vocacy . The former is targeted at firms, while the latter involves government bodies . One of the most import-ant components of a successful competition policy is ensuring that government policies do not generate unnecessary barriers to entry or distort the playing field by favoring specific firms .
Properly enforced competition policy does not target firm size but threats to—and actual distor-tions of—the competitive process and resource al-location. Concentration of ownership in itself is not necessarily anti-competitive . Competition policy be-comes important in cases where a firm that exhibits significant market power (in that it has the ability to raise prices above a marginal cost) acts in ways that distort the playing field, with potential harmful effects on consumers . This is more likely to be the case if consumers cannot substitute with other products or suppliers in the event of a price increase . Competi-tion policy must take into account the technological characteristics of markets, as there can be instances
in which consumers prefer concentrated markets with a small number of firms because of network exter-nalities . For instance, many communications and in-frastructure services such as telephones and railways exhibit network externalities .
The competition policy framework can bring sub-stantial economic gains by promoting competition. Analysis of the competition policy framework is based on two complementary pillars: (i) opening markets to entry and competition by addressing sector specific constraints; and (ii) effective enforcement of competi-tion policy (Table 4 .5) . Both pillars rely on an effective institutional set up that is able to foster and guaran-tee healthy market conduct . In developing countries, experience shows the importance of de facto inde-pendence and autonomy of decisions of the competi-tion authority . An institutional emphasis on promoting competition, rather than consumer protection issues, seems to play a crucial role in driving total factor pro-ductivity growth .
Enforcement of competition policy and law can gradually trigger positive changes in market struc-ture and reduce concentration. Effective control of mergers can prevent concentrations which stifle com-petition . Meaningful enforcement of antitrust law will discourage behavior that hampers competition . Ad-dressing and tackling cartel behavior will also deter harmful anticompetitive behavior . Even if pro-com-petitive regulations are implemented, they need to be complemented by effective enforcement of competi-tion rules .
Table 4.5. A Comprehensive Competition Policy Framework
Opening Markets and Removing Anti-competitive Sectoral Regulation Enforcing Competition Law and Rules
Remove restrictions to the number of firms, statutory monopolies or bans towards private investment
Eliminate controls on prices and other market variables that increase business risk
Guarantee a level playing field and non-discriminatory treatment against certain firms
Tackle cartel agreements that raise the costs of key inputs and final products
Prevent anticompetitive mergers
Strengthen antitrust framework to combat anticompetitive conduct
Control state aid to avoid favoritism and ensure competitive neutrality
Source: Kitzmuller, M. and Licetti, M, “Competition Policy: Encouraging Thriving Markets for Development” Viewpoint Note Number 331, World Bank Group Financial and Private Sector Development Vice Presidency, August 2012.

54 | Republic of Armenia: Accumulation, Competition, and Connectivity
A level playing field needs to be guaranteed among all market participants. Competitive neutrality occurs when no entity operating in a market is subject to un-due competitive advantages or disadvantages . The rationale for pursuing competitive neutrality is both political and economic . The main economic rationale is that it enhances allocative efficiency throughout the economy—where economic agents (whether state-owned or private) are put at an undue disadvantage, goods and services are no longer produced by those who can do it most efficiently . Governments should be universal regulators and ensure that economic actors are ‘playing fair’, including where state-owned corpo-rate assets are concerned and vis-à-vis other market participants, while also ensuring that public service ob-ligations are being met .63
The price analysis for food products indicates that some markets with only one player have low-er prices and some with many competitors have higher prices (Figure 4.5). There is a range of po-tential explanations for this observation . Structural barriers such as economies of scale may play a role . Concentration of suppliers often follows in markets where economies of scale exist . In fact, one large competitor may have a more efficient cost structure and may offer lower prices relative to a market with more competitors . Higher prices for final products may be associated with market conditions in input markets . In the bread market, for example, prices are higher relative to CIS counterpart countries despite a significant number of market players . This may be the result of many competitors in the market facing the same constraints: higher regulatory costs or high-er input prices . Lower prices, on the other hand, do not necessarily indicate the absence of competitive concerns but may instead point to strategic firm be-havior . Finally, concentrated markets can still register high levels of competition in the absence of barriers to entry (as in the case of mobile telecommunications operators worldwide), while significant market power can still be exercised in markets with more competi-tors due to anticompetitive behavior .
The SCPEC is charged with managing Armenia’s competition policy framework, but faces some
63 OECD (2012) . “Competitive Neutrality . Maintaining a level playing field between public and private business” .
important institutional challenges in achieving this mandate. The SCPEC‘s role is to enforce competition rules, deter anticompetitive behavior, ensure that state aid to firms does not distort competition, and advo-cate and promote a broader understanding of com-petition rules and benefits . Yet the agency has faced institutional obstacles to addressing deficiencies in the current competition framework .
Armenia’s National Assembly enacted meaning-ful amendments to the Competition Law and re-lated legislation in 2011, but these changes were incomplete (box 4.1). The new framework gives a clear mandate to tackle discriminatory treatment at the hands of government officials and potentially distortive state aid . However, several aspects of the legal framework continue to limit the effectiveness of its implementation, particularly concerning the as-sessment of market dominance, the structure of fines, mergers and concentrations, an extreme focus on price levels rather than anticompetitive conduct, and the SCPEC‘s lack of investigative powers . A proposal for useful amendments to the law submitted by the SCPEC was modified during parliamentary approval, however, eliminating or minimizing the effect of key recommendations .
In the case of market dominance, the competition policy framework does not take into account the contestability of markets and market evolution over time. The definition of dominance is based on the possibility that a firm could act independently of com-petitors, consumers, and other market participants . In Armenia’s law, however, the assessment of dominance is based on a static definition of market shares at one period of time . Though market shares are the first step in analyzing market structure, they are usually comple-mented by an analysis of entry barriers in assessing market dominance . Market shares and concentration are more relevant if they have been stable over time, as a firm’s ability to retain market share after increasing its prices relative to rivals offers a better indicator of market power than a snapshot of market shares alone . High concentration with significant changes in market shares over time would be less of a cause for concern . However, this dynamic approach is not considered in the current version of the law . In addition, the threat of potential entry is a factor that is disregarded under the current practice .

Competition | 55
Box 4.1. Review of the current draft of the amendments to Armenia’s Competition Law
Article 4: Definitions
Notion of independence is still not part of the definition of economic entity for the purpose of merger control
Article 5: Anticompetitive Agreements
A. Remains the lack of precision concerning the criteria for assessing anticompetitive agreements (horizontal and vertical)
B. Vertical agreements are still unlawful even if none of the participants has market power.
Article 6: Monopolistic or Dominant Position
C. Absence of potential competition and temporal criteria from the definition of dominant position
D. Low threshold for determining dominance
E. Dominance scenarios are based only on quantitative factors (market shares alone do not determine dominance)
F. Contradictory thresholds for determining dominance based on market shares
Article 7: Practices related with prices
G. The Law still includes unjustified increase of prices as a case of dominant position
H. The Law still states unjustified decrease of prices as a case of dominant position
I. The Law still states unjustified maintenance of price as a case of abuse of a dominant position
Chapter 4: Concentrations
J. Definition of concentration is not exclusively based on change of control and it is over inclusive
K. In case of acquisitions of shares or assets the seller is still treated as participant in the concentration
L. The threshold to notify an economic concentration is not fixed
Article 36: Definition and amount of fines
M. Still inconsistent treatment of fines in some cases (no differentiation between penalties applied for infringing administrative procedures and those for anticompetitive behavior)
N. The treatment of infringements should be according to the seriousness of the offense
O. Differentiate penalties when they are applied against firms and individuals, respectively
P. Penalties against individuals are not included (although the criminal law covers this case, but it is essential to ensure harmonization of any conflicting provisions)
Q. Leniency provisions still: (1) offer immunity regardless of whether the applicant has been the leader or the instigator of the anticompetitive behavior (a leniency program should only offer financial penalties reductions for leaders and/or instigators); (2) do not define whether the applicant to lenient treatment can request guarantee of confidentiality; and (3) not clarify whether the competition law only fines or also initiates criminal prosecution against the members to an agreement and their directors, officials, etc.
Source: WBG Competition Policy Team analysis.

56 | Republic of Armenia: Accumulation, Competition, and Connectivity
Treatment of Economic Groups
The Competition Law introduced important pro-visions for dealing with economic groups. Accord-ing to Article 4 of Armenia’s new Competition Law, the definition of an economic entity64 encompasses the concept of a ‘group of persons,’ itself defined as ‘a group of legal entities and/or individuals which act through concerted actions based on common eco-nomic interest and/or with respect to which at least one of 14 conditions is met’ (Table 4 .6) . This key fea-ture was introduced recently . While the recent draft amendments improve the definition of group of per-sons,65 they do not provide the explicit definitions of independence and concept of control .66
However, the law and its secondary legislation will need to introduce a number of additional clarifica-tions:
¾ The treatment of economic groups, the assessment of direct and indirect control of firms with owner-ship links, and a definition of an ‘economy entity’ .67
¾ A definition of independence, including that the economic entity is entitled and has powers to de-fine its competitive strategy without interference or influence from another economic entity .
¾ The concept of control . The concept of a group of persons in the Competition Law does not explicitly contemplate the notion of control as the basis for the existence of the group .
64 An economic entity is defined as follows: patent fee pay-er, individual, entrepreneur, legal person, other entity, its rep-resentative, representative office or branch, group of persons, commercial network . For concentrations stipulated in this law, natural persons are also treated as economic entities .
65 The recent draft amendments clarify that "the Commission shall be entitled not to consider a group of legal and (or) natural persons as a group of persons within the meaning of this Law, if there is no actual interconnection or control between the legal and (or) natural persons" .
66 Neither these concepts are explicitly included in other rel-evant articles (including articles on monopolistic or dominant position and concentrations of economic entities) .
67 Only reorganizations among firms that depend totally on the control of an individual or a legal entity do not constitute concentrations . Conversely, reorganizations between two firms that do not depend on the total control of the same individual/legal entity should be deemed a concentration, as this reorgani-zation could imply a relevant change in the character of control over these firms .
In order to be able to define economic entities for the implementation of the Competition Law, the SCPEC needs to have access to ownership infor-mation for the companies under investigation. This will require maintaining information channels with the State Registry, Credit Registry, and Central Depository . Memoranda of understanding that define protocols for gaining and granting access to information managed by other entities could be a useful tool in this regard .
Table 4.6. Importance of Defining an “Economic Entity” for the Implementation of the Competition Law
Element of the Competition Law Importance of defining “economic entity”
Merger control Identify when concentration is taking place, since it can be argued that merging parties are already part of a single economic entity.
Assess the unilateral and coordinated effects of mergers by correctly identifying the extent of the economic entity.1
Abuse of dominance
Assess market dominance by correctly identifying all the activities undertaken by the economic entity
Restrictive practices (anticompetitive agreements)
Identify separate economic entities in order to be able to assess the anticompetitive effects of agreements, since it can be argued that agreements take place within a single economic entity
Source: Authors.Note: 1 Unilateral effects include the possibility of exercising significant market power by one firm. Coordinated effects refer to the likelihood that a merger would facilitate collusive behavior among competitors.
Merger Control Procedures
The introduction of simplified merger notification procedures and the revision of current thresholds for merger notification would improve the effective-ness of merger control policy. Merger reviews should be designed in such a way that the costs for govern-ment and businesses are proportionate (Table 4 .7) . If not appropriately designed, merger reviews can dis-place investigations on actual anticompetitive behav-ior, thus reducing the effectiveness of the competition framework . Overly burdensome information require-ments, long review processes, and an unclear and broad scope of merger reviews would increase admin-istrative costs, and business risks .

Competition | 57
Enforcement of Competition
The current structure of fines and sanctions and SCPEC’s investigative powers are too limited to deter anticompetitive conduct. International best practice suggests that sanctions for severe anti-competitive conduct such as price fixing and mar-ket allocation agreements among competitors are most effective if set at about 10 percent of a firm‘s turnover . In Armenia, fines represent, on average, a maximum of 1 .5 percent of the average turnover of the 100 largest taxpayers . Moreover, the response to infringements is not commensurate with the serious-ness of the offense, with lower penalties for cartel be-havior than for less severe transgressions . Compared to other competition agencies around the world, the SCPEC’s lack of power to investigate anticompetitive practices limits its ability to detect anticompetitive conduct . Currently, the SCPEC is drafting secondary legislation on fines guidelines to provide clarity on the fines calculation methods and take into account the nature of the anticompetitive conduct, its severi-ty and duration .
It would be beneficial to refocus the SCPEC’s imple-mentation of competition policy from price moni-toring to market contestability. The SCPEC used to keep a registry of dominant firms identified using its limited definition of dominance based on rigid market
shares .68 In some cases, markets are defined narrow-ly (for example, cigarettes with and without filters are separated into two markets, another example is a sep-arate market for juices predominantly consumed by children) . At the same time, this registry had diverted the attention of staff away from more effective means to detect anticompetitive conduct while burdening firms with an additional reporting requirement . It is therefore possible that some of the firms registered by the SCPEC would not be seen as dominant according to international standards, and vice versa .
Other factors besides prices need to be considered in determining whether firms are exerting signifi-cant market power. A competition agency should determine whether or not anticompetitive conduct has happened and is feasible given market conditions, including entry conditions and level of market contest-ability . The level of prices can fluctuate because of de-mand and supply conditions .
It would be desirable that SCPEC focus its operation-al activities more the typical determinants of dom-inance, some of which are included in the current
68 According to the SCPEC, the new provision on eradication of the register of dominant firms is envisaged in the draft law presented to the RA Government .
Table 4.7. Elements For Designing Merger Control Policies
Components Key areas
1. Defining transactions that will be evaluated
Voluntary or mandatory, ex-ante or ex-post notification.
Definition of economic concentration: definition of control and change in control, types of transactions.
Thresholds for merger notification: variables, values, and calculation method.
2. Establishing formal procedures for merger review
Timeframe: time limits, staggered process (phases for less and more complex cases).
Required documentation and confidential treatment of information.
Required payments: calculation of merger filing fees.
Due process: transparency, consistency, accountability.
3. Setting the economic framework for analysis
Criteria for evaluating potential anticompetitive effects: unilateral and coordinated effects.
Treatment of efficiencies, pass through to consumers and compensation of anticompetitive effects.
Criteria to set remedies or conditions that can remove anticompetitive concerns.
4. Addressing institutional constraints
Availability of resources to conduct merger review.
Optimization of organization structure for effective enforcement.
Source: Authors.

58 | Republic of Armenia: Accumulation, Competition, and Connectivity
Law. In particular, Article 6 (2) mentions, for example, that an economic entity shall be considered as having dominant position on product market if it has market power on the given product market, in particular, does nor encounter any significant competition as a seller or acquirer, and (or), based on its financial standing or oth-er qualities, has the opportunity to have decisive influ-ence on the general product turnover in the given prod-uct market and (or) oust other economic entity out from the given product market and (or) impede the entry into the given product market . (Table 4 .8) presents examples of other variables that are useful for evaluating the exis-tence of a dominant firm in a product market .
Competition Advocacy
The SPEC does not have all the necessary instru-ments to pursue advocacy vis-à-vis sector regula-tors and other government bodies. A systematic
application of the well-recognized methodologies, such as the OECD competition assessment toolkit69 to the examination of the existing and draft regulations can be beneficial . Currently, SCPEC‘s record in issuing opinions on anticompetitive sector-level regulation to other government bodies is limited . According to the SCPEC, the Commission identifies existing anticom-petitive policies based on complaints from different stakeholders (e .g . business societies, unions, cham-bers of commerce) . The Law on the Legal Acts pro-vides a framework to examine the impact of proposed laws and regulations on market competition .70 If a draft is relevant to competition, SCPEC is obliged to carry out a regulatory impact assessment of the implemen-
69 http://www .oecd .org/competition/assessment-toolkit .htm .
70 Law of the Republic of Armenia on Legal Acts . Adopted on 3 April 2002 .
Table 4.8. Competition Indicators for Select Markets
Indicator Bread production Flour productionSugar import and production
Ground transportation of imported bulk cargo
Number of companies High (500+) High (51)
Increased (43 in 2006)
Low (6)
Declined (21 in 2006)
High in road transport
(80+), low in railways (1)
Market share of largest player
NA 47.3 99.9% 67.0%
Concentration Low
(<100)
High
(3459)
High
(9980)
High
(about 4500)
Consumer/user prices High compared to other countries
Asymmetric pass-through of flour prices to bread prices
High compared to other countries
Asymmetric pass-through of flour prices to bread prices
Low compared to other countries
Asymmetric pass-through of flour prices to bread prices
High compared to other countries
Quality and product variety High product variety Medium product variety Low product variety Low quality of service compared to other countries
Concerns related to vertical relationships
Low Medium High Medium
Strategic conduct None Perception of the existence of customs benefits for selected market participants
Potential price squeezing
Strategic investments to preempt entry
Horizontal agreements
Lower tariffs in segments that face competition (containers) and higher tariffs for bulk cargo
Barriers to entry Low Medium
Entry observed in 2010
High Low for road transport, high for railways
Level of competition High Limited Strongly limited Limited
Source: Authors

Competition | 59
tation of proposed draft and submit a report with the potential effects on competition to the body elabo-rating the draft . However, SCPEC‘s opinions are not binding in nature, and there is limited monitoring of their effects . Lack of clearly defined competition-relat-ed advocacy powers may constrain the effectiveness, and ultimately the impact, of policy advocacy to open markets to competition .
The SPEC has signed protocols with public institu-tions (e.g. sector regulators,) in order to foster col-laboration and coordination between institutions that could constitute a key mechanism to improve competition in markets. For example, SCPEC and PSRC, Armenia’s sector regulator for energy, water and telecommunications markets, have signed a mem-orandum of understanding that provides a general framework of cooperation; however it is not focused on specific market regulation . One aspect that the SCPEC could evaluate is to include in these Protocols specific ways of cooperation that will lead to signifi-cant improvements in market conditions . For instance, the SCPEC in coordination with the sector regulator or public authority could commit to review the regulato-ry framework in order to introduce regulatory reforms that promote competition or increase the quality of regulated services . Some protocols will benefit from moredefined rules and provisions regarding their im-plementation (e .g ., the type of information exchanged, criteria for participation in joint assessments) . Likewise, protocols with procurement officials could help detect and identify bid rigging practices .
State Aid Regulations
governments often provide a variety of subsidies and direct aid to firms. State aid and subsidies can be implemented to address market failures, support edu-cation, foster innovation and promote green technolo-gies to preserve the environment, and others . However, targeted aid toward specific firms may result in signif-icant distortions to market competition . Privileges for specific types of firms can damage long-term private sector development, because they bestow these firms with a comparative advantage over their competitors, which is not necessarily associated with their efficiency .
State aid comes in many forms. Measures may in-clude subsidies, debt write-offs or takeover of losses,
exemptions, reductions, or deferrals of fee and tax payments, guarantees, and preferential granting of loans . Support can also involve providing economic advantages—for example, allowing a firm to buy or rent publicly owned land at less than the market price or giving a firm privileged access to infrastructure with-out charging a fee .71 General measures are not regard-ed as state aid because they apply to all companies regardless of their size, location, or sector .
State aid needs to be controlled to limit the nega-tive effects on competition. Control of state aid typ-ically includes: (i) relevant criteria for identifying state aid measures; (ii) application of exemption rules in specific sectors; (iii) assessment of prohibited state aid and its potential impact on competition; and (iv) defi-nition of characteristics of the enforcement procedure . Armenia’s current competition law includes provisions on the control of state aid, but the scope needs to be expanded to ensure effective enforcement .
The Armenian government has implemented a number of measures to support economic entities, but the selection process lacks clear criteria to an-alyze impacts on competition. State aid has consist-ed of deferral of tax payments, subsidies, guarantees, government loans, and subsidies for interest pay-ments . Business projects that satisfy certain criteria can benefit from government support programs, in-cluding both financial and technical assistance . Project selection criteria include: (i) the potential contribution to regional development; (ii) the creation of new jobs; (iii) export orientation; (iv) an innovative approach; (v) the adequacy of skills and employee know-how; and (vi) low risk . The government’s website publishes a list of requirements, selection criteria, and a scoring sys-tem for potential beneficiaries,72 but potential distor-tions to competition are not considered . Aid has been given to companies operating in construction, metals, and mining sectors .
The definition of the scope and purpose of state aid in Armenia’s legislation needs to be strength-ened. It would also be beneficial for the scope and purpose of state aid to be explored in greater detail in
71 EC Directorate-General for Competition, 2008 .
72 http://www .gov .am/files/docs/469 .pdf

60 | Republic of Armenia: Accumulation, Competition, and Connectivity
Policy RecommendationsThe analyses of ownership and competition iden-tified several bottlenecks to the development of a healthy competitive environment in Armenia. Considering the current market structure, which is characterized by concentration and vertical integra-tion, and ownership links in the economy, special attention needs to be paid to limiting potential an-ticompetitive behavior and ensuring a level playing field . In general terms, recommendations encom-pass pro-competitive regulations and measures to improve the effectiveness of the competition policy framework .
There is significant scope to achieve efficiency gains from pro-competitive sector policies and more ef-fective economy-wide competition policy enforce-ment. Removal of barriers to entry and competition is particularly warranted . In addition, competition prin-ciples need to be fully mainstreamed within broader government policies . Finally, improvements to the an-titrust and state aid framework will complement mea-sures to reduce restrictive product market regulation . Reform areas are outlined below .
¾ Improve the competition environment in trans-portation (airlines and railroads). The removal of restrictions in the number of firms that can partici-pate in the market as well as regulatory protection to incumbent firms would foster competition . In the case of railways, improvement of open access
secondary legislation . Armenia’s competition law en-titles the entity initiating the provision of state aid or the economic entity applying for aid to apply to the SCPEC to receive its conclusion prior to provision of aid or applying for such aid .
An analysis of the beneficiaries of government sup-port indicates the patterns of state aid. Large com-panies account for 68 percent of the loans granted by the government . Two companies in particular received significant credit support . Three other companies ac-count for a sizeable portion of outstanding tax arrears (Table 4 .9) .
Transparency regarding state aid and government support could be improved. Even if the Armenian government has decided to support specific sectors, it is recommended to follow the principles of trans-parency and non-discrimination in the granting of state aid . An inventory of current state aid schemes, particularly in sensitive sectors such as construction, transportation and food processing, would help iden-tify their potential impacts on competition and trade . The inventory should include the list of the state aid grantors, as well as the amount, type, and recipient of state aid . Acknowledging this requirement, SCPEC has initiated the creation of an inventory of state aid but it does not have the formal authority to require all the government bodies to provide such information, which may represent a limitation on its state aid mon-itoring activities .
Table 4.9. Example of Direct and Indirect Support to Firms
Company Sector State aid typeState aid (in million
US dollars) Importance
Copper Molybdenum Factory of Zangezour Production of black and nonferrous metals
Loans as of end 2009 15.00 34% of loans in 2009
Armenian Molybdenum Production Production of metal goods Loans as of end 2009 15.00 34% of loans in 2009
Armavia Air Company Air transport Tax arrears as of end 2009
0.18 4.48% of total tax arrears in 2009
Mika Cement Manufacturing of cement Tax arrears as of end 2010
0.78 1.61% of total tax arrears in 2009
Ararat Cement Manufacturing of cement Tax arrears as of end 2011
0.46 0.95% of total tax arrears in 2009
Source: Government of Armenia, 2011.

Competition | 61
Box 4.2. EU Assessment Methodology and Checklist to Ensure That State Aid is Non-distortionaryThe EU uses a balancing test for the assessment of compatibility of state aid. This test is based on the assessment of both the positive effects of state aid, such as contributions to the achievement of a well-defined objective of common interest, and its negative effects, including the distortion of competition and trade. Aid will be compat-ible only if it is necessary and proportional to achieve a particular objective of common interest. The main ele-ments of the balancing test are listed below:
§§ Well-defined objective of the common interest. Aid should be aimed at a well-defined objective of common interest (such as growth, employment, cohesion, or environmental protection). This includes the assessment of both efficiency (correcting a market failure, including externalities, imperfect information, and coordination problems) and equity (measures such as employment of disabled workers or setting up factories in disadvan-taged regions).
§§ Well-designed instrument. Ascertaining that the aid is well designed to deliver the objective identified above involves evaluating the counterfactual scenario in which aid is not granted. This evaluation includes the follow-ing criteria:
§� Appropriateness: state aid should be used where the advantages of using a selective instrument (such as state aid) are established and demonstrated;
§� Incentive effect: state aid should not be granted for activities the beneficiary would still carry out to the same extent if the aid were not granted; and
§� Proportionality: the amount and intensity of the aid should be limited to the minimum necessary to tackle the identified problem.
§§ Balancing of the positive and the negative effects. The possible negative effects of the aid (distortive effects on competition and trade) and their magnitude should be sufficiently offset by positive effects. The impact of both effects is expressed in qualitative and, if possible, quantitative terms. The overall outcome depends on several characteristics of the proposed aid measure and is assessed on a case-by-case basis for measures subject to the detailed assessment.
Roller et. al. (2010) propose the following checklist for evaluating state aid from an economic point of view:
§§ Does aid qualify as State Aid?
§� Is the aid (for example, grants, interest and tax relief, guarantees, government holdings of all or part of a company, or the provision of goods and services on preferential terms) funded by state resources?
§� Does the funding provide an advantage to a firm?
§� Is the funding available only to a select number of firms?
§� Is there a potential or real distortive effect on competition and trade?
§§ Are investors aware of state aid schemes?
§� Is there an inventory of state aid schemes publicly available? Who are the main beneficiaries?
§� Is the process for granting state aid clear and transparent?
§§ Is aid available to all market participants?
§§ Are there any mechanisms for monitoring compliance and illegal state aid?
§§ Have aid schemes led to the desired outcomes?
Sources: European Commission, Roller et. al (2010).

62 | Republic of Armenia: Accumulation, Competition, and Connectivity
regulations for railway transportation, adequate tariff regulation in non-competitive services such as bulk cargo transportation, and institution-al measures to strengthen regulatory oversight would support a competitive environment .
¾ Eliminate barriers to competition in profession-al services. Reforms in professional services would have three main objectives: (i) increasing produc-tivity by allowing entry and competition across professional services; (ii) incentivizing competitive and efficient pricing; and (iii) lowering costs to us-ers of professional services across the economy .
¾ Improve competition in electricity and gas mar-kets. The measures should include review of third party access policies as well as opening the retail market to entry of new firms in both sectors .
¾ Refrain from introducing restrictive regulation in the retail sector. If proposed regulations of the sector are adopted, they should not impose restrictions to the development of retail business, especially because the latter may reduce efficien-cies, productivity gains and potential for employ-ment creation in the sector .
¾ Increase the effectiveness of the competition framework and its implementation. Specific amendments to the competition law and its en-forcement could be aimed at clarifying the defini-tion of economic entities, anticompetitive agree-ments and market dominance, updating the cri-teria to determine the existence of a dominant firm, strengthening the investigation powers of the agency and improving the structure of and criteria for imposing fines . They would also define the con-cepts of independence and control in relation to an economic entity . From the implementation point of view, the SCPEC needs to move away from focusing on price fluctuations in favor of focusing on actual and potential barriers to entry and contestability . Greater attention to market conditions may allow the competition authority to focus on markets that are more prone to restrictive practices .
¾ Pursue advocacy activities to tackle anticompet-itive government interventions and regulations that harm the development of competition. By strengthening the SCPEC’s advocacy man-date, it would be able to prevent and address any
potential competition distortions in key sectors of the economy (such as infrastructure or profession-al services) public procurement and open markets to competition . The SCPEC could also help to de-ter the enactment of anticompetitive regulation by increasing the awareness of other government agencies and regulators on the distortive effects of specific regulatory provisions . Working closely with other sectoral regulators will also avoid over-lap of competencies in the competition space and tackle more effectively anticompetitive regulation .
¾ Strengthen the state aid provisions and their enforcement to minimize potential distortive effects on competition. The introduction of a comprehensive state aid framework could ensure a level playing field for firms and avoid the use of public funds to support distortive schemes that would discourage the entry of new investors . This approach would redirect aid to economy-wide ob-jectives, such as R&D and innovation, risk capital, training, renewable energy/climate change and other measures for the protection of the environ-ment . Setting up a state aid inventory will help en-sure transparency and accountability in the use of public funds .
¾ Introduce transparency and access to data to guarantee competitive neutrality between mar-ket participants to avoid market distortions. As a start, ensuring transparency and access to data for competition enforcement and state aid control is needed . The SCPEC can play a key role in in-creasing public awareness on the anticompetitive effects of government interventions while making its decisions and opinions public in a systematic way . Such reforms would also foster a more pre-dictable and transparent business environment . In the medium term, the Armenian Government could evaluate the design and adoption of a comprehensive regulatory framework to achieve competitive neutrality among all market players . Strengthening information disclosure to unveil the advantages received by certain firms will pro-mote competition . The disclosure of three types of firm-level information is particularly important in Armenia: financial information, non-financial disclosures, and trade data .

Land Connectivity | 63
5. Land Connectivity
Previous studies have shown that exports could benefit greatly from trade facilitation measures even within the existing geopolitical constraints. A crucial aspect of enhancing the competitive-ness of Armenian exports relates to improving the transport and logistics performance on the trade corridors linking it to global markets . Shepotylo (2011) shows that moderate trade facilitation mea-sures could have increased exports from Armenia by 58 percent during 2000–07 .73 Consistent with this, Jensen and Tarr (2011) show that trade facilita-tion would provide greater gains to Armenia than would service sector liberalization or harmonizing standards .
This chapter proposes some ideas to improve Armenia’s land connectivity. The first section provides an overview of the current transit situa-tion . The second section provides a comparative assessment of Armenia’s north-south road transit options . The third section provides policy options to improve the transit situation . The observations and conclusions in this report are based on inter-views with exporters, freight forwarders, trucking companies, and government agencies during Feb-ruary–June 2012 . The study also used the World Bank’s Trade and Transport Facilitation Assess-ment toolkit .
73 The paper compares trade scenarios with actual transport costs during 2000–10 on the one hand, and hypothetically lower transport costs based on a significant reduction in the number of documents and time required to export from 2000 on the other . The trade facilitation reforms simulated from 2000 onwards were actually introduced in 2010 . The results are driven by a 150 per-cent increase in textile exports .
Landlocked Armenia has few options for trans-porting goods over land, and infrastructure and regulatory bottlenecks increase time and cost of exporting. With closed borders with Turkey and Azerbaijan, exports can only use transit corridors to the north through Georgia, and to the south through Iran . The northern route offers access to the Black Sea, while the southern route offers ac-cess to the Gulf of Oman and the Indian Ocean . On both routes, Armenia’s mountainous terrain poses additional challenges, and roads become impass-able at times in the winter season . The Upper Lars border between Russia and Georgia is closed in winter, and does not allow excisable goods even in the summer . Iran, on the other hand, closes its border to two important Armenian exports, ciga-rettes and brandy, and levies road taxes on Arme-nian trucks . Much of Armenian trade therefore uses Black Sea ferries, although they are perceived as unreliable and costly .
While Armenia can’t change its geography and breakthroughs in the geopolitical constraints will take time, the government could engage more with its neighbors and sign international treaties to facilitate trade. Bilateral trade agree-ments could speed up trade and lower costs, in particular with Iran, while discussions with Geor-gia would focus on enhancing road capacity, and creating dedicated facilities at the Poti port . Rat-ifying all relevant international conventions could increase Armenia’s leverage over transit partners . In particular, signing the UN Convention on Transit Trade of Landlocked States could put Armenia in a better position to defend its rights with regard to free transit of goods .
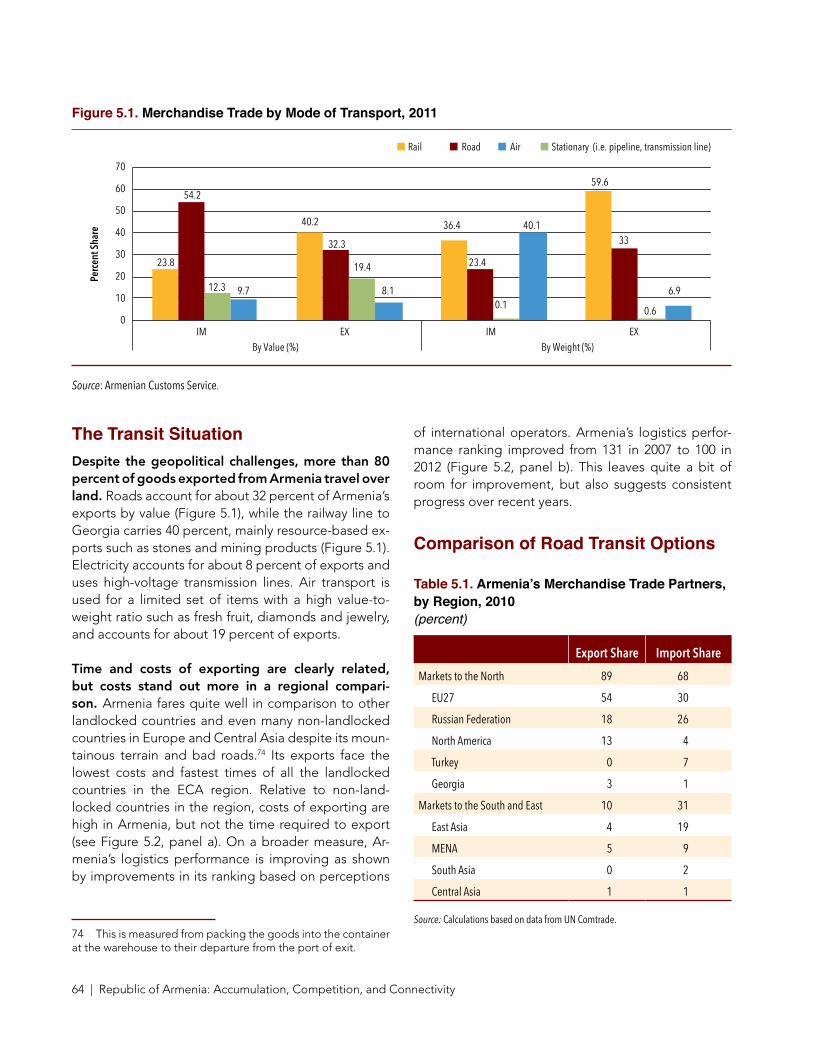
64 | Republic of Armenia: Accumulation, Competition, and Connectivity
Figure 5.1. Merchandise Trade by Mode of Transport, 2011
23.8
40.2 36.4
59.6 54.2
32.3
23.4
33
12.3
19.4
0.1 0.6
9.7 8.1
40.1
6.9
0
10
20
30
40
50
60
70
IM EX IM EX By Value (%) By Weight (%)
Perc
ent S
hare
Rail Road Air Stationary (i.e. pipeline, transmission line)
Source: Armenian Customs Service.
The Transit SituationDespite the geopolitical challenges, more than 80 percent of goods exported from Armenia travel over land. Roads account for about 32 percent of Armenia’s exports by value (Figure 5 .1), while the railway line to Georgia carries 40 percent, mainly resource-based ex-ports such as stones and mining products (Figure 5 .1) . Electricity accounts for about 8 percent of exports and uses high-voltage transmission lines . Air transport is used for a limited set of items with a high value-to-weight ratio such as fresh fruit, diamonds and jewelry, and accounts for about 19 percent of exports .
Time and costs of exporting are clearly related, but costs stand out more in a regional compari-son. Armenia fares quite well in comparison to other landlocked countries and even many non-landlocked countries in Europe and Central Asia despite its moun-tainous terrain and bad roads .74 Its exports face the lowest costs and fastest times of all the landlocked countries in the ECA region . Relative to non-land-locked countries in the region, costs of exporting are high in Armenia, but not the time required to export (see Figure 5 .2, panel a) . On a broader measure, Ar-menia’s logistics performance is improving as shown by improvements in its ranking based on perceptions
74 This is measured from packing the goods into the container at the warehouse to their departure from the port of exit .
of international operators . Armenia’s logistics perfor-mance ranking improved from 131 in 2007 to 100 in 2012 (Figure 5 .2, panel b) . This leaves quite a bit of room for improvement, but also suggests consistent progress over recent years .
Comparison of Road Transit Options
Table 5.1. Armenia’s Merchandise Trade Partners, by Region, 2010(percent)
Export Share Import Share
Markets to the North 89 68
EU27 54 30
Russian Federation 18 26
North America 13 4
Turkey 0 7
Georgia 3 1
Markets to the South and East 10 31
East Asia 4 19
MENA 5 9
South Asia 0 2
Central Asia 1 1
Source: Calculations based on data from UN Comtrade.

Land Connectivity | 65
Armenia’s two transit options—georgia and Iran—give access to very different markets. The biggest factor in corridor choice is therefore location of destina-tion market . Most of Armenia’s exports go to countries to the North and West, which makes Georgia by far the more important route (Table 5 .1) . Only 10 percent of exports reach markets in East Asia, MENA, South Asia and Central Asia, consistent with the minimal use of the southern corridor through Iran (Table 5 .1) . Be-yond this, however, even when it might be preferable to transit through Armenia’s southern corridor, often this does not happen, even with respect to goods to or from Asia . In fact, the southern route sees so little traf-fic that freight forwarders are usually not familiar with it . The reasons will be described later in this chapter .
There is a large potential for increasing trade with countries to the South and East of Armenia. Table 5 .2 shows bilateral trade complementarity indi-ces based on the disaggregated trade shares of Arme-nia and relevant trading partners . Germany and Russia are included as current trading partners . Georgia and Iran are included as they are transit partners and po-tential trading partners . China and India are two im-portant global growth poles and represent potential sources of expanding trade . Relative to other export-ers, Armenia’s exports are not as complementary to the imports of the countries shown here, but there are important variations . In particular, Armenia exports are more complementary with both India and China than with Germany and Russia, yet currently Germany and
Figure 5.2. Armenia Trade and Transport Facilitation Performance, 2007–2012
a: Time vs. cost to export, 2012
Armenia
Azerbaijan
Kazakhstan
Kyrgyz Republic
Macedonia Moldova
Tajikistan
Uzbekistan
Belarus
Kosovo Serbia
Albania BiH
Bulgaria Croatia Georgia
Latvia Lithuania Montenegro
Romania
Russian Federation
Turkey
Ukraine
0
1,000
2,000
3,000
4,000
5,000
0 10 20 30 40 50 60 70 80 90
Cost
to E
xpor
ts ($
per
cont
aine
r)
Time to Export (Days)
Landlocked ECA Other ECA Linear (Landlocked ECA) Linear (Other ECA)
b: Logistics performance index
131
78
111
93 103 100
77
112
0
20
40
60
80
100
120
140
Armenia Georgia Iran
Glob
al R
ank
2007 2010
2012 2007
2010 2012
2007 2010
2012
Source: World Bank Doing Business Indicators, 2012; World Bank LPI, 2012.

66 | Republic of Armenia: Accumulation, Competition, and Connectivity
Russia take much greater share as markets for Armenia . In addition, it is important to note that, out of these countries, the import structure of Iran has the least cor-respondence with the exports of Armenia, which limits trade between the two neighbors . There seems to be greater potential, however, for Iran to serve as a transit country for Armenian goods, or perhaps, for Armenia to serve as a transit country for exports to Iran from Russia or Georgia .
Transit through Georgia
Traders are overall positive about the ease with which they can move goods to georgian ports. They highlight improved border infrastructure, customs per-formance, road conditions and unofficial payments . The main Georgian port Poti, can be reached from two crossings on the Armenian-Georgian border, cor-responding to two alternative roads through Georgia . Some goods are sent to the Russian border crossing at Upper Lars, rather than to the port and onto Black Sea ferries (more to the land route to Russia below) .
The georgian port of Poti is the major entry and exit point for dry goods. Poti lies on the shortest land route from Central Asia to Western Europe and has efficient rail, land and sea linkages . Poti is larger than Georgia’s other major Black Sea port of Batumi and is an all-purpose port as compared to Batumi’s fo-cus on crude oil and oil products, so Poti is integral to
initiatives to improve Armenia’s connectivity with exter-nal markets and to improve diversification of Armenia’s exports . For local traders, Poti is the port they travel to the most and therefore the route through Poti is their central concern . However, costs, time and reliability all seem to be problems, especially during certain peak times or during months of bad weather . It also does not accommodate large ships, so small feeder vessels from Istanbul as well as ferries must be used . Invest-ments to modernize and increase the capacity of Poti are underway . In addition to the higher costs of using feeder vessels, overstretched capacity at Istanbul pres-ents a bottleneck, with shipments sometimes waiting there for up to two weeks during the busy season at the end of the year . Costs incurred beyond Poti can make up almost 80 percent of the total cost of export-ing (Table 5 .3) .
Transit through georgia has been improving. Im-provements are noted in terms of border infrastruc-ture and customs performance, road conditions and lower unofficial payments . Substantial progress has been made in improving traders’ experience at the border . Customs has gradually moved to modern im-port procedures, including streamlining of control and processes, computerization, risk management and ef-fective post-release checks . Current plans for integrat-ed border management will help various government agencies present on each side of the border work more harmoniously with one another .
Table 5.2. Trade Complementarity Index, Armenia and Selected Trading Partners, 2008–10
Importers
Armenia Germany Russia China India Iran Georgia
Exporters :
Armenia 6.45 5.99 6.59 9.39 4.47 6.36
Germany 36.91 55.99 37.42 27.50 47.29 42.60
Russia 25.86 24.72 26.65 40.36 15.36 25.64
China 27.15 43.84 40.23 24.95 34.65 30.59
India 29.92 30.21 27.10 23.79 29.10 34.18
Iran 7.02 14.15 4.49 22.28 35.05 6.38
Georgia 15.98 15.67 15.33 12.07 10.79 12.62
Source: Calculations based on data from UN Comtrade; mirror data used for Iran.Note: Scale is from 0–100; Higher index reflects greater complementarity based on structure of trade at the HS six-digit level.

Land Connectivity | 67
Table 5.3. Estimated Costs to Export One Truckload: Yerevan to Moscow (via Poti)(in US dollars)
Yerevan to Poti (Inland Costs) 1000
Formulation 130
Fuel 500
Salary/per diem 270
Port Fees 100
Poti to Novorossiysk (Black Sea Ferry) 2100
Novorossiysk to Moscow (Russian Territory) 1500
Total 4600
Source: Interviews.
Most goods traveling to or from Armenia use black Sea ferries at Poti or batumi ports. They utilize the multi-modal transport offered by the roll on, roll off (Ro-Ro) services in the Black Sea . Ro-Ro ferries operate between ports in Turkey, Ukraine, Russia and Georgia . Ferries most in demand from Poti are those to Novo-rossyisk (Russia) and Ukraine (Illichysk) . There are eight vessels meant to load trucks, each vessel with a capacity to load 20–25 trucks . Ferries are a bottleneck because of the high cost, time delays and lack of reliability .
The upper Lars border crossing between georgia and Russia does not allow excise goods (Armenian brandy) and is closed in winter. This limits the avail-ability of a land route as an alternative to the Black Sea ferry system . Exporting from Yerevan to Moscow via Upper Lars is roughly 30 percent cheaper than export-ing through Poti because of ferry costs and time de-lays . However, only one Armenian trucking company
has a contract with a Georgian company to clear this route for passage during the winter months .
Transit through Iran
Transit through Iran faces challenging bottlenecks. The location of current trading partners, treacherous terrain in southern Armenia, the distance needed to reach Bandar Abbas port, and bans on some of Arme-nia’s main exports—brandy, wine, and cigarettes—all decrease the attractiveness of this route . Armenian trucks are at a competitive disadvantage because of a road tax (usually around $600 which is assessed accord-ing to both weight and distance) and fuel subsidies to Iranian trucks, and goods are therefore transferred to Iranian trucks at the border . Working with Iranian truck-ing companies is perceived as difficult because of high and unpredictable trucking rates, lack of truck traffic at needed times, and unreliable timing of delivery . On the other hand, costs for utilizing Bandar Abbas are quite low, and capacity is large .
Comparison of Georgia and Iran Transit Routes
generating a comparative assessment of road tran-sit through Iran and georgia is complicated by sev-eral factors. Volume of exports from Armenia on its own is low, as total exports constitute less than 20 per-cent of GDP . Because of this, many transport compa-nies and freight forwarders focus entirely on imports . Furthermore, exports that transit by road are less than half of overall exports . Finally, as discussed, most of this export volume by road leaves through Georgia rather than Iran, making it difficult to find freight for-warders familiar with the southern route . We therefore
Table 5.4. Ro-Ro Service Average Rates for a Full Truck(in US dollars)
Port of Shipment Port of Destination Service rate Service rate for excise goods
Poti (Georgia) Novorossiysk (Russia) 2,000 2,500
Poti (Georgia) Kerch, Ilichevsk (Ukraine) 1,700 1,700
Memoranda:
Samsun (Turkey) Novorossiysk (Russia) 800 800
Zonguldak (Turkey) Kerch, Ilichevsk (Ukraine) 1,000 1,000
Source: ICHR (2011).

68 | Republic of Armenia: Accumulation, Competition, and Connectivity
use the costs of importing in standard shipping con-tainers from China to compare the two transit options .
Despite the closer proximity to China, the ban-dar Abbas transit route is not always cheaper. As shown in the example (Table 5 .5), importing a 20-foot container from China through Iran costs about $5,000, while the same container through Poti costs about $4,000 . This is a remarkable fact considering the geography: transit through Bandar Abbas in Iran is about two weeks faster than through Poti in Georgia, according to freight forwarders interviewed for this study . The reason for the higher cost through Bandar Abbas are the poor business conditions that lead to informal payments plus the fact that export backhaul cannot be arranged easily, given the low volume of trade and switching of trucks at the Armenian border . With a larger container, much lower sea freight costs trump the above factors, making the Iran option more competitive: it is cheaper to bring a 40-feet container through Iran, rather than through Georgia . There are reasons to expect the competitive advantage of Poti to increase: the creation of the Poti free economic zone, the increasing ease of transit through Georgia, and the impact of sanctions on Iran . The sanctions create important disincentives for freight forwarders, including the lack of insurance for shipments, limited access to international shipping lines, and the inability to work with Iranian banks .
Table 5.5. Import Costs from China to Yerevan (via Bandar Abbas), 20' and 40' Containers, 2012(in US dollars)
Sea Inland Total Via Poti
20' 1,600 3,400 5,000 4,000
40' 2,000 3,400 5,400 6,500
Source: Interviews.
Logistics and Trucking Services The trucking industry in Armenia consists of 2–3 sizeable firms and a handful of smaller players. For-eign operators are present, especially Georgian, Turk-ish and Iranian firms . Fixed costs for Armenian truck-ing companies are high and they are spread over few shipments . Trucking companies complain that acquir-ing more trucks is difficult . In particular, they point out
that obtaining bank financing is difficult and rates can range up to 15 percent, and that customs duties and VAT add significant costs . Market regulation may be a factor that limits competition and raises prices . Export-ers on the other hand feel they are being overcharged by trucking companies .
Freight forwarders provide much of what Armenian exporters need but services could be more exten-sive and professionalized. Armenia ranks quite high on the logistics competence indicator in the World Bank Logistics Performance Index, with a rank of 79 out of 155 . Trucking companies are increasingly trying to provide freight forwarding services, rather than rely on third-party freight forwarders .
Shipments from different producers are rarely con-solidated into one larger shipment. Many products from smaller producers, such as handicrafts, textiles, and other products that could potentially be exported by SMEs, may not be currently exported because ship-ment costs are too high for small shipments on their own . Low scale itself makes consolidation more diffi-cult because of the time it takes to assemble enough tonnage, and the costs of having trucks wait until ful-ly loaded . Customs regulations also do not support freight forwarders in serving as agents for the consign-or, as the consignor must specify vehicle information on the customs declaration and therefore must be present at the time of departure .
Two logistics hubs may contribute to more con-solidation of shipments and enhance the level of services by attracting international logistics compa-nies. The Yerevan Logistics Center at Zvartnots airport is set to be completed in 2015, although investments in rail line and road infrastructure are still required . The airport has added to its air freight capabilities by in-vesting in cold storage for fresh fruits as part of the free economic zone . Another proposed logistics hub would be located at Akhuryan outside of Gyumri .
Policy Recommendationsbilateral transit agreements could ease the transit situation. The high road tax levied on Armenian trucks transiting through Iran significantly increases costs . A reciprocal arrangement between Armenia and Geor-gia waives any transit fees or road taxes on trucks from

Land Connectivity | 69
both sides, although some freight forwarders indicat-ed that this may not be applied evenly . The Armenian government could enter into negotiations with Iran to lower the road tax levied on Iranian trucks .
Ratifying all relevant international conventions could increase Armenia’s leverage over transit partners. Armenia has not signed the UN Conven-tion on Transit Trade of Landlocked States, one of a small number of landlocked countries which have not done so . This agreement offers signatories the right to “freedom of transit”, and specifies, inter alia, that transit goods should not be subject to any customs duty or special taxes and should have access to stor-age facilities as would domestic goods . Freedom of transit is subject to negotiation in sensitive areas such as health and security, and transit can be denied when concerning matters of “national security .” Although there is some skepticism among government offi-cials that signing the treaty will have any impact, with
ratification, Armenia may be in a better position to de-fend its rights with regard to free transit of goods . Ar-menia is, however, party to the UN Convention on the Law of the Sea, which also offers signatories the right to defend freedom of transit . Georgia has ratified both agreements but Iran has not ratified either .
Armenian trade would greatly benefit from im-provements on the transit route through georgia. These would include upgrades to the road to Batumi port as an alternative to Poti, road-clearing services at the Upper Lars crossing to Russia to allow for year-round operations, and a dedicated freight pavilion in Poti for goods traveling to and from Armenia . Nego-tiations could also aim at improving the reliability and reducing the costs of the Black Sea ferries . The new Baku-Tbilisi-Kars railway line, which bypasses Armenia, could nevertheless open a new transit route when it is completed in the near future, if Armenian trucks were to shuttle goods to Akhalkalaki in Georgia .


Air Connectivity | 71
6. Air Connectivity
policy recommendations to enhance connectivity in the last section .
Institutional Set-upCurrently, all governmental matters regarding avi-ation are handled by the general Department of Civil Aviation (gDCA). It is de facto policy maker and regulator . It negotiates Air Services Agreements (ASAs), designates Armenian carriers, and defines all market access rules for airlines (frequencies, number of allowed destinations, etc) . It also carries out the functions of technical regulator (monitoring and en-forcement of safety and security) and manages the PPP contract with the company that won the airport concession in 2001 .
Since 2001, airport infrastructure has been substan-tially upgraded. Infrastructure investment in the Ar-menian aviation sector was minimal between 1991 and 2001 . In December 2001, however, a 30-year manage-ment concession for Zvartnots International Airport outside of Yerevan was awarded to the local affiliate of the Argentinian Corporacion America Company (CAC), which operates airports in several countries . As part of the concession, it invested in a new airport ter-minal, which was subsequently opened in 2002 .
Two airlines are providing flights to and from Arme-nia, Armavia and AEA. The former is designated a ‘na-tional carrier’ . It operates a substantial route network from Yerevan using a variety of planes . In contrast, AEA does not own or lease planes, but markets seats on Austrian Airlines and Czech Airlines (CSA) flights to Vi-enna and Prague . Armavia plays an unofficial but nev-ertheless large role in influencing regulatory decisions,
Armenia’s air connectivity is low, an unfortunate sit-uation for Armenia with very limited connectivity on land routes. Flying to and from Armenia is more expensive than to neighboring Georgia, and flight connection to and from Armenia have less capacity and flexibility than to similar countries in the region . The higher prices and lower connectivity impose costs on the Armenian economy, both direct costs borne by travelers, and indirect costs through loss of connec-tions of people and ideas .
The Armenian government can change air connec-tivity quickly by opening the sector to more compe-tition. International experience shows that liberaliza-tion allows air travel to grow rapidly, and that this has significant effects on overall GDP growth . Higher pas-senger traffic connects businesses, brings new ideas, and opens up new areas for trade, including exports of perishable agricultural products and tourism . Air con-nectivity to and from Armenia is low because of the re-strictive environment in which the sector operates . In-deed, Armenia’s effective aviation policy imposes lim-its on capacity (number of permitted flight frequencies or seats) and the number of airlines that can connect it with other countries . The restrictive environment pro-tects the two private Armenian airlines, Armavia and Atlantis European Airways . The restrictions increase the costs for passengers and shippers of cargo .
This chapter examines aviation policies and their re-sults, and suggests ways to improve air connectivi-ty. To do so, we first assess the institutional set-up and the business environment, then benchmark aviation in Armenia with respect to similar countries in the region, and in the fourth section calculate the welfare effects of the restrictive aviation environment . We propose

72 | Republic of Armenia: Accumulation, Competition, and Connectivity
as well as discussions of bilateral air services agree-ments . Flight control over Armenian territory is provid-ed by an independent, government owned company .
Business EnvironmentInternational air transport is typically governed by bilateral Air Service Agreements (ASAs). They reg-ulate the supply of air services and establish market access conditions for both countries under reciprocity principles . The conditions usually include:
¾ Single or multiple airline designations, which de-fine the number of airlines that are allowed to en-ter the market . Single designation ASAs do not allow competition between carriers;
¾ Point designations, which determine specific routes and airports to be used .
¾ Capacity designations, which specify the maxi-mum number of flight frequencies, seats or max-imum aircraft size .
¾ Agreements on the extent of pricing freedom for airlines, and restrictions on their ownership .
Different levels of restrictiveness are currently in force for different markets. The different practices give a confusing picture of Armenia’s aviation pol-icy . Main routes are operated under the following conditions .
¾ The Russian market accounts for more than 50 per-cent of all air passenger traffic in Armenia . It is the only one in which designation of multiple carriers per country exists, allowing competition between airlines . Until 2007, capacity was regulated by set-ting a maximum number of seats per year, peri-odically adjusted based on demand projections . Nonetheless, this was later replaced by placing a limit on weekly frequencies . Currently, capacity restrictions have been set on an interim basis al-lowing up to 49 flights per week and three carriers per side on the Moscow-Yerevan route . For other routes up to three carriers are allowed and there are no restrictions on frequencies . Recent Russian requests to eliminate all capacity restrictions (in-cluding frequency, airline and point designations) have been rejected by the GDCA, which suggest-ed unsuccessfully that frequencies and carriers currently available should instead be reduced .
¾ The ASAs with Austria and the Czech Republic define a maximum number of four weekly flights per side, although Czech Airlines (CSA) and Aus-trian Airlines are currently operating five and six frequencies per week, respectively, presumably on the basis of ad hoc permits issued by the GDCA . Armavia ceded these routes to AEA . Since AEA does not own or operate any aircraft itself, it acts as a marketing agent, which means it sells a fixed number of seats on Austrian and CSA flights (a practice known as ‘block-spacing’) .
¾ The ASA with France specifies a limit of 4-weekly frequencies per side, which are used in full by Air France during high season . Armavia operated two codeshare frequencies per week to Paris with Air France, but the codeshare agreement was recently suspended .75
¾ After the withdrawal of BMI from the Armenian market in October 2012, no UK carrier is making use of the 7 frequencies allowed by the bilateral agreement between Armenia and the UK .
¾ Other routes are served by single designated carriers . These include Istanbul, Beirut, Tehran, and others .
Armenia therefore has single designations on most routes. Multiple airline designations are permitted in many of the bilateral ASAs but most routes are still served by only one foreign and one Armenian airline . The only—albeit important—exception is routes to Russia, where multiple airlines compete for passen-gers and cargo . The restrictive practice is at least par-tially explained by an investment agreement between Armavia and the government, which gives it some pro-tection from competition .76 Capacity restrictions pro-tect the private ‘national carrier’ and AEA to the det-riment of travelers to and from Armenia . The practice overrides more liberal provisions in ASAs .
75 It should be noted that in virtue of the Horizontal Agree-ment between Armenia and the European Union, all bilateral agreements with EU countries have been amended to introduce the Community carrier designation clause . As a consequence, any EU Member State can designate any EU carrier, provided that it is owned, directly or through majority ownership; and it is effectively controlled by member states and or nationals of member states; and or by Norway, Liechtenstein, Switzerland, Iceland or by nationals from these states . Agreement between the European Community and the Republic of Armenia on cer-tain aspects of air services . OJ L 50, 21 .2 .2009, p . 22–29 .
76 The investment agreement has not been disclosed and its provisions are therefore not clear .

Air Connectivity | 73
Benchmarking Armenia’s Air Connectivity
Flight Connections
Yerevan airport is connected mainly with Eurasian cities. As shown in Figure 6 .1, the Eurasian market has 71 percent of the seat capacity from Yerevan, whereas Western European markets account for about a quarter of all available capacity from Yerevan, and the remaining few in the Middle East (7 percent) . The bulk of the seat count is oriented to Russia (69 percent) . Out of 45 destinations served, the Russian capital is the most relevant market . Moscow’s three airports account for almost half of the seats out of Yerevan . Out of 25 carriers, Armavia has the largest share of the seats out of Yerevan (about one third of the total) .
Yerevan does not provide a wide range of choices with enough flexibility (Figure 6.2). About 30 mar-kets are served with at most two frequencies per week (about 70 percent of all markets available out of Yere-van); four markets with at least a daily flight (Rostov, Krasnodar, Mineralnye Vody, with 7 to 13 frequencies per week) and a single route with two or more daily flights (Moscow) . Of the destinations served with at least one daily flight, only Moscow is considered a suit-able connecting hub, served by 10 daily flights from Yerevan . After the withdrawal of BMI from the Arme-nian market, which removed access to London Heath-row’s vast connections, Paris Charles de Gaulle, Frank-furt and Istanbul Ataturk airports are the remaining global hubs connected to Yerevan, albeit only served once or twice a week during low season . Alitalia’s new-ly established service between Rome and Yerevan also operates only twice per week .
Figure 6.1. Capacity Distribution (seats) from Yerevan
71%
21%
7%
1% Eurasia (Eastern Europe)
Western Europe
Middle East
Eurasia (Asia)
67% 5%
5%
3%
3%
3%
3% 2%
2%
7% Russia
Czech Republic
United Kingdom
France
Austria
United Arab Emirates
Iran
Italy
Ukraine
Others
44%
5% 5% 4%
3%
3% 3%
3%
3% 3%
2%
2% 20%
32%
13%
12% 5% 4%
3%
3%
3%
3%
3%
3% 2%
2% 12%
Armavia
Siberia Airlines
Aeroflot
bmi
JSC Don Avia
Austrian Airlines
Moscow
Prague
London
Rostov
Vienna
Paris
Dubai
St. Petersburg
Teheran
Mineralnye Vody
Source: DIIO data (June 2012). Author’s calculations. Note: In October 2012, BMI discontinued its Yerevan-London operations.

74 | Republic of Armenia: Accumulation, Competition, and Connectivity
Yerevan offers lower flexibility compared with re-gional peers. Among major CIS capitals, Yerevan of-fers the lowest levels of flexibility, measured by the share of markets served with two weekly frequencies or less (highest in the sample), and the percentage of routes with two or more daily frequencies (lowest in the sample, see Figure 6 .3) . Moreover, few choices
are available in terms of carriers from Yerevan: a sole market is served by four airlines (Moscow), followed by three other markets within Russia, where three carriers operate (Rostov, Sochi and Mineralnye Vody) . In turn, seventy percent of the markets are served by one or two carriers at most . According to USAID (2011), ef-fective competition in the densest markets might be
Figure 6.2. Number of Destinations by Frequency of Service from Yerevan(in absolute number – left; as a percentage of total destinations – right), 2000–12
Yerevan, 2000 Yerevan, 2012
30
20
10
01–2 1–2 3–6 7–13 14+3–4 14+
Extra-CIS
CIS
Yerevan, 2000 Yerevan, 2012
.8
.6
.4
.2
01–2
Extra-CIS
CIS
1–2 3–6 7–13 14+3–4 14+
Source: Author based on DIIO data (March 2000 and June 2012).
Figure 6.3. Number of Destinations by Frequency of Service from CIS Countries’ Capitals(as percentage of total destinations served), 2000–12
Graphs by year
1–2 3–6 7–13 14+
.8
.6
.4
.2
.0
Almaty
Almaty
Almaty
Almaty
Moscow
Moscow
Moscow
Moscow
MinskMinsk
MinskMinsk
Bishkek
Bishkek
Bishkek
Bishkek
Tbilisi
Tbilisi
Tbilisi
Tbilisi
Kiev
Dushanbe
Dushanbe
Dushanbe
Dushanbe
Ashkhabad
Ashkhabad
Ashkhabad
AshkhabadBaku
Tashkent
Yerevan
YerevanYerevan
Yerevan
Tashkent
Tashkent
TashkentKiev
KievKiev
BakuBaku
Baku
CIS DomesticExtra-CIS
Source: Author based on DIIO data (June 2012).

Air Connectivity | 75
even lower: due to the protective stance towards Ar-mavia capacity in ASAs is split artificially between air-lines, or commercial agreements on codesharing and blockspacing consolidate seat inventory and reduce competition .
Yerevan also handles relatively modest volumes of air cargo. In 2011, total air cargo throughput amount-ed to 9,500 tons, with approximately equal amounts for exports and imports . As a result, capacity utiliza-tion of the new cargo facilities at Zvartnots airport is at 25 percent at best . Around 80 percent of the total cargo volume is carried in passenger aircraft, and only 20 percent in freighter aircraft . Less than ten products account for over 55 percent of the total exports leav-ing Armenia by air, live crayfish (25 percent of total ex-ported air cargo), fruits (16 percent) and frozen fish (5 percent) . Approximately 55 percent of the exports are destined for Moscow, and 18 percent to Europe . Con-versely, 45 percent of imported air cargo comes from Europe (this includes all transit cargo from different or-igins), and close to 30 percent from Moscow .
Transit air freight is limited as well. In terms of tran-sit cargo, approximately 140 tons per year are carried from Europe to other destinations in the region via Yerevan (from Frankfurt Hahn to Tbilisi and Ashgha-bat) . The main products are computer supplies and
equipment (25 percent of total transit cargo), spare parts (25 percent) and other consolidated cargo (16 percent) . According to some air freight forwarders, de-lays in the customs clearance procedures in Moscow make Yerevan marginally more attractive as a transit point for Russian imported goods destined for Siberia and the Russian Far East, although handled volumes are still low .
Regular freighter services to Yerevan are only pro-vided by Air Armenia and Air Cargo germany (ACg). Air Armenia, a local company, has two scheduled week-ly flights between Yerevan and Frankfurt Hahn (using Antonov-12 aircraft) whereas Air Cargo Germany serves Yerevan once per week with a Boeing 747-400 freight-er . Non-regular cargo services also exist to markets in Central Asia such as Ashghabat, Dushanbe and Aktau . Other air cargo companies such as Cargolux, Silk Way Airlines and Coyne Airways, run road feeder services to and from Tbilisi, connecting to their international net-work within the region and beyond . Reportedly, there are no regulatory constraints for air cargo .
Competitiveness
Fares in Yerevan are significantly more expensive than in neighboring Tbilisi. A benchmarking of air fares was conducted in 47 direct and non-stop markets
Figure 6.4. Lowest Available Fares from (left) and to (right) Yerevan and Tbilisi Direct and Non-stop Routes(in US dollars/km)
0
0.1
0.2
0.3
0.4
0.5
0.6
0.7
0 500 1000 1500 2000 2500 3000 3500 4000
EVN
TBS
EVN
TBS
0
0.1
0.2
0.3
0.4
0.5
0.6
0.7
0 500 1000 1500 2000 2500 3000 3500 4000
Source: Author’s calculations, based on 3rd week of November 2012. Note: Fares do not include air charges, security fees or taxes.

76 | Republic of Armenia: Accumulation, Competition, and Connectivity
from the Armenian capital and 28 markets from Geor-gia, equivalent to 99 percent of all available destina-tions for the traveler in each case . The comparison with the Georgian case can be helpful to illustrate the likely effects of less restrictive aviation policies on air fares in markets with similar traffic patterns . In contrast with Armenia, Georgia imposes no restrictions on ca-pacity, airline and point designation . Results show that the lowest fares subject to inventory availability to and from Yerevan are systematically higher than those to and from Tbilisi across the selected sample of markets on a per-kilometer basis (Figure 6 .4) . For a typical distance of 1900 km, average yields per kilo-meter in Yerevan add up to $0 .20 per km, compared to $0 .13–0 .15 per km in Tbilisi, constituting a premium of 33 to 50 percent for the traveler flying in and out of the Armenian capital . The comparison results hold for different points in time (February/March and May) . Moreover, when fees and taxes levied on the passen-ger (passenger facility charges, departure taxes, etc .) are added to the fares in both cases, the overall re-sults remain unchanged .
The benchmarking exercise was also extended to other CIS countries and connecting markets, yield-ing similar results. When compared with other CIS capitals such as Almaty and Baku, outbound yields are also found to be more expensive in Yerevan based on the lowest available fare (Figure 6 .5) . In the case of connecting markets, only online connections via ma-jor hubs were considered (i .e . Air France connections via Paris, or Turkish Airlines via Istanbul) to beyond destinations in North America, Europe and Asia . The exercise shows lower and more volatile yields dis-tinctive of connecting markets as compared to non-stop markets . In spite of the increased competition in connecting markets via major hubs, average yields continue to be higher from Yerevan as compared to Tbilisi, although the premium seems much lower (around 10 percent for a typical market in excess of 2000 miles) .
A benchmarking exercise of infrastructure and non-infrastructure charges was conducted in order to compare the costs borne by airlines and passen-gers across Eurasian airports, including Yerevan. These charges can be divided in two broad groups: regulated and non-regulated charges . Typically the first group would include landing fees and surcharges,
parking fees, navigation charges (air traffic control ser-vices for aircraft approaching or departing Yerevan, or transiting through Armenian airspace), or any other in-frastructure related charges (use of boarding bridges, meteorological services, etc .) . It also includes all costs borne by passengers, whether in the form of passen-ger facility charges or terminal use charges, security fees, or other duties which are ultimately paid by the traveler –either levied by the airport or the airlines . On the other hand, non-regulated charges usually com-prise handling costs, both for passenger and ramp services, as well as fuel .77 Comparisons were made on a per-passenger basis (where applicable) and for a typical turnaround operation of an Airbus A320-200 aircraft (Figure 6 .6) .
Turnaround costs borne by airlines in Yerevan are comparable to those in Tbilisi and baku, albe-it higher than in other Eurasian airports. Yerevan stands after Baku as the third most expensive airport in the sample with over $5,000 in total charges, and followed closely by Tbilisi (approx . $4,400) and Minsk ($4,100) . In turn, Kiev is the most expensive airport for airlines with $5,730 in charges . As far as the individual components, landing fees in Yerevan are the second most expensive in the sample ($5 .8/ton per each land-ing and each takeoff, adding up to $1,135) exceeding Baku and Tbilisi by 30 and 95 percent, respectively . Approach charges in Yerevan add up to $590 ($6 per ton), similar to Tbilisi ($578) but more expensive than Baku ($391), exceeding by 30 percent the sample av-erage of $455 . Navigation charges in Armenia of $204 are far below the sample average, but close to Tbili-si’s $182 and much cheaper than Baku’s $274 . Ground handling charges in Yerevan appear to be competi-tive within the sub-region when compared to Tbilisi (both airports stand close to $2,100 per turnaround)
77 Some initial conditions must be held constant considering that rate structures vary according to the specific charge; wether by aircraft size (usually based on the Maximum takeoff weight), time (turnaround times for parking fee calculations, and time of day for any night surcharges), or the number of passengers (any charge based on the number of passengers enplaning or de-planing the aircraft) . Consequently, the base scenario employed for the comparison uses an Airbus 320-200 operation (77 tons Maximum takeoff weight or MTOW) with a 60 percent load fac-tor (with 100 revenue passengers out of the possible 164 at a typical pitch configuration) during daytime hours, and a 2-hour turnaround time (the time on the ground between arrival and departure) .

Air Connectivity | 77
Figure 6.5. Lowest Available Fares from Yerevan, Tbilisi, Baku and Almaty Direct and Non-stop Routes(in US dollars/km)
0
0.1
0.2
0.3
0.4
0.5
0.6
0.7
0 500 1000 1500 2000 2500 3000 3500 4000 4500
EVN TBS GYD ALA
Source: Author’s calculations, based on 3rd week of November, 2012. Note: Fares do not include airport charges, security fees or taxes.
Figure 6.6. Turnaround Costs for an Airbus A320-200 Paid by Airlines(in US dollars)
a: without fuel costs b: with fuel costs
0
1,000
2,000
3,000
4,000
5,000
6,000
7,000
Other OPS Handling
Navigation Landing andParking
Moscow (D
ME)
Moscow (S
VO) Kiev
Almaty
Tashkent
Dushanbe
Bishkek
Minsk
Yerevan Tbilis
i Baku
Ashghabat 0
5,000
10,000
15,000
20,000
25,000
30,000
Moscow (D
ME)
Moscow (S
VO) Kiev
Almaty
Tashkent
Dushanbe
Bishkek
Minsk
Yerevan Tbilis
i Baku
Ashghabat
Other OPS Fuel Handling Navigation Landing
and Parking
Source: Author’s calculations based on ICAO and IATA Manual on Airport and Air Navigation Charges and country AIPs.Note: Based on daylight operations, 2-hour turnaround time.

78 | Republic of Armenia: Accumulation, Competition, and Connectivity
and Baku (around $2,590) . However, in June 2012, Ye-revan had the third most expensive fuel in the sample ($1,394 per ton), impacting directly on the turnaround cost computations .
Airport charges and fees paid by passengers in Ye-revan are in line with other airports in the region when government duties are excluded from the comparison. The Government of Armenia levies a State Air Exit Duty of AMD10,000 (equivalent to $25) on departing passengers . This is not related to infrastruc-ture recovery costs or the provision of airport services by the operator, but collected by the airlines and incor-porated in final ticket prices . Other similar cases can be found in Baku and Kiev, in the form of a civil avia-tion tax (of $1 .5 per passenger) or government tax ($2 per passenger) . When the State Air Duty is excluded from the computations, passenger charges levied by Yerevan airport are very similar to that in other airports including Tbilisi, and almost 50 percent cheaper than in Baku (Figure 6 .7) .78 Conversely, when the State Air Exit Duty is added to the final cost for the passenger traveling in and out of Armenia, Yerevan stands out
78 EUR 2 per passenger in Security fees and EUR 18 per pas-senger in Passenger Facility Charges, plus $3 per passenger for check-in services .
very close to Baku as the most expensive airport in the region, exceeding the $5,000 mark, and surpassing the sample average by 75 percent .
Total turnaround costs paid by airlines and passen-gers in Yerevan are still higher than in most airports in the region. Fuel costs constitute the bulk of the to-tal turnaround costs, as shown in (Figure 6 .8) . Together with the State Air Exit Duty, these two elements are the largest source of premiums associated to air travel in Armenia, as compared to the other airports . A study by USAID (2011) shows that, when compared to a dif-ferent set of airports in Eastern and Western Europe, the results are qualitatively the same .79 As far as the in-cidence of passenger charges in Armenia, these tend to represent between 10 and 13 percent of the final price of a ticket for medium and long-haul air travel
79 “Competitiveness of the Armenian Air Transport Sector” USAID, 2008 . Small variations between the two studies emerge from the cost of fuel (which varies rapidly according to market conditions) and ground handling . In the latter case, airlines usu-ally enter in contracts with different service providers at a dis-count, and hence slightly different quotations might be consid-ered as a valid . Different aircraft seat configurations also might impact the cost for ground handling . In this case, we use the official published value provided by the airport through public sources or via consultations with airports and airlines .
Figure 6.7. Total Turnaround Charges paid by Passengers for an Airbus A320-200(in US dollars)
a: levied by airport, without state tax and duties b: with related state taxes and duties
0
1,000
2,000
3,000
4,000
5,000
6,000
Moscow (D
ME)
Moscow (S
VO) Kiev
Almaty
Tashkent
Dushanbe
Bishkek
Minsk
Yerevan Tbilis
i Baku
Ashghabat
PFC Security (MTOW based) Security (pax based)
0
1,000
2,000
3,000
4,000
5,000
6,000
Moscow (D
ME)
Moscow (S
VO) Kiev
Almaty
Tashkent
Dushanbe
Bishkek
Minsk
Yerevan Tbilis
i Baku
Ashghabat
PFC Other
Security (MTOW based) Security (pax based)
Source: Author’s calculations based on ICAO and IATA Manual on Airport and Air Navigation Charges and country AIPs.

Air Connectivity | 79
(including the State Air Exit Duty) .80 When the State Air Exit Duty is not considered, charges and fees levied on passengers account for 6 to 10 percent of the final ticket price .
The institutional environment for the economic reg-ulation of the airport concession needs to be better defined. Formally, GDCA is the state agency respon-sible for approving the fees and charges to be paid by carriers and passengers, and the monitoring body for the operator’s compliance with the airport con-cession agreement, acting in its capacity of economic regulator . As far as airport pricing regulation is con-cerned, an intergovernmental commission was creat-ed in 2004 to monitor all charges and fee adjustments proposed by the operator in accordance with the con-cession agreement, although the level of technical
80 Respectively, based on a two-way fare for a 3500 and 2000 kilometer route .
expertise available to the commission is unclear . The commission is chaired by the Director General of the GDCA . The arrangement lacks formal consultation or complaint handling mechanisms for the users of the infrastructure and there is need for a better defined economic regulatory framework in regard to ancillary services, with a clear role for competition law and its enforcement .
Transit Hub Potential
Network connectivity measures can be used to as-sess the transit hub potential of Yerevan vis-à-vis other airports in the region. In previous sections, an analysis of direct connectivity from Yerevan was per-formed by assessing the number of flights and fre-quency of service by destination from the Armenian capital . Alternative definitions of connectivity focus on a central node on a given network, and its capabilities
Figure 6.8. Total Turnaround Charges, for an Airbus A320-200(in US dollars)
a: without fuel costs b: with fuel costs
0
2,000
4,000
6,000
8,000
10,000
12,000
Other OPS Handling Navigation
Landing andParking
Passenger(PFC+security+Oth. Taxes)
Moscow (D
ME)
Moscow (S
VO) Kiev
Almaty
Tashkent
Dushanbe
Bishkek
Minsk
Yerevan Tbilis
i Baku
Ashghabat
Moscow (D
ME)
Moscow (S
VO) Kiev
Almaty
Tashkent
Dushanbe
Bishkek
Minsk
Yerevan Tbilis
i Baku
Ashghabat 0
5,000
10,000
15,000
20,000
25,000
30,000
35,000
Other OPS Fuel Handling
Navigation Landingand Parking
Passenger(PFC+security+Oth. Taxes)
Source: Author’s calculations based on ICAO and IATA Manual on Airport and Air Navigation Charges and country AIPs.

80 | Republic of Armenia: Accumulation, Competition, and Connectivity
to serve as a transit point for passengers or cargo . In recent literature, the latter is referred to as hub connectivity.81
Two synthetic indicators can summarize the con-nectivity capabilities of an airline hub: the spatial concentration of its network, and the time coordi-nation of flight schedules.82 One metric commonly utilized to represent the spatial concentration of a network is Freeman’s (1979) betweenness centrality index .83 In principle, pure radial networks provide better capabilities for carriers to hub since they max-imize the number of possible connecting markets with the minimum number of inbound and outbound flights . In turn, different metrics have been proposed to capture the scheduling practices of carriers .84 The basic rationale behind them is to count the number of competitive ‘hits’ or suitable connections at a spe-cific airport, provided that they comply with a set of operational and practical rules (see Box 6 .1) . Once all valid ‘hits’ are counted, only the number of con-nected markets is considered; and later normalized by the maximum possible number of connecting markets that can be served by that carrier at that air-port, so as to avoid any bias introduced by network
81 Unless indicated otherwise, the use of the term hub follows the accepted definitions in the literature (see Burghouwt 2007; Holloway 2009) . The spatial structure of an airline network can unveil some core characteristics about its operations . Hubbed networks “add a temporal dimension to the radial form, as they exist not just by virtue of (spatial) network design, but also as a result of scheduling decisions” . Timing and coordination of inbound and outbound flights out of the hub are then carefully managed so as to present a wide range of competitive connec-tions for transit passengers . On the other side of the spectrum, linear or grid-type network structures are more in line with the business model of point-to-point carriers, typical of the pre de-regulation 1970s air transport markets, and that of low cost car-riers (LCCs) or regional carriers . Of course, this is not to say that all airlines with radial network structures can be associated with hub-type operations, or that all point-to-point structures do not exploit any transit traffic . Ultimately, this depends on the carriers’ business proposition, whether segment-based (point-to-point) or journey-based (hubbed) .
82 Nijkamp et al 2007 .
83 The Freeman index measures the “degree of inequality or variance in the network” as compared to a pure radial configu-ration, adopting the maximum value possible (equal to 1) for a pure radial architecture, and 0 for pure point-to-point network .
84 See Burghouwt 2007, Boostma 1997, Nijkamp et al 2007 .
size .85 A higher time coordination ratio indicates bet-ter aptitudes to provide seamless connections and is usually indicative of a hubbed network structure . In order to draw a comparison between different carri-ers, eight different airline-airport pairs in the region were chosen as comparators, along with other seven based in Europe (Table 6 .1) .
85 The maximum number of markets that can be served from a specific airline hub follows the formula of n!/(n-2)! where n is the number of markets excluding the hub . Assuming a network with a single hub and spokes A,B,C and, D, 12 market combinations (assuming directional markets) can be formed . Hence if there are only 3 valid hits via the hub (connecting markets A–B, C–D, and B–D), then the scheduling coordination index would equal 1/3 .
Box 6.1. Criteria for Counting Valid ‘hits’ on Connecting Flights§§ A minimum time separation must be met be-
tween the landing and departing connection. This is to allow passengers to deplane and transfer within or between terminals, and assure that any baggage or cargo can be unloaded and load-ed to the new aircraft in time. This minimum time separation is defined by Minimum Connect Time (MCT) rules, which depend on a multiplicity of factors: some of them reflect infrastructure issues like lengthy transfer times between terminals, the efficiency of baggage handling, or the need for extra time due to heightened security measures, etc. Usually, the complexity of MCT rules is directly proportional to the size of the hub; a good exam-ple of that is Charles de Gaulle (CDG) airport in Paris, which shows very complex MCTs. Although the literature has used typical values for MCTs (90 minutes for domestic departures and two hours for international departures) in order to compute the number of suitable connections at a hub, this calculation uses real MCT rules for all carriers and airports considered in the sample.
§§ A routing factor is introduced to measure the de-viation from the great circle distance between origin and destination; this avoids the validation of connecting routes with a significant degree of backtracking. A detour of up to 30 percent of the non-stop great circle distance is usually accepted.
§§ A Maximum Connect Time (MaCT) is also intro-duced as a way to prevent the counting of con-nections which are neither competitive nor con-venient for passengers.
Source: Adapted from Boostma (1997), Burghouwt (2007) and Goedeking (2011).

Air Connectivity | 81
Armavia has the most concentrated spatial structure along with belavia, since it does not operate any routes between spokes. In contrast, Air Astana exhib-its the lowest spatial concentration in the region, given the fact that it operates both from Almaty and Astana air-ports . As far as the legacy carriers such as Lufthansa, their lower spatial concentration is explained by their double hub structure (Frankfurt and Munich) . On the other hand, Armavia shows the lowest degree of schedule coordina-tion as compared to the other carriers in the region, sug-gesting that a smaller number of connecting markets can be served via Yerevan seamlessly, relative to the size of its network; only low cost carriers in Europe (Easyjet, Ry-anair and Air Berlin) with a marked orientation towards a point-to-point structure show lower time coordination in-dicators . Although there is nothing inherently wrong with such strategy—as many successful carriers around the world do not configure their networks around the idea of connecting traffic—Yerevan’s chances of becoming a successful regional transit hub seem unrealistic under the present conditions . In fact, transit passengers account for less than 0 .2 percent of total passenger movement at Zvartnots, a negligible amount by industry standards .86 The current restrictive aviation policies and the compara-tively higher costs for airlines and passengers in Yerevan make matters worse in that respect .
86 For instance, transit traffic in airlines such as Air Astana, Ice-landair and LOT represents some 20, 39 and 45 percent of total traffic, carrying some 2 .0, 0 .6 and 1 .4 million O&D passengers, respectively (figures based on different years, extracted from in-dustry publications) .
under the current conditions, Yerevan’s chances to be-come a regional hub appear to be slim. First, Armavia appears to have the most concentrated spatial structure in the sample (Figure 6 .9) . The carrier’s network is purely radial and does not operate routes between spokes. In contrast, Air Astana exhibits the lowest spatial concen-tration in the sample, since the Kazakh airline operates both from Almaty and Astana airport . As far as Europe-an carriers, their lower spatial concentration can be ex-plained by their double hub structure (such as the case of Lufthansa, in Frankfurt and Munich, or the point-to-point structure of low cost carriers) . Second, Armavia shows the lowest degree of schedule coordination as compared to other airlines in the region and most legacy carriers that operate successful hubs in Europe, indicating that a smaller number of connecting markets can be served via Yerevan relative to the size of its network . Only European low cost carriers (Easyjet, Ryanair and Air Berlin) with a segment-based business model show lower time coordi-nation . Although there is nothing inherently wrong with such a strategy, as many successful carriers around the world do not configure their networks around the idea of connecting traffic, Yerevan’s chances of becoming a re-gional transit hub are low under the present conditions . In fact, transit passengers account for less than 0 .2 per-cent of total passenger movement at Zvartnots .87
87 For instance, transit traffic in airlines such as Air Astana, Ice-land air and LOT represents some 20, 39 and 45 percent of total traffic, carrying some 2 .0, 0 .6 and 1 .4 million O&D passengers, respectively (figures based on different years, extracted from in-dustry publications) .
Table 6.1. Base of Operations and Size of Selected Carriers in CIS Countries
Carrier Country Base Monthly ASMs*
Aerosvit Ukraine Kiev (KBP) 574.7
Air Astana Kazakhstan Almaty(ALA)*/ Astana (TSE) 527.9
Turkmenistan Airlines Turkmenistan Ashghabat (ASB) 138.2
Belavia Belarus Minsk (MSQ) 127.3
AZAL Azerbaijan Baku (GYD) 213.0
Georgian Airways Georgia Tbilisi (TBS) 28.0
Uzbekistan Airways Uzbekistan Tashkent (TAS) 462.0
Armavia Armenia Yerevan (EVN) 94.3
*available seat miles.Source: Authors.
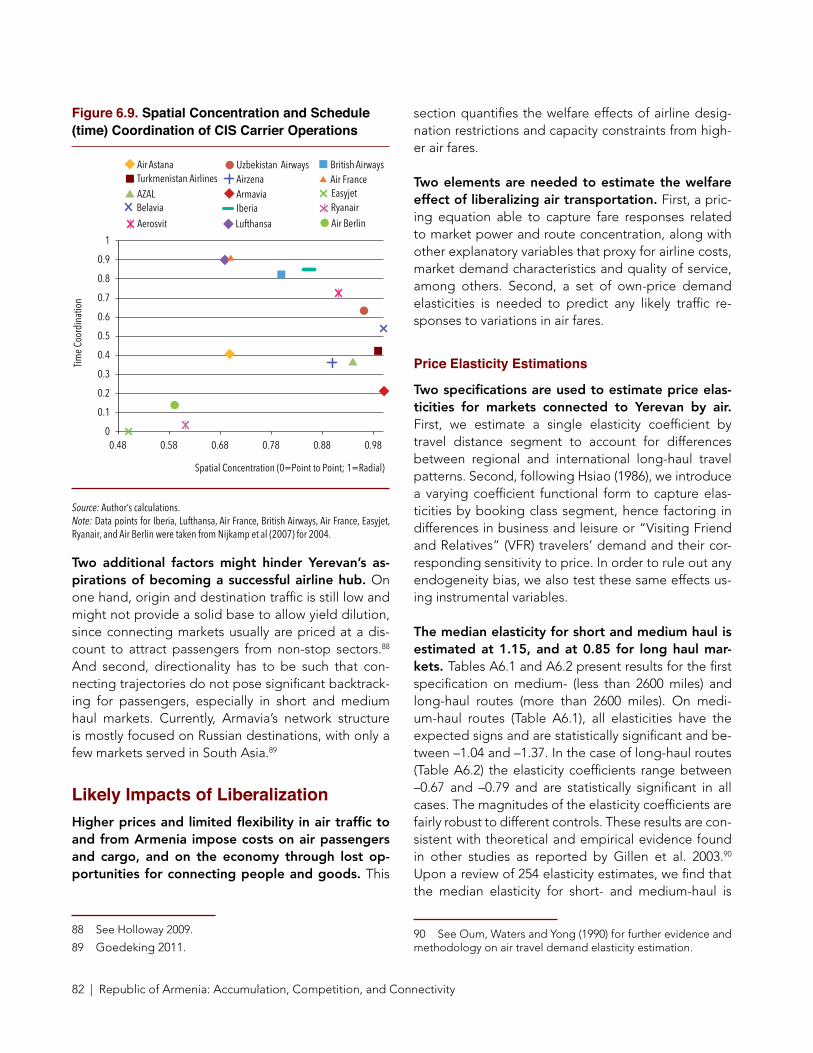
82 | Republic of Armenia: Accumulation, Competition, and Connectivity
Figure 6.9. Spatial Concentration and Schedule (time) Coordination of CIS Carrier Operations
0
0.1
0.2
0.3
0.4
0.5
0.6
0.7
0.8
0.9
1
0.48 0.58 0.68 0.78 0.88 0.98
Time
Coor
dina
tion
Spatial Concentration (0=Point to Point; 1=Radial)
British Airways Turkmenistan Airlines
Uzbekistan Airways
Air Berlin Lufthansa
Armavia
Air Astana
Belavia EasyjetRyanair
Aerosvit
Airzena AZAL
Air France
Iberia
Source: Author’s calculations.Note: Data points for Iberia, Lufthansa, Air France, British Airways, Air France, Easyjet, Ryanair, and Air Berlin were taken from Nijkamp et al (2007) for 2004.
Two additional factors might hinder Yerevan’s as-pirations of becoming a successful airline hub. On one hand, origin and destination traffic is still low and might not provide a solid base to allow yield dilution, since connecting markets usually are priced at a dis-count to attract passengers from non-stop sectors .88 And second, directionality has to be such that con-necting trajectories do not pose significant backtrack-ing for passengers, especially in short and medium haul markets . Currently, Armavia’s network structure is mostly focused on Russian destinations, with only a few markets served in South Asia .89
Likely Impacts of Liberalization Higher prices and limited flexibility in air traffic to and from Armenia impose costs on air passengers and cargo, and on the economy through lost op-portunities for connecting people and goods. This
88 See Holloway 2009 .
89 Goedeking 2011 .
section quantifies the welfare effects of airline desig-nation restrictions and capacity constraints from high-er air fares .
Two elements are needed to estimate the welfare effect of liberalizing air transportation. First, a pric-ing equation able to capture fare responses related to market power and route concentration, along with other explanatory variables that proxy for airline costs, market demand characteristics and quality of service, among others . Second, a set of own-price demand elasticities is needed to predict any likely traffic re-sponses to variations in air fares .
Price Elasticity Estimations
Two specifications are used to estimate price elas-ticities for markets connected to Yerevan by air. First, we estimate a single elasticity coefficient by travel distance segment to account for differences between regional and international long-haul travel patterns . Second, following Hsiao (1986), we introduce a varying coefficient functional form to capture elas-ticities by booking class segment, hence factoring in differences in business and leisure or “Visiting Friend and Relatives” (VFR) travelers’ demand and their cor-responding sensitivity to price . In order to rule out any endogeneity bias, we also test these same effects us-ing instrumental variables .
The median elasticity for short and medium haul is estimated at 1.15, and at 0.85 for long haul mar-kets. Tables A6 .1 and A6 .2 present results for the first specification on medium- (less than 2600 miles) and long-haul routes (more than 2600 miles) . On medi-um-haul routes (Table A6 .1), all elasticities have the expected signs and are statistically significant and be-tween –1 .04 and –1 .37 . In the case of long-haul routes (Table A6 .2) the elasticity coefficients range between –0 .67 and –0 .79 and are statistically significant in all cases . The magnitudes of the elasticity coefficients are fairly robust to different controls . These results are con-sistent with theoretical and empirical evidence found in other studies as reported by Gillen et al . 2003 .90 Upon a review of 254 elasticity estimates, we find that the median elasticity for short- and medium-haul is
90 See Oum, Waters and Yong (1990) for further evidence and methodology on air travel demand elasticity estimation .

Air Connectivity | 83
estimated at 1 .15, whilst that in long haul markets is estimated at 0 .85 .
This result is confirmed when running the regres-sions distinguishing booking class segments. Table A6 .3 presents the regression results for the vary-ing coefficient model in order to account for differenc-es in booking class segments (economy and business travelers) . Both coefficients turn out to be statistically significant in all but two cases, and with the expected signs . Own-price elasticities for higher booking class-es range between –0 .37 and –0 .65, which is consis-tent with the fact that business travelers’ demand is less sensitive to variations in price . On the other hand, economy class elasticities (capturing the leisure and VFR segment) range between –1 .4 and –1 .7 . It should be noted that the latter exercise was performed using the entire dataset and for long haul routes . Although economy class elasticities remained within the men-tioned values, the coefficients associated to business class did not turn out to be significant in many cases .
The result is valid when correcting for endogeneity. We turn to the results for the instrumental variables (IV) model, in order to account for any possible bias due to endogeneity in the fare coefficient (Table A6 .4) .91 Two instruments were used: per capita Gross Domestic Product and the geographical distance to markets .92 The results indicate that the elasticity coefficient rang-es between –0 .88 and –1 .6, depending on the specifi-cation used . Furthermore, in all cases the hypothesis that the fare is exogenous cannot be rejected .93 Fur-thermore, it is deemed that instruments are sufficiently strong as indicated by the F-statistic .
Determinants of Air Fares
The estimations show that if concentration is re-duced by half on a specific market, observed prices for the economy class segment might drop in the range of 20 to 28 percent in average. Table A6 .5 presents all estimation results of air fare determinants, for a number of markets connected to Yerevan by air .
91 See Gillen et al (2008) for a more detailed account of en-dogeneity issues when estimating air travel demand elasticities .
92 See Intervistas 2006 for a detailed discussion on choosing instruments for air travel demand elasticity estimation .
93 As indicated by the chi(2) p-value at 5 percent significance .
The route level concentration coefficient is statistically significant in all cases and robust to different controls, ranging between 0 .44 and 0 .63 . A second specification tries to capture the differentiated effects of market lev-el concentration by booking class (equations 5–7) us-ing a varying coefficient functional form (Hsiao 1986) . The Herfindahl coefficients for economy and business class tickets are statistically significant and range be-tween 0 .52 and 0 .63, higher than in similar applications (Borenstein 1989) . The exact opposite happens with the Herfindahl coefficient associated to the discount economy segment . Finally, a third specification is in-troduced in order to control for market dominance in the destination market . The signs on the route concen-tration coefficients remain invariant for the most part, except for the discount economy class, which turns significant and higher in magnitude . Alternatively, an instrumental variables model was computed (using lagged variables of the Herfindahl index as instrument) in order to rule out any endogeneity issues in the con-centration-price relationship, as suggested by Evans, Froeb and Werden (1993) . Although the results are not reported here, no substantial differences in the sign, significance and magnitude of the coefficients were found compared to the pooled OLS model . Simula-tions using the estimated coefficients indicate that a reduction of concentration by half on a specific market (for instance, when a new entrant matches the capacity offered by a single incumbent), might lead to a drop in the range of 20 to 28 percent in observed prices for the economy class segment . 94
A 25-percent reduction in price could add up to 1.4 percent of gDP. The methodology employed by Brattle (2002) is useful to compute the aggregate eco-nomic benefit of a liberalized market for passengers . Depending on the level of detail, different elasticities can be used by routes and booking class . Although it might provide a more insightful picture of the likely effects of liberalization, it also requires additional as-sumptions based on passenger traffic, which might not be readily available . Assuming an overall reduction of 25 percent in price and an average elasticity between –0 .9 and –1 .08, the aggregate welfare gains for the
94 Assuming that there is no significant change in the overall market share at the destination airport for any entrant carrier, and that fares are determined freely (neither collusion nor filing restrictions are in place) .
84 | Republic of Armenia: Accumulation, Competition, and Connectivity
consumer would add up to 1 .4 percent of GDP . The welfare gain would obviously be quite small for travel to and from Russia, because the competitive environ-ment on these routes means liberalization would not lead to big changes .
Policy RecommendationsA range of empirical studies have shown the positive effects of liberalization of aviation in a wide range of countries. Empirical and analytical work shows a strong positive link between air transport liberalization and traffic growth . A wide array of methodologies and datasets has been employed to test the likely effects of more open air transport policies on passenger traf-fic, tourism growth and job creation . Many case stud-ies and simulation exercises are based on the experi-ence with liberalization and structural reform programs since the early 1990s . In highly regulated environments where supply is artificially constrained, removing ca-pacity restrictions and single designation provisions can have decisive effects on air transport: new routes are flown, more seats and frequencies become avail-able to the consumer, and fares drop as competition increases . For example, Piermartini and Rousova (2008) conduct a cross country study linking restrictiveness of the aviation business environment to passenger traffic volumes . The results show that an increase in the de-gree of liberalization from the 25th percentile to the 75th increases passenger traffic volumes between countries with direct air services by approximately 30 per cent . For air cargo, Micco and Serebrisky (2006) compare air cargo rates from US import data . They estimate that an open skies agreement reduces air transport rates by 9 percent, and increases the amount of cargo arriving by air by 7 percent on average (for a broader literature overview see Table 6 .2) .
Liberalization of aviation would boost growth in air passenger and cargo traffic in Armenia, and boost economic growth. Our estimates have shown that
an elimination of capacity restrictions, including sin-gle designations, might contribute to welfare gains of up to 1 .4 percent of GDP by lowering fares by 25–30 percent . Liberalization of Armenia’s aviation sector re-quires:
¾ A clear policy statement outlining the govern-ment’s commitment to a competitive environment,
¾ A better separation of policy making and its im-plementation,
¾ Independence of regulators from interference from regulated entities,
¾ Industry consultation and complaint handling mechanisms,
¾ Capacity building to help the Armenian regulator better monitor and enforce contracts, including the airport management concession, and
¾ Greater transparency with regard to contracts and agreements to level the playing field for actual and potential market participants .
A review of aviation policy should lead to a well-defined strategy for the sector. The current in-stitutional set-up needs to be broken up, because it is not conducive to the development of the aviation sector . A clear policy statement outlining the govern-ment’s commitment to increasing competition be-tween airlines, and improving connectivity for Arme-nia should therefore be published . Moreover, clear institutional responsibilities should be delineated for policy making, implementation, and monitoring and enforcement of policies in the strategy . The overlap of functions and concentration of decision making discretion in the GDCA are detrimental to democratic oversight, clarity of business environment, and gov-ernance . Technical capacity may have to be strength-ened for more effective oversight of conditions and charges and fees, both charges by airlines and the airport . With regard to the airport, the regulatory framework pertaining to ancillary services should also be reviewed .

Air Connectivity | 85
Appendix
Table A6.1. Pooled OLS Regression Results, Aggregate Fare Elasticities
(1) (2) (3) (4) (5) (6) (7)
lpax lpax lpax lpax lpax lpax lpax
lfare –1.043 –1.040 –1.095 –1.098 –1.099 –1.372 –1.103(7.89)** (7.87)** (8.53)** (8.50)** (8.55)** (10.41)** (8.53)**
lrate –9.423 –9.436 –9.471 –31.629 –9.467 –34.200 –31.459(1.86) (1.87) (1.94) (1.39) (1.93) (1.41) (1.38)
lpop_total 2.361 8.951 1.011 8.940 0.359 0.965(1.32) (4.09)** (6.61)** (4.08)** (2.51)* (5.99)**
lweo_gdpcusd 4.314(4.92)**
lweo_econ 4.293 –0.088 –0.086(4.89)** (0.87) (0.91)
lweo_busi 4.376(4.96)**
ldist 28.261 28.251(6.75)** (6.74)**
Constant 68.945 33.444 –103.836 –18.157 –104.172 223.839 –18.393(2.12)* (0.79) (2.10)* (0.12) (2.10)* (1.42) (0.12)
Observations 355 355 355 355 355 355 355
R-squared 0.59 0.60 0.62 0.74 0.62 0.70 0.74
DUMMY VARIABLES
YEAR YES YES YES YES YES YES YES
QUARTER YES YES YES YES YES YES YES
MARKET YES YES YES YES YES YES YES
YEAR-QUARTER YES YES YES YES YES YES YES
FARE CLASS YES YES YES YES YES YES YES
YR-Q-ORG NO NO NO NO YES YES YES
DISTANCE (Miles) MED MED MED MED MED MED MED
(continued on next page)

86 | Republic of Armenia: Accumulation, Competition, and Connectivity
Table A6.1. Pooled OLS Regression Results, Aggregate Fare Elasticities (cont'd.)
(8) (9) (10) (11) (12) (13) (14)
lpax lpax lpax lpax lpax lpax lpax
lfare –0.673 –0.673 –0.686 –0.796 –0.796 –0.796 –0.782
(5.46)** (5.45)** (5.55)** (5.71)** (5.71)** (5.71)** (5.61)**
lrate –2.457 –2.479 –2.323 3.004 3.004 3.004 3.277
(0.45) (0.45) (0.42) (0.10) (0.10) (0.10) (0.11)
lpop_total 12.214 7.597 0.516 0.516 0.516 0.567
(0.59) (0.36) (1.09) (1.09) (1.09) (1.20)
lweo_gdpcusd
lweo_econ 2.743 –1.142 –1.142 –1.142
(0.63) (1.38) (1.38) (1.38)
lweo_busi 3.882
(0.88)
ldist
Constant 23.271 –180.193 –127.485 –9.661 –9.661 –9.661 –23.200
(0.66) (0.52) (0.37) (0.05) (0.05) (0.05) (0.12)
Observations 423 423 423 423 423 423 423
R-squared 0.35 0.35 0.35 0.39 0.39 0.39 0.39
DUMMY VARIABLES
YEAR YES YES YES YES YES YES YES
QUARTER YES YES YES YES YES YES YES
MARKET YES YES YES YES YES YES YES
YEAR-QUARTER YES YES YES YES YES YES YES
FARE CLASS YES YES YES YES YES YES YES
YR-Q-ORG NO NO NO NO YES YES YES
DISTANCE (Miles) LONG LONG LONG LONG LONG LONG LONG
Source: Authors.

Air Connectivity | 87
Table A6.2. Pooled OLS Regression Results, Economy and Business Class Fare Elasticities
(1) (2) (3) (4) (5) (6) (7)
lpax lpax lpax lpax lpax lpax lpax
lfare_economy –1.453 –1.452 –1.487 –1.414 –1.540 –1.757 –1.450
(9.48)** (9.49)** (10.03)** (9.70)** (10.13)** (11.70)** (9.72)**
lfare_busi –0.372 –0.361 –0.443 –0.587 –0.333 –0.652 –0.511
(1.97)* (1.92) (2.42)* (3.38)** (1.69) (3.32)** (2.75)**
lrate –9.974 –9.994 –10.003 –32.703 –10.095 –35.864 –33.080
(2.03)* (2.04)* (2.11)* (1.48) (2.14)* (1.53) (1.50)
lpop_total 2.607 8.901 0.965 8.917 0.478 1.021
(1.51) (4.20)** (6.47)** (4.21)** (3.41)** (6.50)**
lweo_gdpcusd 4.128
(4.85)**
lweo_busi 3.965
(4.63)**
ldist 26.371 26.129
(6.43)** (6.37)**
Constant 68.616 29.404 –101.765 0.695 –100.719 228.263 3.567
(2.18)* (0.72) (2.12)* (0.00) (2.11)* (1.50) (0.02)
Observations 355 355 355 355 355 355 355
R-squared 0.62 0.62 0.65 0.75 0.65 0.72 0.76
DUMMY VARIABLES
YEAR YES YES YES YES YES YES YES
QUARTER YES YES YES YES YES YES YES
MARKET YES YES YES YES YES YES YES
YEAR-QUARTER YES YES YES YES YES YES YES
FARE CLASS YES YES YES YES YES YES YES
YR-Q-ORG NO NO NO YES YES YES NO
DISTANCE (Miles) MED MED MED MED MED MED MED
Source: Authors.
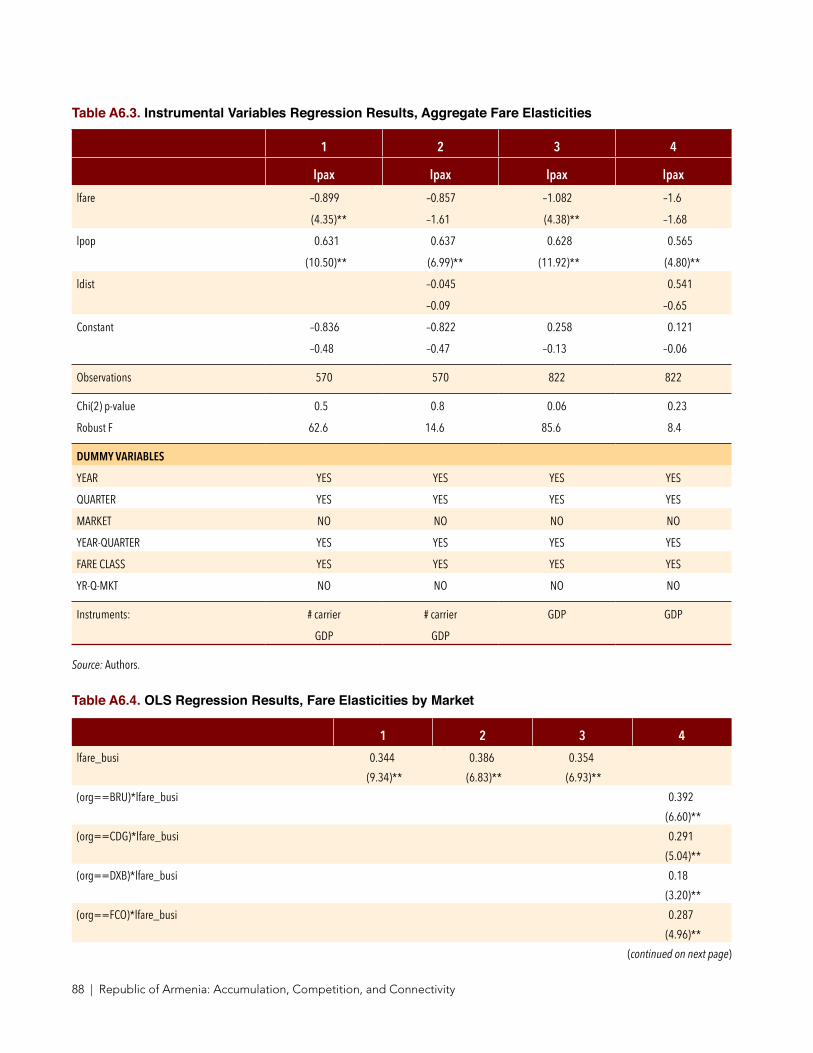
88 | Republic of Armenia: Accumulation, Competition, and Connectivity
Table A6.3. Instrumental Variables Regression Results, Aggregate Fare Elasticities
1 2 3 4
lpax lpax lpax lpax
lfare –0.899 –0.857 –1.082 –1.6
(4.35)** –1.61 (4.38)** –1.68
lpop 0.631 0.637 0.628 0.565
(10.50)** (6.99)** (11.92)** (4.80)**
ldist –0.045 0.541
–0.09 –0.65
Constant –0.836 –0.822 0.258 0.121
–0.48 –0.47 –0.13 –0.06
Observations 570 570 822 822
Chi(2) p-value 0.5 0.8 0.06 0.23
Robust F 62.6 14.6 85.6 8.4
DUMMY VARIABLES
YEAR YES YES YES YES
QUARTER YES YES YES YES
MARKET NO NO NO NO
YEAR-QUARTER YES YES YES YES
FARE CLASS YES YES YES YES
YR-Q-MKT NO NO NO NO
Instruments: # carrier # carrier GDP GDP
GDP GDP
Source: Authors.
Table A6.4. OLS Regression Results, Fare Elasticities by Market
1 2 3 4
lfare_busi 0.344 0.386 0.354
(9.34)** (6.83)** (6.93)**
(org==BRU)*lfare_busi 0.392
(6.60)**
(org==CDG)*lfare_busi 0.291
(5.04)**
(org==DXB)*lfare_busi 0.18
(3.20)**
(org==FCO)*lfare_busi 0.287
(4.96)**
(continued on next page)

Air Connectivity | 89
1 2 3 4
(org==FRA)*lfare_busi 0.211
(3.82)**
(org==LHR)*lfare_busi 0.651
(9.38)**
(org==MOW)*lfare_busi 0.436
(4.89)**
(org==PRG)*lfare_busi 0.266
(3.74)**
(org==VIE)*lfare_busi 0.461
(7.61)**
(org==BRU)*lfare –1.31 –1.288 –1.626
(4.04)** (3.52)** (4.37)**
(org==CDG)*lfare –0.962 –0.916 –0.907
(3.91)** (3.31)** (3.38)**
(org==DXB)*lfare –0.616 –0.546 –0.562
(1.36) (1.4) (1.28)
(org==FCO)*lfare –0.418 –0.443 –0.384
(1.43) (1.36) (1.36)
(org==FRA)*lfare –0.757 –0.734 –0.53
(3.02)** (2.62)** (2.04)*
(org==LHR)*lfare –1.376 –1.415 –2.721
(6.03)** (5.29)** (8.23)**
(org==MOW)*lfare –1.286 –1.306 –1.33
(5.49)** (6.58)** (5.87)**
(org==PRG)*lfare –1.578 –1.607 –1.332
(5.66)** (6.74)** (4.34)**
(org==VIE)*lfare –1.29 –1.292 –1.724
(5.01)** (5.72)** (6.01)**
Lrate –8.456 –10.366 –6.598 –9.007
(2.33)* (2.22)* –1.24 (2.57)*
lpop_total 3.272 1.596 3.248 –2.018
(3.08)** (2.33)* (2.90)** (1.57)
lweo_econ –0.311 0.008 –4.833
(0.29) (0.08) (4.27)**
lweo_busi –0.257 1.755 –4.482
(0.24) (2.20)* (3.90)**
Observations 822 366 456 822
R-squared 0.56 0.7 0.43 0.6
Source: Authors.
Table A6.4. OLS Regression Results, Fare Elasticities by Market (continued)

90 | Republic of Armenia: Accumulation, Competition, and Connectivity
Table A6.5. Pooled OLS Regression Results, Determinants of Fares
(1) (2) (3) (4) (5) (6) (7) (8) (9)
lfare lfare lfare lfare lfare lfare lfare lfare lfare
ldist –10.058 –10.058 0.365 0.341 –10.027 –10.027 0.367 0.344 1.125
(396.55)** (396.55)** (0.73) (0.68) (556.27)** (556.27)** (0.73) (0.68) (4.42)**
lhhi 0.445 0.445 0.439 0.635
(2.85)* (2.85)* (3.53)** (4.93)**
lweo_gdpcusd 2.163 2.556 0.083 0.036 2.160 2.551 0.085 0.039 0.856
(50.54)** (64.83)** (1.37) (0.80) (48.05)** (60.14)** (1.45) (0.87) (2.49)*
lpop_total –0.444 –0.442
(111.55)** (145.05)**
lhhi_coach 0.525 0.525 0.518 0.714 0.572
(3.35)* (3.35)* (3.24)* (4.17)** (6.55)**
lhhi_disc 0.170 0.170 0.163 0.359 0.399
(1.46) (1.46) (1.18) (1.84) (5.41)**
lhhi_busi 0.637 0.637 0.633 0.829 1.054
(2.61)* (2.61)* (3.91)** (11.05)** (7.10)**
ls_coach 0.067
(4.45)**
ls_disc 0.001
(0.03)
ls_busi 0.082
(3.71)*
Constant 71.456 60.258 –1.548 –2.586 69.493 58.173 –3.480 –4.370 –19.418
(96.11)** (65.05)** (0.51) (0.99) (41.35)** (33.18)** (0.92) (1.28) (3.49)*
Observations 537 537 537 537 537 537 537 537 394
R-squared 0.64 0.64 0.60 0.59 0.65 0.65 0.62 0.61 0.62
DUMMY VARIABLES
BOOKING CLASS YES YES YES YES YES YES YES YES YES
YEAR YES YES YES YES YES YES YES YES YES
QUARTER YES YES YES NO YES YES YES NO NO
DESTINATION YES YES NO NO YES YES NO NO NO
YEAR-Q-DEST YES YES YES YES YES YES YES YES YES
Source: Authors.

Air Connectivity | 91
Econometric modelsThe first pricing equation to be estimated follows the basic functional form adapted from Borenstein (1989) and Brueckner, Dyer and Spiller (1992) using a pooled OLS regression . Each observation includes the aver-age price paid by all passengers in a specific booking class, as well as the total passenger count in that class, for each year/quarter and market . The specification in-cludes a number of variables capturing market demand characteristics (distance, income, population mass), and factors that seemingly determine market power (con-centration by market, and by airport, measured by the highest share from all carriers operating in that market) . In this particular model, a single coefficient is estimat-ed for the market (route) concentration (captured by the coefficient associated to HHI) . A series of dummies are included to control for market specific inobserv-ables, fixed effects by booking class, as well as seasonal shocks and market specific-time shocks .
ln FAREijk = α + β1 ln DISTANCEi + β2 ln POPULATIONij + β3 ln GDPij + β4 ln HHIij + ∑z βz DTIMEj + ∑u βuDDESTINATIONi + ∑n βnDYEARDESTij + ∑e βeDCLASSk+ εijk
A second specification was introduced in order to account for market concentration effects on fares by booking class, using a varying coefficient model (Hsiao 1986) . Instead of running separate regressions for each booking class, the Herfindhal index is interacted with each booking class dummy as depicted in the equa-tion below . Furthermore, the highest market share at the destination computed for all carriers operating in a particular route is included to control for any pre-miums associated with airport market power (see also Stavins 1996 in addition to the mentioned articles) .
ln FAREijk = α + β1 ln DISTANCEi + β2 ln POPULATIONij + β3 ln GDPj + DECON * β4 ln HHIij + DDISC * β5 ln HHIij + DBUSI * β6 ln HHIij + DECON * β7 ln SHAREij + DDISC * β8 ln SHAREij + DBUSI * β9 ln SHAREij + ∑z βzDTIMEj + ∑u βu DDESTINATIONi + ∑n βnDYEARDESTij + ∑e βeDCLASSk + εijk
In order to estimate the own-price elasticities we use a log linear travel demand functional form commonly used in the literature (see Intervistas 2006; Gillen et al 2003) using a pooled OLS regression approach . In this case, the dependent variable is Passenger traffic by
market, booking class, and time of the year, whereas the coefficient associated to fares can be interpreted as the elasticity . The equation below exhibits the other vari-ables used as controls and to capture structural charac-teristics of air travel demand, including any unobserv-ables and specific market and time shocks, as before .
ln Paxijk = α + β1 ln DISTANCEi +β2 ln POPULATIONij + β3 ln GDPij + β4 ln FAREij + β5 ln FXij + ∑z βz DTIMEj + ∑u βu DDESTINATIONi + ∑n βn DYEARDESTij + ∑e βe DCLASSk + εijk
A similar approach is to use the varying coefficient model to capture different own-price elasticities by booking class, where each fare is interacted with the corresponding dummy variable . It should be noted that the generic variable DCLASS is exactly equivalent to the booking class dummies (DECON, DDISC and DBUSI) and enunciated in such form only due to nota-tion purposes .
ln Paxijk = α + β1 ln DISTANCEi + β2 ln POPULATIONij + β3 ln GDPij + DECON * β4 ln FAREij + DDISC * β5 ln FAREij + DBUSI * β6 ln FAREij +β7 ln FXij + ∑z βzDTIMEj + ∑u βuDDESTINATIONi + ∑n βnDYEARDESTij + ∑e βeDCLASSk + εijk
Now that all models have been described, it is important to turn to a number of known estimation and data related issues that might affect the estimation . We reproduce the following from Oum, Waters and Yong (1990):
¾ Intermodal competition: Air travel demand can be affected by changes in the prices and service qual-ity of other modes . For short-haul routes (markets) the relative price and service attributes of auto and train would need to be included in any model; par-ticularly for short-haul markets . Failure to include the price and service attributes of substitutes will bias the elasticity . For example, if airfares increase and auto costs are also increasing, the airfare elas-ticity would be overestimated if auto costs were excluded .
¾ Market aggregation: As the level of aggregation increases the amount of variation in the elastici-ty estimates decreases . This occurs because ag-gregation averages out some of the underlying

92 | Republic of Armenia: Accumulation, Competition, and Connectivity
variation relating to specific contexts . Since air travel market segments may differ significant-ly in character, competition and dominance of trip purpose, interpreting a reduction in vari-ation through aggregation as a good thing would be erroneous . Such estimates might have relatively low standard deviations but would be also be relatively inaccurate when used to assess the effect of changes in fares in a specific market .
¾ Identification problem: In most cases only de-mand functions are estimated in attempts to measure the demand elasticity of interest . How-ever, it is well known that the demand function is part of a simultaneous equations system con-sisting of both supply and demand functions . Therefore, a straightforward estimation of only the demand equation will produce biased and inconsistent estimates . The problem of iden-tification can be illustrated by describing the process by which fares and travel, for example, are determined in the origin-destination market simultaneously . To model this process in its en-tirety, we must develop a quantitative estimate of both the demand and supply functions in a system . If, in the past, the supply curve has been shifting due to changes in production and cost conditions for example, while the demand curve has remained fixed, the resultant intersection points will trace out the demand function . On the contrary, if the demand curve has shifted due to changes in personal income, while the supply curve has remained the same, the inter-section points will trace out the supply curve . The most likely outcome, however, is movement of both curves yielding a pattern of fare, quan-tity intersection points from which it will be dif-ficult, without further information, to distinguish the demand curve from the supply curve or esti-mate the parameters of either .
¾ Cross-sectional data: In the long run demand elasticities for non-durable goods and services are larger in absolute terms, than in the short run . This follows because in the long run there are many more substitution possibilities that can be used to avoid price increases or service qual-ity decreases . In effect there are more opportu-nities to avoid these changes with substitution possibilities . Data tends to be cross-sectional
or time-series although more recently panels have become available . A panel is a combina-tion of cross-section and time-series—informa-tion on several routes for a multi-year period is a panel . Cross-sectional information is general-ly regarded as indicating short run elasticities while time-series data is interpreted as long run elasticities . In time-series data the information reflects changes in markets, growth in income, changes in competitive circumstances, for ex-ample . Policy changes should rely on long run elasticities since these are long run impacts that are being modelled . Short run elasticities be-come important when considering the compet-itive position of firms in a highly dynamic and competitive industry .
Dataset
Fares and Passenger TrafficThe dataset comprises CRS MIDT fares and pas-senger traffic for 13 markets connected to Yerevan by air (including Brussels, Paris, Dusseldorf, Dubai, Rome, Frankfurt, New York, London Heathrow, Moscow Dedomodevo and Sheremetyevo, Prague, and Vienna), between May 2002 and April 2005 . The markets were chosen on the basis of largest non-stop capacity share from Yerevan, excluding those segments shorter than 1400km to avoid bi-ases in yield .
This includes all traffic bookings from two economy class fares (coach and discount), business and first (the latter not used in the estimations though) ac-quired from a CRS (Computer Reservation System) and excludes all taxes from the fare computation . It does not include pre-CRS methods like visiting an airline office –common in Armenia- and post-CRS methods such as direct internet purchases .
Other variablesThe population and per capita GDP variables were obtained from IMF World Economic Outlook Data-bases . Whereas the concentration and market share variables were constructed with DIIO data on airline level-route capacity for all relevant periods . Dis-tance between markets was obtained from the same source .

Air Connectivity | 93
VariablesFARE: average paid fare for roundtrip ticket between Yerevan and market i, for booking class k on year and quarter j
PAX: passenger traffic count between Yerevan and market i, for booking class k on year and quarter j
HHI: Herfindahl concentration index for market i, on year and quarter j (HHI=10000 indicates a single carrier operates in that market)
SHARE: maximum market share of all carriers operat-ing between Yerevd market i, on year and quarter j
DISTANCE: distance in kilometers between Yerevan and market i
POPULATION: total population mass of Armenia and market i (proxied by total country population) on year and quarter j
GDP: combined current per capita GDP (in US dollars) of Armenia and market i on year and quarter j
FX: exchange rate between Armenian Drams with mar-ket’s i on on year and quarter j
DECON, DDISC, DBUSI: dummy variable for economy (coach), discount and business class passenger count/fare
DCLASS: dummy variable for economy, discount and business class segments k
DTIME: year/quarter j dummy
DDESTINATION: market i dummy
DYEARDEST: year/quarter-market dummy
Table 6.2. Summary of Selected Studies on Air Transport Liberalization
Author Tested Effects/ Methodology Results
Hummels et al (2010) Effect of US Open Skies Agreements on passenger traffic, based on Difference in Difference estimator.
Traffic growth in new routes following three years after the liberalization reaches 6% and close to 9% after the third year. Traffic growth rates after year 3 increase 7.2% in new routes.
Piermartini and Rousova (2008) Effects of liberalization on passenger traffic, using a synthetic air liberalization index (ALI) as independent variable (WTO/QUASAR database).
An increase in the degree of liberalization from the 25th percentile to the 75th percentile (using a synthetic indicator of restrictiveness) increases passenger traffic volumes between countries with direct air services by approximately 30 per cent. Traffic increases are higher when cabotage, seventh freedom, free determination of capacity and multiple designation provisions are included.
Warnock-Smith and Morrell (2008) Country-pair case studies (Caribbean-US). Study estimates the effects of liberalization on passenger traffic (based on US DOT T-100 database).
Positive relationship between more liberal bilateral agreements and entry and traffic/ capacity growth, suggesting a direct link between liberalization and incoming tourism to the region. Positive statistical relationship between liberalization and traffic/capacity growth; carrier entry leads to greater output and competition levels. The number of effective competitors and LCC entry has also been greater in those markets with lower entry barriers.
Micco and Serebrisky (2006) Effect of Open Skies Agreements on average air cargo rates based on U.S. import data.
Open Skies Agreements on average reduces airfares by 9 percent and increases the share of imports arriving by air by 7 percent three years after the OSA is signed (in developed and upper-middle income countries).
Clougherty, Dresner and Oum (2001)
Effect on Canadian air passenger traffic of dual designation and partially liberalized ASAs, based on panel data for 33 bilateral markets.
Dual designation can increase traffic up to 280,000 passengers/year for Canadian carriers and up to 270,000 for foreign carriers. Liberalized bilateral can increase total traffic up to 240,000 passengers/year.
Oluwakoya (2011) Impact of Deregulation and liberalization in Nigerian air transport industry. Based on documentary research.
Freight and passenger traffic increased 54 percent and 9.4 percent per annum, respectively, during the period 2000 to 2004.

94 | Republic of Armenia: Accumulation, Competition, and Connectivity
Author Tested Effects/ Methodology Results
Button (1998) Impact of deregulation in US domestic markets since 1978’s Airline Deregulation Act. Based on documentary research.
In the decade after 1978’s Airline Deregulation Act, U.S. domestic market passenger enplanements rose by 55 percent, scheduled revenue passenger-miles grew by over 60 percent, and employment in the industry increased by 32 percent. Real costs of travel fell by about 17 percent on major routes. Air travelers have gained an estimated $12.4 billion annually (in 1998 dollars) from lower fares and another $10.3 billion from reduced travel time between 1978–1998.
INTERVISTAS (2006) Impact in traffic growth of liberalization of United States-United Kingdom, intra European Union, United Arab Emirates-U.K. and Germany, Australia-New Zealand and Malaysia-Thailand markets. Based on documentary evidence.
Traffic growth subsequent to liberalization of air services agreements between countries typically averaged between 12% and 35%, significantly greater than during years preceding liberalization. In a number of situations, growth was at rates exceeding 50%, and in some cases reached almost 100% of the pre-liberalization rates.
CAA Impact of UK-India liberalization based on documentary evidence.
The capacity limit on airlines operating between India and the UK on the core routes between Delhi-Mumbai and London Heathrow more than tripled between 2004 and 2006. The number of direct services between India and the UK rose from 34 to 112 services per week. The increase in services has been provided by a combination of carriers already serving the market (British Airways, Virgin and Air India) and new entrants. Passenger numbers on direct services have doubled in the period since liberalisation, from around 87,000 to 181,000 between 2004 and 2006. The increase in capacity and competition has led to significant reductions in the fares for travel between the UK and India.
ComMark Trust (2006) Impact of air transport liberalization in African countries based on documentary, econometric and statistical evidence.
Monthly passenger volumes increased by 69 percent between 2000 and 2005 over the pre-liberalisation trend on the Nairobi–Johannesburg route. During the 1990s and early 2000s passenger volumes on domestic routes in South Africa increased by more than 80 percent. Liberalisation allowed for the entry of two low-cost airlines. Based on econometric evidence comprising 56 routes on 12 SADC member states, results show that air fares are 18 percent lower on liberalized routes. Impact of liberalization on passenger volumes from 1999 to 2004 on 16 routes between Johannesburg and other destinations in SADC shows that in country pairs with more liberal bilateral agreements, passenger volumes increased by an average of 23 percent, and that large, once-off increases in capacity allowed by the bilateral agreements further increased passenger volumes by an average of 12 percent.
Dresner and Tretheway (1992) Impact on air fares of liberalization in US international routes for 1976–1981.
Liberal bilateral agreements had a substantial effect in fare reduction for the discount economy fare segment, whereas competitive routes showed 35 percent lower fares than non competitive routes
Maillebiau and Hansen (1995) Impact of liberalization in Transatlantic air travel demand, between US and UK, France, West Germany, the Netherlands and Italy between 1970–1989.
Liberalization increased service accessibility (measured by the total number of enplanements per year on those gateways with non-stop services to the partner country) by 55 percent; yields are 35 percent lower.
Dresner and Windle (1992) Effect of US partial liberal agreements compared to liberal agreements between 1976–1987.
US liberal agreements increased passenger traffic by 11 percent vis-à-vis partially-liberal bilateral air service agreements.
Annex 6.2. Summary of Selected Studies on Air Transport Liberalization (cont'd.)

Internet and Communications Technology (ICT) | 95
7. Internet and Communications Technology (ICT)
key to unlock that potential . This will require reforms to build confidence of foreign and domestic investors . It would be achieved through strengthening the regula-tory and law enforcement environment especially in the areas of intellectual property and data confidentiality and promotion activities to raise awareness of foreign investors about the opportunities . At the same time, ef-forts should be made to reduce barriers to growth, by addressing the low level of competition in the telecom market, introducing a more favorable tax regime and strengthening labor force skills in line with the changing demands of the fast developing industry .
This chapter assesses Armenia’s readiness for the fur-ther expansion of the ICT sector and identifies gaps and weaknesses in number of areas. The first section gives an overview of the status of the sector . The sec-ond section looks at its readiness for expansion based on the Location Readiness Index (LRI), a tool developed by the World Bank in partnership with McKinsey & Co . Armenia’s performance is being benchmarked against India (global industry leader), USA (major market), and Indonesia (case study country), with both the USA and Russia considered as two main destination markets . The third section highlights reform recommendations .
The IT-based Services Industry in ArmeniaStatus of the Information Technology Sector in Armenia
Historically, Armenia had a strong standing in tech-nological research and development activities in the region. Since 1991, the sector has shifted its focus towards development of software and applications,
The development of the Armenian ICT sector has seen rapid progress in recent years. Although its size is still comparatively small, its rapid development and prospects attract foreign investments . The sector is cre-ating jobs, and 35 percent of the workers are women . Armenia has a comparative advantage in a number of areas important for ICT sector development, such as a high number of graduates of higher education and a very competitive cost base . The ICT sector as a whole may be characterized as relatively matured, which pro-vides the opportunity for further expansion . At the same time, Armenia is facing a number of competitive disad-vantages, which keeps it from benefiting from the full potential of the ICT sector . Among such disadvantag-es are a monopolistic market structure of the telecom sector, poor connectivity, lack of good office space, and overall a rather high risk profile of the country .
The ICT sector has been an engine of growth in many countries. Between 2000 and 2009, ICT invest-ments were more important for growth than non-ICT investments in OECD countries .95 The economic litera-ture has identified multiple channels through which the ICT sector can have an impact on growth and economic integration . In particular, broadband infrastructure and IT-based services are recognized as key enablers for do-mestic productivity, competitiveness, job creation and economic diversification, a tool to foster cross border trade, foreign direct investment (FDI) and regional eco-nomic integration .
The ICT sector could play a key role in Armenia’s in-tegration into the global economy. It holds impressive potential and further investments into the sector are the
95 OECD, 2011 .

96 | Republic of Armenia: Accumulation, Competition, and Connectivity
outsourcing, IT-based services and modernizing tele-communication infrastructure . In the early 2000s, active development of the IT sector began when the govern-ment declared it as one of the main priorities for the country’s economic development . Nearly 80 percent of the companies now active in the sector were started during 2000–10, both local start-ups and branches of international companies . In 2010, the number of op-erating IT companies reached 200, of which 72 were subsidiaries of foreign companies with a market share of 52 percent .
The sector is mostly oriented towards exporting software. The majority of the IT firms specialize in in-ternet services, web development and IT consulting . Internet services generated over 34 percent of the sec-tor’s revenues in 2010 . Local companies are starting to become more active in engineering, systems develop-ment, and research and development (R&D) . In 2010, the size of the domestic market totaled $91million, and the turnover of the software and services sector reached $150 million . Most of the foreign investments in the sector come from North America .
The sector is also creating jobs, with a significant share going to women. In 2008–10, the sector em-ployed nearly 5,000 professionals, 83 percent of which are technical specialists and 17 percent are business and management specialists . Interestingly, 53 percent of the workers are employed by foreign companies and 35 percent of the total workers are female . The average monthly salary of IT specialists is $1,200–1,500 which is 4–5 times higher than the average salary .96
The IT industry is contributing to exports, although at a small scale. The sector’s contribution to total ex-ports reached 8 .5 percent in 2010, 82 percent of which was generated by foreign companies . The largest por-tion of exports go to the United States and Canada (70 percent), 19 percent go to Europe and around 8 percent to Russia and CIS markets .
The government has adopted a strategy to expand the IT sector, with some specific initiatives already being implemented. The main policy document
96 The Open Society Institute, EurasiaNet .org, “Armenia aimed to become post-soviet Silicon Valley”, http://russian .eur-asianet .org/node/59057 .
outlining the strategy is the ICT Master Strategy . It aims to create a vibrant and sustainable ICT industry that promotes growth in other sectors of the Arme-nian economy and positions Armenia in the global knowledge economy .97 The strategy suggests lever-aging the capacities of national IT professionals and creating a favorable environment for collaboration and competition among IT firms . The government also supports ICT infrastructure, computer literacy, computer saturation and internet access, and use of e-services systems .
Readiness for an Extension of the IT Sector
The Location Readiness Index (LRI) can be used to assess Armenia’s readiness for an expansion of the IT sector. The LRI is a modeling tool devel-oped by the World Bank in partnership with McK-insey designed to help countries identify existing gaps and weaknesses . 98 It allows policy makers to prioritize areas important for increasing the country’s attractiveness for IT investment . Six criteria are eval-uated: talent pool availability, cost structure, qual-ity of infrastructure, key risks, overall environment, and sector maturity . Scores along these six criteria range between 1 and 5, with 1 meaning ‘extremely favorable’ and 5 meaning ‘not ready’ . An assessment was conducted for Armenia in comparison with India (global industry leader), USA (major market), and In-donesia (case study country), with both the USA and Russia considered as two main destination markets (Figure 7 .1) .
The talent pool index shows opportunities as well as challenges to the growth of the Armenian IT sec-tor. A competitive telecommunications market and the availability of skilled talent are the most important factors in the growth of an IT-based services industry . Based on the numbers of the 2012 Statistical Yearbook of Armenia, there are about 34,000 graduates each year who may be employed in the ICT industry . The talent pool assessment in the LRI diagnostic calculates
97 United Nations Asian and Pacific Training Center for Informa-tion and Communication Technology for Development, “ICT Mas-ter Strategy for Republic of Armenia”, http://www .unapcict .org/ecohub/resources/ict-master-strategy-for-republic-of-armenia .
98 The World Bank, Location Readiness Index (LRI) Toolkit, http://www .infodev .org/en/Publication .986 .html .

Internet and Communications Technology (ICT) | 97
the: (i) suitability; (ii) willingness; (iii) accessibility; and (iv) trainability of university graduates in subjects that may be of interest to IT/ITES companies . Calculations were carried out for each of the four traditional ICT business lines: data processing, voice processing, knowledge processing and IT services .
Armenia has an advantage in voice services rel-ative to data and knowledge processing and IT services. With a score of 4 .2, Armenia appears to be better endowed than Indonesia in terms of the pro-portion of graduates suitable for voice services . This is largely due to a relatively high number of graduates in
Figure 7.1. Overall Location Readiness Index (LRI) for IT/ITES
3.0 4.2
1.8
2.5
3.3
3.0
2.8
3.1
3.1
2.1
2.9
4.1
3.7
5.0
1.8
1.5
3.3
2.9
1.0 1.0
3.5 1.5 1.4
1.6
Generalists - DataLocation Readiness
Index
Talent
Cost
Infrastructure Risk
Environment
Industry Maturity
Armenia LRI=3.08
Indonesia LRI=3.13
India LRI=1.8
USA LRI=1.9
3.0
4.2
1.9
2.5 3.3
3.0
2.8
3.5 4.4
2.2
2.9
4.1
3.7
5.0
2.3 2.7
1.6
3.3
2.9
1.0
1.9
1.0
3.7 1.5 1.4
1.6
Armenia LRI=3.18
Indonesia LRI=3.52
India LRI=2.3
USA LRI=1.9
Generalists - VoiceLocation Readiness
Index
Talent
Cost
Infrastructure Risk
Environment
Industry Maturity
3.2 4.8
2.0
2.5
3.3
3.0
2.8
3.7
4.7
2.2
2.9
4.1
3.7
5.0
2.2 1.6
2.3
3.3
2.9
1.0
3.0
3.3
4.8 1.5 1.4
1.6
Armenia LRI=3.10
Indonesia LRI=3.72
India LRI=2.2
USA LRI=3
Knowledge Process Location Readiness
Index
Talent
Cost
Infrastructure Risk
Environment
Industry Maturity 3.2
4.9
1.8
2.5
3.3
3.0
2.8
3.5
4.3
2.2
2.9
4.1
3.7
5.0
2.0
1.1
1.9
3.3
2.9
1.0
3.8
4.8 1.5 1.4
1.6
Armenia LRI=3.12
Indonesia LRI=3.52
India LRI=2
USA LRI=3.1
IT ServicesLocation Readiness
Index
Talent
Cost
Infrastructure Risk
Environment
Industry Maturity
Source: Authors.

98 | Republic of Armenia: Accumulation, Competition, and Connectivity
general disciplines who speak well Russian and English (about 7,300) . The talent pool index for data services is assessed at 4 .2 as well, but this is much lower com-pared to Indonesia (3 .1), India (1 .0) and the USA (1 .0) for the same group . Knowledge processing (4 .81) and IT Services (4 .95) are two groups where Armenia has to improve the most in terms of talent pool readiness .
Although Armenia produced a large number of high-er education graduates, only a small number is read-ily employable in the IT sector. Armenian tertiary insti-tutions produce around 6,500 graduates with degrees in business management and economics who are of in-terest to the knowledge processing sector, and anoth-er 1,600 with IT related degrees employable in the IT sector . Nonetheless, the ready-to-hire population for knowledge (1,800) and IT groups (500) is very small . Of the 34,000 graduates with potential to be employed in the ICT sectors, only 18,600 are actually ready to be hired, and 38,100 could become suitable if given train-ing of a maximum of six months (Figure 7 .2)99
99 The suitability, accessibility, willingness, and trainability esti-mates are based on the insights from the interviews with compa-nies such as EBS Llynx, OMD, National Instruments and Integrator conducted by the Enterprise Incubator Foundation (EIF, 2010) .
Armenia has a very competitive cost base, largely due to the relatively low wages. Four cost categories are considered: labor; facilities; IT/Telecommunica-tions; and selling, general, and administrative (SG&A) expenses (Figure 7 .3) .100 Labor costs, which account for more than half of the total cost, include not only the salaries for direct employers, but also salaries for management and support staff . Note that the compar-atively low cost of employment of engineers in the IT sector is due to their low support and management expenses . This gives the ICT sector in Armenia a very prominent position .
Despite decreasing connectivity costs, Armenia re-mains at a competitive disadvantage because of the monopolistic market structure of the telecom sec-tor. After price cuts in recent years for broadband, the connectivity costs dropped significantly . According to
100 The cost index calculation of the LRI is made up of two main components . The first component, “hourly cost of doing business,” takes into account the hourly cost per full time work-er doing a particular job needed to keep an IT-based services firm running . The second component measures the incentives offered by the government authorities to companies operating in the IT/ITES industry .
Figure 7.2. Armenia’s Ready-to-Hire Population
Graduatecategory
Totalgraduates
(thousands)
Suitability(percent)
Accessibility(percent)
Willingness(percent)
Ready to hire(thousands)
Trainability(percent)
Trainable(thousands)
26 7.3 16.5
26 7.3 16.5
6.5 1.8 4.1
1.6 0.4 1.0
TOTAL 18.6 38.1
GeneralistsData
50 80 70 70
GeneralistsVoice
50 80 70 70
KnowledgeProcessors 50 80 70 70
IT Specialists 50 80 70 70
Source: Authors.

Internet and Communications Technology (ICT) | 99
TeleGeography, a 1Mbps international transit TCP/IP traffic service reached the price of $217 .2 per month . However, the Armenian communications sector still suffers from a lack of competition on the domestic wholesale internet market . The two monopolistic play-ers, as reported by the State Commission for the Pro-tection of Economic Competition of Armenia, are PTO ArmenTel and FiberNet Communications .
The LRI analysis suggests that the quality of in-frastructure in Armenia is favorable. The quality of infrastructure was measured along four different cate-gories, collecting a total of nine indicators to analyze the availability, quality and reliability of Armenia’s tele-communications, real estate, power supply, and trans-portation infrastructure . With an overall score of 2 .45, Armenia performs better than Indonesia (2 .91) and In-dia (3 .28), but its infrastructure readiness has not yet reached the level of the USA (1 .45), which is a model country for infrastructure development .
Armenia suffers from poor connectivity, lack of good office space, and inadequate roads and rail-ways. Armenia ranked 71st (out of 144 countries) in terms of infrastructure development in the latest Global Competitiveness Report,101 which in addition to communications and power supply infrastructure
101 World Economic Forum, The Global Competitiveness Re-port 2012–2013, http://www3 .weforum .org/docs/WEF_Global-CompetitivenessReport_2012–13 .pdf
takes into account the readiness of transport such as quality of roads, railways, ports, and air transportation . Fixed-broadband penetration is low (around 3 per-cent), but there are many positive signs for growth in Armenia’s broadband sector . The Ministry of Economy of Armenia plans to build and expand a mixture of fi-ber-optic, WiMAX, and satellite technologies working to develop the country’s high-speed broadband net-work at a cost of approximately $24 million .102
Armenia’s risk profile is on the higher side. The coun-try risk component of the LRI measures three areas: transparency, stability, and predictability of a coun-try’s regulatory environment (regulatory risk); macro-economic and currency stability and capital freedom (country investment risk); and the adequacy of intellec-tual property and data protection (data risk) . With this decomposition, Armenia’s overall risk profile is high compared to India and USA, but is lower than Indo-nesia’s . Armenia needs major improvements in trans-parency and fairness of the legal system, the business regulatory environment, data risk, currency exchange stability, bureaucracy and macroeconomic Stability .
Armenia needs further improvements of business and living environment. By combining an assessment of general government support of business (including
102 See http://www .itu .int/ITU-D/ict/newslog/Ministry+Reveals+High+-Speed+Broadband+Network+Plan+Armenia .aspx
Figure 7.3. Armenia Cost of Operations(full time equivalent per hour, in US dollars)
IT Services
Generalists - Data
Labor
Facilities
IT/Telecommunications
SG&A
TOTAL
Generalists - Voice Knowledge Process
5.57
3.13
0.5
1.08
10.2
6.70
.049
5.57
1.20
11.3
8.14
3.77
0.5
1.45
13.8
4.7
4.06
0.5
1.11
10.3
Source: Authors' calculations.

100 | Republic of Armenia: Accumulation, Competition, and Connectivity
bureaucratic burden and corruption), overall business environment, quality of life (including desirability of location, disease burden, and crime), and accessibil-ity to the main markets where services are expected to be delivered (including flight time and frequency), Armenia appears to be better performing than Indo-nesia and India, but it is behind the US . In particular, Armenia needs more progress in reducing bureaucrat-ic barriers, adopting employer-friendly labor laws, and decreasing its economic distance from the major IT markets through appropriate stimulating measures .
The IT sector in Armenia seems to be fairly mature, and hence provides an opportunity for expansion. The maturity index describes how well developed the country’s IT-based services industry already are, how many IT-based businesses are being done, and wheth-er there is an active business association to coordinate private and public sector activity and promote the in-dustry to investors . The Enterprise Incubator Founda-tion (EIF) reports that ICT GDP represents 5 .4 percent of Armenia’s total services GDP . This figure is very high even compared to India and US where it constitutes around 3 percent . According to the EIF, Armenian IT industry is one of the most dynamic and promising sectors of the economy .103 However, the percentage of employees in ICT industry as part of Armenia’s total employees in non-agriculture sectors represents only 1 .6 percent, as reported by the EIF . This is low com-pared to India (4 .5 percent) and USA (6 .6 percent), and may be caused by a short supply of qualified special-ists in the country .
Policy Recommendations The ICT sector has shown impressive potential for development, but innovative strategies could help it to break into the league of leading destinations. We will in the following present recommended actions around areas of policies, processes and institutions, ac-cess to finance, infrastructure, and skills development .
Strengthening intellectual property rights protec-tion and law enforcement. Although initial safeguards protecting business data are already in place, stronger
103 Enterprise Incubator Foundation . “Armenian Information Technology Sector, Software and Services” . 2010 Industry Re-port .
data and intellectual property protection would in-crease investor confidence . Entrepreneurs in Armenia note that although the necessary laws and regulations may already be in place, their implementation is un-even . Partially, these challenges can be addressed through closer partnerships with industry associations and research and analytical organizations which regu-larly collect relevant data, organize customer surveys and possess hands-on knowledge on the day-to-day business processes in the domestic market .
Support for competition and innovation. Compe-tition policies need to make sure that measures are taken to promote contestability and reduce barriers to entry . Currently, the industry focuses mostly on devel-oping software, applications, and providing web-de-sign services . Stimulating the internal demand for ad-vanced IT products and incentivizing high-value ser-vices could encourage the ICT sector . Higher quality and more advanced IT products would raise demand for Armenian IT products from abroad . Export promo-tion of Armenia IT products would raise awareness of foreign investors about the advantages and opportu-nities in the Armenian market .
Providing a more favorable tax regime and other forms of support. Tax breaks can further improve the competitiveness of Armenian IT products abroad and also in the domestic market . A special tax regime could be defined for technology start-ups, and tax breaks to build, maintain, and improve R&D facilities . Promoting the Armenian IT sector abroad will help attract more FDI and venture investors looking for promising op-portunities in the emerging markets . Private compa-nies’ donations and/or assistance to educational insti-tutions should be exempted of VAT . For the sake of raising competitiveness of the Armenian technology professionals, private companies’ training costs made outside of Armenia should be considered as expenses deductible from revenue .
The Armenian diaspora has been an important source of FDI and has demonstrated keen inter-est in supporting the IT industry. The government may consider strengthening ties with the diaspora in their efforts to expand in international markets, and promote the Armenian IT industry abroad . It may also consider allowing 100 percent FDI in ICT industry and IT parks .
Internet and Communications Technology (ICT) | 101
Introducing additional measures to improve labor productivity and increase investor confidence in the industry. As another important step, PPP models may be considered to strengthen revenue streams and help jumpstart the ICT industry . Shortening the time needed for export and import of technological prod-ucts is key to decreasing the economic distance be-tween Armenia and major global IT hubs .
Targeted and general infrastructure growth has ac-companied the rise of countries as an outsourcing destination for IT-based services. Increased com-petition in the telecom sector lowers the cost of ICT infrastructure . Increasing bandwidth and improving connectivity will allow for faster and more secure infor-mation exchange and will improve the overall business processes . Stimulating infrastructure sharing can help make a better use of available infrastructure and low-er infrastructure investments costs for industry incum-bents . Other targeted infrastructure developments for IT-based services would include the development of technology parks . Armenia could learn from other countries how ICT parks have been developed . For ex-ample, Software Technology Parks of India (STPI) has played a seminal role in establishing over 20 technol-ogy parks throughout the nation . Other countries are establishing ICT parks that could help attract foreign investment and foster growth of a local IT-based ser-vices industry .
IT industry would benefit from an increased supply of qualified technical and business professionals and improved quality of education. The curricula at Armenian universities may be revised to incorporate the changing demands of the fast developing indus-try . More continuous education and training programs will allow professionals to stay on the cutting edge of the industry . Armenia may consider more investments in higher education institutions, e .g . equipment infra-structure, training, curriculum resources and support particularly outside the capital region . The govern-ment may also consider creating a new state-spon-sored institution to train candidates for entry-level positions in the ICT industry, including more intensive training in English language capabilities . Language skills and communication skills should be paid signifi-cant attention to at intermediate & high-school levels . Joint program with successful universities (inside Ar-menia and abroad) to foster collaboration in various
levels, including student exchanges, management enrichment programs should be encouraged . Compa-nies should be encouraged to incorporate employee training in employee contracts to encourage individu-al and workforce skill growth . Technical skills could be developed through collaboration with foreign venture capital and incubating firms (e .g . Y-Combinator, Beta-works, IdeaLabs) and linking aspiring entrepreneurs in Armenia to global start-ups . This will allow them to acquire cutting-edge technology and business skills in the process and provide them experience working in an international environment, which is critical for suc-cess in today’s global market .
To summarize, Armenia has seen quite impressive developments of its IT-based services sector, but it may still need to adopt targeted strategies to break into the league of leading destinations. Build-ing the right skills, investment incentives and institu-tional forms, can provide the foundation for IT-based services industry development . In this context, Arme-nia may need to:
¾ Improve intellectual property protection and ensure business data confidentiality, as well as strengthen relevant regulation and law enforce-ment to raise the confidence of foreign and do-mestic investors in the country’s IT-based services sector .
¾ Intensify its export and industry promotion efforts to raise awareness of foreign investors about the op-portunities in the Armenian IT-based services market and as a result increase the country’s involvement in the global market for IT products and services .
¾ Create incentives for the private sector to engage with higher education institutions to better incor-porate the changing demands of the fast devel-oping industry through developing joint programs and initiatives .
¾ Work further to identify specific market niche op-portunities in the IT-based services industry where Armenia has strong competitive advantages com-pared to other markets in terms of labor costs and professional skills .
¾ Stimulate competition and reduce barriers to entry to create internal demand for advanced IT products and high-value services, as well as to make these products and services competitive internationally .


References | 103
References
Brueckner, J ., Dyer, N ., Spiller, P .T . (1992) . “Fare de-termination in airline hub-and-spoke net-works .” Rand Journal of Economics 23, pp . 309–333 .
Burghouwt, G . (2007) . Airline network development in Europe and its implications for airport planning . Aldershot, Hampshire, England: Ashgate .
Button, K . (1998) . “Opening US skies to Global Airline competition .” Washington DC: Cato Institute, No-vember .
Clougherty, J .A ., Dresner, M ., Oum, T .H . (2001) . “An em-pirical analysis of Canadian international air policy: effects of dual carrier designation and partial liber-alization .” Transport Policy (8), pp . 219–230 .
ComMark Trust . (2006) . The Economic Benefits of Liberalising Regional Air Transport – A Review of Global Experience . November 2005 .
Commission on Growth . (2008) . The Growth Report: Strategies for Sustained Growth and Inclusive De-velopment. World Bank Publications .
Consulting, I . (2007) . Estimating Air Travel Demand Elasticities . Report prepared for IATA . December .
Cristea, A . and Hummels, D . (2010) . Estimating the Gains from Liberalizing Services Trade: The Case of Passenger Aviation .
Dresner, M . and Robert Windle . (1992) . “The Liberal-ization of U .S . International Air Policy: Impact on U .S . Markets and Carriers”, Journal of the Trans-portation Research Forum, Vol . 32(2), pp . 273–285 .
Edwards, S . (1996) . “Why are Latin America’s savings rates so low? An international comparative analy-sis .” Journal of Development Economics 51(1) .
Abdelkhalek, T ., et al . (2009) . A Microeconometric Analysis of Household Saving Determinants in Morocco . Mimeo . Washington DC: World Bank .
Adeniyi, O ., & Cmilt, O . (2011) . Airline Services in Nige-ria: An Empirical Analysis . International Business Management, 5(4), 218–222 .
Alderighi, M ., Cento, A ., Nijkamp, P ., & Rietveld, P . (2007) . Assessment of New Hub-and-Spoke and Point-to-Point Airline Network Configurations . Transport Reviews, 27(5), 529–549 .
Alfaro, L . (2003) . FDI and Growth: Does the Sector Mat-ter? Mimeo . Boston: Harvard Business School .
Asian Development Bank . (2011) . “Armenia’s Transport Outlook” . Yerevan: ADB .
_____ . (2008) . “Armenia: Transport Sector Develop-ment Strategy” . Yerevan: ADB .
Averch, H . and Johnson, L . (1962) . “Behavior of the Firm Under Regulatory Constraint” . American Economic Review 52 (5): 1052–1069 .
Baaj, Hadi . (2002) . “The civil aviation sector in Leba-non”, Journal of Air Transportation, Vol (7) No .1 .
Bootsma, P . D . (1997) . Airline Flight Schedule Develop-ment, Utrecht: Elinkwijk B .V .
Borenstein, S . (1989) . “Hubs and high fares: domi-nance and market power in the U .S . airline indus-try .” Rand Journal of Economics 20, pp . 344–365 .
Brattle Group . (2002) . “The Economic Impacts of an EU-US Open Aviation Area” . December 2002 .

104 | Republic of Armenia: Accumulation, Competition, and Connectivity
Enterprise Incubator Foundation . (2010) . “Armenian Information Technology Sector, Software and Ser-vices” Yerevan: EIF .
Estache, A . and Ginés de Rus . (2000) . “Privatization and Regulation of Transport Infrastructures: Guidelines for Policymakers and Regulators,” ULB Institution-al Repository 2013/44116, ULB – Universite Libre de Bruxelles .
ETF (2010) . “Black Sea Labor Market Reviews: Armenia Country Report” . Turin: European Training Foun-dation .
Gillen, D ., Morrison, W . and Stewart G . (2003) . “Air Trav-el Demand Elasticities . Concepts, Issues and Mea-surement .” Ottawa: Department of Finance, 2003 .
Goedeking, P . (2011) . Networks in Aviation: Strategies and Structures . Springer .
Hartwell, Christopher (2010) . “Employment Protection Legislation and Labor Markets in Transition: As-sessing the Effects of the Labor Code in Armenia,” European Journal of Comparative Economics, vol . 7(2), pages 413–445, December .
Holloway, S . (2008) . Straight and level: Practical airline economics . Aldershot: Ashgate .
Horioka, C . and J . Wan (2007) . “The Determinants of Household Saving in China: A Dynamic Panel Analysis of Provincial Data .” Journal of Money, Credit and Banking 39(8) .
Hsiao, C . (1986) . The Analysis of Panel Data . Cam-bridge: Cambridge University Press .
IMF (2013) . Republic of Armenia: Financial System Stability Assessment, Country Report No . 13/10, Washington DC: IMF .
International Center for Human Development (2011) . “Perspectives on Development of Internation-al Transport Corridors in Armenia, Turkey and the Region .” Armenia: USAID . http://www .ichd .org/?laid=1&com=module&module=menu&id=8 .
Jensen, J . and Tarr, D . (2011) . “Deep Trade Policy Op-tions for Armenia: The Importance of Services, Trade Facilitation and Standards Liberalization .” Policy Research Working Paper . Washington, DC: The World Bank .
Jongwanich, J . (2010) . The determinants of household and private savings in Thailand . Applied Econom-ics, 42(8), 965–976 .
Karapetyan, S . et al . (2011) . “Armenia: Social Protec-tion and Social Inclusion” Yerevan: Caucasus Re-search Resource Centers .
Kitchin, R ., & Boyle, M . (2011) . Diaspora Strategies in Transition States: Prospects and Opportunities for Armenia .
Koettl, J . et al . (2011) . “Employment Recovery in Eu-rope and Central Asia,” Knowledge Brief Special Issue No . 1 . Washington: The World Bank .
Kulikov, D ., and Paabut, A . (2007) . “A Microecono-metric Analysis of Household Saving in Estonia: Income, Wealth and Financial Exposure .” Tallinn: Bank of Estonia Working Paper .
Lipsey, R . E . (2004) . Home-and host-country effects of foreign direct investment . In Challenges to glo-balization: analyzing the economics (pp . 333–382) . University of Chicago Press .
Maillebiau, E . and Hansen, M . (1995) “Demand and consumer welfare impacts of international airline liberalization: the case of the North Atlantic .” Journal of Transport Economics and Policy 29, pp . 115–136 .
Micco, A ., & Serebrisky, T . (2006) . Competition regimes and air transport costs: The effects of open skies agreements . Journal of International Economics, 70(1), 25–51 .
Ministry of Transport and Communications of the Re-public of Armenia, “Transport Sector in Armenia”, Presentation to the 19th OSCE Economic and Envi-ronmental Forum (2011) .
Minoian, V . A ., & Freinkman, L . M . (2005) . Armenia: What drives first movers and how can their efforts be scaled up? . Diaspora Networks and the Inter-national Migration of Skills, 129 .
Mitra, S . et al . (2007) . The Caucasian Tiger: Sustaining Economic Growth in Armenia, Washington DC: The World Bank .
Modigliani, F . (1970) . The life cycle hypothesis of sav-ing and intercountry differences in the saving ratio . Induction, Growth, and Trade, 197–225 .

References | 105
Montiel, P ., & Servén, L . (2008) . Real exchange rates, saving and growth: Is there a link? . World Bank Policy Research Working Paper Series, Vol .
Narmania, D . and S . Grigoryan (2010) . “Cross-Border Co-operation between Georgia and the Republic of Armenia: Existing Problems and Challenges” Yerevan: EVconsulting .
Oum, T . H ., Waters, W . G ., & Yong, J . S . (1990) . A survey of recent estimates of price elasticities of demand for transport (Vol . 359) . Washington, DC: World Bank .
PADECO Co . (2010) . “Preparing the North-South Road Corridor Development Project .” On behalf of Asian Development Bank .
Piermartini, R . and L . Rousova . (2008) . “Liberalization of Air Transport Services and Passenger Traffic” World Trade Organization Economic Research and Statistics Division Staff Working Paper . Gene-va: WTO .
Rutkowski, J . (2012), Promoting Productive Employ-ment in Armenia, Report No . 72907-AM, The Word Bank .
Schmidt-Hebbel, K ., Webb, S . B ., & Corsetti, G . (1992) . Household saving in developing countries: first cross-country evidence . The World Bank Econom-ic Review, 6(3), 529–547 .
Serebrisky, T . (2011) . Airport Economics in Latin Ameri-ca and the Caribbean: Benchmarking, Regulation, and Pricing . Washington, DC: The World Bank .
Serebrisky, T ., & Presso, P . (2002) . An incomplete regu-latory framework? Vertical integration in Argentine airports . In XXXVII Meeting of the Argentine Po-litical Economy Association, Tucumán, Argentina .
Shepotylo, O . (2011) . Estimating the Potential of Arme-nian Exports due to Bilateral and Unilateral Trade liberalization . Washington, DC: World Bank, 2010 .
Stavins, J . (2001) . Price discrimination in the airline mar-ket: The effect of market concentration . Review of Economics and Statistics, 83(1), 200–202 .
UNCTAD Statistics, Inward and outward foreign direct investment flows, online database .
USAID, (2010) . ADA Export Promotion And Enterprise Development Strategy .
USAID, (2011) . Competitiveness of the Air Transport Sector in Georgia . Economic Prosperity Initiative (EPI) . USAID: Tbilisi, Georgia .
Warnock-Smith, D ., & Morrell, P . (2008) . Air transport liberalisation and traffic growth in tourism-depen-dent economies: A case-history of some US-Carib-bean markets . Journal of Air Transport Manage-ment, 14(2), 82–91 .
World Bank (2002) . “Growth Challenges and Govern-ment Policies in Armenia”, World Bank Country Study No . 23786, Washington: The World Bank .
___ (2004) . “Rural Infrastructure in Armenia: Address-ing Gaps in Service Delivery”, Washington: The World Bank .
___ (2007) . “Armenia Labor Market Dynamics,” Report No . 5 35361-AM, Washington: The World Bank .
___ 2008) . Armenia - The Caucasian Tiger (Vol . 1 of 2) : Policies to sustain growth . Country Economic Memorandum . World Bank: Washington, DC .
___ (2009) . “Formulation of a National Aviation Policy for Tajikistan . Final Report” World Bank: Washing-ton, DC .
___ (2010) . “Transport and Trade Facilitation Assessment: A Practical Toolkit for Country Implementation .”
___ (2011a) . “Demographic Change and Implications for Social Policy and Poverty,” South Caucasus Programmatic Poverty Assessment Technical Note No . 5, Washington: The World Bank .
___ (2011b) . “Social Assistance Programs and Work Disincentives” South Caucasus Programmatic Poverty Assessment Technical Note, Washington: The World Bank .
___ (2012) . “Lingering effects of the global economic crisis,” Armenia Poverty Update, Washington: The World Bank .
___ Transport and Trade Facilitation Assessment: A Practical Toolkit for Country Implementation . Wash-ington, DC: World Bank, (2010) . <http://elibrary .worldbank .org/content/book/9780821384121> .
World Development Indicators online database .

Republic of ArmeniaAccumulation, Competition, and Connectivity
April 2013
Poverty Reduction and Economic Management UnitEurope and Central Asia Region
1818 H Street, NWWashington, DC 20433