reproductions supplied by edrs are the best that …ed 445 140 author title institution spons agency...
TRANSCRIPT

ED 445 140
AUTHOR
TITLE
INSTITUTION
SPONS AGENCYPUB DATENOTEPUB TYPE
EDRS PRICEDESCRIPTORS
ABSTRACT
DOCUMENT RESUME
Barth, Patte, Ed.; Haycock, Kati,Mora, Karen, Ed.; Ruiz, Pablo, Ed.Ed.; Wilkins, Amy, Ed.Dispelling the Myth: High PovertyExpectations.Education Trust, Washington, DC.; Council of Chief StateSchool Officers, Washington, DC.Department of Education, Washington, DC.1999-00-00104p.
Reference Materials - Directories/Catalogs (132) -- ReportsResearch (143) Tests/Questionnaires (160)
MF01/PC05 Plus Postage.*Academic Achievement; Effective Schools Research;Elementary Secondary Education; Low Income Groups; *Poverty;Rural Schools; *School Effectiveness; *State Standards;Surveys; *Teacher Expectations of Students; Urban Schools
UD 033 737
Ed.; Jackson, Hilda, Ed.;; Robinson, Stephanie,
Schools Exceeding
In the fall of 1998, the Education Trust constructed andadministered a survey of 1,200 schools that had been identified by the statesas their top-scoring or most improved schools with poverty levels over 5096.The 366 elementary and secondary schools that responded to the survey servestudent populations that are largely poor in urban and rural areas. Surveyfindings reveal that these top performing high-poverty schools tend to: (1)
use state standards extensively to design curriculum and instruction, assessstudent work, and evaluate teachers; (2) increase instructional time inreading and mathematics to help students meet standards; (3) devote a largerproportion of funds to support professional development focused on changinginstructional practice; (4) implement comprehensive systems to monitorindividual student progress and provide extra support to students as soon asit is needed; (5) focus their efforts to involve parents in helping studentsmeet standards; and (6) have state and district accountability systems inplace that have real consequences for staff in the schools. The secondsection of the report discusses each of these major findings. Sections 3 and4 follow with a profile of the schools responding to the survey and adescription of the study methodology. An appendix contains the survey. (SLD)
Reproductions supplied by EDRS are the best that can be madefrom the original document.

U.S. DEPARTMENT OF EDUCATIONOffice of Educational Research and Improvement
EDUC TIONAL RESOURCESINFORMATION
CENTER (ERIC)This document has been reproduced asreceived from the person or organizationoriginating it
0 Minor changes have been made toImprove reproduction quality
Points of view or opinions stated in thisdocument do not necessarily representofficial OERI position or policy
gia
4111P
A
II
_
1%
MMO
9BEST COPY AVAILABLE
ACKNOWLEDGMENTS
This report would not have been possible without the support of the following organizations andindividuals: Rolf Blank, Council of Chief State School Officers State Education Assessment Center;Elizabeth Reisner and Brenda Turnbull, Policy Studies Associates; Val Plisko and Daphne Hardcastle,U.S. Department of Education; Norm Eaddy and Gary Costello, ISHQ Corporation; Kevin O'Brien, QuickTab; and Hammertine Bell, temporary assistant.
We also would like to acknowledge the support and efforts of the entire Education Trust staff. We aredeeply grateful to each of them.
Dispelling the Myth editors,
Patte BarthKati HaycockHilda JacksonKaren MoraPablo RuizStephanie RobinsonAmy Wilkins
Copyright 1999 by the Education Trust
All rights reserved.
The Education Trust was created to promote high academic achievement for all students, at all levels,kindergarten through college. While we know that all schools and colleges could better serve theirstudents, our work forces on the schools and colleges most often left behind in efforts to improveeducation: those serving low-income, Latinos, African American and Native American students.
Education Trust staff work along policy makers, parents, education professionals, community and businessleaders in cities and towns across the country who are trying to transform their schools and colleges intoinstitutions that genuinely serve all students. We bring lessons from these communities back toWashington to ensure that in the national policy debate there is a strong, clear voice for what's right forstudents.
For more information, contact:THE EDUCATION TRUST1725 K Street, N.W., Suite 200Washington, DC 20006Phone: (202) 293-1217Fax: (202) 293-2605www.edtrust.org
3
BEST COPY AVAILABLE

TABLE OF CONTENTS
Letter from Kati Haycock, Director,The Education Trust i
Dispelling the Myth:High Poverty Schools Exceeding Expectations 1
High Performing, High PovertySchools Directory 15
Technical Notes 93
Appendix A 95

March, 1999
Dear Friend:
Over the past decade, we have watched a kind of creeping malaise infect more and moreeducators, and, indeed, more and more entire school systems. The clearest manifestation of thismalaise is found in the conversations we have with teachers and principals in high povertyschools who often tell us that, "these standards you're talking about may be fine for some kids,but certainly not for the kind of kids that we have in our school." But the malaise is by no meanslimited to front-line educators: leaders at all levels administrators, school boards, legislatorsoften make policies about things like assessments, graduation requirements, accountabilitysystems and the like, that at their core, expect less of poor children and poor schools.
Somewhere along the line somebody decided that poor kids couldn't learn, or, at least, not at avery high level. And everyone fell in line.
But the truth is actually quite different. Some poor children have always learned to high levels,and some whole schools get all of their children to levels reached by only a few students in otherschools.
Almost everybody knows a school or two like this. But although we tried, we couldn't find asource of systematic data on high poverty schools performing at highor dramaticallyimprovinglevels.
In the belief that such information would be invaluable both to educators who want to makemore of a difference for the children they serve and to policymakers who want to design moreeffective policy, the Education Trust and the Council of Chief State School Officers cooperatedin a project to identify and learn more about top performing high poverty schools. This is thefirst product from that project. It contains information on 366 schools from the 21 states thatagreed to participate. Future reports will, we hope, include more complete information on someof the schools, as well as information from top performing schools in the states that did notparticipate in the initial study.
We hope this information is useful. We also hope it inspires both the hope that things can bebetter, and the will to make it that way.
Sincerely,
Kati HaycockDirector
5
Dispelling the Myth:High Poverty Schools Exceeding Expectations
SECTION 1: A Survey of Top Performing, High Poverty Schools
"We take all of the excuses off the table and have committed ourselves to working with the kidsthat walk through the door."
Principal, Thayer Elementary, Kansas
In 1994, the U.S. Congress made sweeping changes in Title I, the largest of the federalgovernment's elementary and secondary education programs. As originally designed, the lawsupported efforts by high poverty schools to give their low-achieving students extra help inmastering the most basic skills. The reauthorized Title I pressed participating schools and statesto set their sights higher. Indeed, the goal of the new law was an audacious one: to get allstudents poor and rich, minority and whiteto the same high academic standards.
Congress is now preparing to reauthorize this program once again. During the coming twoyears, members of key legislative committees and those who advise them will be faced with animportant decision: do we continue along the path that we started down in 1994, or do we strikeoff in another direction?
Some are already beginning to argue that the law isn't working. Achievement as measuredby NAEP, overall, isn't up, or isn't up by much. And many Title I schools have continued doingessentially what they were doing before the new law took effect.' Maybe we should simply giveup, some critics say, and admit that schools will never be able to get poor kids to meet highstandards.
But we see too many successful high poverty schools to throw in the towel on theireducational futures. If poor kids can't achieve at high levels, why are the students in HawleyRoad Elementary School in Milwaukee, 80% of whom are poor, knocking the top off of theirstate's assessment in reading? And why, too, are the students in Sierra Vista Elementary Schoolin Reno, Nevada, over half of whom are poor, achieving at the highest level on their state'sassessment in mathematics? Why, indeed, are students in the highest poverty schools in eightentire states, performing higher in mathematics than the average student in all the other states?
Before anybodyincluding members of Congress and educators in high povertyschools gives up on poor kids or on Title I, they need to take a careful look, as we have, atschools that are successfully serving poor children. In the practices of those schools, as well asin their essential spirits, there are many lessons for those of us who hope for more schools likethese in the future.
That's what this report is all about: mining the experiences of those who dispel the myth thatpoor kids can't learn and are proving it everyday through their work in top performing, highpoverty schools.
I See 1998 report from Citizens Committee on Title I.

In the fall of 1998, the Education Trust constructed and administered a survey of 1,200schools that had been identified by the states as their top scoring and/or most improving schoolswith poverty levels over 50%. The work had partial support of the Council of Chief State SchoolOfficers (CCSSO). We sought to highlight the success stories of Title I as well as identifycharacteristics that seem to contribute to high academic achievement among low-incomestudents. The U.S. Department of Education asked the Education Trust and CCSSO to report outtheir findings. The results are reported in these pages.
The 366 elementary and secondary schools responding to the survey serve studentpopulations that are largely poor. They come from 21 states. They operate in rural isolation andin urban overcrowding. They serve every racial and ethnic group in the country as well as thosewho come to school with little or no English. Over half the students in these schools are fromlow-income families; in many of them, poor students comprise over three quarters of the schoolpopulation.
The survey data reported by the schools' principals were for the 1996-97 academic year.Many of these schools produced results that exceed the best efforts of their suburbancounterparts. All of them have met one of two significant criteria: (1) "high performing," that is,among the ten highest performing high poverty schools on state assessments in reading and/ormathematics; or (2) "most improved," that is, among the ten biggest gaining schools on stateassessments in reading and/or mathematics.
This is not to say that all the schools in this study have met their goals. Most, by their ownadmission, recognize that they still have much to do to get their students to the same highacademic levels as their peers in affluent schools. Nonetheless, these schools warrant attentionfor showing gains when too many schools have bought the myth that such progress is notpossible with poor children. Their success is revealed by their position at the top of the pack intheir states.
Their experiences as reported in this survey should interest both policymakers and fellowpractitioners. While no single instructional technique, no particular textbook, no curriculumcould be credited with producing these schools' gains, one dominant theme did emerge from thesurvey. All of these schools are unusually focused on high academic expectations for theirstudents.
Standards undergird each of the six findings in this report. In addition, the findings seem tovalidate the policies promoted by the 1994 Title I law. In general, we found that these topperforming, high poverty schools tend to:
Use state standards extensively to design curriculum and instruction, assess student work,and evaluate teachers. A full 80% of the high-performing, high-poverty schools reportedusing standards to design instruction. Similarly, the successful schools in this study wereusing standards to assess student work and evaluate teachers.
2
7

Increase instructional time in reading and math in order to help students meet standards.A 78% majority of top performing, high poverty schools reported providing extendedlearning time for their students. This time was primarily focused on reading and math.Devote a larger proportion of fisnds to support professional development focused onchanging instructional practice. Changes in the 1994 law require schools to provide forthorough professional development for teachers in high poverty schools. The schools in thisstudy seem to be moving faster than their less successful counterparts to comply with thisprovision. As important is that the focus of professional development seems to be centeredon helping students meet specific academic standards.Implement comprehensive systems to monitor individual student progress and provideextra support to students as soon as it's needed. Four out of five of the top performing, highpoverty schools had systematic ways to identify and provide early support to students indanger of falling behind in their instruction.Focus their efforts to involve parents on helping students meet standards. In these schools,traditional roles for parents as fund-raisers are giving way to activities that address parents'knowledge of standards, encourage their involvement in curriculum and involve them inreviewing students' work.Have state or district accountability systems in place that have real consequences foradults in the schools. Nearly half of the principals in these schools were subject to some kindof sanctions if their students fail to show measurable academic improvement.
Not every school in this survey reported having all six of the above characteristics in theirprograms; most, in fact, had some in various combinations. In addition, we made no attempt tomake conjectures about the relative effectiveness of these characteristics. This survey wasstructured purely to elicit information about the types of practices top performing, high povertyschools engage in. The findings represent the school characteristics that showed up over and overagain in the survey responses.
We believe that, even at face value, this information should alert policymakers and educatorsto policies that seem to hold the most promise for the education of poor children. At the sametime, we recognize the limitations of a survey such as this. For this reason, we will be exploringthese findings in greater depth in the second phase of this project.
The next section offers a discussion of the six major findings listed above. Sections 3 and4 follow with an overall profile of the schools responding to the survey and a description of ourmethodology.
3
8

SECTION 2: The Findings
"What it takes is this: Putting kids first and believing all kids can learn. Lots of hard work, acommitted staff, trust, compassion and clear standards for behavior and performance."
Principal, Strafford Elementary, New Hampshire
The Education Trust analyzed the survey data to identify common characteristics of topperforming, high poverty schools; to determine how they used Title I funds; and to identifycommon policies and practices that contribute to student success. In general, we found that thetop performing schools were quickest to use state standards to guide their efforts to raise studentachievement, as the new Title I law intended. Standards formed the basis of the dominantcharacteristics and practices in the schools responding to the survey.
Top Performing, High Poverty Schools Report Extensive Use of Standards toDesign Curriculum and Instruction, Assess Student Work and EvaluateTeachers
The most significant finding of the Education Trust survey was the extent to which topperforming, high poverty schools are using standards to guide school activity. A full 80% reportthat standards are used extensively in their schools to design curriculum and instruction. Nearlyevery school in our survey 94% uses standards to assess student progress with 77%offering regular mechanisms for teachers to analyze student work against state standards.
The 1994 Title I law was designed to make sure that poor students were held to the samehigh expectations as their peers in more affluent schools. To this end, the law promotes a systemof challenging academic and performance standards for all students in the state. In order toreceive Title I funds, schools have to measure the academic growth of low-income students usingthe same standards and assessments administered to non-Title I students.
This strategy seems to be paying off in the top performing schools in this survey. Theseschools have become places where all classroom activity is aligned with the state standards. Theprincipal of East New York Transit Tech, for example, credits standards as being one of the mostimportant factors in the school's ability to increase achievement. Other factors include therecognition among the faculty that all students must meet higher standards and their willingnessto work together toward this goal.
Standards also inform teacher evaluations in the top high-poverty schools, 59% of whichreported using standards to gauge teacher effectiveness. The Arthur P. Momot school in NewYork is an example. Momot's administration focuses instructional staff evaluations on standardsimplementation based on classroom observations. The evaluations include a look at standards insetting goals and as a basis for teacher portfolios. Arthur P. Momot also provides peer coachingto help teachers strengthen their capacity to teach to the standards.
4

All the states in this survey have a system of standards and assessments in place. However,evidence from around the country shows that state standards are not a universal presence in day-to-day classroom practice. The top performing, high poverty schools in this survey suggest thatthe explicit use of state standards in planning and evaluating curriculum, instruction and studentwork can have a significant impact on raising the achievement of low-income students. Usingstandards to evaluate teacher effectiveness can further strengthen the alignment of practice tostudent results.
Ways Standards are Used In Schools
100% 91% 94%
0%
67%59%
Design CurriculumAssess Student ProgressEl Evaluate Teacher Effectiveness
100%
0%
Percentage of Teachers Using StateStandards to Design instructional Units
68%
20%
10%
I I nCI Little to None Almost HalfD More Than Half O Extensively
Percentage of Teachers Analyzing StudentWork Against State Standards
1:1Yes El No
100%
0%
Frequency of Meetings to AnalyzeStudent Work Against State Standards
26%18%
56%
Weekly OBI-Monthly Monthly
Top performing, high poverty schools increase the instructional time inreading and math in order to help students meet standards.
5
BEST COPY AVAILABLE
The 1994 Title I reauthorization encouraged schools to increase the amount and quality ofinstructional time to help accelerate the gains of low-income students. A 78% majority of theschools surveyed provide extended learning time that emphasizes core academic subjects,especially reading and math. Research has shown that early mastery of these skills is crucial tolearning in other subjects. Students who fail to become proficient readers face an uphill struggleto keep up with increasingly demanding texts and vocabulary. Similarly, students lacking astrong foundation in math often find themselves lost in the high-level high school coursesnecessary for success in college and work.
The extra time devoted to making sure low-income students are solid in the basics shows inbetter results for the schools in this survey. Parkview Elementary in Wisconsin credits itsemphasis on the basicsreading, math, writing and scienceas being integral to the highacademic achievement of their students. Lake Agassiz Elementary in North Dakota offers anexpanded ten-month experience for K-1 children at risk of academic failure. They credit thisprogram for the considerable gains they show with participating students.
Middle and high schools in this survey also reported adjusting schedules in order to providestudents with extended opportunities to develop reading and math skills. In New York City, forexample, East New York Transit Technical school restructured its school day with blockschedules for math and science, a Copernican model for English and social studies and an extraten-week cycle to provide extra help in improving students' literacy skills. Of all the schools inthe survey, 86% reported an increase in the time spent on reading, and 66% report havingincreased the amount of time students spend studying math.
The survey also elicited information about the amount of time devoted to particularpractices. Recent research has shown relationships between various instructional practices andstudent achievement scores on the National Assessment for Educational Progress (NAEP).2 Ananalysis of the eighth-grade mathematics assessment, for example, show a negative relationshipbetween the routine assignment of ditto sheets and students' test scores. On the other hand,students who discuss work with other students were shown to also have higher NAEP scores. Forthese reasons, our survey asked principals whether the amount of time their students spent onspecific instructional practices had increased or decreased during the past few years.
2 The Education Trust, Education Watch 1998, pps. 16-18. Analysis of NAEP 1996 Math Survey Tables.
6
11

Overall, among survey respondents, nearly two-thirds (63%) report a decrease in the use ofditto sheets. On the positive side, 83% of the schools reported increasing the amount of timestudents spend discussing work with others. These data indicate that the top performing schoolsare moving away from low-level instruction, exemplified by the routine filling out of bubbles onditto sheets. Rather they seem to be developing higher-order skills by offering students moretime for discussion of the subject matter. In addition, 95% reported an increase in the use oftechnology.
The efforts of these schools respond to the recognition by our nation's leaders that studentsand schools need to maximize the time spent on teaching and learning the core academic subjectsand developing higher order skills if our low achieving children, particularly those from low-income families, are to meet the nation's educational goals.
100%
0%
-100%
Increase or Decrease in Use ofInstructional Practices
83% 86%77%
95%
-63%
Ditto Sheets
Time on Reading
Technology
0 Discuss Work With Others
Time on Math
Top performing, high poverty schools are spending larger proportions of TitleI dollars on professional development.
7
I. 2

Changes in the 1994 law require schools to provide for thorough professional developmentfor teachers in high poverty schools. There is growing recognition that teachers need time tounderstand new state standards and to develop strategies for teaching them to poor and minoritystudents. The top performing schools in this study seem to be moving fast to comply with theTitle I provision.
Our survey revealed that a full third of the top performing schools were dedicating morethan 10% of their Title I dollars to professional development. In comparison, two recent nationalstudies of seven large urban districts estimated that expenditures on professional developmentranged from 1.8% to 5.7% of the local school budget.3 Even New York City's District 2 aschool district well-known for attributing its student gains to significant increases in professionaldevelopmentdevotes only slightly more than 5% to professional development.4
As important as investing funds, according to our respondents, is making sure thatprofessional development is focused on the implementation of standards and students' needs.Wrote the principal of Nathaniel Green Middle School in Rhode Island: Over the last few yearswe have focused our professional development activities toward teaching to standards andmodeling our classroom assessment more in line with our state assessments."
Bemiss Elementary in Spokane, Washington, uses the majority of its Title I funds to fundtwo literacy and two math instructional facilitators to provide regular in-class professionaldevelopment, study sessions and grade level meetings. Thayer Elementary in Wyoming uses itsTitle I funds to provide early literacy training staff development to improve the teaching ofreading and writing. Thayer's program restructures the teaching of reading and writing in theelementary grades using high-quality children's literature, provides intensive staff development,uses research-based methodology and measures the program's success using validatedinstruments.
3 Miller, B., B. Lord and J. Domey, Staff Development for Teachers, Education Development Corp., and D. Mooreand A. Hyde, Making Sense of Staff Development, Designs for Change, Chicago, cited in CPRE Policy Briefs, June1995.4 Panasonic Foundation
8
13

Top performing high poverty schools have comprehensive systems to monitorstudent mastery of standards and provide extra support to those who need it.
Title I emphasizes the use of standards as a strategy for all kids to reach high standards. Akey component of this is the requirement that schools monitor the progress of each student andprovide appropriate support. The vast majority of respondents 81% report that they have inplace a comprehensive system for monitoring student progress and providing early support tostudents in danger of falling behind in their instruction.
Monitoring systems are effective means for providing ongoing analysis of studentachievement data. When used for diagnostic purposes, achievement data enableschools to provide immediate help to struggling students and to move them on quickly once theyhave demonstrated mastery. The Terrell Wells Middle School in Texas identifies students whoneed extra support and offers help for individual students or groups that includes 40 minutes ofdaily tutorial. Several schools make weekly progress reports to parents to elicit their help inmonitoring student mastery of standards.
The West Bourbon Elementary School in Kansas uses its Title I funds for instructionalsupport staff to assist students who fall below the mastery level. Students are then reassessed tomeasure improvements in their progress towards standards. Victor Orne las Elementary School,also in Kansas, analyzes pre- and post-test data by subjects and adjusts its teaching strategies tomeet students' specific learning needs.
The push-pull of monitoring progress and providing extra support helps schools to stayon top of the development of each of their students. In this way, they can make sure that nostudent will fall through the cracks.
Percentages of Schools Monitoring StudentPerformance
100%
0%
81%
16%
3%
OComprehensive System With HelpCI Extra Help As NeededEl Little or No Extra Help Provided
BEST COPY AVAILABLE
14
9

Top performing, high poverty schools have state or district accountabilitysystems in place that have real consequences for adults in the schools.
The 1994 Title I law for the first time held high poverty schools accountable for the academicachievement of their students. Recent developments in some states, notably Texas, NorthCarolina and Kentucky, show that accountability for results is related to improvement in studentachievement. Policymakers hoped that by emphasizing student results and attaching strongaccountability provisions for school districts, they could allow school systems the freedom todevise their own strategies for getting there.
Title I accountability is far from fully realized. Education Week's Quality Counts 1999reports that just 31% of states have systems to hold schools and principals accountable forstudent performance. Only 20% of the states have these mechanisms for teachers and 24% holdentire school districts responsible for showing students gains.
Accountability for student achievement is an important characteristic of our pool of topperforming schools in that nearly two-thirds of the respondents reported that they were operatingwithin systems that held adults responsible to some degree. A full 45% of our respondentsreported that accountability took the form of strong sanctions for schools and principals.Similarly, 35% of the high poverty schools in our survey report that teachers are held responsiblefor student achievement.
One in three schools report there are rewards for students when they improve, and somewhatfewer than one in three teachers receive rewards when their students post gains. A higherpercentage of schools, 42%, report no rewards for improving student achievement. Overall, therespondents reported clearer and more frequent sanctions for adults than for students and fewerrewards for adults in these schools.
Groups Receiving Sanctions When StudentAchievement Does Not Improve
100%
45°/5%
15%
n
1%36%
27%
Note: Schools had the option to check more than 1selection. This explains why the percentages exceed 100.
10
BEST COPY AVAILABLE
Groups Receiving Rewards When StudentAchievement Improves
100%
0%
21%
n
0% 29%
13%
n9e ee ocp
Note: Schools had the option to check more than 1selection. This explains why the percentages exceed 100.
15

Top performing, high poverty schools focus their efforts to involve parents onhelping students meet standards.
Since its inception in 1965, the Title I legislation has supported parent involvement.Traditionally, local and districtwide parent councils were involved either in monitoring how thedistrict spent Title I funds or in governance. This involvement was in keeping with the emphasison "inputs"the investment of resources as opposed to "outcomes" or student resultsin theTitle I law before the 1994 reauthorization.
As the graph below indicates, parent activity in top performing high poverty schoolsindicates that these schools are increasingly focusing their parent involvement efforts towardareas that most directly affect student achievement. In these schools, traditional roles for parentsas fundraisers are being expanded to include processes to help parents improve their knowledgeof standards and their understanding of student work.
Nearly one in three schools in this survey reported that 25-50% of their parents wereinvolved in processes to help them understand the quality of student work; one in four said that50-75% of their parents were involved in processes to help them understand student work.
It appears that this group of top performing, high poverty schools is moving in the directionencouraged by the 1994 law which encouraged schools to involve parents in more academicareas of their children's schooling.
Parents. Participate Most. Frequently inActivities. Related to. Student Work
Student Work
PTA
Classroom Help
Standards
aCuricultan
cr.Governance
Budget:.1,
OMInimal Moderate High 0 Ma dmum
16
100%
a
0%
Percentage of Schools Reporting Level ofParent Familiarity with Standards by
Quartile
59%
23%11%
8%
Iri0-25% 026-50% 51-75% 76-100%
BEST COPY AVAILABLE
11

SECTION 3: Survey Schools At A Glance
The Title I program provides funding to nearly every school district in the country. Thebreadth of the program's reach is illustrated by our survey respondents who represent everymajor region of the country, with the largest representation from the South at 47%; 26% from theMidwest; 15% from the Northeast and 12% from the West. The respondents range from smalltown America (62%) to some of the nation's largest urban areas (38%).
The majority of the schools are neighborhood schools that accept all of the children in theirattendance area (67%). The next largest segment is schools with open enrollments that acceptchildren from throughout the school district (30%). True to the origins of the Title I legislation,elementary schools make up the largest number of respondents.
The 1994 reauthorization gave schools more flexibility to establish schoolwide Title Iprograms, and 79% of respondents took advantage of that opportunity to allow all of theirstudents to benefit from the program. The reauthorization also sought to place more budgetarycontrol of Title I funds at the school-building level, and 56% of the schools surveyed reportedhaving control over all of their Title I dollars.
The schools have an average enrollment of 509 students and are led by principals who haveserved on average 4' years at the school. The average school had a student enrollment in excessof 60% white; 17% African American; 13%; Latino; 2% Asian; and 4% Native American. Theaverage limited English proficient (LEP) population is 10%.
SECTION 4: Methodology
In spring 1998, the Council of Chief State School Officers (CCSSO), in collaboration withthe Education Trust, asked the chief state school officer of every state to voluntarily participatein a project to identify top performing, high poverty schools. Twenty-one states agreed. Theproject targeted schools that served student populations in the 50-75% poverty range and the 75-100% poverty range.
Each participating state submitted a list of its top performing, high poverty schools based onassessment results in reading and mathematics administered at the elementary, middle and highschool level. The schools were further categorized as either High Achievement or MostImproved. The High Achievement category included the top 10 scoring high poverty schools interms of student performance. The Most Improved category included those schools who hadmade the greatest increases in assessment scores over a two-year period. The survey yielded alist of 1,200 top performing, high poverty schools representing every region of the country.
The results of the CCSSO project were compiled into a database for analysis by theEducation Trust. The next step required linking the Education Trust top performing schoolsdatabase to the U.S. Department of Education's public schools locator database to obtain mailingaddresses for each of the 1,200 schools.
12
17

The Education Trust then designed a survey that was mailed to each of the 1,200 schools inOctober 1998. The survey (Appendix A) focused on discovering the strategies these schoolsutilized to increase achievement. By mid-November 1998, 366 schools responded to the survey.The results were coded, entered and analyzed and comprise the content of this report.
While we sought to survey "high performing" high poverty schools, each state determinesthe rigor of its state assessment. Therefore, state-by-state comparisons cannot be made regardingthe level or content of student achievement. We urge readers of this report to bear these factors inmind in interpreting the results.
SECTION 5: Conclusion
A survey such as this one offers a glimpse into what separates these high poverty schoolsfrom others who are not showing the same amount of progress. The one aspect that pops outfrom the responses is the extent to which state standards inform the work of top performingschools and raise the adults' expectations for their students. The respondents told us that they usestandards to design instruction, assess student work, and evaluate teachers. Standards alsoprovided the framework for professional development of teachers. They guided the monitoringof student progress and helped schools target the kinds of extra support struggling studentsneeded to become proficient. Parents, by and large, were increasingly more active in theacademic aspects of school life than in governance and budgets. Making adults accountable formaking sure that their students meet standards was another factor that showed up in theseschools.
But a survey can only begin to piece together a picture of what makes schools work. Thefindings have raised several questions that the Education Trust believes warrant furtherinvestigation. For example, we don't know how professional development dollars are spent orwhat happens in teachers' meetings to examine student work. The survey only offers clues aboutthe overall impact of Title I dollars.
The Education Trust intends to pursue some of these questions over the coming months. Thissurvey has been invaluable in helping us surface promising practices and, most important,pinpointing schools where they are making these practices work for poor students. Our next taskis to find out why they work, so we can share these lessons with policymakers and educators whocare about the education of poor children.
13
18

4pr TheEducation
pi Trust
Top PerformingSchools Directory
19

Top Performing Schools Directory
How to use this directory
What the directory includes:
TheEducation.Trust
We created this Directory to respond to our desire, and the desires of advocates, policy makersand educators for examples of high poverty schools that are working and proving that theirstudents can achieve at high levels.
Creating this directory represents a beginning rather than an end. As with most research weraised as many questions as we answered. Are all of the students in these schools achieving athigh levels? No, they are not. Relatively low percentages of students are performing above theproficiency level in some of the schools in the high achieving category. Many of the schools thatcited as "most improved" still have a long way to go. Their current "good" may not be goodenough when compared to the standard, but it is truly a step in the right direction and we shouldrecognize it as such. The important fact is that we are not lowering the standards for the studentsin high poverty schools. The data from this survey indicate that, with continued support and hardwork, more students in high poverty schools can reach high standards.
This directory includes demographic and achievement data on each of the 366 schools thatresponded to the survey. Participation in the survey was voluntary. States not included in thisreport either chose not to participate or did not have state assessments upon which to selectschools to meet the criteria. The survey was mailed to 1200 schools in 21 states based onresearch done by the Council of Chief State School Officers (CCSSO) which asked each state'schief education officer for a list of its 10 highest achieving and most improved schools. Theschools were selected based on state assessments in reading and math, and on poverty categories,50-74% and 75-100%.
We strongly recommend that you read the Technical Notes on State Proficiency Definitions forfurther information about how the scores were compiled and reported. Where available weprovided state average scores by subject and grade.
We recommend that this directory not be used to:
Make comparisons between states. States use different tests and they set different levels ofproficiency therefore achievement data in one state cannot be compared with that of another.
Make determinations about what students know. Some states did not report cut offscores for proficiency which makes it difficult to make a judgment about what the studentsknow when they exceed the state's proficient level.
17
20

Top Performing Schools Directory
Florida!Assessment::Proficient:
TheEducationTrust
Various NRTsAbove the 50th percentile for district norm-referenced tests in reading comprehension andmath concepts/applications and grades 4 and 8.
PA 1 1ERSON FT YMENTARY1025 REDWOOD AVE, PANAMA CITY, FL 32401904-872-4675 PK 05
High AchievementMath: 68 (61)
Most ImprovedReading Year 1: 34 (49)
Enrollment 598LEP: 0 to 10% Title I75-100% PovertyWhites: 45African Americans: 50Latinos: 25Asians: 3
Reading Year 2: 48 (49)
MASCOTTE ELEMENTARY513 ALBROOK STREET, MASCOTTE, FL 34753904-429-2533 PK 05
High AchievementMath: 71 (61)
Enrollment: 442LEP: 11 to 20% Title I75-100% PovertyWhites: 62African Americans: 5Latinos: 32Asians: 1
RIMES ELEMENTARY3101 SCHOOLVIEW STREET, LEESBURG, FL 34748904-787-5757 PK 05
High AchievementMath: 67 (61)
Enrollment: 369LEP: 0 to 10% Title I75-100% PovertyWhites: 37African Americans: 61Latinos: 2
KENSINGTON PARK ELEMENTARY711 N.W. 30TH AVENUE, MIAMI, FL 33125305-649-2811 PK - 05
High AchievementMath: 62 (61)
Enrollment: 533LEP: 41 to 50% Title I75-100% PovertyWhites: 4African Americans: 2Latinos: 93Asians: 1
MYAKKA RIVER ELEMENTARY12650 WILLMINGTON BLVD, PORT CHARLOTTE, FL 33981813-697-7111 PK - 05
High AchievementReading: 59 (49)
Enrollment: 638LEP: 0 to 10% Title I50-74% PovertyWhites: 96African Americans: 3Asians: 1
WESTGATE ELEMENTARY1545 LOXAHATCHEE DRIVE, WEST PALM BEACH, FL407-640-5081 PK 05
High AchievementReading: 61 (49)
Enrollment: 649LEP: 41 to 50% Title I50-74% PovertyWhites: 29African Americans: 36Latinos: 32Asians: 1
Native Americans: 1
BEST COPY AVAILABLE
Legend: The Education Trust Logo denotes schools that have exceeded their state's average score in reading and/or math. 19( ) The number in parentheses is the state average score.
21

Top Performing Schools Directory
Florida
WEST HERNANDO MIDDLE14325 KEN AUSTIN PARKIN, BROOKSVILLE, FL 34613904-597-7070 06 08
High AchievementMath: 60 (55)
Enrollment: 296LEP: 0 to 10%50-74% PovertyWhites: 85African Americans: 13Latinos: 2
BENNETT F.T .FMENTARY1755 N.E. 14TH STREET, FT. LAUDERDALE, FL 33304305-390-0710 PK 05
Most ImprovedMath Year 1: 23 (61) Math Year 2: 50 (61)
Enrollment: 776LEP: 11to 20% Title I75-100% PovertyWhites: 38African Americans: 41Latinos: 18Asians: 2Native Americans: 1
LAKE PLACID ELEMENTARY101 GREEN DRAGON DRIVE, LAKE PLACID, FL 33852813-699-5070 PK 05
Most ImprovedMath Year 1: 48 (55) Math Year 2: 64 (55)
Enrollment: 613LEP: 21 to 30% Title I50-74% PovertyWhites: 50African Americans: 25Latinos: 25
20 Legend:
TheEducationTrust
dIrt'flWYOMINA PARK ELEMENTARY511 N.E. 12TH AVENUE, OCALA, FL 34470904-622-5147 PK 05
High AchievementReading: 54 (49)
Enrollment: 642LEP: 0 to 10% Title I75-100% PovertyWhites: 56African Americans: 36Latinos: 6Asians: 1Native Americans: 1
CITRUS SPRING ELEMENTARY570 W. CENTURY BOULEV, CITRUS SPRINGS, FL 34433352-344-4079
Most ImprovedMath Year 1: 50 (61) Math Year 2: 69 (61)
Enrollment: 932LEP: 0 to 10% Title I50-74% PovertyWhites: 92African American: 5Latinos: 3Asian: 1
LEE ELEMENTARY SCHOOL OF TECH.305 E. COLUMBUS DRIVE, TAMPA, FL 33602813-276-5404 KG - 05
Most ImprovedReading Year 1: 48 (54) Reading Year 2: 62 (53)Math Year 1: 45 (55) Math Year 2: 56 (55)
Enrollment: 470LEP: 11to 20% Title I50-74% PovertyWhites: 48African Americans: 29Latinos: 18Asians: 3 BEST COPY AVAILABLE
The Education Trust Logo denotes schools that have exceeded their state's average score in reading and/or math.( ) The number in parentheses is the state average score.
22

Top Performing Schools Directory
Florida
MAYS MIDDLE11700 HAINLIN MILL DR, GOULDS, FL 33170305-233-2300 06 08
TheEducalico.Trust
MOORE HAVEN FLFMENTARYPOST OFFICE BOX 160, MOORE HAVEN, FL 33471813-946-0737 KG - 05
Most Improved Most ImprovedReading Year 1: 28 (54) Reading Year 2: 41 (53) Math Year 1: 42 (61) Math Year 2: 59 (61)
Enrollment: 928LEP: 0 to 10% Title I50-74% Poverty
RICHEY FUNDAMENTAL ELEMENTARY6807 MADISON STREET, NEW PORT RICHEY, FL 34652813-842-5716 PK - 05
Most ImprovedReading Year 1: 31 (49)Math Year 1: 44 (61)
Enrollment: 836LEP: 0 to 10% Title I50-74% PovertyWhites: 90African Americans: 2Latinos: 5Asians: 2Native Americans: 1
Reading Year 2: 45 (49)Math Year 2: 66 (61)
Enrollment: 531LEP: 0 to 10% Title I50-74% PovertyWhites: 67African Americans: 26Latinos: 4Asians: 3
Legend: , The Education Trust Logo denotes schools that have exceeded their state's average score in reading and/or math. 210 The number in parentheses is the state average score.
23

Top Performing Schools Directory'
IdahoAsSessment Iowa Test of Basic Skills (Grades 3-8) Test of AchievementProficiency: n/a
ABERDEEN ELEMENTARY-MIDDLEFOURTH & WASHINGTON, ABERDEEN, ID 83210208-397-4115 PK - 08
High AchievementMath: 51 (54)
Enrollment: 734LEP: 11to 20% Title I50-74% PovertyWhites: 70Latinos: 30
KENNEDY ELEMENTARY60 SOUTH 5TH WEST SIRE, REXBURG, ID 83440208-359-3325 KG - 04
High AchievementReading: 50 (54) Math: 55 (54)
Enrollment: 343LEP: 0 to 10% Title I50-74% PovertyWhites: 93Latinos: 7Asians: 1
SYRINGA ELEMENTARY388 EAST GRIFFITH ROAD, POCATELLO, ID 83201208-237-4040 KG - 06
High AchievementMath: 61 (54)
Enrollment: 495LEP: 0 to 10°A, Title I50-74% PovertyWhites: 87Latinos: 6Asians: 4Native Americans: 3
ALMO ELEMENTARYPO BOX 168, ALMO, ID 83312208-824-5526 KG - 06
High AchievementReading: 62 (54) Math: 59 (59)
Enrollment: 28LEP: 0 to 10%75-100% PovertyWhites: 80Latinos: 20
TheTrust
LINCOLN ELEMENTARY330 OAKWOOD DRIVE, POCATELLO, ID 83204208-234-0121 KG 06
High AchievementReading: 57 (59)
Enrollment: 337LEP: 0 to 10% Title I75-100% PovertyWhites: 76African Americans: 1Latinos: 20Asians: 1Native Americans: 2
BEST COPY AVAILABLE
22 Legend: The Education Trust Logo denotes schools that have exceeded their state's average score in reading and/or math.( ) The number in parentheses is the state average score.
24

Top Performing Schools Directory
inertanaAssessment: Indiarilateikide Testing for Educational Progress Plus.>Proficient. Meets standards
ARLINGTON HIGH4825 N ARLINGTON AVE, INDIANAPOLIS, IN 46226317-226-4006 09 12
High AchievementReading: 36 (70) Math: 20 (58)
Enrollment: 434LEP: 0 to 10%50-74% Poverty
ARTHUR P MELTON ELEMENTARY4581 FILLMORE ST, GARY, IN 46408219-980-6336 KG - 05
High AchievementReading: 78 (68) Math: 91 (70)
Enrollment: 412LEP: 0 to 10% Title I50-74% PovertyWhites: 1
African Americans: 99Latinos: 1
CENTER ELEMENTARY4415 S NEBRASKA ST, MARION, IN 46952317-674-2276 PK - 04
High AchievementReading: 74 (68)
Enrollment: 313LEP: 0 to 10% Title I50-74% PovertyWhites: 68African Americans: 31Latinos: 1
TheEducationTrust
ARSENAL IECHNICAL HIGH1500 E MICHIGAN ST, INDIANAPOLIS, IN 46226317-226-4009 09 - 12
High AchievementReading: 48 (70) Math: 36 (58)
Enrollment: 250LEP: 0 to 10%50-74% PovertyWhites: 34African Americans: 63Latinos: 2Asians: 1
BENJAMIN FRANKLIN ELEMENTARY600 E 35TH AVE, GARY, IN 46409219-980-6330 KG - 05
High AchievementReading: 54 (68) Math: 85 (70)
Enrollment: 392LEP: 0 to 10% Title I75-100% PovertyWhites: 3African Americans: 93Latinos: 4
CHAUNCEY ROSE MIDDLE1275 3RD AVE, TERRE HAUTE, IN 47802812-462-4474 06 - 08
High AchievementReading: 69 (73) Math: 63 (65)
Enrollment: 596LEP: 0 to 10%50-74% PovertyWhites: 89African Americans: 10Latinos: 1
BEST COPY AVAILABLE
Legend: The Education Trust Logo denotes schools that have exceeded their state's average score in reading and/or math. 230 The number in parentheses is the state average score.
25

Top Performing Schools Directory
Indiana
CRISPUS ATTUCKS MIDDLE1140 N WEST ST, INDIANAPOLIS, IN 46202317-226-4007 06 - 08
High AchievementReading: 56 (73)
Enrollment: 514LEP: 0 to 10%50-74% PovertyWhites: 35African Americans: 60Latinos: 3Asians: 1
FRANCES W PARKER 562353 COLUMBIA AVE, INDIANAPOLIS, IN 46205317-226-4256 PK - 08
High AchievementReading: 80 (73) Math: 20 (65)
Enrollment: 466LEP: 0 to 10% Title I75-100% Poverty
GT ENWOOD MIDDLE901 SWEETSER AVE, EVANSVILLE, IN 47703812-435-8242 06 - 08
High AchievementReading: 55 (73) Math: 45 (65)
Enrollment: 451LEP: 0 to 10% Title I50-74% PovertyWhites: 51African Americans: 49
FRANCES SLOCUM ELEMENTARY2909 S TORRENCE ST, MARION, IN 46952317-664-0589 PK - 04
High AchievementMath: 69 (70)
Enrollment: 431LEP: 0 to 10% Title I75-100% PovertyWhites: 40African Americans: 55Latinos: 5
TheEducationTrust
FRANCIS SCOTT KEY 1033920 BAKER DR, INDIANAPOLIS, IN 46236317-226-4103 KG 05
High Achievement.Math: 67 (70)
Enrollment: 331LEP: 0 to 10% Title I75-100% PovertyWhites: 15African Americans: 84Latinos: 1
Asians: 1
HOWARD ROOSA ELEMENTARY1230 E ILLINOIS ST, EVANSVILLE, IN 47711812-435-8231 KG 05
High AchievementReading: 54 (68)
Enrollment: 413LEP: 0 to 10% Title I75-100% PovertyWhites: 61African Americans: 38Latinos: 1
Asians: 1
Native Americans: 1
24 Legend: The Education Trust Logo denotes schools that have exceeded their state's average score in reading and/or math.( ) The number in parentheses is the state average score.
;0

Top Performing Schools Directory
Indiana
JAMES WHITCOMBRILEY ELEMENTARYUPPER 11TH/COLL AVE, VINCENNES, IN 47591812-882-7953 KG - 05
High AchievementReading: 73 (68)
Enrollment: 158LEP: 0 to 10%50-74% PovertyWhites: 90African Americans: 3Latinos: 7
LODGE ELEMENTARY2000 LODGE AVE, EVANSVILLE, IN 47714812-477-5319 KG - 05
High AchievementReading: 69 (68)
Enrollment: 421LEP: 0 to 10% Title I50-74% PovertyWhites: 51African Americans: 49
SARAH SCOTT MIDDLE2000 S 9TH ST, TERRE HAUTE, IN 47802812-462-4381 06 - 08
High AchievementReading: 66 (73) Math: 44 (65)
Enrollment: 459LEP: 0 to 10%50-74% PovertyWhites: 78African Americans: 17Latinos: 1
Asians: 1
JEFFERSON ELEMENTARY
601 JACKSON ST, GARY, IN 46402219-886-6570 PK - 05
High AchievementReading: 83 (68) Math: 86 (70)
Enrollment: 534LEP: 0 to 10% Title I75-100% PovertyWhites: 1African Americans: 98Latinos: 1
Asians: 1
PIERRE NAVARRE MIDDLE4702 W FORD ST, SOUTH BEND, IN 46556219-289-7765 07 - 08
High AchievementReading: 53 (73) Math: 43 (65)
Enrollment: 546LEP: 0 to 10%50-74% PovertyWhites: 40African Americans: 35Latinos: 25
TheEducationTrust
STEPHEN COLLINS FOSTER 67653 N SOMERSET, INDIANAPOLIS, IN 46222317-226-4267 KG 05 (Traditional) K-8 (Montessori)
High AchievementReading: 100 (73) Math: 75 (65)
Enrollment 722LEP: 0 to 10% Title I50-74% PovertyWhites: 53African Americans: 40
BEST COPY AVAILABLE
Legend: The Education Trust Logo denotes schools that have exceeded their state's average score in reading and/or math. 250 The number in parentheses is the state average score.
27

Top Performing Schools Directory
Indiana
THOMAS A EDISON MIDDLE777 S WHITE RVR PKWY, INDIANAPOLIS, IN 46221317-226-4247 06 08
High AchievementReading: 38 (73) Math: 25 (65)
Enrollment: 667LEP: 0 to 10% Title I75-100% PovertyWhites: 80
26 Legend: I iv
TheEducationTrust
WINCHESTER VILLAGE ELEMENTARY1900 E STOP 12 RD, INDIANAPOLIS, IN 46227317-865-2697 KG - 05
High AchievementMath: 80 (70)
Enrollment: 563LEP: 0 to 10% Title I50-74% PovertyWhites: 87African Americans: 12Latinos: 1
The Education Trust Logo denotes schools that have exceeded their state's average score in reading and/or math.( ) The number in parentheses is the state average score.
28

Top Performing Schools Directory
Assessment: Kansas Reading AssessmentProficient: Students scoring 62% or above
MAYNARD ELEMENTARY19 CONSTITUTION, EMPORIA, KS 66801316-341-2276 KG - 06
High AchievementMath: 59.1 (53.08)
Most ImprovedMath Year 1: 25.9 (41.8) Math Year 2: 59.1 (44.8)
Enrollment: 216LEP: 50% or more Title I75-100% PovertyWhites: 14African Americans: 2Latinos: 82Asians: 1
RURAL CENTER ELEMENTARY902 1400 AVENUE, ABILENE, KS 67410913-479-2213 KG - 06
High AchievementReading: 100 (64.05)
Most ImprovedReading Year 1: 57.1 (55.3) Reading Year 2: 100 (63.8)
Enrollment: 98LEP: 0 to 10% Title I50-74% Poverty
AVENUE A ELEMENTARY111 S MADISON, HUTCHINSON, KS 67501316-665-4610 KG - 06
High AchievementReading: 73.3 (64.05)
Enrollment: 156LEP: 0 to 10% Title I75-100% PovertyWhites: 49African Americans: 10Latinos: 39Asians: 1
Native Americans: 1
MILLER ELEMENTARY1100 AVE G, DODGE CITY, KS 67801316-227-1603 PK 05
High AchievementReading: 88.9 (64.05)
TheEchicationTrust.
Most ImprovedReading Year 1: 60.7 (55.3) Reading Year 2: 88.9 (63.8)
Enrollment: 359LEP: 31 to 40% Title I75-100% PovertyWhites: 28African Americans: 6Latinos: 61Asians: 4Native Americans: 1
WEST MINERAL ELEMENTARYBOX 90, WEST MINERAL, KS 66782316-827-6237 KG 08
High AchievementReading: 62.5 (62.92) Math: 25 (48.59)
Most ImprovedReading Year 1: 62.5 (59.7) Reading Year 2: 62.5 (62.2)Math Year 1: 37.5 (45.18) Math Year 2: 25.0 (48.59)
Enrollment: 75LEP: 0 to 10% Title I75-100% PovertyWhites: 100
GREEN ELEMENTARYGREEN, KS 67447913-944-3324 KG - 06
High AchievementReading: 100 (64.05)
Enrollment: 51LEP: 0 to 10% Title I50-74% PovertyWhites: 94African Americans:Latinos: 6 BEST COPY AVAILABLE
Legend: The Education Trust Logo denotes schools that have exceeded their state's average score in reading and/or math. 27( ) The number in parentheses is the state average score.
29

Top Performing Schools Directory
Kari SO'S
GREEN ELEMENTARYGREEN, KS 67447913-944-3324 KG - 06
High AchievementMath: 80.0 (53.08)
Enrollment: 51LEP: 0 to 10% Title I50-74% PovertyWhites: 94African Americans:Latinos: 6
LONGTON HIGHP 0 BOX 87, LONGTON, KS 67352316-642-2215 07 - 12
High AchievementReading: 57.1 (60.31) Math: 15.4 (22.66)
Enrollment: 113LEP: 0 to 10% Title I75-100% PovertyWhites: 99African Americans:Latinos: 1
LAHARPE ELEMENTARYLAHARPE, KS 66751316-496-2261 KG - 03
Most ImprovedReading Year 1: 50 (61.51) Reading Year 2: 87.5 (64.05)
Enrollment: 91LEP: 0 to 10% Title I75-100% PovertyWhites: 93African Americans:Latinos: 3Asians: 3Native Americans: 1
LEON ELEMENTARYBOX 98, LEON, KS 67074316-742-3291 PK - 05
High AchievementReading: 92.9 (64.05)
Enrollment: 227LEP: 0 to 10% Title I50-74% PovertyWhites: 97African Americans: 1
Asians: 1
Native'Americans: 1
TheEducationTrust
CUSTER HILL ELEMENTARY6344 HAMPTON PLACE, FORT RILEY, KS 66442913-784-4026 KG - 05
Most ImprovedMath Year 1: 33.3 (43.94) Math Year 2: 79.5 (53.08)
Enrollment: 329LEP: 0 to 10% Title I75-100% PovertyWhites: 60African Americans: 25Latinos: 11Asians: 3Native Americans: 1
LENORA ELEMENTARYLENORA, KS 67645913-567-4350 KG - 08
Most ImprovedReading Year 1: 0 (61.51) Reading Year 2: 40 (64.05)
Enrollment: 61LEP: 0 to 10% Title I50-74% PovertyWhites: 99African Americans: 1
28 Legend: The Education Trust Logo denotes schools that have exceeded their state's average score in reading and/or math.( ) The number in parentheses is the state average score.
0

Top Performing Schools Directory
Kansas
LONGTON HIGHP 0 BOX 87, LONGTON, KS 67352316-642-2215 07 - 12
Most ImprovedReading Year 1: 44.4 (57.49) Reading Year 2: 57.1 (60.31)Math Year 1: 11.1 (21.85) Math Year 2: 15.4 (22.66)
Enrollment: 113LEP: 0 to 10% Title I75-100% PovertyWhites: 99African Americans:Latinos: 1
SCRANTON ELEMENTARY104 BURLINGAME AVE, SCRANTON, KS 66537913-793-2256 KG - 08
MARY HERBERT ELEMENTARY1700 WEST 7TH, EMPORIA, KS 66801316-341-2270 KG - 04
TheEducationTrust
Most ImprovedMath Year 1: 15.2 (43.94) Math Year 2: 61.4 (53.08)
Enrollment: 388LEP: 11to 20°/0 Title I50-74% PovertyWhites: 57Latinos: 33Asians: 7
SHALLOW WATER ELEMENTARYSHALLOW WATER, KS 67872316-872-7680 KG - 08
Most Improved Most ImprovedMath Year 1: 12.5 (45.18) Math Year 2: 58.1 (48.59) Math Year 1: 50 (45.18) Math Year 2: 80 (48.59)
Enrollment: 160LEP: 0 to 10°/0 Title I50-74% Poverty
SILVER CITY ELEMENTARY2515 LAWRENCE AVE, KANSAS CITY, KS 66106913-722-7475 KG - 05
Enrollment: 165LEP: 0 to 10% Title I50-74% PovertyWhites: 85Latinos: 15
VICTOR ORNELAS ELEMENTARY3401 E SPRUCE, GARDEN CITY, KS 67846316-276-5270 PK - 05
Most Improved Most ImprovedReading Year 1: 24.2 (61.51) Reading Year 2: 85.2 (64.05) Reading Year 1: 26.5 (61.51) Reading Year 2: 45.5
(64.05)
Enrollment: 216LEP: 0 to 10% Title I50-74% PovertyWhites: 35African Americans: 33Latinos: 27Asians: 4
Enrollment: 580LEP: 50% or more Title I75-100% PovertyWhites: 10Latinos: 78Asians: 12
BEST COPY AVAILABLE
Legend: The Education Trust Logo denotes schools that have exceeded their state's average score in reading and/or math. 290 The number in parentheses is the state average score.
31

Top Performing Schools Directory
Kansas
WEST BOURBON ELEMENTARYBOX 10, UNIONTOWN, KS 66779316-756-4335 PK - 08
Most ImprovedMath Year 1: 51.1 (45.18) Math Year 2: 63.6 (48.59)
Enrollment: 338LEP: 0 to 10% Title I50-74% PovertyWhites: 98African Americans: 1Asians: 1
Native Americans: 1
TheEducationTrust
30 Legend: 'The Education Trust Logo denotes schools that have exceeded their state's average score in reading and/or math.( ) The number in parentheses is the state average score.
32

Top Performing Schools Directory
KentuckyAssessment:Proficient:
TheEducationTrust
Kentucky Instructional Skills Information System.Students demonstrates knowledge of major concepts ever though she/he overlooks ormisunderstands some less obvious ideas of details. Student can apply core concepts andskills to solve problems. Student makes connections among major concepts. Studentcommunicates ides effectively.
EAST CARTER MIDDLE520 ROBERT & MARY, GRAYSON, KY 41143606-474-5156 06 - 08
High AchievementMath: 88.7 (53.8)
Most ImprovedReading Year 1: 47.8 (45.5)Math Year 1: 48.7 (48.9)
Enrollment: 703LEP: 0 to 10% Title I50-74% PovertyWhites: 99Asian: 1
Reading Year 2: 52.5 (49.2)Math Year 2: 88.7 (53.8)
LEESTOWN MIDDLELEESTOWN ROAD, LEXINGTON, KY 40511606-254-9223 06 - 08
High AchievementMath: 53.9 (53.8)
Most ImprovedMath Year 1: 41.7 (48.9) Math Year 2: 53.9 (53.8)
Enrollment: 643LEP: 50% or more Title I50-74% PovertyWhites: 51African Americans: 49
AUDUBON ELEMENTARY300 WORTHINGTON RD, OWENSBORO, KY 42301502-685-4110 KG - 05
High AchievementReading: 82.3 (63.8)
Enrollment: 441LEP: 0 to 10% Title I50-74% Poverty
HARDINSBURG ELEMENTARY419 EAST 3RD STREET, HARDINSBURG, KY 40143502-756-5184 KG - 08
High AchievementReading: 85.6 (63.8)
Most ImprovedReading Year 1: 52.1 (55.3) Reading Year 2: 85.6 (63.8)
Enrollment: 748LEP: 0 to 10% Title I50-74% PovertyWhites: 96African Americans: 4
RUSSELL COUNTY MIDDLE2258 SOUTH HWY 127, RUSSELL SPRINGS, KY 42642502-866-2224 07 - 09
High AchievementReading: 51.7 (49.2)
Most ImprovedMath Year 1: 48.7 (48.9) Math Year 2: 61.5 (53.8)
Enrollment: 651LEP: 0 to 10% Title I50-74% PovertyWhites: 99African Americans: 1Latinos: 1
CANNEL CITY ELEMENTARYRT 191, CANNEL CITY, KY 41408606-743-4115 KG - 05
High AchievementReading: 92.7 (63.8)
Enrollment: 119LEP: 0 to 10% Title I75-100% PovertyWhites: 99African Americans: 1
BEST COPY AVAILABLE
Legend: The Education Trust Logo denotes schools that have exceeded their state's average score in reading and/or math. 31( ) The number in parentheses is the state average score.
33

Top Performing Schools Directory
Kentucky
HATCHER ELEMENTARYHICKMAN ST, ASHLAND, KY 41101606-327-2732 KG - 06
High AchievementMath: 50.9 (44.8)
Enrollment: 221LEP: 0 to 10')/0 Title I75-100% PovertyWhites: 91African Americans: 5Latinos: 1Asians: 1Native Americans: 1
JAMESTOWN ELEMENTARY342 S MAIN STREET, JAMESTOWN, KY 42629502-343-3966 KG - 06
High AchievementReading: 85.9 (63.8)
Enrollment: 381LEP: 0 to 10% Title I50-74% PovertyWhites: 98African Americans: 2
SOUTH LAUREL MIDDLE
223 S LAUREL RD, LONDON, KY 40741606-878-9300 06 - 08
High AchievementMath: 58.2 (53.8)
Enrollment: 93LEP: 0 to 10% Title I50-74% PovertyWhites: 97African Americans: 1
Latinos: 1
Asians: 1
ISONVILLE ELEMENTARYPO BOX 199, ISONVILLE, KY 41149606-738-6695 KG - 06
High AchievementReading: 104.7 (63.8)
Enrollment: 144LEP: 0 to 10% Title I75-100% PovertyWhites: 100
TheEducationTrust
L C CURRY ELEMENTARYGLENLILY & DURBIN ST, BOWLING GREEN, KY 42101502-842-0089 KG - 06
High AchievementMath: 66.7 (44.8)
Enrollment: 280LEP: 11to 20% Title I75-100% PovertyWhites: 40African Americans: 47Latinos: 11Asians: 1
TILDEN HOGGE ELEMENTARY
5950 CRANSTON ROAD, MOREHEAD, KY 40351606-784-4604 KG - 05
High AchievementMath: 58.3 (44.8)
Enrollment: 264LEP: 0 to 10% Title I50-74% PovertyWhites: 99African Americans: 1
32 Legend: 'The Education Trust Logo denotes schools that have exceeded their state's average score in reading and/or math.0 The number in parentheses is the state average score.
3 4

Top Performing Schools Directory
Kentucky
WHITLEY CO CENTRAL ELEMENTARY520 BLV OF CHAMPIONS, WILLIAMSBURG, KY 40769606-549-7060 KG - 05
High AchievementMath: 54.6 (44.8)
Enrollment: 433LEP: 0 to 10% Title I75-100% PovertyWhites: 98African Americans: 1Asians: 1
ARJAY ELEMENTARY
ARJAY, KY 40902606-337-3512 KG - 06
Most ImprovedReading Year 1: 35.0 (55.3) Reading Year 2: 74.3 (63.8)
Enrollment: 156LEP: 0 to 10% Title I75-100% PovertyWhites: 99African Americans: 1
BURNSIDE ELEMENTARY
LAKESHORE DRIVE, BURNSIDE, KY 42519606-561-4250 KG 05
Most ImprovedReading Year 1: 44.6 (55.3) Reading Year 2: 70.7 (63.8)
Enrollment: 457LEP: 0 to 10% Title I50-74% PovertyWhites: 99African Americans: 1Asians: 1
WILMORE ELEMENTARYS LEXINGTON AVE, WILMORE, KY 40390606-858-3134 KG - 05
High AchievementMath: 72.5 (44.8)
Enrollment: 550LEP: 11to 20% Title I50-74% PovertyWhites: 88African Americans: 5Latinos: 2Asians: 3Native Americans: 2
BREATHITT COUNTY HIGH
406 COURT ST, JACKSON, KY 41339606-666-7511 09 12
TheEducaticalTrust
Most ImprovedMath Year 1: 26.7 (45.5) Math Year 2: 37.3 (50.0)Reading Year 1: 26.9 (33.8) Reading Year 2: 44.6 (54)
Enrollment: 826LEP: 0 to 10% Title I50-74% PovertyWhites: 100
CARR CREEK ELEMENTARY
LITTCARR, KY 41834606-642-3833 KG - 08
Most ImprovedMath Year 1: 13.2 (41.8)
Enrollment: 623LEP: 0 to 10% Title I50-74% PovertyWhites: 97African Americans: 3
Math Year 2: 33.2 (44.8)
BEST COPY AVAILABLE
Legend: The Education Trust Logo denotes schools that have exceeded their state's average score in reading and/or math. 33( ) The number in parentheses is the state average score.
35

Top Performing Schools Directory
Kentucky
CRABBE ELEMENTARY17TH & CENTRAL, ASHLAND, KY 41101606-327-2730 KG 06
Most ImprovedMath Year 1: 15.2 (41.8)
Enrollment: 406LEP: 0 to 10% Title I75-100% PovertyWhites: 97African Americans: 1Asians: 1
Native Americans: 1
Math Year 2: 37.2 (44.8)
FOURTH DISTRICT ELEMENTARYPO BOX 20, JETSON, KY 42252502-526-4392 KG 05
Most ImprovedMath Year 1: 9.6 (41.8) Math Year 2: 27.7 (44.8)
Enrollment: 163LEP: 0 to 10% Title I75-100% PovertyWhites: 100
HERALD WHITAKER MIDDLEHORNET DRIVE, SALYERSVILLE, KY 4146506-349-5190 07 08
Most ImprovedReading Year 1: 38.8 (45.5) Reading Year 2: 45.8 (49.2)
Enrollment: 494LEP: 0 to 10% Title I50-74% PovertyWhites: 100
34 Legend:
TheEducationTrust
DISHMAN MCGINNIS ELEMENTARYOLD MORGANTOWN RD, BOWLING GREEN, KY 42101502-843-4464 KG - 06
Most ImprovedMath Year 1: 11.6 (41.8) Math Year 2: 30.6 (44.8)
Enrollment: 269LEP: 11to 20% Title I75-100% PovertyWhites: 59African Americans: 30Latinos: 9Asians: 2
HARRODSBURG HIGHE LEXINGTON ST, HARRODSBURG, KY 40330606-734-8420 09 12
Most ImprovedMath Year 1: 46.6 (48.9) Math Year 2: 47.9 (53.8)
Enrollment: 237LEP: 0 to 10% Title I50-74% PovertyWhites: 75African Americans: 25
IROQUOIS HIGH4615 TAYLOR BLVD, LOUISVILLE, KY 40215502-473-8269 09 12
Most ImprovedReading Year 1: 16.3 (33.8) Reading Year 2: 32.0 (54)Math Year 1: 22.1 (45.5) Math Year 2: 35.0 (50)
Enrollment: 222LEP: 0 to 10% Title I50-74% PovertyWhites: 49African Americans: 44Latinos: 3Asians: 4
The Education Trust Logo denotes schools that have exceeded their state's average score in reading and/or math.( ) The number in parentheses is the state average score.

Top Performing Schools Directory
Kentucky
IRVINGTON ELEMENTARYROUTE 2 BOX 90, IRVINGTON, KY 40146502-547-4491 KG 08
Most ImprovedMath Year 1: 23.4 (41.8) Math Year 2: 53.3 (44.8)
Enrollment: 407LEP: 0 to 10% Title I50-74% PovertyWhites: 89African Americans: 11
JACKSON INDEPENDENT MIDDLE938 HIGHLAND AVE, JACKSON, KY 41339606-666-5164 05 08
Most ImprovedReading Year 1: 20.7 (33.8) Reading Year 2: 50.9 (54.0)
Enrollment: 116LEP: 0 to 10% Title I50-74% PovertyWhites: 99African Americans: 1
LACY ELEMENTARY12015 GREENVILLE RD, HOPKINSVILLE, KY 42240502-269-2102 KG - 05
Most ImprovedMath Year 1: 17.3 (41.8) Math Year 2: 54.4 (44.8)
Enrollment: 294LEP: 0 to 10% Title I50-74% PovertyWhites: 73African Americans: 26
Legend:
TheEducationTrust
JACKSON COUNTY HIGHPO BOX 427 HWY 421S, MCKEE, KY 40447606-287-7155 09 12
Most ImprovedReading Year 1: 26.3 (33.8) Reading Year 2: 48.8 (54)Math Year 1: 26.0 (45.5) Math Year 2: 37.8 (50)
Enrollment: 691LEP: 0 to 10% Title I50-74% PovertyWhites: 100
KNOX CENTRAL HIGHN MAIN STREET, BARBOURVILLE, KY 40906606-546-9253 09 12
Most ImprovedReading Year 1: 25.6 (33.8) Reading Year 2: 45.5 (54.0)
Enrollment: 67LEP: 0 to 10% Title I75-100% PovertyWhites: 99African Americans: 1
MEYZEEK MIDDLE828 S JACKSON ST, LOUISVILLE, KY 40203502-473-8307 06 - 08
Most ImprovedReading Year 1: 45.4 (45.5) Reading Year 2: 58.3 (49.2)
Enrollment: 328LEP: 0 to 10% Title I50-74% PovertyWhites: 62African Americans: 34Latinos: 1
Asians: 3
The Education Trust Logo denotes schools that have exceeded their state's average score in reading and/or math. 350 The number in parentheses is the state average score.
37

Top Performing Schools Directory
Kentucky
NOE MIDDLE121 WEST LEE ST, LOUISVILLE, KY 40208502-473-8299 06 08
Most ImprovedReading Year 1: 40.0 (45.5) Reading Year 2: 45.6 (49.2)Math Year 1: 38.4 (48.9) Math Year 2: 50.8 (53.8)
Enrollment: 79LEP: 0 to 10% Title I50-74% PovertyWhites: 60African Americans: 33Latinos: 2Asians: 3Native Americans: 1
SANDERS ELEMENTARY8408 TERRY LN, PLEASURE RIDGE, KY 40258502-473-8322 KG 05
Most ImprovedReading Year 1: 39.4 (55.3) Reading Year 2: 66.7 (63.8)
Enrollment: 416LEP: 0 to 10% Title I50-74% PovertyWhites: 67African Americans: 31Latinos: 1
Asians: 1
SUMMER SHADE ELEMENTARYRT 1 BOX 23, SUMMER SHADE, KY 42166502-428-3962 KG 05
Most ImprovedReading Year 1: 40.9 (55.3) Reading Year 2:
Enrollment: 191LEP: 0 to 10% Title I50-74% PovertyWhites: 98African Americans: 2
80.9 (63.8)
TheEducation.Trust
NORTH DRIVE MIDDLE831 NORTH DRIVE, HOPKINSVILLE, KY 42240502-887-1250 06 - 08
Most ImprovedReading Year 1: 39.3 (45.5) Reading Year 2: 48.1 (49.2)
Enrollment: 678LEP: 0 to 10°/0 Title I50-74% PovertyWhites: 65African Americans: 35
SPARKSVILLE ELEMENTARY44 WEED-SPARKSVILLE, COLUMBIA, KY 42728502-378-6565 KG - 08
Most ImprovedReading Year 1: 53.7 (55.3) Reading Year 2: 91.7 (63.8)
Enrollment: 177LEP: 0 to 10% Title I50-74% PovertyWhites: 99
WARFIELD MIDDLEP 0 BOX 378, WARFIELD, KY 41267606-395-5900 06 08
Most ImprovedReading Year 1: 41.9 (45.5) Reading Year 2: 47.1 (49.2)
Enrollment: 294LEP: 0 to 10% Title I50-74% PovertyWhites: 100
36 Legend: The Education Trust Logo denotes schools that have exceeded their state's average score in reading and/or math.( ) The number in parentheses is the state average score.
38

Top Performing Schools Directory
Kentucky
WEST CARTER MIDDLEPO BOX 910, OLIVE HILL, KY 41164606-286-5354 06 08
Most ImprovedReading Year 1: 38.3 (45.5) Reading Year 2: 47.9 (49.2)
Enrollment: 557LEP: 0 to 10% Title I75-100% PovertyWhites: 99Latinos: 1
WHITESBURG MIDDLEPARK STREET, WHITESBURG, KY 41858606-633-2761 06 - 08
TheEducationTrust
Most ImprovedReading Year 1: 41.7 (45.5) Reading Year 2: 47.8 (49.2)
Enrollment: 243LEP: 0 to 10% Title I50-74% Poverty
Legend: The Education Trust Logo denotes schools that have exceeded their state's average score in reading and/or math. 37( ) The number in parentheses is the state average score.
39

Top Performing Schools Directory
MinnesotaAssessment: Minnesota Comprehensive Assessment (elementary school)
Mihnesota Basic Standards Test (middle school:)Proficient: Elementary: no definition available Middle: percent passing
ANDERSEN OPEN ELEMENTARY1098 ANDERSEN LANE, MINNEAPOLIS, MN 55407612-627-2295 Grade: 05
High AchievementMath: 11 (32)
Enrollment: 740LEP: 21 to 30% Title I75-100% PovertyWhites: 20African Americans: 30Latinos: 30Native Americans: 20
BELGRADE BROOTEN ELROSA SECONDARYBOX 339, BELGRADE, MN 56312612-254-8211 Grade: 03
High AchievementReading: 49 (35) Math: 34 (32)
Enrollment: 226LEP: 0 to 10% Title I50-74% PovertyWhites: 95African Americans: 5
CANBY ELEMENTARY307 1ST ST. W., CANBY, MN507-223-7219 Grade: 03
High AchievementReading: 44 (35) Math: 47 (35)
Enrollment: 362LEP: 0 to 10% Title I50-74% PovertyWhites: 98Latinos: 1
Native Americans: 1
38 Legend:
TheEducationTrust
ANDERSEN OPEN ELEMENTARY1098 ANDERSEN LANE, MINNEAPOLIS, MN 55407612-627-2295 Grade: 08
High AchievementReading: 50 (68) Math: 44 (71)
Enrollment: 740LEP: 21 to 30% Title I75-100% PovertyWhites: 20African Americans: 30Latinos: 30Native Americans: 20
BERTHA ELEMENTARYBOX 8, BERTHA, MN218-924-2500 Grade: 03
High AchievementReading: 38 (35)
Enrollment: 323'LEP: 0 to 10% Title I50-74% PovertyWhites: 97Latinos: 3
EAGLE VALLEY SECONDARYBOX 299, EAGLE BEND, MN 56446218-738-6442 Grade: 08
High AchievementReading: 56 (68) Math:55 (71)
Enrollment: 308LEP: 0 to 10% Title I50-74% PovertyWhites: 96African Americans: 1Asians: 1
Native Americans: 2 BEST COPY AVAILABLE
The Education Trust Logo denotes schools that have exceeded their state's average score in reading and/or math.( ) The number in parentheses is the state average score.
40

Top Performing Schools Directory
Minnesota
FOLWELL MIDDLE3611 20TH AVE. S., MINNEAPOLIS, MN 55407612-627-2604 Grade: 08
High AchievementReading: 29 (68) Math:30 (71)
Enrollment: 756LEP: 21 to 30% Title I75-100% PovertyWhites: 25African Americans: 30Latinos: 14Asians: 14Native Americans: 2
HENDRICKS ELEMENTARY200 E. LINCOLN, HENDRICKS, MN507-275-3115 Grade: 06
High AchievementReading: 51 Math:32
Enrollment: 103LEP: 0 to 10% Title I50-74% PovertyWhites: 99African Americans: 1Asians: 1
HOLMES ELEMENTARY1026 E. CENTER ST., ROCHESTER, MN 55904507-281-6085 Grade: 05
High AchievementReading: 41 (38)
Enrollment: 334LEP: 21 to 30% Title I50-74% PovertyWhites: 55African Americans: 10Latinos: 2Asians: 18
HEALY SECONDARY112 KAMNIC ST., PIERZ, MN 56364612-468-6491 Grade: 08
High AchievementReading: 56 (68) Math: 78 (71)
Enrollment: 575LEP: 0 to 10% Title I50-74% PovertyWhites: 100
HILL CITY SECONDARY500 IONE AVE., HILL CITY, MN218-697-2394 Grade: 08
High AchievementReading: 58 (68) Math:76 (71)
Enrollment: 147LEP: 0 to 10% Title I50-74% PovertyWhites: 90Native Americans: 10
KING ELEMENTARYBOX 307, DEER RIVER, MN218-246-8860 Grade: 05
High AchievementReading: 41 (38)
Enrollment: 493LEP: 0 to 10% Title I50-74% PovertyWhites: 73African Americans: 1Native Americans: 26
TheEducationTrust .
Legend: The Education Trust Logo denotes schools that have exceeded their state's average score in reading and/or math. 39( O The number in parentheses is the state average score.
41

Top Performing Schools Directory
Minnesota
LOWELL MUSIC MAGNET ELEMENTARY2000 RICE LAKE RD., DULUTH, MN 55811218-722-9226 Grade: 03
High AchievementReading: 36 (35)
Enrollment: 545LEP: 0 to 10% Title I50-74% PovertyWhites: 80African Americans: 9Latinos: 1
Asians: 7Native Americans: 3
MADELIA ELEMENTARY121 E. MAIN ST., MADELIA, MN507-642-3234 Grade: 03
High AchievementReading: 37 (35)
Enrollment: 290LEP: 11to 20% Title I50-74% PovertyWhites: 70Latinos: 30
MARCY OPEN ELEMENTARY415 4TH AVE. S.E., MINNEAPOLIS, MN612-627-2271 Grade: 08
High AchievementReading: 57 (68) Math:57 (71)
Enrollment: 609LEP: 11to 20% Title I50-74% PovertyWhites: 50African Americans: 35Latinos: 5Asians: 10Native Americans: 4
TheEducationTrust
LOWELL MUSIC MAGNET ELEMENTARY2000 RICE LAKE RD., DULUTH, MN 55811218-722-9226 Grade: 05
High AchievementReading: 47 (38)
Enrollment: 545LEP: 0 to 10% Title I50-74% PovertyWhites: 80African Americans: 9Latinos: 1
Asians: 7Native Americans: 3
MARCY OPEN ELEMENTARY415 4TH AVE. S.E., MINNEAPOLIS, MN612-627-2271 Grade: 03
High AchievementMath:47 (35)
Enrollment: 609LEP: 11to 20% Title I50-74% PovertyWhites: 50African Americans: 35Latinos: 5Asians: 10Native Americans: 4
MARCY OPEN ELEMENTARY415 4TH AVE. S.E., MINNEAPOLIS, MN612-627-2271 Grade: 05
High AchievementMath:32 (32)
Enrollment: 609LEP: 11to 20% Title I50-74% PovertyWhites: 50African Americans: 35Latinos: 5Asians: 10Native Americans: 4
BEST COPY AVAILABLE
40 Legend: The Education Trust Logo denotes schools that have exceeded their state's average score in reading and/or math.( ) The number in parentheses is the state average score.
42

Top Performing Schools Directory
Minnesota
MOTLEY-STAPLES MIDDLEBOX 268, MOTLEY, MN218-352-6170 Grade: 07
High AchievementReading: 79 (68) Math:78 (71)
Enrollment:LEP: 0 to 10% Title I50-74% PovertyWhites: 98Latinos: 2
MOUNTAIN LAKE ELEMENTARY.BOX 400, 450 12TH ST., MOUNTAIN LAKE, MN 56159507-427-3151 Grade: 05
High AchievementReading: 46 (38)
Enrollment: 309LEP: 0 to 10% Title I50-74% PovertyWhites: 78Latinos: 7Asians: 15
PARKERS PRAIRIE ELEMENTARYBOX 46, 518 SOUTH MCCO, PARKERS PRAIRIE, MN218-338-6011 Grade: 03
High AchievementMath:46 (35)
Enrollment: 358LEP: 0 to 10°/0 Title I50-74% PovertyWhites: 98African Americans: 1Latinos: 1
Legend:
TheEducationTrust
MOUNTAIN LAKE ELEMENTARYBOX 400, 450 12TH ST., MOUNTAIN LAKE, MN 56159507-427-3151 Grade: 03
High AchievementReading: 45 (35)
Enrollment: 309LEP: 0 to 10%, Title I50-74% PovertyWhites: 78Latinos: 7Asians: 15
PARKERS PRAIRIE ELEMENTARYBOX 46, 518 SOUTH MCCO, PARKERS PRAIRIE, MN218-338-6011 Grade: 05
High AchievementReading: 49 (38) Math:37 (32)
Enrollment: 358LEP: 0 to 10% Title I50-74% PovertyWhites: 98African Americans: 1Latinos: 1
PINE RIVER ELEMENTARYBOX 610, PINE RIVER, MN 56474218-587-4447 Grade: 03
High AchievementMath:47 (35)
Enrollment: 519LEP: 0 to 10% Title I50-74% PovertyWhites: 97African Americans: 1Latinos: 1
Native Americans: 1
The Education Trust Logo denotes schools that have exceeded their state's average score in reading and/or math. 41( ) The number in parentheses is the state average score.
4 3

Top Performing Schools Directory
MinnesotaPINE RIVER ELEMENTARYBOX 610, PINE RIVER, MN 56474218-587-4447 Grade: 05
High AchievementMath:35 (32)
Enrollment: 519LEP: 0 to 10% Title50-74% PovertyWhites: 97African Americans: 1
Latinos: 1Native Americans: 1
TUTTLE ELEMENTARY1042 18TH AVE. S.E., MINNEAPOLIS, MN 55414612-627-2271 Grade: 03
High AchievementReading: 41 (35) Math:49 (35)
Enrollment: 426LEP: 31 to 40% Title I50-74% PovertyWhites: 40African Americans: 30Asians: 30
WAUBUN SEC.BOX 98, WAUBUN, MN218-473-2173 Grade: 08
High AchievementMath:54 (71)
Enrollment: 284LEP: 0 to 10% Title I50-74% PovertyWhites: 40Native Americans: 60
TheEducationTrust
SHINGLE CREEK FT .FMENTARY5034 OLIVER AVE. N., MINNEAPOLIS, MN 55430612-627-2673 Grade: 05
High AchievementMath:17 (32)
Enrollment: 461LEP: lit° 20°/0 Title I75-100% PovertyWhites: 18African Americans: 61Asians: 16Native Americans: 5
TU1 1LE ELEMENTARY1042 18TH AVE. S.E., MINNEAPOLIS, MN 55414612-627-2271 Grade: 05
High AchievementMath:32 (32)
Enrollment: 426LEP: 31 to 40% Title I50-74% PovertyWhites: 40African Americans: 30Asians: 30
42 Legend: 'The Education Trust Logo denotes schools that have exceeded their state's average score in reading and/or math.( ) The number in parentheses is the state average score.
4 4
Top Performing Schools Directory
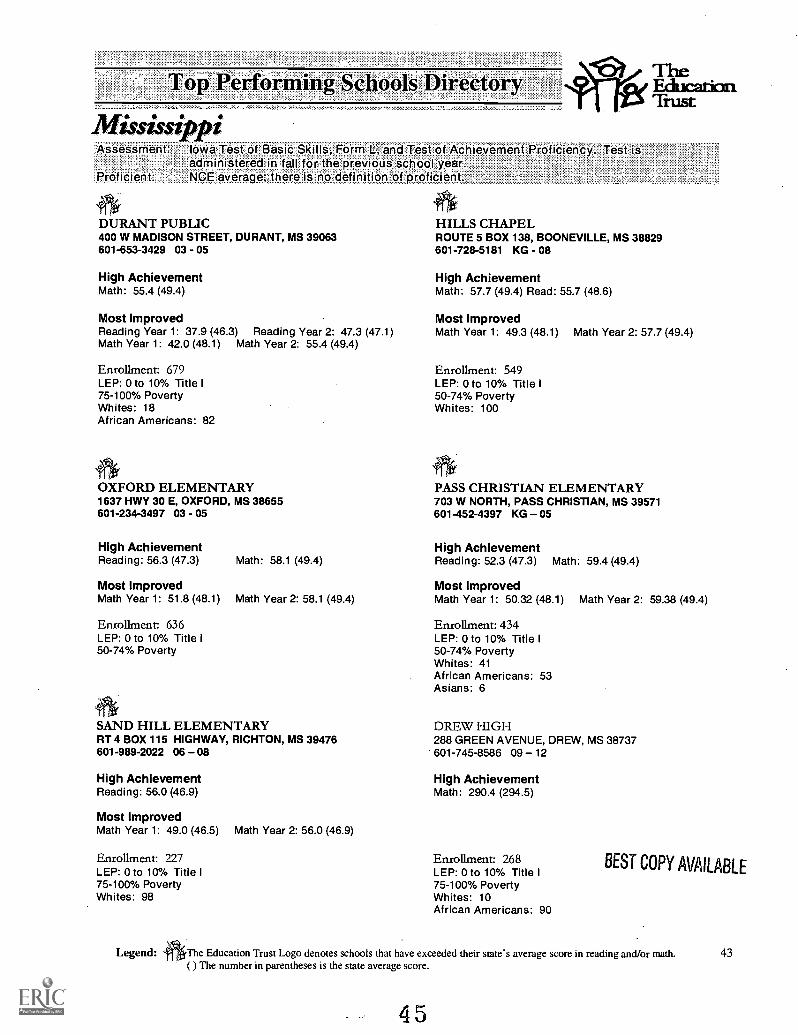
MSS sj P:Assessment: Iowa Test-of Basic Skills, Form L, and Test of Achievement Proficiency. Test is
administered in fall for the previous school year.;Proficient: NCE average; there is no definition of proficient.
4*,DURANT PUBLIC400 W MADISON STREET, DURANT, MS 39063601-653-3429 03 - 05
TheEducationTrust
HILLS CHAPELROUTE 5 BOX 138, BOONEVILLE, MS 38829601-728-5181 KG - 08
High Achievement High AchievementMath: 55.4 (49.4) Math: 57.7 (49.4) Read: 55.7 (48.6)
Most ImprovedReading Year 1: 37.9 (46.3) Reading Year 2: 47.3 (47.1)Math Year 1: 42.0 (48.1) Math Year 2: 55.4 (49.4)
Enrollment: 679LEP: 0 to 10% Title I75-100% PovertyWhites: 18African Americans: 82
OXFORD ELEMENTARY1637 HWY 30 E, OXFORD, MS 38655601-234-3497 03 - 05
High AchievementReading: 56.3 (47.3)
Most ImprovedMath Year 1: 51.8 (48.1) Math Year 2: 58.1 (49.4) Math Year 1: 50.32 (48.1) Math Year 2: 59.38 (49.4)
Most ImprovedMath Year 1: 49.3 (48.1) Math Year 2: 57.7 (49.4)
Enrollment: 549LEP: 0 to 10% Title I50-74% PovertyWhites: 100
PASS CHRISTIAN ELEMENTARY703 W NORTH, PASS CHRISTIAN, MS 39571601-452-4397 KG - 05
High AchievementMath: 58.1 (49.4) Reading: 52.3 (47.3) Math: 59.4 (49.4)
Most Improved
Enrollment: 636LEP: 0 to 10% Title I50-74% Poverty
SAND HILL ELEMENTARYRT 4 BOX 115 HIGHWAY, RICHTON, MS 39476601-989-2022 06 - 08
High AchievementReading: 56.0 (46.9)
Most ImprovedMath Year 1: 49.0 (46.5)
Enrollment: 227LEP: 0 to 10°/0 Title75-100% PovertyWhites: 98
Legend:
Math Year 2: 56.0 (46.9)
Enrollment: 434LEP: 0 to 10% Title I50-74% PovertyWhites: 41African Americans: 53Asians: 6
DREW HIGH288 GREEN AVENUE, DREW, MS 38737601-745-8586 09 - 12
High AchievementMath: 290.4 (294.5)
Enrollment: 268LEP: 0 to 10% Title I75-100% PovertyWhites: 10African Americans: 90
BEST COPY AVAILABLE
The Education Trust Logo denotes schools that have exceeded their state's average score in reading and/or math. 43( ) The number in parentheses is the state average score.
45

Top Performing Schools Directory
Mississippi
4.DURANT PUBLIC400 W MADISON STREET, DURANT, MS 39063601-653-3429 06 08
High AchievementMath: 49.9 (46.9)
Enrollment: 679LEP: 0 to 10% Title I75-100% PovertyWhites: 18African Americans: 82
HEIDELBERG HIGHP 0 DRAWER M, HEIDELBERG, MS 39439601-787-3414 09 12
High AchievementMath: 292.3 (294.5)
Enrollment: 396LEP: 0 to 10% Title I75-100% PovertyAfrican Americans: 99Native Americans: 1
MANNING ELEMENTARY430 HIGHWAY 1 N, GREENVILLE, MS 38701601-334-7116 03 05
High AchievementMath Year 52.3 (49.4)
Enrollment: 366LEP: 0 to 10% Title IAfrican Americans: 100
44 Legend:
TheEducationTrust
EAST CORINTH ELEMENTARY1200 MEEKS STREET, CORINTH, MS 38834601-286-5245 02 - 04
High AchievementMath: 59.9 (49.4)
Enrollment: 463LEP: 0 to 10% Title I50-74% PovertyWhites: 60African Americans: 40
LELAND HIGH403 E THIRD STREET, LELAND, MS 38756601-686-5020 09 - 12
High AchievementMath: 294.8 (294.5)
Enrollment: 421LEP: 0 to 10% Title I50-74% PovertyWhites: 5African Americans: 95
NORA DAVIS MAGNET1305 MARTIN LUTHER KING, LAUREL, MS 39440601-428-7782 KG 06
High AchievementReading: 56.0 (47.3) Math: 58.2 (49.4)
Enrollment: 461LEP: 0 to 10% Title I50-74% PovertyWhites: 25African Americans: 73
The Education Trust Logo denotes schools that have exceeded their state's average score in reading and/or math.( ) The number in parentheses is the state average score.
4 6

Top Performing Schools Directory
Mississippi
WEIR ATTENDANCE CENTERSCHOOL HOUSE STREET, WEIR, MS 39772601-547-6428 KG 12
High AchievementMath: 47.0 (46.9)
Enrollment: 602LEP: 0 to 10% Title I50-74% PovertyWhites: 37African Americans: 63Asians: 6
ARMSTRONG MIDDLE303 MCKEE STREET, STARKVILLE, MS 39759601-324-4070 07 08
Most ImprovedMath Year 1: 44.6 (46.5)
Enrollment: 666LEP: 0 to 10%50-74% PovertyWhites: 36African Americans: 63Asians: 1
Math Year 2: 49.5 (46.8)
FAIRVIEW JUNIOR HIGHROUTE 1 66 FAIRVIEW RO, GOLDEN, MS 38847601-585-3127 KG 09
TheEducationTrust
AKIN ELEMENTARY361 BOWMAN BLVD, GREENVILLE, MS 38701601-334-7161 KG 06
Most ImprovedReading Year 1: 47.3 (48.6) Reading Year 2: 57.4 (48.4)Math Year 1: 44.7 (46.5) Math Year 2: 49.7 (46.8)
Enrollment: 550LEP: 0 to 10% Title I50-74% PovertyWhites: 41African Americans: 59
EARL NASH ELEMENTARYP 0 BOX 391, MACON, MS 39341601-726-5203 KG 04
Most ImprovedMath Year 1: 34.5 (48.1)
Enrollment: 582LEP: 0 to 10% Title I75-100% PovertyWhites: 1African Americans: 98Asians: 1
Math Year 2: 43.9 (49.4)
GLEN ALLAN Al 1ENDANCE CENTERBOX 209, GLEN ALLAN, MS 38744P 0 601-839-2991 PK 06
Most Improved Most ImprovedMath Year 1: 46.8 (48.1) Math Year 2: 53.0 (49.4) Reading Year 1: 33.6 (46.3) Reading Year 2: 41.6 (47.1)
Enrollment: 255LEP: 0 to 10% Title I50-74% PovertyWhites: 100
Enrollment: 163LEP: 0 to 10% Title I75-100% PovertyWhites: 4African Americans: 95Latinos: 1
Legend: The Education Trust Logo denotes schools that have exceeded their state's average score in reading and/or math. 45( ) The number in parentheses is the state average score.
4 7
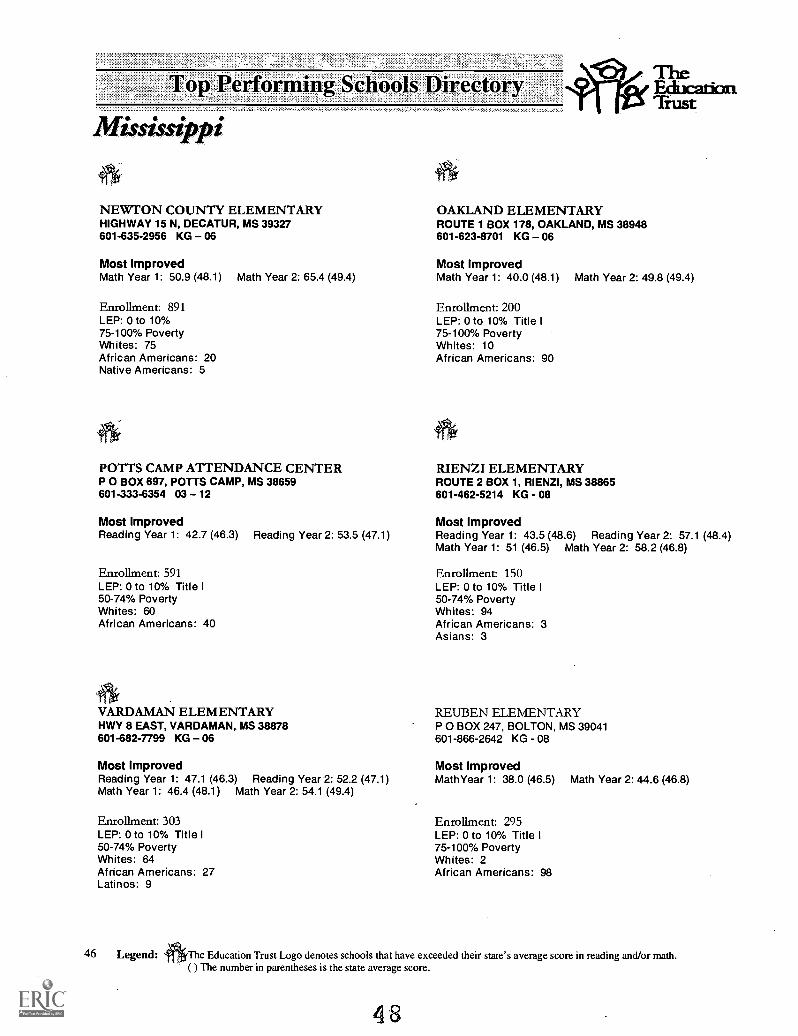
Top Performing Schools Directory
Musissippi
NEWTON COUNTY ELEMENTARYHIGHWAY 15 N, DECATUR, MS 39327601-635-2956 KG - 06
Most ImprovedMath Year 1: 50.9 (48.1) Math Year 2: 65.4 (49.4)
Enrollment: 891LEP: 0 to 10%75-100% PovertyWhites: 75African Americans: 20Native Americans: 5
POTTS CAMP ATTENDANCE CENTERP 0 BOX 697, POTTS CAMP, MS 38659601-333-6354 03 -12
Most ImprovedReading Year 1: 42.7 (46.3) Reading Year 2: 53.5 (47.1)
Enrollment: 591LEP: 0 to 10% Title I50-74% PovertyWhites: 60African Americans: 40
VARDAMAN ELEMENTARYHWY 8 EAST, VARDAMAN, MS 38878601-682-7799 KG - 06
Most ImprovedReading Year 1: 47.1 (46.3) Reading Year 2: 52.2 (47.1)Math Year 1: 46.4 (48.1) Math Year 2: 54.1 (49.4)
Enrollment: 303LEP: 0 to 10% Title I50-74% PovertyWhites: 64African Americans: 27Latinos: 9
OAKLAND ELEMENTARYROUTE 1 BOX 178, OAKLAND, MS 38948601-623-8701 KG - 06
Most ImprovedMath Year 1: 40.0 (48.1)
Enrollment: 200LEP: 0 to 10% Title I75-100% PovertyWhites: 10African Americans: 90
TheEducationTxust
Math Year 2: 49.8 (49.4)
RIENZI ELEMENTARYROUTE 2 BOX 1, RIENZI, MS 38865601-462-5214 KG - 08
Most ImprovedReading Year 1: 43.5 (48.6) Reading Year 2: 57.1 (48.4)Math Year 1: 51 (46.5) Math Year 2: 58.2 (46.8)
Enrollment: 150LEP: 0 to 10% Title I50-74% PovertyWhites: 94African Americans: 3Asians: 3
REUBEN ELEMENTARYP 0 BOX 247, BOLTON, MS 39041601-866-2642 KG - 08
Most ImprovedMathYear 1: 38.0 (46.5) Math Year 2: 44.6 (46.8)
Enrollment: 295LEP: 0 to 10% Title I75-100% PovertyWhites: 2African Americans: 98
46 Legend: "The Education Trust Logo denotes schools that have exceeded their state's average score in reading and/or math.0 The number in parentheses is the state average score.
4

Top Performing Schools Directory
Neva,da
TheEducationTrust.
Assessment: Terra Nova Form A.Proficient. National percentile. Within the state four reporting levels are used: Below Standard,
Approaching Standard, Meets standard, and Exceeds Standard.
EMPIRE ELEMENTARY1260 MONTE ROSA, CARSON CITY, NV 89703702-885-6371 KG - 05
High AchievementReading: 71.1 (77.1)
Enrollment: 556LEP: 41 to 50% Title I50-74% PovertyWhites: 55Latinos: 45
JACKPOT HIGHPO BOX 463, JACKPOT, NV 89825702-755-2374 07 - 12
GRAGSON ELEMENTARY555 NORTH HONOLULU, LAS VEGAS, NV 89110702-799-7330 PK - 05
High AchievementReading: 78 (77.1)
Enrollment: 789LEP: 50% or more50-74% PovertyWhites: 10African Americans: 20Latinos: 70
OR.R MIDDLE1562 EAST KATIE DRIVE, LAS VEGAS, NV 89119702-799-5573 06 - 08
High Achievement High AchievementReading: 62.5 (80.8) Math: 87.5 (76.2) Reading: 62.6 (76.2) Math: 61.0 (71.6)
Enrollment: 132LEP: lit° 20% Title I75-100% Poverty
YERINGTON INTERMEDIATE215 PEARL STREET, YERINGTON, NV 89447702-463-3506 05 - 08
High AchievementReading: 70.5 (76.2) Math: 71.7 (71.6)
Enrollment: 448LEP: llto 20% Title I
50-74% PovertyWhites: 68Latinos: 20Native Americans: 9
Enrollment: 129LEP: 11to 20% Title I75-100% PovertyWhites: 22African Americans: 18Latinos: 44Asians: 6Native Americans: 1
CAHLAN ELEMENTARY2801 FORT SUMTER DRIVE, NORTH LAS VEGAS, NV 89030702-799-7103 KG 05
Most ImprovedReading Year 1: 48Math Year 1: 55
Reading Year 2: 53.6 (76.2)Math Year 2: 63.9 (71.6)
Enrollment: 473LEP: 50% or more Title I75-100% PovertyWhites: 4African Americans: 20Latinos: 75Asians: 1
BEST COPY AVAILABLE
Legend: , The Education Trust Logo denotes schools that have exceeded their state's average score in reading and/or math. 47( ) The number in parentheses is the state average score.
49

Top Performing Schools Directory
Nevada
CRESTWOOD ELEMENTARY1300 PAULINE WAY, LAS VEGAS, NV 89104702-799-7890 PK - 05
Most ImprovedReading Year 1: 76 Reading Year 2: 82.2
TheEducation'Rust
DESERT HEIGHTS ELEMENTARY13948 MT. BISMARK STRE, RENO, NV 89506702-677-5444 KG - 06
Most ImprovedReading Year 1: 49Math Year 1: 35
Enrollment: 609 Enrollment:LEP: 31 to 40% LEP: 21 to 30% Title I50-74% Poverty 50-74% PovertyWhites: 23 Whites: 59African Americans: 10 African Americans: 5Latinos: 65 Latinos: 32Asians: 1 Asians: 3Native Americans: 1 Native Americans: 3
SIERRA VISTA ELEMENTARY2001 GETTO DRIVE, RENO, NV 89512702-322-5365 PK - 06
Most ImprovedMath Year 1: 44 Math Year 2: 90.2
Enrollment: 379LEP: 11to 20% Title I50-74% PovertyWhites: 60African Americans: 1Latinos: 40Asians: 1
Reading Year 2: 57.1Math Year 2: 65.7
48 Legend: P 'The Education Trust Logo denotes schools that have exceeded their state's average score in reading and/or math.0 The number in parentheses is the state average score.
5 0

Top Performing Schools Directory
New HampshireAssessment: New Hampshire State Assessment Test, 1995-96 (high school)Proficient: Proficient
ALT ,FN ELEMENTARY23 GRANITE ST, ROCHESTER, NH 3866603-332-2280 01 - 05
High AchievementReading: 15 (30) Math: 28 (39)
Most ImprovedMath Year 1: 24 (33) Math Year 2: 28 (39)
Enrollment: 345LEP: 0 to 10% Title I50-74% PovertyWhites: 94African Americans: 2Latinos: 2Asians: 2
DALTON ELEMENTARYRR 2 BOX 350, WHITEFIELD, NH 3598603-837-9827 01 - 03
High AchievementReading: 20 (30) Math: 20
Most ImprovedMath Year 1: 6 (33) Math Year 2: 20 (39)
Enrollment: 55LEP: 11to 20% Title I50-74% PovertyWhites: 100
BESSIE C ROWELL20 ROWELL DR, FRANKLIN, NH 3235603-934-5116 03 - 04
Most ImprovedMath Year 1: 10 (33) Math Year 2: 11 (39)
Enrollment: 252LEP: 0 to 10% Title I50-74% Poverty
AMHERST STREET71 AMHERST ST, NASHUA, NH 3060603-594-4385 KG - 06
High AchievementReading: 21 (30) Math: 23 (39)
TheEducationTrust.
Most ImprovedReading Year 1: 14 (29) Reading Year 2: 21 (30)
Enrollment: 413LEP: 0 to 10% Titlel50-74% PovertyWhites: 80African Americans: 2Latinos: 15Asians: 2Native Americans: 1
STRAFFORD ELEMENTARYHC 71 BOX 113, CENTER STRAFFORD, NH 3815603-664-2842 01 08
High AchievementReading: 17 (30)
Enrollment: 472LEP: 0 to 10% Title I50-74% PovertyWhites: 98African Americans: 1Latinos: 1
HILLTOP ELEMENTARY17 GRAND ST, SOMERSWORTH, NH 3878603-692-2435 01 - 04
Most ImprovedReading Year 1: 8 (29) Reading Year 2: 19 (30)Math Year 1: 4 (33) Math Year 2: 11 (39)
Enrollment: 182LEP: 0 to 10% Title I50-74% PovertyWhites: 98African Americans: 1Latinos: 1
BEST COPY AVAILABLE
Legend: The Education Trust Logo denotes schools that have exceeded their state's average score in reading and/or math. 490 The number in parentheses is the state average score.
51

Top Performing Schools Directory
New York
TheEducaticatTrust
Assessment: New York State Pupil Evaluation Program Test (Grades 3 & 6); Grades: RegentsExamination (Secondary)
Proficient. Score at or above the state reference point, but below mastery level. (Grades 3 & 6); Notavailable, Secondary)
CHOIR ACADEMY OF HARLEM2005 MADISON AVE, NEW YORK, NY 10035212-289-3481 04 - 11
High AchievementReading: 106 (56.3)
Most ImprovedReading Year 1: 13 (50.3) Reading Year 2: 106 (56.3)
Enrollment: 282LEP: 0 to 10% Title I50-74% PovertyWhites: 1
African Americans: 95Latinos: 3Native Americans: 1
HOSTOS LINCOLN ACADEMY475 GRAND CONCOURSE, BRONX, NY 10451718-518-4333 09 12
High AchievementReading: 68 (56.3)
Most ImprovedReading Year 1: 29 (50.3) Reading Year 2: 68 (56.3)
Enrollment: 267LEP: 11to 20% Title I50-74% PovertyWhites: 1
African Americans: 23Latinos: 74Asians: 2Native Americans: 1
FASHION INDUSTRIES HIGH225 W 24TH ST, NEW YORK, NY 10016212-255-1235 09 12
High AchievementReading: 41 (56.3) Math: 35 (58.7)
Most ImprovedReading Year 1: 40 (50.3) Reading Year 2: 41 (56.3)
Enrollment: 201LEP: 11to 20% Title I75-100% PovertyWhites: 5African Americans: 27Latinos: 61Asians: 7
LACKAWANNA HIGH550 MARTIN RD, LACKAWANNA, NY 14218716-827-6727 07 - 12
High AchievementMath: 46 (58.7) Reading: 55 (56.3)
Most ImprovedMath Year 1: 32 (52.7) Math Year 2: 46 (58.7)
Enrollment: 5LEP: 0 to 10% Title I50-74% PovertyWhites: 70African Americans: 20Asians: 10
50 Legend: The Education Trust Logo denotes schools that have exceeded their state's average score in reading and/or math.( ) The number in parentheses is the state average score.
52

Top Performing Schools Directory
New York
PS 38350 VERMONT ST, BUFFALO, NY 14213716-888-7060 PK 08
High AchievementMath: 58 (20.3)
Most ImprovedMath Year 1: 20 (26.8)
Enrollment: 726LEP: 11 to 20% Title I75-100% PovertyWhites: 13African Americans: 50Latinos: 36Native Americans: 1
Math Year 2: 58 (20.3)
SYLVAN-VERONA BEACH COMMUNITYRT 13, VERONA BEACH, NY 13162315-762-4404 KG 06
High AchievementGrade: 6Reading: 100 (86.1) Math: 50 (20.3)
TheEducaticaiTrust
SCHOOL 46250 NEWCASTLE RD, ROCHESTER, NY 14610716-288-8008 KG 06
High AchievementMath: 95 (58.5)
Most ImprovedMath Year 1: 56 (45.5)
Enrollment: 373LEP: 0 to 10% Title I50-74% PovertyWhites: 44African Americans: 45Latinos: 8Asians: 2Native Americans: 1
Math Year 2: 95 (58.5)
TALENT UNLIMITEDED HIGH317 E 67TH ST, NEW YORK, NY 10021212-879-6866 09 12
High AchievementReading: 65 (56.3)
Most improved Most ImprovedMath Year 1: 27 (26.8) Math Year 2: 50 (20.3) Math Year 1: 12 (52.7) Math Year 2: 31 (58.7)
Enrollment:LEP: 0 to 10°/. Title I50-74% PovertyWhites: 100
Enrollment:LEP: 0 to 10% Title I50-74% PovertyWhites: 9African Americans: 48Latinos: 40Asians: 3
BEST COPY AVAILABLE
Legend: , The Education Trust Logo denotes schools that have exceeded their state's average score in reading and/or math. 51( ) The number in parentheses is the state average score.
53

Top Performing Schools Directory
New York
ALBANY ELEMENTARY1151 ALBANY ST, UTICA, NY 13501315-792-2150 KG - 06
High AchievementReading: 100 (85.6)
Enrollment: 510LEP: 0 to 10% Title I50-74% PovertyWhites: 68African Americans: 19Latinos: 13
EL PUENTE ACADEMY FOR PEACE & JUSTICE221 S 4TH ST, BROOKLYN, NY 11211718-599-2895 09 10
High AchievementReading: 25 (56.3)
Enrollment: 60LEP: 0 to 10% Title I75-100% PovertyAfrican Americans: 13Latinos: 87
HAMILTON ELEMENTARY20 OAK ST, MOUNT VERNON, NY 10550914-665-5050 KG-06
High AchievementReading: 100 (86.1)
Enrollment: 508LEP: 0 to 10% Title I50-74% PovertyWhites: 89African Americans: 8Latinos: 2Asians: 1
ARTHUR P. MOMOT60 MONTY ST, PLATTSBURGH, NY 12901518-563-1140 PK - 05
High AchievementReading: 100 (85.6)
Enrollment: 460LEP: 0 to 10% Title I50-74% PovertyWhites: 86African Americans: 9Latinos: 4Asians: 1
TheEducationTrust
GREAT NECK ROAD ELEMENTARY1400 GREAT NECK RD, COPIAGUE, NY 11726516-842-4000 KG - 05
High AchievementReading: 100 (85.6)
Enrollment: 492LEP: 11to 20% Title I50-74% PovertyWhites: 38African Americans: 30Latinos: 30Asians: 2
HOLMES365 DUPONT AVE, TONAWANDA, NY 14150716-874-8423
High AchievementMath: 83 (58.5)
Enrollment: 508LEP: 0 to 10% Title50-74% PovertyWhite: 89African American: 8Latinos: 2Asians: 1
52 Legend: The Education Trust Logo denotes schools that have exceeded their state's average score in reading and/or math.( ) The number in parentheses is the state average score.
54

Top Performing Schools Directory
New York
IS 237 RACHEL CARSON46-21 COLDEN ST, FLUSHING, NY718-353-6464 07 09
High AchievementMath: 47 (58.7)
Enrollment: 290LEP: 21 to 30%50-74% PovertyWhites: 10African Americans: 10Latinos: 22Asians: 58
NEWTOWN HIGH48-01 90TH ST, ELMHURST, NY 11373718-592-4300 09 - 12
High AchievementMath: 39 (58.7)
Enrollment: 639LEP: 31 to 40%50-74% PovertyWhites: 7African Americans: 8Latinos: 61Asians: 24
PS 161330 CROWN ST, BROOKLYN, NY 11225718-756-3100 KG - 05
High AchievementReading: 100 (86.1) Math: 75 (20.3)
Enrollment: 413LEP: 0 to 10% Title I75-100% PovertyWhites: 1
Legend:
JEFFERSON ELEMENTARYBAILEY RD, MASSENA, NY 13662315-764-0292 KG 06
High AchievementReading: 100 (85.6)
Enrollment: 363LEP: 0 to 10% Title I50-74% PovertyWhites: 100
PS 139 THE REGO PARK93-06 63RD DR, REGO PARK, NY 11374718-459-1044 KG 06
High AchievementMath: 40 (20.3)
Enrollment: 916LEP: 31 to 40%50-74% PovertyWhites: 40African Americans: 4Latinos: 16Asians: 40
PS 171 PATRICK HENRY19 EAST 103RD ST, NEW YORK, NY 10029212-860-5801 PK 06
High AchievementMath: 30 (20.3)
Enrollment: 561LEP: 0 to 10% Title I75-100% PovertyWhites: 1
African Americans: 49Latinos: 49Asians: 1
TheEducationTrust
BEST COPY AVAILABLE
The Education Trust Logo denotes schools that have exceeded their state's average score in reading and/or math. 53( ) The number in parentheses is the state average score.
55

Top Performing Schools Directory
New York
PS 1924715 18TH AVE, BROOKLYN, NY 11204718-633-3061 PK 05
High AchievementMath: 77 (58.5)
Enrollment: 438LEP: 31 to 40% Title I75-100% PovertyWhites: 32African Americans: 5Latinos: 44Asians: 19
PS 214 CADWALLADER COLDEN31-15 140TH ST, FLUSHING, NY 11354718-461-4055 KG 06
High AchievementMath: 50 (20.3)
Enrollment: 626LEP: 0 to 10%50-74% PovertyWhites: 14African Americans: 9Latinos: 37Asians: 40
THE RENAISSANCE36-41 28TH ST, LONG ISLAND CITY, NY 11106718-937-1463 04 08
High AchievementMath: 34 (58.7)
Enrollment: 135LEP: NA50-74% Poverty
54 Legend:
TheEducationTrust
PS 2001940 BENSON AVE, BROOKLYN, NY 11214718-236-5466 PK - 05
High AchievementMath: 83 (58.5)
Enrollment: 938LEP: 21 to 30%50-74% PovertyWhites: 40African Americans: 1Latinos: 12Asians: 27
PS 70 INDIAN PARK ACADEMY76 BUFFUM ST, BUFFALO, NY 14210716-828-4800 03 08
High AchievementReading: 100 (85.6) Math: 68 (58.5)
Enrollment: 273LEP: 0 to 10% Title I75-100% PovertyWhites: 45African Americans: 52Latinos: 3
SCHOOL 16759 N BROADWAY, YONKERS, NY 10701914-376-8340 KG 06
High AchievementReading: 100 (86.1)
Enrollment: 372LEP: 0 to 10% Title I50-74% PovertyWhites: 21African Americans: 42Latinos: 32Asians: 5
The Education Trust Logo denotes schools that have exceeded their state's average score in reading and/or math.( ) The number in parentheses is the state average score.
56

Top Performing Schools Directory
New York
iftySYLVAN-VERONA BEACH COMMUNITYRT 13, VERONA BEACH, NY 13162315-762-4404 KG 06
High AchievementGrade: 3Reading: 100 (85.6)
Enrollment:LEP: 0 to 10% Title I50-74% PovertyWhites: 100
z
WATSON WILLIAMS ES107 ELMWOOD PL, UTICA, NY 13501315-792-2167 KG 06
High AchievementReading: 99 (85.6)
Enrollment: 527LEP: 0 to 10% Title I75-100% PovertyWhites: 30African Americans: 56Latinos: 10Asians: 4
ittCLINTON V. BUSH ELEMENTARY150 PARDEE AVE, JAMESTOWN, NY 14701716-483-4401 KG 04
Most ImprovedMath Year 1: 29 (45.5)
Enrollment: 339LEP: 0 to 10% Title I50-74% PovertyWhites: 86African Americans: 7Latinos: 6Native Americans: 1
Math Year 2: 79 (58.5)
THEODORE ROOSEVELTOGDEN ST, BINGHAMTON, NY 13901607-762-8283 PK 05
High Achievement
Reading: 98 (85.6)
Enrollment: 438LEP: 0 to 10% Title I75-100% PovertyWhites: 62African Americans: 25Latinos: 7Asians: 6
TheEducationTrust
WOODROW WILSON287 PROSPECT ST, BINGHAMTON, NY 13905607-763-8442 KG - 05
High AchievementReading: 98 (85.6)
Enrollment: 537LEP: 11 to 20% Title I75-100% PovertyWhites: 72African Americans: 14Latinos: 7Asians: 7
EAST NY VOCATIONAL & TECHNOLOGY HIGH1 WELLS ST, BROOKLYN, NY718-647-5204 09 12
Most ImprovedMath Year 1: 9 (52.7) Math Year 2: 18 (58.7)
Enrollment: 368LEP: 0 to 10% Title I75-100% PovertyWhites: 1African Americans: 75Latinos: 22Asians: 1Native Americans: 1
Legend: ¶The Education Trust Logo denotes schools that have exceeded their state's average score in reading and/or math. 55( ) The number in parentheses is the state average score.
57

Top Performing Schools Directory
New York
GOV. GEORGE CLINTON100 MONTGOMERY ST, POUGHKEEPSIE, NY 12601914-451-4600 PK 05
Most ImprovedReading Year 1: 43 (79.5) Reading Year 2: 89 (85.6)
Enrollment: 365LEP: 11to 20% Title I75-100% PovertyWhites: 18African Americans: 80Latinos: 2
LOUIS D. BRANDEIS HIGH145 W 84TH ST, NEW YORK, NY 10024212-799-0300 09 12
Most ImprovedReading Year 1: 6 (50.3) Reading Year 2: 21 (56.3)Math Year 1: 16 (52.7) Math Year 2: 27 (58.7)
Enrollment: 838LEP: 31 to 40% Title I50-74% PovertyWhites: 2African Americans: 36Latinos: 62
PS 15040-01 43D AVE, LONG ISLAND CITY, NY 11104718-784-2252 KG 06
Most ImprovedMath Year 1: 9 (26.8) Math Year 2: 22 (20.3)
Enrollment: 894LEP: 41 to 50% Title I50-74% PovertyWhites: 1
African Americans: 37Latinos: 58Asians: 38
LAUREL PARK ELEMENTARYSWAN PL, BRENTWOOD, NY 11717516-434-2464 01 - 05
Most ImprovedMath Year 1: 31 (45.5)
Enrollment: 448LEP: 11to 20% Title I50-74% PovertyWhites: 21African Americans: 24Latinos: 53Asians: 1Native Americans: 1
TheEducationTrust
Math Year 2: 76 (58.5)
NORTH ELEMENTARY400 WEST NORTH ST, GENEVA, NY 14456315-781-0489 KG 05
Most ImprovedMath Year 1: 33 (45.5) Math Year 2: 72 (58.5)
Enrollment: 591LEP: 11t° 20% Title I50-74% PovertyWhites: 57African Americans: 22Latinos: 19Asians: 2
PS 150 CHARLES JAMES FOX920 E 167TH ST, BRONX, NY 10459718-328-7729 PK 06
Most ImprovedReading Year 1: 46 (83.7) Reading Year 2: 79 (86.1)
Enrollment: 721LEP: 1 1to 20% Title I75-100% PovertyAfrican Americans: 13Latinos: 87
BEST COPY AVAILABLE
56 Legend: 'The Education Trust Logo denotes schools that have exceeded their state's average score in reading and/or math.0 The number in parentheses is the state average score.
58

Top Performing Schools Directory
New York
PS 18118 HAMPSHIRE ST, BUFFALO, NY 14213716-888-7030 KG 08
Most ImprovedMath Year 1: 11 (45.5)
Enrollment: 705LEP: 31 to 40% Title I75-100% PovertyWhites: 15African Americans: 24Latinos: 60Asians: 1
Native Americans: 1
Math Year 2: 49 (58.5)
PS 28 TRIANGLE ACADEMY
1515 SOUTH PARK AVE, BUFFALO, NY 14220716-828-4777 03 08
Most ImprovedReading Year 1: 41 (79.5) Reading Year 2: 87 (85.6)
Enrollment: 474LEP: 0 to 10% Title I75-100% PovertyWhites: 40African Americans: 51Latinos: 8Asians: 1
Native Americans: 1
SCHOOL 16759 N BROADWAY, YONKERS, NY 10701914-376-8340 Grade: 3
Most ImprovedReading Year 1: 42 (79.5) Reading Year 2: 84 (85.6)
Enrollment: 372LEP: 0 to 10% Title I50-74% PovertyWhites: 21African Americans: 42Latinos: 32Asians: 5
PS 204108-110 W 174TH ST, BRONX, NY 10453718-583-6636 KG 05
TheEducationTrust
Most ImprovedReading Year 1: 34 (79.5) Reading Year 2: 81 (85.6)
Enrollment: 458LEP: 21 to 30% Title I75-100% PovertyWhites:African Americans: 32Latinos: 68
PS 72 LORRAINE ACADEMY
71 LORRAINE AVE, BUFFALO, NY 14220716-828-4809 05 - 08
Most ImprovedReading Year 1: 45 (83.7) Reading Year 2: 95 (86.1)
Enrollment: 300LEP: 0 to 10% Title I50-74% PovertyWhites: 48African Americans: 50Latinos: 1
Native Americans: 1
Legend: The Education Trust Logo denotes schools that have exceeded their state's average score in reading and/or math. 57( ) The number in parentheses is the state average score.
59

Top Performing Schools Directory
North Carolina
TheEducation.'Trust
Assessment: North Carolina End of Course TestProficient: Students performing at this level consistently demonstrate mastery of grade level subject
matter and skills and are well prepared for the next grade level.
NANTAHALA SCHOOLSTAR RT BOX 307, TOPTON, NC 28781704-321-4388 KG - 12
High AchievementReading: 82.5 Math: 81.0
Enrollment: 116LEP: 0 to 10% Title I50-74% PovertyWhites: 100
BEST COPY AVAILABLE
58 Legend: 'The Education Trust Logo denotes schools that have exceeded their state's average score in reading and/or math.( ) The number in parentheses is the state average score.
60
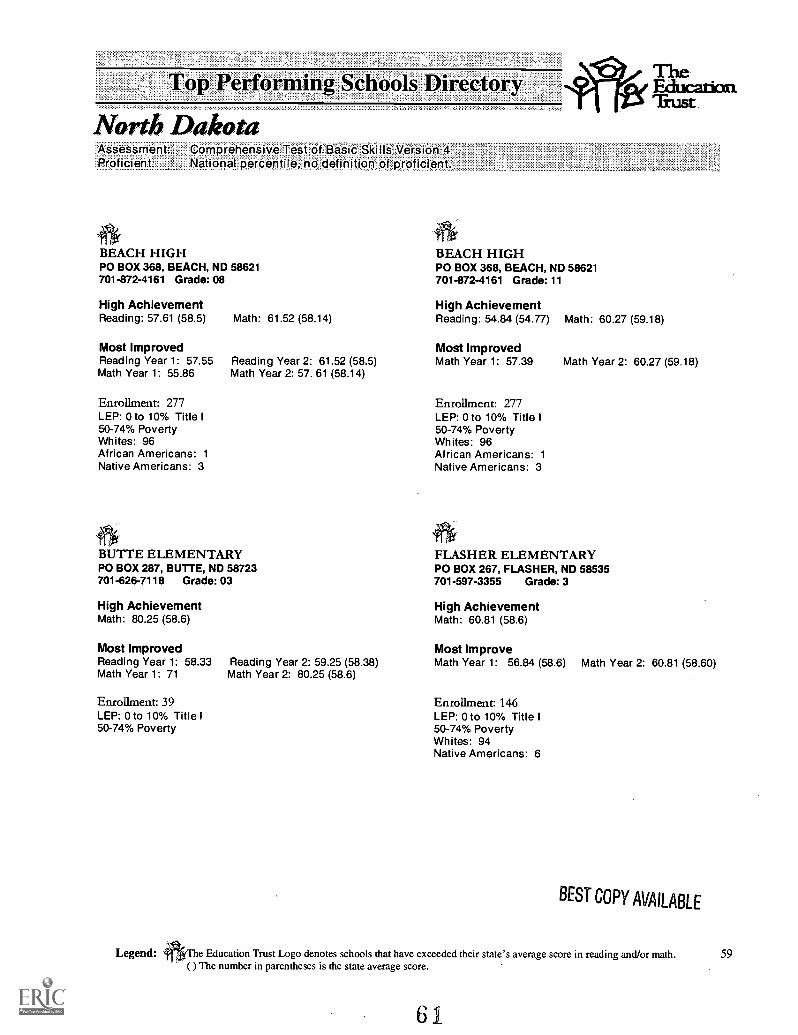
Top Performing Schools Directory
North DakotaAssessment: Comprehensive Test of Basic Skills Version 4.Proficient: National percentile, no cfefinition of proficient.
BEACH HIGHPO BOX 368, BEACH, ND 58621701-872-4161 Grade: 08
High AchievementReading: 57.61 (58.5)
Most ImprovedReading Year 1: 57.55Math Year 1: 55.86
Enrollment: 277LEP: 0 to 10% Title I50-74% PovertyWhites: 96African Americans: 1Native Americans: 3
Math: 61.52 (58.14)
Reading Year 2: 61.52 (58.5)Math Year 2: 57. 61 (58.14)
BUTTE ELEMENTARYPO BOX 287, BUTTE, ND 58723701-626-7118 Grade: 03
High AchievementMath: 80.25 (58.6)
Most ImprovedReading Year 1: 58.33Math Year 1: 71
Enrollment: 39LEP: 0 to 10% Title I50-74% Poverty
Legend:
Reading Year 2: 59.25 (58.38)Math Year 2: 80.25 (58.6)
BEACH HIGHPO BOX 368, BEACH, ND 58621701-872-4161 Grade: 11
TheEducationTrust.
High AchievementReading: 54.84 (54.77) Math: 60.27 (59.18)
Most ImprovedMath Year 1: 57.39 Math Year 2: 60.27 (59.18)
Enrollment: 277LEP: 0 to 10% Title I50-74% PovertyWhites: 96African Americans: 1
Native Americans: 3
FLASHER ELEMENTARYPO BOX 267, FLASHER, ND 58535701-597-3355 Grade: 3
High AchievementMath: 60.81 (58.6)
Most ImproveMath Year 1: 56.84 (58.6) Math Year 2: 60.81 (58.60)
Enrollment: 146LEP: 0 to 10% Title I50-74% PovertyWhites: 94Native Americans: 6
BEST COPY AVAILABLE
The Education Trust Logo denotes schools that have exceeded their state's average score in reading and/or math. 59( ) The number in parentheses is the state average score.
61

Top Performing Schools Directory
North Dakota
FRANKLIN ELEMENTARYPO BOX 269, JAMESTOWN, ND 58401701-252-0558 KG 06
High AchievementReading: 63.25 (58.38)
Most ImproveMath Year 1: 57.43Reading Year 1: 57.75
Enrollment: 134LEP: 0 to 10% Title I50-74% PovertyWhites: 90Latinos: 4Native Americans: 6
HALLIDAY HIGHPO BOX 188, HALLIDAY, ND 58636701-938-4391 08
High AchievementReading: 59.55 (58.5)
TheEducationTrust
Most ImproveMath Year 2: 60.16 (58.6) Math Year 1: 54 Math Year 2: 59.55 (58.14)Reading Year 2: 63.25 (58.38)
HEBRON ELEMENTARYPO BOX 0, HEBRON, ND 58638701-878-4442 Grade: 03
High AchievementReading: 62.72 (58.38)
Most ImproveMath Year 1: 58.37
(58.5)
Enrollment: 124LEP: 0 to 10% Title I50-74% PovertyWhites: 99Native Americans: 1
Math: 61.36 (58.6)
Enrollment: 67LEP: 0 to 10% Title I50-74% PovertyWhites: 75Native Americans: 25
REEDER ELEMENTARYPO BOX 248, REEDER, ND 85649701-853-2311 Grade: 8
High AchievementReading: 60.75 (58.5) Math: 70.5 (58.14)
Most ImproveMath Year 2: 61.36 (58.6) Reading Year 1: 67.28 (58.5) Reading Year 2: 70.5
Enrollment: 51LEP: 0 to 10% Title I50-74% PovertyWhites: 82Native Americans: 18
60 Legend: The Education Trust Logo denotes schools that have exceeded their state's average score in reading and/or math.( ) The number in parentheses is the state average score.
62

Top Performing Schools Directory
North Dakota
ROOSEVELT HIGHPO BOX 197, CARSON, ND 58529701-622-3263 08
High AchievementReading: 70.44 (58.5) Math: 68.77 (58.14)
Most ImprovedReading Year 1: 67 Reading Year 2: 68.77 (58.5)Math Year 1: 64 Math Year 2: 70.44 (58.14)
Enrollment: 75LEP: 0 to 10% Title I50-74% PovertyWhites: 92Asians: 1
Native Americans: 7
WOLFORD ELEMENTARYPO BOX 478, WOLFORD, ND 58385701-583-2387 PK 06
High AchievementReading: 75.80 (58.38)
Most ImproveReading Year 1: 66.2Math Year 1: 73.4
Enrollment: 35LEP: 0 to 10% Title I50-74% PovertyWhites: 100
Math: 80 (58.6)
Reading Year 2: 75.8 (58.38)Reading Year 2: 80.0 (58.6)
ROOSEVELT HIGHPO BOX 197, CARSON, ND 58529701-622-3263 Grade: 11
High AchievementReading: 59 (54.77) Math: 70.28 (59.18)
TheEducatical.Trust
Most ImprovedReading Year 1: 57.46 Reading Year 2: 59 (54.77)Math Year 1: 61.53 Math Year 2: 70.28 (59.18)
Enrollment: 75LEP: 0 to 10% Title I50-74% PovertyWhites: 92Asians: 1Native Americans: 7
HALLIDAY HIGHPO BOX 188, HALLIDAY, ND 58636701-938-4391 11
High AchievementReading: 58.15 (54.77)
Enrollment: 67LEP: 0 to 10% Title I50-74% PovertyWhites: 75Native Americans: 25
BEST COPY AVAILABLE
Legend: The Education Trust Logo denotes schools that have exceeded their state's average score in reading and/or math. 61( ) The number in parentheses is the state average score.
63

Top Performing Schools Directory
North .Dakota
LAKE AGASSIZ F.T,FMENTARY605 STANFORD, GRAND FORKS, ND 58203701-746-2275 Grade: 03
High AchievementReading: 51.28 (58.38)
Enrollment: 458LEP: 0 to 10% Title I75-100% PovertyWhites: 69African Americans: 6Latinos: 3Asians: 2Native Americans: 20
FLASHER ELEMENTARYPO BOX 267, FLASHER, ND 58535701-597-3355 Grade: 08
Most ImprovedReading Year 1: 57.56 Reading Year 2: 58.50 (58.5)
Enrollment: 146LEP: 0 to 10% Title I50-74% PovertyWhites: 94Native Americans: 6
ROLE1"1 E HIGHPO BOX 97, ROLETTE, ND 58366701-246-3596 07 - 12
Most ImprovedGrade: 11Reading Year 1: 51.68
Enrollment: 123LEP: 0 to 10% Title I50-74% PovertyWhites: 74African Americans: 1Native Americans: 25
Reading Year 2: 53 (54.77)
ELGIN HIGHPO BOX 70, ELGIN, ND 58533701-584-2374 Grade: 11
Most ImprovedMath Year 1: 54.37
Enrollment: 122LEP: 0 to 10% Title I50-74% PovertyWhites: 94Asians: 1Native Americans: 5
The.EducationTrust
Math Year 2: 57.56 (59.18)
MONTPELIER HIGHPO BOX 10, MONTPELIER, ND 58472701-489-3348 07 - 12
Most ImprovedReading Year 1: 40.41 Reading Year 2: 54.92 (58.5)Math Year 1: 50.46 Math Year 2: 54.07 (58.14)
Enrollment: 72LEP: 0 to 10% Title I50-74% PovertyWhites: 100
62 Legend: The Education Trust Logo denotes schools that have exceeded their state's average score in reading and/or math.( ) The number in parentheses is the state average score.
64

Top Performing Schools Directory
OklahomaAssessment.Proficient:
TheEducation.Trust
Oklahoma Core Curriculum Tests.Satisfactory. Students performing at this level consistently demonstrate mastery of gradelevel subject matter and skills and are well prepared for the next grade level.
CALVIN ELEMENTARYP 0 BOX 127, CALVIN, OK 74531405-645-2411 Grade: 05
High AchievementReading: 92 (77)
Most ImprovedGrade: 5Reading Year 1: 67
Enrollment: 141LEP: 0 to 10% Title I75-100% PovertyWhites: 90Native Americans: 10
Reading Year 2: 92
WAPANUCKA ELEMENTARY
P 0 BOX 188, WAPANUCKA, OK 73461405-937-4288 KG - 08
High AchievementReading: 92 (72)
Most ImprovedReading Year 1: 67
Enrollment: 139LEP: 0 to 10% Title I75-100% PovertyWhites: 53African Americans: 1Latinos: 6Asians: 3Native Americans: 37
Reading Year 2: 92
Oklahoma
LEACH ELEMENTARYP 0 BOX 211, TWIN OAKS, OK 74368918-868-2277 Grade: 08
High AchievementReading: 86 (72) Math: 83 (72)
Enrollment: 116LEP: 50% or more Title I75-100% PovertyWhites: 10Native Americans: 90
BRUSHY ELEMENTARY
RT 3 BOX 231-8, SALLISAW, OK 74955918-775-4458 PK - 08
High AchievementMath: 100 (72)
Enrollment: 218LEP: 0 to 10% Title I75-100% PovertyWhites: 56Latinos: 3Native Americans: 41
BEST COPY AVAILABLE
Legend: The Education Trust Logo denotes schools that have ex( their state's average score in reading and/or math. 63( ) The number in parentheses is the state average score.
65

Top Performing Schools DirectoryCANEY ELEMENTARYP 0 BOX 60, CANEY, OK 74533405-889-6608 KG - 08
High AchievementMath: 100 (80)
Enrollment: 247LEP: 0 to 10% Title I50-74% PovertyWhites: 90Native Americans: 10
CHEYENNE ELEMENTARYP 0 BOX 650, CHEYENNE, OK 73628405-497-3371 KG - 08
High AchievementMath: 93 (72)
Enrollment: 200LEP: 0 to 10% Title I50-74% PovertyWhites: 98Latinos: 1Native Americans: 1
HAYWOOD ELEMENTARYHCR 75 BOX 3, MCALESTER, OK 74501918-423-6265 KG - 08
High AchievementMath: 100 (72)
Enrollment: 148LEP: 0 to 10% Title I50-74% PovertyWhites: 70Native Americans: 30
64 Legend:
CANUTE ELEMENTARYP 0 BOX 490, CANUTE, OK 73626405-472-3922 KG - 08
High AchievementReading: 93 (72) Math: 93 (72)
Enrollment: 150LEP: 0 to 10% Title I50-74% PovertyWhites: 98Native Americans: 2
FELT ELEMENTARYP 0 BOX 47, FELT, OK 73937
405-426-2220 KG - 08
High AchievementReading: 88 (72) Math: 100 (72)
Enrollment: 47LEP: 11to 20% Title I75-100% PovertyWhites: 75Latinos: 25
HOMER ELEMENTARYP 0 BOX 2509, ADA, OK 74820405-332-4303 PK - 05
High AchievementMath: 93 (80)
Enrollment: 554LEP: 0 to 10% Title I75-100% PovertyWhites: 53African Americans: 1Asians: Asians: 1
Native Americans: 45
TheEducationTrust
BEST COPY AVAILABLE
The Education Trust Logo denotes schools that have exceeded their state's average score in reading and/or math.( ) The number in parentheses is the state average score.

Top Performing Schools Directory
Oklahoma
JACKSON ELEMENTARY2201 N LINDY, LAWTON, OK 73502405-353-7890 PK - 06
High AchievementReading: 100 (77)
Enrollment: 223LEP: 0 to 10% Title I75-100% PovertyWhites: 53African Americans: 32Latinos: 8Asians: 1
Native Americans: 5
MIYLANE ELEMENTARYP 0 BOX 39, LANE, OK 74555405-889-2743 Grade: 08
High AchievementReading: 100 (77)
Enrollment: 166LEP: 0 to 10% Title I50-74% PovertyWhites: 35African Americans: 2Latinos: 2Asians: 1
Native Americans: 60
LOST CITY ELEMENTARY
P 0 BOX 138, HULBERT, OK 74444918-772-2538 Grade: 08
High AchievementReading: 92 (72) Math: 100 (72)
Enrollment: 151LEP: 0 to 10% Title I75-100% PovertyWhites: 40Native Americans: 60
KEYES ELEMENTARYP 0 BOX 47, KEYES, OK 73947405-546-7686 KG - 08
High AchievementReading: 100 (77) Math: 100 (80)
Enrollment: 96LEP: 0 to 10% Title I50-74% PovertyWhites: 98Latinos: 2
LANE ELEMENTARYP 0 BOX 39, LANE, OK 74555405-889-2743 KG - 08
High AchievementReading: 92 (72) Math: 100 (72)
Enrollment: 166LEP: 0 to 10% Title I50-74% PovertyWhites: 35African Americans: 2Latinos: 2Asians: 1Native Americans: 60
TheEducationTrust
MULHALL-ORLANDO ELEMENTARY
P 0 BOX 8, ORLANDO, OK 73073405-649-2228 Grade: 08
High AchievementReading: 100 (77) Math: 100 (80)
Enrollment: 166LEP: 0 to 10% Title I50-74% Poverty
BEST COPY AVAILABLE
Legend: The Education Trust Logo denotes schools that have exceeded their state's average score in reading and/or math. 65( ) The number in parentheses is the state average score.
6 7

Top Performing Schools Directory
Oklahoma
MULHALL-ORLANDO ELEMENTARYP 0 BOX 8, ORLANDO, OK 73073405-649-2228 KG - 08
High AchievementMath: 93 (72)
Enrollment: 166LEP: 0 to 10% Title I50-74% Poverty
SUNNYSIDE ELEMENTARYROUTE 4 BOX 1050, CUSHING, OK 74023918-225-1635 01 - 05
High AchievementReading: 95 (77)
Enrollment: 198LEP:. 0 to 10% Title I50-74% PovertyWhites: 85African Americans: 5Native Americans: 10
WHITEFIELD ELEMENTARYP 0 BOX 178, WHITEFIELD, OK 74472918-967-8572 KG - 08
High AchievementMath: 100 (80)
Enrollment: 77LEP: 0 to 10% Title I75-100% PovertyWhites: 80Native Americans: 20
66 Legend:
PIERCE ELEMENTARY2701 S TULSA, OKLA CITY, OK 73108405-685-1988 PK - 05
High AchievementReading: 86 (77) Math: 93 (80)
Enrollment: 265LEP: 21 to 30% Title I75-100% PovertyWhites: 50African Americans: 5Latinos: 40Native Americans: 5
4ki
TheEducationTrust
TENKILLER ELEMENTARYRURAL ROUTE 1 BOX 750, WELLING, OK 74471918-457-5996 KG - 08
High AchievementReading: 85 (72)
Enrollment: 196LEP: 31 to 40% Title I75-100% PovertyWhites: 16Native Americans: 84
AGRA ELEMENTARYP 0 BOX 279, AGRA, OK 74824918-375-2261 PK - 08
Most ImprovedReading Year 1: 50 Reading Year 2: 83Math Year 1: 50 Math Year 2: 83
Enrollment: 214LEP: 0 to 10% Title I75-100% PovertyWhites: 100Native Americans:
The Education Trust Logo denotes schools that have exceeded their state's average score in reading and/or math.( ) The number in parentheses is the state average score.
68

Top Performing Schools Directory
Oklahoma
BOWLEGS ELEMENTARYP 0 BOX 88, BOWLEGS, OK 74830405-398-4321 KG - 08
Most ImprovedReading Year 1: 50 Reading Year 2: 86
Enrollment: 231LEP: 0 to 10% Title I75-100% PovertyWhites: 58African Americans: 2Native Americans: 40
FLETCHER ELEMENTARYP 0 BOX 489, FLETCHER, OK 73541405-549-6020 KG - 06
Most ImprovedReading Year 1: 68 Reading Year 2: 92
Enrollment: 263LEP: 0 to 10% Title I50-74% PovertyWhites: 86African Americans: 1
Latinos: 2Asians: 1
Native Americans: 10
OKLAHOMA UNION ELEMENTARYRT 1 BOX 377-7, S COFFEYVILL, OK 74072918-251-6552 KG - 06
Most ImprovedMath Year 1: 62 Math Year 2: 89
Enrollment: 223LEP: 0 to 10% Title I50-74% PovertyWhites: 96African Americans: 1Native Americans: 3
TheEducationTrust
COLBERT EAST WARD ELEMENTARYP 0 BOX 310, COLBERT, OK 74733405-296-2198 04 - 06
Most ImprovedReading Year 1: 51 Reading Year 2: 79
Enrollment: 179LEP: 0 to 10% Title I50-74% PovertyWhites: 59African Americans: 5Latinos: 6Native Americans: 30
GARFIELD ELEMENTARY601 S 7TH ST, PONCA CITY, OK 74601405-767-8030 01 - 06
Most ImprovedReading Year 1: 31 Reading Year 2: 77Math Year 1: 46 Math Year 2: 76
Enrollment: 286LEP: 0 to 10% Title I75-100% PovertyWhites: 60African Americans: 13Latinos: 6Asians: 1
Native Americans: 20
PICHER-CARDIN ELEMENTARYP 0 BOX 280, PICHER, OK 74360918-673-1783 KG - 06
Most ImprovedMath Year 1: 55 Math Year 2: 82
Enrollment: 245LEP: 0 to 10% Title I75-100% PovertyWhites: 80African Americans: 1
Asians: 1
Native Americans: 19
BEST COPY AVAILABLE
Legend: The Education Trust Logo denotes schools that have exceeded their state's average score in reading and/or math. 67( ) The number in parentheses is the state average score.
69

Top Performing Schools Directory
Oklahoma
PRESTON ELEMENTARYP 0 BOX 418, PRESTON, OK 74456918-756-8470 KG 08
ROOSEVELT ELEMENTARY1502 SW "I" AVE, LAWTON, OK 73501405-355-0199 PK - 06
TheEducationTrust
Most Improved Most ImprovedMath Year 1: 62 Math Year 2: 88 Reading Year 1: 42 Reading Year 2: 67
Enrollment: 260LEP: 0 to 10% Title I
50-74% PovertyWhites: 65African Americans: 20Native Americans: 15
Enrollment: 193LEP: 0 to 10% Title I75-100% PovertyWhites: 30African Americans: 38Latinos: 14Asians: 1Native Americans: 16
68 Legend: The Education Trust Logo denotes schools that have exceeded their state's average score in reading and/or math.( ) The number in parentheses is the state average score.
7 0

Top Performing Schools Directory
Rhode Island
TheT t
Assessment: Grade 4 & 8 RI Math Performance Assessment Program, Rhode Island New StandardsReference Exam, Metropolitan Achievement Test, Grade 10 Reading.
Proficient Proficient/Achieved Standard: At this level, students demonstrate the ability to applyconcepts and processes effectively and accurately. Students communicate ideas in clearand effective ways.
CARL G. LAURO99 KENYON STREET, PROVIDENCE, RI 2903401-456-9391 KG 06
High AchievementReading: 15 (71) Math: 1 (20)
Enrollment: 975LEP: 41 to 50% Title I75-100% PovertyWhites: 9African Americans: 26Latinos: 62Asians: 12Native Americans: 1
CENTRAL FALLS JUNIOR-SENIOR HIGH24 SUMMER STREET, CENTRAL FALLS, RI 2863401-727-7710 07 - 12
High AchievementGrade: 10Reading: 26 (64) Math: 38 (66)
Enrollment: 54LEP: 21 to 30% Title I75-100% PovertyWhites: 12African Americans: 3Latinos: 85
NATHANAEL GREENE MIDDLE721 CHALKSTONE AVENUE, PROVIDENCE, RI 2908401-456-9347 06 - 08
High AchievementReading: 49 (64) Math: 39 (60)
Enrollment: 812LEP: 0 to 10% Title I75-100% PovertyWhites: 35Native Americans: 1
CENTRAL FALLS JUNIOR-SENIOR HIGH24 SUMMER STREET, CENTRAL FALLS, RI 2863401-727-7710 Grade: 08
High AchievementReading: 27 (69) Math: 30 (60)
Enrollment: 54LEP: 21 to 30% Title I75-100% PovertyWhites: 12African Americans: 3Latinos: 85
CUNNINGHAM40 BALDWIN STREET, PAWTUCKET, RI 2860401-729-6262 KG 06
High Achievement
Reading: 35 (71)
Enrollment: 662LEP: 11t° 20% Title I75-100% PovertyWhites: 27African Americans: 35Latinos: 36Asians: 1Native Americans: 2
ROBERT F. KENNEDY195 NELSON STREET, PROVIDENCE, RI 2908401-456-9403 01 - 06
High AchievementMath: 13
Enrollment: 595LEP: 50% or more Title I75-100% PovertyWhites: 11African Americans: 22Latinos: 12Asians: 55
BEST COPY AVAILABLE
Legend: 'The Education Trust Logo denotes schools that have exceeded their state's average score in reading and/or math. 69( ) The number in parentheses is the state average score.
71

Top Performing Schools Directory
Rhode isknd
ROGERS HIGHWICKHAM ROAD, NEWPORT, RI 2840401-849-3608 09 - 12
High AchievementReading: 63 (64)
Enrollment: 915LEP: 0 to 10%75-100% PovertyWhites: 78African Americans: 14Latinos: 5Asians: 2Native Americans: 1
WOONSOCKET MIDDLE357 PARK PLACE, WOONSOCKET, RI 2895401-767-4600 06 - 08
High AchievementReading: 47 (60) Math: 42 (60)
Enrollment: 454LEP: 0 to 10%75-100% Poverty
TheEucation.Trust
WOONSOCKET HIGH777 CASS AVENUE, WOONSOCKET, RI 2895401-767-4662 09 - 12
High AchievementReading: 52 (64) Math: 54 (66)
Enrollment: 580LEP: 0 to 10%75-100% PovertyWhites: 72African Americans: 6Latinos: 11Asians: 10Native Americans: 1
70 Legend: The Education Trust Logo denotes schools that have exceeded their state's average score in reading and/or math.0 The number in parentheses is the state average score.
7 2

Top Performing Schools Directory
Tennessee.Assessment: Tennessee Comprehensive Achievement Program. New assessment in 1997-98.Proficient: No information available.
BRICEVILLE ELEMENTARY103 SLATE STONE ROAD, BRICEVILLE, TN 37710615-426-2289 KG - 05
High Achievement:Reading: 56 (55) Math: 61 (57)
Enrollment: 159LEP: 0 to 10% Title I75-100% PovertyWhites: 100
WESTWOOD ELEMENTARY912 OAKDALE STREET, MANCHESTER, TN 37355615-728-3412 PK - 06
High Achievement:Reading: 63 (55) Math: 66 (57)
Enrollment: 372LEP: 0 to 10% Title I50-74% PovertyWhites: 90African Americans: 3Latinos: 5Asians: 2
Ak
ELK VALLEY ELEMENTARYROUTE 2, PIONEER, TN 37847615-784-6866 KG.- 08
High Achievement:Reading: 56 (55) Math: 65 (57)
Enrollment: 94LEP: 0 to 10% Title I75-100% PovertyWhites: 100
TheEducaticalTrust
BEST COPY AVAILABLE
Legend: The Education Trust Logo denotes schools that have exceeded their state's average score in reading and/or math. 71( ) The number in parentheses is the state average score.
73
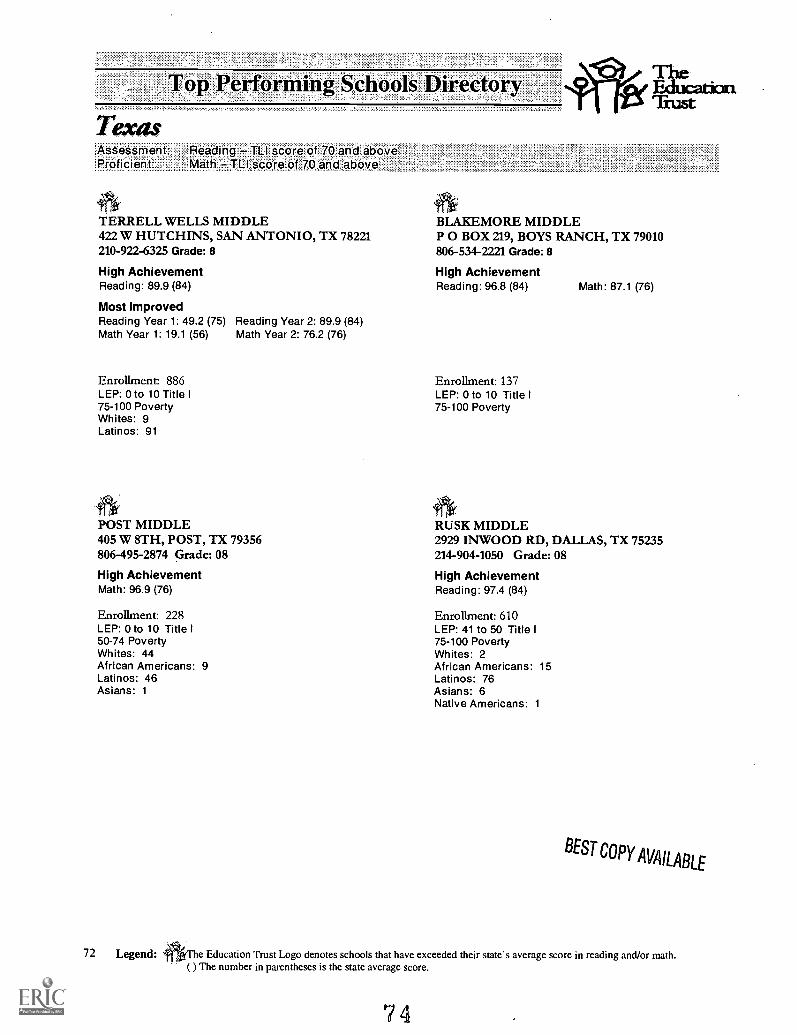
Texas
Top Performing Schools Directory
Assessment Reading TLI score of 70 and abOve'Proficient: Math TLI score of 70 and above
TERRELL WELLS MIDDLE422 W HUTCHINS, SAN ANTONIO, TX 78221210-922-6325 Grade: 8
High AchievementReading: 89.9 (84)
Most ImprovedReading Year 1: 49.2 (75) Reading Year 2: 89.9 (84)Math Year 1: 19.1 (56) Math Year 2: 76.2 (76)
Enrollment: 886LEP: 0 to 10 Title I75-100 PovertyWhites: 9Latinos: 91
POST MIDDLE405 W 8TH, POST, TX 79356806-495-2874 Grade: 08
High AchievementMath: 96.9 (76)
Enrollment: 228LEP: 0 to 10 Title I50-74 PovertyWhites: 44African Americans: 9Latinos: 46Asians: 1
TheEducationTrust
BLAKEMORE MIDDLEP 0 BOX 219, BOYS RANCH, TX 79010806-534-2221 Grade: 8
High AchievementReading: 96.8 (84) Math: 87.1 (76)
Enrollment: 137LEP: 0 to 10 Title I75-100 Poverty
RUSK MIDDLE2929 INWOOD RD, DALLAS, TX 75235214-904-1050 Grade: 08
High AchievementReading: 97.4 (84)
Enrollment: 610LEP: 41 to 50 Title I75-100 PovertyWhites: 2African Americans: 15Latinos: 76Asians: 6Native Americans: 1
BEST COPY AVAILABLE
72 Legend: The Education Trust Logo denotes schools that have exceeded their state's average score in reading and/or math.( ) The number in parentheses is the state average score.
74

Top Performing Schools Directory
Texas
THE TEACHER ACADEMY510 S SUGAR RD, EDINBURG, TX 78539210-383-1684 Grade: 10
High AchievementReading: 97.7 (86) Math: 89.7 (73)
Enrollment: 178LEP: 0 to 10 Title I50-74 PovertyWhites: 21Latinos: 77Asians: 2
ARANSAS PASS MIDDLE450 SOUTH AVENUE A, ARANSAS PASS, TX 78336512-758-3248 09 - 12
High AchievementReading: 86 (73)
Enrollment: 7LEP: NA Title I50-74 Poverty
Whites: 51African Americans: 4Latinos: 43Asians: 1
Native Americans: 1
J K HILEMAN ELP 0 BOX 128, QUEEN CITY, TX 75572903-796-6304 Grade: 4
Most ImprovedMath Year 1: 41.2 (70) Math Year 2: 96.7 (82)
Enrollment: 486LEP: 0 to 10 Title I50-74 PovertyWhites: 60African Americans: 40
Legend:
TheEducatical.Trust
ANSON JONES MIDDLE1256 PINN RD, SAN ANTONIO, TX 78227210-678-2100 Grade: 8
Most ImprovedReading Year 1: 58.9 (75) Math: 87 (84)
Enrollment: 240LEP: 0 to 10 Title I75-100 PovertyWhites: 13African Americans: 6Latinos: 80Asians: 1
ATTUCKS MIDDLE4330 BELLFORT BLVD, HOUSTON, TX 77051713-733-9253 06 - 08
Most ImprovedReading Year 1: 41.1 (75) Reading Year 2: 70.8 (84)
Enrollment: 533LEP: 11to 20 Title I50-74 PovertyWhites: 1African Americans: 86Latinos: 13Asians: 1
KEY MIDDLE4000 KELLEY ST, HOUSTON, TX 77026713-635-2353 Grade: 8
Most ImprovedReading Year 1: 47.2 (75) Reading Year 2:81.5 (84)Math Year 1: 23.6 (56) Math Year 2:75.9 (76)
Enrollment: 919LEP: 0 to 10 Title I50-74 PovertyWhites: 2African Americans: 68Latinos: 30
BEST COPY AVAILABLE
The Education Trust Logo denotes schools that have exceeded their state's average score in reading and/or math.( ) The number in parentheses is the state average score.
7 5
73

Top Performing Schools Directory
Texas
PROGRESO MIDDLEP 0 BOX 613, PROGRESO, TX 78579210-565-6539 Grade: 08
Most ImprovedMath Year 1: 23.5 (56) Math Year 2: 74.3 (76)
Enrollment: 433LEP: 31 to 40 Title I75-100 PovertyLatinos: 100
YSLETA MIDDLE8691 INDEPENDENCE DR, EL PASO, TX 79907915-859-1613 06 - 08
Most ImprovedMath Year 1: 33.8 (56) Math Year 2: 76.9 (76)
Enrollment: 569LEP: 31 to 40 Title I75-100 PovertyLatinos: 100
74 Legend:
TheEducationTrust
RAYBURN MIDDLE1400 CEDARHURST, SAN ANTONIO, TX 78227210-678-2150 Grade: 08
Most ImprovedMath Year 1: 31.1 (56) Math Year 2: 77.6 (76)
Enrollment: 808LEP: 0 to 10 Title I50-74 PovertyWhites: 21African Americans: 5Latinos: 73
AIRPORT ELEMENTARY410 N AIRPORT DR, WESLACO, TX 78596210-969-6770 KG - 04
High AchievementReading: 100 (83) Math: 100 (82)
Enrollment: 12LEP: 31 to.40 Title I75-100 PovertyWhites: 1Latinos: 99
The Education Trust Logo denotes schools that have exceeded their state's average score in reading and/or math.( ) The number in parentheses is the state average score.
0 6

Top Performing Schools Directory10-Virpnla
IASsessment. National percentileProficient: levels available in 1997-98
DRYDEN PRIMARYPO BOX 89, DRYDEN, VA 24243703-346-4443 KG - 04
High AchievementReading: 54 (58) Math: 61 (58)
Grade: 3Enrollment: 449LEP: 0 to 10 Title I75-100 PovertyWhites: 97African Americans: 2Asians: 1
FRANCIS SCOTT KEY ELEMENTARY2300 KEY BLVD, ARLINGTON, VA 22201703-358-4210 KG - 05
High AchievementReading: 71 (62) Math: 72 (62)
Grade: 5Enrollment: 636LEP: 50 or more Title I50-74 PovertyWhites: 30African Americans: 15Latinos: 43Asians: 10Native Americans: 2
TheEdticationTrust
FRANCIS SCOTT KEY ELEMENTARY2300 KEY BLVD, ARLINGTON, VA 22201703-358-4210 KG - 05
High AchievementReading: 79 (58) Math: 78 (58)
Grade: 3Enrollment: 636LEP: 50 or more Title I50-74 PovertyWhites: 30African Americans: 15Latinos: 43Asians: 10Native Americans: 2
IVOR ELEMENTARYPO BOX 169, IVOR, VA 23866804-859-6539 KG - 05
High AchievementReading: 64 (62) Math: 67 (62)
Enrollment: 163LEP: 0 to 10 Title I50-74 PovertyWhites: 55African Americans: 43Latinos: 2
BESTCOPY AVAILABLE
Legend: The Education Trust Logo denotes schools that have exceeded their state's average score in reading and/or math. 75( ) The number in parentheses is the state average score.
77

Top Performing Schools Directory
Virginia
LONG BRANCH ELEMENTARY33 N FILLMORE ST, ARLINGTON, VA 22201703-358-4220 KG - 05
High AchievementReading: 67 (62) Math: 70 (62)
Grade: 5Enrollment: 478LEP: 41 to 50 Title I50-74 PovertyWhites: 41African Americans: 17Latinos: 32Asians: 10
WESTHAVEN ELEMENTARY3701 CLIFFORD ST, PORTSMOUTH, VA 23707804-393-8855 KG - 04
High AchievementReading: 66 (58) Math:65 (58)
Grade: 3Enrollment: 632LEP: 0 to 10 Title I50-74 PovertyWhites: 55African Americans: 42Asians: 2Native Americans: 1
TheEditcation.Trust
VIRGINIA MIDDLE501 PIEDMONT ST, BRISTOL, VA 24201703-669-2042 07 - 08
High AchievementReading: 65 (57) Math: 54 (57)
Grade: 8Enrollment: 410LEP: 0 to 1050-74 PovertyWhites: 92African Americans: 7Latinos: 1
Asians: 1
WILLARD MODEL ELEMENTARY1511 WILLOW WOOD DR, NORFOLK, VA 23509804-441-2891 KG - 05
High AchievementReading: 67 (62) Math:70 (62)
Grade: 5Enrollment: 565LEP: 0 to 1050-74 PovertyWhites: 40African Americans: 55Asians: 4Native Americans: 1
76 Legend: The Education Trust Logo denotes schools that have exceeded their state's average score in reading and/or math.( ) The number in parentheses is the state average score.
78

Top Performing Schools Directory
WashingtonAssessment. Comprehensive Test of Basic Skills version 4Proficient: Reduction in the percent of students scoring in the bottom quarter over time
CURLEW2193 CURLEW SCHOOL RD, CURLEW, WA 99118509-779-4931 Grade: 08
High AchievementMath: 23 (23.2)
Most ImprovedReading Year 1: 39 Reading Year 2: 23
Enrollment: 359LEP: 0-10%50-74% PovertyWhites: 85African Americans: 1Latinos: 4Asians: 4Native Americans: 6
414%WHITSTRAN ELEMENTARYROUTE 2 BOX 2197, PROSSER, WA 99350509-973-2345 Grade: 4
High AchievementReading: 23 (23.5)
Most ImprovedReading Year 1: 49 Reading Year 2: 23
Enrollment: 278LEP: 41-50%75-100% PovertyWhites: 38Latinos: 60Asians: 2
cf
TheEchicatian.Trust
GRANT1018 NO. PROSPECT, TACOMA, WA 98406206-596-1402 Grade: 04
High AchievementMath: 6 (28.1)
Most ImprovedMath Year 1: 41 Math Year 2: 6
Enrollment: 342LEP: 11-20%75-100% Poverty
AUDUBON ELEMENTARYW 2020 CARLISLE AVE., SPOKANE, WA 99205509-353-5234 PK - 06
High AchievementReading: 27 (23.5) Math: 22 (28.1)
Enrollment: 607LEP: 0 to 10% Title I75-100% PovertyWhites: 85African Americans: 4Latinos: 4Asians: 2Native Americans: 5
BEST COPY AVAILABLE
Legend: 'The Education Trust Logo denotes schools that have exceeded their state's average score in reading and/or math. 770 The number in parentheses is the state average score.
79

Top Performing Schools Directory
Washington
BEMISSEAST 2323 BRIDGEPORT A, SPOKANE, WA 99207509-353-4476 Grade: 4
High AchievementMath: 26 (28.1)
Enrollment: 601LEP: 11-20%75-100% PovertyWhites: 76African Americans: 3Asians: 1
Other: 20
LAKE STICKNEY ELEMENTARY1625 MADISON WAY, LYNNWOOD, WA 98037206-356-1303 KG - 05
High AchievementReading: 11 (23.5)
Enrollment: 515LEP: 0 to 10% Title I50-74% PovertyWhites: 76African Americans: 7Latinos: 10Asians: 6Native Americans: 1
STEVENS1242 18 AV E, SEATTLE, WA 98112206-281-6760 Grade: 04
High AchievementReading: 13 (23.5)
Enrollment: 274LEP: 11 to 20% Title I50-74% PovertyWhites: 51African Americans: 20Latinos: 10Asians: 18Native Americans: 1
CUSICKPO BOX 270, CUSICK, WA 99119509-445-1125 Grade: 08
High AchievementReading: 19 (20.2) Math: 10 (23.2)
Enrollment: 70LEP: 0-10%50-74% PovertyWhites: 77Asian: 2Native Americans: 21
LONGFELLOW301 N 10TH AVENUE, PASCO, WA 99301509-547-2429 Grade: 04
High AchievementReading: 25 (28.1)
Enrollment: 454
75-100% PovertyWhites: 22Latinos: 78
TheEducation.Trust.
ALDERWOOD3400 HOLLYWOOD AVENUE, BELLINGHAM, WA 98225206-676-6404 Grade: 04
Most ImprovedMath Year 1: 71 Math Year 2: 35
Enrollment: 301LEP: 11-20%50-74% PovertyWhites: 72African Americans: 1
Latinos: 9Asians: 12Native Americans: 6
78 Legend: The Education Trust Logo denotes schools that have exceeded their state's average score in reading and/or math.( ) The number in parentheses is the state average score.
80

Top Performing Schools Directory
Washington
SARAH J. ANDERSON2215 NE 104 STREET, VANCOUVER, WA 98686206-696-7231 Grade: 04
Most ImprovedMath Year 1: 45 Math Year 2: 19
Enrollment: 575LEP: 21-30%50-74% PovertyWhites: 73African Americans: 7Latinos: 18Asians: 1Native Americans: 1
GRANTHAM1253 POPLAR, CLARKSTON, WA 99403509-758-2503 Grade: 04
Most ImprovedMath Year 1: 51 Math Year 2: 29
Enrollment: 387LEP: 0-10%75-100% PovertyWhites: 100African Americans: 5Latinos: 5Native Americans: 10
NEAH BAYPO BOX 86, NEAH BAY, WA 98357206-645-2221 Grade: 08
Most ImprovedMath Year 1: 75 Math Year 2: 31
Enrollment: 326LEP: 0-10%50-74% PovertyWhites: 4African Americans: 1Latinos: 1Native Americans: 94
CENTRAL311 3RD STREET, HOQUIAM, WA 98550206-533-1151 Grade: 4
Most ImprovedReading Year 1:42 Reading Year 2: 16
Enrollment: 363LEP: 0-10%75-100% PovertyWhites: 76African Americans: 1Latinos: 10Asians: 1Native Americans: 12
TheEducationTrust
HOUGH1900 DANIEL STREET, VANCOUVER, WA 98660206-696-7275 Grade: 04
Most ImprovedMath Year 1: 57 Math Year 2: 24
Enrollment: 406LEP: 0-10%50-74% PovertyWhites: 77African Americans: 6Latinos: 11Asians: 2Native American: 4
KITSAP LAKE111 CARR BLVD, BREMERTON, WA 98312206-478-5100 Grade: 04
Most ImprovedMath Year 1: 59 Math Year 2: 29
Enrollment: 112LEP: 0-10%50-74% Poverty
BEST COPY AVAILABLE
Legend: 4 *The Education Trust Logo denotes schools that have exceeded their state's average score in reading and/or math. 79( ) The number in parentheses is the state average score.
8 1

Top Performing Schools Directory
Washington
PRESCOTTP.O BOX 65, PRESCOTT, WA 99348509-849-2215 Grade: 08
Most ImprovedMath Year 1: 32 Math Year 2: 90
Enrollment: 128LEP: 41-50%50-74% PovertyWhites: 48Latinos: 52
TheEducationTrust
80 Legend: The Education Trust Logo denotes schools that have exceeded their state's average score in reading and/or math.( ) The number in parentheses is the state average score.
82

Top Performing Schools Directory
West Vir niaAssessment: Stanford Achievement Test Version 9Proficient: National percentile; no levels
BRAXTON COUNTY HIGH200 JERRY BURTON DRIVE, SUTTON, WV 26601304-765-7331 09 - 12
High AchievementReading: 61 (59)
Most ImprovedGrade: 11Reading Year 1: 53Math Year 1: 41
Enrollment: 746LEP: 0 to 10°/0 Title I50-74% PovertyWhites: 99African Americans: 1
Reading Year 2: 61Math Year 2: 56
CAMERON ELEMENTARY5 CHURCH STREET, CAMERON, WV 26033304-686-3305 KG - 06
High AchievementReading: 71 (61) Math: 93 (70)
Most ImprovedReading Year 1: 58Math Year 1: 80
Enrollment: 398LEP: 0 to 10% Title I50-74% PovertyWhites: 99African Americans: 1
Reading Year 2: 71Math Year 2: 93
COTTAGEVILLE ELEMENTARYSCHOOL STREET, COTTAGEVILLE, WV 25239304-372-7330 PK - 05
High AchievementReading: 76 (57) Math: 80 (66)
Most ImprovedReading Year 1: 35Math Year 1: 65
Enrollment: 152LEP: 0 to 10% Title I50-74% PovertyWhites: 100
Reading Year 2: 76Math Year 2: 80
TheEducationTrust
BRAXTON COUNTY MIDDLE100 CARTER BRAXTON DRI, SUTTON, WV 26601304-765-2644 05 - 08
High AchievementReading: 66 (61)
Most Improved
Reading Year 1: 57 Reading Year 2: 66
Enrollment: 789LEP: 0 to 10% Title I50-74% PovertyWhites: 99African Americans: 1
CONFIDENCE ELEMENTARYSTAR ROUTE BOX 163, RED HOUSE, WV 25168304-586-2041 KG - 05
High AchievementReading: 74 (57)
Most ImprovedReading Year 1: 66 Reading Year 2: 74
Enrollment: 118LEP: 0 to 10% Title I50-74% PovertyWhites: 100
AI*DANESE ELEMENTARYBOX 69, DANESE, WV 25831304-438-6827 KG - 05
High AchievementReading: 62 (57)
Most ImprovedReading Year 1: 53 Reading Year 2: 62
Enrollment: 120LEP: 0 to 10% Title I75-100% PovertyWhites: 100
Legend: The Education Trust Logo denotes schools that have exceeded their state's average score in reading and/or math.( ) The number in parentheses is the state average score.
8 3 BEST COPY AVAILABLE
81

Top Performing Schools Directory
West Virginia
HACKER VALLEY ELEMENTARYP.O. BOX 69, HACKER VALLEY, WV 26222304-493-6488 Grade: 6
High AchievementReading: 65 (61) Math: 81 (70)
Most ImprovedReading Year 1: 57Math Year 1: 66
Enrollment: 94LEP: 0 to 10% Title I75-100% PovertyWhites: 100
Reading Year 2: 65Math Year 2: 91
LOST CREEK ELEMENTARYPO BOX 128, LOST CREEK, WV 26385304-745-3531 PK 06
High AchievementReading: 58 (61) Math: 70 (70)
Most ImprovedGrade: 6Reading Year 1: 50
Enrollment: 199LEP: 0 to 10% Title I75-100% PovertyWhites: 99African Americans: 1
Reading Year 2: 58
OAKWOOD ELEMENTARY909 OAKHURST DRIVE, CHARLESTON, WV 25314304-348-6696 KG 06
High AchievementGrade: 6Reading: 56 (61)
Most ImprovedGrade: 6Reading Year 1: 50
Enrollment: 139LEP: 0 to 10% Title I75-100% PovertyWhites: 75African Americans: 14Asians: 1
82 Legend:
Reading Year 2: 56
TheEducationTrust
LITTLE BIRCH ELEMENTARYGENERAL DELIVERY, LITTLE BIRCH, WV 26629304-765-2042 PK - 04
High AchievementReading: 71 (57) Math: 76 (64)
Most Improved
Math Year 1: 53 Math Year 2: 76
Enrollment: 131LEP: 0 to 10% Title I75-100% PovertyWhites: 100
MIDLAND TRAIL ELEMENTARY200 FERRY STREET, DIAMOND, WV 25015304-949-1823 KG - 06
High AchievementReading: 67 (57) Math: 79 (66)
Most ImprovedReading Year 1: 52Math Year 1: 57
Enrollment: 161LEP: 0 to 10% Title I50-74% PovertyWhites: 99African Americans: 1
Reading Year 2: 67Math Year 2: 79
SOPHIA ELEMENTARYBOX 487, SOPHIA, WV 25921304-683-4541 KG 06
High AchievementGrade: 6Reading: 56 (61)
Most ImprovedGrade: 6Math Year 1: 72
Math: 81 (70)
Math Year 2: 81
Enrollment: 321LEP: 0 to 10% Title I75-100% PovertyWhites: 98African Americans: 2
The Education Trust Logo denotes schools that have exceeded their state's average score in reading and/or math.( ) The number in parentheses is the state average score.
8 4 BEST COPY AVAILAbLt

Top Performing Schools Directory
West Virginia
SOPHIA ELEMENTARYBOX 487, SOPHIA, WV 25921304-683-4541 KG 06
High AchievementGrade: 4Reading: 73 (57)
Most ImprovedGrade: 4Reading Year 1: 47Math Year 1: 72
Enrollment: 321LEP: 0 to 10% Title I75-100% PovertyWhites: 98African Americans: 2
Math: 84 (64)
Reading Year 2: 73Math Year 2: 84
ZELA ELEMENTARYCOUNTY ROAD, BOX 1073, SUMMERSVILLE, WV 26651304-872-1481 KG 06
High AchievementGrade: 6Reading: 58 (61) Math: 72 (70)
Most ImprovedMath Year 1: 57 Math Year 2: 72
Enrollment: 145LEP: 0 to 10% Title I75-100% PovertyWhites: 98Native Americans: 2
CAMERON ELEMENTARY5 CHURCH STREET, CAMERON, WV 26033304-686-3305 KG 06
High AchievementGrade: 4Math: 85 (66)
Enrollment: 398LEP: 0 to 10% Title I50-74% PovertyWhites: 99African Americans: 1
Legend:
TROY ELEMENTARYTROY, WV 26443304-462-8655 PK - 06
High AchievementGrade: 6Reading: 79 (61)
Most ImprovedGrade: 6Reading Year 1: 68
Enrollment: 176LEP: 0 to 10% Title I50-74% PovertyWhites: 100
Math: 85 (70)
TheEducation.Trust
Reading Year 2: 79
BRAXTON COUNTY HIGH200 JERRY BURTON DRIVE, SUTTON, WV 26601304-765-7331 09 - 12
High AchievementGrade: 9Math: 63 (63)
Enrollment: 746LEP: 0 to 10% Title I50-74% PovertyWhites: 99African Americans: 1
FAIRVIEW ELEMENTARY101 HIGH STREET, SAINT ALBANS, WV 25177304-722-0224 PK - 06
High Achievement
Math: 80 (70)
Enrollment: 295LEP: 0 to 10% Title I50-74% PovertyWhites: 98African Americans: 2
The Education Trust Logo denotes schools that have exceeded their state's average score in reading and/or math.( ) The number in parentheses is the state average score.
85 BEST COPY AVAILABLE
83

Top Performing Schools Directory
West Virginia
GEARY SCHOOLP.O. BOX 89, LEFT HAND, WV 25251304-565-3721 KG 08
High AchievementGrade: 6Reading: 66 (61) Math: 89 (70)
Enrollment: 309LEP: 0 to 10% Title I50-74% Poverty
HUGH DINGESS ELEMENTARYRT 1 BOX 607, HARTS, WV 25524304-855-3585 KG - 05
High AchievementGrade: 4Reading: 68 (57) Math: 82 (64)
Enrollment: 199LEP: 0 to 10°/0 Title I75-100% PovertyWhites: 100
MONTCALM ELEMENTARYROUTE 2 BOX 35, ROCK, WV 24747304-589-7095 PK 06
High AchievementMath: 91 (70)
Enrollment: 282LEP: 0 to 10% Title I75-100% PovertyWhites: 99African Americans: 1
GEARY SCHOOLP.O. BOX 89, LEFT HAND, WV 25251304-565-3721 KG - 08
High AchievementGrade: 4Math: 74 (66)
Enrollment: 309LEP: 0 to 10% Title I50-74% Poverty
LOST CREEK ELEMENTARYPO BOX 128, LOST CREEK, WV 26385304-745-3531 PK - 06
High Achievement
Reading: 58 (57)
Enrollment: 199LEP: 0 to 10% Title I75-100% PovertyWhites: 99African Americans: 1
TheEducationTrust
OAK HILL ELEMENTARY140 SCHOOL STREET, OAK HILL, WV 25901304-469-4541 PK - 04
High AchievementMath: 79 (66)
Enrollment: 434LEP: 0 to 10% Title I50-74% PovertyWhites: 97African Americans: 3
84 Legend: The Education Trust Logo denotes schools that have exceeded their state's average score in reading and/or math.( ) The number in parentheses is the state average score.
86

Top Performing Schools Directory
West Virginias.
OAKWOOD ELEMENTARY909 OAKHURST DRIVE, CHARLESTON, WV 25314304-348-6696 KG 06
High AchievementReading: 61 (57)
Enrollment: 139LEP: 0 to 10% Title I75-100% PovertyWhites: 75African Americans: 14Asians: 1
SOUTH PRESTON JUNIOR HIGHPO BOX 400, TUNNELTON, WV 26444304-568-2331 06 09
High AchievementReading: 59 (61) Math: 68 (70)
Enrollment:: 280LEP: 0 to 10%75-100% PovertyWhites: 99Asians: 1
WASHINGTON LANDS ELEMENTARYRD 4 BOX 255, MOUNDSVILLE, WV 26041304-843-4420 KG 06
High AchievementMath: 82 (70)
Enrollment: 354LEP: 0 to 10% Title I50-74% PovertyWhites: 98African Americans: 1Asians: 1
SAND FORK ELEMENTARYSAND FORK, WV 26430304-462-7605 PK - 06
High AchievementMath: 79 (64)
Enrollment: 173LEP: 0 to 10% Title I75-100% PovertyWhites: 99
411t(TROY ELEMENTARYTROY, WV 26443304-462-8655 PK 06
High AchievementMath: 74 (66)
Enrollment: 176LEP: 0 to 10% Title I50-74% PovertyWhites: 100
TheEducationTrust
WASHINGTON LANDS ELEMENTARYRD 4 BOX 255, MOUNDSVILLE, WV 26041304-843-4420 KG - 06
High AchievementReading: 66 (61)
Enrollment: 354LEP: 0 to 10% Title I50-74% PovertyWhites: 98African Americans: 1Asians: 1
Legend: The Education Trust Logo denotes schools that have exceeded their state's average score in reading and/or math.( ) The number in parentheses is the state average score.
8 7 BEST COPY AVAILABLE
85

Top Performing Schools Directory
West Virginia
ZELA ELEMENTARYCOUNTY ROAD, BOX 1073, SUMMERSVILLE, WV 26651304-872-1481 KG 06
High AchievementReading: 61 (57)
Enrollment: 145LEP: 0 to 10% Title I75-100% PovertyWhites: 98Native Americans: 2
CHERRY RIVER ELEMENTARYRT 9 BOX 142, RICHWOOD, WV 26261304-846-6646 KG 06
Most Improved
Reading Year 1: 46
Enrollment: 402LEP: 0 to 10% Title I75-100% PovertyWhites: 98African Americans: 1Native Americans: 1
Reading Year 2: 56
CHERRY RIVER ELEMENTARYRT 9 BOX 142, RICHWOOD, WV 26261304-846-6646 KG 06
Most ImprovedGrade: 46Math Year 1: 49 Math Year 2: 62
Enrollment: 402LEP: 0 to 10% Title I75-100% PovertyWhites: 98African Americans: 1Latinos:Native Americans: 1
BERLIN MCKINNEY ELEMENTARYBOX 628, OCEANA, WV 24870304-682-6481 PK - 04
Most ImprovedReading Year 1: 50 Reading Year 2: 59
Enrollment: 428LEP: 0 to 10% Title I50-74% PovertyWhites: 99African Americans: 1
CHERRY RIVER ELEMENTARYRT 9 BOX 142, RICHWOOD, WV 26261304-846-6646 KG - 06
Most ImprovedGrade: 6Math Year 1: 51 Math Year 2: 67
Enrollment: 402LEP: 0 to 10% Title I75-100% PovertyWhites: 98African Americans: 1Native Americans: 1
TheEducationTrust
ENSLOW MIDDT .F.
26TH STREET AND COLLIS, HUNTINGTON, WV 25702304-528-5121 06 - 08
Most ImprovedGrade: 6Math Year 1: 55
Enrollment: 374LEP: 0 to 10% Title I75-100% PovertyWhites: 94African Americans: 5Latinos: 1
Math Year 2: 64
86 Legend: 'The Education Trust Logo denotes schools that have exceeded their state's average score in reading and/or math.( ) The number in parentheses is the state average score.
88

Top Performing Schools Directory
West Virginia
FAIRVIEW ELEMENTARY101 HIGH STREET, SAINT ALBANS, WV 25177304-722-0224 PK 06
Most ImprovedReading Year 1: 47 Reading Year 2: 57
Enrollment: 295LEP: 0 to 10% Title I50-74% PovertyWhites: 98African Americans: 2
MONTCALM ELEMENTARYROUTE 2 BOX 35, ROCK, WV 24747304-589-7095 PK - 06
Most ImprovedGrade: 6Math Year 1: 80Reading Year 1: 52
Enrollment: 282LEP: 0 to 10% Title I75-100% PovertyWhites: 99African Americans: 1
Math Year 2: 91Reading Year 2: 79
PHILIPP MIDDLEROUTE 3, BOX 40, PHILIPPI, WV 26416304-457-2999 PK - 08
Most Improved
Math Year 1: 54 Math Year 2: 66
Enrollment: 367LEP: 0 to 10% Title I50-74% PovertyWhites: 80African Americans: 15Latinos: 1
Native Americans: 4
Legend:
TheEducation.Trust
MIDLAND TRAIL ELEMENTARY200 FERRY STREET, DIAMOND, WV 25015304-949-1823 KG 06
Most ImprovedReading Year 1: 47Math Year 1: 63
Enrollment: 161LEP: 0 to 10% Title I50-74% PovertyWhites: 99African Americans: 1
Reading Year 2: 65Math Year 2: 78
OAK HILL ELEMENTARY140 SCHOOL STREET, OAK HILL, WV 25901304-469-4541 PK 04
Most ImprovedGrade: 4Math Year 1: 63
Enrollment: 434LEP: 0 to 10% Title I50-74% PovertyWhites: 97African Americans: 3
Math Year 2: 79
PRICHARD ELEMENTARYRT 1 BOX 89, PRICHARD, WV 25555304-486-5096 KG 05
Most ImprovedGrade: 4Math Year 1: 48
Enrollment: 166LEP: 0 to 10% Title I50-74% PovertyWhites: 99African Americans: 1
Math Year 2: 56
The Education Trust Logo denotes schools that have exceeded their state's average score in reading and/or math.( ) The number in parentheses is the state average score.
89BEST COPY AVAILABLE
87

Top Performing Schools Directory
West Virginia
RUFFNER ELEMENTARY808 LITZ DRIVE, CHARLESTON, WV 25311304-348-1130 KG - 06
Most ImprovedMath Year 1: 47 Math Year 2: 55
Enrollment: 258LEP: 0 to 10% Title I50-74% PovertyWhites: 65African Americans: 30Asians: 5
SAND FORK ET .F MENTARYSAND FORK, WV 26430304-462-7605 PK - 06
Most ImprovedMath Year 1: 65 Math Year 2: 79
Enrollment: 173LEP: 0 to 10% Title I75-100% PovertyWhites: 99
TheEducaticaiTrust
88 Legend: ,The Education Trust Logo denotes schools that have exceeded their state's average score in reading and/or math.( ) The number in parentheses is the state average score.
90

Top Performing Schools Directory
Wisconsin!Assessment: Knowledge and Concepts Examinations.!Proficient: National percentile; no levels. Levels introduced in 1997-98.
COLUMBUS ELEMENTARY6410 25TH AVE, KENOSHA, WI 53140414-653-6242 KG - 06
High Achievement
Math: 68 (52)
Enrollment: 332LEP: 0 to 10% Title I50-74% PovertyWhites: 65African Americans: 18Latinos: 16Asians: 1
FERNWOOD ELEMENTARY3239 S PENNSYLVANIA AV, MILWAUKEE, WI 53207414-482-0123 PK 08
High AchievementGrade: 4Reading: 62 (69) Math: 39 (52)
Enrollment: 426LEP: 0 to 10% Title I75-100% PovertyWhites: 43African Americans: 36Latinos: 12Asians: 3Native Americans: 4
FRANKLIN ELEMENTARY1011 S MAIN ST, RICE LAKE, WI 54868715-234-4591 KG - 05
High AchievementReading: 82 (69) Math: 65 (52)
Enrollment: 256LEP: 0 to 10% Title I50-74% PovertyWhites: 99African Americans: 1
Legend:
TheEducationTrust
FERNWOOD ELEMENTARY3239 S PENNSYLVANIA AV, MILWAUKEE, WI 53207414-482-0123 PK - 08
High AchievementGrade: 8Reading: 62 (64)
Enrollment: 426LEP: 0 to 10% Title I50-74% PovertyWhites: 43African Americans: 36Latinos: 12Asians: 3Native Americans: 4
FLAMBEAU JUNIOR HIGHPO BOX 86, TONY, WI 54563715-532-5559 07 08
High Achievement
Math: 22 (30)
Enrollment: 81LEP: 0 to 10°A3 Title I50-74% PovertyWhites: 98African Americans: 1Native Americans: 1
GILMAN ELEMENTARYFIFTH AVE, GILMAN, WI 54433715-447-8776 PK - 05
High AchievementReading: 87 (69) Math: 57 (52)
Enrollment: 363LEP: 0 to 10% Title I50-74% PovertyWhites: 96African Americans: 2Latinos: 2
The Education Trust Logo denotes schools that have exceeded their state's average score in reading and/or math.( ) The number in parentheses is the state average score.
9 b BEST COPY AVAILABLE
89

Top Performing Schools Directory
Wisconsin
GILMAN HIGHFIFTH AVE, GILMAN, WI 54433715-447-8211 06 -12
High AchievementReading: 68 (63) Math: 37 (35)
Enrollment: 328LEP: 0 to 10% Title I50-74% PovertyWhites: 94African Americans: 2Latinos: 3Asians: 1
0.;HAWLEY ROAD ELEMENTARY5610 W WISCONSIN AVE, MILWAUKEE, WI 53213414-475-7096 PK - 05
High Achievement
Reading: 83 (69)
Enrollment: 335LEP: 0 to 10% Title I75-100% PovertyWhites: 25African Americans: 61Latinos: 10Asians: 3
JUNEAU HIGH6415 W MT VERNON AVE, MILWAUKEE, WI 53213414-476-5480 09 - 12
High Achievement
Math: 11 (35)
Enrollment: 867LEP: 0 to 10% Title I50-74% PovertyWhites: 26African Americans: 61Latinos: 5Asians: 6Native Americans: 1
90 Legend:
TheEducationTrust
GRAND AVE MIDDLE2430 W WISCONSIN AVE, MILWAUKEE, WI 53233414-933-9900 06 08
High AchievementMath: 5 (30)
Enrollment: 652LEP: 1 1to 20% Title I75-100% PovertyWhites: 15African Americans: 56Latinos: 22Asians: 6Native Americans: 1
HURLEY K-121S517 RANGE VIEW DR, HURLEY, WI 54534715-561-3340 PK - 06
High AchievementGrade: 4Reading: 89 (69)
Enrollment: 445LEP: 0 to 10% Title I50-74% PovertyWhites: 99
LAC DU FLAMBEAU ELEMENTARY2899 HWY 47, LAC DU FLAMBEAU, WI 54538715-588-3838 PK - 08
High AchievementGrade: 8Reading: 44 (64) Math: 48 (30)
Enrollment: 444LEP: 0 to 10% Title I75-100% PovertyWhites: 4Native Americans: 96
The Education Trust Logo denotes schools that have exceeded their state's average score in reading and/or math.( ) The number in parentheses is the state average score.
92 BEST COPY AVAILABLE

Top Performing Schools Directory
Wisconsin
LAC DU FLAMBEAU ELEMENTARY2899 HWY 47, LAC DU FLAMBEAU, WI 54538715-588-3838 PK 08
High AchievementGrade: 4Math: 40 (52)
Enrollment: 444LEP: 0 to 10% Title I75-100% PovertyWhites: 4Native Americans: 96
MARENGO VALLEY ELEMENTARYPO BOX 209, ASHLAND, WI 54806715-278-3286 KG 06
High AchievementReading: 92 (69) Math: 71 (52)
Enrollment: 163LEP: 0 to 10% Title I50-74% PovertyWhites: 100
MERCER ELEMENTARYPO BOX 567, MERCER, WI 54547715-476-2154 KG - 08
High AchievementReading: 72 (64)
Enrollment: 164LEP: 0 to 10% Title I50-74% PovertyWhites: 98Asians: 1
Native Americans: 1
Legend:
Math: 67 (30)
LAONA HIGHPO BOX 57, LAONA, WI 54541715-674-2143 07 -12
High AchievementGrade: 8Reading: 73 (64) Math: 37 (30)
Enrollment: 155LEP: 0 to 10% Title I50-74% PovertyWhites: 90African Americans: 5Native Americans: 5
MATTOON ELEMENTARYPO BOX 80, MATTOON, WI 54450715-489-3631 KG - 06
High AchievementReading: 92 (69)
Enrollment: 120LEP: 0 to 10% Title I50-74% PovertyWhites: 94Asians: 1
Native Americans: 5
Math: 77 (52)
TheEducationTrust
PARKVIEW ELEMENTARY10825 W VILLARD AVE, MILWAUKEE, WI 53225414-466-5500 PK - 05
High AchievementMath: 45 (52) Reading: 71 (69)
Enrollment: 413LEP: 0 to 10% Title I75-100% PovertyWhites: 25African Americans: 59Latinos: 6Asians: 7Native Americans: 1
The Education Trust Logo denotes schools that have exceeded their state's average score in reading and/or math.( ) The number in parentheses is the state average score.
93 BEST COPY AVAILABLE
91
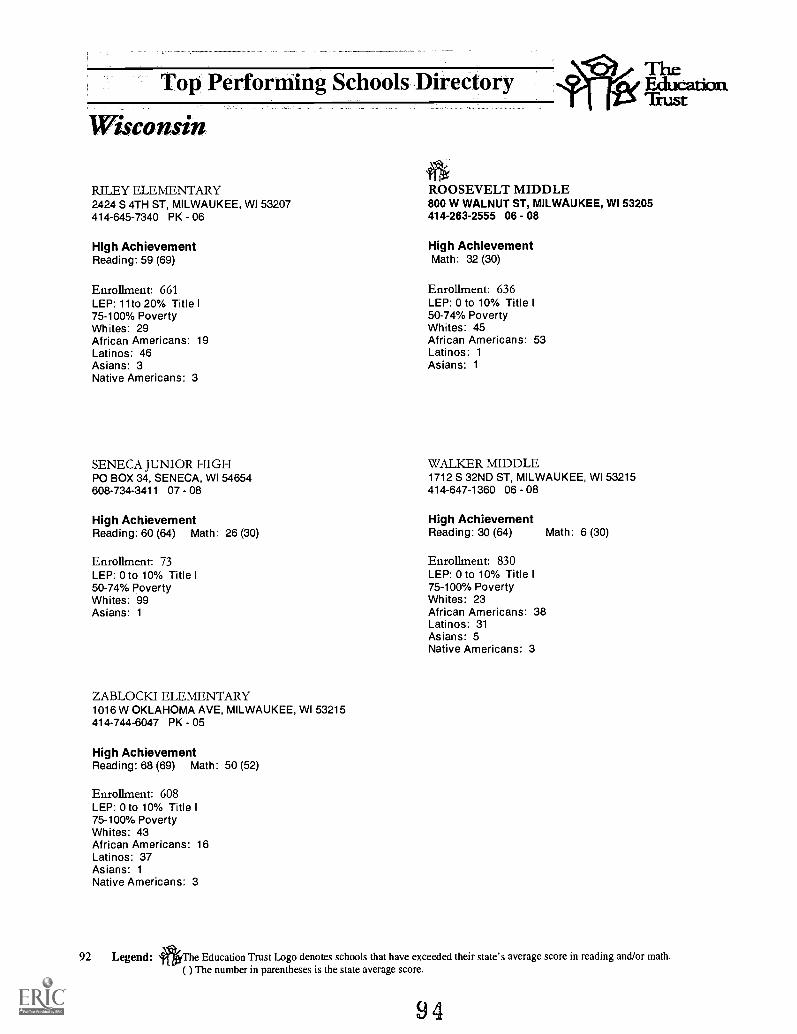
Top Performing Schools Directory
Wisconsin
RILEY ELEMENTARY2424 S 4TH ST, MILWAUKEE, WI 53207414-645-7340 PK - 06
High AchievementReading: 59 (69)
Enrollment: 661LEP: 1 1to 20% Title I75-100% PovertyWhites: 29African Americans: 19Latinos: 46Asians: 3Native Americans: 3
SENECA JUNIOR HIGHPO BOX 34, SENECA, WI 54654608-734-3411 07 - 08
High AchievementReading: 60 (64) Math: 26 (30)
Enrollment: 73LEP: 0 to 10% Title I50-74% PovertyWhites: 99Asians: 1
ZABLOCKI ELEMENTARY1016 W OKLAHOMA AVE, MILWAUKEE, WI 53215414-744-6047 PK - 05
High AchievementReading: 68 (69) Math: 50 (52)
Enrollment: 608LEP: 0 to 10% Title I75-100% PovertyWhites: 43African Americans: 16Latinos: 37Asians: 1
Native Americans: 3
92 Legend:
TheEducationTrust
ROOSEVELT MIDDLE800 W WALNUT ST, MILWAUKEE, WI 53205414-263-2555 06 - 08
High AchievementMath: 32 (30)
Enrollment: 636LEP: 0 to 10% Title I50-74% PovertyWhites: 45African Americans: 53Latinos: 1
Asians: 1
WALKER MIDDLE1712 S 32ND ST, MILWAUKEE, WI 53215414-647-1360 06 08
High AchievementReading: 30 (64) Math: 6 (30)
Enrollment: 830LEP: 0 to 10% Title I75-100% PovertyWhites: 23African Americans: 38Latinos: 31Asians: 5Native Americans: 3
The Education Trust Logo denotes schools that have exceeded their state's average score in reading and/or math.( ) The number in parentheses is the state average score.
94

Top Performing Schools Directory
W:yommg
TheEducatianTrust
Assessment: Multiple Assessment Tools. Scores available only at elementary and middle school levels,not by grade.
Proficient: Level 3: 46% and above.
WYOMING INDIAN HIGHPO BOX 340, ETHETE, WY 82520307-332-9765 09 - 12
High AchievementReading: 5.7 (36.49) Math: 6.8 (41.51)
Most ImprovedReading/Math Year 1: 0 Reading/Math Year 2: 6.25
Enrollment: 158LEP: 50% or more Title I75-100% PovertyNative Americans: 100
GOINS ELEMENTARY201 SOUTH CRIBBON AVEN, CHEYENNE, WY 82007307-771-2620 KG 06
High AchievementMath: 57.4 (49.15)
Enrollment: 322LEP: 11to 20% Title I50-74% PovertyWhites: 55African Americans: 6Latinos: 35Asians: 2Native Americans: 2
THAYER ELEMENTARY801 SOUTH 24TH STREET, LARAMIE, WY 82070307-721-4450 KG 06
High AchievementReading: 60.8 (44.1)
Enrollment: 268LEP: 0 to 10% Title I50-74% PovertyWhites: 96African Americans: 1Latinos: 1
Asians: 1Native Americans: 1
Legend:
Math: 70.3 (49.15)
AFFLERBACH ELEMENTARY400 WEST WALLICK ROAD, CHEYENNE, WY 82007307-771-2300 KG - 06
High AchievementMath: 45.7 (49.15)
Enrollment: 433LEP: 0 to 10% Title I50-74% PovertyWhites: 73African Americans: 1Latinos: 18Asians: 1Native Americans: 1
ROSSMAN ELEMENTARY916 WEST COLLEGE DRIVE, CHEYENNE, WY 82007307-771-2544 KG - 06
High AchievementReading: 54.1 (44.1)
Enrollment: 188LEP: 0 to 10% Title I50-74% PovertyWhites: 78African Americans: 4Latinos: 14Native Americans: 4
BYRON ELEMENTARYPO BOX 176, BYRON, WY 82412307-548-2723 KG 05
Most ImprovedReading/Math Year 1: 39.71 Reading/Math Year 2: 50
Enrollment: 85LEP: 0 to 10°/0 Title I50-74% PovertyWhites: 73Latinos: 27
The Education Trust Logo denotes schools that have exceeded their state's average score in reading and/or math.( ) The number in parentheses is the state average score.
95BEST COPY AVAILABLE
93

Top Performing Schools Directory
Wyoming
COFFEEN ELEMENTARY1053 SOUTH SHERIDAN, SHERIDAN, WY 82801307-674-9333 KG 05
Most ImprovedReading/Math Year 1: 20.29
Enrollment: 276LEP: 0 to 10% Title I50-74% PovertyWhites: 84African Americans: 2Latinos: 9Asians: 3Native Americans: 4
Reading Year 2: 41.57
GRANT ELEMENTARY1536 OAKCREST AVENUE, CASPER, WY 82601307-577-4538 KG - 06
Most ImprovedReading/Math Year 1: 38.96
45.72
Enrollment: 248LEP: 0 to 10% Title I50-74% PovertyWhites: 90African Americans: 3Latinos: 6Native Americans: 2
Reading Year 2: 59.28
HUDSON ELEMENTARY273 SOUTH OHIO, HUDSON, WY 82515307-332-2838 KG - 06
Most ImprovedReading/Math Year 1: 31.25
52.18
Enrollment: 64LEP: 0 to 10% Title I50-74% PovertyWhites: 95Native Americans: 5
94 Legend:
Reading Year 2: 43.33
TheEducationTrust
COLE ELEMENTARY615 WEST 9TH STREET, CHEYENNE, WY 82007307-771-2480 KG 06
Most ImprovedReading/Math Year 1: 36.30 Reading/Math Year 2: 48.57
Enrollment: 234LEP: 0 to 10% Title I75-100% PovertyWhites: 40African Americans: 14Latinos: 43Asians: 2Native Americans: 1
HEBARD ELEMENTARY413 SEYMOUR AVENUE, CHEYENNE, WY 82007307-771-2450 KG - 06
Most ImprovedReading/Math Year 1: 36.61 Reading/Math Year 2:
Enrollment: 289LEP: 11to 20% Title I75-100% PovertyWhites: 49African Americans: 2Latinos: 47Asians: 1
Native Americans: 2
MILLS ELEMENTARYPO BOX 268, MILLS, WY 82644307-577-4558 KG 06
Most ImprovedReading/Math Year 1: 35.06 Reading/Math Year 2:
Enrollment: 228LEP: 0 to 10% Title I50-74% PovertyWhites: 94African Americans: 2Asians: 1Native Americans: 2
The Education Trust Logo denotes schools that have exceeded their state's average score in reading and/or math.( ) The number in parentheses is the state average score.
9 6 BEST COPY AVAILABLE

Technical Notes onState Proficiency Definitions
Kentucky
Schools in this list were selected based on their accountability indices. Further, only those Title Ischools showing progress over the three-year period of 1994-95, 1995-96, and 1996-97 wereselected. A school's accountability index is not equivalent to the percent of students scoring at orabove the proficient level of performance; however, it does indicate how well students in a givenschool are performing in terms of the percent of novice, apprentice, proficient and distinguished.
Note that in the 75-100% poverty range at the middle and high school levels and in the 50-74%poverty range at the high school level, no schools were identified as High Achievement. Whilesome Title I schools in these poverty ranges/grade levels could have been considered as highimprovement, they were not listed here because their performance was below the state average.
Mississippi
A database of ITBS/TAP scores was created in which October 1997 and 1996 results wereassigned to the children's school of attendance in the prior year (this meant the grade 4-9 scoreseffectively became evaluations of grades 3-8. This was then merged with the Percent of Freeand Reduced Lunch eligibility data from the Title I 71 project (1996-97 school year) to yieldachievement and percent low income information for 591 schools serving any of grades 3-5 and310 schools serving any of grades 6-8. A weighted average of reading and mathematics data foreach school was computed for grades 3-5 and 6-8 and results were sorted by achievement andpoverty levels. Only one year of data was available for Algebra so improvement scores couldnot be computed. Also there was no data separated grade 8 from grade 9 (or above) scores. Tokeep results at the secondary level only for this tier, schools whose first grade level was less thangrade 9 were eliminated. This left 122 "pure" high schools to comprise the algebra sample(unfortunately no high school reading/language arts data suitable for inclusion was available.
New York
The [New York] data for third and sixth grades are based on the Pupil Evaluation tests in readingand mathematics and do not identify students at the proficient level. The PEP tests weredesigned to identify students in need of remediation. Because the department has recognized theneed to identify students performing at higher levels, we have identified some benchmarks on thePEP tests for this purpose. These levels are useful as an estimate of the percentage of students ina school reaching a given level in a given year. Because the tests were not developed to measureat these higher levels, these percentages are not reliable indicators of year-to-year change.Therefore the reading test data enclosed are based on the percentage of students who scoredabove the State reference point (SRP), the point that identifies students who require remediation.These data provide a reliable indicator of change. The SRP on the mathematics test does notprovide sufficient distinction among schools to identify the highest performing.
93
9 7

Oklahoma
These schools were drawn from a rank order with the following two exceptions: Schools thattested fewer than 10 children were not included. Schools who are on the Oklahoma low-performing, high challenge list -- schools who do not have satisfactory achievement in all corecontent areas were not included.
Virginia
Virginia reported student and school results based on national percentiles. Other modificationsare: Data is reported for grades 3, 5 and 8 in reading/language arts and mathematics due to thefact that Title I schools in Virginia are concentrated at the elementary and middle school levels.Statewide averages for all schools regarding percentile ranks are not available by quartile.Instead, available statewide averages reflect the partial battery score, which is comprised ofreading, mathematics and language at grades 3, 5 and 8. Statewide data was not disaggregatedby school poverty level, therefore no data is available. Based on the performance indicators forVirginia during the 1996-97 school year, "high scoring" is defined as the average percentage ofthe school relative to the students scoring above the 50th percentile on the Stanford 9 inreading/language arts and mathematics.
Wisconsin
Percents are based on all students enrolled in the school for a full academic year whether or notthey took the test. Low-income percentages are based on percent of students enrolled for fullacademic year who meet the low-income requirements for subsidized lunch. Students areassumed to be middle or high income unless they are known to be low income. Data areprobably most accurate at grade 4. All results are based on CTB Terra Nova MultipleAssessments and Wisconsin-set proficiency standards.
Wyoming
In calculating AYP, Wyoming looks at a combination of scores across both content areas. Thebaseline year against which progress is measured consists of a combination of two years 1994-95and 1995-96. The comparison or post data point consists of a combination of two years 1995-96and 1996-97. The transitional assessment that we are using is NRT scores. The information onMost Improved remains combined across Reading and Math content areas because, in one of theyears used in calculating the baseline, were missing approximately 90% of the Math scores.Also, grades are combined across the elementary, middle and high school levels due to the smallnumbers that we have at individual grade levels. In reporting Most Improved data, we can onlyinclude those schools that have complete data across all the years.
94
98

APPENDIX APLEASE RETURN BY:NOVEMBER 13, 1998
The Education Trust High Performing Schools Survey
At the conclusion of this survey, we will be asking you to share with us your thoughts on what factors havecontributed to your school's success in increasing student achievement. First, though, we need your helpwith a very brief questionnaire. Thank you.
PROFILE
1. Is your school a Title 1 school?Yes
No
If yes: TargetedAssistance
2. What is your school's grade configuration?K-67-910-12K-12Other (Specify)
3. What is the size of your student enrollment?Less than 500 1,000-1,499
500-999 1,500 or more
4. Indicate your school's student enrollment by race and ethnicity. (Provide percentages.)WhiteAfrican AmericanLatinoAsianNative American
5. What percentages of your students are Limited English Proficient?0-10%11-20%
21-30%
31-40%41-50%
More than 50%
6. Is your school a(n) ... (choose one)Neighborhood school, accepting all children in the attendance areaMagnet school or school within a school (with admissions criteria)Charter schoolSchool for gifted and talented studentsSchool with a program for gifted and talented students
99
School-wide
BEST COPY AVAILABLE97

Percentage enrolled in gifted and talented program:Open enrollment that accepts children from throughout the districtOther (please describe):
7. Which ONE best describes your school's geographic setting?Inner CityOther UrbanTownSmall town or rural community
8. How many years have you served as principal at this school?Less than 1 year1-3 years4-5 years6 or more years
STANDARDS
9. On a scale of 1 to 5, rate the degree to which standards are utilized in your school to design instruction. (Circle one)
1 2 3 4 5
Standards are usedextensively
Standards used in Standards notcertain being used at all
subjects/grades orby some teachers
10. In what ways are standards used to support your school's efforts to increase student achievement?(Check all that apply)
Design curriculumAssess student progressEvaluate teacher effectivenessImprove information for parents
11. Approximately what percentages of the teachers in your school use the state standards to design their instructional units?0-25%26-50%51-75%76-100%
12. Do teachers have regular mechanisms to collectively analyze student work against state standards?YesNo
13. If so, how often do they meet?WeeklyBi-Monthly (twice a month)Monthly
14. Approximately what percentages of teachers participate?0-25%26-50%51-75%76-100%
15. On a scale of 1 to 5, rate the degree to which your school has implemented procedures to monitor students who are falling behindin their instruction and provide them with extra help. (Circle one)
1 2 3 4 5
Comprehensive system:students monitored
98
Extra help provided Students don't getto students on an as- much extra help
100

APPENDIX Afrequently and helpprovided whenever
needed
CURRICULUM AND INSTRUCTION
Language Arts
needed basis, but no except from theschool-wide system occasional teacher
16. Who developed your school's Reading/Language Arts curriculum?StateDistrictTeachers at our schoolExternal model developer (e.g. Success for All, Core Knowledge)
17. What is the primary Language Arts text used at your school?
Classroom Literature Sets
Textbook: Name of Publisher:
Combination of Literature Set and Textbook: Publisher of Textbook
18. How many books are students in your school required to read each year? (Circle one)
No Policy 1-9 10-19 20-25 More than 25
Mathematics
19. Who developed your school's Mathematics curriculum?StateDistrictTeachers at our schoolExternal model developer (e.g. Success for All, Core Knowledge)
20. What is the primary Mathematics text used at your school?Name of Publisher:
21. In your school, which of the following instructional practices have increased or decreased over the last few years:
Use of ditto sheets Increased Decreased About sameStudents problem solving in groups Increased Decreased About sameStudents discussing work with other students Increased Decreased About sameTime spent on reading Increased Decreased About sameTime spent on math Increased Decreased About sameUse of technology Increased Decreased About same
22. Has your school adopted scheduling changes to provide extended learning time in Reading and Math?
Yes
No
If yes, inwhichsubject(s)?
Reading Math Both
101BEST COPY AVAILABLE

FAMILY INVOLVEMENT
23. What percentages of parents are actively involved in the following aspects of your school?
0-25% 26-50% 50-75% 76-100%
Budgets
Governance
Curriculum
UnderstandingStudent Work
Standards
PTA
Helping in Classroom
24. What percentages of parents are familiar with state standards?0-25%26-50%51-75%76-100%
PERSONNEL/STAFFING
25. Have you reduced class size during the last three years? If yes, how?Yes, school-wide.
Yes, in certain subjects/grade levels.(Specify: Subject(s): Grade(s):
No, not at all.
26. How many of the following INSTRUCTIONAL personnel are on your staff?
Full time Regular Classroom Teachers (non-Special Education)
Full time Resource Teachers (Non-Classroom Math, Reading, Science, ESL)
Instructional Aides, Assistants, Paraprofessionals
27. Roughly, what percentage of first year teachers do you have on your staff this year?0-10%11-20%More than 20%
28. In your district, upon which of the following groups are sanctions levied if student achievement doesn't improve?100

APPENDIX A(Check all that apply)
Principals o SuperintendentsTeacher SchoolStudents No One
29. In your district, which of the following gets rewards of any sort if student achievement improves? (Check all that apply)
PrincipalsTeacherStudents
SuperintendentsSchoolNo One
30. Roughly, what percentage of your Title 1 dollars last school year was spent on the following?
0-10% 11-20%
ProfessionalDevelopment
Class Size Reductions
21-30% More than 30%
Instructional materialsand/or equipment
Instructional Personnel(teachers, aides,paraprofessionals)
School Counselors
Parent Involvement
31. What portion of the Title 1 budget do you control at the school level?All of the Title 1 fundsAll Title 1 funds, excluding personnelNone
32. Please describe the three most important factors that have contributed to your ability to raise student achievement.Attach additional sheet, if necessary.
103
101
BEST COPY AVAILABLE

33. Please describe three barriers you encountered in your efforts to increase student achievement.Attach additional sheet, if necessary.
34. Please share anything else about your experiences that you believe would be helpful to leaders in other high poverty schools.Attach additional sheet, if necessary.
102
104BEST COPY AVAILABLE
(9/92)
U.S. DEPARTMENT OF EDUCATIONOffice of Educational Research and Improvement (OERI)
Educational Resources Information Center (ERIC) ".
NOTICE
REPRODUCTION BASIS
O
ERIC
This document is covered by a signed "Reproduction Release(Blanket)" form (on file within the ERIC system), encompassing allor classes of documents from its source organization and., therefore,does not require a "Specific Document" Release form.
This document is Federally-funded, or carries its own permission toreproduce, or is otherwise in the public domain and, therefore, maybe reproduced by ERIC without a signed Reproduction Releaseform (either "Specific Document" or "Blanket")..