reproductions supplied by edrs are the best that can … · title university of alaska anchorage...
TRANSCRIPT
DOCUMENT RESUME
ED 455 884 JC 010 564
TITLE University of Alaska Anchorage Student Information, Summer2000 Closing.
INSTITUTION Alaska Univ., Anchorage. Office of Institutional Planning,Research, and Assessment.
PUB DATE 2000-00-00NOTE 28p.
PUB TYPE Numerical/Quantitative Data (110) Reports Research(143)
EDRS PRICE MF01/PCO2 Plus Postage.DESCRIPTORS *Attendance; College Students; Community Colleges; *Credit
Courses; *Enrollment; Higher Education; InstitutionalCharacteristics; *Student Characteristics
IDENTIFIERS *University of Alaska Anchorage
ABSTRACTThis statistical document from the University of Alaska
Anchorage provides charts and graphs regarding students and studentactivities at the six-campus institution, including Prince William SoundCommunity College, for summer 2000. Included is information on studentheadcount and student characteristics as well as credit hours at each campus.Overall, the university system enrollment headcount and credit hours weredown from summer 1999 by 9%. Only the Kenai campus recorded an increase instudent enrollment over the previous year. The large majority of credit hourswere in lower division courses, with developmental education recording thesmallest number of credit hours. At the Anchorage campus, the largest numberof developmental courses were offered by the community and technical college,with the college of arts and sciences offering the largest number of bothlower and upper division courses. Of students enrolling in summer courses,95% of them attended part-time and the majority of them were female. Moststudents attempted 3 or less credit hours (65%), with an additional 22.0%attempting 4 to 6 credit hours. In terms of class standing, seniors were themost likely to attend summer school (17%), followed by juniors, sophomores,and freshmen. (LD)
Reproductions supplied by EDRS are the best that can be madefrom the original document.
00oo
LL4,' 3TUDENT INFORMATION
U.S. DEPARTMENT OF EDUCATIONOffice of Educational Research and Improvement
EDUCATIONAL RESOURCES INFORMATION
,cli This documCENTER (ERIC)ent has been reproduced as
received from the person or organizationoriginating it.
0 Minor changes have been made toimprove reproduction quality.
Points of view or opinions stated in thisdocument do not necessarily representofficial OERI position or policy.
PERMISSION TOREPRODUCE AND
DISSEMINATE THISMATERIAL HAS
BEEN GRANTEDBY
_ElevytO_
TO THE EDUCATIONALRESOURCES
INFORMATIONCENTER (ERIC)
UNIVERSITY OF ALASKA ANCHORAGEOFFICE OF INSTITUTIONAL PLANNING, RESEARCH, AND ASSESSMENT
2BEST COPY AVAILABLE
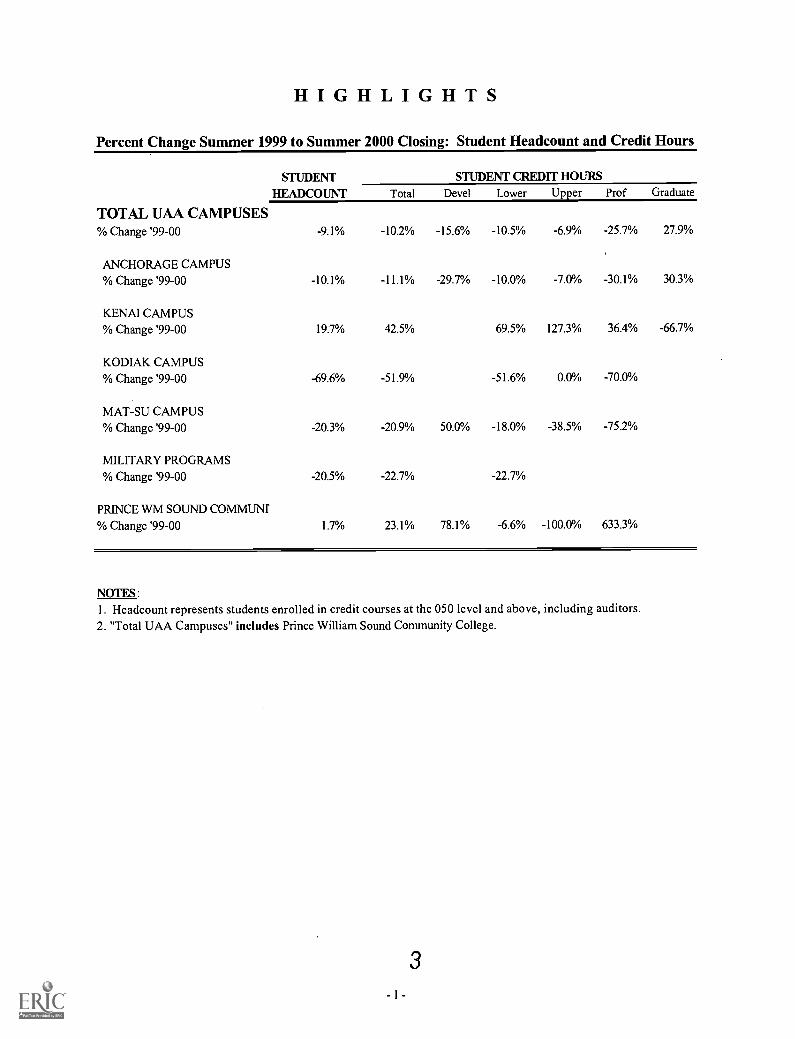
HIGHLIGHTSPercent Change Summer 1999 to Summer 2000 Closing: Student Headcount and Credit Hours
TOTAL UAA CAMPUSES
STUDENTHEADCOUNT
STUDENT CREDIT HOURS
Total Devel Lower Upper Prof Graduate
% Change '99-00 -9.1% -10.2% -15.6% -10.5% -6.9% -25.7% 27.9%
ANCHORAGE CAMPUS% Change '99-00 -10.1% -11.1% -29.7% -10.0% -7.0% -30.1% 30.3%
KENAI CAMPUS% Change '99-00 19.7% 42.5% 69.5% 127.3% 36.4% -66.7%
KODIAK CAMPUS% Change '99-00 -69.6% -51.9% -51.6% 0.0% -70.0%
MAT-SU CAMPUS% Change '99-00 -20.3% -20.9% 50.0% -18.0% -38.5% -75.2%
MILITARY PROGRAMS% Change '99-00 -20.5% -22.7% -22.7%
PRINCE WM SOUND COMMUNT
% Change '99-00 1.7% 23.1% 78.1% -6.6% -100.0% 633.3%
NOTES :
1. Headcount represents students enrolled in credit courses at the 050 level and above, including auditors.2. "Total UAA Campuses" includes Prince William Sound Community College.
3- 1 -
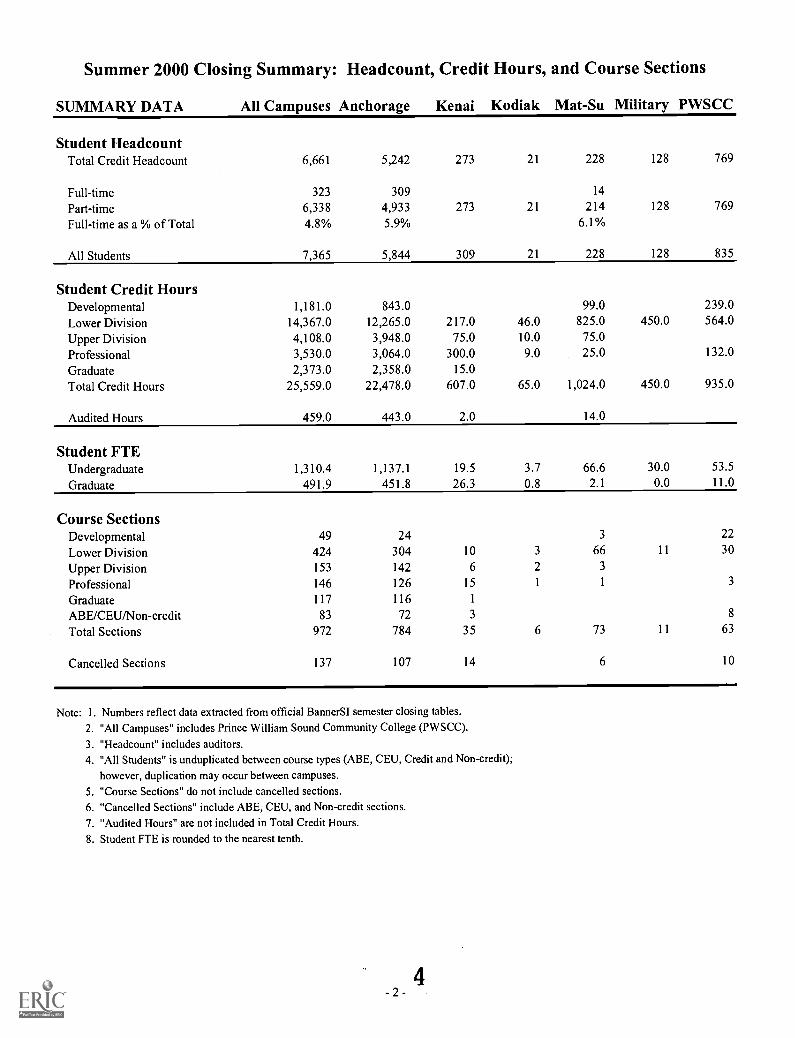
Summer 2000 Closing Summary: Headcount, Credit Hours, and Course Sections
SUMMARY DATA All Campuses Anchorage Kenai Kodiak Mat-Su Military PWSCC
Student HeadcountTotal Credit Headcount 6,661 5,242 273 21 228 128 769
Full-time 323 309 14
Part-time 6,338 4,933 273 21 214 128 769
Full-time as a % of Total 4.8% 5.9% 6.1%
All Students 7,365 5,844 309 21 228 128 835
Student Credit HoursDevelopmental 1,181.0 843.0 99.0 239.0
Lower Division 14,367.0 12,265.0 217.0 46.0 825.0 450.0 564.0
Upper Division 4,108.0 3,948.0 75.0 10.0 75.0
Professional 3,530.0 3,064.0 300.0 9.0 25.0 132.0
Graduate 2,373.0 2,358.0 15.0
Total Credit Hours 25,559.0 22,478.0 607.0 65.0 1,024.0 450.0 935.0
Audited Hours 459.0 443.0 2.0 14.0
Student FTEUndergraduate 1,310.4 1,137.1 19.5 3.7 66.6 30.0 53.5
Graduate 491.9 451.8 26.3 0.8 2.1 0.0 11.0
Course SectionsDevelopmental 49 24 3 22
Lower Division 424 304 10 3 66 11 30
Upper Division 153 142 6 2 3
Professional 146 126 15 1 1 3
Graduate 117 116 1
ABE/CEU/Non-credit 83 72 3 8
Total Sections 972 784 35 6 73 11 63
Cancelled Sections 137 107 14 6 10
Note: 1. Numbers reflect data extracted from official BannerSI semester closing tables.
2. "All Campuses" includes Prince William Sound Community College (PWSCC).3. "Headcount" includes auditors.4. "All Students" is unduplicated between course types (ABE, CEU, Credit and Non-credit);
however, duplication may occur between campuses.5. "Course Sections" do not include cancelled sections.6. "Cancelled Sections" include ABE, CEU, and Non-credit sections.7. "Audited Hours" are not included in Total Credit Hours.8. Student FTE is rounded to the nearest tenth.
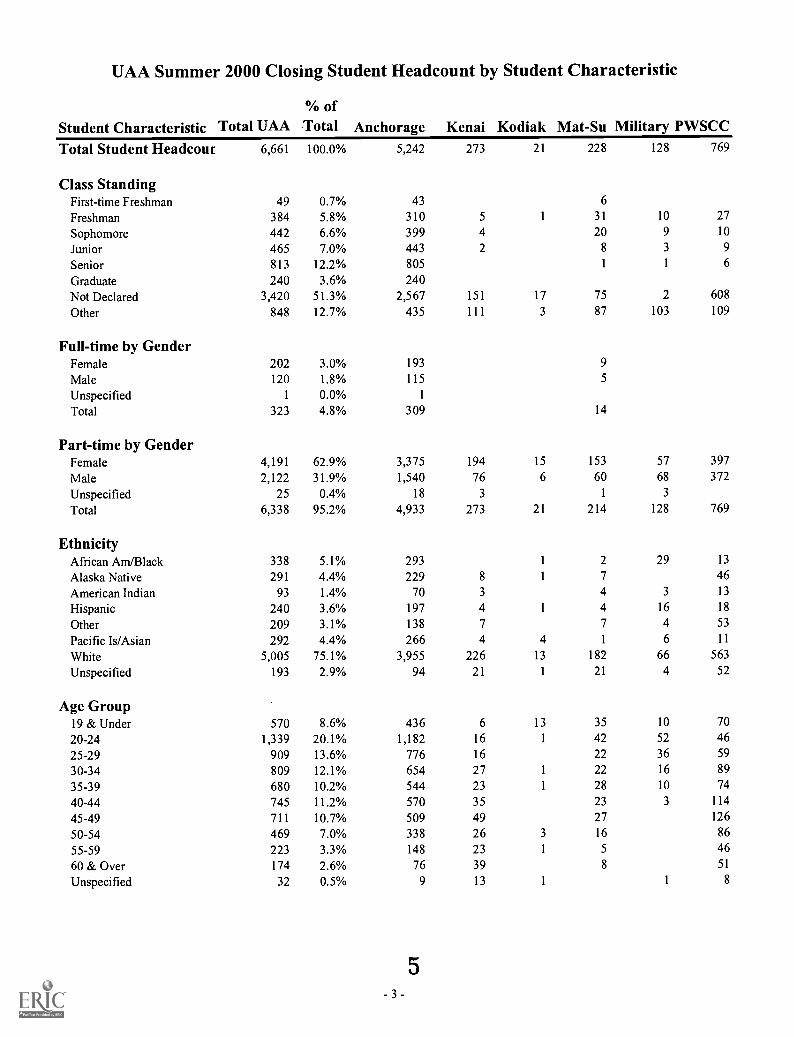
UAA Summer 2000 Closing Student Headcount by Student Characteristic
Student Characteristic Total UAA% ofTotal Anchorage Kenai Kodiak Mat-Su Military PWSCC
Total Student Headcour 6,661 100.0% 5,242 273 21 228 128 769
Class StandingFirst-time Freshman 49 0.7% 43 6
Freshman 384 5.8% 310 5 1 31 10 27
Sophomore 442 6.6% 399 4 20 9 10
Junior 465 7.0% 443 2 8 3 9
Senior 813 12.2% 805 1 1 6
Graduate 240 3.6% 240Not Declared 3,420 51.3% 2,567 151 17 75 2 608
Other 848 12.7% 435 111 3 87 103 109
Full-time by GenderFemale 202 3.0% 193 9
Male 120 1.8% 115 5
Unspecified 1 0.0% 1
Total 323 4.8% 309 14
Part-time by GenderFemale 4,191 62.9% 3,375 194 15 153 57 397
Male 2,122 31.9% 1,540 76 6 60 68 372
Unspecified 25 0.4% 18 3 1 3
Total 6,338 95.2% 4,933 273 21 214 128 769
EthnicityAfrican Am/Black 338 5.1% 293 1 2 29 13
Alaska Native 291 4.4% 229 8 1 7 46
American Indian 93 1.4% 70 3 4 3 13
Hispanic 240 3.6% 197 4 1 4 16 18
Other 209 3.1% 138 7 7 4 53
Pacific Is/Asian 292 4.4% 266 4 4 1 6 11
White 5,005 75.1% 3,955 226 13 182 66 563
Unspecified 193 2.9% 94 21 1 21 4 52
Age Group19 & Under 570 8.6% 436 6 13 35 10 70
20-24 1,339 20.1% 1,182 16 1 42 52 46
25-29 909 13.6% 776 16 22 36 59
30-34 809 12.1% 654 27 1 22 16 89
35-39 680 10.2% 544 23 1 28 10 74
40-44 745 11.2% 570 35 23 3 114
45-49 711 10.7% 509 49 27 126
50-54 469 7.0% 338 26 3 16 86
55-59 223 3.3% 148 23 1 5 46
60 & Over 174 2.6% 76 39 8 51
Unspecified 32 0.5% 9 13 1 1 8
5- 3 -
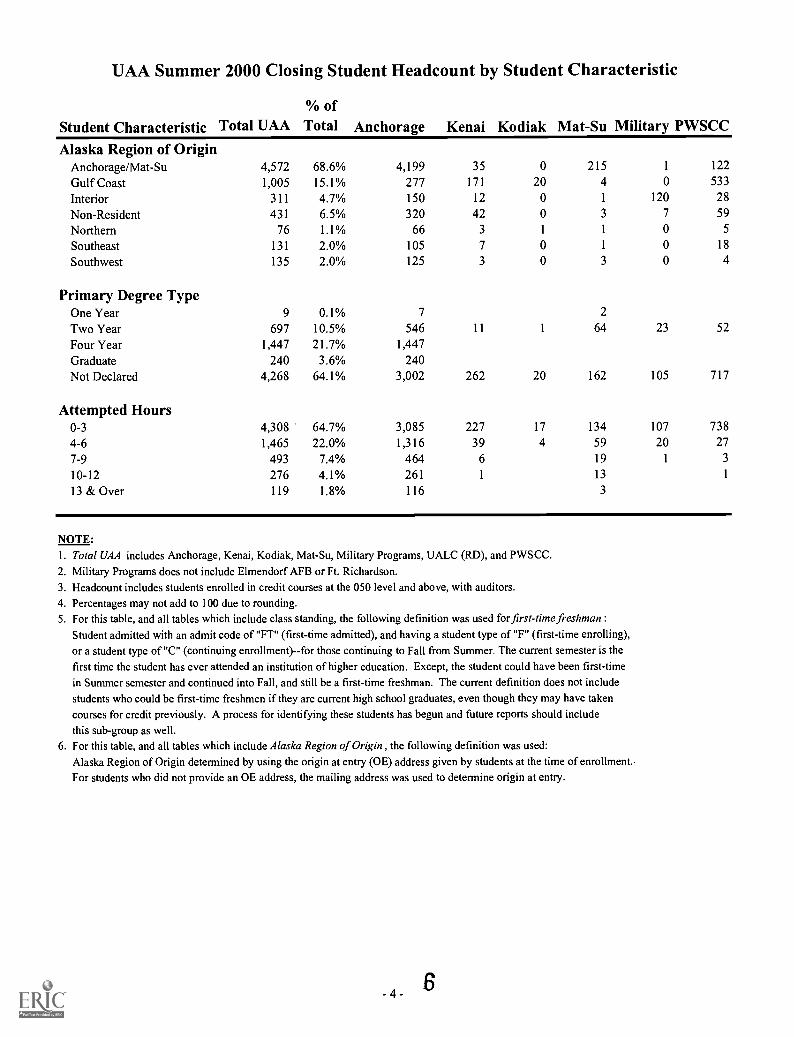
UAA Summer 2000 Closing Student Headcount by Student Characteristic
Student Characteristic Total UAA% ofTotal Anchorage Kenai Kodiak Mat-Su Military PWSCC
Alaska Region of OriginAnchorage/Mat-Su 4,572 68.6% 4,199 35 0 215 1 122
Gulf Coast 1,005 15.1% 277 171 20 4 0 533
Interior 311 4.7% 150 12 0 1 120 28
Non-Resident 431 6.5% 320 42 0 3 7 59
Northern 76 1.1% 66 3 1 1 0 5
Southeast 131 2.0% 105 7 0 1 0 18
Southwest 135 2.0% 125 3 0 3 0 4
Primary Degree TypeOne Year 9 0.1% 7 2
Two Year 697 10.5% 546 11 1 64 23 52
Four Year 1,447 21.7% 1,447Graduate 240 3.6% 240Not Declared 4,268 64.1% 3,002 262 20 162 105 717
Attempted Hours0-3 4,308 64.7% 3,085 227 17 134 107 738
4-6 1,465 22.0% 1,316 39 4 59 20 27
7-9 493 7.4% 464 6 19 1 3
10-12 276 4.1% 261 1 13 1
13 & Over 119 1.8% 116 3
NOTE:1. Total UAA includes Anchorage, Kenai, Kodiak, Mat-Su, Military Programs, UALC (RD), and PWSCC.
2. Military Programs does not include Elmendorf AFB or Ft. Richardson.3. Headcount includes students enrolled in credit courses at the 050 level and above, with auditors.
4. Percentages may not add to 100 due to rounding.5. For this table, and all tables which include class standing, the following definition was used for first-time freshman :
Student admitted with an admit code of "FT" (first-time admitted), and having a student type of "F" (first-time enrolling),
or a student type of "C" (continuing enrollment)--for those continuing to Fall from Summer. The current semester is the
first time the student has ever attended an institution of higher education. Except, the student could have been first-timein Summer semester and continued into Fall, and still be a first-time freshman. The current definition does not includestudents who could be first-time freshmen if they are current high school graduates, even though they may have taken
courses for credit previously. A process for identifying these students has begun and future reports should includethis sub-group as well.
6. For this table, and all tables which include Alaska Region of Origin , the following definition was used:Alaska Region of Origin determined by using the origin at entry (OE) address given by students at the time of enrollment..For students who did not provide an OE address, the mailing address was used to determine origin at entry.
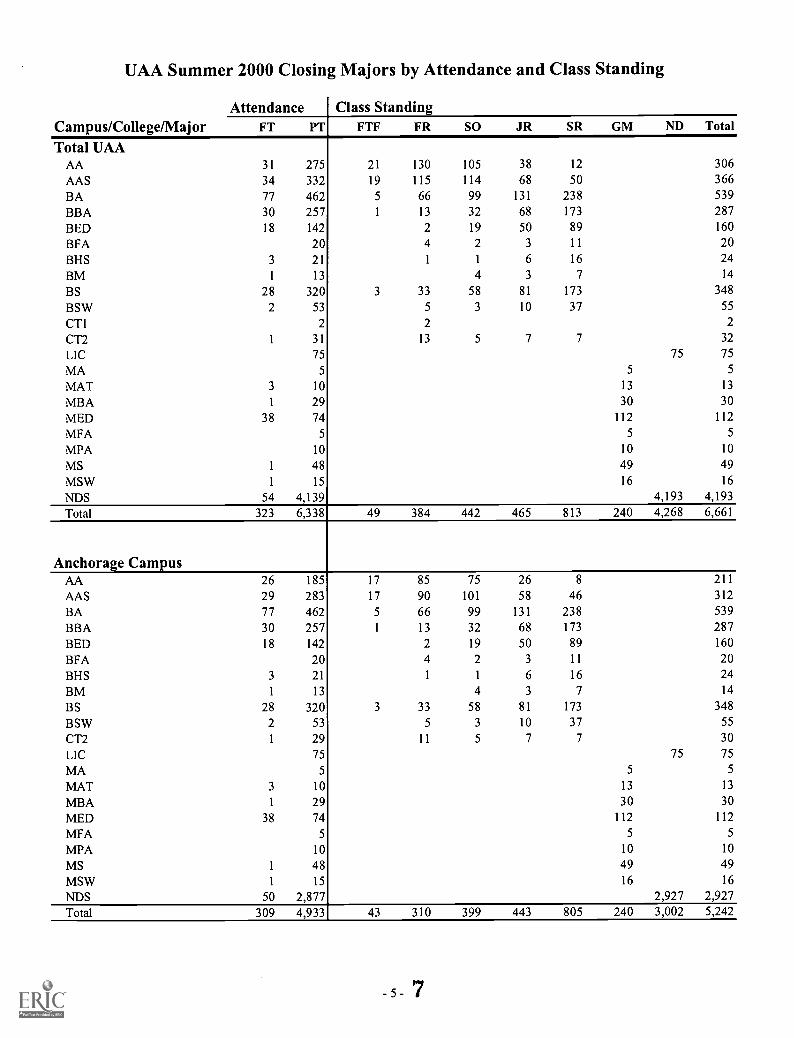
UAA Summer 2000 Closing Majors by Attendance and Class Standing
Campus/College/MajorAttendance Class Standing
FT PT FTF FR SO JR SR GM ND Total
Total UAAAA 31 275 21 130 105 38 12 306
AAS 34 332 19 115 114 68 50 366
BA 77 462 5 66 99 131 238 539
BBA 30 257 1 13 32 68 173 287
BED 18 142 2 19 50 89 160
BFA 20 4 2 3 11 20
BHS 3 21 1 1 6 16 24
BM 1 13 4 3 7 14
BS 28 320 3 33 58 81 173 348
BSW 2 53 5 3 10 37 55
CT1 2 2 2
CT2 1 31 13 5 7 7 32
LIC 75 75 75
MA 5 5 5
MAT 3 10 13 13
MBA 1 29 30 30
MED 38 74 112 112
MFA 5 5 5
MPA 10 10 10
MS 1 48 49 49
MSW 1 15 16 16
NDS 54 4,139 4,193 4,193
Total 323 6,338 49 384 442 465 813 240 4,268 6,661
Anchorage CampusAA 26 185 17 85 75 26 8 211
AAS 29 283 17 90 101 58 46 312
BA 77 462 5 66 99 131 238 539
BBA 30 257 1 13 32 68 173 287
BED 18 142 2 19 50 89 160
BFA 20 4 2 3 11 20
BHS 3 21 1 1 6 16 24
BM 1 13 4 3 7 14
BS 28 320 3 33 58 81 173 348
BSW 2 53 5 3 10 37 55
CT2 1 29 11 5 7 7 30
LIC 75 75 75
MA 5 5 5
MAT 3 10 13 13
MBA 1 29 30 30
MED 38 74 112 112
MFA 5 5 5
MPA 10 10 10
MS 1 48 49 49
MSW 1 15 16 16
NDS 50 2,877 2,927 2,927
Total 309 4,933 43 310 399 443 805 240 3,002 5,242
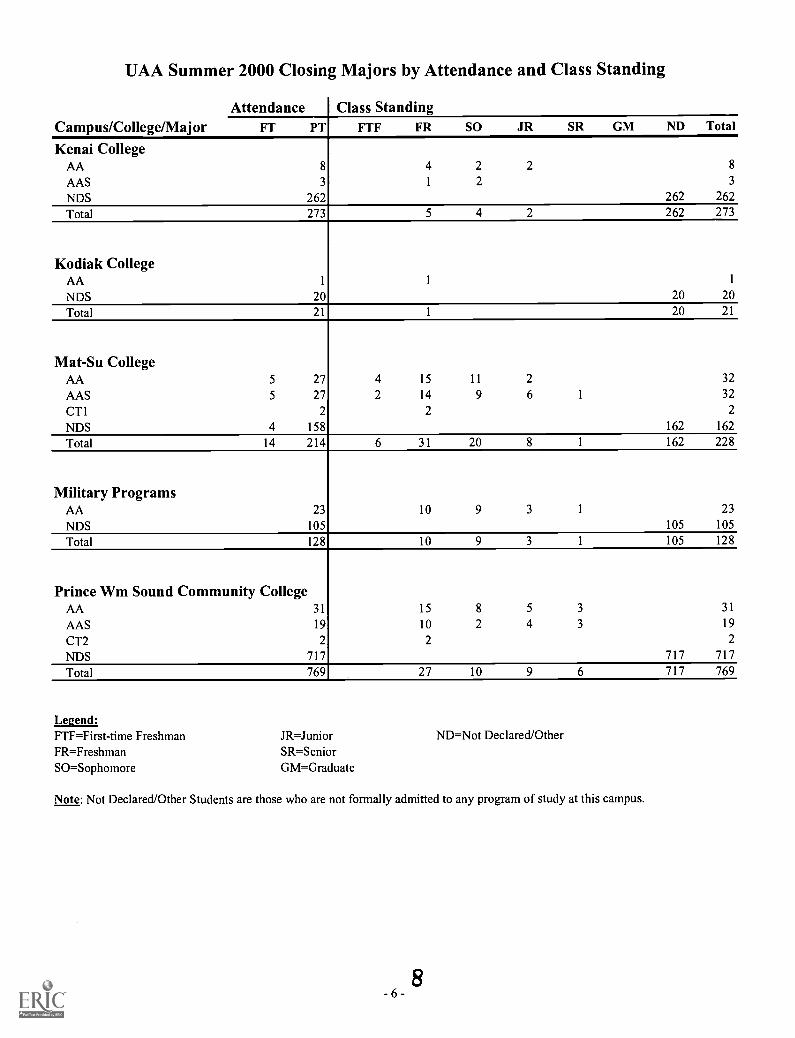
UAA Summer 2000 Closing Majors by Attendance and Class Standing
Campus/College/MajorAttendance Class Standing
FT PT FTF FR SO JR SR GM ND Total
Kenai CollegeAA 8 4 2 2 8
AAS 3 1 2 3
NDS 262 262 262
Total 273 5 4 2 262 273
Kodiak CollegeAA 1 1 1
NDS 20 20 20
Total 21 1 20 21
Mat-Su CollegeAA 5 27 4 15 11 2 32
AAS 5 27 2 14 9 6 1 32
CT1 2 2 2
NDS 4 158 162 162
Total 14 214 6 31 20 8 1 162 228
Military ProgramsAA 23 10 9 3 1 23
NDS 105 105 105
Total 128 10 9 3 1 105 128
Prince Wm Sound Community CollegeAA 31 15 8 5 3 31
AAS 19 10 2 4 3 19
CT2 2 2 2
NDS 717 717 717
Total 769 27 10 9 6 717 769
Legend:FTF=First-time FreshmanFR=FreshmanSO=S ophomore
JR=JuniorSR=SeniorGM=Graduate
ND=Not Declared/Other
Note: Not Declared/Other Students are those who are not formally admitted to any program of study at this campus.
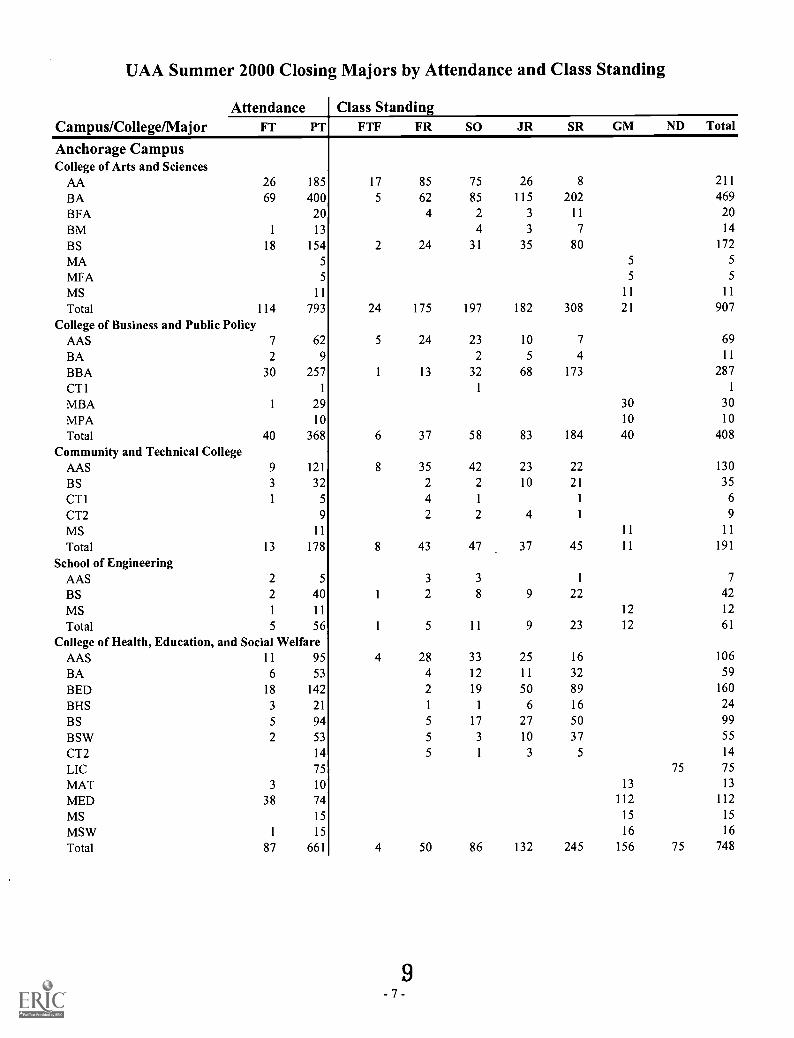
UAA Summer 2000 Closing Majors by Attendance and Class Standing
Attendance Class StandingCampus/College/Major FT PT FTF FR SO JR SR GM ND Total
Anchorage CampusCollege of Arts and SciencesAA 26 185 17 85 75 26 8 211
BA 69 400 5 62 85 115 202 469
BFA 20 4 2 3 11 20
BM 1 13 4 3 7 14
BS 18 154 2 24 31 35 80 172
MA 5 5 5
MFA 5 5 5
MS 11 11 11
Total 114 793 24 175 197 182 308 21 907
College of Business and Public PolicyAAS 7 62 5 24 23 10 7 69
BA 2 9 2 5 4 11
BBA 30 257 1 13 32 68 173 287
CT1 1 1 1
MBA 1 29 30 30
MPA 10 10 10
Total 40 368 6 37 58 83 184 40 408
Community and Technical CollegeAAS 9 121 8 35 42 23 22 130
BS 3 32 2 2 10 21 35
CT1 1 5 4 1 1 6
CT2 9 2 2 4 1 9
MS 11 11 11
Total 13 178 8 43 47 37 45 11 191
School of EngineeringAAS 2 5 3 3 1 7
BS 2 40 1 2 8 9 22 42
MS 1 11 12 12
Total 5 56 1 5 11 9 23 12 61
College of Health, Education, and Social WelfareAAS 11 95 4 28 33 25 16 106
BA 6 53 4 12 11 32 59
BED 18 142 2 19 50 89 160
BHS 3 21 1 1 6 16 24
BS 5 94 5 17 27 50 99
BSW 2 53 5 3 10 37 55
CT2 14 5 1 3 5 14
LIC 75 75 75
MAT 3 10 13 13
MED 38 74 112 112
MS 15 15 15
MSW 1 15 16 16
Total 87 661 4 50 86 132 245 156 75 748
9- 7 -
UAA Summer 2000 Closing Majors by Attendance and Class Standing
Attendance Class StandingCampus/College/Major FT PT FTF FR SO JR SR GM ND Total
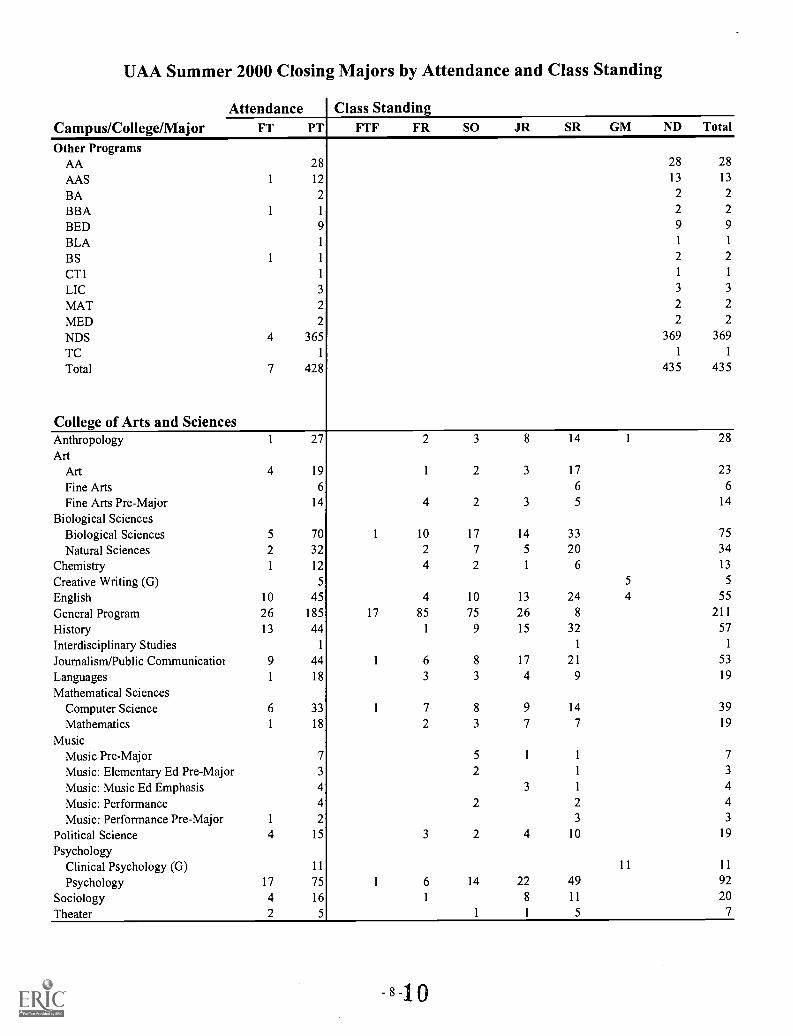
Other ProgramsAA 28 28 28
AAS 1 12 13 13
BA 2 2 2
BBA 1 1 2 2
BED 9 9 9
BLA 1 1 1
BS 1 1 2 2
CT1 1 1 1
LIC 3 3 3
MAT 2 2 2
MED 2 2 2
NDS 4 365 369 369
TC 1 1 1
Total 7 428 435 435
College of Arts and SciencesAnthropology 1 27 2 3 8 14 1 28
ArtArt 4 19 1 2 3 17 23
Fine Arts 6 6 6
Fine Arts Pre-Major 14 4 2 3 5 14
Biological SciencesBiological Sciences 5 70 1 10 17 14 33 75
Natural Sciences 2 32 2 7 5 20 34
Chemistry 1 12 4 2 1 6 13
Creative Writing (G) 5 5 5
English 10 45 4 10 13 24 4 55
General Program 26 185 17 85 75 26 8 211
History 13 44 1 9 15 32 57
Interdisciplinary Studies 1 1 1
Journalism/Public Communicatior 9 44 1 6 8 17 21 53
Languages 1 18 3 3 4 9 19
Mathematical SciencesComputer Science 6 33 1 7 8 9 14 39
Mathematics 1 18 2 3 7 7 19
MusicMusic Pre-Major 7 5 1 1 7
Music: Elementary Ed Pre-Major 3 2 1 3
Music: Music Ed Emphasis 4 3 1 4
Music: Performance 4 2 2 4
Music: Performance Pre-Major 1 2 3 3
Political Science 4 15 3 2 4 10 19
PsychologyClinical Psychology (G) 11 11 11
Psychology 17 75 1 6 14 22 49 92
Sociology 4 16 1 8 11 20
Theater 2 5 1 1 5 7
UAA Summer 2000 Closing Majors by Attendance and Class Standing
Attendance Class StandingCampus/College/Major FT PT FTF FR SO JR SR GM ND Total
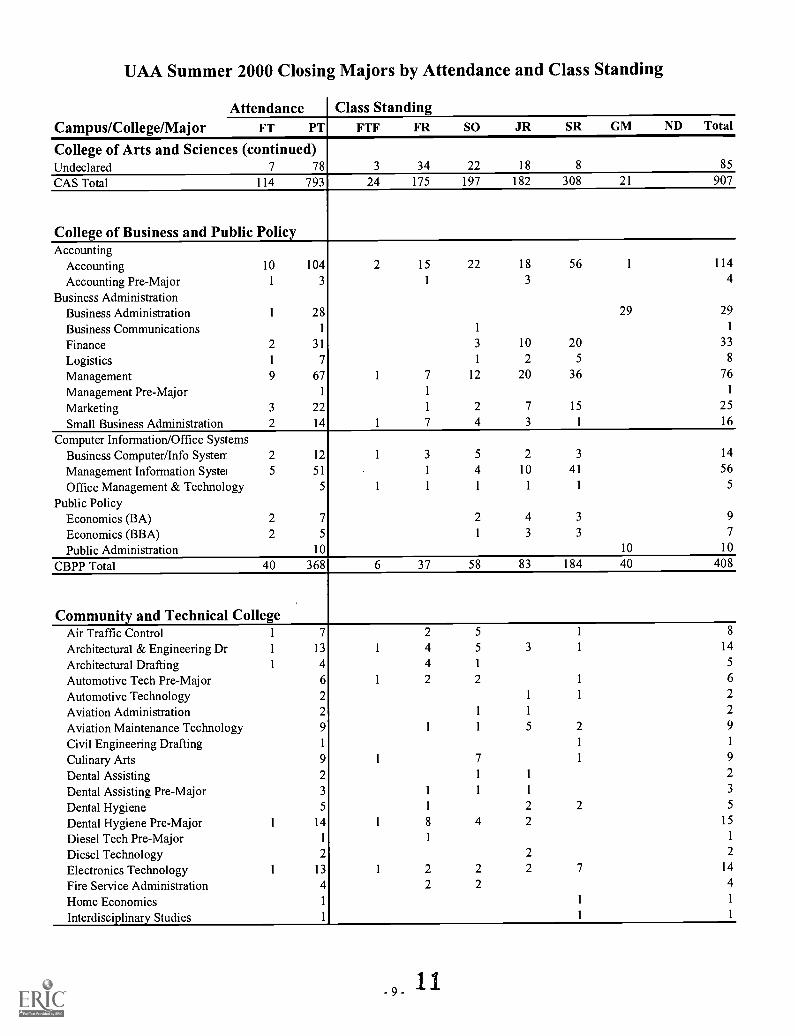
College of Arts and Sciences (continued)Undeclared 7 78 3 34 22 18 8 85
CAS Total 114 793 24 175 197 182 308 21 907
College of Business and Public PolicyAccounting
Accounting 10 104 2 15 22 18 56 1 114
Accounting Pre-Major 1 3 1 3 4
Business AdministrationBusiness Administration 1 28 29 29
Business Communications 1 1 1
Finance 2 31 3 10 20 33
Logistics 1 7 1 2 5 8
Management 9 67 1 7 12 20 36 76
Management Pre-Major 1 1 1
Marketing 3 22 1 2 7 15 25
Small Business Administration 2 14 1 7 4 3 1 16
Computer Information/Office SystemsBusiness Computer/Info System 2 12 1 3 5 2 3 14
Management Information Systei 5 51 1 4 10 41 56
Office Management & Technology 5 1 1 1 1 1 5
Public PolicyEconomics (BA) 2 7 2 4 3 9
Economics (BBA) 2 5 1 3 3 7
Public Administration 10 10 10
CBPP Total 40 368 6 37 58 83 184 40 408
Community and Technical CollegeAir Traffic Control 1 7 2 5 1 8
Architectural & Engineering Dr 1 13 1 4 5 3 1 14
Architectural Drafting 1 4 4 1 5
Automotive Tech Pre-Major 6 1 2 2 1 6
Automotive Technology 2 1 1 2
Aviation Administration 2 1 1 2
Aviation Maintenance Technology 9 1 1 5 2 9
Civil Engineering Drafting 1 1 1
Culinary Arts 9 1 7 1 9
Dental Assisting 2 1 1 2
Dental Assisting Pre-Major 3 1 1 1 3
Dental Hygiene 5 1 2 2 5
Dental Hygiene Pre-Major 1 14 1 8 4 2 15
Diesel Tech Pre-Major 1 1 1
Diesel Technology 2 2 2
Electronics Technology 1 13 1 2 2 2 7 14
Fire Service Administration 4 2 2 4
Home Economics 1 1 1
Interdisciplinary Studies 1 1 1
UAA Summer 2000 Closing Majors by Attendance and Class Standing
Attendance Class StandingCampus/College/Major FT PT FTF FR SO JR SR GM ND Total
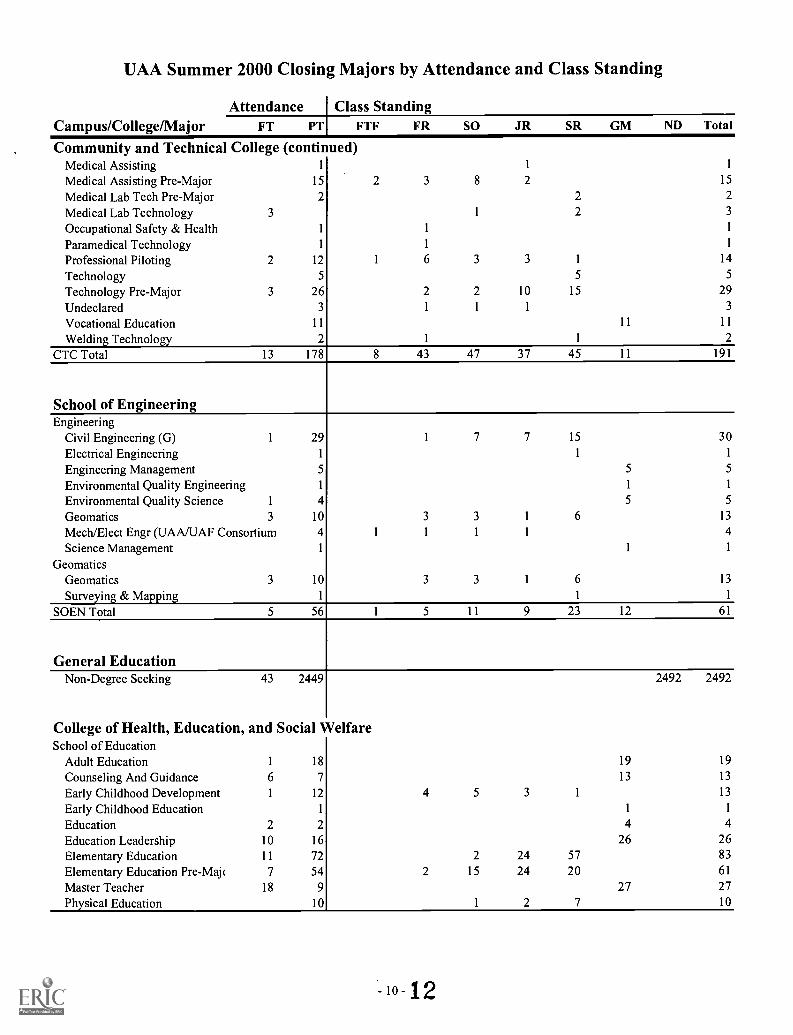
Community and Technical College (continued)Medical Assisting 1 1 1
Medical Assisting Pre-Major 15 2 3 8 2 15
Medical Lab Tech Pre-Major 2 2 2
Medical Lab Technology 3 1 2 3
Occupational Safety & Health 1 1 1
Paramedical Technology 1 1 1
Professional Piloting 2 12 1 6 3 3 1 14
Technology 5 5 5
Technology Pre-Major 3 26 2 2 10 15 29
Undeclared 3 1 1 1 3
Vocational Education 11 11 11
Welding Technology 2 1 1 2
CTC Total 13 178 8 43 47 37 45 11 191
School of EngineeringEngineering
Civil Engineering (G) 1 29 1 7 7 15 30
Electrical Engineering 1 1 1
Engineering Management 5 5 5
Environmental Quality Engineering 1 1 1
Environmental Quality Science 1 4 5 5
Geomatics 3 10 3 3 1 6 13
Mech/Elect Engr (UAA/UAF Consortium 4 1 1 1 1 4
Science Management 1 1 1
GeomaticsGeomatics 3 10 3 3 1 6 13
Surveying & Mapping 1 1 1
SOEN Total 5 56 1 5 11 9 23 12 61
General EducationNon-Degree Seeking 43 2449 2492 2492
College of Health, Education, and Social WelfareSchool of Education
Adult Education 1 18 19 19
Counseling And Guidance 6 7 13 13
Early Childhood Development 1 12 4 5 3 1 13
Early Childhood Education 1 1 1
Education 2 2 4 4
Education Leadership 10 16 26 26
Elementary Education 11 72 2 24 57 83
Elementary Education Pre-Maj( 7 54 2 15 24 20 61
Master Teacher 18 9 27 27
Physical Education 10 1 2 7 10
- - 12
UAA Summer 2000 Closing Majors by Attendance and Class Standing
1
Attendance Class StandingCampus/College/Major FT PT FTF FR SO JR SR GM ND Total
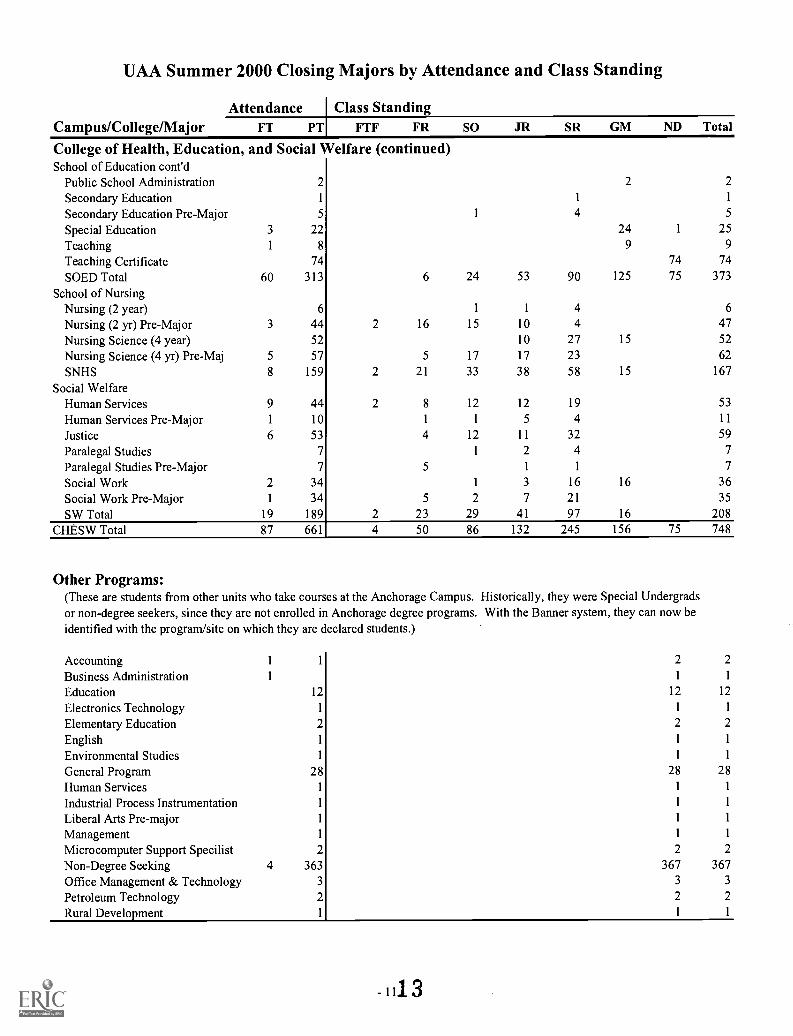
College of Health, Education, and Social Welfare (continued)School of Education cont'd
Public School Administration 2 2 2
Secondary Education 1 1 1
Secondary Education Pre-Major 5 1 4 5
Special Education 3 22 24 1 25
Teaching 1 8 9 9
Teaching Certificate 74 74 74
SOED Total 60 313 6 24 53 90 125 75 373
School of NursingNursing (2 year) 6 1 1 4 6
Nursing (2 yr) Pre-Major 3 44 2 16 15 10 4 47
Nursing Science (4 year) 52 10 27 15 52
Nursing Science (4 yr) Pre-Maj 5 57 5 17 17 23 62
SNHS 8 159 2 21 33 38 58 15 167
Social WelfareHuman Services 9 44 2 8 12 12 19 53
Human Services Pre-Major 1 10 1 1 5 4 11
Justice 6 53 4 12 11 32 59
Paralegal Studies 7 1 2 4 7
Paralegal Studies Pre-Major 7 5 1 1 7
Social Work 2 34 1 3 16 16 36
Social Work Pre-Major 1 34 5 2 7 21 35
SW Total 19 189 2 23 29 41 97 16 208CHESW Total 87 661 4 50 86 132 245 156 75 748
Other Programs:(These are students from other units who take courses at the Anchorage Campus. Historically, they were Special Undergradsor non-degree seekers, since they are not enrolled in Anchorage degree programs. With the Banner system, they can now beidentified with the program/site on which they are declared students.)
Accounting 1 1 2 2
Business Administration 1 1 1
Education 12 12 12
Electronics Technology 1 1 1
Elementary Education 2 2 2
English 1 1 1
Environmental Studies 1 1 1
General Program 28 28 28
Human Services 1 1 1
Industrial Process Instrumentation 1 1 1
Liberal Arts Pre-major 1 1 1
Management 1 1 1
Microcomputer Support Specilist 2 2 2
Non-Degree Seeking 4 363 367 367
Office Management & Technology 3 3 3
Petroleum Technology 2 2 2
Rural Develo i ment
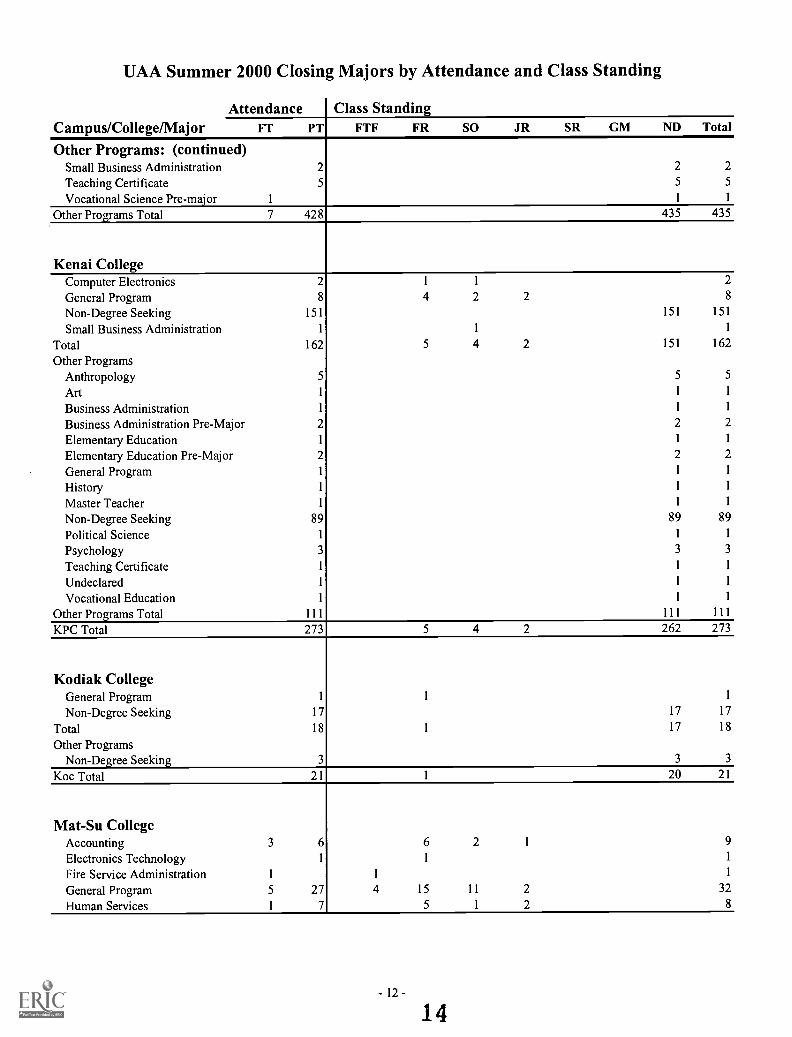
UAA Summer 2000 Closing Majors by Attendance and Class Standing
Attendance Class StandingCampus/College/Major FT PT FTF FR SO JR SR GM ND Total
Other Programs: (continued)Small Business Administration 2 2 2
Teaching Certificate 5 5 5
Vocational Science Pre-major 1 1 1
Other Programs Total 7 428 435 435
Kenai CollegeComputer Electronics 2 1 1 2
General Program 8 4 2 2 8
Non-Degree Seeking 151 151 151
Small Business Administration 1 1 1
Total 162 5 4 2 151 162
Other ProgramsAnthropology 5 5 5
Art 1 1 1
Business Administration 1 1 1
Business Administration Pre-Major 2 2 2
Elementary Education 1 1 1
Elementary Education Pre-Major 2 2 2
General Program 1 1 1
History 1 1 1
Master Teacher 1 1 1
Non-Degree Seeking 89 89 89
Political Science 1 1 1
Psychology 3 3 3
Teaching Certificate 1 1 1
Undeclared 1 1 1
Vocational Education 1 1 1
Other Programs Total 111 111 111
KPC Total 273 5 4 2 262 273
Kodiak CollegeGeneral Program 1 1 1
Non-Degree Seeking 17 17 17
Total 18 1 17 18
Other ProgramsNon-Degree Seeking 3 3 3
Koc Total 21 1 20 21
Mat-Su CollegeAccounting 3 6 6 2 1 9
Electronics Technology 1 1 1
Fire Service Administration 1 1 1
General Program 5 27 4 15 11 2 32
Human Services 1 7 5 1 2 8
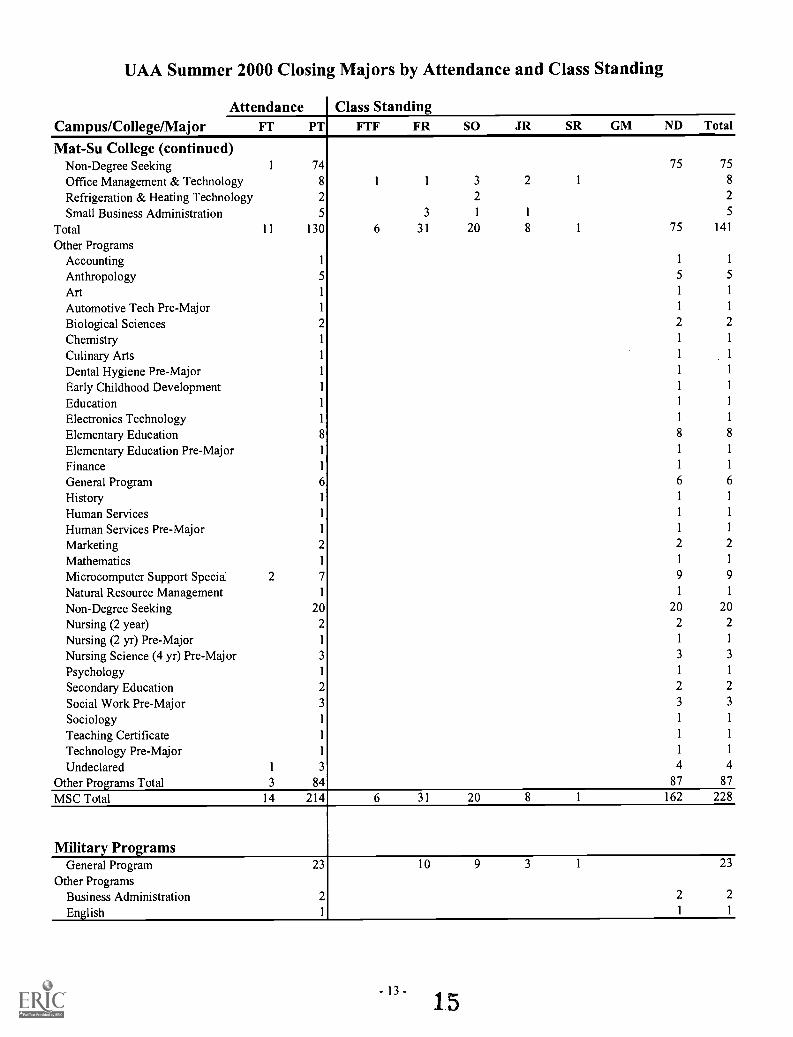
UAA Summer 2000 Closing Majors by Attendance and Class Standing
Attendance Class StandingCampus/College/Major FT PT FTF FR SO JR SR GM ND Total
Mat-Su College (continued)Non-Degree Seeking 1 74 75 75
Office Management & Technology 8 1 1 3 2 1 8
Refrigeration & Heating Technology 2 2 2
Small Business Administration 5 3 1 1 5
Total 11 130 6 31 20 8 1 75 141
Other ProgramsAccounting 1 1
Anthropology 5 5 5
Art 1 1 1
Automotive Tech Pre-Major 1 1 1
Biological Sciences 2 2 2
Chemistry 1 1 1
Culinary Arts 1 1 1
Dental Hygiene Pre-Major 1 1 1
Early Childhood Development 1 1
Education 1 1 1
Electronics Technology 1 1 1
Elementary Education 8 8 8
Elementary Education Pre-Major 1 1 1
Finance 1 1 1
General Program 6 6 6
History 1 1 1
Human Services 1 1 1
Human Services Pre-Major 1 1 1
Marketing 2 2 2
Mathematics 1 1 1
Microcomputer Support Specia. 2 7 9 9
Natural Resource Management 1 1 1
Non-Degree Seeking 20 20 20
Nursing (2 year) 2 2 2
Nursing (2 yr) Pre-Major 1 1
Nursing Science (4 yr) Pre-Major 3 3 3
Psychology 1 1 1
Secondary Education 2 2 2
Social Work Pre-Major 3 3 3
Sociology 1 1 1
Teaching Certificate 1 1 1
Technology Pre-Major 1 1 1
Undeclared 1 3 4 4
Other Programs Total 3 84 87 87
MSC Total 14 214 6 31 20 8 1 162 228
Military ProgramsGeneral Program 23 10 9 3 1 23
Other ProgramsBusiness Administration 2 2 2
English 1
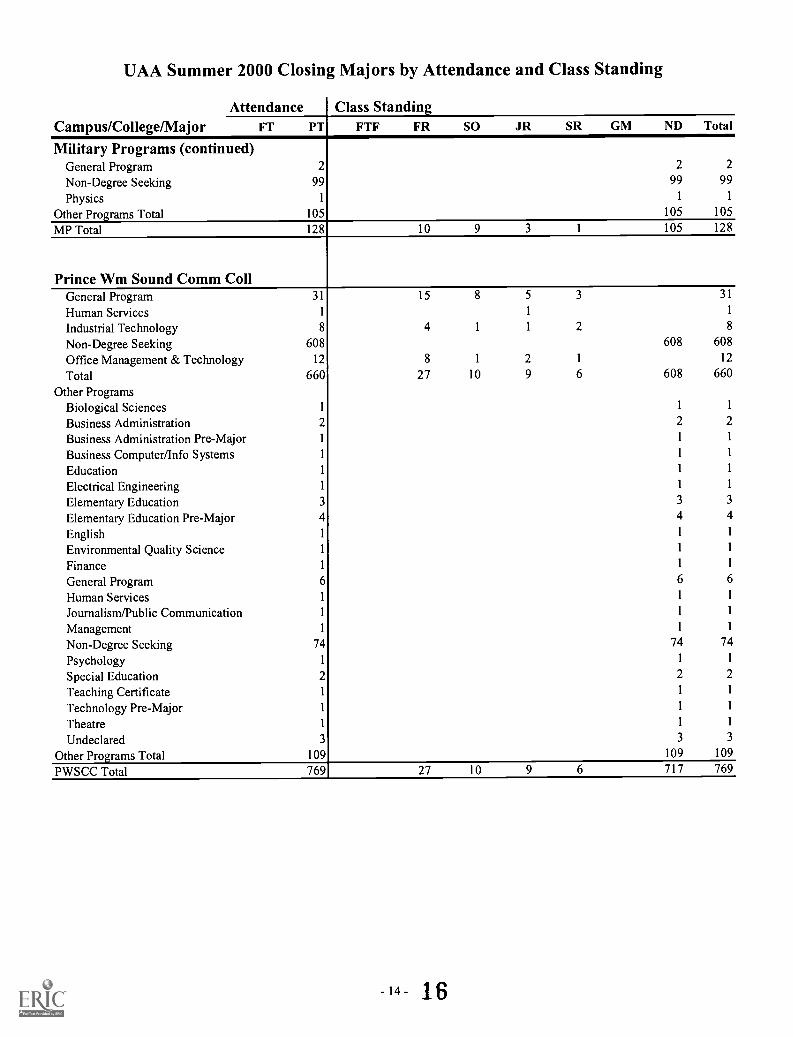
UAA Summer 2000 Closing Majors by Attendance and Class Standing
Attendance Class StandingCampus/College/Major FT PT FTF FR SO JR SR GM ND Total
Military Programs (continued)General Program 2 2 2
Non-Degree Seeking 99 99 99
Physics 1 1 1
Other Programs Total 105 105 105
MP Total 128 10 9 3 1 105 128
Prince Wm Sound Comm CollGeneral Program 31 15 8 5 3 31
Human Services 1 1 1
Industrial Technology 8 4 1 1 2 8
Non-Degree Seeking 608 608 608
Office Management & Technology 12 8 1 2 1 12
Total 660 27 10 9 6 608 660
Other ProgramsBiological Sciences 1 1 1
Business Administration 2 2 2
Business Administration Pre-Major 1 1 1
Business Computer/Info Systems 1 1 1
Education 1 1 1
Electrical Engineering 1 1 1
Elementary Education 3 3 3
Elementary Education Pre-Major 4 4 4
English 1 1 1
Environmental Quality Science 1 1 1
Finance 1 1 1
General Program 6 6 6
Human Services 1 1 1
Journalism/Public Communication 1 1 1
Management 1 1 1
Non-Degree Seeking 74 74 74
Psychology 1 1 1
Special Education 2 2 2
Teaching Certificate 1 1 1
Technology Pre-Major 1 1 1
Theatre 1 1 1
Undeclared 3 3 3
Other Programs Total 109 109 109
PWSCC Total 769 27 10 9 6 717 769
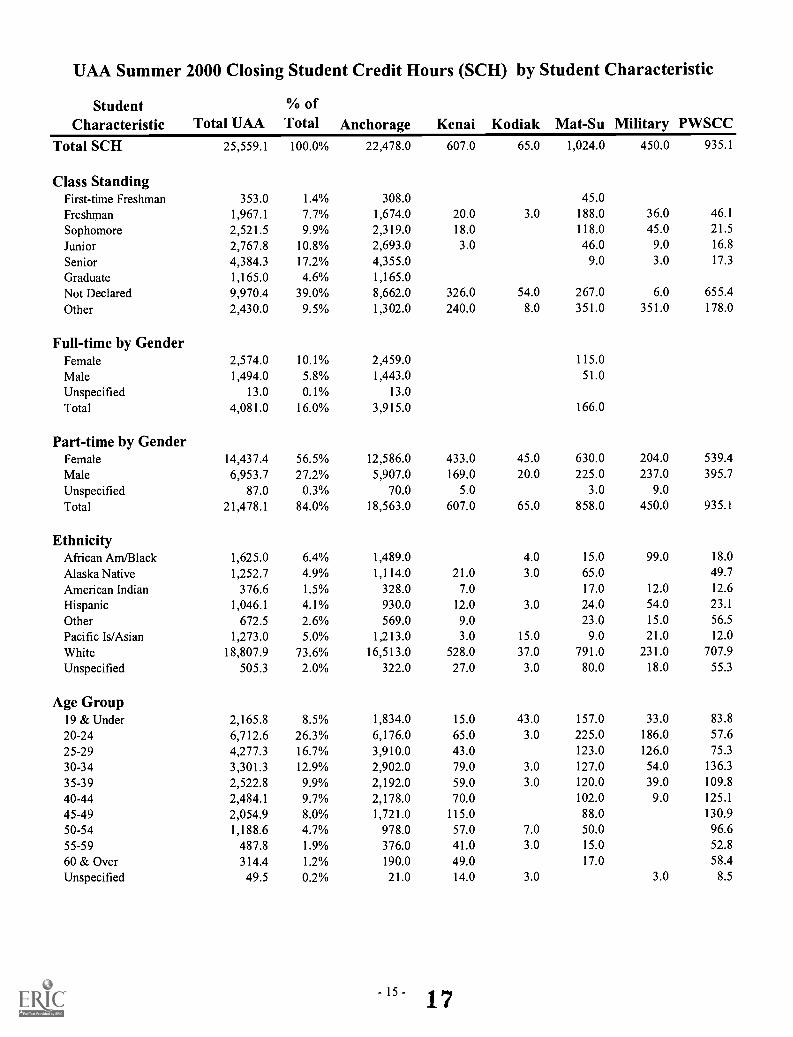
UAA Summer 2000 Closing Student Credit Hours (SCH) by Student Characteristic
StudentCharacteristic Total UAA
% ofTotal Anchorage Kenai Kodiak Mat-Su Military PWSCC
Total SCH 25,559.1 100.0% 22,478.0 607.0 65.0 1,024.0 450.0 935.1
Class StandingFirst-time Freshman 353.0 1.4% 308.0 45.0Freshman 1,967.1 7.7% 1,674.0 20.0 3.0 188.0 36.0 46.1
Sophomore 2,521.5 9.9% 2,319.0 18.0 118.0 45.0 21.5
Junior 2,767.8 10.8% 2,693.0 3.0 46.0 9.0 16.8
Senior 4,384.3 17.2% 4,355.0 9.0 3.0 17.3
Graduate 1,165.0 4.6% 1,165.0Not Declared 9,970.4 39.0% 8,662.0 326.0 54.0 267.0 6.0 655.4
Other 2,430.0 9.5% 1,302.0 240.0 8.0 351.0 351.0 178.0
Full-time by GenderFemale 2,574.0 10.1% 2,459.0 115.0
Male 1,494.0 5.8% 1,443.0 51.0
Unspecified 13.0 0.1% 13.0
Total 4,081.0 16.0% 3,915.0 166.0
Part-time by GenderFemale 14,437.4 56.5% 12,586.0 433.0 45.0 630.0 204.0 539.4Male 6,953.7 27.2% 5,907.0 169.0 20.0 225.0 237.0 395.7
Unspecified 87.0 0.3% 70.0 5.0 3.0 9.0
Total 21,478.1 84.0% 18,563.0 607.0 65.0 858.0 450.0 935.1
EthnicityAfrican Am/Black 1,625.0 6.4% 1,489.0 4.0 15.0 99.0 18.0
Alaska Native 1,252.7 4.9% 1,114.0 21.0 3.0 65.0 49.7
American Indian 376.6 1.5% 328.0 7.0 17.0 12.0 12.6
Hispanic 1,046.1 4.1% 930.0 12.0 3.0 24.0 54.0 23.1
Other 672.5 2.6% 569.0 9.0 23.0 15.0 56.5
Pacific Is/Asian 1,273.0 5.0% 1,213.0 3.0 15.0 9.0 21.0 12.0
White 18,807.9 73.6% 16,513.0 528.0 37.0 791.0 231.0 707.9Unspecified 505.3 2.0% 322.0 27.0 3.0 80.0 18.0 55.3
Age Group19 & Under 2,165.8 8.5% 1,834.0 15.0 43.0 157.0 33.0 83.8
20-24 6,712.6 26.3% 6,176.0 65.0 3.0 225.0 186.0 57.6
25-29 4,277.3 16.7% 3,910.0 43.0 123.0 126.0 75.3
30-34 3,301.3 12.9% 2,902.0 79.0 3.0 127.0 54.0 136.3
35-39 2,522.8 9.9% 2,192.0 59.0 3.0 120.0 39.0 109.840-44 2,484.1 9.7% 2,178.0 70.0 102.0 9.0 125.1
45-49 2,054.9 8.0% 1,721.0 115.0 88.0 130.9
50-54 1,188.6 4.7% 978.0 57.0 7.0 50.0 96.655-59 487.8 1.9% 376.0 41.0 3.0 15.0 52.8
60 & Over 314.4 1.2% 190.0 49.0 17.0 58.4
Unspecified 49.5 0.2% 21.0 14.0 3.0 3.0 8.5
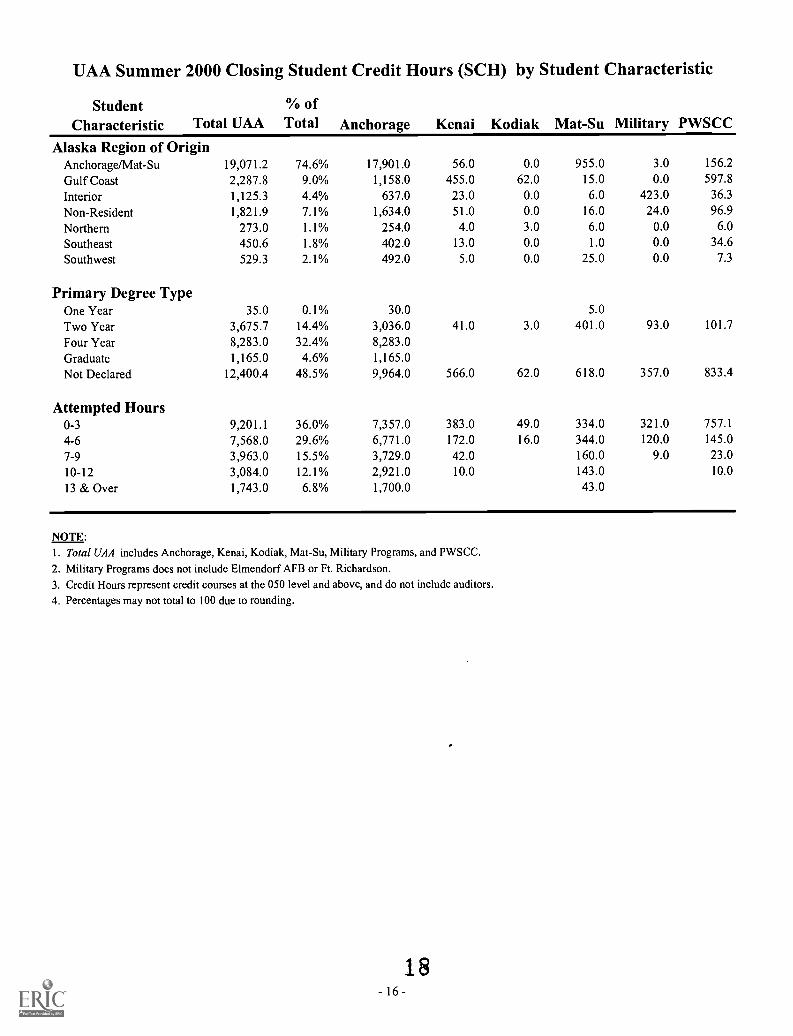
UAA Summer 2000 Closing Student Credit Hours (SCH) by Student Characteristic
StudentCharacteristic Total UAA
% ofTotal Anchorage Kenai Kodiak Mat-Su Military PWSCC
Alaska Region of OriginAnchorage/Mat-Su 19,071.2 74.6% 17,901.0 56.0 0.0 955.0 3.0 156.2
Gulf Coast 2,287.8 9.0% 1,158.0 455.0 62.0 15.0 0.0 597.8
Interior 1,125.3 4.4% 637.0 23.0 0.0 6.0 423.0 36.3
Non-Resident 1,821.9 7.1% 1,634.0 51.0 0.0 16.0 24.0 96.9
Northern 273.0 1.1% 254.0 4.0 3.0 6.0 0.0 6.0
Southeast 450.6 1.8% 402.0 13.0 0.0 1.0 0.0 34.6
Southwest 529.3 2.1% 492.0 5.0 0.0 25.0 0.0 7.3
Primary Degree TypeOne Year 35.0 0.1% 30.0 5.0
Two Year 3,675.7 14.4% 3,036.0 41.0 3.0 401.0 93.0 101.7
Four Year 8,283.0 32.4% 8,283.0Graduate 1,165.0 4.6% 1,165.0Not Declared 12,400.4 48.5% 9,964.0 566.0 62.0 618.0 357.0 833.4
Attempted Hours0-3 9,201.1 36.0% 7,357.0 383.0 49.0 334.0 321.0 757.1
4-6 7,568.0 29.6% 6,771.0 172.0 16.0 344.0 120.0 145.0
7-9 3,963.0 15.5% 3,729.0 42.0 160.0 9.0 23.010-12 3,084.0 12.1% 2,921.0 10.0 143.0 10.0
13 & Over 1,743.0 6.8% 1,700.0 43.0
NOTE:1. Total UAA includes Anchorage, Kenai, Kodiak, Mat-Su, Military Programs, and PWSCC.
2. Military Programs does not include Elmendorf AFB or Ft. Richardson.3. Credit Hours represent credit courses at the 050 level and above, and do not include auditors.4. Percentages may not total to 100 due to rounding.
18- 16 -
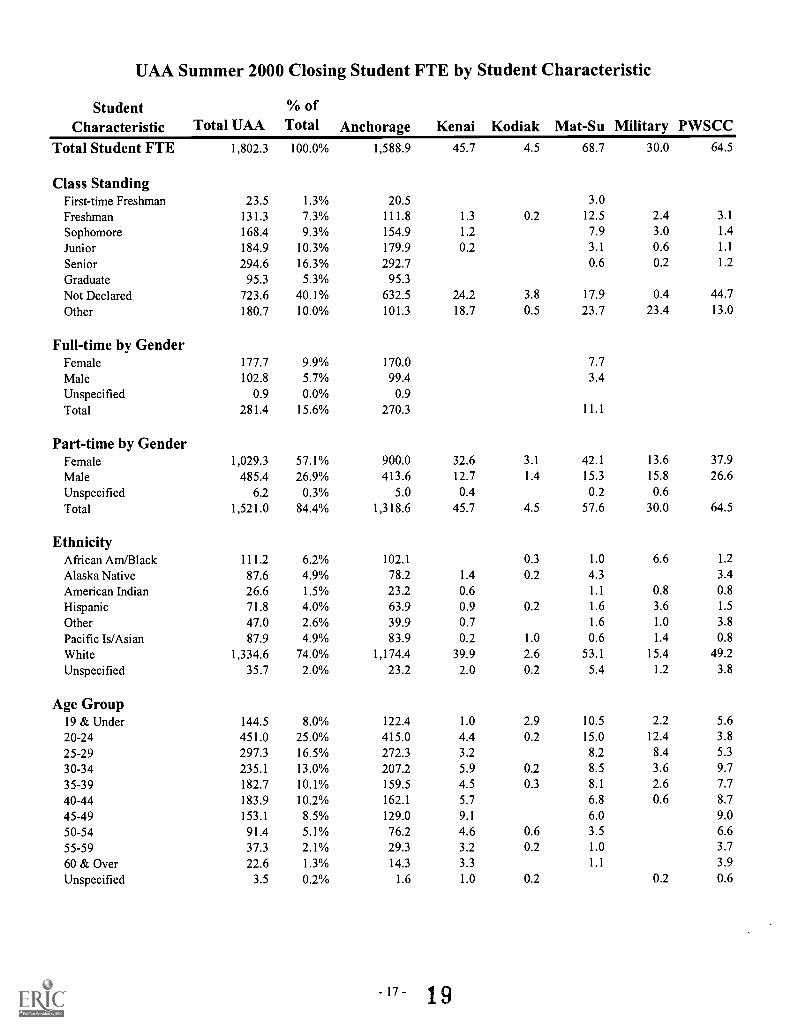
UAA Summer 2000 Closing Student FTE by Student Characteristic
StudentCharacteristic Total UAA
% ofTotal Anchorage Kenai Kodiak Mat-Su Military PWSCC
Total Student FTE 1,802.3 100.0% 1,588.9 45.7 4.5 68.7 30.0 64.5
Class StandingFirst-time Freshman 23.5 1.3% 20.5 3.0
Freshman 131.3 7.3% 111.8 1.3 0.2 12.5 2.4 3.1
Sophomore 168.4 9.3% 154.9 1.2 7.9 3.0 1.4
Junior 184.9 10.3% 179.9 0.2 3.1 0.6 1.1
Senior 294.6 16.3% 292.7 0.6 0.2 1.2
Graduate 95.3 5.3% 95.3
Not Declared 723.6 40.1% 632.5 24.2 3.8 17.9 0.4 44.7
Other 180.7 10.0% 101.3 18.7 0.5 23.7 23.4 13.0
Full-time by GenderFemale 177.7 9.9% 170.0 7.7Male 102.8 5.7% 99.4 3.4Unspecified 0.9 0.0% 0.9Total 281.4 15.6% 270.3 11.1
Part-time by GenderFemale 1,029.3 57.1% 900.0 32.6 3.1 42.1 13.6 37.9Male 485.4 26.9% 413.6 12.7 1.4 15.3 15.8 26.6
Unspecified 6.2 0.3% 5.0 0.4 0.2 0.6
Total 1,521.0 84.4% 1,318.6 45.7 4.5 57.6 30.0 64.5
EthnicityAfrican Am/Black 111.2 6.2% 102.1 0.3 1.0 6.6 1.2
Alaska Native 87.6 4.9% 78.2 1.4 0.2 4.3 3.4
American Indian 26.6 1.5% 23.2 0.6 1.1 0.8 0.8
Hispanic 71.8 4.0% 63.9 0.9 0.2 1.6 3.6 1.5
Other 47.0 2.6% 39.9 0.7 1.6 1.0 3.8
Pacific Is/Asian 87.9 4.9% 83.9 0.2 1.0 0.6 1.4 0.8
White 1,334.6 74.0% 1,174.4 39.9 2.6 53.1 15.4 49.2
Unspecified 35.7 2.0% 23.2 2.0 0.2 5.4 1.2 3.8
Age Group19 & Under 144.5 8.0% 122.4 1.0 2.9 10.5 2.2 5.6
20-24 451.0 25.0% 415.0 4.4 0.2 15.0 12.4 3.8
25-29 297.3 16.5% 272.3 3.2 8.2 8.4 5.3
30-34 235.1 13.0% 207.2 5.9 0.2 8.5 3.6 9.7
35-39 182.7 10.1% 159.5 4.5 0.3 8.1 2.6 7.7
40-44 183.9 10.2% 162.1 5.7 6.8 0.6 8.7
45-49 153.1 8.5% 129.0 9.1 6.0 9.0
50-54 91.4 5.1% 76.2 4.6 0.6 3.5 6.6
55-59 37.3 2.1% 29.3 3.2 0.2 1.0 3.7
60 & Over 22.6 1.3% 14.3 3.3 1.1 3.9
Unspecified 3.5 0.2% 1.6 1.0 0.2 0.2 0.6
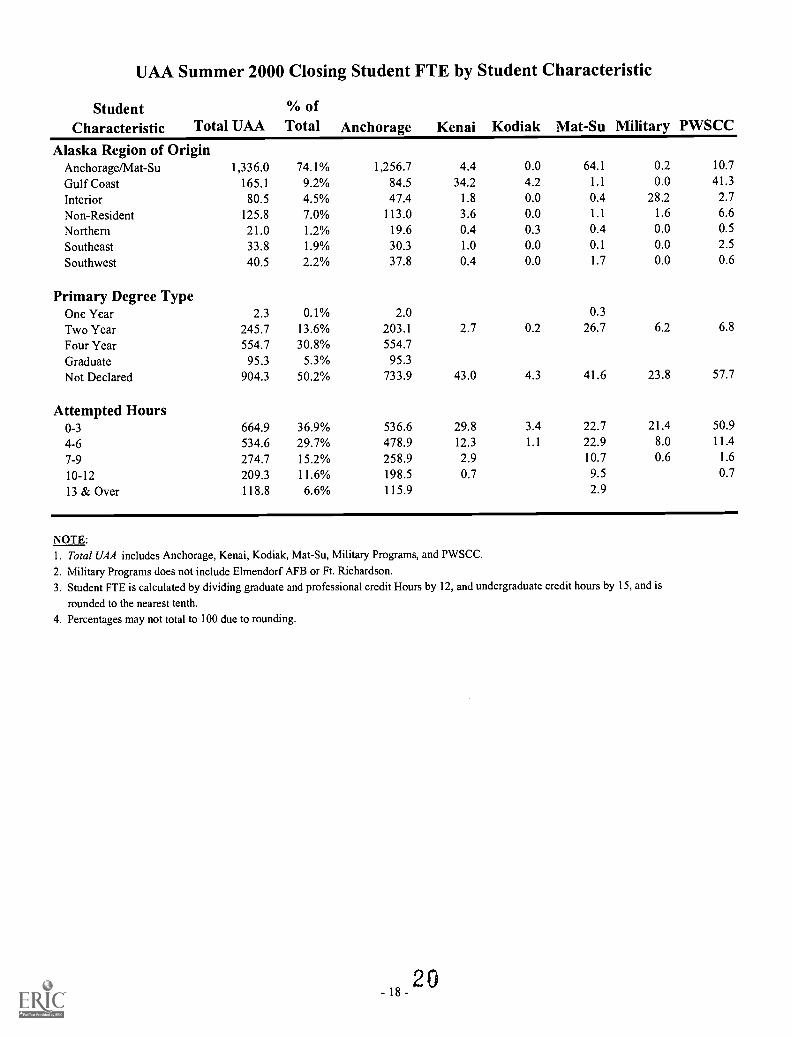
UAA Summer 2000 Closing Student FTE by Student Characteristic
StudentCharacteristic Total UAA
% of
Total Anchorage Kenai Kodiak Mat-Su Military PWSCC
Alaska Region of OriginAnchorage/Mat-Su 1,336.0 74.1% 1,256.7 4.4 0.0 64.1 0.2 10.7
Gulf Coast 165.1 9.2% 84.5 34.2 4.2 1.1 0.0 41.3
Interior 80.5 4.5% 47.4 1.8 0.0 0.4 28.2 2.7
Non-Resident 125.8 7.0% 113.0 3.6 0.0 1.1 1.6 6.6
Northern 21.0 1.2% 19.6 0.4 0.3 0.4 0.0 0.5
Southeast 33.8 1.9% 30.3 1.0 0.0 0.1 0.0 2.5
Southwest 40.5 2.2% 37.8 0.4 0.0 1.7 0.0 0.6
Primary Degree TypeOne Year 2.3 0.1% 2.0 0.3
Two Year 245.7 13.6% 203.1 2.7 0.2 26.7 6.2 6.8
Four Year 554.7 30.8% 554.7
Graduate 95.3 5.3% 95.3
Not Declared 904.3 50.2% 733.9 43.0 4.3 41.6 23.8 57.7
Attempted Hours0-3 664.9 36.9% 536.6 29.8 3.4 22.7 21.4 50.9
4-6 534.6 29.7% 478.9 12.3 1.1 22.9 8.0 11.4
7-9 274.7 15.2% 258.9 2.9 10.7 0.6 1.6
10-12 209.3 11.6% 198.5 0.7 9.5 0.7
13 & Over 118.8 6.6% 115.9 2.9
NOTE:I. TotalUAA includes Anchorage, Kenai, Kodiak, Mat-Su, Military Programs, and PWSCC.
2. Military Programs does not include Elmendorf AFB or Ft. Richardson.3. Student FTE is calculated by dividing graduate and professional credit Hours by 12, and undergraduate credit hours by 15, and is
rounded to the nearest tenth.4. Percentages may not total to 100 due to rounding.
- 18 -20
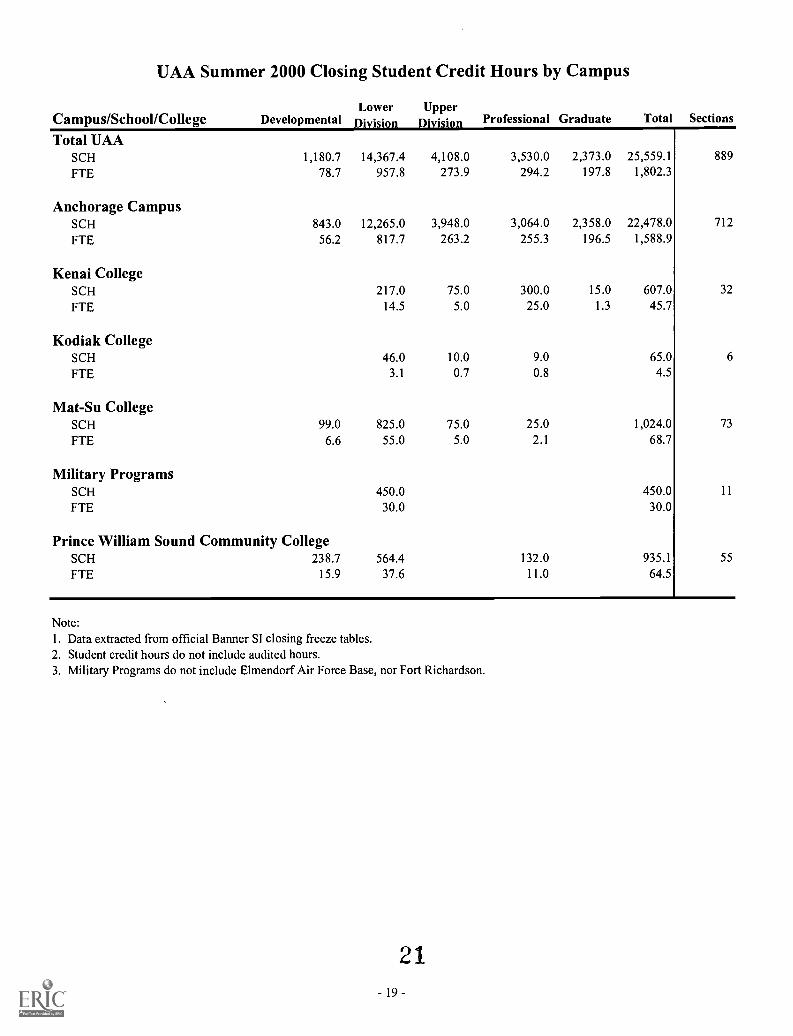
UAA Summer 2000 Closing Student Credit Hours by Campus
Campus/School/College DevelopmentalLower
DivisionUpper
Division Professional Graduate Total Sections
Total UAASCH 1,180.7 14,367.4 4,108.0 3,530.0 2,373.0 25,559.1 889
FTE 78.7 957.8 273.9 294.2 197.8 1,802.3
Anchorage CampusSCH 843.0 12,265.0 3,948.0 3,064.0 2,358.0 22,478.0 712
FTE 56.2 817.7 263.2 255.3 196.5 1,588.9
Kenai CollegeSCH 217.0 75.0 300.0 15.0 607.0 32
FTE 14.5 5.0 25.0 1.3 45.7
Kodiak CollegeSCH 46.0 10.0 9.0 65.0 6
FTE 3.1 0.7 0.8 4.5
Mat-Su CollegeSCH 99.0 825.0 75.0 25.0 1,024.0 73
FTE 6.6 55.0 5.0 2.1 68.7
Military ProgramsSCH 450.0 450.0 11
FTE 30.0 30.0
Prince William Sound Community CollegeSCH 238.7 564.4 132.0 935.1 55
FTE 15.9 37.6 11.0 64.5
Note:1. Data extracted from official Banner SI closing freeze tables.2. Student credit hours do not include audited hours.3. Military Programs do not include Elmendorf Air Force Base, nor Fort Richardson.
21- 19 -
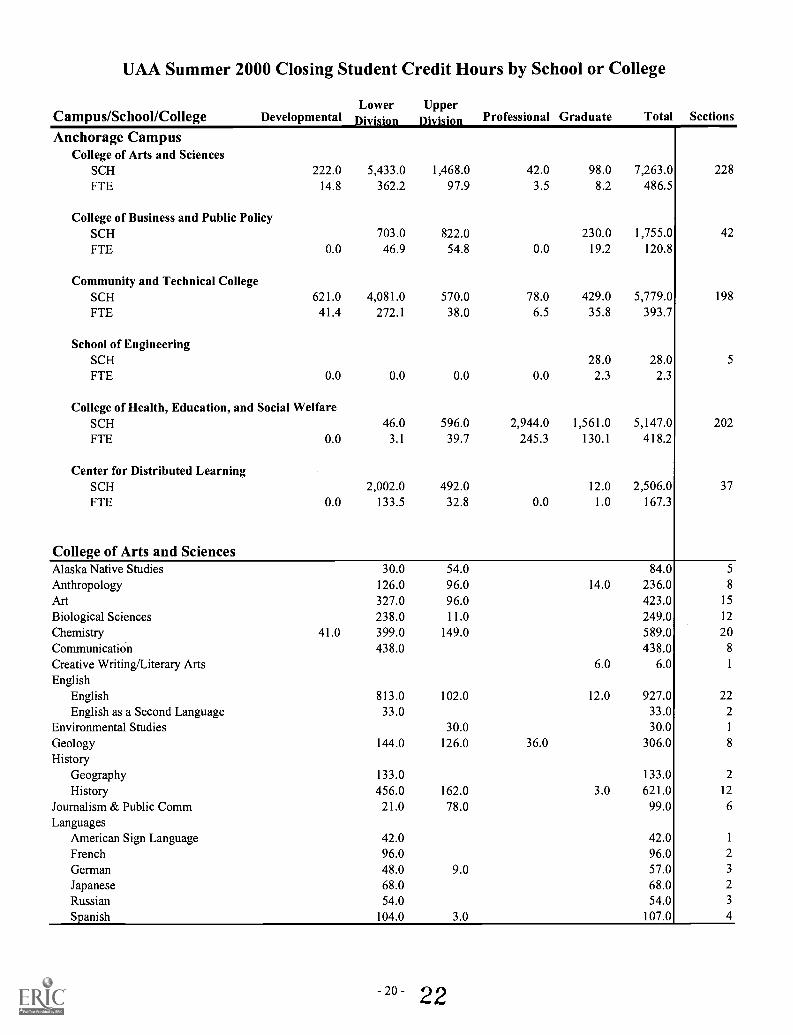
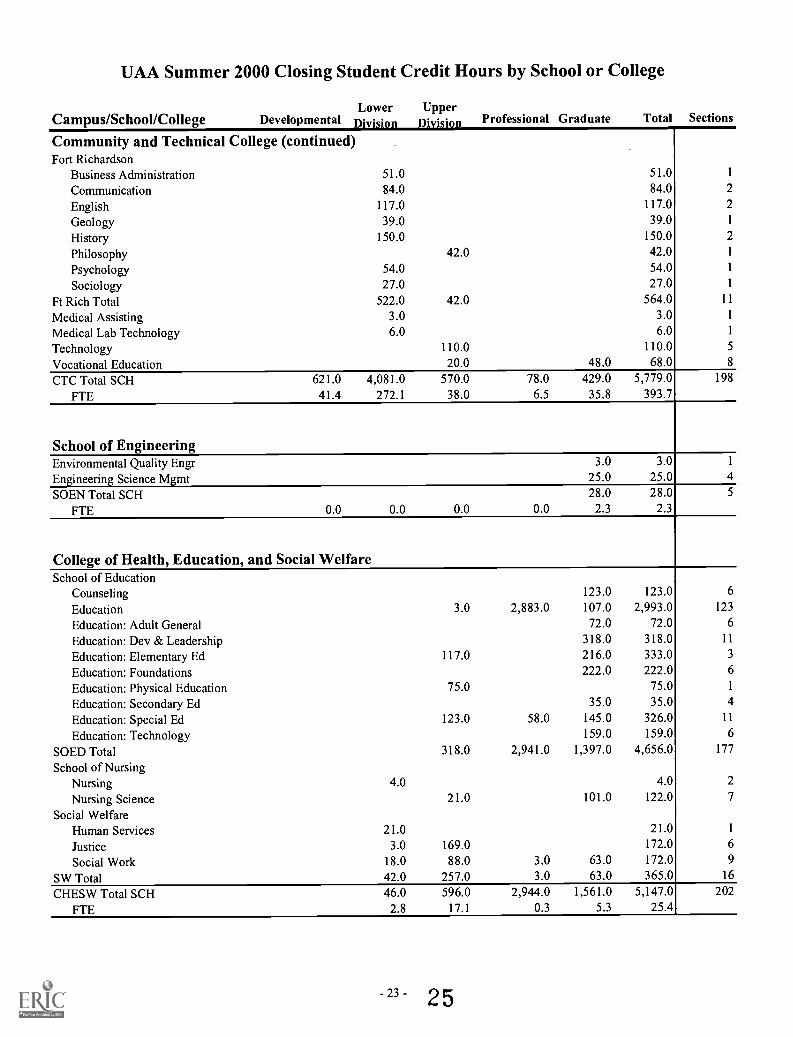
UAA Summer 2000 Closing Student Credit Hours by School or College
Campus/School/College DevelopmentalLower
DivisionUpper
Division Professional Graduate Total Sections
Anchorage CampusCollege of Arts and Sciences
SCH 222.0 5,433.0 1,468.0 42.0 98.0 7,263.0 228FTE 14.8 362.2 97.9 3.5 8.2 486.5
College of Business and Public PolicySCH 703.0 822.0 230.0 1,755.0 42
FTE 0.0 46.9 54.8 0.0 19.2 120.8
Community and Technical CollegeSCH 621.0 4,081.0 570.0 78.0 429.0 5,779.0 198
FTE 41.4 272.1 38.0 6.5 35.8 393.7
School of EngineeringSCH 28.0 28.0 5
FTE 0.0 0.0 0.0 0.0 2.3 2.3
College of Health, Education, and Social WelfareSCH 46.0 596.0 2,944.0 1,561.0 5,147.0 202FTE 0.0 3.1 39.7 245.3 130.1 418.2
Center for Distributed LearningSCH 2,002.0 492.0 12.0 2,506.0 37FTE 0.0 133.5 32.8 0.0 1.0 167.3
College of Arts and SciencesAlaska Native Studies 30.0 54.0 84.0 5
Anthropology 126.0 96.0 14.0 236.0 8
Art 327.0 96.0 423.0 15
Biological Sciences 238.0 11.0 249.0 12
Chemistry 41.0 399.0 149.0 589.0 20Communication 438.0 438.0 8
Creative Writing/Literary Arts 6.0 6.0 1
EnglishEnglish 813.0 102.0 12.0 927.0 22English as a Second Language 33.0 33.0 2
Environmental Studies 30.0 30.0 1
Geology 144.0 126.0 36.0 306.0 8
HistoryGeography 133.0 133.0 2
History 456.0 162.0 3.0 621.0 12
Journalism & Public Comm 21.0 78.0 99.0 6
LanguagesAmerican Sign Language 42.0 42.0 1
French 96.0 96.0 2
German 48.0 9.0 57.0 3
Japanese 68.0 68.0 2
Russian 54.0 54.0 3
Spanish 104.0 3.0 107.0 4
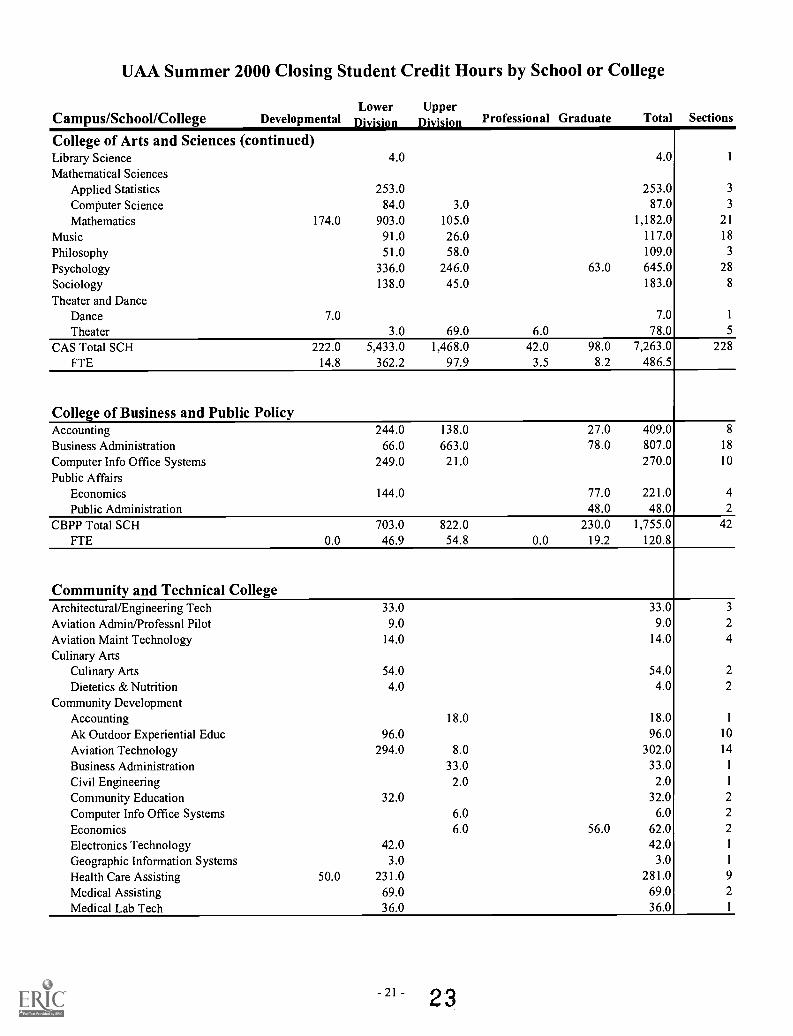
UAA Summer 2000 Closing Student Credit Hours by School or College
Cam us/School/Colle eLower Upper
Developmental Division Division Professional Graduate Total Sections
College of Arts and Sciences (continued)Library Science 4.0 4.0 1
Mathematical SciencesApplied Statistics 253.0 253.0 3
Computer Science 84.0 3.0 87.0 3
Mathematics 174.0 903.0 105.0 1,182.0 21
Music 91.0 26.0 117.0 18
Philosophy 51.0 58.0 109.0 3
Psychology 336.0 246.0 63.0 645.0 28
Sociology 138.0 45.0 183.0 8
Theater and DanceDance 7.0 7.0 1
Theater 3.0 69.0 6.0 78.0 5
CAS Total SCH 222.0 5,433.0 1,468.0 42.0 98.0 7,263.0 228
FTE 14.8 362.2 97.9 3.5 8.2 486.5
College of Business and Public PolicyAccounting 244.0 138.0 27.0 409.0 8
Business Administration 66.0 663.0 78.0 807.0 18
Computer Info Office Systems 249.0 21.0 270.0 10
Public AffairsEconomics 144.0 77.0 221.0 4
Public Administration 48.0 48.0 2
CBPP Total SCH 703.0 822.0 230.0 1,755.0 42FTE 0.0 46.9 54.8 0.0 19.2 120.8
Community and Technical CollegeArchitectural/Engineering Tech 33.0 33.0 3
Aviation Admin/Professnl Pilot 9.0 9.0 2
Aviation Maint Technology 14.0 14.0 4
Culinary ArtsCulinary Arts 54.0 54.0 2
Dietetics & Nutrition 4.0 4.0 2
Community DevelopmentAccounting 18.0 18.0 1
Ak Outdoor Experiential Educ 96.0 96.0 10
Aviation Technology 294.0 8.0 302.0 14
Business Administration 33.0 33.0 1
Civil Engineering 2.0 2.0 1
Community Education 32.0 32.0 2
Computer Info Office Systems 6.0 6.0 2
Economics 6.0 56.0 62.0 2
Electronics Technology 42.0 42.0 1
Geographic Information Systems 3.0 3.0 1
Health Care Assisting 50.0 231.0 281.0 9
Medical Assisting 69.0 69.0 2
Medical Lab Tech 36.0 36.0 1
- 21 - 23
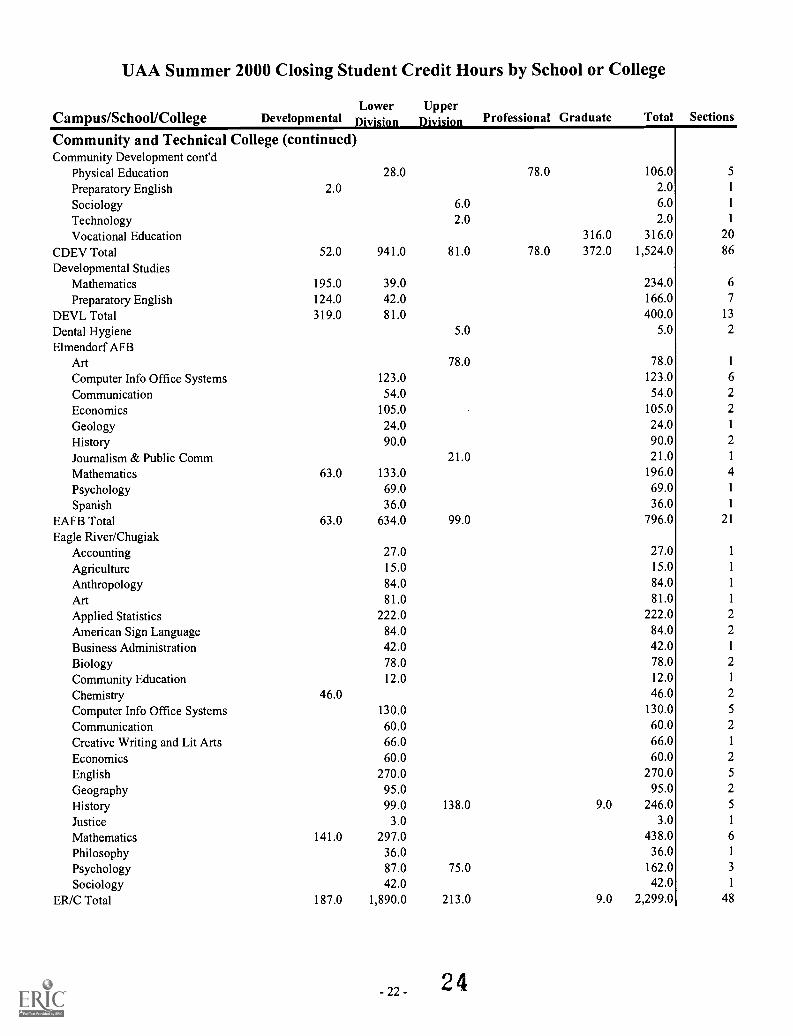
UAA Summer 2000 Closing Student Credit Hours by School or College
Campus/School/CollegeLower Upper
Developmental Professional Graduate Total Sections
Community and Technical College (continued)Community Development cont'd
Physical Education 28.0 78.0 106.0 5
Preparatory English 2.0 2.0 1
Sociology 6.0 6.0 1
Technology 2.0 2.0 1
Vocational Education 316.0 316.0 20
CDEV Total 52.0 941.0 81.0 78.0 372.0 1,524.0 86
Developmental StudiesMathematics 195.0 39.0 234.0 6
Preparatory English 124.0 42.0 166.0 7
DEVL Total 319.0 81.0 400.0 13
Dental Hygiene 5.0 5.0 2
Elmendorf AFBArt 78.0 78.0 1
Computer Info Office Systems 123.0 123.0 6
Communication 54.0 54.0 2
Economics 105.0 105.0 2
Geology 24.0 24.0 1
History 90.0 90.0 2
Journalism & Public Comm 21.0 21.0 1
Mathematics 63.0 133.0 196.0 4
Psychology 69.0 69.0 1
Spanish 36.0 36.0 1
EAFB Total 63.0 634.0 99.0 796.0 21
Eagle River/ChugiakAccounting 27.0 27.0 1
Agriculture 15.0 15.0 1
Anthropology 84.0 84.0 1
Art 81.0 81.0 1
Applied Statistics 222.0 222.0 2
American Sign Language 84.0 84.0 2
Business Administration 42.0 42.0 1
Biology 78.0 78.0 2
Community Education 12.0 12.0 1
Chemistry 46.0 46.0 2
Computer Info Office Systems 130.0 130.0 5
Communication 60.0 60.0 2
Creative Writing and Lit Arts 66.0 66.0 1
Economics 60.0 60.0 2
English 270.0 270.0 5
Geography 95.0 95.0 2
History 99.0 138.0 9.0 246.0 5
Justice 3.0 3.0 I
Mathematics 141.0 297.0 438.0 6
Philosophy 36.0 36.0 1
Psychology 87.0 75.0 162.0 3
Sociology 42.0 42.0 1
ER/C Total 187.0 1,890.0 213.0 9.0 2,299.0 48
UAA Summer 2000 Closing Student Credit Hours by School or College
Campus/School/CollegeLower Upper
Developmental flivicinn flivicrnn Professional Graduate Total Sections
Community and Technical College (continued)Fort Richardson
Business AdministrationCommunicationEnglishGeologyHistory
.
51.084.0
117.039.0
150.0
51.084.0
117.039.0
150.0
1
2
2
1
2
Philosophy 42.0 42.0 1
Psychology 54.0 54.0 1
Sociology 27.0 27.0 1
Ft Rich Total 522.0 42.0 564.0 11
Medical Assisting 3.0 3.0 1
Medical Lab Technology 6.0 6.0 1
Technology 110.0 110.0 5
Vocational Education 20.0 48.0 68.0 8
CTC Total SCH 621.0 4,081.0 570.0 78.0 429.0 5,779.0 198
FTE 41.4 272.1 38.0 6.5 35.8 393.7
School of EngineeringEnvironmental Quality Engr 3.0 3.0 1
Engineering Science Mgmt 25.0 25.0 4
SOEN Total SCH 28.0 28.0 5
FTE 0.0 0.0 0.0 0.0 2.3 2.3
College of Health, Education, and Social WelfareSchool of Education
Counseling 123.0 123.0 6
Education 3.0 2,883.0 107.0 2,993.0 123
Education: Adult General 72.0 72.0 6
Education: Dev & Leadership 318.0 318.0 11
Education: Elementary Ed 117.0 216.0 333.0 3
Education: Foundations 222.0 222.0 6
Education: Physical Education 75.0 75.0 1
Education: Secondary Ed 35.0 35.0 4
Education: Special Ed 123.0 58.0 145.0 326.0 11
Education: Technology 159.0 159.0 6
SOED Total 318.0 2,941.0 1,397.0 4,656.0 177
School of NursingNursing 4.0 4.0 2
Nursing Science 21.0 101.0 122.0 7
Social WelfareHuman Services 21,0 21.0 1
Justice 3.0 169.0 172.0 6
Social Work 18.0 88.0 3.0 63.0 172.0 9
SW Total 42.0 257.0 3.0 63.0 365.0 16
CHESW Total SCH 46.0 596.0 2,944.0 1,561.0 5,147.0 202
FTE 2.8 17.1 0.3 5.3 25.4
UAA Summer 2000 Closing Student Credit Hours by School or College
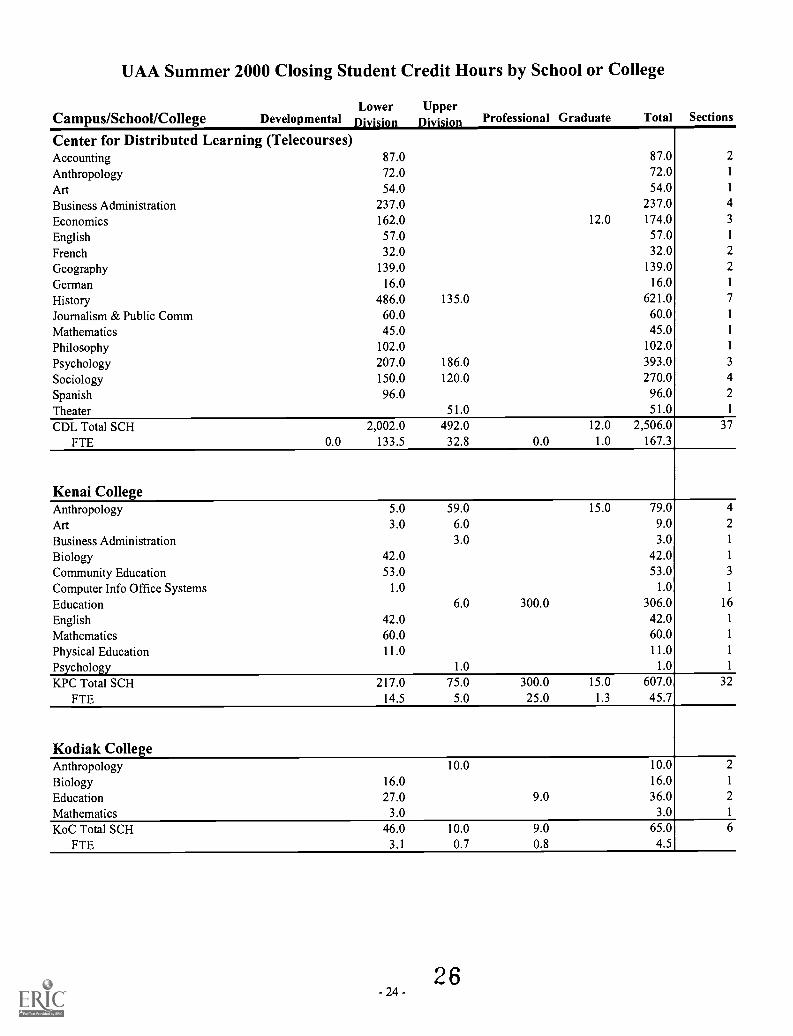
Cam us/School/Cone e DevelopmentalLower Upper
Professional Graduate Total Sections
Center for Distributed Learning (Telecourses)Accounting 87.0 87.0 2
Anthropology 72.0 72.0 1
Art 54.0 54.0 1
Business Administration 237.0 237.0 4
Economics 162.0 12.0 174.0 3
English 57.0 57.0 1
French 32.0 32.0 2
Geography 139.0 139.0 2
German 16.0 16.0 1
History 486.0 135.0 621.0 7
Journalism & Public Comm 60.0 60.0 1
Mathematics 45.0 45.0 1
Philosophy 102.0 102.0 1
Psychology 207.0 186.0 393.0 3
Sociology 150.0 120.0 270.0 4
Spanish 96.0 96.0 2
Theater 51.0 51.0 1
CDL Total SCH 2,002.0 492.0 12.0 2,506.0 37
FTE 0.0 133.5 32.8 0.0 1.0 167.3
Kenai CollegeAnthropology 5.0 59.0 15.0 79.0 4
Art 3.0 6.0 9.0 2
Business Administration 3.0 3.0 1
Biology 42.0 42.0 1
Community Education 53.0 53.0 3
Computer Info Office Systems 1.0 1.0 1
Education 6.0 300.0 306.0 16
English 42.0 42.0 1
Mathematics 60.0 60.0 1
Physical Education 11.0 11.0 1
Psychology 1.0 1.0 1
KPC Total SCH 217.0 75.0 300.0 15.0 607.0 32
FTE 14.5 5.0 25.0 1.3 45.7
Kodiak CollegeAnthropology 10.0 10.0 2
Biology 16.0 16.0 1
Education 27.0 9.0 36.0 2
Mathematics 3.0 3.0 1
KoC Total SCH 46.0 10.0 9.0 65.0 6
FTE 3.1 0.7 0.8 4.5
UAA Summer 2000 Closing Student Credit Hours by School or College
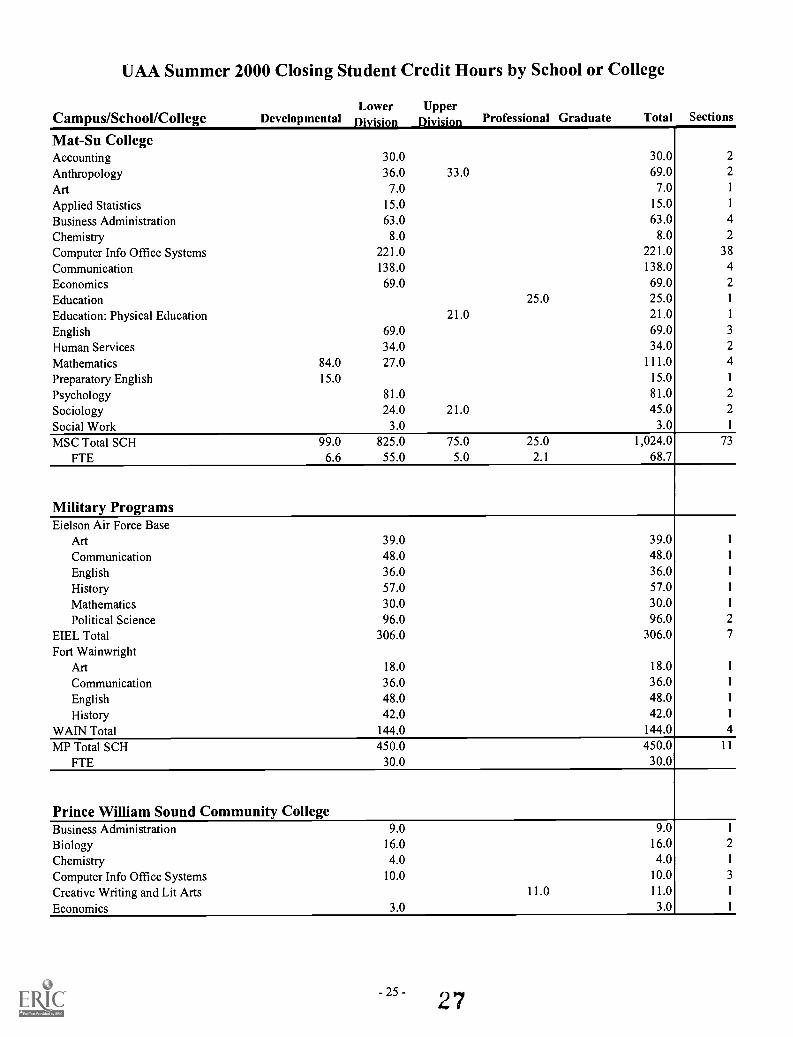
Cam us/School/Colle e DevelopmentalLower Upper
Professional Graduate Total Sections
Mat-Su CollegeAccounting 30.0 30.0 2
Anthropology 36.0 33.0 69.0 2
Art 7.0 7.0 I
Applied Statistics 15.0 15.0 1
Business Administration 63.0 63.0 4
Chemistry 8.0 8.0 2
Computer Info Office Systems 221.0 221.0 38
Communication 138.0 138.0 4
Economics 69.0 69.0 2
Education 25.0 25.0 1
Education: Physical Education 21.0 21.0 1
English 69.0 69.0 3
Human Services 34.0 34.0 2
Mathematics 84.0 27.0 111.0 4
Preparatory English 15.0 15.0 1
Psychology 81.0 81.0 2
Sociology 24.0 21.0 45.0 2
Social Work 3.0 3.0 1
MSC Total SCH 99.0 825.0 75.0 25.0 1,024.0 73
FTE 6.6 55.0 5.0 2.1 68.7
Military ProgramsEielson Air Force Base
Art 39.0 39.0 1
Communication 48.0 48.0 1
English 36.0 36.0 1
History 57.0 57.0 1
Mathematics 30.0 30.0 1
Political Science 96.0 96.0 2
EIEL Total 306.0 306.0 7
Fort WainwrightArt 18.0 18.0 1
Communication 36.0 36.0 1
English 48.0 48.0 1
History 42.0 42.0 1
WAIN Total 144.0 144.0 4
MP Total SCH 450.0 450.0 11
FTE 30.0 30.0
Prince William Sound Community CollegeBusiness Administration 9.0 9.0 1
Biology 16.0 16.0 2
Chemistry 4.0 4.0 1
Computer Info Office Systems 10.0 10.0 3
Creative Writing and Lit Arts 11.0 11.0 1
Economics 3.0 3.0 1
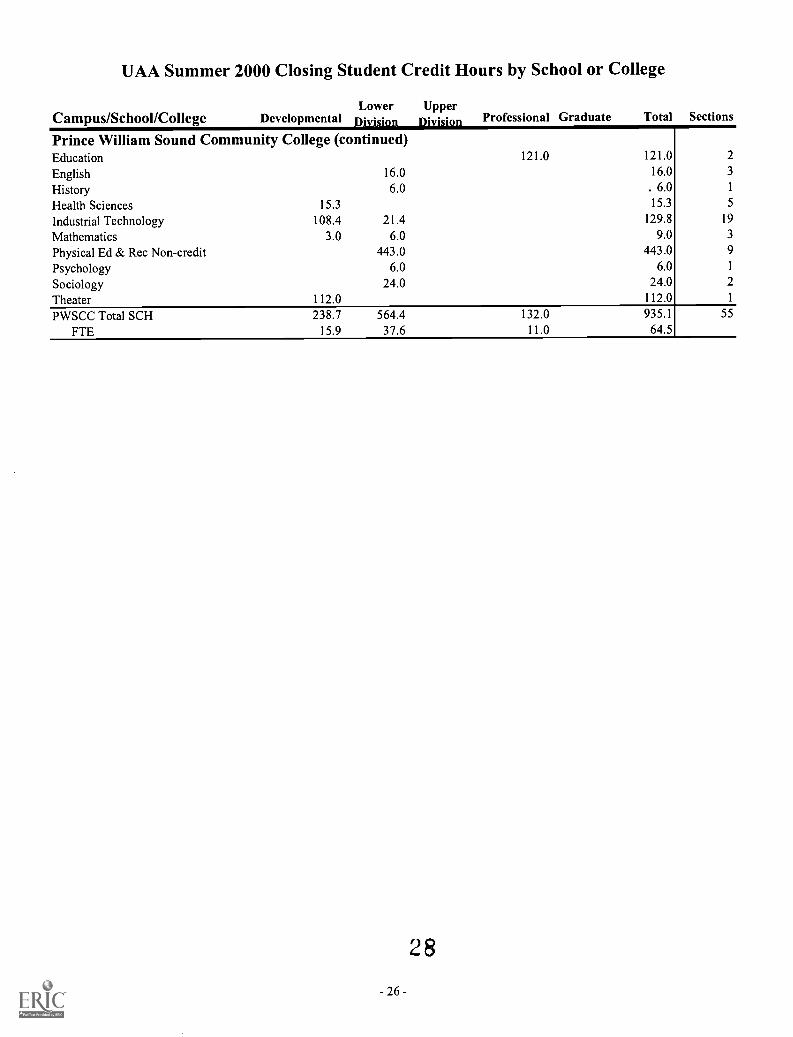
UAA Summer 2000 Closing Student Credit Hours by School or College
Campus/School/College DevelopmentalLower Upper
Division Division Professional Graduate Total Sections
Prince William Sound Community College (continued)Education 121.0 121.0 2
English 16.0 16.0 3
History 6.0 . 6.0 1
Health Sciences 15.3 15.3 5
Industrial Technology 108.4 21.4 129.8 19
Mathematics 3.0 6.0 9.0 3
Physical Ed & Rec Non-credit 443.0 443.0 9
Psychology 6.0 6.0 1
Sociology 24.0 24.0 2
Theater 112.0 112.0 1
PWSCC Total SCH 238.7 564.4 132.0 935.1 55
FTE 15.9 37.6 11.0 64.5
28
- 26 -
U.S. Department of EducationOffice of Educational Research and Improvement (OERI)
National Library of Education (NLE)
Educational Resources Information Center (ERIC)
NOTICE
Reproduction Basis
ERIC
This document is covered by a signed "Reproduction Release(Blanket)" form (on file within the ERIC system), encompassing allor classes of documents from its source organization and, therefore,does not require a "Specific Document" Release form.
This document is Federally-funded, or carries its own permission toreproduce, or is otherwise in the public domain and, therefore, maybe reproduced by ERIC without a signed Reproduction Release form(either "Specific Document" or "Blanket").
EFF-089 (3/2000)