reproductions supplied by edrs are the best that can … · schools and staffing survey (sass)....
TRANSCRIPT
ED 437 396
AUTHORTITLE
INSTITUTION
SPONS AGENCY
REPORT NOPUB DATENOTEAVAILABLE FROM
PUB TYPEEDRS PRICEDESCRIPTORS
IDENTIFIERS
ABSTRACT
DOCUMENT RESUME
TM 030 365
Gruber, Kerry J.; Rohr, Carol L.; Fondelier, Sharon E.Schools and Staffing Survey 1990-91: Data File User'sManual. Volume I: Survey Documentation.Pinkerton Computer Consultants, Inc., Baileys Crossroads,VA.; Bureau of the Census (DOC), Suitland, MD.National Center for Education Statistics (ED), Washington,DC.
NCES-93-144-11994-01-00513p.; For volumes II and III, see ED 435 733-734.National Center for Education Statistics, Office ofEducational Research and Improvement, 555 New Jersey Avenue,NW, Washington, DC 20208-5651.Guides Non-Classroom (055)MF02/PC21 Plus Postage.*Coding; Data Analysis; Elementary Secondary Education;National Surveys; *Research Methodology; Response Rates(Questionnaires); Sample Size; *Sampling; School Personnel;School Statistics; *Teachers; User Needs (Information)Data Files; *Schools and Staffing Survey (NCES)
This volume documents the data collection of the 1990-91Schools and Staffing Survey (SASS). People wishing to determine whether theirresearch needs can be served by SASS data will find a description of thesurvey's contents and objectives in the Overview. This volume contains thefollowing chapters: (1) "Overview"; (2) "Changes in SASS Design and Contentfrom 1998 to 1991"; (3) "Preparation for the 1991 SASS"; (4) "Sample Designand Implementation"; (5) "Data Collection"; (6) "Response Rates"; (7) "EditProcedures"; (8) "Imputation Procedures"; (9) "Weighting"; (10) "VarianceEstimation"; (11) "Reinterview Program"; (12) "Reviewing the Quality of SASSData"; (13) "Cautions Concerning the Measurement of Change Estimates Using1987-88 and 1990-91 SASS"; (14) "Confidentiality Protection Measures"; (15)
"Created Variables"; and (16) "User Notes." Seven appendixes containsupplemental information about the survey. (Contains 153 tables and 21figures.) (SLD)
Reproductions supplied by EDRS are the best that can be madefrom the original document.

,c) NATIONAL CENTER FOR EDUCATION STATISTICS
LOCD
OO2
User's Manual January 1994
Schools and Staffing Survey
1990 -91 Schools and StaffingSurvey: Data File User'sManualVolume I: Survey Documentation
SASS
U.S. DEPARTMENT OF EDUCATIONOffice of Educational Research and Improvement
EDUCATIONAL RESOURCES INFORMATIONCENTER (ERIC)
This document has been reproduced asreceived from the person or organizationoriginating it.
Minor changes have been made toimprove reproduction quality.
Points of view or opinions stated in thisdocument do not necessarily representofficial OERI position or policy.
BEST COPY AVAILABLE
U.S. Department of EducationOffice of Educational Research and Improvement NCES 93-144-I

NATIONAL CENTE=a FOR EDUCATION STATISTICS
User's Manual January 1994
Schools and Staffing Survey
1990-91 Schools and StaffingSure y: Data File User'sManualVolume I: Survey Documentation
SASS
Kerry J. GruberElementary/Secondary Education Statistics Division
Carol L. RohrPinkerton Computer Consultants, Inc.
Sharon E. FondelierBureau of the Census
epartment of EducationOffice of Educational Research and Improvement NCES 93 -144 -I
3

U.S. Department of EducationRichard W. RileySecretary
Office of Educational Research and ImprovementSharon P. RobinsonAssistant Secretary
National Center for Education StatisticsEmerson J. ElliottCommissioner
National Center for Education Statistics
"The purpose of the Center shall be to collect, and analyze,and disseminate statistics and other data related toeducation in the United States and in othernations."Section 406(b) of the General EducationProvisions Act, as amended (20 U.S.C. 1221e-1).
January 1994
Contact:Kerry J. Gruber(202) 219-1370
4

111
Preface
This set of volumes is intended to document the data collection of the 1990-91 Schoolsand Staffing Surveys (SASS) and is intended for several types of readers. Researchers readyto access the datafile may choose to go directly to the Codebooks for each survey (Volumes IIand III, for the Restricted-Use Version and the Public-Use Version, respectively), whichcontain the layout and descriptive information on all survey and sampling variables.
Persons wishing to ascertain whether their research needs can be served by SASS datamay find the Overview useful with descriptions of the survey's contents and objectives.
Finally, for those interested in the design and methodology of each SASS component, thereare chapters on Sample Design and Implementation, Data Collection, Edit Procedures, andImputation.
We are interested in your reaction to the information presented here about the Schoolsand Staffing Survey data collection system as well as the microdata files we release. Wewelcome your recommendations for improving our survey work and data products. If youhave suggestions or comments or want more information, please contact:
SASS DatatapesSpecial Surveys and Analysis BranchElementary and Secondary Education Statistics DivisionNational Center for Education StatisticsOffice of Educational Research and Improvement555 New Jersey Avenue, NWWashington, DC 20208-5651
We are also interested in the research you do using the SASS data sets. We would bepleased to receive copies of reports, working papers, and published articles you write, whichuse data from the SASS. Send them to the address above.
5
iv
Acknowledgments
The authors wish to thank all those who contributed to the production of the data filesand this technical document. Each of the staff members of the Special Surveys and AnalysisBranch who supervised the collection of one or more SASS components provided data tablesand careful review: Sharon Bobbitt (Teacher), Stephen Broughman (Teacher Demand andShortage), Charles Hammer (Administrator), Steven Kaufman (Sample Design andImplementation, Imputation for all components), Mary Rollefson (Teacher Demand andShortage), and Summer Whitener (Bureau of Indian Affairs Schools). Elizabeth Geraldcontributed information on the Private School Survey and data tables from a separate reporton the 1988-89 Private School Survey (the frame for the private schools). Dan Kasprzyk,SSAB Branch Chief, did extensive editing and provided overall production oversight.Technical reviewers at the National Center for Education Statistics are Marilyn McMillen(division statistical review) and Susan Ahmed (statistical standards). Frank Johnson of theGeneral Surveys and Analysis Branch provided technical help with his LOCALE code. JohnSietsema, also of GSAB, helped put together a work group to look into the issue of CCD andSASS definition differences.
The Education Surveys Branch of the Bureau of the Census, as primary data collector,prepared all data files and drafted major sections of this report and the codebooks. SarahDoherty and Lawrence McGinn, former and current Education Surveys branch chiefs,La Terri Bynum, Lenore Colaciello, Sharon Fondelier, Patrick Healy, Richard Schwartz, andthe entire Education Surveys Programming Branch headed by Howard McGowan and assistedby Stella Kim, Venancio Aguirre, Kathy Carlers, and Kenneth King, produced the computeredits, imputation scheme, and preliminary codebooks. Dennis Schwanz' branch in theDemographic Statistical Methods Division at Census provided specifications for sampleselection, decision rules for eligibility, while Pat Wilson's branch supervised fieldwork for allsampling-related aspects of all the surveys.
The earliest phase of data collection is the review of data instruments. Our thanks go to themany Reviewers on the SASS Review Board and to the Data Users' Group, who providedvaluable insight from researchers' perspectives. In addition, SSAB holds an annual PrivateSchool meeting to solicit reactions from the varied members of the Private school community.Shelley Burns and John Burkett of the Data Development Division at NCES have served oftenin reviewing data instruments and plans.
Finally, the final restricted-use and public-use datafiles and this document would not bepossible without the technical support of Pinkerton Computer Consultants, Inc.: Ross Merlin,who oversaw numerous versions of the datafiles, Hilda Lynch, general programmingexpertise, Matt Gibbs, programmer and liaison between SASS and the PSS, and Tracy Jones,formatting and printing.
6

V
TABLE OF CONTENTS
VOLUME I
Preface
Acknowledgments
I. OverviewA. Purpose of the SurveyB. Periodicity of the SurveyC. Objectives and Policy IssuesD. Target Population and EstimatesE. Survey Content
iii
iv
1
23357
II. Changes in SASS Design and Content from 1988 to 1991 9
A. Procedural Changes 10B. Design Changes 10
C. Content Changes 11
III. Preparation for the 1991 SASS 13
IV. Sample Design and Implementation 15
A. Sampling Frames 16
1. Public Schools 16
2. Bureau of Indian Affairs Schools 17
3. Private Schools 17
B. Sample Allocation 18
1. Public Schools 18
2. Bureau of Indian Affairs Schools 203. Private Schools 20
C. Overlapping 1988 and 1991 SASS Samples 211. Public Schools 21
2. Private Schools 22D. Sample Selection Procedures 22
1. Public Schools 222. Private Schools 233. Public School Districts 244. Teachers 25
V. Data Collection 29A. Time Frame of the Survey 30B. Data Collection Procedures 31
VI. Response Rates 33A. Survey Response Rates 34B. Item Response Rates 34

vi
VII. Edit Procedures 39A. Field Office Edit 40B. General Clerical Edit 40C. Computer Pre-edit 41D. Computer Edit 55E. Interview Status Edit 55
1. Teacher Demand and Shortage Survey 552. Public Schools (SASS-3A) 563. Private Schools (SASS-3B) 564. Bureau of Indian Affairs Schools (SASS-3C) 575. Public and Private School Administrators (SASS-2A and 2B) . . . 586. Public and Private School Teachers (SASS-4A and 4B) 58
F. Post Processing Edit 59G. Race/ethnicity Edit 62
VIII. Imputation Procedures 71A. Teacher Demand and Shortage Survey (SASS-1A) 72
1. First Stage 722. Second Stage 73
B. Public and Private School Administrators (SASS-2A and 2B) 741. First Stage 742. Second Stage 74
C. Public Schools (SASS-3A) 751. First Stage 752. Second Stage 75
D. Private Schools (SASS-3B) 761. First stage 762. Second stage 76
E. Bureau of Indian Affairs Schools (SASS-3C) 77F. Public and Private School Teachers (SASS-4A and 4B) 77
1. First stage 772. Second stage 78
G. Imputation Flags 78
IX. Weighting 97A. School Weight (SASS Questionnaire Forms 3A, 3B, and 3C) 98B. School Weighting Adjustment Cells 99
1. Public School Adjustment Cells 992. Private School Adjustment Cells 99
C. Administrator Weight (SASS Questionnaire Forms 2A and 2B) 100D. Teacher Demand and Shortage for Public Districts (SASS Questionnaire
Form 1A) 100E. Local Education Agency (LEA) Basic Weights 101
1. LEAs with Schools 1012. LEAs Without Schools 1023. LEA Basic Weights for Delaware, Nevada and West Virginia . . 102

vii
F. Teacher Weights (SASS Questionnaire Forms 4A and 4B) 1021. Public Adjustment Cells 1042. Private Adjustment Cells 104
X. Variance Estimation 107A. Replicate Assignment 108
1. Replicates: Public Schools 1082. Replicates: Private Schools 1093. Replicates: Treatment of the Overlap Sample 1094. Replicates: Administrators 1095. Replicates: Teachers 1096. Replicates: Local Education Agencies 109
B. Replicate Weights 110
XI. Reinterview Program 111
XII. Reviewing the Quality of SASS Data 115
A. Teacher Demand and Shortage Questionnaire for Public School Districts(SASS-1A) 117
B. School Administrator Questionnaires (SASS-2A and 2B) 127C. School Questionnaires (SASS-3A and 3B) 127D. Teacher Questionnaires (SASS-4A and 4B) 132
XIII. Cautions Concerning the Measurement of Change Estimates using 1987-88and 1990-91 SASS 135
XIV. Confidentiality Protection Measures 139A. Public-Use Files 140B. Restricted-Use Files 141
C. File Linkage 142D. Treatment of BIA Schools 142
XV. Created Variables 145
A. Variables Added to the Datafile 146B. Analysis Variables Used in NCES Publications 149
XVI. User Notes 151
APPENDICES
Appendix A. Definitions A-1
Appendix B. Crosswalk between items in the 1987-88 and 1990-91 SASS B-1Teacher Demand and Shortage Questionnaire B-1Public School Administrator Questionnaire B-8Private School Administrator Questionnaire B-11
9
Public School Questionnaire B-14Private School Questionnaire B-21Public School Teacher Questionnaire B-28Private School Teacher Questionnaire B-35
Appendix C. Crosswalk of codes for teachers' major field of study C-1
Appendix D. SAS Variable List D-1Teacher Demand and Shortage Survey, Public and Private School Surveys . D-1Public and Private School Administrator Surveys D-20Public and Private School Teacher Surveys D-28
Appendix E. Selected Unweighted and Weighted Tables E-1Teacher Demand and Shortage Survey E-3Public School Administrator Survey E-13Private School Administrator Survey E-33Public School Survey E-49Private School Survey E-69Public School Teacher Survey E-73Private School Teacher Survey E-85
Appendix F. Questionnaires F-1Teacher Demand and Shortage Questionnaire (SASS 1A) F-3Public School Administrator Questionnaire (SASS 2A) F-17Private School Administrator Questionnaire (SASS 2B) F-27Public School Questionnaire (SASS 3A) F-37Private School Questionnaire (SASS 3B) F-53Public School Teacher Questionnaire (SASS 4A) F-77Private School Teacher Questionnaire (SASS 4B) F-103
Appendix G. Industry and Occupation Codes G-1
VOLUME II
RESTRICTED-USE CODEBOOKS
Preface to Volume II iii
I. Created Variables xiA. Variables Added to the Datafile xiiB. Analysis Variables Used in NCES Publications xv
II. User Notes xvii
Appendix H. Teacher Demand and Shortage (SASS 1A), Public and Private School(SASS 3A and 3B) Codebook H-1
10

Appendix I. Public and Private School Administrator (SASS 2A and 2B)Codebook I-1
Appendix J. Public and Private School Teacher (SASS 4A and 4B) Codebook J-1
VOLUME HI
PUBLIC-USE CODEBOOKS
Appendix K. Teacher Demand and Shortage (SASS 1A), Section A (Enrollmentand Teaching Positions) Codebook K-1
Appendix L. Public and Private School (SASS 3A and 3B), Teacher Demand andShortage (SASS 1A), Section B (District Policies) Codebook L-1
Appendix M. Public and Private School Administrator (SASS 2A and 2B)Codebook M-1
Appendix N. Public and Private School Teacher (SASS 4A and 4B) Codebook N-1
i if
x
List of Tables
Table Page
IV-1 Sample allocation for both public and private schools, and administratorsand public districts 19
IV-2 Average number of new and experienced teachers selected per school byschool level and sector 26
IV-3 Number of selected teachers in SASS sample by teacher type and sector . . . 27
V-1 Data collection time schedule 30
VI-1 Unweighted and final weighted response rates by state for public districts,administrators, schools and teachers 35
VI-2 Unweighted and final weighted response rates by typology for private schools 36
VI-3 Unweighted and final weighted response rates, by sampled association forprivate administrators and schools 37
VI-4 Unweighted and final weighted response rates for private administrators,schools, and teachers, by private school affiliation 38
VI-5 Item with response rates less than 75 percent 38
VII-1 Reasons for pre-edit rejection of questionnaires 42
VII-2 The number of changes to item response categories by source code betweenthe preliminary file and pre-edit file for Teacher Demand and ShortageQuestionnaire 43
VII-3 Number of changes to item response categories by source code betweenthe preliminary file and the pre-edit file for Public School AdministratorQuestionnaire 44
VII-4 Number of changes to item response categories by source code betweenthe preliminary file and the pre-edit file for Private School AdministratorQuestionnaire 45
VII-5 Number of changes to item response categories by source code betweenthe preliminary file and the pre-edit file for Public School Questionnaire . 46
VII-6 Number of changes to item response categories by source code betweenthe preliminary file and the pre-edit file for Private School Questionnaire 47
12

xi
Table Page
VII-7 Number of changes to item response categories by source code betweenthe preliminary file and the pre-edit file for Indian School Questionnaire . 49
VII-8 Number of changes to item response categories by source code betweenthe preliminary file and the pre-edit file for Public School. TeachersQuestionnaire 51
VII-9 Number of changes to item response categories by source code betweenthe preliminary file and the pre-edit file for Private School TeacherQuestionnaire 53
VII-10 Estimated number of schools by state compared with 1990-91 Common Coreof Data after post processing edit 65
VII-11 Estimated number of teacher (FTEs) by state compared with 1990-91Common Core of Data after post processing edit 67
VII-12 Comparison of 1990-91 Schools and Staffing Survey and 1990-91 CommonCore of Data enrollment 69
XII-1 Estimated number of districts by state compared with number of districtsreported on 1988-89 Common Core of Data 121
XII-2 Estimated number of FTE teachers by state compared with 1990-91 CommonCore of Data 123
XII-3 Estimated enrollment by state compared with 1990-91 Common Core of Data 125
XII-4 Estimated number of public schools by state compared with 1990-91 CommonCore of Data 129
XII-5 Number of private schools, K-12 students, and K-12 teachers by school type1989-90 Private School Survey (PSS) frame to 1990-91 SASS comparison . . 131
XII-6 Estimated number of teachers (FTEs) by state compared with 1990-91Common Core of Data 133
Teacher Demand and Shortage Survey Selected Unweighted and Weighted Tables
E-1 Unweighted number of districts by enrollment and by state: 1990-91 E-4
E-2 Weighted number of districts by enrollment and by state: 1990-91 E-6
E-3 Unweighted number of FTE K-12 teaching positions by region: 1990-91 . E-8
.1 3
xii
Table Page
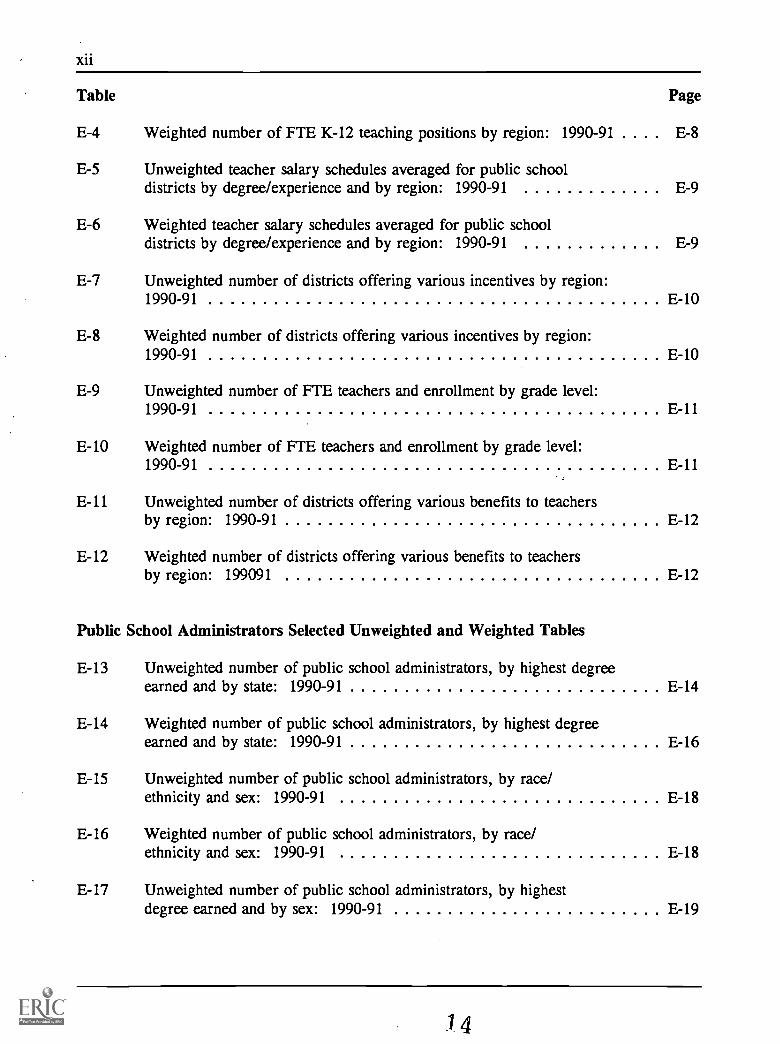
E-4 Weighted number of FTE K-12 teaching positions by region: 1990-91 . E-8
E-5 Unweighted teacher salary schedules averaged for public schooldistricts by degree/experience and by region: 1990-91 E-9
E-6 Weighted teacher salary schedules averaged for public schooldistricts by degree/experience and by region: 1990-91 E-9
E-7 Unweighted number of districts offering various incentives by region:1990-91 E-10
E-8 Weighted number of districts offering various incentives by region:1990-91 E-10
E-9 Unweighted number of FTE teachers and enrollment by grade level:1990-91 E-11
E-10 Weighted number of FTE teachers and enrollment by grade level:1990-91 E-11
E-11 Unweighted number of districts offering various benefits to teachersby region: 1990-91 E-12
E-12 Weighted number of districts offering various benefits to teachersby region: 199091 E-12
Public School Administrators Selected Unweighted and Weighted Tables
E-13 Unweighted number of public school administrators, by highest degreeearned and by state: 1990-91 E-14
E-14 Weighted number of public school administrators, by highest degreeearned and by state: 1990-91 E-16
E-15 Unweighted number of public school administrators, by race/ethnicity and sex: 1990-91 E-18
E-16 Weighted number of public school administrators, by race/ethnicity and sex: 1990-91 E-18
E-17 Unweighted number of public school administrators, by highestdegree earned and by sex: 1990-91 E-19
14

xiii
Table Page
E-18 Weighted number of public school administrators, by highestdegree earned and by sex: 1990-91 E-19
E-19 Unweighted number of public school administrators, by annualsalary and by sex: 1990-91 E-20
E-20 Weighted number of public school administrators, by annualsalary and by sex: 1990-91 E-20
E-21 Unweighted number of public school administrators, by years asa principal and by sex: 1990-91 E-21
E-22 Weighted number of public school administrators, by years asa principal and by sex: 1990-91 E-21
E-23 Unweighted number of public school administrators, by age andby sex: 1990-91 E-22
E-24 Weighted number of public school administrators, by age andby sex: 1990-91 E-22
E-25 Unweighted number of public school administrators, by highestdegree earned and by race/ethnicity: 1990-91 E-23
E-26 Weighted number of public school administrators, by highestdegree earned and by race/ethnicity: 1990-91 E-23
E-27 Unweighted number of public school administrators, by annualsalary and by race/ethnicity: 1990-91 E-24
E-28 Weighted number of public school administrators, by annualsalary and by race/ethnicity: 1990-91 E-24
E-29 Unweighted number of public school administrators, by years as aprincipal and by race/ethnicity: 1990-91 E-25
E-30 Weighted number of public school administrators, by years as aprincipal and by race/ethnicity: 1990-91 E-25
E-31 Unweighted number of public school administrators, by age and byrace/ethnicity: 1990-91 E-26
E-32 Weighted number of public school administrators, by age and byrace/ethnicity: 1990-91 E-26
1 5

xiv
Table Page
E-33 Unweighted number of public school administrators, by annual salaryand by highest degree earned: 1990-91 E-27
E-34 Weighted number of public school administrators, by annual salaryand by highest degree earned: 1990-91 E-27
E-35 Unweighted number of public school administrators, by years as aprincipal and by highest degree earned: 1990-91 E-28
E-36 Weighted number of public school administrators, by years as aprincipal and by highest degree earned: 1990-91 E-28
E-37 Unweighted number of public school administrators, by age andby highest degree earned: 1990-91 E-29
E-38 Weighted number of public school administrators, by age andby highest degree earned: 1990-91 E-29
E-39 Unweighted number of public school administrators, by years as aprincipal and by annual salary: 1990-91 E-30
E-40 Weighted number of public school administrators, by years as aprincipal and by annual salary: 1990-91 E-30
E-41 Unweighted number of public school administrators, by age andby annual salary: 1990-91 E-31
E-42 Weighted number of public school administrators, by age andby annual salary: 1990-91 E-31
Private School Administrators Selected Unweighted and Weighted Tables
E-43 Unweighted number of private school administrators, by race/ethnicity and sex: 1990-91 E-34
E-44 Weighted number of private school administrators, by race/ethnicity and sex: 1990-91 E-34
E-45 Unweighted number of private school administrators, by highestdegree earned and by sex: 1990-91 E-35
E-46 Weighted number of private school administrators, by highestdegree earned and by sex: 1990-91 E-35
1.6
xv
Table Page
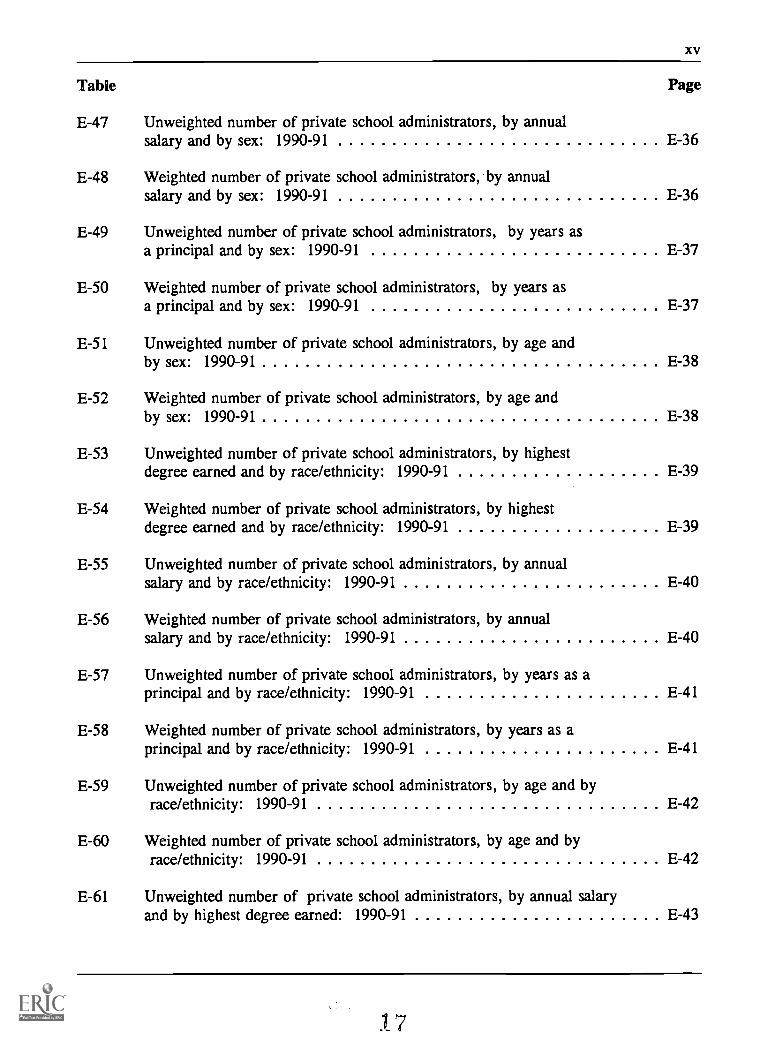
E-47 Unweighted number of private school administrators, by annualsalary and by sex: 1990-91 E-36
E-48 Weighted number of private school administrators, by annualsalary and by sex: 1990-91 E-36
E-49 Unweighted number of private school administrators, by years asa principal and by sex: 1990-91 E-37
E-50 Weighted number of private school administrators, by years asa principal and by sex: 1990-91 E-37
E-51 Unweighted number of private school administrators, by age andby sex: 1990-91 E-38
E-52 Weighted number of private school administrators, by age andby sex: 1990-91 E-38
E-53 Unweighted number of private school administrators, by highestdegree earned and by race/ethnicity: 1990-91 E-39
E-54 Weighted number of private school administrators, by highestdegree earned and by race/ethnicity: 1990-91 E-39
E-55 Unweighted number of private school administrators, by annualsalary and by race/ethnicity: 1990-91 E-40
E-56 Weighted number of private school administrators, by annualsalary and by race/ethnicity: 1990-91 E-40
E-57 Unweighted number of private school administrators, by years as aprincipal and by race/ethnicity: 1990-91 E-41
E-58 Weighted number of private school administrators, by years as aprincipal and by race/ethnicity: 1990-91 E-41
E-59 Unweighted number of private school administrators, by age and byrace/ethnicity: 1990-91 E-42
E-60 Weighted number of private school administrators, by age and byrace/ethnicity: 1990-91 E-42
E-61 Unweighted number of private school administrators, by annual salaryand by highest degree earned: 1990-91 E-43
17

xvi
Table Page
E-62 Weighted number of private school administrators, by annual salaryand by highest degree earned: 1990-91 E-43
E-63 Unweighted number of private school administrators, by years as aprincipal and by highest degree earned: 1990-91 E-44
E-64 Weighted number of private school administrators, by years as aprincipal and by highest degree earned: 1990-91 E-44
E-65 Unweighted number of private school administrators, by age andby highest degree earned: 1990-91 E-45
E-66 Weighted number of private school administrators, by age andby highest degree earned: 1990-91 E-45
E-67 Unweighted number of private school administrators, by years as aprincipal and by annual salary: 1990-91 E-46
E-68 Weighted number of private school administrators, by years as aprincipal and by annual salary: 1990-91 E-46
E-69 Unweighted number of private school administrators, by age and byannual salary: 1990-91 E-47
E-70 Weighted number of private school administrators, by age and byannual salary: 1990-91 E-48
Public Schools Selected Unweighted and Weighted Tables
E-71 Unweighted number of public K-12 teachers by level: 1990-91 E-50
E-72 Weighted number of public K-12 teachers by level: 1990-91 E-50
E-73 Unweighted number of public schools, students, and K-12 teachersby state: 1990-91 E-51
E-74 Weighted number of public schools, students, and K-12 teachersby state: 1990-91 E-52
E-75 Unweighted number of public schools offering a particular programor service, by state: 1990-91 E-53
E-76 Weighted number of public schools offering a particular programor service, by state: 1990-91 E-55
18

xvii
Table Page
E-77 Unweighted number of public school students participating in aparticular program or service, by state: 1990-91 E-57
E-78 Weighted number of public school students participating in aparticular program or service, by state: 1990-91 E-59
E-79 Unweighted number of public schools and students receiving publiclyfunded Chapter 1 services, and free or reduced-price lunch, by state:1990-91 E-61
E-80 Weighted number of public schools and students receiving publiclyfunded Chapter 1 services, and free or reduced-price lunch, by state:1990-91 E-63
E-81 Unweighted number of public high schools with 12th grade students,graduation rate and college application rate of 1989-90 seniors, bystate: 1990-91 E-65
E-82 Weighted number of public high schools with 12th grade students,graduation rate and college application rate of 1989-90 seniors, bystate: 1990-91 E-67
Private Schools Selected Unweighted and Weighted Tables
E-83 Unweighted number of private K-12 teachers by level: 1990-91 E-70
E-84 Weighted number of private K-12 teachers by level: 1990-91 E-70
E-85 Unweighted number of private schools, students, and K-12 teachersby private school type: 1990-91 E-71
E-86 Weighted number of private schools, students, and K-12 teachersby private school type: 1990-91 E-71
Public School Teachers Unweighted and Weighted Tables
E-87 Unweighted number of elementary public school teachers, byemployment status and teacher type: 1990-91 E-74
E-88 Weighted number of elementary public school teachers, byemployment status and teacher type: 1990-91 E-74
19
xviii
Table Page
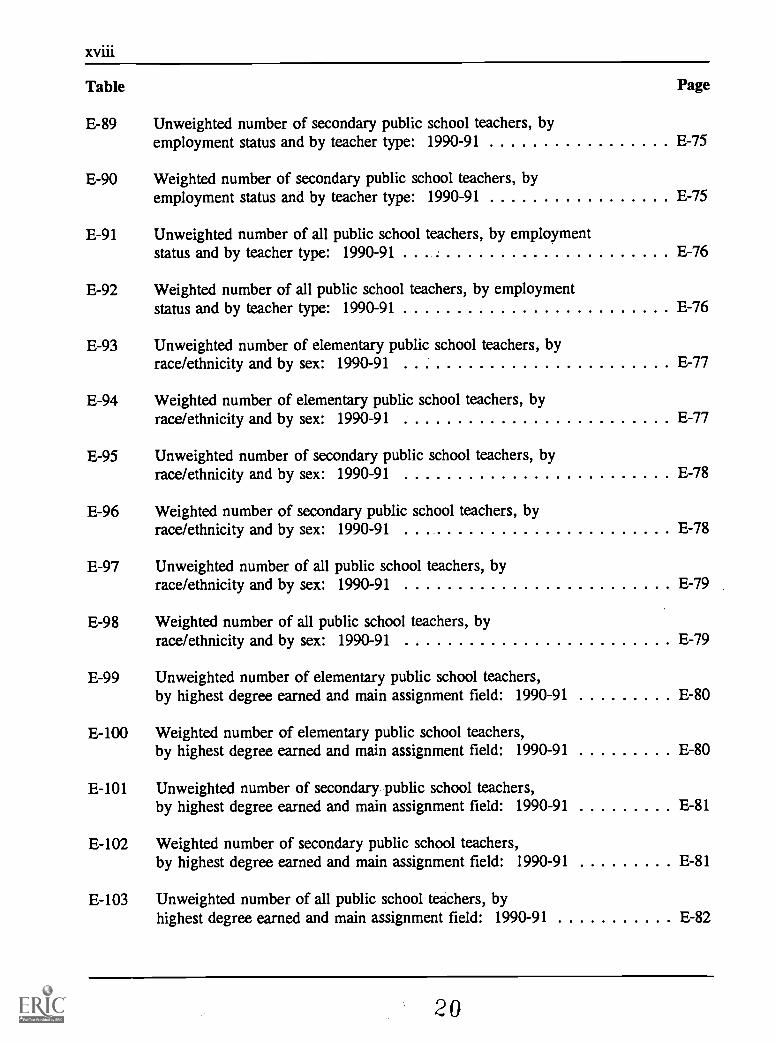
E-89 Unweighted number of secondary public school teachers, byemployment status and by teacher type: 1990-91 E-75
E-90 Weighted number of secondary public school teachers, byemployment status and by teacher type: 1990-91 E-75
E-91 Unweighted number of all public school teachers, by employmentstatus and by teacher type: 1990-91 E-76
E-92 Weighted number of all public school teachers, by employmentstatus and by teacher type: 1990-91 E-76
E-93 Unweighted number of elementary public school teachers, byrace/ethnicity and by sex: 1990-91 E-77
E-94 Weighted number of elementary public school teachers, byrace/ethnicity and by sex: 1990-91 E-77
E-95 Unweighted number of secondary public school teachers, byrace/ethnicity and by sex: 1990-91 E-78
E-96 Weighted number of secondary public school teachers, byrace/ethnicity and by sex: 1990-91 E-78
E-97 Unweighted number of all public school teachers, byrace/ethnicity and by sex: 1990-91 E-79
E-98 Weighted number of all public school teachers, byrace/ethnicity and by sex: 1990-91 E-79
E-99 Unweighted number of elementary public school teachers,by highest degree earned and main assignment field: 1990-91 E-80
E-100 Weighted number of elementary public school teachers,by highest degree earned and main assignment field: 1990-91 E-80
E-101 Unweighted number of secondary public school teachers,by highest degree earned and main assignment field: 1990-91 E-81
E-102 Weighted number of secondary public school teachers,by highest degree earned and main assignment field: 1990-91 E-81
E-103 Unweighted number of all public school teachers, byhighest degree earned and main assignment field: 1990-91 E-82
20

xix
Table Page
E-104 Weighted number of all public school teachers, byhighest degree earned and main assignment field: 1990-91 E-82
E-105 Unweighted number of public school teachers, by leveland by teaching experience: 1990-91 E-83
E-106 Weighted number of public school teachers, by leveland by teaching experience: 1990-91 E-83
Private School Teachers Selected Unweighted and Weighted Tables
E-107 Unweighted number of elementary private school teachers, byemployment status and teacher type: 1990-91 E-86
E-108 Weighted number of elementary private school teachers, byemployment status and teacher type: 1990-91 E-86
E-109 Unweighted number of secondary private school teachers, byemployment status and by teacher type: 1990-91 E-87
E-110 Weighted number of secondary private school teachers, byemployment status and by teacher type: 1990-91 E-87
E-111 Unweighted number of all private school teachers, by employmentstatus and by teacher type: 1990-91 E-88
E-112 Weighted number of all private school teachers, by employmentstatus and by teacher type: 1990-91 E-88
E-113 Unweighted number of elementary private school teachers, byrace/ethnicity and by sex: 1990-91 E-89
E-114 Weighted number of elementary private school teachers, byrace/ethnicity and by sex: 1990-91 E-89
E-115 Unweighted number of secondary private school teachers, byrace/ethnicity and by sex: 1990-91 E-90
E-116 Weighted number of secondary private school teachers, byrace/ethnicity and by sex: 1990-91 E-90
E-117 Unweighted number of all private school teachers, byrace/ethnicity and by sex: 1990-91 E-91
21
xx
Table Page
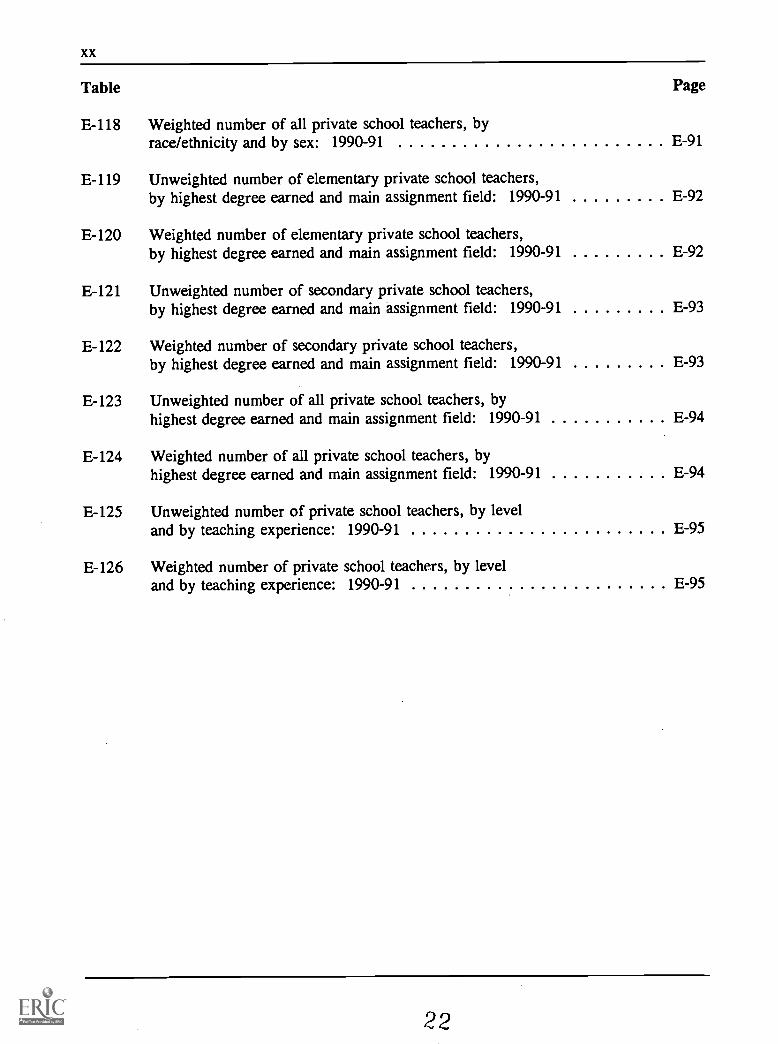
E-118 Weighted number of all private school teachers, byrace/ethnicity and by sex: 1990-91 E-91
E-119 Unweighted number of elementary private school teachers,by highest degree earned and main assignment field: 1990-91 E-92
E-120 Weighted number of elementary private school teachers,by highest degree earned and main assignment field: 1990-91 E-92
E-121 Unweighted number of secondary private school teachers,by highest degree earned and main assignment field: 1990-91 E-93
E-122 Weighted number of secondary private school teachers,by highest degree earned and main assignment field: 1990-91 E-93
E-123 Unweighted number of all private school teachers, byhighest degree earned and main assignment field: 1990-91 E-94
E-124 Weighted number of all private school teachers, byhighest degree earned and main assignment field: 1990-91 E-94
E-125 Unweighted number of private school teachers, by leveland by teaching experience: 1990-91 E-95
E-126 Weighted number of private school teachers, by leveland by teaching experience: 1990-91 E-95
22
xxi
List of Figures
Figure Page
VIII -1 Teacher Demand and Shortage (SASS-1A) items imputed using other dataon the Teacher Demand and Shortage record 79
VIII -2 Teacher Demand and Shortage (SASS-1A) imputation variables 80
VIII-3 Teacher Demand and Shortage (SASS-1A) matching variables andcollapse order 81
VIII -4 Teacher Demand and Shortage (SASS-1A) matching variables andcollapse order 81
VIII-5 School Administrator (SASS-2A/2B) imputation variables 82
VIII -6 School Administrator (SASS-2A) matching variables and collapse order 84
VIII -7 Private School Administrator (SASS-2B) matching variables and collapseorder 85
VIII -8 Public School (SASS-3A) items imputed using the Teacher Demand andShortage (SASS-1A) record 85
VIII -9 Public School (SASS-3A) imputation variables 86
VIII-10 Public School (SASS-3A) matching variables and collapse ordering 87
VIII-11 Public School (SASS-3A) matching variables and collapse ordering 87
VIII-12 Public School (SASS-3A) matching variables and collapse ordering 87
VIII-13 Private School (SASS-3B) imputation variables 88
VIII-14 Private School (SASS-3B) matching variables and collapse ordering 90
VIII-15 Private School (SASS-3B) matching variables and collapse ordering 91
VIII-16 Private School (SASS-3B) matching variables and collapse ordering 91
VIII-17 Private School (SASS-3B) matching variables and collapse ordering 91
VIII-18 Teacher (SASS-4A/4B) imputation variables 92
VIII-19 Teacher (SASS-4A/4B) matching variables and collapse ordering 95
23

Figure Page
VIII-20 Teacher (SASS-4A/4B) matching variables and collapse ordering 96
XI-1 Number of questions in SASS reinterview, by level of inconsistency,questionnaire and mode 113
24
1
I. Overview

2 1990-91 SASS Data File Users' Manual
I. Overview
A. Purpose of the Survey
In the early 1980s, education policymakers became increasingly aware of the need forstudies providing nationally representative data on public and private schools, their programs,teachers, and their staffing levels. Such data would inform policymakers about the status ofteaching and education and identify the features of schooling they wanted to improve. Inaddition, such data would clarify conflicting reports on issues vital to policy initiatives, suchas teacher shortages.
The first attempt to address these concerns was a series of surveys that began in 1983.These surveys included:
The Survey of Teacher Demand and Shortage, conducted in 1983-84 amongpublic and private schools, which included questions on teacher demand andincentive plans.
The Public School SurveySchool Questionnaire, conducted in 1984-85, toprovide descriptive information about public schools, use of teacher incentiveplans, volunteers and computers.
The National Survey of Private Schools-- School Questionnaire, conducted in1985-86, to provide parallel information about private schools.
The Public School Survey--Teacher Questionnaire, conducted in 1984-85, toprovide information about teacher characteristics, qualifications, incentives, andopinions concerning policy issues.
The National Survey of Private SchoolsTeacher Questionnaire, conductedin 1985-1986, to provide parallel information about private school teachers.
In 1985, the National Center for Education Statistics (NCES) initiated the redesign ofits elementary/secondary data system, soliciting advice from the education policy and researchcommunity on matters of context, methodology and analytic utility. In late 1985, NCESbegan addressing some of the identified problems under the heading of "Excellence in SchoolsSurveys and Analysis Study" (later renamed the Schools and Staffing Surveys Project). Ininitiating the study, the NCES expanded the purposes of the earlier surveys. In part, theseexpansions were responses to increasing and conflicting reports of teacher shortages andincreasing activity on the part of state and local policymakers to respond to concerns aboutthe status of teaching and schools in general. The study also incorporated a more generalawareness of the paucity of information on schooling that policymakers were seeking tochange.
Under contract with the Rand Corporation, these surveys were redesigned to collectinformation relevant to their expanded purposes and to correct the methodological difficultiesaffecting the surveys. The outcome of this effort was a set of concurrent and integrated
26
Overview
surveys designed to provide a composite national snapshot of America's public and privateschools. Also, in order to increase response rates and to maintain consistency in proceduresacross components of the survey, NCES selected the Bureau of the Census to collect andprocess the data for all parts of the survey.
The Schools and Staffing Survey (SASS) was first conducted by the Bureau of theCensus during the 1987-88 school year; and again in 1990-91. The 1990-91 SASS samplewas expanded to include schools operated by the Bureau of Indian Affairs (BIA), tribally-runIndian schools, and public schools with a high concentration of American Indian students(schools with at least 25% American Indian students).
SASS provides data on public and private schools, teachers, and administrators, and isused by educators, researchers, and policymakers. The survey includes several types ofrespondents: school district personnel, public school principals, private school heads, publicschool teachers, and private school teachers.
B. Periodicity of the Survey
The first two rounds of SASS were conducted three years apart, and all future roundsare planned at 3-year intervals.
C. Objectives and Policy Issues
The objective of SASS is to provide information on teacher supply and demand,characteristics of the elementary and secondary teaching force, teacher workplace conditions,characteristics of school administrators, and school programs and policies. The SASS hasfive components:
a. Teacher Demand and Shortage Survey For Public School Districts(Questionnaire Form SASS-1A)
The Teacher Demand and Shortage Survey obtains information about studentenrollment, number of teachers, position vacancies, new hires, teachers'salaries and incentives, and hiring and retirement policies from public localeducation agencies (LEAs). These data permit an assessment of teacher supplyand demand. For example, are new hires as likely to be as certified aspreviously employed teachers? To what extent is the demand for teachers met?The teacher supply and demand area also explores the policy conditions andinitiatives influencing teacher supply and demand.
b. Public School Administrator Survey (Questionnaire Form SASS-2A) andPrivate School Administrator Survey (Questionnaire Form SASS-2B)
The School Administrator Survey obtains information about the training,experience, professional background, and job activities of school
27
4 1990-91 SASS Data File Users' Manual
principals/heads. These data provide insights about the education andexperience of the nation's school administrators, about the teachers who leavethe classroom for the administrative field, about school problems administratorsview as serious, and how administrators perceive their influence on schoolpolicies.
c. Public School Survey (Questionnaire Form SASS-3A)Private School Survey (Questionnaire Form SASS-3B)Indian School Survey (Questionnaire Form SASS-3C)
These surveys provide data about school programs and policies, enrollment bygrade, student demographic characteristics, staffing patterns, and teacherturnover. The questionnaires also provide measures of school type, teachingload, teachers' experience, length of school day and year, community size,tuition, admissions requirements, teacher demographic characteristics, numberof teachers with advanced degrees, number of students graduated, collegeapplication rates, use of volunteers.
In addition, because there are no comparable school districts, the PrivateSchool questionnaire and the Indian School questionnaire combine the PublicSchool questionnaire items and the Teacher Demand and Shortage items whichare collected at the District level for public schools (teaching positionvacancies, new hires, teacher salaries, and hiring and retirement policies).
d. Public School Teacher Survey (Questionnaire Form SASS-4A) and PrivateSchool Teacher Survey (Questionnaire Form SASS-4B)
The Teacher Survey collects data about teachers' education and training,teaching assignments, teaching experience, certification, teaching workload,perceptions and attitudes about teaching, job mobility, and workplaceconditions. This information permits analyses of the relationships of thesefactors in the teaching profession, and their effects on movement in and out ofthe teaching profession.
e. The Teacher Follow-up Survey
The Teacher Follow-up Survey is a subsample of teachers in the profession.The subsample has two parts, "leavers" and "stayers". The Teacher Follow-upSurvey is a followup of teachers in the SASS teacher sample who left theteaching profession within one year after the administration of the SASS(leavers) and a subsample of those who remained in the teaching profession(stayers). It was first administered in 1988-89, one year after the 1987-88SASS, and was repeated in 1991-92, one year after the 1990-91 SASS. Themajor objectives of this survey are to determine the attrition rate for teachers;determine the characteristics of those who stay in the teaching profession andthose who leave; obtain major activity or occupation data for those who leavethe teaching profession and career patterns for those who remain in the
28

Overview 5
profession; obtain data on educational activities and future plans; and obtaindata on attitudes about the teaching profession and job satisfaction.
D. Target Population and Estimates
Target Populations. The target populations for 1990-91 SASS were:
Local Education Agencies (LEAs) that employ elementary and/or secondarylevel teachers (for example: public school districts, state agencies that operateschools for special student populations, such as inmates of juvenile correctionalfacilities, and cooperative agencies that provide special services to more thanone school district).
Public and private schools with students in any of grades 1-12.
Principals of those schools.
Teachers in public and private schools who teach students in grades K-12.
The 1988-89 Common Core of Data (CCD) served as the sampling frame for thepublic schools. The population of public schools was drawn from the frame population forthe 1988-89 school year. For each school in sample, the LEA reported as having jurisdictionover the school was also selected.
The population of private schools also included only schools that existed during the1988-89 school year. The sample was drawn from the schools used for the 1989-90 PrivateSchools Survey (see section IV, "Sample Design and Implementation," for a description ofthat operation).
The population of teachers included teachers who were employed by the public andprivate schools described above during the fall of 1990. The sample of teachers was selectedfrom a list of all teachers who taught students in grades K-12 for each school in sample.Teachers who were teaching in BIA schools were also included in the public school teacherpopulation.
Estimates. The SASS was designed to support estimates at both the state and nationallevel for the public sector, and at the national and association level for the private sector.The association groups for private schools were:
(1) Military membership in the Association of American Military Colleges andSchools;
(2) Catholic affiliation as Catholic or membership in the National CatholicEducation Association or the Jesuit Secondary Education Association;
(3) Friends - affiliation as Friends or membership in the Friends Council onEducation;
2J

6 1990-91 SASS Data File Users' Manual
(4) Episcopal - affiliation as Episcopal or membership in the National Associationof Episcopal Schools association;
(5) Hebrew Day - membership in the National Society for Hebrew Day Schoolsassociation;
(6) Solomon Schechter - membership in the Solomon Schechter Day Schools;(7) other Jewish other Jewish affiliation;(8) Missouri Synod membership in the Lutheran Church, Missouri Synod school
association;(9) Wisconsin Synod - membership in the Evangelical Lutheran Church -
Wisconsin Synod school association or affiliation as Evangelical LutheranWisconsin Synod;
(10) Evangelical Lutheran membership in the Association of Evangelical LutheranChurches school association or affiliation, as Evangelical Lutheran Church inAmerica;
(11) other Lutheran - other Lutheran affiliation;(12) Seventh-Day Adventist - affiliation as Seventh-Day Adventist or membership in
the General Conference of Seventh-Day Adventists;(13) Christian Schools International membership in Christian Schools International;(14) Association of Christian Schools International membership in the Association
of Christian Schools International;(15) National Association of Private Schools for Exceptional Children membership
in the National Association of Private Schools for Exceptional Children;(16) Montessori membership in the American Montessori Society or other
Montessori associations;(17) National Association of Independent Schools member of the National
Association of Independent Schools;(18) all else member of any other association specified in the PSS or affiliated
with a group not listed above or not a member of any association.
Comparisons between public and private schools are only possible at the nationallevel, because private schools are selected for sampling by association group and not bygeographic location, such as state.
Due to measures taken to protect the confidentiality of individual schools, state namesare not available on the public-use data tapes, and affiliation identification for private schoolshas been recoded to a 9-level typology. Therefore, estimates from the public-use tapes willbe possible for the 9-level typology for the private sector, and only for Census region for thepublic sector. The exception to this rule is the Teacher Demand and Shortage (TDS) datatape, where each LEA's PIPS state code and Census region designation have been left on thetape for analysis, but the piece that has this information is not linkable to the pieces on thepublic use tape. (Some detailed affiliation codes have been deleted from or collapsed on thepublic-use data tapes to protect the confidentiality of individual responses.)
The teacher survey was designed to support comparisons between new andexperienced teachers. Comparisons between bilingual and nonbilingual teachers are possibleat the national level.
30
Overview 7
E. Survey Content
The SASS consists of four separate surveys administered simultaneously to linkedsamples of respondents. These surveys are the Teacher Demand and Shortage Survey, theSchool Administrator Survey, the School Survey, and the Teacher Survey. The TeacherFollowup Survey (TFS), conducted a year after the SASS, follows up on information obtainedthrough the Teacher Survey and provides additional information about job mobility within theteaching profession, as well as between teaching and other careers.
® The Teacher Demand and Shortage Survey questionnaire has two sections,enrollment and teaching positions and district policies. The first section, onenrollment and teaching positions, obtains information on the number ofstudents, number of teachers and librarians, position vacancies, new hires andcertification status. The second section, on district policies, obtainsinformation on teacher salaries and benefits incentives, hiring and retirementpolicies, and high school graduation requirements. Race/ethnic data on thestudent population and the teacher work force are also collected. Thecorresponding sections for private schools and Indians are incorporated into theSchool Questionnaires. The data derived from this survey estimate the numberof teachers who hold certification in their field of assignment, and the effect ofvarious policies on teacher supply and demand balances.
The School Administrator Survey obtained information about the age, sex,race/ethnicity, training, experience, salary, benefits, opinions and attitudes ofschool principals/head. Questions required both objective responses (e.g.,number of years of teaching experience) and judgmental responses (e.g.,ranking the seriousness of school problems). The data derived from this surveyprovide an insight into qualifications of school administrators, which schoolproblems administrators view as serious, and how administrators perceive theirinfluence on school policies.
Questionnaires for the School Survey were sent to public schools, Indianschools, and private schools. The private school version of the questionnaireincluded items for identifying the religious or other affiliation of the school.The private school and Indian school versions of the questionnaire alsoincorporated Teacher Demand and Shortage items on district policies. Thissurvey obtained information about schools such as student characteristics,staffing patterns, student-teacher ratios, types of programs and services offered,length of school day and school year, graduation and college application rates,and teacher turnover rates. These data provide information about the teachingexperience of the staff, the sources of newly hired teachers, and thedestinations of teachers who left the school the previous year.
Questionnaires for the Teacher Survey were sent to teachers in public andprivate schools. The two versions of the questionnaire were virtually identical.The survey collected data from teachers regarding their education and training,teaching assignment, teaching experience, certification, teaching workload,
31

8 1990-91 SASS Data File Users' Manual
perceptions and attitudes about teaching, job mobility, and workplaceconditions. This information permits analyses of how these factors affectmovement into and out of the teaching profession.
The questionnaires for the Teacher Followup Survey (TFS) were sent a yearlater to a sample of participants in the Teacher Survey. These questionnaireswere of two types: a version for participants who were still teaching, andanother version for those who had left the teaching profession. In addition toquestions about employment and teaching status and about possible sources ofdissatisfaction with teaching as a profession, the questionnaires includedquestions about family size and income. Data derived from the TFS allow forcomparative analyses of public and private school teacher job satisfaction andmovement within and out of the teaching profession.
Please refer to Appendix F for the questionnaires.
32

9
II. Changes in SASS Design and Content from 1988 to 1991
3 3

10 1990-91 SASS Data File Users' Manual
II. Changes in SASS Design and Content from 1988 to 1991
Several changes in survey procedures, design, and content were made between thecompletion of the first SASS (1987-88) and the implementation of the second SASS in schoolyear 1990-91.
A. Procedural Changes
In 1987-88, the Teacher Demand and Shortage Questionnaires went to both publicschool districts and private schools. In 1990-91, only public school districts received theTDS Questionnaire. Instead, private schools were asked questions on aggregate demand fornew and continuing teachers and school policies in their 1990-91 Private SchoolQuestionnaire.
The 1990-91 SASS included an Indian School Questionnaire sent to schools not in thepublic system that are operated by the Bureau of Indian Affairs (BIA) or by Indian tribesunder contract with the BIA. These schools traditionally have not been included in publicschool frames such as the Quality Education Data file or the Common Core of Data file.
In general, the time frame for contacting sample schools and school districts anddistributing questionnaires was a month earlier in the 1990-91 SASS (i.e., the first mailout forthe 1987-88 SASS was late January; the first mailout for the 1990-91 SASS was mid-December).
B. Design Changes
After the first SASS collection, a statistical team was set up to evaluate the 1987-88sample design and make changes where appropriate. The following paragraphs summarizethe changes made to the 1990-91 sample design.
Instead of using the Quality of Education Data (QED) as a public school frame,NCES's Common Core of Data (CCD) universe file was used. This was doneto eliminate inconsistencies between CCD and SASS estimates of schools thatresulted from differences between the QED and CCD definitions of a school.
The QED defines a school as a physical location, while the CCD defines it asan administrative unit (e.g., a consolidated school district may have a highschool meeting in two buildings at two locations but is administered as one highschool. The QED would count this as two schools, the CCD as one. Tomeasure the impact of the school definition difference on SASS schoolestimates, the 1990-91 survey was designed to produce estimates using eitherthe QED or CCD definition. The default definition was the CCD definition.
3 4
Changes in SASS Design and Content from 1988 to 1991 11
To improve the precision of the 1990-91 private sector estimates, the numberof area frame PSUs (see page 17 for a definition) was increased from 75 to123.
To increase the level of publishable detail for the public sector, the schoolsample was reallocated to produce state/elementary and state/secondaryestimates. In the 1987-88 survey, the design only supported aggregate publicsector estimates at the state level.
For the private sector, the sample was reallocated to publish five additionalassociations.
To improve the precision of SASS change estimates from 1987-88 to 1990-91,30 percent of the 1990-91 public school sample was also in sample for 1987-88. For the private school sample, associations with a high response rate alsohad a 30 percent overlap. Associations with lower response rates had smallerpercentages of school overlap. Associations with poor response rates had theschool overlap minimized.
In the 1987-88 survey, bilingual and new teachers were oversampled. In 1990-91, American Indian/Alaska Natives and Asian/Pacific Islanders as well asbilingual and new teachers were oversampled.
In the 1990-91 survey, schools with 25 percent or more American Indianenrollment were oversampled. Also, a sample 101 out of 152 of the schoolsrun by or affiliated with the Bureau of Indian Affairs was included.
In the 1987-88 survey, missing data (item nonresponse) from the Administratorand Teacher files were not imputed. In 1990-91, they were imputed. In bothsurveys, missing data from the TDS and School files were imputed.
To make the SASS estimated teacher counts from the School and Teacher filesmore consistent, the Teacher file weights were adjusted so that they equaled theSchool file headcount estimate.
C. Content Changes
In the 1990-91 SASS, the following item sets were added to each survey. For specificorder and wording changes, refer to Appendix B.
The Teacher Demand and Shortage Survey was expanded to include data ondemand and shortage of librarians and pension portability.
The School Survey was expanded to include data on types of prekindergartenand kindergarten programs offered and degree of difficulty of filling teachervacancies by teaching field.
3 5

12 1990-91 SASS Data File Users' Manual
9 The Teacher Survey was expanded to include more data on professionalactivities.
The Administrator Survey remained essentially unchanged.
Rewording a question or moving a question to another part of the questionnaire canaffect the size of the estimates. This "change" occurs because the context for responding tothe question has changed, and the question now may measure something different than it didoriginally. An example of items changing between the 1987-88 SASS and the 1990-91 SASS
is the question about student participation in a vocational or technical program. In the 1987-88 SASS, the number of students participating in a vocational program was asked in a seriesalong with student participation in various programs, such as in remedial reading or mathprograms. There was no restriction on the students' grade levels included in the 1987-88number of vocational program students. However, in the 1990-91 SASS, the vocationalprogram participation item was restricted to schools with grades 10 through 12. Thevocational program question in 1990-91 is part of a sequence of items on enrollment of theschool's students in the academic, vocational, or general high school curriculum. The twoestimates, from 1987-88 and 1990-91, are not strictly comparable and do not measure thesame group of vocational students.
36

13
III. Preparation for the 1991 SASS

14 1990-91 SASS Data File Users' Manual
HI. Preparation for the 1991 SASS
During the 1988 survey, problems were encountered with some items on thequestionnaires, e.g., counts of FIE teachers by teaching assignment on the district level formand the reporting of college courses on the teacher forms. In addition to low response ratesfor individual questions, the interview rates for some components of SASS (e.g., the TeacherDemand and Shortage Survey for Private Schools) were lower than expected.
In an effort to rectify these problems, the questionnaires were revised after the 1988survey. The major change made was replacing the two questionnaires for private schools(SASS-1B and SASS-3B) with one consolidated form. In addition, some items werereworded, some simplified and some deleted. As a further effort to increase response rates,NCES obtained the endorsement of several public and private school associations (e.g.,American Federation of Teachers, American Montessori Society, National CatholicEducational Association), and these endorsements were displayed prominently on the front ofthe questionnaires. To determine whether these changes were beneficial, the revisedquestionnaires were field tested during the 1989-90 school year. For this test, the newquestionnaires were mailed to 332 public school districts, 352 public schools and principals,398 private schools and principals, 448 public school teachers and 448 private schoolteachers.
In addition to interview rates, item response rates and other computer-generated data,NCES and Census Bureau staff reviewed all questionnaires returned during the field tests todetermine the kinds of errors respondents made in filling the forms and read all commentsrecorded by the respondents.
Because it is important to know why some questions were not answered or wereanswered incorrectly, cognitive research was done on the school and teacher questionnaires.Interviews were conducted with the principals of nine public and six private schools and withten public school teachers and ten private school teachers in the Washington, D.C., area.Trained cognitive research staff used a method in which respondents read aloud the questionson the form and then verbalized their thoughts as they decided how to answer. Theinterviews were recorded on audio tape and then summarized.
In order to stimulate the respondent to verbalize his/her thoughts in formulatinganswers to the survey questions and to elicit as much information as possible for someparticularly troublesome items, the interviewers asked probing questions such as: "You seemunsure of how to answer that question. Is there something which confuses you or seemsambiguous?"
As a result of the field test and the cognitive research, numerous changes were madeto the questionnaires (e.g., deleting the items which ask for FTE teacher counts byassignment field on the district and private school forms). The changes made to thequestionnaires between the 1988 and 1991 surveys may cause some overestimates of changebetween those school years.
33

15
IV. Sample Design and Implementation

16 1990-91 SASS Data File Users' Manual
IV. Sample Design and Implementation
A. Sampling Frames
1. Public Schools
The primary public school frame for,the 1990-91 SASS was the 1988-89 schoolyear Common Core of Data (CCD) file. The CCD is based on universe survey datacollected annually by NCES from all state education agencies, providing data fromtheir administrative records. NCES and the state education agencies workcooperatively to assure comparability between data elements reported. The CCD isbelieved to be the most complete public school listing available. The frame includesregular public schools and Department of Defense schools. Nonregular schools suchas special education, vocational or technical schools are also included in the sampleframe. Before sampling, duplicate schools and schools outside of the United Stateswere removed from the frame. Schools that only teach prekindergarten, kindergartenor adult education were also removed. A total of 83,165 schools remained on the1988-89 public school frame.
To allow data users the ability to estimate using either the CCD or QED(Quality Education Data) definition of schools, the 1990-91 SASS needed to becomparable with the 1987-88 SASS which used the QED as the public school frame.For the 1987-88 SASS the QED (sampling frame for the 1987-88 SASS) and the CCDdefined schools differently. The QED defined a school as a physical location, whilethe CCD defined it as an administrative unit (e.g., a consolidated school district mayhave a high school meeting in two buildings at two locations but is administered asone high school. The QED would count this as two schools, the CCD as one. Also,an elementary school and a high school meeting at the same location with twoprincipals would be counted as one school by the QED and as two schools by theCCD.).
The 1990-91 SASS interviewing collected school data using the CCDdefinition. However, if we combine data collected from the selected many-to-oneschools into one school questionnaire, estimates can be produced using the QEDschool definition. Looking at the differences between these estimates measures theimpact of QED and CCD definitions on the estimates in SASS. This information canbe used to adjust 1987-88 SASS estimates to the CCD school definition. This workhas not been started, but specifications have been written to compute the estimatesdescribed in this paragraph'.
'U.S. Department of Education, National Center for Education Statistics, 1988 Schools and StaffingSurvey Sample Design and Estimation, by Steve Kaufman, Technical Report NCES 91-127, Frame Evaluation,describes the magnitude of definitional difference with respect to number of schools.
40
Sample Design and Implementation 17
2. Bureau of Indian Affairs Schools
The schools associated with the Bureau of Indian Affairs (BIA) were in aseparate frame from the public schools or the private schools. The list of BIA schoolscame from the Office of Indian Education's Program Education Directory from theBureau of Indian Affairs. The BIA directory of schools lists all schools funded byBIA and the Office of Indian Education by name of school, location, and the numberof teachers and students. Approximately 180 schools were on the BIA Directory list.After the removal of schools that did not offer instruction, offered only kindergarten,or were already on the public school frame, there were 152 schools on the list of BIAschools that were eligible for sampling in SASS.
3. Private Schools
3,271 private schools were selected using a dual frame approach. A list framewas the primary private school frame, and an area frame was used to find schoolsmissing from the list frame, thereby compensating for the coverage problems of thelist frame.
List Frame
The list frame used for private schools was the 1989-90 Private School Survey(PSS) list frame. NCES initiated PSS to build a universe frame of private schools.The PSS list frame universe is based on the 1988-89 QED private school list updatedwith private school association lists given to the Census Bureau in the spring of 1989.Various private school associations were asked to supply lists of their schools.Twenty such lists were received. These lists were matched with the QED list and anyassociation list school not found on the QED file was added to the frame. Beforesampling, duplicate schools were excluded from the frame. Schools that only teachprekindergarten, kindergarten or adult education were also removed. The list frameconsisted of approximately 20,600 schools.
Area Frame
The area frame sample consisted of two sets of sample PSUs: 1) a subsampleof the 1987-88 SASS area frame sample PSUs2; and 2) sample PSUs selectedindependently from the 1987-88 SASS sample. The 1987-88 SASS sample PSUs wereselected systematically with probabilities proportional to the square root of enrollmentfrom each of sixteen strata defined by Census region, metro/nonmetro status, and highor low percent of enrollment in private schools. By maintaining a fifty percentoverlap of PSUs, the reliability of estimates of change was maintained at a reasonablelevel, while reducing respondent burden.
2A PSU is a primary sample unit, which is a geographic area consisting of one or more contiguous countiesor an independent city.
41

18 1990-91 SASS Data File Users' Manual
The eight certainty PSUs in the 1987-88 SASS remained in the 1990-91 SASSsample with certainty. The 67 non-certainty PSUs in the 1987-88 SASS were firstsorted by PSU stratum code and then a subsample of 52 PSUs was systemicallyselected with equal probability. The total of 60 sample PSUs from the 1987-88 SASSformed the first set of sample PSUs for the 1990-91 SASS area frame. They were theoverlap PSUs with the 1987-88 SASS.3
An additional 64 PSUs were selected independently. The United States wasdivided up into primary sampling units (PSUs). Each PSU consisted of a singlecounty, independent city or cluster of geographically contiguous areas defined so thateach PSU had a minimum population of 20,000 according to population projections for1988. To avoid having PSUs covering too large a geographic area some PSUs hadless than 20,000 in population. Counties of Alaska were excluded until the 1989 PSUSample was selected. In other words, there were no Alaska counties in the overlapsample but there was a county in Alaska in the non-overlap sample. The eightcertainty PSUs in 1988 were also excluded from the independent PSU samplingoperation.
The strata were defined the same way as in the 1988 area frame design: a)Census region (4 levels), b) metro/nonmetro status (2 levels) and c) whether thePSU's percent private school enrollment exceeded the median percent privateenrollment of the other PSUs in the census region/metro status strata (2 levels - using1980 Census data).
The PSUs were selected as a systematic sample with probability proportionateto the square root of the 1988 projected PSU population. A total of 123 distinct PSUswere in sample since one PSU was selected for both sets of samples. Its weight wasadjusted to appropriately reflect the duplication.
B. Sample Allocation
1. Public Schools
The SASS sample is a stratified sample. For public schools, the first level ofstratification was by three types of schools: (A) Native American schools (schoolswith 25 or more Native American students), (B) schools in Delaware, Nevada andWest Virginia, and (C) all other schools.
For the second level of stratification, the type A schools were stratified byArizona, North Dakota, Oklahoma and all other states (except Alaska, since mostAlaskan schools have high Native American enrollment), the type B schools were
3For details of how the original 67 non-certainty PSUs in the 1988 SASS were selected refer to pages 28-29of U.S. Department of Education, National Center for Education Statistics, 1988 Schools and Staffing SurveySample Design and Estimation, by Steve Kaufman, Technical Report NCES 91-127, dated May 1991.
42

Sample Design and Implementation 19
stratified first by state and then by district and, the type C schools were stratified bystate (all states and the District of Columbia except Delaware, Nevada, and WestVirginia).
Within each second level there were three grade level strata (elementary,secondary, and combined schools), defined as follows:
Regular Schools:
Elementary Lowest Grade 6 and Highest grade 5 8Secondary Lowest Grade z 7 and Highest grade 12
Combined Lowest Grade 5. 6 and Highest grade > 8
Nonregular schools which include special education, vocational, technical, adulteducation (if part of in-scope school) or alternative/continuation grades were classifiedas combined schools. See Table IV-1 for the public school sample allocation.
Table IV- 1.-- Sample allocation for both public and private schools, andadministrators and public Districts
Total Elementary Combined Secondary
Public
Districts 5,424
General Schools(Administrators)
9,336 4,203 1,508 3,625
Bureau of Indian AffairsSchools (Administrators) 101 67 20 14
Native AmericanOversample Schools(Administrators) 251 162 8
.
81
Public School Total 9,687 4,435 1,530 3,722
Private
List Frame Schools(Administrators) 2,670 1,355 892 423
Area Frame Schools(Administrators) 600 300 258 42
Private School Total 3,270 1,655 1,150 465
43

20 1990-91 SASS Data File Users' Manual
2. Bureau of Indian Affairs Schools
The first level of stratification was Arizona, New Mexico, South Dakota, andall other states. Within each state or group of states, the schools were stratified byelementary, secondary, and combined. See Table IV-1 above for the BIA schoolsample allocation.
3. Private Schools
For list frame private schools, the frame was partitioned into an initial set of216 cells. The first level of stratification was school association membership (18):
1) Military - membership in the Association of American Military Colleges andSchools;
2) Catholic - affiliation as Catholic or membership in the National CatholicEducation Association or the Jesuit Secondary Education Association;
3) Friends - affiliation as Friends or membership in the Friends Council onEducation;
4) Episcopal - affiliation as Episcopal or membership in the National Associationof Episcopal Schools association;
5) Hebrew Day - membership in the National Society for Hebrew Day Schoolsassociation;
6) Solomon Schechter membership in the Solomon Schechter Day Schools;
7) Other Jewish other Jewish affiliation;
8) Missouri Synod membership in the Lutheran Church, Missouri Synod schoolassociation;
9) Wisconsin Synod - membership in the Evangelical Lutheran Church -Wisconsin Synod school association or affiliation as Evangelical Lutheran -Wisconsin Synod;
10) Evangelical Lutheran membership in the Association of Evangelical LutheranChurches school association or affiliation as Evangelical Lutheran Church inAmerica;
11) Other Lutheran - other Lutheran affiliation;
12) Seventh-Day Adventist - affiliation as Seventh-Day Adventist or membership inthe General Conference of Seventh-Day Adventists;

Sample Design and Implementation 21
13) Christian Schools International - membership in Christian Schools International;
14) Association of Christian Schools International - membership in the Associationof Christian Schools International;
15) National Association of Private Schools for Exceptional Children - membershipin the National Association of Private Schools for Exceptional Children;
16) Montessori - membership in the American Montessori Society or otherMontessori associations;
17) National Association of Independent Schools member of the NationalAssociation of Independent Schools;
18) All else member of any other association specified in the PSS or affiliatedwith a group not listed above or not a member of any association.
Within each association membership, schools were stratified by grade level(elementary, secondary, and combined schools) as defined above.
Within association/grade level, schools were stratified by four Census regions:Northeast, Midwest, South, and West.
The area frame was stratified by PSU and school level.
For the private sample school allocation, see Table 4-1 above.
C. Overlapping 1988 and 1991 SASS Samples
1. Public Schools
One of the goals for the 1990-91 SASS was to measure change between1987-88 and 1990-91 for various characteristics. To improve such estimates, thesample selection process controlled the amount of overlap between the 1987-88 and1990-91 school samples. Appendix 3 in the technical report, 1990-91 Schools andStaffing Survey: Sample Design and Estimation, by S. Kaufman and H. Huang,NCES 93-449, July 1993, describes how this was done.
The 1990-91 SASS pretest measured the impact of collecting data from thesame school several times. For public schools, the effect on response rates wasminimal - 92% for nonoverlap schools and 87% for overlap schools. (To account foroverlap schools being selected only from 1987-88 SASS respondents, overlap pretestsample schools were adjusted for the 1987-88 SASS nonresponse.) This suggests thatthe school overlap rate can be high, since the increased precision resulting forestimates of change produces little degradation of response rates.
45

22 1990-91 SASS Data File Users' Manual
To minimize the impact on the 1990-91 district response rates, the schooloverlap was set at 30%. With a controlled 30% school overlap, the expected districtoverlap rate was 58%, which from the SASS pretest translates into an expected 6percentage point drop in response rates if there were no overlap at all. The predicteddrop in the district response rate did not occur. The simplification in the districtquestionnaire is thought to be a contributing factor for the actual increase in responserate.
2. Private Schools
From the SASS pretest, we learned that overlapping samples reduces responserates among private schools. Since the overall 1988 SASS private school responserate was only 79%, it was considered important to minimize the impact of overlappingthe samples in 1990-91, so as to reduce the effect on response rates for 1990-91. Todo this, we designed a sampling scheme which controlled the expected overlap. Thissampling scheme, used in the list frame, provided a 30% overlap for associations witha high 1987-88 response rate and minimized the overlap for associations with a lowresponse rate.
The 1990-91 SASS area frame sample was selected independently of the 1987-88 area frame sample. There was no need to control overlap since half the PSUsselected from the 1990-91 frame were in the 1987-88 sample as well. One wouldassume from this that many schools in these PSUs would be eligible again in 1990-91.Also, many schools in this frame were in the certainty strata. Taken together, thesetwo design aspects produced an overlap of 24.5 percent over the entire area sample.
D. Sample Selection Procedures
1. Public Schools
To facilitate the calculation of district weights, it was important that within astratum all schools belonging to the same district be together. This can be achievedby sorting by district ID first. However, to get additional efficiencies into the sampledesign, it would be better to sort by other variables before sorting by district ID (seebelow). To achieve both of these goals, some of the sort variables' values wererecoded to make them the same for every school within a stratum/district. They werechanged in the following manner:
1) All schools within a stratum/district had the first three digits of the ZIPcode set equal to the ZIP code of the first school in the stratum/district.
2) All schools within a stratum/district had the urbanicity code changed tothe urbanicity code most prevalent among all schools within thestratum/district. If a tie occurred, the lower value was used.
46

Sample Design and Implementation 23
After these fields were changed the schools within a stratum were sorted by thefollowing variables:
State;District urbanicity:
0 = Unclassified1 = Central city of a Metropolitan Statistical Area (MSA)2 = MSA, not central city3 = Outside MSA;
District ZIP Code (The first three digits)CCD District ID number4;District percent minority:
1 = 0-5%2 = 6-20%3 = 21-50%4 = 51% or more;
Highest grade in school;School enrollment; andCCD School ID5
Within each stratum, schools were systematically selected using a probabilityproportionate to size algorithm. The measure of size used for the schools on CCDwas the square root of the number of teachers in the school as reported on the CCDfile. Any school with a measure of size larger than the sampling interval wasexcluded from the probability sampling operation and included in the sample withcertainty.
2. Private Schools
Within each stratum for private schools on the list frame, sorting took place onthe following variables:
State;Urbanicity:
0 = unclassified1 = urban2 = suburban3 = rural4 = affiliation adds with no classification;
ZIP Code (The first two digits);
°CCD District ID number is a unique number assigned to each school district by NCES.
sCCD School ID is a unique number assigned to each school.
47
24 1990-91 SASS Data File Users' Manual
Highest grade in the school;1989-90 PSS Enrollment;PIN number: This PIN number is a unique number assigned by QED which
identifies the school on PSS. The PIN numbers for schools added fromprivate affiliation list adds were assigned by the Census Bureau.
Within each stratum, private schools in the list frame were systematicallyselected using a probability proportionate to size algorithm. The measure of size usedwas the square root of the 1989-90 PSS number of teachers in the school. Any schoolwith a measure of size larger than the sampling interval was excluded from theprobability sampling process and included in sample with certainty.
Eligible schools in the private schools area frame were sorted using thefollowing variables:
Affiliation (Catholic, other religious, and nonsectarian);1989-90 PSS Enrollment; andSchool name (in alphabetical order).
Within each stratum, eligible schools in the area frame were systematicallyselected using a probability proportionate to size algorithm. The measure of size wasthe square root of the number of reported teachers from 1989-90 PSS. Any schoolwith a measure of size larger than the sampling interval was excluded from theprobability sampling process and included in sample with certainty.
3. Public School Districts
Once schools were selected, districts associated with these schools were insample as well. Hence, the district sample consisted of the set of districts that wereassociated with the SASS public school sample. This provided the linkage betweenthe district and the school. This portion of the district sample represented the set ofdistricts associated with schools. The sample size for districts with schools was5,380.
Some districts were not associated with schools. Such districts may hireteachers who teach in schools of other districts. For SASS to represent such districts,a sample of these districts was also selected. The frame for this sample consisted of1,352 districts on the 1988-89 CCD file that were not associated with schools. A 1 in10 sample was taken. The sample was selected using a systematic equal probabilityalgorithm. Sample size for districts without schools was 135 units, of which only 14were actually in-scope.
Research showed standard errors from Delaware, Nevada, and West Virginiawere very high relative to the district sampling rate (i.e., coefficients of variationlarger than 20 percent with 90 percent of districts in sample) in the 1987-88 SASS.
48
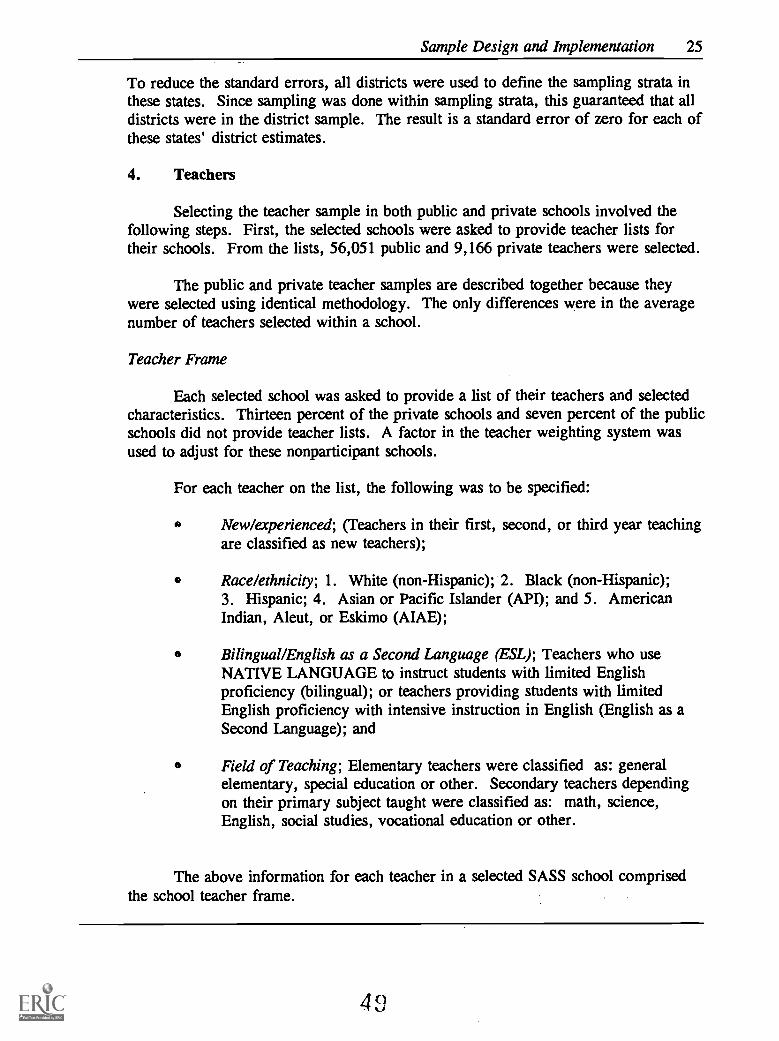
Sample Design and Implementation 25
To reduce the standard errors, all districts were used to define the sampling strata inthese states. Since sampling was done within sampling strata, this guaranteed that alldistricts were in the district sample. The result is a standard error of zero for each ofthese states' district estimates.
4. Teachers
Selecting the teacher sample in both public and private schools involved thefollowing steps. First, the selected schools were asked to provide teacher lists fortheir schools. From the lists, 56,051 public and 9,166 private teachers were selected.
The public and private teacher samples are described together because theywere selected using identical methodology. The only differences were in the averagenumber of teachers selected within a school.
Teacher Frame
Each selected school was asked to provide a list of their teachers and selectedcharacteristics. Thirteen percent of the private schools and seven percent of the publicschools did not provide teacher lists. A factor in the teacher weighting system wasused to adjust for these nonparticipant schools.
For each teacher on the list, the following was to be specified:
New/experienced; (Teachers in their first, second, or third year teachingare classified as new teachers);
Race/ethnicity; 1. White (non-Hispanic); 2. Black (non-Hispanic);3. Hispanic; 4. Asian or Pacific Islander (API); and 5. AmericanIndian, Aleut, or Eskimo (AIAE);
Bilingual/English as a Second Language (ESL); Teachers who useNATIVE LANGUAGE to instruct students with limited Englishproficiency (bilingual); or teachers providing students with limitedEnglish proficiency with intensive instruction in English (English as aSecond Language); and
Field of Teaching; Elementary teachers were classified as: generalelementary, special education or other. Secondary teachers dependingon their primary subject taught were classified as: math, science,English, social studies, vocational education or other.
The above information for each teacher in a selected SASS school comprisedthe school teacher frame.

26 1990-91 SASS Data File Users' Manual
Within each selected school, teachers were stratified into one of five teachertypes in the following hierarchical order:
Asian or Pacific Islander;
American Indian or Aleutian or Eskimo;
Bilingual/ESL;
New; and
Experienced
Within-School Teacher Allocation
For new/experienced teachers in public schools, oversampling was not requireddue to the large number of sample schools with new teachers. Therefore, teacherswere allocated to the new and experienced categories proportional to their numbers inthe school. However, for private school teachers, new teachers were oversampled toensure that there would be enough new teachers in both 1991 SASS and the TeacherFollow-up Survey (TFS).
Before teachers were allocated to the new/experienced strata, schools were firstallocated an overall number of teachers to be selected. This overall sample size waschosen so as to equalize the teacher weights with the school stratification (state/leveland association/level/region for public and private sectors, respectively), assuming nofurther teacher stratification and zero Asian Pacific Islander (API), American Indian,Aleut and Eskimo (AIAE), and Bilingual teachers.
Table IV-2 provides the average number of new and experienced teachers to beselected within each public and private school by school level.
Table IV-2.--Average number of new and experienced teachers selected per school by school level andsector
School Level
Elementary Secondary Combined
Public Schools 3.49 6.98 5.23
Private Schools 3.78 4.72 2.83
50

Sample Design and Implementation 27
A total of 65,217 teachers were selected (60,056 new and experienced, 1,511Asian Pacific Islander, 1,529 American Indian Aleutian or Eskimo, and 2,121bilingual). Table IV-3 shows the number of selected teachers in SASS sample byteacher type and sector.
Table 1V-3.Ntmther of selected teachers in SASS sample by teacher type and sector
Teacher type Public Private Total
Native American 1,259 270 1,529
Asian/Pacific Islander 1,475 36 1,511
Bilingual/ESL 1,957 164 2,121
New 5,970 2,002 7,972
Experienced 45,390 6,694 52,084
TotalI
56,051 9,166 65,217
J1.

29
V. Data Collection
52
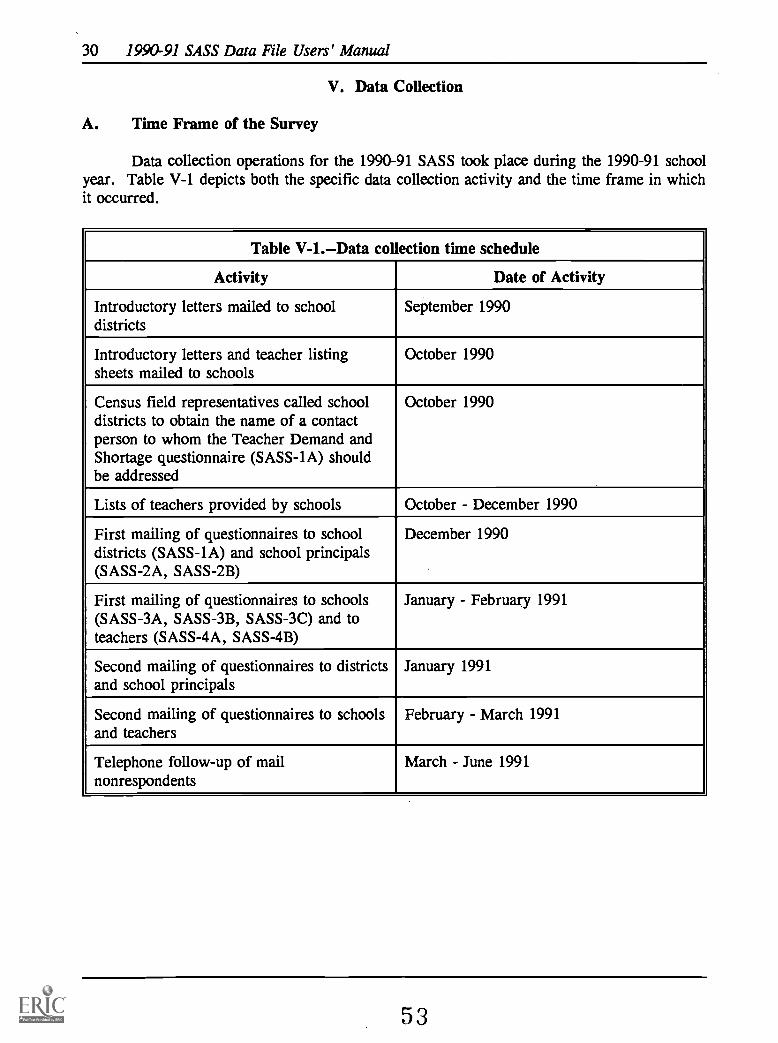
30 1990-91 SASS Data File Users' Manual
V. Data Collection
A. Time Frame of the Survey
Data collection operations for the 1990-91 SASS took place during the 1990-91 schoolyear. Table V-1 depicts both the specific data collection activity and the time frame in whichit occurred.
Table V-1.--Data collection time schedule
Activity Date of Activity
Introductory letters mailed to schooldistricts
September 1990
Introductory letters and teacher listingsheets mailed to schools
October 1990
Census field representatives called schooldistricts to obtain the name of a contactperson to whom the Teacher Demand andShortage questionnaire (SASS-1A) shouldbe addressed
October 1990
Lists of teachers provided by schools October December 1990
First mailing of questionnaires to schooldistricts (SASS-1A) and school principals(SASS-2A, SASS-2B)
December 1990
First mailing of questionnaires to schools(SASS-3A, SASS-3B, SASS-3C) and toteachers (SASS-4A, SASS-4B)
January - February 1991
Second mailing of questionnaires to districtsand school principals
January 1991
Second mailing of questionnaires to schoolsand teachers
February March 1991
Telephone follow-up of mailnonrespondents
March - June 1991
53

Data Collection 31
B. Data Collection Procedures
In September 1990, a letter describing the survey and requesting cooperation wasmailed to each sample school district. This letter also informed the district personnel that aCensus field representative would call during October to obtain the name of the districtcontact person, i.e., the person to whom the district questionnaire should be addressed.
In October 1990, introductory letters were sent to the sample schools. Enclosed witheach letter was a Teacher Listing Sheet, on which the school principal (or other school staff)was asked to list all teachers in the school. A postage-paid return envelope addressed to theappropriate Census Bureau regional office was also enclosed. Three weeks after the listingsheets were mailed to the schools, field representatives from the regional offices began callingschools that had not returned teacher lists. When this telephone follow-up ended in December1990, approximately 93 percent of public schools and 87 percent of private schools hadprovided lists of teachers.
In December 1990, Teacher Demand and Shortage (SASS-1A) questionnaires weremailed to the districts and Administrator Survey questionnaires were mailed to the schools(SASS-2A to public schools and Indian schools, SASS-2B to private schools). Public andprivate school questionnaires (SASS-3A and 3B, respectively) were mailed in late December(public) and early January (private). Questionnaires for Bureau of Indian Affairs schools(SASS-3C) were mailed in early February. Questionnaires for teachers selected from theteacher listing sheets were also mailed to the schools in early February; SASS-4Aquestionnaires were sent to teachers in public and Bureau of Indian Affairs schools and SASS-4B questionnaires were sent to private school teachers.
The district questionnaires were addressed to the contact person whose name had beenprovided in October or, if no name had been provided, to "Superintendent." School andadministrator questionnaires were addressed to "Principal." (Names of individuals were notused on the school and administrator forms because the person named could have beentransferred to another school.) The only eligible respondent for the administratorquestionnaire was the present school principal; for the school questionnaires, however, theeligible respondent could be the principal, vice principal, school secretary or any otherknowledgeable school staff member. The teacher questionnaires were addressed to theselected sample teachers; only the teacher named on the label was an eligible respondent.
All questionnaires included a letter printed on page 2, signed by Emerson Elliott, theActing Commissioner of NCES. This letter described the survey's purpose and requestedparticipation. As required by the Office of Management and Budget (OMB), it also statedthat the survey was voluntary and provided an estimate of the time required to complete theform. The questionnaires also contained instructions for filling out the form and a CensusBureau telephone number; respondents were advised to call this number collect if they neededinformation or assistance in filling the questionnaire.
The follow-up operation for sample cases that did not return the initial questionnairewas twofold. First, about five weeks after the first mailing, a second questionnaire wasmailed to all nonrespondents. If the second questionnaire was not returned within the next six
54

32 1990-91 SASS Data File Users' Manual
or seven weeks, Census field representatives began calling the nonrespondents. Theyattempted to complete the interviews by telephone or, in some cases, to persuade therespondent to complete and mail back the questionnaire. All data collection ended during thefirst week of June 1991.
The field representatives who worked on the telephone phase of data collection wereprovided with an instruction manual and a self-study training package. The self-studyincluded a test on survey procedures; they were required to complete the test and return it totheir regional office supervisor before beginning their survey assignments. These fieldrepresentatives were experienced survey interviewers who had already been trained on basicinterviewing concepts and procedures such as confidentiality, how to persuade reluctantrespondents to participate, and how to follow questionnaire skip instructions.
55

33
VI. Response Rates
56

34 1990-91 SASS Data File Users' Manual
VI. Response Rates
A. Survey Response Rates
The unweighted and weighted response rates for each component of SASS are detailedin Tables VI-1 through VI-4. These response rates are useful as an indication of possiblenonresponse bias. Table VI-1 provides unweighted and weighted response rates by state foreach of the four public SASS components; Table VI-2 provides private school unweighted andweighted response rates by typology; Table VI-3 provides private school unweighted andweighted response rates by private school association; and Table VI-4 lists private schoolresponse rates by these classifications: Catholic, Other religious, and Nonsectarian.
The unweighted response rates were derived by dividing the number of interviews bythe number of eligible cases (the number of sample cases minus out-of-scope cases; forexample, school closed, no elementary or secondary teachers, teacher retired). The weightedresponse rates were derived by dividing the sum of the basic weights for the interview casesby the sum of the basic weights for the eligible cases. The basic weight for each sample casewas assigned at the time of sampling and is the inverse of the probability of selection.
Teacher response rates refer to the percentage of teachers responding in schools thatprovided teacher lists for sampling. Ten percent of the in-scope private schools and fivepercent of the in-scope public schools did not send in teacher lists.
The effective response rate is calculated by multiplying together the teacher list rateand the response rate:
Public teachers: .95 x .904 = .8588 x 100 = 85.9% effective response ratePrivate teachers: .90 x .839 =.7551 x 100 = 75.5% effective response rate
B. Item Response Rates
Table VI-5 provides a summary of the unweighted item response rates for each of the1990-91 SASS surveys. A response rate for an item is defined as the number of records withvalid responses to an item divided by the universe for that item.
57

Response Rates 35
Table VI-1.- -Unweighted and final weighted response rates by state for public districts,administrators, schools and leathers
StateDistricts Administrators Schools Teachers*
Unweighted Weighted Unweighted Weighted Unweighted Weighted Unweighted Weighted
United States 93.7% 93.5% 96.9% 96.7% 95.0% 95.3% 91.5% 90.3%Alabama 95.1 96.3 98.7 98.9 95.6 95.9 89.6 90.6Alaska 95.1 96.2 96.8 96.6 91.1 92.0 89.7 89.8
Arizona 97.0 90.4 96.9 97.1 96.5 94.8 94.6 94.9
Arkansas 94.0 91.3 97.0 96.6 97.6 97.7 94.7 94.1
California 88.3 91.3 95.3 95.7 93.1 94.6 87.7 87.9
Colorado 97.4 98.2 97.8 98.4 96.2 95.9 94.4 95.2
Connecticut 84.2 77.0 96.9 97.0 92.0 93.1 84.5 85.6
Delaware 100.0 100.0 94.4 94.4 93.1 93.3 95.4 95.6
District of Columbia 100.0 100.0 89.7 88.9 87.0 86.3 68.2 69.3
Florida 90.9 92.0 94.5 94.4 93.1 93.9 88.9 88.7
Georgia 91.1 92.3 94.7 94.8 96.8 96.6 93.3 93.3
Hawaii 100.0 100.0 98.9 98.7 98.9 98.7 88.2 88.3Idaho 93.5 95.5 100.0 100.0 98.1 98.6 94.8 95.2Illinois 94.2 91.8 98.8 99.8 97.2 98.7 95.4 95.6Indiana 96.2 95.8 100.0 100.0 99.5 99.6 94.9 95.3Iowa 98.5 98.4 98.9 99.0 98.3 96.5 95.9 96.2
Kansas 99.1 99.6 98.1 98.0 97.5 98.0 95.3 95.6
Kentucky 94.8 92.3 98.9 99.0 97.8 98.1 88.0 88.8
Louisiana 89.2 90.1 94.4 93.7 93.1 93.9 92.3 93.1
Maine 90.0 92.0 98.6 98.2 96.5 94.7 89.4 89.7
Maryland 87.0 87.5 82.4 82.4 80.7 81.0 89.3 90.2
Massachusetts 93.3 94.1 96.4 96.5 93.0 91.1 85.5 84.4
Michigan 92.8 90.2 98.6 98.8 94.4 97.1 83.6 84.5
Minnesota 92.2 92.1 98.5 98.8 96.5 97.4 95.5 94.1
Mississippi 96.6 96.7 97.4 97.6 96.1 97.2 92.6 93.3
Missouri 95.3 93.8 99.0 98.9 97.6 98.0 94.3 91.2
Montana 97.1 95.1 99.4 99.8 98.1 97.8 94.5 95.0
Nebraska 97.1 97.3 98.6 98.2 97.5 98.7 93.8 92.9Nevada 100.0 100.0 97.5 97.8 95.8 96.1 88.4 88.5New Hampshire 97.4 92.9 97.4 98.8 94.0 96.3 92.5 92.5
New Jersey 81.8 86.3 92.3 92.4 85.8 88.3 86.4 86.3
New Mexico 92.9 95.0 99.4 99.2 95.1 96.0 89.1 90.0
New York 95.3 95.7 89.9 89.5 88.0 87.6 81.2 79.3
North Carolina 94.5 94.0 96.3 95.6 94.1 92.6 95.8 96.0
North Dakota 94.2 94.4 98.9 99.1 97.4 98.4 95.3 95.8
Ohio 90.5 89.4 98.5 97.0 97.0 97.0 86.9 87.8
Oklahoma 97.8 98.5 98.9 99.1 96.0 96.3 95.0 93.8
Oregon 91.3 91.2 97.7 97.3 95.4 95.3 90.7 91.3
Pennsylvania 93.7 94.4 96.2 97.2 94.1 96.1 93.1 93.3
Rhode Island 91.4 91.9 96.2 97.1 96.2 96.5 87.3 87.4
South Carolina 92.9 92.8 98.9 98.6 96.2 96.6 91.2 91.1
South Dakota 97.8 98.2 99.0 98.6 96.7 98.5 95.9 95.2
Tennessee 100.0 100.0 97.9 97.5 96.4 98.1 91.2 92.9
Texas 94.0 95.2 97.4 98.1 96.9 97.4 91.3 91.5
Utah 97.1 96.0 99.4 99.4 97.8 98.4 97.7 97.9
Vermont 88.3 86.9 98.0 98.6 98.1 98.5 95.7 95.6
Virginia 89.1 90.7 96.9 95.3 92.3 92.2 89.9 90.7
Washington 95.2 97.0 94.1 93.7 93.4 92.6 87.9 88.1
West Virginia 98.2 98.2 98.8 99.6 97.6 98.2 94.9 94.8
Wisconsin 96.2 96.3 98.2 97.2 93.5 94.6 95.5 95.3
Wyoming 95.6 96.1 96.9 96.1 97.6 97.7 96.3 96.8
*Public school teacher response rates refer to the percentage of teachers responding in schools thatprovided teacher lists for sampling; five percent of the in-scope public schools did not send in teacher lists.
SOURCE: U.S. Department of Education, National Center for Education Statistics, Schools and StaffingSurvey, 1990-91 (Teacher Demand and Shortage Questionnaire, Administrator Questionnaire, SchoolQuestionnaire, and Teacher Questionnaire).
BEST COPY AVAILABLE

36 1990-91 SASS Data File Users' Manual
Table VI-2. Unweighted and final weighted response rates bytypology for private schools
TypologySchools
Unweighted Weighted
All private schools 85.1 % 83.9 %
Catholic 90.0 90.8Parochial 88.7 89.9Diocesan 90.4 92.1
Private Order 93.3 93.9
Other Religious 83.2 79.6Conservative Christian 77.7 73.6Other religious affiliated 88.3 88.0Other religious unaffiliated 74.8 76.5
Nonsectarian 84.3 81.5Regular 82.6 76.5Special emphasis 82.3 83.4Special education 92.1 92.0
SOURCE: U.S. Department of Education, National Center for EducationStatistics, Schools and Staffing Survey, 1990-91 (School Questionnaire).
59
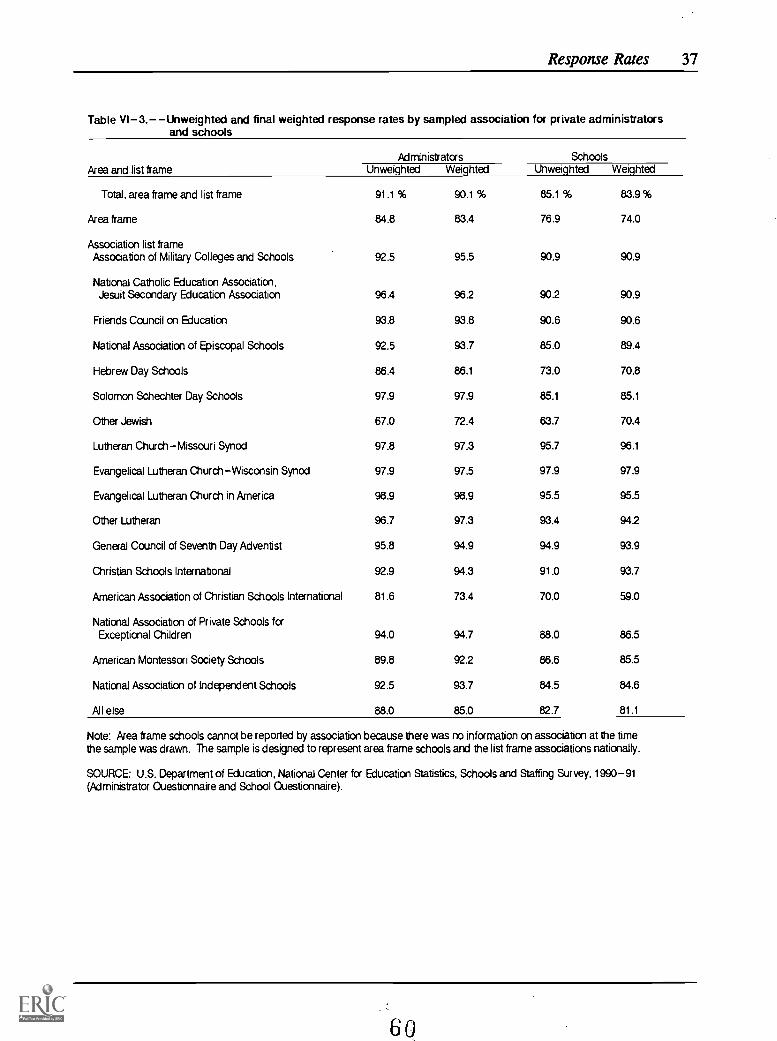
Response Rates 37
Table VI-3.- -Unweighted and final weighted response rates by sampled association for private administratorsand schools
Area and list frameAdministrators Schools
Unweighted Weighted Unweighted Weighted
Total, area frame and list frame 91.1 % 90.1 % 85.1 % e3.9%
Area frame 84.8 83.4 76.9 74.0
Association list frameAssociation of Military Colleges and Schools 92.5 95.5 90.9 90.9
National Catholic Education Association,Jesuit Secondary Education Association 96.4 96.2 90.2 90.9
Friends Council on Education 93.8 93.8 90.6 90.6
National Association of Episcopal Schools 92.5 93.7 85.0 89.4
Hebrew Day Schools 86.4 86.1 73.0 70.8
Solomon Schechter Day Schools 97.9 97.9 85.1 85.1
Other Jewish 67.0 72.4 63.7 70.4
Lutheran Church-Missouri Synod 97.8 97.3 95.7 96.1
Evangelical Lutheran Church-Wisconsin Synod 97.9 97.5 97.9 97.9
Evangelical Lutheran Church in America 98.9 98.9 95.5 95.5
Other Lutheran 96.7 97.3 93.4 94.2
General Council of Seventh Day Adventist 95.8 94.9 94.9 93.9
Christian Schools International 92.9 94.3 91.0 93.7
American Association of Christian Schools International 81.6 73.4 70.0 59.0
National Association of Private Schools forExceptional Children 94.0 94.7 88.0 86.5
American Montessori Society Schools 89.8 92.2 86.6 85.5
National Association of Independent Schools 92.5 93.7 84.5 84.6
All else 88.0 85.0 82.7 81.1
Note: Area frame schools cannot be reported by association because there was no information on association at the timethe sample was drawn. The sample is designed to represent area frame schools and the list frame associations nationally.
SOURCE: U.S. Department of Education, National Center for Education Statistics, Schools and Staffing Survey, 1990-91(Administrator Questionnaire and School Questionnaire).
60

38 1990-91 SASS Data File Users' Manual
Table VI-4.--Unweighted and final weighted response rates for private administrators,schools, and teachers, by private school affiliation
Private schoolaffiliation
Private administrators Private schools Private teachersUnweighted Weighted Unweighted Weighted Unweighted Weighted
United States 91.1 % 90.1 % 85.1 % 83.9 % 83.1 % 83.6 %
Catholic 96.6 96.5 90.0 90.8 87.7 87.9Other religious 88.6 84.9 83.2 79.6 80.8 80.3Non -sectarian 91.1 89.9 84.3 81.5 81.0 78.1
Private school teacher response rates refer to the percentage of teachers responding in schools that providedteacher lists for sampling; ten percent of the in-scope private schools did not send in teacher lists.
SOURCE: U.S. Department of Education. National Center for Education Statistics, Schools and StaffingSurvey, 1990-91 (Administrator Questionnaire. School Questionnaire, and Teacher Questionnaire).
Table VI -5.- -Items with response rates less than 75 percent
SASS Items with a response rate less than 75%
District surveyPublic
Administrator surveyPublic
None
None
Private None
School surveyPublic 31 (part-time), 2, 33d(3)-33d(9)
Private 18b(1), 35d(2), 35:(7), 35d(9), 43a-d, f-i (part-time)
Indian 42a-d, f-i (part-time)
Teacher surveyPublic None
Private 20b (undergraduates), 20b(graduates)
The questionnaire wording for these items can be found in "SASS and TFSQuestionnaires, 1990-1991", an NCES publication.
61

39
VII. Edit Procedures
62

40 1990-91 SASS Data File Users' Manual
VII. Edit Procedures
A. Field Office Edit
The field office edit was used by clerks to check the quality of the data collected bythe field representatives during the telephone follow-up operation. This edit consisted of acareful review of the first four teacher questionnaires and the first two school, district, andadministrator questionnaires from each field representative. If the check uncovered ten ormore errors, including omissions, the clerk continued the item-by item edit of thequestionnaires until there were four consecutive teacher forms and two consecutive district,school, and administrator forms with less than 10 errors. This detailed edit provided the fieldrepresentatives with feedback on omissions, errors, and misunderstood instructions.
Part of this edit required the clerk to compare the number of students and teachersreported in the questionnaire with the number of students and teachers from the CommonCore of Data (CCD) included on each questionnaire's label. The CCD counts reflected thenumber of teachers and students reported by the school or district in 1988-89. If the CCDcount was twice the number reported on the questionnaire, or vice versa, a writtenexplanation of the difference should have been provided by the field representative. This 50percent rule was designed to sort out egregious reporting errors while allowing considerablelatitude for variations in definitions and for changes in enrollment and teaching positions.
B. General Clerical Edit
Questionnaires completed by both individual respondents and by field representativesin telephone follow-up were sent to the central processing unit in Jeffersonville, Indiana.Before data keying, clerks performed a general clerical edit on all questionnaires. Theyreviewed the questionnaires for legibility and consistency in entries and made corrections suchas changing 'one' to ' 1', ensuring a number was present to the right of the decimal point, androunding fractions to whole numbers. For the teacher questionnaires, the clerks also assignedindustry and occupation codes to the write-in entries in item 8, previous non-education job.
For the school and district forms, clerks again calculated the comparison of enrollmentand number of teachers with the CCD counts printed on the questionnaire label. If thecomparison of the numbers did not pass the 35 percent test for the questionnaires whichpreviously failed the 50 percent rule and there was no written explanation for the difference,the clerks attempted to resolve this problem by telephoning the district or school to obtaineither correct data or an explanation for the difference.
After the clerical edit, questionnaires were batched by type and by interview status forkeying. Data entry personnel were instructed to correct all errors identified during the keyingoperation and to refer problem cases to their supervisor.
Quality assurance was conducted on all work keyed. Keying was verified at the 100percent level for districts (SASS-1A), administrators (SASS-2A, 2B), and schools (SASS-3A,
63
Edit Procedures 41
3B, 3C). For the teacher questionnaires (SASS-4A, 4B), keying was verified at the 33percent level.
C. Computer Pre-edit
After data keying, each component of SASS was processed through a computer pre-edit designed to identify inconsistencies, invalid entries, and critical missing data. As a resultof the computer pre-edit, reject listings were generated containing a list of questionnairecontrol numbers (number used to identify individual questionnaires), the source codescontaining information unacceptable to the pre-edit program, and error messages describingthe problem.
Using the list of rejected cases generated for each of the SASS components, the clerksreviewed the questionnaires. In some instances, the keyed entry was correct and requiredconfirmation only. When this occurred, the clerk marked the reject listing with an 'A' fiiraccept. If the entry to the field was erroneous and could not be corrected, the clerk markedthe reject listing with a 'D' for delete. If the entry to the field required change or a valueneeded to be inserted, the clerk would enter the change on the listing and annotate it with theletter 'C' for change. All annotations were made to both the questionnaire and the rejectlisting. The reject listing was then sent to data entry for keying.
In some instances, the clerk was required to call the respondent to resolveinconsistencies or to obtain critical data. For example, if a teacher indicated that he had beenteaching at the current school since 1980, but reported earlier that he did not enter theteaching field until 1985, the inconsistency would be referred back to the respondent forresolution. Likewise, if a teacher said she had been teaching since 1985, and reported thatshe had 0 years of experience as a full-time teacher, and 0 years of experience as a part-timeteacher, the case would be referred to the respondent.
In line with plans to further automate SASS processing, the 1990-91 SASS tested anon-line pre-edit correction system for the administrator questionnaires (SASS-2A, SASS-2B).For these corrections, the rejected case's control number, the rejected data, and errormessages appeared on a computer screen rather than a paper listing. The clerk compared theinformation on the screen to the original questionnaire and then made corrections anddeletions or accepted the data at the computer terminal. The clerk was notified immediatelyof any inconsistencies resulting from new values. This enabled the clerk to resolve allproblems with a specific case at one time and eliminated the need to write changes on a paperlisting that had to be keyed.
For critical items, the clerks attempted to telephone the respondent to obtain correctdata if the entries on the questionnaire were inconsistent or missing. The most frequentreasons for rejecting a questionnaire are shown in Table VII-1 by SASS component.
64
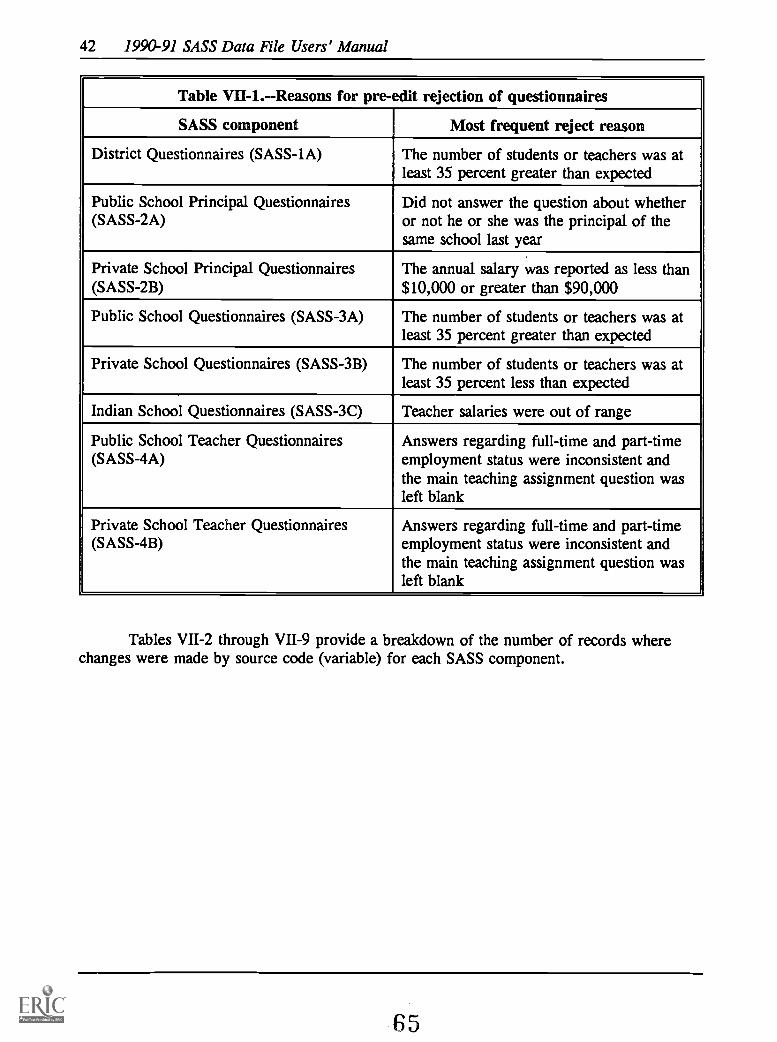
42 1990-91 SASS Data File Users' Manual
Table WI-I.Reasons for pre-edit rejection of questionnaires
SASS component Most frequent reject reason
District Questionnaires (SASS-1A) The number of students or teachers was atleast 35 percent greater than expected
Public School Principal Questionnaires(SASS-2A)
Did not answer the question about whetheror not he or she was the principal of thesame school last year
Private School Principal Questionnaires(SASS-2B)
The annual salary was reported as less than$10,000 or greater than $90,000
Public School Questionnaires (SASS-3A) The number of students or teachers was atleast 35 percent greater than expected
Private School Questionnaires (SASS-3B) The number of students or teachers was atleast 35 percent less than expected
Indian School Questionnaires (SASS-3C) Teacher salaries were out of range
Public School Teacher Questionnaires(SASS-4A)
Answers regarding full-time and part-timeemployment status were inconsistent andthe main teaching assignment question wasleft blank
Private School Teacher Questionnaires(SASS-4B)
Answers regarding full-time and part-timeemployment status were inconsistent andthe main teaching assignment question wasleft blank
Tables VII-2 through VII-9 provide a breakdown of the number of records wherechanges were made by source code (variable) for each SASS component.
85
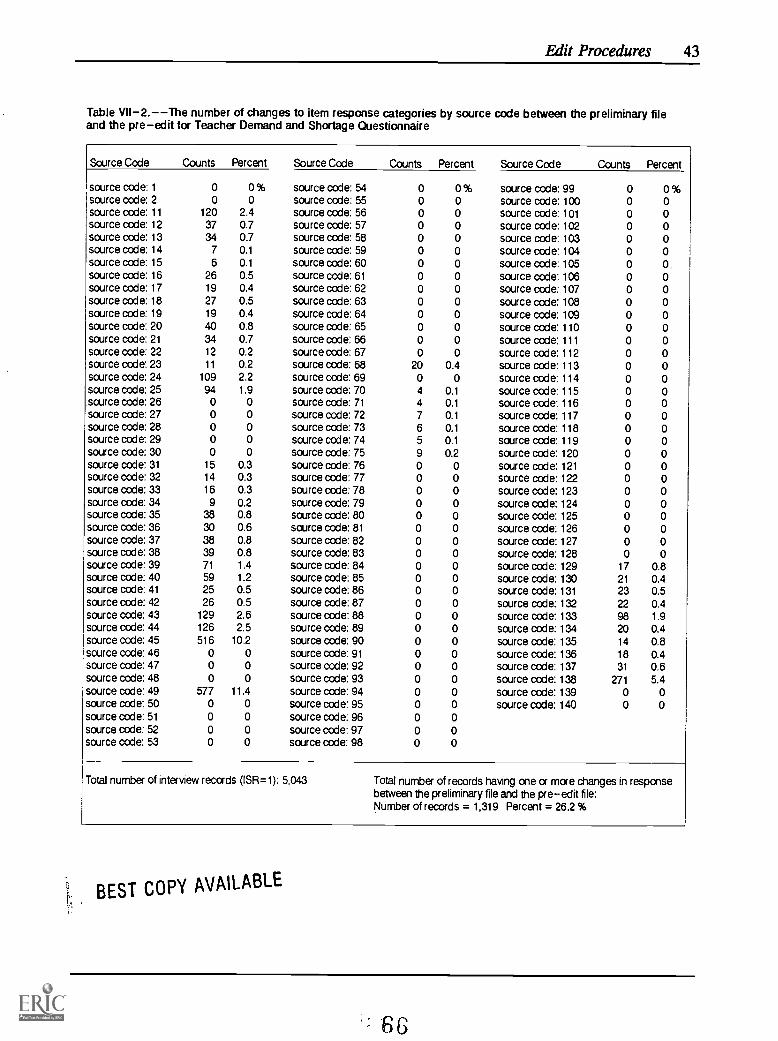
Edit Procedures 43
Table VII-2.--The number of changes to item response categories by source code between the preliminary fileand the pre-edit for Teacher Demand and Shortage Questionnaire
Source Code
source code: 1source code: 2source code: 11source code: 12source code: 13source code: 14source code: 15source code: 16source code: 17source code: 18source code: 19source code: 20source code: 21source code: 22source code: 23source code: 24source code: 25source code: 26source code: 27source code: 28source code: 29source code: 30source code: 31source code: 32source code: 33source code: 34source code: 35source code: 36source code: 37source code: 38source code: 39source code: 40source code: 41source code: 42source code: 43source code: 44source code: 45source code: 46source code: 47source code: 48source code: 49source code: 50source code: 51source code: 52source code: 53
Counts Percent
0 0 %0 0
120 2.437 0.734 0.7
7 0.1
6 0.1
26 0.519 0.427 0.519 0.440 0.834 0.712 0.211 0.2
109 2.294 1.90 00 00 00 00 0
15 0.314 0.316 0.39 0.2
38 0.830 0.638 0.839 0.871 1.459 1.225 0.526 0.5
129 2.6126 2.5516 10.2
0 00 00 0
577 11.40 00 00 00 0
Source Code
source code: 54source code: 55source code: 56source code: 57source code: 58source code: 59source code: 60source code: 61source code: 62source code: 63source code: 64source code: 65source code: 66source code: 67source code: 68source code: 69source code: 70source code: 71source code: 72source code: 73source code: 74source code: 75source code: 76source code: 77source code: 78source code: 79source code: 80source code: 81source code: 82source code: 83source code: 84source code: 85source code: 86source code: 87source code: 88source code: 89source code: 90source code: 91source code: 92source code: 93source code: 94source code: 95source code: 96source code: 97source code: 98
Counts Percent
0 0 %0 00 00 00 00 00 00 00 00 00 00 00 00 0
20 0.40 04 0.14 0.1
7 0.1
6 0.15 0.1
9 0.20 00 00 00 00 00 00 00 00 00 00 00 00 00 00 00 00 00 00 00 00 00 00 0
Source Code
source code: 99source code: 100source code: 101source code: 102source code: 103source code: 104source code: 105source code: 106source code: 107source code: 108source code: 109source code: 110source code: 111source code: 112source code: 113source code: 114source code: 115source code: 116source code: 117source code: 118source code: 119source code: 120source code: 121source code: 122source code: 123source code: 124source code: 125source code: 126source code: 127source code: 128source code: 129source code: 130source code: 131source code: 132source code: 133source code: 134source code: 135source code: 136source code: 137source code: 138source code: 139source code: 140
Counts Percent
0 0 %0 00 00 00 00 00 00 00 00 00 00 00 00 00 00 00 00 00 00 00 00 00 00 00 00 00 00 00 00 0
17 0.821 0.423 0.522 0.498 1.920 0.414 0.818 0.431 0.6
271 5.40 00 0
Total numbs of interview records (ISR=1): 5,043 Total number of records having one or more changes in responsebetween the preliminary file and the pre-edit file:Number of records = 1,319 Percent = 26.2 %
BEST COPY AVAILABLE
66

44 1990-91 SASS Data File Users' Manual
Table VII -3. -- Number of changes to item response categories by source code between the preliminary file andthe preedit file for Public School Administrator Questionnaire
Source Code
source code: 1source code: 2source code: 11source code: 12source code: 13source code: 14source code: 15source code: 16source code: 17source code: 18source code: 19source code: 20source code: 21source code: 22source code: 23source code: 24source code: 25source code: 26source code: 27source code: 28source code: 29source code: 30source code: 31source code: 32source code: 33source code: 34source code: 35source code: 36source code: 37source code: 38source code: 39source code: 40source code: 41source code: 42source code: 43source code: 44
Counts Percent
0 0 %0 03 01 00 03 00 00 00 01 00 00 00 00 00 00 0
0 01 00 00 00 00 00 00 00 00 00 00 00 00 00 00 00 00 00 0
25 0.3
Source Code
source code: 45source code: 46source code: 47source code: 48source code: 49source code: 50source code: 51source code: 52source code: 53source code: 54source code: 55source code: 56source code: 57source code: 58source code: 59source code: 60source code: 61source code: 62source code: 63source code: 64source code: 65source code: 66source code: 67source code: 68source code: 69source code: 70source code: 71source code: 72source code: 73source code: 74source code: 75source code: 76source code: 77source code: 78source code: 79
Counts Percent
77 0.8 %0 00 00 00 00 00 00 00 00 0
12 0.145 0.50 00 00 00 00 00 00 00 00 00 00 00 00 00 00 00 00 00 00 00 00 00 00 0
Source Code
source code: 80source code: 81source code: 82source code: 83source code: 84source code: 85source code: 86source code: 87source code: 88source code: 100source code: 101source code: 102source code: 103source code: 104source code: 105source code: 106source code: 107source code: 108source code: 109source code: 110source code: 111source code: 112source code: 113source code: 114source code: 115source code: 116source code: 117source code: 118source code: 119source code: 120source code: 121source code: 122source code: 123source code: 124source code: 125
Counts Percent
0 0 %0 00 00 00 00 00 00 00 00 00 00 00 00 00 00 00 00 00 00 00 00 00 00 00 00 00 00 00 00 00 00 00 00 00 0
Total numbs of interview records (ISR =1): 9,331 Total numbs of records having one a more changes in responsebetween the preliminary file and the preedit file:Number of records = 150 Percent = 1.6 %
67

Edit Procedures 45
Table VII -4. -- Number of changes to item response categories by source code between the preliminary file andthe preedit file for Private School Administrator Questionnaire
Source Code
source code: 1source code: 2source code: 11source code: 12source code: 13source code: 14source code: 15source code: 16source code: 17source code: 18source code: 19source code: 20source code: 21source code: 22source code: 23source code: 24source code: 25source code: 26source code: 27source code: 28source code: 29source code: 30source code: 31source code: 32source code: 33source code: 34source code: 35source code: 36source code: 37source code: 38source code: 39source code: 40source code: 41source code: 42source code: 43
Counts Percent
1 0 %0 02 0.1
0 00 02 0.1
0 00 00 00 00 00 00 00 00 00 00 00 00 00 00 00 00 00 00 00 00 00 00 00 00 00 00 00 00 0
Source Code
source code: 44source code: 45source code: 46source code: 47source code: 48source code: 49source code: 50source code: 51source code: 52source code: 53source code: 54source code: 55source code: 56source code: 57source code: 58source code: 59source code: 60source code: 61source code: 62source code: 63source code: 64source code: 65source code: 66source code: 67source code: 68source code: 69source code: 70source code: 71source code: 72source code: 73source code: 74source code: 75source code: 76source code: 77source code: 78
Counts Percent
8 0.3 %20 0.70 00 00 00 00 00 00 00 00 07 0.2
12 0.40 00 00 00 00 00 00 00 00 00 00 00 00 00 00 00 00 00 00 00 00 00 0
Source Code
source code: 79source code: 80source code: 81source code: 82source code: 83source code: 84source code: 85source code: 86source code: 87source code: 88source code: 101source code: 102source code: 103source code: 104source code: 105source code: 106source code: 107source code: 108source code: 109source code: 111source code: 112source code: 113source code: 114source code: 115source code: 116source code: 117source code: 118source code: 119source code: 120source code: 121source code: 122source code: 123source code: 124source code: 125
Counts Percent
0 0 %0 00 00 00 00 00 00 00 00 00 00 00 00 00 00 00 00 00 00 00 00 00 00 00 00 00 00 00 00 00 00 00 00 0
Total number of interview records (ISR=1): 2,857 Total number of records having one or more changes in responsebetween the preliminary file and the preedit file:Number of Records = 48 Percent = 1.7 %
63

46 1990-91 SASS Data File Users' Manual
Table VII-5.---Number of changes to item response categories by source code between the preliminary file andthe 're -edit file for Public School QuestionnaireSource Code
source code: 1source code: 2source code: 11source code: 12source code: 13source code: 14source code: 15source code: 16source code: 17source code: 18source code: 19source code: 20source code: 21source code: 22source code: 23source code: 24source code: 25source code: 26source code: 27source code: 28source code: 29source code: 30source code: 31source code: 32source code: 33source code: 34source code: 35source code: 36source code: 37source code: 38source code: 39source code: 40source code: 41source code: 42source code: 43source code: 44source code: 45source code: 46source code: 47source code: 48source code: 49source code: 50source code: 51source code: 52source code: 53source code: 54source code: 55source code: 56source code: 57source code: 58source code: 59source code: 60source code: 61source code: 62source code: 63source code: 64source code: 65source code: 66source code: 67source code: 68source code: 69source code: 70
Counts Percent
1 0 %0 0
22 0.2149 1.6
37 0.40 00 00 0
0 017 0.217 0.2
0 01 0
14 0.29 0.1
11 0.1
20 0.238 0.4
0 00 00 00 00 00 00 00 00 00 00 00 00 00 00 00 0
62 0.72 02 0
10 0.1
1 01 00 00 00 0
17 0.21 00 00 0
11 0.1
0 00 00 00 00 00 00 00 00 00 00 00 0
11 0.1
9 0.1
Source Code
source code: 71source code: 72source code: 73source code: 74source code: 75source code: 76source code: 77source code: 78source code: 79source code: 80source code: 81source code: 82source code: 83source code: 84source code: 85source code: 86source code: 87source code: 88source code: 89source code: 90source code: 91source code: 92source code: 93source code: 94source code: 95source code: 96source code: 97source code: 98source code: 99source code: 100source code: 101source code: 102source code: 103source code: 104source code: 105source code: 106source code: 107source code: 108source code: 109source code: 110source code: 111source code: 112source code: 113source code: 114source code: 115source code: 116source code: 117source code: 118source code: 119source code: 120source code: 121source code: 122source code: 123source code: 124source code: 125source code: 126source code: 127source code: 128source code: 129source code: 130source code: 131source code: 132
Total number of interview records (ISR=1): 9,064
Counts Percent
4 0 %5 0.1
5 0.1
3 06 0.1
7 0.1
5 0.1
7 0.1
5 0.1
8 0.1
5 0.1
7 0.1
5 0.1
3 05 0.1
5 0.1
2 05 0.1
2 05 0.1
2 09 0.1
2 017 0.2
2 017 0.2
2 015 0.2
3 00 0
147 1.60 00 00 00 01 00 00 01 09 0.1
0 00 00 0
156 1.7129 1.4227 2.5
17 0.22 04 0
19 0.2123 1.4
1 00 0
21 0.219 0.225 0.311 0.1
1 00 00 00 00 0
Source Code
source code: 133source code: 134source code: 135source code: 136source code: 137source code: 138source code: 139source code: 140source code: 141source code: 142source code: 143source code: 144source code: 145source code: 146source code: 147source code: 148source code: 149source code: 150source code: 151source code: 152source code: 153source code: 154source code: 155source code: 156source code: 157source code: 158source code: 159source code: 160source code: 161source code: 162source code: 163source code: 164source code: 165source code: 166source code: 167source code: 168source code: 169source code: 170source code: 171source code: 172source code: 173source code: 174source code: 175source code: 176source code: 177source code: 178source code: 179source code: 180source code: 181source code: 182source code: 183source code: 184source code: 185source code: 186source code: 187source code: 188source code: 189source code: 190source code: 191source code: 192source code: 193
Counts Percent
0 0 %0 00 00 00 00 00 00 00 00 00 00 00 00 00 00 00 00 00 00 00 00 00 00 00 00 00 00 00 00 00 00 00 00 00 00 00 00 00 00 00 00 00 00 00 00 00 00 00 00 00 00 00 00 00 00 00 00 00 00 00 0
Total number of records having one a more changes inresponse between the preliminary file and the pre-edit file:Number of records = 906 Percent = 10 %
69
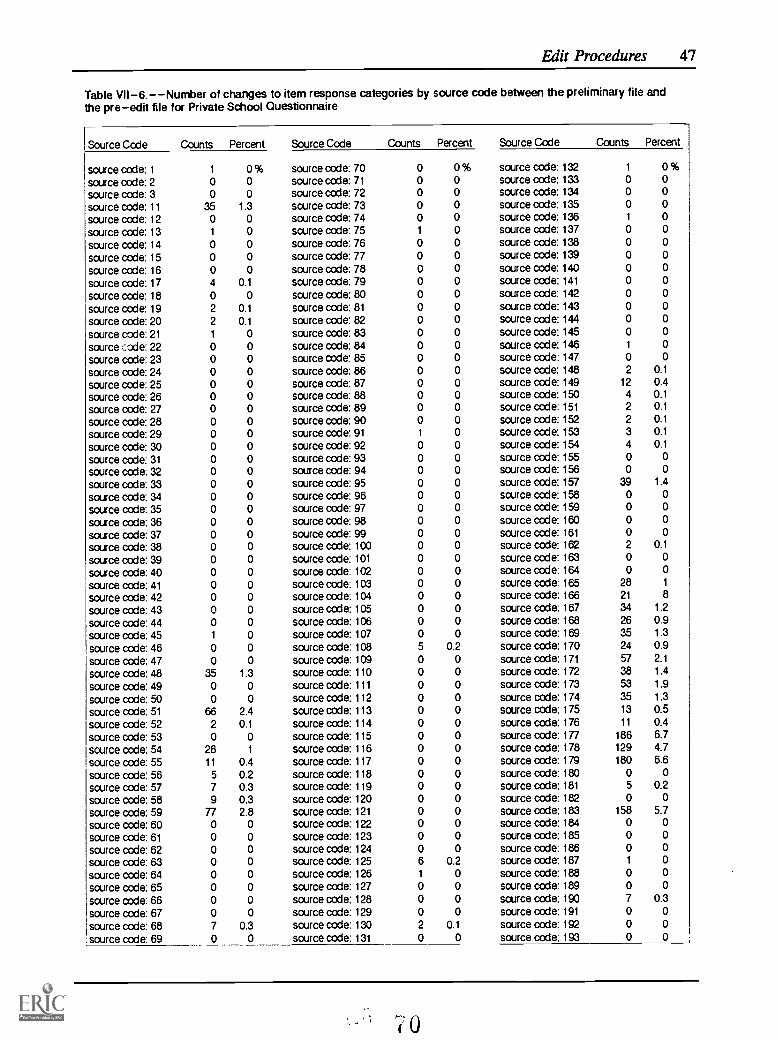
Edit Procedures 47
Table VII-6.--Number of changes to item response categories by source code between the preliminary file andthe pre-edit file for Private School Questionnaire
Source Code
source cede: 1
source code: 2source code: 3source code: 11
source code: 12source code: 13source code: 14source code: 15source code: 16
source code: 17
source code: 18source code: 19source code: 20source code: 21
source code: 22source code: 23source code: 24source code: 25source code: 26source code: 27source code: 28source code: 29source code: 30source code: 31
source code: 32source code: 33source code: 34source code: 35source code: 36source code: 37source code: 38source code: 39source code: 40source code: 41
source code: 42source code: 43source code: 44source code: 45source code: 46source code: 47source code: 48source code: 49source code: 50source code: 51
source code: 52source code: 53source code: 54source code: 55source code: 56source code: 57source code: 58source code: 59source code: 60source code: 61
source code: 62source code: 63source code: 64source code: 65source code: 66source code: 67source code: 68source code: 69
Counts Percent
1 0 %0 00 0
35 1.30 01 0
0 00 00 04 0.1
0 02 0.1
2 0.1
1 00 00 00 00 00 00 00 00 00 00 00 00 00 00 00 00 00 00 00 00 00 00 00 01 00 00 0
35 1.30 00 0
66 2.42 0.1
0 028 1
11 0.45 0.27 0.39 0.3
77 2.80 00 00 00 00 00 0
0 00 07 0.30 0
Source Code
source code: 70source code: 71
source code: 72source code: 73source code: 74source code: 75source code: 76source code: 77source code: 78source code: 79source code: 80source code: 81
source code: 82source code: 83source code: 84source code: 85source code: 86source code: 87source code: 88source code: 89source code: 90source code: 91
source code: 92source code: 93source code: 94source code: 95source code: 96source code: 97source code: 98source code: 99source code: 100
source code: 101
source code: 102
source code: 103source code: 104source code: 105source code: 106
source code: 107source code: 108
source code: 109source code: 110
source code: 111
source code: 112source code: 113source code: 114source code: 115source code: 116source code: 117source code: 118source code: 119source code: 120source code: 121
source code: 122source code: 123source code: 124source code: 125source code: 126source code: 127source code: 128source code: 129source code: 130source code: 131
Counts Percent
0 0 %0 00 00 00 01 00 00 00 00 00 00 00 00 00 00 00 00 00 00 00 01 00 00 00 00 00 00 00 00 00 00 00 00 00 00 00 00 05 0.20 00 00 00 00 00 00 00 00 00 00 00 00 00 00 00 06 0.21 00 00 00 02 0.1
0 0
70
Source Code
source code: 132source code: 133source code: 134source code: 135source code: 136source code: 137source code: 138source code: 139source code: 140source code: 141
source code: 142source code: 143source code: 144source code: 145source code: 146source code: 147source code: 148source code: 149source code: 150source code: 151
source code: 152
source code: 153source code: 154source code: 155scurce code: 156source code: 157source code: 158source code: 159source code: 160source code: 161source code: 162
source code: 163source code: 164source code: 165source code: 166source code: 167source code: 168source code: 169source code: 170source code: 171
source code: 172source code: 173source code: 174source code: 175source code: 176source axle: 177source code: 178source code: 179source code: 180source code: 181
source code: 182source code: 183source code: 184source code: 185source code: 186source code: 187source code: 188
source code: 189source code: 190
source code: 191
source code: 192
source code: 193
Counts Percent
1 0 %0 00 00 01 00 00 00 00 00 00 00 00 00 01 00 02 0.1
12 0.44 0.12 0.1
2 0.13 0.1
4 0.1
0 00 0
39 1.40 00 00 00 02 0.1
0 00 0
28 1
21 834 1.2
26 0.935 1.324 0.957 2.1
38 1.453 1.935 1.313 0.511 0.4
186 6.7129 4.7180 6.6
0 05 0.20 0
158 5.70 00 00 01 00 00 07 0.30 00 00 0
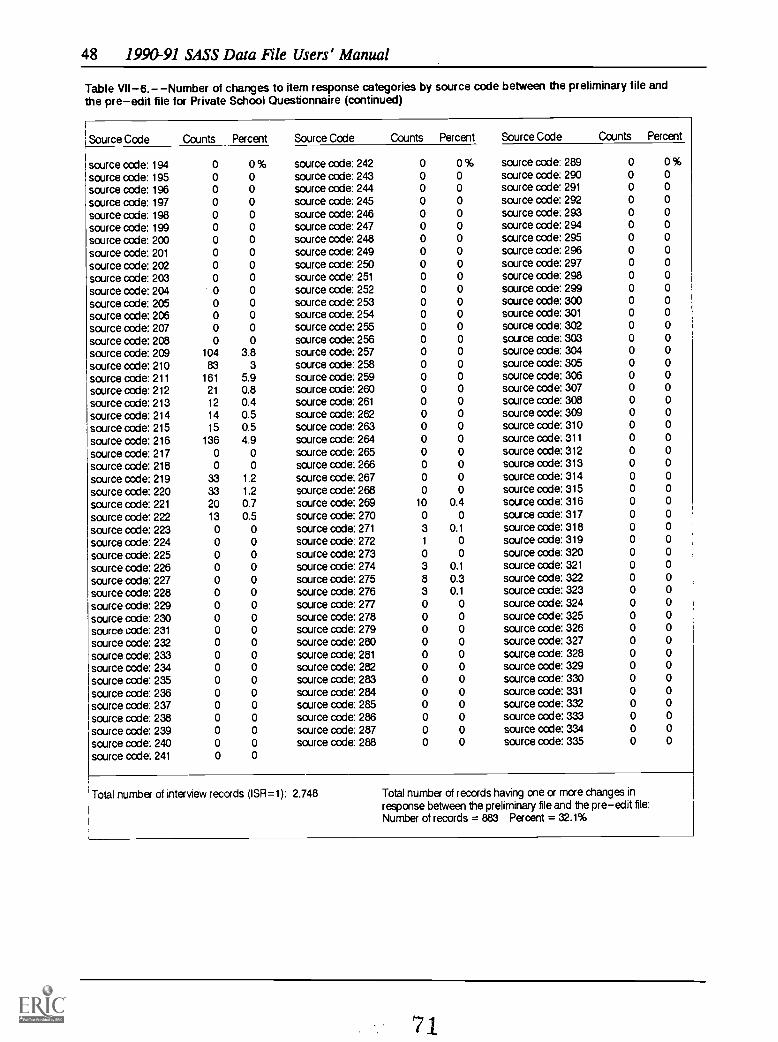
48 1990-91 SASS Data File Users' Manual
Table VII-6. Number of changes to item response categories by source code between the preliminary file andthe preedit file for Private School Questionnaire (continued)
Source Code
source code: 194source code: 195source code: 196source code: 197source code: 198source code: 199source code: 200source code: 201source code: 202source code: 203source code: 204source code: 205source code: 206source code: 207source code: 208source code: 209source code: 210source code: 211source code: 212source code: 213source code: 214source code: 215source code: 216source code: 217source code: 218source code: 219source code: 220source code: 221source code: 222source code: 223source code: 224source code: 225source code: 226source code: 227source code: 228source code: 229source code: 230source code: 231source code: 232source code: 233source code: 234source code: 235source code: 236source code: 237source code: 238source code: 239source code: 240source code: 241
Counts Percent
0 0 %0 00 00 00 00 00 00 00 00 00 00 00 00 00 0
104 3.883 3
161 5.921 0.812 0.414 0.515 0.5
136 4.90 00 0
33 1.233 1.220 0.713 0.5
0 00 00 00 00 00 00 00 00 00 00 00 00 00 00 00 00 00 00 0
Source Code
source code: 242source code: 243source code: 244source code: 245source code: 246source code: 247source code: 248source code: 249source code: 250source code: 251source code: 252source code: 253source code: 254source code: 255source code: 256source code: 257source code: 258source code: 259source code: 260source code: 261source code: 262source code: 263source code: 264source code: 265source code: 266source code: 267source code: 268source code: 269source code: 270source code: 271source code: 272source code: 273source code: 274source code: 275source code: 276source code: 277source code: 278source code: 279source code: 280source code: 281source code: 282source code: 283source code: 284source code: 285source code: 286source code: 287source code: 288
Counts Percent
0 0 %0 00 00 00 00 00 00 00 00 00 00 00 00 00 00 00 00 00 00 00 00 00 00 00 00 00 0
10 0.40 03 0.1
1 00 03 0.1
8 0.33 0.1
0 00 00 00 00 00 00 00 00 00 00 00 0
Source Code
source code: 289source code: 290source code: 291source code: 292source code: 293source code: 294source code: 295source code: 296source code: 297source code: 298source code: 299source code: 300source code: 301source code: 302source code: 303source code: 304source code: 305source code: 306source code: 307source code: 308source code: 309source code: 310source code: 311source code: 312source code: 313source code: 314source code: 315source code: 316source code: 317source code: 318source code: 319source code: 320source code: 321source code: 322source code: 323source code: 324source code: 325source code: 326source code: 327source code: 328source code: 329source code: 330source code: 331source code: 332source code: 333source code: 334source code: 335
Counts Percent
0 0 %0 00 00 00 00 00 00 00 00 00 00 00 00 00 00 00 00 00 00 00 00 00 00 00 0
0 00 00 00 00 00 00 00 00 00 00 00 00 00 00 00 00 00 00 00 00 00 0
Total number of interview records (ISR =1): 2,748 Total number of records having one or more changes inresponse between the preliminary file and the preedit file:Number of records = 883 Percent = 32.1%
71

Edit Procedures 49
Table VII-7.--Number of changes to item response categories by source code between the preliminary file andthe preedit for Indian School Questionnaire
Source Code
source code: 1source code: 2source code: 11source code: 13source code: 14source code: 15source code: 18source code: 19source code: 20source code: 21source code: 22source code: 23source code: 24source code: 25source code: 26source code: 27source code: 28source code: 29source code: 30source code: 31source code: 32source code: 33source code: 34source code: 35source code: 36source code: 37source code: 38source code: 39source code: 40source code: 41source code: 42source code: 43source code: 44source code: 45source code: 46source code: 47source code: 48source code: 49source code: 50source code: 51source code: 52source code: 53source code: 54source code: 55source code: 56source code: 57source code: 58source code: 59source code: 60source code: 61source code: 62source code: 63source code: 64source code: 65source code: 104source code: 105source code: 106source code: 107source code: 108source code: 109source code: 110source code: 111
Counts Percent
0 0 %0 02 2
0 00 00 00 00 00 00 00 00 00 00 00 00 00 00 00 00 00 00 00 00 00 00 00 00 00 00 00 00 00 00 00 00 0
2 2
0 00 03 3.1
0 00 00 01 1
0 00 00 00 00 00 00 00 00 00 00 00 00 00 00 00 00 00 0
Source Code Counts Percent Source Code
source code: 112 0 0 % source code: 174source code: 113 0 0 source code: 175source code: 114 0 0 source code: 176source code: 115 0 0 source code: 177source code: 116 0 0 source code: 178source code: 117 0 0 source code: 179source code: 118 0 0 source code: 180source code: 119 0 0 source code: 181source code: 120 0 0 source code: 182source code: 121 0 0 source code: 183source code: 122 0 0 source code: 184source code: 123 0 0 source code: 185source code: 124 0 0 source code: 186source code: 125 0 0 source code: 187source code: 126 0 0 source code: 188source code: 127 0 0 source code: 189source code: 128 0 0 source code: 190source code: 129 0 0 source code: 191source code: 130 0 0 source code: 192source code: 131 0 0 source code: 193source code: 132 0 0 source code: 194source code: 133 0 0 source code: 195source code: 134 0 0 source code: 196source code: 135 0 0 source code: 197source code: 136 0 0 source code: 198source code: 137 0 0 source code: 199source code: 138 0 0 source code: 200source code: 139 0 0 source code: 201source code: 140 0 0 source code: 202source code: 141 0 0 source code: 203source code: 142 0 0 source code: 204source code: 143 0 0 source code: 205source code: 144 0 0 source code: 206source code: 145 0 0 source code: 207source code: 146 0 0 source code: 208source code: 147 0 0 source code: 209source code: 148 0 0 source code: 210source code: 149 0 0 source code: 211source code: 150 0 0 source code: 212source code: 151 1 1 source code: 213source code: 152 1 1 source code: 214source code: 153 0 0 source code: 215source code: 154 0 0 source code: 216source code: 155 0 0 source code: 217source code: 156 0 0 source code: 218source code: 157 1 1 source code: 219source code: 158 0 0 source code: 220source code: 159 0 0 source code: 221source code: 160 0 0 source code: 222source code: 161 0 0 source code: 223source code: 162 0 0 source code: 224source code: 163 0 0 source code: 225source code: 164 0 0 source code: 226source code: 165 0 0 source code: 227source code: 166 0 0 source code: 228source code: 167 0 0 source code: 229source code: 168 0 0 source code: 230source code: 169 0 0 source code: 231source code: 170 0 0 source code: 232source code: 171 3 3.1 source code: 233source code: 172 0 0 source code: 234source code: 173 0 0 source code: 235
Counts Percent
0 0 %0 00 09 9.26 6.15 5.1
0 00 00 05 5.1
0 00 00 00 00 00 00 00 00 00 00 00 00 00 00 00 00 00 00 00 00 00 00 00 00 04 4.1
1 1
5 5.1
2 20 00 00 03 3.10 00 00 00 00 00 00 00 00 00 00 00 00 00 00 00 00 00 00 0
.

50 1990-91 SASS Data File Users' Manual
Table VII -7. Number of changes to item response categories by source code between the preliminary file andthe preedit file for Indian School Questionnaire (continued)
Source Code
source code: 236source code: 237source code: 238source code: 239source code: 240source code: 241source code: 245source code: 246source code: 247source code: 248source code: 249source code: 250source code: 251source code: 252source code: 253source code: 254source code: 255source code: 256source code: 257source code: 258source code: 259source code: 260source code: 261source code: 262source code: 263source code: 264source code: 265source code: 266source code: 267source code: 268source code: 269
Counts Percent
0 0 %0 00 00 00 00 00 00 00 00 00 00 00 00 00 00 00 00 00 00 00 00 00 00 00 00 00 00 00 00 02 2
Source Code
source code: 270source code: 271source code: 272source code: 273source code: 274source code: 275source code: 276source code: 279source code: 280source code: 281source code: 282source code: 283source code: 284source code: 285source code: 286source code: 287source code: 288source code: 289source code: 290source code: 291source code: 292source code: 293source code: 294source code: 295source code: 296source code: 297source code: 298source code: 299source code: 300source code: 301
Counts Percent
0 0 %1 1
0 00 00 00 00 00 00 00 00 00 00 00 00 00 00 00 00 00 00 00 00 00 00 00 00 00 00 00 0
Source Code
source code: 242source code: 243source code: 244source code: 302source code: 303source code: 304source code: 305source code: 306source code: 307source code: 308source code: 309source code: 310source code: 311source code: 312source code: 313source code: 315source code: 316source code: 317source code: 318source code: 319source code: 326source code: 327source code: 328source code: 329source code: 330source code: 331source code: 332source code: 333source code: 334source code: 335
Counts Percent
0 0 %0 00 00 00 00 00 00 00 00 00 00 00 00 00 00 00 00 00 00 00 00 00 00 00 00 00 00 00 00 0
Total number of interview records (ISR =1): 98 Total number of records having one or more changesresponse between the prelimary file and the preedit file:Number of Records = 34 Percent = 34.7 %
7 3

Edit Procedures 51
Table Number of changes to item response categories by source code between the preliminary file andthe preedit file for Public School Teachers Questionnaire
Source Code
source code: 1source code: 2source code: 11source code: 12source code: 13source code: 14source code: 15source code: 16source code: 17source code: 18source code: 19source code: 20source code: 21source code: 22source code: 23source code: 24source code: 25source code: 26source code: 27source code: 28source code: 29source code: 30source code: 31source code: 32source code: 33source code: 34source code: 35source code: 36source code: 37source code: 38source code: 39source code: 40source code: 41source code: 42source code: 43source code: 44source code: 45source code: 46source code: 47source code: 48source code: 49source code: 50source code: 51source code: 52source code: 53source code: 54source code: 55source code: 56source code: 57source code: 58source code: 59source code: 60source code: 61source code: 62source code: 63source code: 64source code: 65source code: 66source code: 67source code: 68source code: 69source code: 70
Counts Percent
5 0%0 0
598 1.2201 0.4
3205 6.62364 4.9
0 00 0
417 0.90 00 00 00 00 00 00 00 00 00 00 0
37 0.10 0
105 0.24 00 00 00 00 00 0
79 0.20 0
27 0.1
12 017 08 04 07 05 0
14 0403 0.827 0.1
23 024 035 0.1
33 0.132 0.1
4 04 07 0
1341 2.80 00 00 0
0 00 00 00 0o 00 00 00 00 0
Source Code
source code: 71source code: 72source code: 73source code: 74source code: 75source code: 76source code: 77source code: 78source code: 79source code: 80source code: 81source code: 82source code: 83source code: 84source code: 85source code: 86source code: 87source code: 88source code: 89source code: 90source code: 91source code: 92source code: 93source code: 94source code: 95source code: 96source code: 97source code: 98source code: 99source code: 100source code: 101source code: 102source code: 103source code: 104source code: 105source code: 106source code: 107source code: 108source code: 109source code: 110source code: 111source code: 112source code: 113source code: 114source code: 115source code: 116source code: 117source code: 118source code: 119source code: 120source code: 121source code: 122source code: 123source code: 124source code: 125source code: 126source code: 127source code: 128source code: 129source code: 130source code: 131source code: 132
Counts Percent
0 0 %0 00 00 00 00 00 00 00 00 00 00 00 00 00 00 00 00 00 00 00 00 00 00 00 00 00 00 00 00 0
339 0.7172 0.4176 0.4
0 00 00 00 00 00 00 00 0
22 09 0
14 027 0.1
28 0.1
30 0.135 0.1
42 0.141 0.1
46 0.1
52 0.145 0.1
10 0.1
48 0.1
43 0.1
4 00 00 00 00 00 0
Source Code
source code: 133source code: 134source code: 135source code: 136source code: 137source code: 138source code: 139source code: 140source code: 141source code: 142source code: 143source code: 144source code: 145source code: 146source code: 147source code: 148source code: 149source code: 150source code: 151source code: 152source code: 153source code: 154source code: 155source code: 156source code: 157source code: 158source code: 159source code: 160source code: 161source code: 162source code: 163source code: 164source code: 165source code: 166source code: 167source code: 168source code: 169source code: 170source code: 171source code: 172source code: 173source code: 174source code: 175source code: 176source code: 177source code: 178source code: 179source code: 180source code: 181source code: 182source code: 183source code: 184source code: 185source code: 186source code: 187source code: 188source code: 189source code: 190source code: 191source code: 192source code: 193source code: 194
Counts Percent
0 0%0 00 00 00 00 00 00 00 00 00 00 00 00 00 00 00 00 00 00 00 00 00 00 00 00 00 00 00 00 00 00 00 00 00 00 00 00 00 00 00 00 00 00 00 00 00 00 00 00 00 00 00 00 00 00 00 0
0 00 00 00 00 0
BEST COPY AVAILABLE74
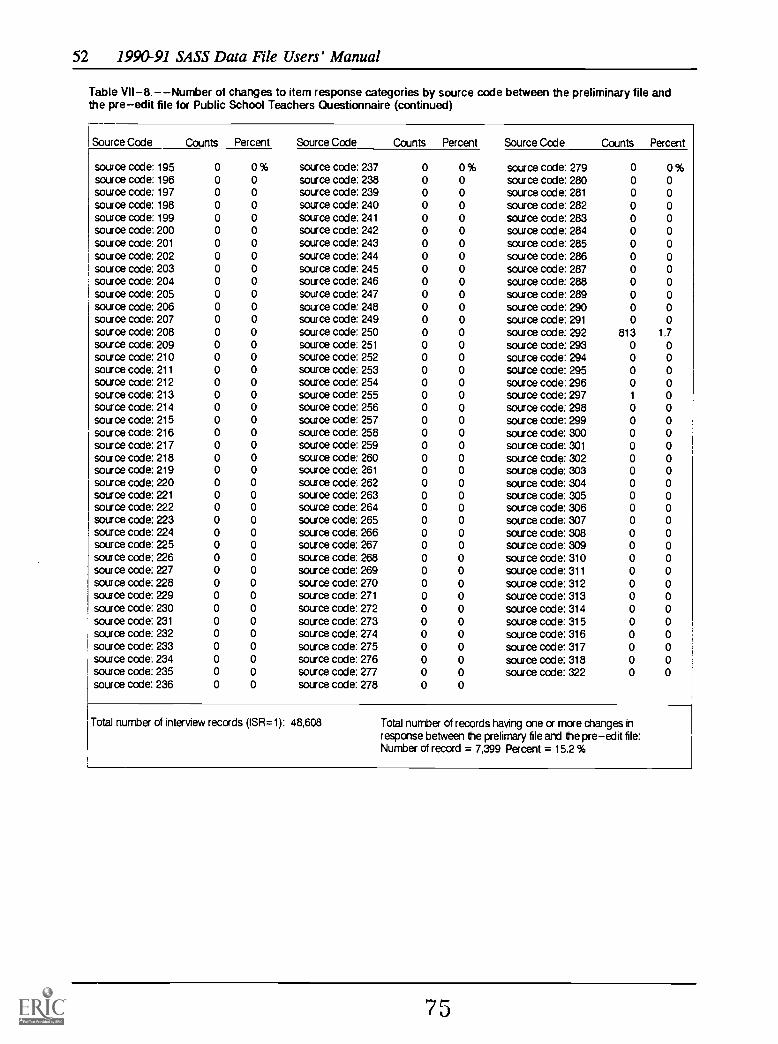
52 1990-91 SASS Data File Users' Manual
Table VII -8. -- Number of changes to item response categories by source code between the preliminary file andthe preedit file for Public School Teachers Questionnaire (continued)
Source Code
source code: 195source code: 196source code: 197source code: 198source code: 199source code: 200source code: 201source code: 202source code: 203source code: 204source code: 205source code: 206source code: 207source code: 208source code: 209source code: 210source code: 211source code: 212source code: 213source code: 214source code: 215source code: 216source code: 217source code: 218source code: 219source code: 220source code: 221source code: 222source code: 223source code: 224source code: 225source code: 226source code: 227source code: 228source code: 229source code: 230source code: 231source code: 232source code: 233source code: 234source code: 235source code: 236
Counts Percent
0 0 %0 00 00 00 00 00 00 00 00 00 00 00 00 00 00 00 00 00 00 00 00 00 00 00 00 00 00 00 00 00 00 00 00 00 00 00 00 00 00 00 00 0
Source Code
source code: 237source code: 238source code: 239source code: 240source code: 241source code: 242source code: 243source code: 244source code: 245source code: 246source code: 247source code: 248source code: 249source code: 250source code: 251source code: 252source code: 253source code: 254source code: 255source code: 256source code: 257source code: 258source code: 259source code: 260source code: 261source code: 262source code: 263source code: 264source code: 265source code: 266source code: 267source code: 268source code: 269source code: 270source code: 271source code: 272source code: 273source code: 274source code: 275source code: 276source code: 277source code: 278
Counts Percent
0 0 %0 00 00 00 00 00 00 00 00 00 00 00 00 00 00 00 00 00 00 00 00 00 00 00 00 00 00 00 00 00 00 00 00 00 00 00 00 00 00 00 00 0
Source Code
source code: 279source code: 280source code: 281source code: 282source code: 283source code: 284source code: 285source code: 286source code: 287source code: 288source code: 289source code: 290source code: 291source code: 292source code: 293source code: 294source code: 295source code: 296source code: 297source code: 298source code: 299source code: 300source code: 301source code: 302source code: 303source code: 304source code: 305source code: 306source code: 307source code: 308source code: 309source code: 310source code: 311source code: 312source code: 313source code: 314source code: 315source code: 316source code: 317source code: 318source code: 322
Counts Percent
0 0 %0 00 00 00 00 00 00 00 00 00 00 00 0
813 1.70 00 00 00 01 00 00 00 00 00 00 00 00 00 00 00 00 00 00 00 00 00 00 00 00 00 00 0
Total number of interview records (ISR =1): 48,608 Total number of records having one or more changes inresponse between the prelirnary file and the preedit file:Number of record = 7,399 Percent = 15.2 %
7 5
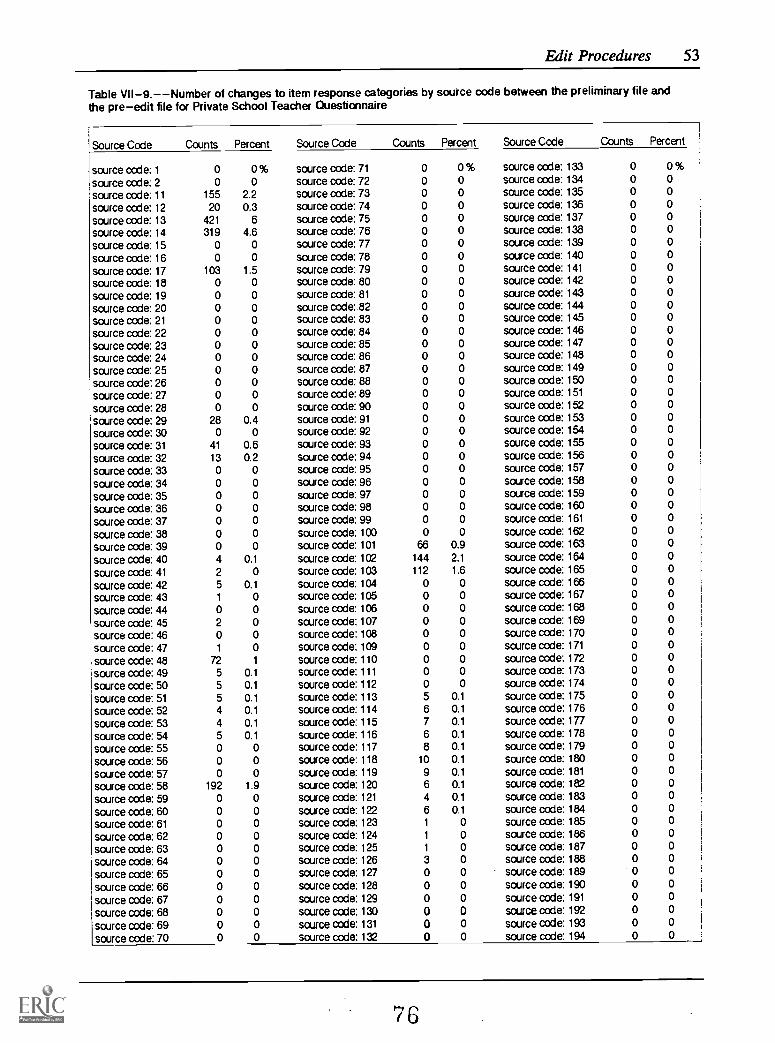
Edit Procedures 53
Table VII -9. -- Number of changes to item response categories by source code between the preliminary file andthe preedit file for Private School Teacher Questionnaire
Source Code
source code: 1source code: 2source code: 11source code: 12source code: 13source code: 14source code: 15source code: 16source code: 17source code: 18sauce code: 19source code: 20source code: 21source code: 22sauce code: 23source code: 24source code: 25source code: 26source code: 27source code: 28source code: 29source code: 30source code: 31source code: 32source code: 33sauce code: 34source code: 35source code: 36source code: 37source code: 38source code: 39source code: 40source code: 41source code: 42source code: 43source code: 44source code: 45source code: 46source code: 47source code: 48source code: 49source code: 50source code: 51source code: 52source code: 53source code: 54source code: 55source code: 56source aide: 57source code: 58source code: 59sauce code: 60source code: 61source code: 62source code: 63source code: 64source code: 65source code: 66source code: 67source code: 68source code: 69source code: 70
Counts Percent
0 0 %0 0
155 2.220 0.3
421 6319 4.6
0 00 0
103 1.50 00 00 00 00 00 00 00 00 00 00 0
28 0.40 0
41 0.613 0.20 00 00 00 00 00 00 04 0,1
2 05 0.11 00 02 00 01 0
72 1
5 0.15 0.1
5 0.14 0.1
4 0.1
5 0.1
0 00 00 0
192 1.90 00 00 00 00 00 00 00 00 00 00 00 0
Source Code
source code: 71source code: 72source code: 73source code: 74source code: 75source code: 76source code: 77source code: 78source code: 79source code: 80source code: 81source code: 82source code: 83source code: 84source code: 85source code: 86source code: 87source code: 88source code: 89source code: 90source code: 91source code: 92source code: 93source code: 94source code: 95source code: 96source code: 97source code: 98source code: 99source code: 100source code: 101source code: 102source code: 103source code: 104source code: 105source code: 106source code: 107source code: 108source code: 109source code: 110source code: 111source code: 112source code: 113source code: 114source code: 115source code: 116source code: 117source code: 118source code: 119source code: 120source code: 121source code: 122source code: 123source code: 124source code: 125source code: 126source code: 127source code: 128source code: 129source code: 130source code: 131source code: 132
Counts Percent
0 0 %0 00 00 00 00 00 00 00 00 00 00 00 00 00 00 00 00 00 00 00 00 00 00 00 00 00 00 00 00 0
66 0.9144 2.1
112 1.60 00 00 00 00 00 00 00 00 05 0.1
6 0.1
7 0.1
6 0.1
8 0.1
10 0.1
9 0.1
6 0.1
4 0.1
6 0.1
1 01 01 03 00 00 00 00 00 00 0
Source Code
source code: 133source code: 134source code: 135source code: 136source code: 137source code: 138source code: 139source code: 140source code: 141source code: 142source code: 143source code: 144source code: 145source code: 146source code: 147source code: 148source code: 149source code: 150source code: 151source code: 152source code: 153source code: 154source ccde: 155source code: 156source code: 157source code: 158source code: 159source code: 160source code: 161source code: 162source code: 163source code: 164source code: 165source code: 166sauce code: 167source code: 168source code: 169source code: 170source code: 171source code: 172source code: 173source code: 174source code: 175source code: 176source code: 177source code: 178source code: 179source code: 180source code: 181source code: 182source code: 183source code: 184source code: 185source code: 186source code: 187source code: 188source code: 189source code: 190source code: 191source code: 192source code: 193source code: 194
Counts Percent
0 0 %0 00 00 00 00 00 00 00 00 00 00 00 00 00 00 00 00 00 00 00 00 00 00 00 00 00 00 00 00 00 00 00 00 00 00 00 00 00 00 00 00 00 00 00 00 00 00 00 00 00 00 00 00 00 00 00 00 00 00 00 00 0
7 6

54 1990-91 SASS Data File Users' Manual
Table VII -9.- -Number of changes to item response categories by source code between the preliminary file andthe pre-edit file for Private School Teacher Questionnaire (continued)
Source Code
source code: 195source code: 196source code: 197source code: 198source code: 199source code: 200source code: 201source code: 202source code: 203source code: 204source code: 205source code: 206source code: 207source code: 208source code: 209source code: 210source code: 211source code: 212source code: 213source code: 214source code: 215source code: 216source code: 217source code: 218source code: 219source code: 220source code: 221source code: 222source code: 223source code: 224source code: 225source code: 226source code: 227source code: 228source code: 229source code: 230source code: 231source code: 232sauce code: 233source code: 234source code: 235source code: 236source code: 237
Counts Percent
0 0 %0 00 00 00 00 00 00 00 00 00 00 00 00 00 00 00 00 00 00 00 00 00 00 00 00 00 00 00 00 00 00 00 00 00 00 00 00 00 00 00 00 00 0
Source Code
source code: 238source code: 239source code: 240source code: 241source code: 242source code: 243source code: 244source code: 245source code: 246source code: 247source code: 248source code: 249source code: 250source code: 251source code: 252source code: 253source code: 254source code: 255source code: 256source code: 257source code: 258source code: 259source code: 260source code: 261source code: 262source code: 263source code: 264sauce code: 265source code: 266source code: 267source code: 268source code: 269source code: 270source code: 271source code: 272source code: 273source code: 274source code: 275source code: 276source code: 277source code: 278source code: 279source code: 280
Counts Percent
0 0 %0 00 00 00 00 00 00 00 00 00 00 00 00 00 00 00 00 00 00 00 00 00 00 00 00 00 00 00 00 00 00 00 00 00 00 00 00 00 00 00 00 00 0
Source Code
source code: 281source code: 282source code: 283source code: 284source code: 285source code: 286source code: 287source code: 288source code: 289source code: 290source code: 291source code: 292source code: 293sauce code: 294source code: 295source code:.296source code: 297source code: 298source code: 299source code: 300source code: 301source code: 302source code: 303source code: 304source code: 305source code: 306source code: 307source code: 308source code: 309source code: 310source code: 311source code: 312source code: 313sauce code: 314source code: 315source code: 316source code: 317source code: 318source code: 319source code: 323
Counts Percent
0 0 %0 00 00 00 00 00 00 00 00 00 0
97 1.40 00 00 00 00 00 00 00 00 00 00 00 00 00 00 00 00 00 00 00 00 00 00 00 00 00 00 00 0
Total numbs of interview records (ISR=1): 6,977 Total number of records having one or more changes inresponse between prelimary file and preedit file:Number of records: 1,213 Percent = 17.4%

Edit Procedures 55
D. Computer Edit
After pre-edit corrections were made, each file passed through a computer edit. Thisedit consisted of (1) a range check where out-of-range entries were blanked, (2) a consistencyedit where inconsistent entries were either made consistent or were blanked, and (3) ablanking edit where answers to inappropriate items were blanked and "not answered" (NA)codes were assigned to blank items that should have been answered.
E. Interview Status Edit
After the range check, consistency edit, and blanking edit were complete, the recordswere put through an edit to determine whether the case was eligible for the survey and, if so,whether sufficient data had been collected for the case to be classified as an interview. Aninterview status record (ISR) value was assigned to each case as a result of the edit.
1. Teacher Demand and Shortage Survey
Cases were classified as out-of-scope (ISR=0) if:
The district no longer existed; or
The agency named on the questionnaire label was not a school district orother public agency that employed elementary and/or secondaryteachers.
Cases were classified as interview (ISR=1) if:
The agency named on the questionnaire label still existed; and
It was a school district or other public agency that employed elementaryand/or secondary teachers; and
The number of students in the district was reported for October 1989 orOctober 1990; and
The total number of FTE teachers was reported for October 1989 orOctober 1990, or the number of NTb teachers for grades K-12 wasreported for October 1990; and
There were values for at least 30% of the minimum items that arespondent should fill of the 27 required minimum items.
Cases were classified as noninterviews (ISR=2) if the conditions for out-of-scope cases and interview cases were not met.
78

56 1990-91 SASS Data File Users' Manual
2. Public Schools (SASS-3A)
Cases were classified as out-of-scope (ISR=0) if:
The institution named on the questionnaire label was not a publicschool; or
The school named on the label was not in operation during the 1990-91school year; or
The school did not serve students in any of the grades 1-12 orcomparable ungraded levels.
Cases were classified as interviews (ISR=1) if:
It was a public school that was in operation during the 1990-91 schoolyear; and
It served students in one or more of grades 1-12 or comparableungraded levels; and
A count of K-12 students was reported for October 1989 or October1990, or a count of total students (including prekindergarten andpostsecondary) was reported for October 1990; and
The number of teachers in the school was reported; and
There were values for at least 30% of the minimum items that arespondent should fill of the 25 required minimum items.
Cases were classified as noninterviews (ISR=2) if the conditions for out-of-scope cases and interview cases were not met.
3. Private Schools (SASS-3B)
Cases were classified as out-of-scope (ISR=0) if:
The institution named on the questionnaire label was not a privateschool; or
The school named on the label was not in operation during the 1990-91school year; or
It did not serve students in any of grades 1-12 or comparable ungradedlevels; or
It was located in a private home; or
7g

Edit Procedures 57
If the question used to determine whether the school was in a privatehome was not answered, the number of students was less than 10 or thenumber of teachers was one.
Cases were classified as interviews (ISR=1) if:
The conditions for an out-of-scope case were not met; and
The count of students was reported for October 1989 or October 1990;and
The count of total teachers in FTEs was reported for October 1989 orOctober 1990, or the count of K-12 teachers was reported in FTEs orhead counts for October 1990; and
There were values for at least 30% of the minimum items that arespondent should fill of the 40 required minimum items.
Cases were classified as noninterviews (ISR=2) if the conditions for out-of-scope cases and interview cases were not met.
4. Bureau of Indian Affairs Schools (SASS-3C)
Cases were classified as out-of-scope (ISR=0) if:
The institution named on the questionnaire label was not a school; or
The school named on the label was not in operation during the 1990-91school year; or
The school did not serve students in any of grades 1-12 or comparableungraded levels.
Cases were classified as interviews (ISR=1) if:
The conditions for out-of-scope cases were not met; and
The count of students was reported for October 1989 or October 1990;and
The count of total teachers in 1. I Es was reported for October 1989 orOctober 1990, or the count of K-12 teachers was reported in FlEs orhead counts for October 1990; and
There were values for at least 30% of the minimum items that arespondent should fill.
80

58 1990-91 SASS Data File Users' Manual
Cases were classified as noninterviews (ISR=2) if the conditions for out-of-scope cases and interview cases were not met.
5. Public and Private School Administrators (SASS-2A and 2B)
Cases were classified as out-of-scope (ISR=0) if:
The school named on the questionnaire label was classified as out-of-scope; or
The school had no principal, headmaster, etc.
Cases were classified as interviews (ISR =1) if:
The conditions for out-of-scope cases were not met; and
At least one part of the educational background section had values inrange; and
The number of years as principal of school named on the label wasreported; and
There were values for at least 30% of the minimum items that arespondent should fill of the 9 required minimum items.
Cases were classified as noninterviews (ISR=2) if the conditions for out-of-scope cases and interview cases were not met.
6. Public and Private School Teachers (SASS-4A and 4B)
Cases were classified as out-of-scope (ISR=0) if:
The school where the teacher was selected for sample was classified asout-of-scope; or
The person named on the questionnaire label had never worked at theschool named on the label; or
The person's main assignment at the school was not teaching; or
The teacher no longer worked at the school named on the label (forexample, transferred to another school, retired, deceased, left teaching);or
The person named on the label was a short-term substitute teacher,student teacher, teacher's aide, or administrator.
81

Edit Procedures 59
Cases were classified as interviews (ISR=1) if:
The conditions for out-of-scope cases were not met; and
The respondent reported the year that he or she began working as anelementary or secondary teacher; and
At least one part of the educational background section had valueswithin specified ranges; and
The teacher's main assignment field was reported; and
The respondent reported whether or not he or she was certified inhis/her main assignment field; and
At least one grade level of students taught by the respondent wasreported; and
There are values for at least 30% of the minimum items that arespondent should fill.
Cases were classified as noninterviews (ISR=2) if the conditions for out-of-scope cases and interview cases were not met.
F. Post Processing Edit
The initial review of the data tapes for the 1991 Schools and Staffing Survey (SASS)indicated that the estimates of total teachers from the public school file (SASS-3A) were atleast 15 percent greater than the state Full-Time Equivelent (FIE) teacher counts reported onthe 1991 CCD for nine states: Arkansas, Iowa, Missouri, Montana, Nebraska, NorthDakota, Oklahoma, South Dakota, and Wisconsin; in addition, staff review of data fromArizona indicated data problems requiring further review. (See Appendix A for the definitionof FTE teachers.)
The SASS school records were examined and two primary causes were found forthese overestimates. First, schools did not report data for their school but rather for theentire school district. At times this was due to vague or incorrect school names on thequestionnaire label and at times the respondent misunderstood the instructions. The secondfactor contributing to the overestimates was that school administrators did not define schoolsin the same way that CCD did. For example, a school with grades K-8 at one address might,in fact, be two CCD schools - an elementary school with grades K-6 and a middle schoolwith grades 7 and 8.
Because of the large differences between SASS and CCD in the nine states, a post-processing edit was implemented to improve SASS state estimates of the number of schools,
82
60 1990-91 SASS Data File Users' Manual
enrollment, and teachers relative to the CCD. In general, the approach adopted was to editSASS data to improve their consistency with CCD reported data:
If certain grade levels were not reported on CCD but were reported in SASS(e.g. CCD reported elementary, middle or secondary when SASS reported K-12, or CCD reported 7-8, 7-9, 9-12, or 10-12 when SASS reported 7-12), thegrade levels reported to SASS, but not in agreement with CCD, were deletedfrom the SASS file.
The head count of teachers on the SASS school record was edited to beconsistent with the adjusted enrollment count (previous bullet) and with theCCD teacher count.
All entries on the SASS file involving counts of students or teachers wereadjusted to be consistent with the adjusted enrollment and total teacher counts.
In certain cases, records for schools that had been made out-of-scope becausethe schools had been treated as "merged" were reinstated and data from the"merged" schools were allocated to the individual schools.
Teacher records for teachers who taught only grades no longer considered partof the sample school (due to the post-processing edit) were reclassified as out-of-scope.
Records for teachers at schools previously classified as out-of-scope because ofmergers were reinstated in the file.
To accomplish this edit, SASS school information was compared to the 1990-91 CCDin a school-to-school match. For approximately 375 schools within the ten states, largedifferences between the SASS and CCD records were identified. For some schools thenumber of teachers on the SASS school record was at least 10 percent greater than thenumber of teachers on the CCD record. Also, differences resulted from one or more of theK-12 grade levels being reported on the SASS record when it was not reported on the CCDrecord.
Correction sheets were created which displayed the 1990-91 SASS schoolquestionnaire (SASS-3A) entries, the 1990-91 CCD enrollment by grade levels and theteacher counts with space for recording new SASS values. For about 75 schools no changeswere made to the SASS data because: 1) there was only one grade level difference betweenSASS and CCD; 2) the CCD information appeared to be incorrect (e.g., zero for enrollmentor teacher count, grades 1 and 6 but not 2-5, etc.); or 3) the enrollment counts for CCD andSASS were very similar but the grade levels were different (e.g., SASS reported grades K-6and CCD reported that all students were ungraded).
For approximately 300 SASS school (SASS-3A) records, the SASS information wasedited for consistency with CCD. This was done when the CCD data appeared to be correct,
83

Edit Procedures 61
when the SASS record included two or more grade levels not reported on CCD, and whenthere was a significant difference between the SASS and CCD enrollment values.
One SASS school record was reclassified as out-of-scope because the data werereported for a district rather than a school. Another record was reclassified as a noninterviewbecause it appeared that information had been provided for the wrong school.
In 20 cases, there were two schools located in the same building and both schoolswere selected for the SASS sample. Rather than completing each questionnaire, the schoolswere combined and only one questionnaire was returned. Phone calls were made to theschools and correct data were obtained. Thus, each record was reclassified from non-interview to interview status.
After the edits were implemented, the school files for each of the ten states werereprocessed through the edits, ISR, imputation, final edits, and weighting. Some qualitycontrol checks were done on the new state files and new weighted estimates of students andteachers for each state were computed.
The quality control checks and the new state enrollment and teacher estimatessuggested that some reporting errors remained. For some schools, the respondents hadreported students and grade levels for the school (or part of a school) named on thequestionnaire label but had reported teachers for a larger entity (e.g., all of grades 7-12instead of only grades 7 and 8).
After another round of edits, some differences still remain (see Table VII-10). Someof these differences are probably due to response errors in SASS overlooked during thecorrection process and some are due to possible errors on the CCD. For example, for SouthDakota, there are 65 schools where the 1991 CCD has teacher counts with values of zero ormissing; for Oklahoma, there are 28 schools where the CCD student/teacher ratio is greaterthan 30 to 1, and 9 where the ratio is greater than 100 to 1. When CCD and SASS stateaggregates were compared, unexplained differences remained.
Because changes were made to some school records, teacher records (in the SASSpublic school teacher file; SASS-4A) associated with those schools also needed to be edited.After inconsistent grade levels were deleted from the SASS school records in the ten states,teacher records for teachers who taught only grades outside the new grade level range for theschool were reclassified as out-of-scope.
Records for teachers associated with schools reclassified from out-of-scope tointerview were also reclassified if they taught one or more grades now considered part of theschool or if there was insufficient information to determine grades taught. These teacherrecords were reclassified as interviews if there were enough data to meet the requirements foran interview in the ISR edit; if there were not enough data, they become noninterviews.
The ten states were reweighted and the new state estimates of teachers were producedfrom the file. SASS estimates for the teacher file were still higher than CCD for some states(see Table VII-11).
84

62 1990-91 SASS Data File Users' Manual
Similar estimation problems occurred in the 1987-88 SASS; however, there were somedifferences:
1. In 1987-88, the overestimates of students were worse than those for teachers,while the reverse was true in 1991;
2. Teacher overestimates were high for both the 1987-88 and the 1990-91 SASS,however, they tended to be higher in 1987-88. In 1987-88, the highestoverestimates were for Montana (33%) and Iowa (26%). In 1991 they werehighest for South Dakota (32%) and Wisconsin (17%).
Because of the overestimates of students and teachers in the 1987-88 SASS, similarproblems were anticipated in the 1990-91 SASS. To remedy the problem, instructions wereadded to the 1990-91 school questionnaires (SASS-3A) for respondents to report data only forthe school named on the questionnaire label.
Also, the expected number of students and teachers for each school was displayed onthe front of the school's questionnaire. For cases showing a difference of 50 percent ormore, follow-up phone calls were made to obtain either correct data or an explanation for thedifference. More information on these procedures can be found in the Editing Procedureschapter (Chapter VII) of the Users Manual. The methods implemented to improve the 1990-91 SASS estimates were not totally successful. Had they been, there would have been noneed for the post processing edit. Reporting problems at the school level continued. Whenthese problems were observed in early 1992, questionnaire research was initiated by theCensus Bureau's Center for Survey Methods Research in an effort to improve the 1993-94SASS questionnaires. Recommendations based on more recent research are proposed byJenkins (1992)6 and Jenkins, Ciochetto, and Davis (1992).7 Additional research to improvereporting on all SASS questionnaires is ongoing.
G. Race/ethnicity Edit
Following the initial published release of Schools and Staffing in the United States:Selected Data for Public and Private Schools, 1990-91, E.D. TABS, NCES 93-453 andSchools and Staffing in the United States: A Statistical Profile, 1990-91, NCES 93-146, anerror in the distribution of the race/ethnicity items on the public school file for students andteachers was detected during an analytic investigation. Large discrepancies in Indian studentcounts for some sample schools between the frame (1988-89 Common Core of Data) andSASS were discovered. These discrepancies occurred in the reported data, and appeared to bedue to respondent error in reading the categories, so that all students were reported in the first
qenIcins, C. "Questionnaire Research in the Schools and Staffing Survey: A Cognitive Approach", 1992Proceedings of the Section on Survey Research Methods, American Statistical Association, Alexandria, VA,pages 434-439.
'Jenkins, C., S. Ciochetto, and W. Davis. "Recommendation for Changes to the Public School 1991-92Field Test Questionnaire for the Schools and Staffing Survey (SASS-3A) Based on Cognitive Interviews".Internal memorandum available from the U.S. Department of Commerce, Bureau of the Census. (Washington,D.C.: September 24, 1992).
85

Edit Procedures 63
category, "American Indian or Alaskan Native." Tables that are affected by this problem inthe Profile (none occur in the E.D. TABS) are Tables 2.3, 3.6, Appendix Tables A3, and A13.Those tables will be reissued.
The errors were isolated by setting up the following conditions: the SASS Indianstudents must be greater than or equal to 20 percent of the total student enrollment, and thenumber of Indian students reported on CCD must be 80 percent or less of the SASS numberof Indian students. In some cases, respondents reported all students in the American Indiancategory, and again in White. Adjustment by imputation reduced the counts by half the totalin each category, compounding the original reporting error. Each school's record meetingthose conditions was examined, and out of 204 schools that met the criteria, 32 wereconcluded to contain a misreporting error in the student race/ethnicity items.
The same criteria were tested on the race/ethnicity counts for teachers, and a total of152 schools met them. Out of the 152 schools, 44 were deemed to have a misreportingproblem in the teacher's race/ethnicity counts. The records of all problem student and teachercounts were adjusted, using the district record (SASS 1A)'s race/ethnicity counts as acomparison. For example, if the district reported all students and teachers as "White, non-Hispanic," then the school's count for "American Indian or Alaskan Native" students andteachers was shifted over to "White, non-Hispanic."
The overall effect to the student and teacher race/ethnicity percentage distribution asfound on the public school file is summarized in the following tables:
Before editAfter edit
Before editAfter edit
Student Race/ethnicity percentage distribution (weighted)Total Indian Asian Hispanic Black White
100.0100.0
1.3 2.9 11.11.1 2.9 11.1
16.1 68.616.2 68.8
Teacher Race/ethnicity percentage distribution (weighted)Total Indian Asian Hispanic Black White
100.0 0.7 1.0 3.1 9.1 85.5100.0 0.4 1.0 3.1 9.2 85.8
where Indian is American Indian or Alaskan Native, Asian is Asian or Pacific Islander,Hispanic may be of any race, and Black and White are non-Hispanic.
There were a total of 17 states affected by these changes to the student race/ethnicitypercentage distribution, while the number of states affected by the changes in the distributionof teachers' race/ethnicity could not be determined, as those data had not been tabulated priorto the occurrence of the problem. In those 17 states, the change in the total of Indianstudents caused the percentage distribution of race/ethnicity within a given state to differ by atleast one-tenth of a percentage point or more. The denominator used above in calculatingthe percentage distribution of students' race/ethnicity is the sum of all the student counts byrace/ethnicity, rather than the total number of students summed by grade. The number of
66

64 1990-91 SASS Data File Users' Manual
students summed across race/ethnicity categories does not equal the sum of students by grade,because the race/ethnicity items ask for counts of K-12 students only, which excludes theungraded students.
87
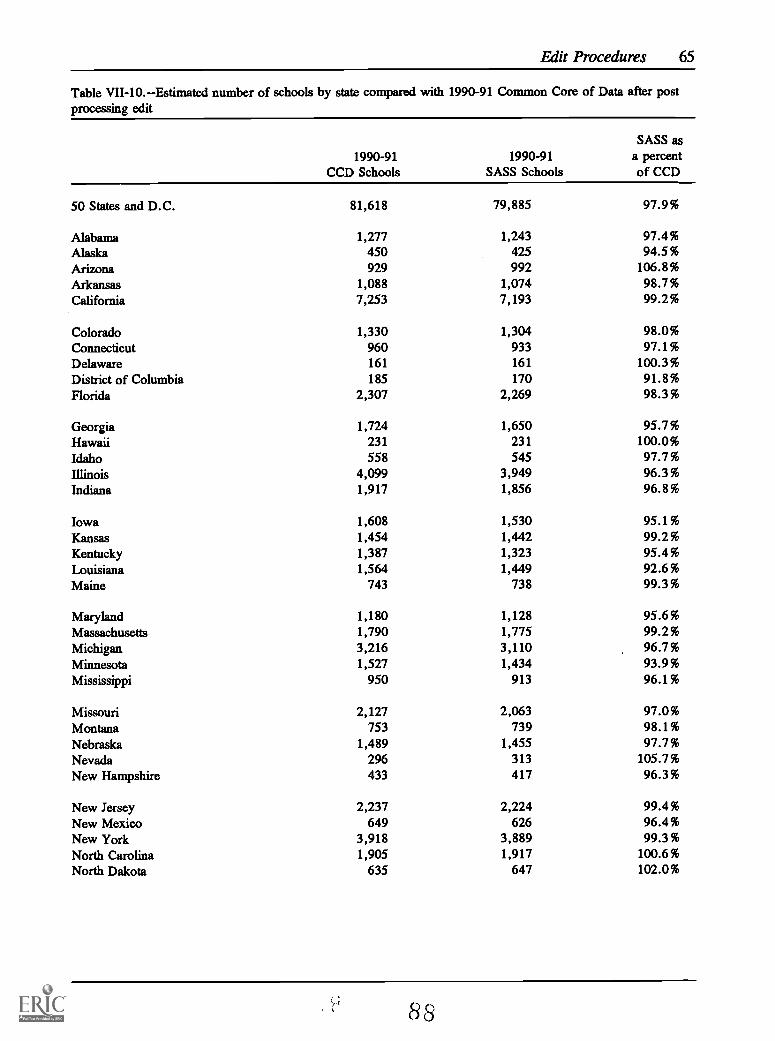
Edit Procedures 65
Table VII-10.--Estimated number of schools by state compared with 1990-91 Common Core of Data after postprocessing edit
1990-91CCD Schools
1990-91SASS Schools
SASS asa percentof CCD
50 States and D.C. 81,618 79,885 97.9%
Alabama 1,277 1,243 97.4%Alaska 450 425 94.5%Arizona 929 992 106.8%Arkansas 1,088 1,074 98.7%California 7,253 7,193 99.2%
Colorado 1,330 1,304 98.0%Connecticut 960 933 97.1%Delaware 161 161 100.3%District of Columbia 185 170 91.8%Florida 2,307 2,269 98.3%
Georgia 1,724 1,650 95.7%Hawaii 231 231 100.0%Idaho 558 545 97.7%Illinois 4,099 3,949 96.3%Indiana 1,917 1,856 96.8%
Iowa 1,608 1,530 95.1%Kansas 1,454 1,442 99.2%Kentucky 1,387 1,323 95.4%Louisiana 1,564 1,449 92.6%Maine 743 738 99.3%
Maryland 1,180 1,128 95.6%Massachusetts 1,790 1,775 99.2%Michigan 3,216 3,110 96.7%Minnesota 1,527 1,434 93.9%Mississippi 950 913 96.1%
Missouri 2,127 2,063 97.0%Montana 753 739 98.1%Nebraska 1,489 1,455 97.7%Nevada 296 313 105.7%New Hampshire 433 417 96.3%
New Jersey 2,237 2,224 99.4%New Mexico 649 626 96.4%New York 3,918 3,889 99.3%North Carolina 1,905 1,917 100.6%North Dakota 635 647 102.0%
8 8

66 1990-91 SASS Data File Users' Manual
Table VII-10.--Estimated number of schools by state compared with 1990-91 Common Core of Data after postprocessing edit (continued)
1990-91CCD Schools
1990-91SASS Schools
SASS asa percentof CCD
Ohio 3,730 3,623 97.1%Oklahoma 1,511 1,730 114.5%Oregon 1,198 1,164 97.1%Pennsylvania 3,267 3,205 98.1%Rhode Island 297 294 99.0%
South Carolina 1,096 1,085 99.0%South Dakota 787 732 93.0%Tennessee 1,556 1,485 95.4%Texas 5,796 5,651 97.5%Utah 711 718 100.9%
Vermont 331 331 100.0%Virginia 1,765 1,737 98.4%Washington 1,826 1,772 97.1%West Virginia 1,036 1,007 97.2%Wisconsin 1,974 1,848 93.6%Wyoming 407 376 92.3%
SOURCES: U.S. Department of Education, National Center for Education Statistics, Schools and StaffingSurvey 1990-91 (School Questionnaire). U.S. Department of Education, National Center for EducationStatistics, Common Core of Data, Public School Universe, 1990-91.
89

Edit Procedures 67
Table VII-11.Estimated number of teacher (1-Ths) by state compared with 1990-91 Common Core of Dataafter post processing edit
State1990-91
CCD FTEs1990-91SASS FTEs*
SASS as apercentof CCD
50 States and D.C. 2,397,351 2,464,510 102.80%
Alabama 36,266 40,862 112.67%Alaska 6,710 6,727 100.25%Arizona 32,987 31,845 96.54%Arkansas 25,984 27,662 106.46%California 217,228 208,543 96.00%
Colorado 32,342 34,615 107.03%Connecticut 34,549 34,808 100.75%Delaware 5,961 5,937 99.60%District of Columbia 5,950 5,899 99.14%Florida 108,088 106,483 98.52%
Georgia 63,058 66,390 105.28%Hawaii 9,083 10,256 112.91%Idaho 11,254 11,439 101.64%Illinois 108,775 119,400 109.77%Indiana 54,509 55,840 102.44%
Iowa 31,045 34,889 112.38%Kansas 29,140 32,117 110.22%Kentucky 36,777 37,818 102.83%Louisiana 45,704 ERRMaine 15,513 15,814 101.94%
Maryland 42,562 39,536 92.89%Massachusetts 54,003 60,289 111.64%Michigan 80,008 79,219 99.01%Minnesota 43,753 45,797 104.67%Mississippi 28,062 29,070 103.59%
Missouri 52,304 54,494 104.19%Montana 9,613 11,004 114.47%Nebraska 18,764 19,160 102.11%Nevada 10,373 10,408 100.34%New Hampshire 10,637 10,928 102.74%
New Jersey 79,886 90,556 113.36%New Mexico 16,703 18,115 108.45%New York 176,390 169,724 96.22%North Carolina 64,283 68,037 105.84%North Dakota 7,591 8,211 108.17%
90

68 1990-91 SASS Data File Users' Manual
Table VII-11.-- Estimated number of teacher (Fibs) by state compared with 1990-91 Common Core of Dataafter post processing edit (continued)
State1990-91
CCD FTEs1990-91SASS FTEs*
SASS as apercentof CCD
Ohio 102,714 104,324 101.57%Oklahoma 37,221 38,921 104.57%Oregon 26,163 26,262 100.38%Pennsylvania 100,275 110,400 110.10%Rhode Island 9,522 10,595 111.27%
South Carolina 36,963 39,178 105.99%South Dakota 8,511 11,212 131.74%Tennessee 43,051 44,183 102.63%Texas 219,298 212,475 96.89%Utah 17,884 18,691 104.51%
Vermont 7,257 6,890 94.94%Virginia 63,638 60,933 95.75%Washington 41,764 45,161 108.13%West Virginia 21,476 22,538 104.95%Wisconsin 49,302 57,726 117.09%Wyoming 6,784 7,425 109.45%
*The SASS FTE calculation is an approximate estimate based upon the full-time to part-time status of eachteacher.
SOURCES: U.S. Department of Education, National Center for Education Statistics, Schools and StaffingSurvey, 1990-91 (Teacher Questionnaire). U.S. Department of Education, National Center for EducationStatistics, Common Core of Data, Public School Universe, 1990-91.
91
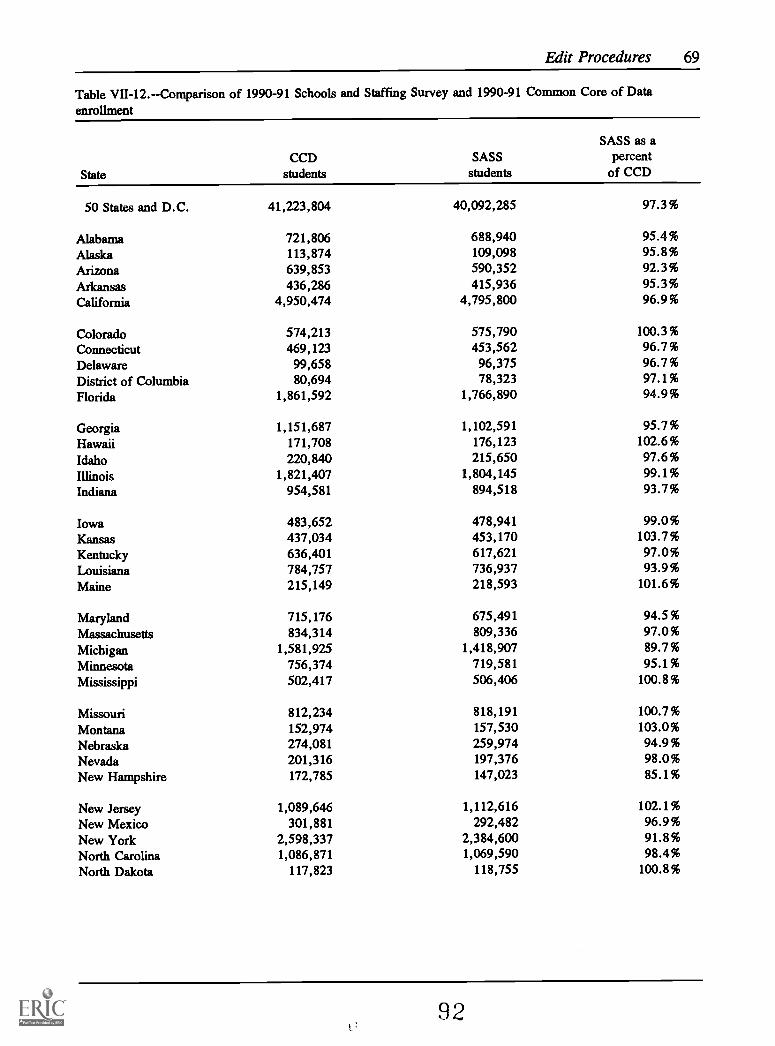
Edit Procedures 69
Table VII-12.-Comparison of 1990-91 Schools and Staffing Survey and 1990-91 Common Core of Dataenrollment
StateCCD
studentsSASS
students
SASS as apercent
of CCD
50 States and D.C. 41,223,804 40,092,285 97.3%
Alabama 721,806 688,940 95.4%Alaska 113,874 109,098 95.8%
Arizona 639,853 590,352 92.3%
Arkansas 436,286 415,936 95.3%California 4,950,474 4,795,800 96.9%
Colorado 574,213 575,790 100.3%
Connecticut 469,123 453,562 96.7%
Delaware 99,658 96,375 96.7%District of Columbia 80,694 78,323 97.1%Florida 1,861,592 1,766,890 94.9%
Georgia 1,151,687 1,102,591 95.7%Hawaii 171,708 176,123 102.6%
Idaho 220,840 215,650 97.6%Illinois 1,821,407 1,804,145 99.1%Indiana 954,581 894,518 93.7%
Iowa 483,652 478,941 99.0%Kansas 437,034 453,170 103.7%
Kentucky 636,401 617,621 97.0%Louisiana 784,757 736,937 93.9%
Maine 215,149 218,593 101.6%
Maryland 715,176 675,491 94.5%
Massachusetts 834,314 809,336 97.0%
Michigan 1,581,925 1,418,907 89.7%
Minnesota 756,374 719,581 95.1%Mississippi 502,417 506,406 100.8%
Missouri 812,234 818,191 100.7%
Montana 152,974 157,530 103.0%
Nebraska 274,081 259,974 94.9%Nevada 201,316 197,376 98.0%New Hampshire 172,785 147,023 85.1%
New Jersey 1,089,646 1,112,616 102.1%New Mexico 301,881 292,482 96.9%New York 2,598,337 2,384,600 91.8%North Carolina 1,086,871 1,069,590 98.4%North Dakota 117,823 118,755 100.8%
92

70 1990-91 SASS Data File Users' Manual
Table VII-12.--Comparison of 1990-91 Schools and Staffing Survey and 1990-91 Common Core of Dataenrollment (continued)
StateCCD
studentsSASS
students
SASS as apercentof CCD
Ohio 1,771,516 1,716,955 96.9%Oklahoma 579,087 574,517 99.2%Oregon 484,652 459,095 94.7%Pennsylvania 1,667,834 1,721,896 103.2%Rhode Island 138,813 147,993 106.6%
South Carolina 622,112 649,513 104.4%South Dakota 129,164 148,722 115.1%Tennessee 824,595 789,303 95.7%Texas 3,382,887 3,323,322 98.2%Utah 447,891 438,732 98.0%
Vermont 95,762 90,632 94.6%Virginia 998,601 942,699 94.4%Washington 839,709 897,858 106.9%West Virginia 322,389 336,573 104.4%Wisconsin 797,621 795,561 99.7%Wyoming 98,226 101,704 103.5%
SOURCES: U.S. Department of Education, National Center for Education Statistics, Schools and StaffingSurvey, 1990-91 (Teacher Questionnaire). U.S. Department of Education, National Center for EducationStatistics, Common Core of Data, Public School Universe, 1990-91.
93

71
VIII. Imputation Procedures
94

72 1990-91 SASS Data File Users' Manual
VIII. Imputation Procedures
For questionnaire items that should have been answered but were not, values wereimputed by (1) using data from other items on the questionnaire, (2) extracting data from arelated component of the Schools and Staffing Survey (for example, using data from a schoolrecord to impute missing values on that school's district questionnaire), (3) extracting datafrom the sample file (information about the sample case from other sources; for example, thePrivate School Survey, collected in the 1989-90 school year or the Common Core of Data,collected in the 1988-89 school year), and (4) extracting data from a respondent with similarcharacteristics.
For some incomplete items, the entry from another part of the questionnaire orinformation from the sample file was directly imputed to complete the item; for others theentry was used as part of an adjustment factor with other data on the incomplete record. Forexample, if a respondent did not report whether a school offered remedial reading in item 10cof the public school questionnaire, the response (1 = Yes or 2 = No) for a similar schoolwas imputed to item 10c of the incomplete record. However, if a respondent had answered"Yes" to item 10c but had not reported the number of students in the program, the ratio ofnumber of students in remedial reading to the total enrollment for a similar school was usedwith the enrollment at the school for which item 10c was incomplete to impute an entry toitem 10c (i.e., SCHOOL A item 10c = SCHOOL A ENROLLMENT multiplied by the ratioof SCHOOL B item 10c to SCHOOL B ENROLLMENT).
Values were imputed to items with missing data for records that had been classified asinterviews (ISR=1). Noninterview adjustment factors were used during the data weightingprocess to compensate for data that were missing because the sample case was a noninterview(ISR=2).
A. Teacher Demand and Shortage Survey (SASS-1A)
Data were imputed to items with missing values in two stages.
1. First Stage
In the first stage, information about the same district but from other sources(other questionnaire items on the same record, records for schools in the district, andthe Common Core of Data) was used.
If the district with missing data had only one school in its jurisdiction and datafor that school was collected in the 1990-91 SASS, information from the school recordwas used to fill items with missing values on the district record whenever possible.For one-school districts, these items were imputed with school data when available:
95

Imputation Procedures 73
Teacher Demand and Shortage Public School (SASS-3A)(SASS-1A) Items Source item
la-g ("This year's enrollment" column) 17
9c 31e (if values equal 0)
28 9
29 25
For districts with missing values that could not be imputed with school data,the next step was to use data from other items on the district's record. For example,if a district reported the 1990 enrollment (in column labeled "This year's enrollment")by the requested instructional levels but reported only the total enrollment for 1989(column labeled "Last year's enrollment"), the 1989 total enrollment was allocated tothe instructional levels by using the same proportions as 1990; e.g., 1989 ungradedenrollment equals 1989 total enrollment multiplied by the ratio of 1990 ungradedenrollment to 1990 total enrollment.
Items in Figure VIII-1 (Note: All figures are located at the end of thissection.) were imputed using ratios or proportions from other items on the record forthe same district.
If the district's total enrollment for 1989 was not reported in item 1 (total for"Last year's enrollment" column), the total enrollment reported for the 1988-89Common Core of Data was extracted from the district's sample data and imputed toitem 1.
2. Second Stage
For items that still had missing values after stage 1 of the imputation wascompleted, a hot deck method was used (Figure VIII-2)8. Variables (SASS-1A impu-tation variables) which described certain characteristics of the districts (e.g., size,instructional levels, percent minority students, etc.) were created and used to sort thefile and to match incomplete records to those with complete entries (donors).
During the second stage of imputation, items on the SASS-1A questionnairewere grouped according to the relevance of the SASS-1A imputation variables to thedata collected by the item. For example, LEALEVEL was the most importantvariable for matching incomplete records and donors to fill item 1 (students by grade
8Kalton, G. and Kasprzyk D. (1982), "Imputing for Missing Survey Responses," Proceedings of theSection on Survey Research Methods, American Statistical Association, 22-31; Kalton, G. Compensating forMissing Survey Data. Ann Arbor: Survey Research Center, University of Michigan, 1983; Kalton, G. andKasprzyk, D. (1986), "The Treatment of Missing Survey Data," Survey Methodology, Vol. 12, No. 1, pp. 1-16;Little, R. J. A. and Rubin, D. B. (1987), Statistical Analysis with Missing Data, John Wiley and Sons; Madow,W. G., Olkin, I., and Rubin, D. B. (eds.) 1983, Incomplete Data in Sample Surveys, Vols. 1, 2, and 3, NewYork, Academic Press.
96
74 1990-91 SASS Data File Users' Manual
level) but LEALEVEL was not used to match districts to impute item 18 (merit payplan).
Figure VIII-3 lists the groups of items, the order in which records were sorted,and the matching variables.
Items 1-6, 9-12, and 27 The records were sorted by GROUP/STATE/LEALEVEL/MSC88/LEAENR. The matching variables and their order of collapseare given in Figure VIII-3.
Items 7, 8, 13-26, 28, 29 - The records were sorted by GROUP/STATE/MSC88/LEAENR. The matching variables and their order of collapse are given inFigure VIII-4.
B. Public and Private School Administrators (SASS-2A and 2B)
Data were imputed in two stages:
1. First Stage
During the first stage, items with missing values were filled by using other datafrom the same record or by making some assumptions about the respondent's intendedanswer (e.g., not answering means "No" or "None"). Values were imputed to thefollowing items during the first stage: 1, 2a 2d, 3a, 4a, 5a, 5b, 8b, 9b-9e, and 19a.
Also during the first stage, imputation variables (SASS-2A/2B imputationvariables) (Figure VIII-5) were created from questionnaire data or copied from thematching school record. These variables were used during the second stage ofimputation.
2. Second Stage
During the second stage of imputation, the SASS-2A/2B imputation variableslisted in Figure VIII-5 were used to sort the administrator records and to match in-complete records to records with complete data (donors).
Public school administrators The records were sorted by STATE/GRDLEVEL/PUBURB/LEANUMBR (a code on the sample file record whichidentified the LEA with jurisdiction over the administrator's school)/MINEN/PUBENR. The matching variables and their order of collapse for items imputed inthe second stage are given in Figure VIII-6. Items are listed in the order of imputa-tion.
Private school administrators The records were sorted by AFFLG/AFFILS/GRDLEVEL /PRVURB /MINEN /PRVENR. The matching variables and their order ofcollapse are given in Figure VIII-7. Items are listed in the order of their imputation.
9'7

Imputation Procedures 75
C. Public Schools (SASS-3A)
Data were imputed to items with missing values in two stages.
1. First Stage
In the first stage, information about the same school but from other sources(other questionnaire items on the same record, the record for the LEA with jurisdic-tion over the school, and the Common Core of Data) was used.
Values for a few items with missing values were imputed by using data for theLEA (SASS-1A) with jurisdiction over the school; for example, if the school did notreport whether or not they had postsecondary students but the LEA record indicatedthere were no postsecondary students in the district, then entries were imputed to item17 to indicate that there were no postsecondary students in the school.
For schools in one-school LEAs, more data were extracted from the LEArecord to impute values to the school record.
In Figure VIII-8, SASS-3A items were imputed by using data from SASS-1Arecords:
During the first stage, items with missing values were also filled by usinginformation from other items. These items were imputed by this method: 3, 10c(yes/no), 11a, 12a, 13, 14a, 15a, 16a, 21, 33a.
If an item could not be filled by using LEA data or data from other items onthe school record, information from the 1988-89 Common Core of Data (included inthe school's sample file record) was used whenever possible. These items were filledby using the CCD data in the sample file: lb, 2, 3, 4, 9a-9e, 15, 17, 23a.
2. Second Stage
For items that still had missing values after the first stage of imputation, a hotdeck imputation method was used. Variables (SASS-3A imputation variables) (FigureVIII-9) that described certain characteristics of the school (e.g., size, urbanicity,instructional level, etc.) were created and used to sort the records and to matchincomplete records to those with complete data (donors).
During the second stage of imputation, items on the SASS-3A questionnairewere grouped according to the relevance of the SASS-3A imputation variables to thedata collected by the item. For example, TYPE was used for matching incompleterecords and donors to fill item 10 (school programs and services) but was not used foritem 8 (number of students absent).
Cl 3
76 1990-91 SASS Data File Users' Manual
Figure VIII-10 provides the groups of items, the order in which records weresorted, and the matching variables. Items are listed in the order in which they wereimputed.
Items 17, 1, 4, 6, 7, 10-13, 16, and 18-23 - The records were sorted bySTATE/GRDLEVEL/TYPE/MEAS (the square root of the number of teachersreported in the CCD). The matching variables and their order of collapse are given inFigureVIII-10.
Items 8, 9, 14-15, 25, 26 - The records were sorted by STATE/GRDLEVEL/MINEN/PUBURB/CNTY (the county where the school is located)/MEAS. Thematching variables and their order of collapse are given in Figure VIII-11.
Items 24, 27-35 The records were sorted by STATE/TYPE/GRDLEVEL/PUBURB/CNTY/MEAS. The matching variables and their order of collapse aregiven in Figure VIII-12.
D. Private Schools (SASS-3B)
Data were imputed to items with missing values in two stages.
1. First stage
In the first stage of imputation, values for missing items were imputed by usingother information on the questionnaire and information collected for the sample schoolin the 1989-90 Private School Survey.
These items were filled by using information from other questionnaire items:14, 16, 17, 20, 24, 27, 32a, 33, 34, 35, 41a.
If an item could not be filled by using data from other questionnaire items,information from the 1989-90 Private School Survey or other sources that wasincluded in the sample file record (or added to the school record) was used wheneverpossible. These items were filled by using PSS or sample file information: 2, 4, 12a-12d, 13, 14, 16a, 26a, 27.
2. Second stage
For items that still had missing values after the first stage of imputation, a hotdeck imputation method was used. Variables (SASS-3B imputation variables) (FigureVIII-13) that described certain characteristics of the schools (e.g., size, urbanicity,instructional level, etc.) were created and used to sort the records and to matchincomplete to those with complete data (donors).
99

Imputation Procedures 77
During the second stage of imputation, items on the SASS-3B questionnairewere grouped according to the relevance of the imputation variables to the datacollected by the item. For example, urbanicity (PRVURB) was used for matchingincomplete records and donors to fill item 7 (students by racial categories) but was notused for item 32 (number of newly hired teachers in FTEs). Figure VIII-14 providesthe groups of items, the order in which records were sorted, and the matching vari-ables. Items are listed in the order in which they were imputed.
Items 2, 27, 28, 1, 5, 15, 16, 21-26, 36, 39, 43, 44, 35, 41, 42, and 32 -The records were sorted byGRDLEVEL/AFFILG/AFFILS/TYPE/HIGHGRADE/MEAS (the square root of thenumber of teachers reported in the 1989 Private Schools Survey). The matchingvariables and their order of collapse are given in Figure VIII -14.
Items 3, 6, 10, 12b, 13, 19, 20, 45-48, 58 - The records were sorted byAFFLG/AFFILS/AFFILR/TYPE/PRVURB/REGION/STATE/MEAS. The matchingvariables and their order of collapse are given in Figure
Items 4, 7, 9, 11, 29, 30, 33, 37, 38, 49-57 The records were sorted byAFFLG/AFFILS/PRVURB/MINEN/REGION/MEAS. The matching variables andtheir order of collapse are given in Figure VIII-16.
Items 8, 17, 34, 40 -- The records were sorted by AFFLG/AFFILS/GRDLEVEL/HIGHGRADE/MEAS. The matching variables and their order ofcollapse are given in Figure VIII-17.
E. Bureau of Indian Affairs Schools (SASS-3C)
Because there were only 97 Indian school records and the item response rates werevery high for all items, the imputation was done clerically. The computer records weresorted by BIA status (whether school was operated by the Bureau of Indian Affairs), state,and size so that records for similar schools were close together. The actual questionnaireswere also reviewed for notes and other entries which were useful in deciding the entries to beimputed. If an item could not be filled by using information on the questionnaire, entriesfrom the record for a similar school were used.
F. Public and Private School Teachers (SASS-4A and 4B)
Data were imputed in two stages:
1. First stage
During the first stage, items with missing values were filled by using other datafrom the same record or by making some assumptions about the respondent's intendedanswer (i.e., not answering a question implies a "No" response).
100

78 1990-91 SASS Data File Users' Manual
Values were imputed to these items during the first stage if enough informationwere available: 3c, 6, 10, 11, 15, 16, 17, 18b, (Yes/No), 19b, 20b, 23, 27, 31b, 32,34b, 45, 46, 50.
To impute missing values for item 32c, the average was calculated for thenumber of times per week (item 32c) for each subject-grade level combination (items32b and 32d) on the file, and these averages were used to impute item 32c.
Also, during the first stage imputation variables were created from question-naire data or copied from the matching school record. These variables (SASS-4A/4Bimputation variables) were used during the second stage of imputation. They aregiven in Figure VIII-18.
2. Second stage
During the second stage, a hot deck method of imputation was used to fillitems that still had missing values. The variables listed in Figure VIII-18 (exceptREGION) were used to sort the teacher records and to match incomplete records torecords with complete data (donors).
Items on the teacher questionnaire were grouped according to the relevance ofthe imputation variables to the data collected by the item.
Public school teachers Figure VIII-19 lists the groups of items, the order inwhich records were sorted, and the matching variables.
Items 1-31, 33-56. - The records were sorted by STGROUP/ STATE/TEALEVEL/GRADELEV/PUBURB/TEAFIELD/PUBENR. The matching variablesand their order of collapse for items imputed in the second stage are given in FigureVIII-19. Items are listed in the order in which they were imputed.
Private school teachers - Figure VIII-20 lists the groups of items, the order inwhich records were sorted, and the matching variables.
Items 1-31, 33-56. - The records were sorted by AFFLG/AFFILS/TEALEVEL / GRADELEV /PRVURB /TEAFIELD /PRVENR. The matching variablesand their order of collapse for items imputed in the second stage are given in FigureVIII-20. Items are listed in the order in which they were imputed.
G. Imputation Flags
Data items for all questionnaires were imputed, except for items with "mark all thatapply" categories. The imputed values can be detected by checking the value of the imputa-tion flag (variables beginning with F_) - if the imputation flag is set at 0, the data value is asreported; if the flag is set at 1, the value has been imputed. In items which may not apply to
101

Imputation Procedures 79
a particular record, the imputation flag will always be set to 0, and the data item would notbe reported (i.e., its value is missing).
In some cases, such as race/ethnicity of students in the Public School and PrivateSchool Questionnaires, the total reported for all races did not agree with the total for allgrades. The race/ethnicity values were ratio-adjusted until the total for the school matchedthe enrollment by grade total. Thus, all of the races reported in that school would be markedas "imputed," although the actual values were only slightly adjusted.
Figure VIII-1.Teacher Demand and Shortage (SASS-1A) items imputed using other data on theTeacher Demand and Shortage record
Imputed item Source items
la-g (This year's enrollment) la-g (Proportions from last year's enrollment); or
2a-g (Proportions from this year's FTE teachers);Or
2a-g (Proportions from last year's FTE teachers orLast year's student/teacher ratios)
la-g (Last year's enrollment) la-g (Proportions from this year's enrollment); or
2a-g (Proportions from last year's FTE teachers); or
2a-g (Proportions from this year's FTE teachers); or
This year's student/teacher ratios
2a-g (This year's FTE teachers) 2a-g (Proportions from last year's FTE teachers); or
la-g (Proportions from this year's enrollment); or
la-g (Proportions from last year's enrollment); or
Last year's student/teacher ratios
2a-g (Last year's FTE teachers) 2a-g (Proportions from this year's FTE teachers); or
la-g (Proportions from last year's enrollment); or
la-g (Proportions from this year's enrollment); or
This year's student/teacher ratios.
BEST COPY AVAILABLE
102

80 1990-91 SASS Data File Users' Manual
Figure VIDE-2.--Teacher Demand and Shortage (SASS-1A) imputation variables
Variable name Description Values
LEAENR Number of students in LEA 0 - 990,000
SIZE Number of students by categories 1 = None2 = 1-9993 = 1,000-9,9994 = 10,000-990,0005 = Unknown
LEALEVEL Instructional levels in LEA 1 = Elementary only2 = Combined, mostly elementary3 = Combined, comparable elementary and
secondary students counts4 = Combined, mostly secondary5 = Secondary only6 = Ungraded
MSC88 Urbanicity (as reported on the1988 Common Core of Data)
1 = Large central city of SMSA2 = Medium city of SMSA3 = Urban fringe of large city4 = Urban fringe of medium city5 = Large town, not in SMSA6 = Small town, not in SMSA7 = Rural8 = Unknown
GROUP. Groups of states with similarLEAs
1 = Connecticut, Rhode Island2 = Delaware, District of Columbia, Maryland3 = Maine, New Hampshire, Vermont4 = Massachusetts, New York5 = New Jersey, Pennsylvania6 = Illinois, Indiana7 = Iowa, Nebraska8 = Kansas, Oklahoma9 = Michigan, Ohio10 = Minnesota, Missouri, Wisconsin11 = North Dakota, South Dakota12 = Alabama, Louisiana13 = Arkansas, Mississippi, West Virginia14 = Florida, Texas15 = Georgia, Virginia16 = Kentucky, South Carolina17 = North Carolina, Tennessee18 = Alaska, Wyoming19 = Arizona, Nevada, Utah20 = California, Hawaii21 = Colorado, Washington22 = Idaho, Montana23 = New Mexico, Oregon
'The variable GROUP was created because some states (e.g., Hawaii, District of Columbia, Delaware)have few LEAs; combining states made more records of LEAs with similar characteristics available as donorsources.
1 0 3
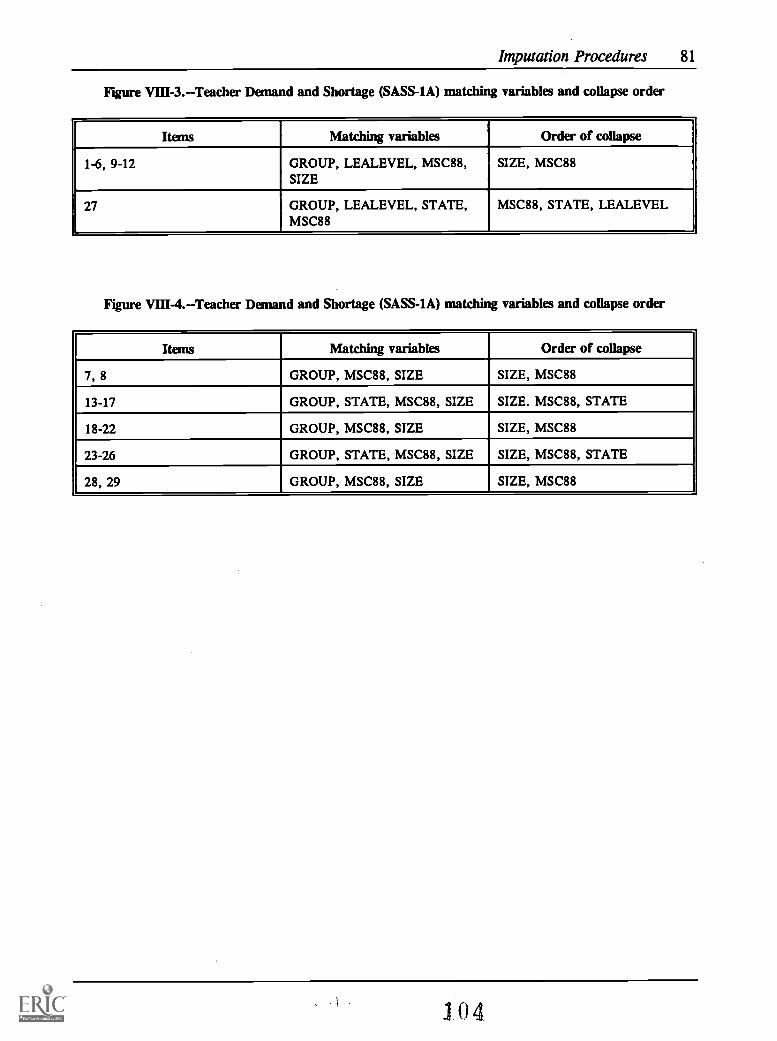
Imputation Procedures 81
Figure VIII-3.Teacher Demand and Shortage (SASS-1A) matching variables and collapse order
Items Matching variables Order of collapse
1-6, 9-12 GROUP, LEALEVEL, MSC88,SIZE
SIZE, MSC88
27 GROUP, LEALEVEL, STATE,MSC88
MSC88, STATE, LEALEVEL
Figure VIII-4.--Teacher Demand and Shortage (SASS-1A) matching variables and collapse order
Items Matching variables Order of collapse
7, 8 GROUP, MSC88, SIZE SIZE, MSC88
13-17 GROUP, STATE, MSC88, SIZE SIZE. MSC88, STATE
18-22 GROUP, MSC88, SIZE SIZE, MSC88
23-26 GROUP, STATE, MSC88, SIZE SIZE, MSC88, STATE
28, 29 GROUP, MSC88, SIZE SIZE, MSC88
104

82 1990-91 SASS Data File Users' Manual
Figure VIII-5.--School Administrator (SASS-2A/2B) imputation variables
Variable name DescriptionI
Values
GRDLEVEL Instructional level ofschool
1 = Elementary2 = Combined3 = Secondary4 = Not known
COMBSTU For principals of corn-bined schools, whetherschool is predominant-ly elementary or sec-ondary
1 = Elementary3 = Secondary
PUBURB(SASS-2A only)
Urbanicity of commu-nity where publicschool is located
1 = Large central city of SMSA2 = Medium city of SMSA3 = Urban fringe of SMSA4 = Urban fringe of medium city5 = Large town, not in SMSA6 = Small town, not in SMSA7 = Rural8 = Not known
PRVURB(SASS-2B only)
Urbanicity of commu-nity where privateschool is located
1 = Urban2 = Suburban3 = Rural4 = Not known
MINEN Schools' percent mi-nority enrollment
1 = 0-5%2 = 6-20%3 = 21-50%5 = 51-100%4 = Not known
PUBENR(SASS-2A only)
Public school enroll-ment size code
1 = 1-2992 = 300-5993 = 600-9,0004 = Not known
PRVENR(SASS-2B only)
Private school enroll-ment size code
1 = 1-1492 = 150-3993 = 400-5,0004 = Not known
105

Imputation Procedures 83
Figure V111-5.--School Administrator (SASS-2A/213) imputation variables (continued)
Variable name IDescription
IValues
AFFILS(SASS-2B only)
Schools' religious af-filiation and/or asso-ciation membership
1 = Catholic, parochial2 = Catholic, diocesan3 = Catholic, private4 = Catholic, unclassified5 = Member of conservative Christian school
association6 = Other schools with religious affiliation or
orientation not included in categories 1-57 = Religious schools, unknown affiliation/
association8 = Secular school - regular program9 = Secular school - special program,
vocational or alternative10 = Secular school - special education11 = Secular school - unknown program12 = Unclassified
AFFLG(SASS-2B only)
General affiliationcode
1 = Catholic2 = Other religious affiliation or
orientation3 = Secular4 = Unclassified
PRVANNSAL(SASS-2B only)
Private school princip-al's annual salary
1 = 0-12,9992 = 13,000-17,9993 = 18,000-21,9994 = 22,000-28,9995 = 29,000-32,9996 = 33,000+7 = Not reported
PUBANNSAL(SASS-2A only)
Public school princip-al's annual salary
1 = 0-35,2992 = 35,300-38,5993 = 38,600-41,9994 = 42,000-46,9995 = 47,000-53,799
ANNSAL(SASS-2B only)
Principal's annual sal-ary
6 = 53,800+7 = Not reported
HIGHDEG Highest degree re-ceived by respondent
1 = No degree reported2 = Bachelor's3 = Master's or higher
AGE Age of respondent 1 = 21-292 = 30-453 = 45-604 = 61-905 = Not reported
106

84 1990-91 SASS Data File Users' Manual
Figure VDT-S.School Administrator (SASS- 2A /2B) imputation variables (continued)
Variable name Description Values
YRPRINSC Years as principal of 1 = 0-3this school 2 = 4-15
3 = 16-304 = 31-70
YEARPRIN Years as principal in 1 = 0-3all schools 2 = 4-15
3 = 16-304 = 31+
Figure VIII-6.--Public School Administrator (SASS-2A) matching variables and collapse order
Items Matching variables Order of collapse
5a and 5b, where respondent'sage was known
STATE, GRDLEVEL,HIGHDEG, AGE
AGE, HIGHDEG, GRDLEVEL
5a and b, where respondent's agewas not known
STATE, GRDLEVEL,YEARPRIN
YEARPRIN, HIGHDEG,GRDLEVEL
4b STATE, GRDLEVEL,YEARPRIN
YEARPRIN, GRDLEVEL
2b, 2e, 3b, 4c, 6 STATE, GRDLEVEL, PUBURB PUBURB, GRDLEVEL
7, 8, 10 STATE, GRDLEVEL,HIGHDEG, AGE
AGE, HIGHDEG, GRDLEVEL
11 STATE, GRDLEVEL, AGE,PUBURB
PUBURB, AGE, GRDLEVEL
18 STATE, GRDLEVEL, PUBURB,AGE
AGE, PUBURB, GRDLEVEL
19, 20 STATE, GRDLEVEL, PUBURB,MINEN
MINEN, PUBURB, GRDLEVEL
14-17 STATE, GRDLEVEL, PUBURB,YRPRINSC
YRPRINSC, PUBURB
13 STATE, GRDLEVEL, PUBURB,YRPRINSC
YRPRINSC, PUBURB,GRDLEVEL
12a,b (if salary was not known) STATE, GRDLEVEL, PUBURB,HIGHDEG, YEARPRIN
YEARPRIN, HIGHDEG,PUBURB, GRDLEVEL
12b (if salary was known) STATE, GRDLEVEL, PUBURB,PUBANNSAL
PUBANNSAL, GRDLEVEL
107
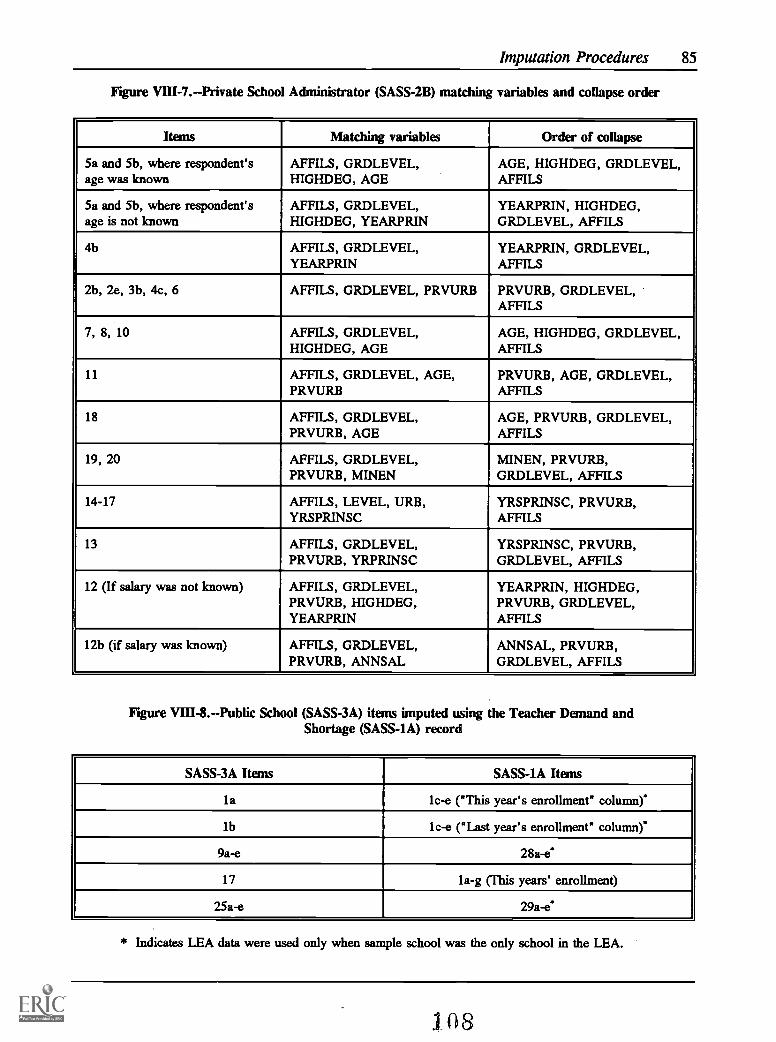
Imputation Procedures 85
Figure VIII-7.Private School Administrator (SASS-2B) matching variables and collapse order
Items Matching variables Order of collapse
5a and 5b, where respondent'sage was known
AFFILS, GRDLEVEL,HIGHDEG, AGE
AGE, HIGHDEG, GRDLEVEL,AFFILS
5a and 5b, where respondent'sage is not known
AFFILS, GRDLEVEL,HIGHDEG, YEARPRIN
YEARPRIN, HIGHDEG,GRDLEVEL, AFFILS
4b AFFILS, GRDLEVEL,YEARPRIN
YEARPRIN, GRDLEVEL,AFFILS
2b, 2e, 3b, 4c, 6 AFFILS, GRDLEVEL, PRVURB PRVURB, GRDLEVEL,AFFILS
7, 8, 10 AFFILS, GRDLEVEL,HIGHDEG, AGE
AGE, HIGHDEG, GRDLEVEL,AFFILS
11 AFFILS, GRDLEVEL, AGE,PRVURB
PRVURB, AGE, GRDLEVEL,AFFILS
18 AFFILS, GRDLEVEL,PRVURB, AGE
AGE, PRVURB, GRDLEVEL,AFFILS
19, 20 AFFILS, GRDLEVEL,PRVURB, MINEN
MINEN, PRVURB,GRDLEVEL, AFFILS
14-17 AFFILS, LEVEL, URB,YRSPRINSC
YRSPRINSC, PRVURB,AFFILS
13 AFFILS, GRDLEVEL,PRVURB, YRPRINSC
YRSPRINSC, PRVURB,GRDLEVEL, AFFILS
12 (If salary was not known) AFFILS, GRDLEVEL,PRVURB, HIGHDEG,YEARPRIN
YEARPRIN, HIGHDEG,PRVURB, GRDLEVEL,AFFILS
12b (if salary was known) AFFILS, GRDLEVEL,PRVURB, ANNSAL
ANNSAL, PRVURB,GRDLEVEL, AFFILS
Figure VIII-8.--Public School (SASS-3A) items imputed using the Teacher Demand andShortage (SASS-1A) record
SASS-3A Items SASS-1A Items
la lc-e ("This year's enrollment" column)*
lb lc-e ("Last year's enrollment" column)"
9a-e 28a-e"
17 la-g (This years' enrollment)
25a-e 29a-es
* Indicates LEA data were used only when sample school was the only school in the LEA.
1.08

86 1990-91 SASS Data File Users' Manual
Figure VIII-9.--Public School (SASS-3A) imputation variables
Variable name Description Values
GRDLEVEL Instructional level of school 1 = Elementary2 = Combined3 = Secondary4 = Unknown
TYPE Type of school 1 = Regular2 = Special education3 = Vocational education4 = Alternative5 = Unclassified
PUBURB Urbanicity of community whereschool is located
1 = Large central city where school islocated of an SMSA
2 = Medium city of an SMSA3 = Urban fringe of a large city4 = Urban fringe of a medium city5 = Large town, not in an SMSA6 = Small town, not in an SMSA7 = Rural8 = Unknown
PUBENR School enrollment size code 1 = 1-2992 = 300-5993 = 600-9,0004 = Unknown
MINEN Percent minority enrollment 1 = 0-5%2 = 6-20%3 = 21-50%5 = 51-100%4 = Unknown
REGION Census region where school islocated
1 = Northeast2 = Midwest3 = South4 = West
log

Imputation Procedures 87
Figure VIII-10.--Public School (SASS-3A) matching variables and collapse ordering
Items Matching variables Order of collapse
17 STATE, GRDLEVEL, TYPE TYPE
lb STATE, GRDLEVEL No collapsing
4 STATE, TYPE, GRDLEVEL GRDLEVEL, TYPE
6, 7 STATE, GRDLEVEL, TYPE TYPE
10a-h (Yes/No) and 10a, 10b,10h (Number of students served)
STATE, GRDLEVEL, TYPE TYPE, GRDLEVEL
10c-g (Number of studentsserved)
STATE, TYPE, GRDLEVEL GRDLEVEL, TYPE
11 STATE, GRDLEVEL, TYPE TYPE, GRDLEVEL
12, 13 STATE, GRDLEVEL, TYPE TYPE
16, 18 STATE, TYPE, GRDLEVEL GRDLEVEL, TYPE
20-23 STATE, GRDLEVEL, TYPE TYPE, GRDLEVEL
Figure V111-11.--Public School (SASS-3A) matching variables and collapse ordering
Items Matching variables Order of collapse
8 STATE, GRDLEVEL, MINEN,PUBURB
PUBURB, MINEN
9 STATE, MINEN, PUBURB PUBURB, MINEN
14, 15 STATE, MINEN MINEN
25 STATE, MINEN, PUBURB PUBURB, MINEN
26 STATE, PUBURB, MINEN MINEN, PUBURB
Figure VIII-12.--Public School (SASS-3A) matching variables and collapse ordering
Items Matching variables Order of collapse
24, 27, 28 STATE, GRDLEVEL, TYPE TYPE, GRDLEVEL
29, 30 STATE, TYPE, GRDLEVEL GRDLEVEL, TYPE
31-33 STATE, GRDLEVEL, TYPE TYPE, GRDLEVEL
34, 35 STATE, GRDLEVEL GRDLEVEL
110

88 1990-91 SASS Data File Users' Manual
Figure VIII-13.--Private School (SASS-3B) imputation variables
Variable name Description Values
REGION Census region 1 = Northeast2 = Midwest3 = South4 = West
AFFILR Specific religious affiliation code 1 = Catholic2 = Amish3 = Assembly of God4 = Baptist5 = Calvinist6 = Christian7 = Church of Christ8 = Church of God9 = Disciples of Christ10 = Episcopal11 = Friends12 = Greek Orthodox13 = Islamic14 = Jewish15 = Latter Day Saints16 = Lutheran17 = Mennonite18 = Methodist19 = Pentecostal20 = Presbyterian21 = Seventh-Day Adventist22 = Other23 = No religious affiliation24 = Unknown
General affiliation code 1 = Catholic2 = Other religious affiliation3 = No religious affiliation4= Unknown
AP FLG

Imputation Procedures 89
Figure VIII -13.--Private School (SASS-3B) imputation variables (continued)
Variable name I DescriptionI
Values
AFFILS Religious affiliation and or associ-ation membership
1 = Catholic, parochial2 = Catholic, diocesan3 = Catholic, private4 = Catholic, unclassified5 = Member of conservative Christian
school association6 = Other schools with religious affiliation
and/or association membership notincluded in codes 1-5
7 = Religious schools, unknown affiliationor association
8 = Secular - regular elementary and/orsecondary
9 = Secular - special program, vocational,or alternative
10 = Secular - special education11 = Secular - unknown program12 = Unclassified
PRVENR School enrollment size code 1 = 1-149 students2 = 150-3993 = 400-5,0004 = Not known
PRVURB Urbanicity of community whereschool is located
1 = Urban2 = Suburban3 = Rural4 = Not known
GRDLEVEL Instructional level of school 1 = Elementary2 = Combined3 = Secondary4 = Not known
TYPE School type 1 = Regular2 = Special education3 = Vocational education4 = Alternative5 = Not known
MINEN Percent minority enrollment 1 = 0-5%2 = 6-20%3 = 21-50%5 = 51-100%4 = Not known
1 i 2
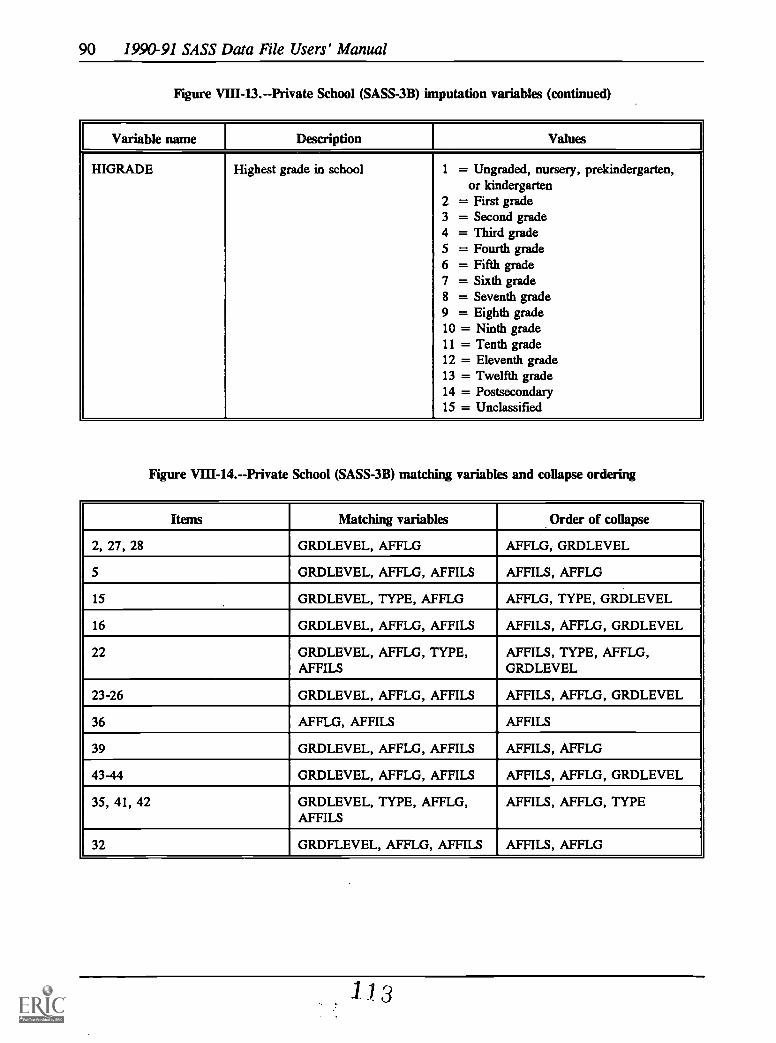
90 1990-91 SASS Data File Users' Manual
Figure VIII-13.--Private School (SASS-3B) imputation variables (continued)
Variable name I DescriptionI
Values
HIGRADE Highest grade in school 1 = Ungraded, nursery, prekindergarten,or kindergarten
2 = First grade3 = Second grade4 = Third grade5 = Fourth grade6 = Fifth grade7 = Sixth grade8 = Seventh grade9 = Eighth grade10 = Ninth grade11 = Tenth grade12 = Eleventh grade13 = Twelfth grade14 = Postsecondary15 = Unclassified
Figure VIII-14.--Private School (SASS-3B) matching variables and collapse ordering
Items Matching variables Order of collapse
2, 27, 28 GRDLEVEL, AFFLG AFFLG, GRDLEVEL
5 GRDLEVEL, AFFLG, AFFILS AFFILS, AFFLG
15 GRDLEVEL, TYPE, AFFLG AFFLG, TYPE, GRDLEVEL
16 GRDLEVEL, AFFLG, AFFILS AFFILS, AFFLG, GRDLEVEL
22 GRDLEVEL, AFFLG, TYPE,AFFILS
AFFILS, TYPE, AFFLG,GRDLEVEL
23-26 GRDLEVEL, AFFLG, Al, FILS AFFILS, AFFLG, GRDLEVEL
36 AFFLG, AFFILS AFFILS
39 GRDLEVEL, AFFLG, AFFILS AFFILS, AFFLG
43-44 GRDLEVEL, AFFLG, AFFILS AFFILS, AFFLG, GRDLEVEL
35, 41, 42 GRDLEVEL, TYPE, AFFLG,AFFILS
AFFILS, AFFLG, TYPE
32 GRDFLEVEL, AFFLG, AFFILS AFFILS, AFFLG
113

imputation Procedures 91
Figure VIII -15.-- Private School (SASS-313) matching variables and collapse ordering
Item Matching variables Order of collapse3, 6 AFFLG, AFFILS, TYPE TYPE, AFFILS10 AFFLG, TYPE, AFFILS AFFILS, TYPE12b AFFLG, AFFILS AFFILS13 AFFLG, AFFILS, TYPE TYPE19, 20 AFFLG, TYPE, AFFILS AFFILS, TYPE45-48 AFFLG, TYPE, PRVURB,
AFFILSAFFILS, PRVURB
58 AFFLG, AFFILS, TYPE TYPE, AFFILS
Figure VIII-16.--Private School (SASS-3B) matching variables and collapse ordering
Items Matching variables Order of collapse4 AFFLG, AFFILS AFFILS7, 9 AFFLG, AFFILS, PRVURB PRVURB, AFFILS11 PRVURB, AFFLG, AFFILS AFFILS, AFFLG18, 29, 30, 33 PRVURB PRVURB, AFFILS37 AFFLG, AFFILS, PRVURB,
MINENMINEN, PRVURB, AFFILS
38, 49-57 AFFLG, AFFILS, PRVURB PRVURB, AFFILS
Figure VIII-17.--Private School (SASS-3I3) matching variables and collapse ordering
ItemsI Matching variables
I Order of collapse8, 17, 34, 40 AFFLG, AFFILS, GRDLEVEL 1 GRDLEVEL, AFFILS
114
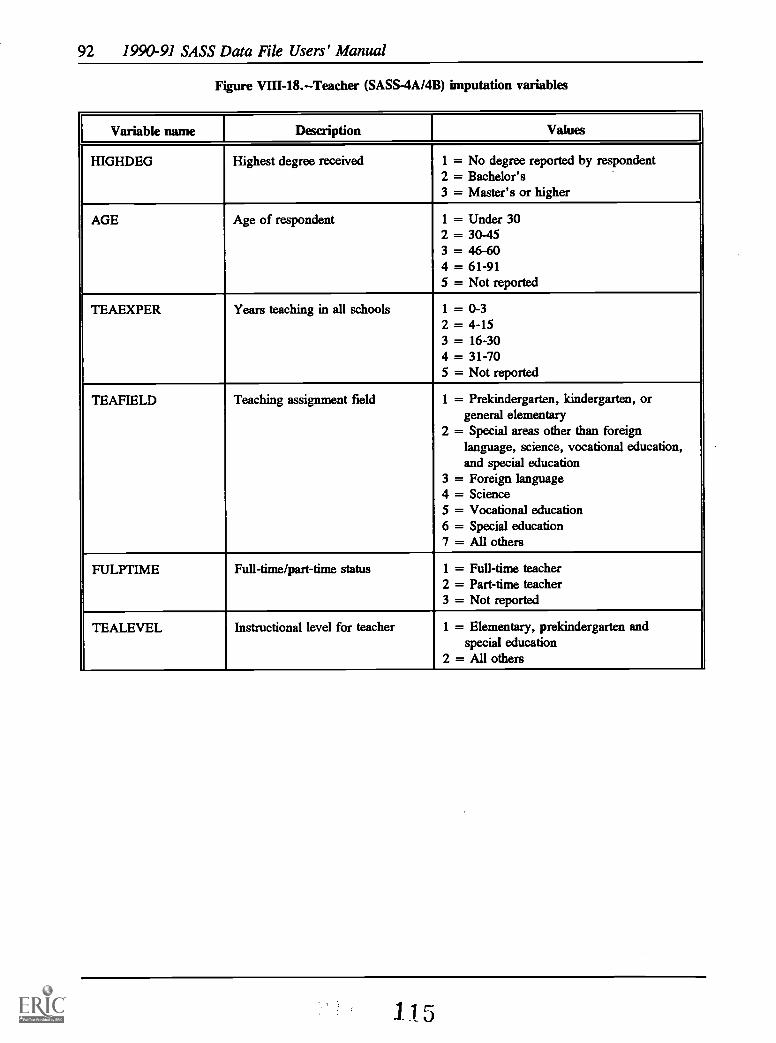
92 1990-91 SASS Data File Users' Manual
Figure VIII -18. Teacher (SASS-4A/4B) imputation variables
Variable name I DescriptionI
Values
HIGHDEG Highest degree received 1 = No degree reported by respondent2 = Bachelor's3 = Master's or higher
AGE Age of respondent 1 = Under 302 = 30-453 = 46-604 = 61-915 = Not reported
TEAEXPER Years teaching in all schools 1 = 0-32 = 4-153 = 16-304 = 31-705 = Not reported
TEAFIELD Teaching assignment field 1 = Prekindergarten, kindergarten, orgeneral elementary
2 = Special areas other than foreignlanguage, science, vocational education,and special education
3 = Foreign language4 = Science5 = Vocational education6 = Special education7 = All others
FULPTIME Full-time/part-time status 1 = Full-time teacher2 = Part-time teacher3 = Not reported
TEALEVEL Instructional level for teacher 1 = Elementary, prekindergarten andspecial education
2 = All others
115
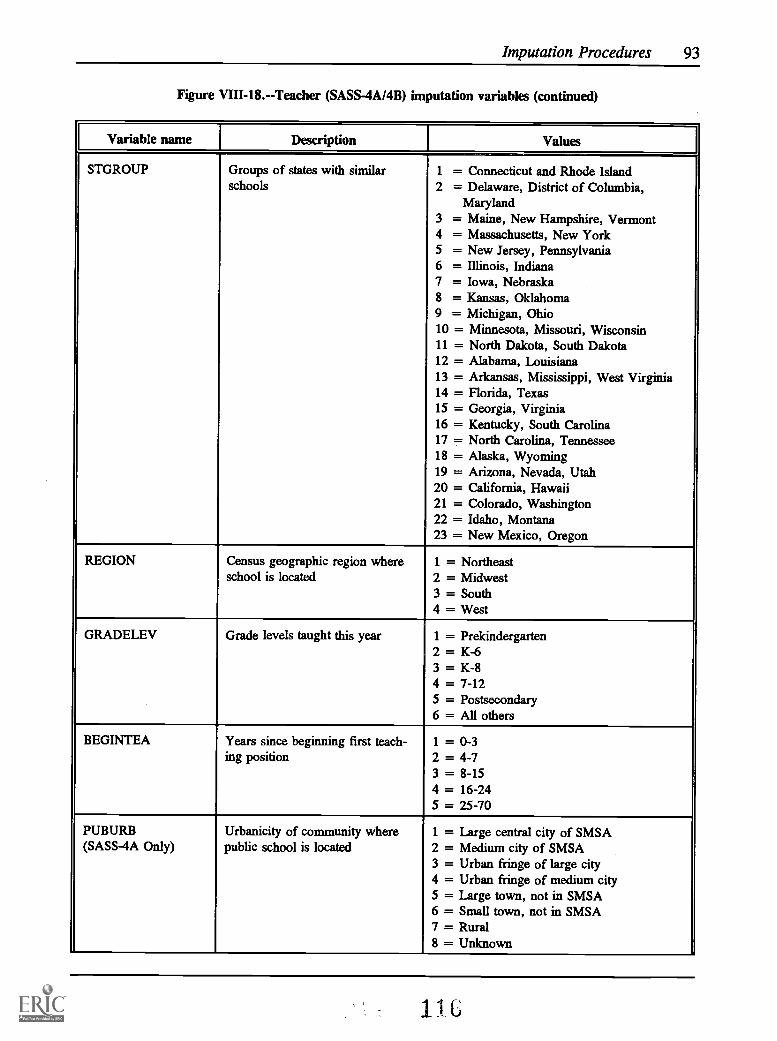
Imputation Procedures 93
Figure VIII -18. -- Teacher (SASS-4A/4B) imputation variables (continued)
Variable name I DescriptionI
Values
STGROUP Groups of states with similarschools
1 = Connecticut and Rhode Island2 = Delaware, District of Columbia,
Maryland3 = Maine, New Hampshire, Vermont4 = Massachusetts, New York5 = New Jersey, Pennsylvania6 = Illinois, Indiana7 = Iowa, Nebraska8 = Kansas, Oklahoma9 = Michigan, Ohio10 = Minnesota, Missouri, Wisconsin11 = North Dakota, South Dakota12 = Alabama, Louisiana13 = Arkansas, Mississippi, West Virginia14 = Florida, Texas15 = Georgia, Virginia16 = Kentucky, South Carolina17 = North Carolina, Tennessee18 = Alaska, Wyoming19 = Arizona, Nevada, Utah20 = California, Hawaii21 = Colorado, Washington22 = Idaho, Montana23 = New Mexico, Oregon
REGION Census geographic region whereschool is located
1 = Northeast2 = Midwest3 = South4 = West
GRADELEV Grade levels taught this year 1 = Prekindergarten2 = K-63 = K-84 = 7-125 = Postsecondary6 = All others
BEGINTEA Years since beginning first teach-ing position
1 = 0-32 = 4-73 = 8-154 = 16-245 = 25-70
PUBURB(SASS-4A Only)
Urbanicity of community wherepublic school is located
1 = Large central city of SMSA2 = Medium city of SMSA3 = Urban fringe of large city4 = Urban fringe of medium city5 = Large town, not in SMSA6 = Small town, not in SMSA7 = Rural8 = Unknown
1
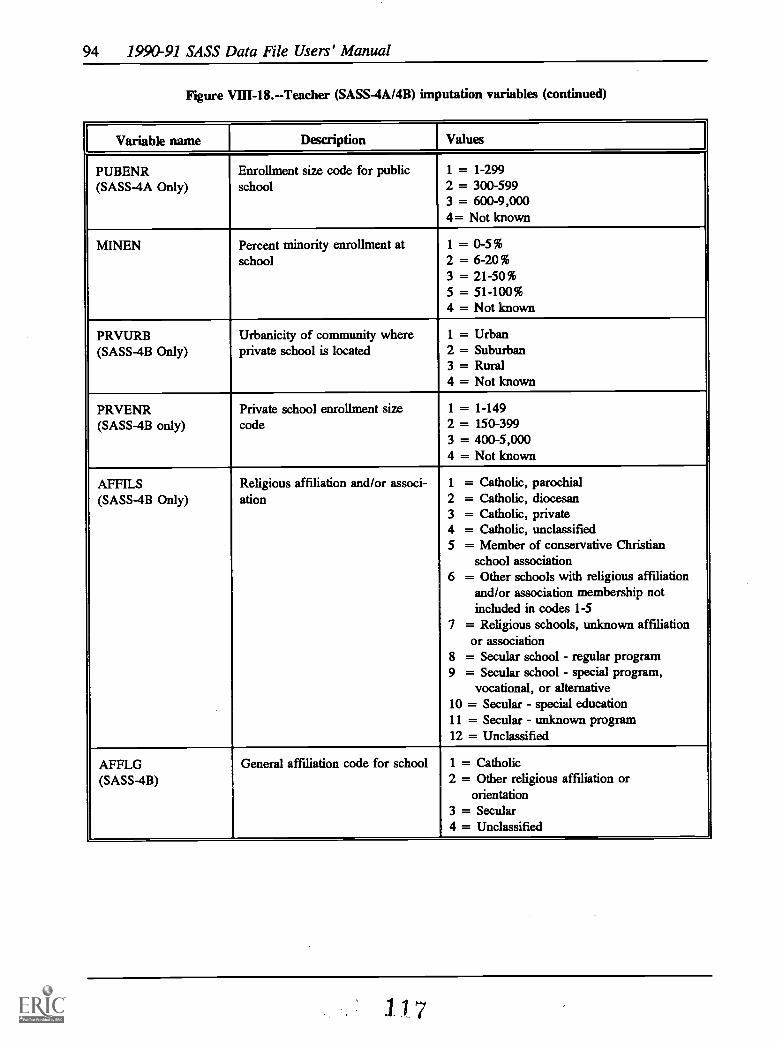
94 1990-91 SASS Data File Users' Manual
Figure VIII-18.--Teacher (SASS-4A/4B) imputation variables (continued)
Variable name1
Description 1 Values
PUBENR(SASS-4A Only)
Enrollment size code for publicschool
1 = 1-2992 = 300-5993 = 600-9,0004= Not known
MINEN Percent minority enrollment atschool
1 = 0-5%2 = 6-20%3 = 21-50%5 = 51-100%4 = Not known
PRVURB(SASS-4B Only)
Urbanicity of community whereprivate school is located
1 = Urban2 = Suburban3 = Rural4 = Not known
PRVENR(SASS-4B only)
Private school enrollment sizecode
1 = 1-1492 = 150-3993 = 400-5,0004 = Not known
AFFILS(SASS-4B Only)
Religious affiliation and/or associ-ation
1 = Catholic, parochial2 = Catholic, diocesan3 = Catholic, private4 = Catholic, unclassified5 = Member of conservative Christian
school association6 = Other schools with religious affiliation
and/or association membership notincluded in codes 1-5
7 = Religious schools, unknown affiliationor association
8 = Secular school - regular program9 = Secular school - special program,
vocational, or alternative10 = Secular - special education11 = Secular - unknown program12 = Unclassified
AFFLG(SASS-4B)
General affiliation code for school 1 = Catholic2 = Other religious affiliation or
orientation3 = Secular4 = Unclassified
11,7
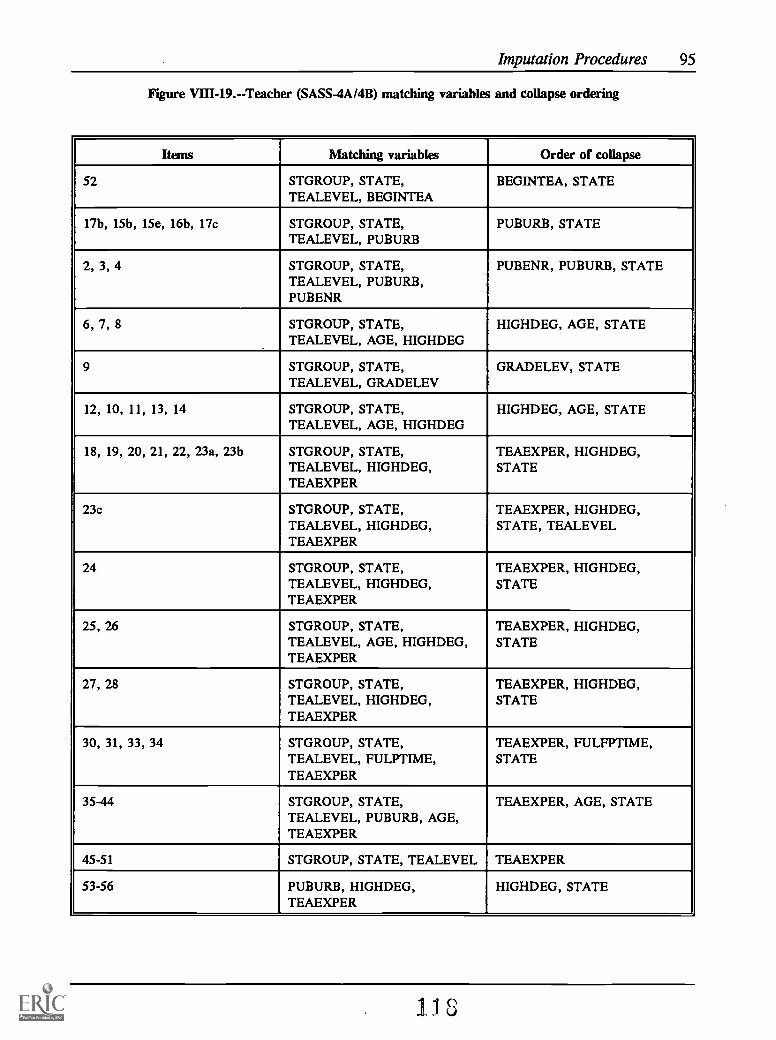
Imputation Procedures 95
Figure 17111-19.--Teacher (SASS-4A/4B) matching variables and collapse ordering
Items Matching variables Order of collapse
52 STGROUP, STATE,TEALEVEL, BEGINTEA
BEGINTEA, STATE
17b, 15b, 15e, 16b, 17c STGROUP, STATE,TEALEVEL, PUBURB
PUBURB, STATE
2, 3, 4 STGROUP, STATE,TEALEVEL, PUBURB,PUBENR
PUBENR, PUBURB, STATE
6, 7, 8 STGROUP, STATE,TEALEVEL, AGE, HIGHDEG
HIGHDEG, AGE, STATE
9 STGROUP, STATE,TEALEVEL, GRADELEV
GRADELEV, STATE
12, 10, 11, 13, 14 STGROUP, STATE,TEALEVEL, AGE, HIGHDEG
HIGHDEG, AGE, STATE
18, 19, 20, 21, 22, 23a, 23b STGROUP, STATE,TEALEVEL, HIGHDEG,TEAEXPER
TEAEXPER, HIGHDEG,STATE
23c STGROUP, STATE,TEALEVEL, HIGHDEG,TEAEXPER
TEAEXPER, HIGHDEG,STATE, TEALEVEL
24 STGROUP, STATE,TEALEVEL, HIGHDEG,TEAEXPER
TEAEXPER, HIGHDEG,STATE
25, 26 STGROUP, STATE,TEALEVEL, AGE, HIGHDEG,TEAEXPER
TEAEXPER, HIGHDEG,STATE
27, 28 STGROUP, STATE,TEALEVEL, HIGHDEG,TEAEXPER
TEAEXPER, HIGHDEG,STATE
30, 31, 33, 34 STGROUP, STATE,TEALEVEL, FULPTIME,TEAEXPER
TEAEXPER, FULFPTIME,STATE
35-44 STGROUP, STATE,TEALEVEL, PUBURB, AGE,TEAEXPER
TEAEXPER, AGE, STATE
45-51 STGROUP, STATE, TEALEVEL TEAEXPER
53-56 PUBURB, HIGHDEG,TEAEXPER
HIGHDEG, STATE
.1 1 8

96 1990-91 SASS Data File Users' Manual
Figure VIII-20.--Teacher (SASS- 4A /4B) matching variables and collapse ordering
Items Matching variables Order of collapse
52 AFFILS, TEALEVEL,BEGINTEA
BEGINTEA, AFFILS
17b, 15b, 15e, 16b, 17c AFFILS, TEALEVEL, PRVURB PRVURB, AFFILS
2, 3, 4 AFFILS, TEALEVEL, PRVURB,PRVENR
PRVENR, PRVURB, AFFILS
6, 7, 8 AFFILS, TEALEVEL, AGE,HIGHDEG
HIGHDEG, AGE, AFFILS
9 AFFILS, STATE, TEALEVEL,GRADELEV
GRADELEV, AFFILS
12, 10, 11, 13, 14 AFFILS, STATE, TEALEVEL,AGE, HIGHDEG
HIGHDEG, AGE, AFFILS
18, 19, 20, 21, 22, 23a, 23b AFFILS, STATE, TEALEVEL,HIGHDEG, TEAEXPER
TEAEXPER, HIGHDEG,AFFILS
23c AFFILS, TEALEVEL,HIGHDEG, TEAEXPER
TEAEXPER, HIGHDEG,TEALEVEL, AFFILS
24 AFFILS, TEALEVEL,HIGHDEG, TEAEXPER
TEAEXPER, HIGHDEG,AFFILS
25, 26 AFFILS, TEALEVEL, AGE,HIGHDEG, TEAEXPER
TEAEXPER, HIGHDEG,AFFILS
27, 28 AFFILS, TEALEVEL,HIGHDEG, TEAEXPER
TEAEXPER, HIGHDEG,AFFILS
30, 31, 33, 34 AFFILS, TEALEVEL,FULPTIME, TEAEXPER
TEAEXPER, FULPTIME,AFFILS
35-44 AFFILS, TEALEVEL, PRVURB,AGE, TEAEXPER
TEAEXPER, AGE, AFFILS
45-51, 53-56 AFFILS, TEALEVEL, PRVURB,HIGHDEG, TEAEXPER
TEAEXPER, HIGHDEG,AFFILS
119

97
IX. Weighting

98 1990-91 SASS Data File Users' Manual
IX. Weighting
This section describes the weighting processes for the different SASS samples. Thegeneral purpose of the weighting steps is to adjust for nonresponse using respondents' data;and also to adjust the sample totals to the frame total to reduce sampling variability. Foreach questionnaire, the formula for the weight will be presented, along with a brief descrip-tion of each component. When computations are done within cells, such as nonresponseadjustments, the cells will be described. Sometimes a cell did not have enough data toproduce a reliable estimate; in such cases, cells were collapsed. The least important variableswere always collapsed first. The collapsing criteria are also described.
First, the school weight will be described. Since the public and private school weightshave the same structure, they will be presented together. They differ only in the definition ofthe cells used to compute the nonresponse adjustment factor and the first-stage ratio adjust-ment factor. These cells will be described separately within the school weight section. Sincethe public and private administrator weights are similar to the school weights, they will bedescribed next. In the third section, the public teacher demand and shortage weights will bedescribed. In the last weighting section, the teacher weights will be described. Since thepublic and private school teacher weights have the same structure, they will be presentedtogether. They differ only in the definition of the cells used to compute the various weightingfactors. These cells will be described separately within the teacher weight section.
A. School Weight (SASS Questionnaire Forms 3A, 3B, and 3C)
The final weight for the public and private school data is:
(Basic Weight) X (Sampling Adjustment Factor) X (School Noninterview Factor) X(Frame Ratio Adjustment Factor)
Where:
Basic Weight is the inverse of the probability of selection of the school.
Sampling Adjustment Factor is an adjustment that accounts for unusual circumstancesthat affect the school's probability of selection, such as a merger, split, or duplica-tion(e.g., a Junior/Senior High which splits into separate Junior and Senior HighSchools).
Noninterview Adjustment Factor is an adjustment that accounts for total schoolnonresponse. It is the weighted (basic weight*sampling adjustment factor) ratio of thetotal eligible in-scope schools to the total responding in-scope schools within cells.
Frame Ratio Adjustment Factor is a factor that adjusts the sample estimates to knownframe totals. For public schools, it is equal to the ratio of the total number of SASSframe noncertainty schools to the weighted sample estimate of the total number ofnoncertainty schools within each cell in the frame. For private schools, the adjust-
121.

Weighting 99
ment is the same, except for the area frame. For the area frame, only sample schoolsin certainty PSUs were adjusted to the PSU totals from the area frame since allschools in the non-certainty PSUs were in sample and we did not have universe countsfor all non-certainty PSUs. Certainty schools were excluded from the numerator anddenominator and their factor set equal to 1. Also, schools from noncertainty PSUshad their factors set equal to 1, since no subsampling took place.
B. School Weighting A eustment Cells
School noninterview and frame ratio adjustments are computed within cells.
1. Public School Adjustment Cells
For public schools, (except BIA and Native American schools) thenoninterview adjustment cells were: state by school grade level by enrollment sizeclass by urbanicity. If the factor was less than 1.5 and there were at least 15 schoolsin the cell, no collapsing was done. Otherwise, cells were collapsed (enrollment sizeclass first, urbanicity second, and grade level third).
For BIA elementary schools, the noninterview adjustment cells were gradelevel by enrollment size class; while BIA secondary schools cells were by grade level.Cells for Native American elementary schools were grade level by state (4 levels) byenrollment size class; while secondary school cells were grade level by state (4levels). If the factor was less than 2.0 and there were at least 10 schools in the cell,no collapsing was done. Otherwise, cells were collapsed in the same sequence as inother public schools.
The frame ratio adjustment cells for public schools (except BIA and AmericanIndian schools) were state by grade level by urbanicity; for BIA schools, they weregrade level; and for Native American schools, they were state (4 groups) by gradelevel. If the factor was between 0.667 and 1.5 and there were at least 15 (10 for BIAand American Indian Schools) non-certainty schools in the cell, no collapsing wasdone. Otherwise, cells were collapsed (urbanicity first, grade level second, and statethird).
2. Private School Adjustment Cells
For private list frame schools, the noninterview adjustment cells were: 18associations by grade level. The Catholic and All Else associations additionally usedurbanicity to define the cells. If the factor was less than 2.0 and there were at least15 schools in the cell, no collapsing was done. If collapsing was done, urbanicity wascollapsed first (for Catholic and ALL ELSE associations), grade level second andassociation last. The frame ratio factor cells were the same as the noninterviewadjustment cells. If the factor was between 0.667 and 1.5 and there were at least 15non-certainty schools in the cell, no collapsing was done. Otherwise, cells werecollapsed (urbanicity first, grade level second, and association last).
122
100 1990-91 SASS Data File Users' Manual
For private area frame schools, the noninterview adjustment cells were:affiliation (Catholic, other religious, nonsectarian, and unknown) by grade level byenrollment size class. If the factor was less than 2.0 and there were at least 15schools in the cell, no collapsing was necessary. If collapsing was necessary, theenrollment size class was collapsed first, grade level was second, and affiliation wascollapsed last.
The frame ratio factor cells were: grade level by certainty PSU. If the factorwas between 0.667 and 1.5 and there were at least 15 noncertainty schools in acertainty PSU in the cell, no collapsing was done. Otherwise, cells were collapsed:grade level first and PSU second.
C. Administrator Weight (SASS Questionnaire Forms 2A and 2B)
The public and private administrator weighting was done the same way as the schoolquestionnaire weighting described above. Since the respondents for each of the administratorsurveys and the corresponding school surveys could be different, the weighting process wasdone separately for each questionnaire. The sum of the administrator weights may not equalthe sum of the school weights because some schools do not have administrators.
D. Teacher Demand and Shortage for Public Districts (SASS QuestionnaireForm 1A)
The final weight for the public school district data is:
(Basic Weight) X (Sampling Adjustment Factor) X (LEA Noninterview Factor) X(Frame Ratio Adjustment Factor)
where:
Basic Weight is the inverse of the probability of selection of the LEA. Note thatLEAs were not selected directly, so the computation of this probability is rathercomplex. See section 7.1.5 for more details.
Sampling Adjustment Factor is an adjustment that accounts for unusual circumstancesthat affect the LEA's probability of selection, such as a merger, split or duplication.For example, if two LEAs consolidated into one.
Noninterview Adjustment Factor is an adjustment that accounts for total LEAnonresponse. It is the weighted (basic weight*sampling adjustment factor) ratio oftotal eligible in-scope LEAs to the total responding in-scope LEAs, computed withincells.
Frame Ratio Adjustment Factor is a factor that adjusts the sample estimates to knownframe totals. It is the ratio of the total number of noncertainty LEAs in the frame to
123

Weighting 101
the weighted sample estimate of the total number of noncertainty LEAs in the frame,computed within cells. Certainty LEAs were assigned a factor of 1.
Noninterview and frame ratio adjustments are computed within cells. Thenoninterview adjustment cells were: state by LEA enrollment size class by metrostatus (central city of MSA, outside central city of MSA, outside MSA) for LEAswith schools, and metro status only for LEAs without schools. If the factor was lessthan 1.5 and there were at least 10 LEAs in the cell, no collapsing was done.Otherwise, cells were collapsed (LEA enrollment size class first and metro statussecond).
The frame adjustment cells were the same as the noninterview adjustment cells.If the factor was between 0.667 and 1.5 and there were at least 10 noncertainty LEAsin the cell, no collapsing was done. Otherwise, cells were collapsed: LEA enroll-ment size class first and metro status second.
E. Local Education Agency (LEA) Basic Weights
Given the complexity of the sampling scheme, the calculation of the LEA basicweights is not straightforward. There are three situations that need discussion: LEAs withschools, LEAs without schools and LEAs in Delaware, Nevada and West Virginia which areall certainty LEAs.
1. LEAs with Schools
The LEA sample was not selected directly through an LEA frame. Instead, theLEAs were selected through the school (i.e., the LEAs associated with the schoolsample comprised the LEA sample). The basic weight, therefore, is more complicat-ed than normal.
Since schools were stratified by grade level (elementary, secondary, andcombined), the probability of selection for LEA k, (Pk(sel)) can be written as follows:
Pk(Sel) =1 -(1 -Pk(Nam,E1)X1 -Pk(Nam,Sec)X1 -Pk(Nam,Com)Xl-Pk(Pub,E1)Xl-Pk(Pub,Sec)X1 -Pk(Pub,Com))
where: Pk(Nam,El) is the probability of selecting LEA k in elementary schools whichare classified as Native American schools. This equals the sumof the school selection probabilities for the schools which areNative American, elementary, and in LEA k. If the sum isgreater than one then Pk(Nam,E1) is set equal to one.
Pk(Nam,Sec) is the probability of selecting LEA k in secondary schools whichare classified as Native American schools. This equals the sumof the school selection probabilities for the schools which are
124

102 1990-91 SASS Data File Users' Manual
Native American, secondary, and in LEA k. If the sum isgreater than one, then Pk(Nam,Sec) is set equal to one.
Pk(Nam,Com) is the probability of selecting LEA k in combinedschools which are classified as Native American schools.This equals the sum of the school selection probabilitiesfor the schools which are Native American, combined,and in LEA k. If the sum is greater than onePk(Nam,Com) is set equal to one.
Pk(Pub,El) is the probability of selecting LEA k in elementary schoolswhich are not Native American. This equals the sum of theschool selection probabilities for the schools which are notNative American, are elementary and in LEA k. If the sum isgreater than one then Pk(Pub,El) is set equal to one.
Pk(Pub,Sec) is the probability of selecting LEA k in secondary schools whichare not Native American. This equals the sum of the schoolselection probabilities for the schools which are not NativeAmerican, are secondary and in LEA k. If the sum is greaterthan one then Pk(Pub,Sec) is set equal to one.
Pk(Pub,Com) is the probability of selecting LEA k in combined schools whichare not Native American. This equals the sum of the schoolselection probabilities for the schools which are not NativeAmerican, are combined and in LEA k. If the sum is greaterthan one then Pk(Pub,Com) is set equal to one.
2. LEAs Without Schools
The basic weight for LEAs that have no associated schools was 10, since theseLEAs were selected with equal probability at a rate of 1 in 10.
3. LEA Basic Weights for Delaware, Nevada and West Virginia
The basic weight is 1 for all LEAs in Delaware, Nevada and West Virginiasince all LEAs in these three states were guaranteed being selected for sample.
F. Teacher Weights (SASS Questionnaire Forms 4A and 4B)
The final weight for public and private school teachers is:
(Basic Weight) X (Sampling Adjustment Factor) X (School Nonresponse Factor) X(Teacher-Within-School Noninterview Adjustment Factor) X (Frame Ratio AdjustmentFactor) X (Teacher Adjustment Factor)
25
Weighting 103
where:
Basic Weight is the inverse of the probability of selection of the teacher.
School Sampling Adjustment Factor is an adjustment that accounts for unusualcircumstances that affect the school's probability of selection, such as a merger, splitor duplication. It is the same factor used in the school weight.
School Nonresponse Adjustment Factor is an adjustment that accounts for schools thatdid not have teachers selected because teacher lists were not provided by the school.It is the weighted (school basic weight*school sampling adjustment factor) ratio oftotal eligible in-scope schools to the total in-scope schools providing teacher lists,computed within cells.
Teacher-within-school noninterview adjustment factor is an adjustment that accountsfor sampled teachers that did not respond to the survey. It is the weighted (product ofall previously defined components) ratio of the total eligible teachers to the totaleligible responding teachers computed within cells.
Frame Ratio Adjustment Factor is a factor that adjusts the sample estimates to knownframe totals of number of teachers. For the set of noncertainty schools, the factor isthe ratio of the frame estimate of the total number of teachers to the weighted (allpreviously defined components) sample estimate of the total number of teachers.These factors are computed within cells. The sample estimate uses the frame count ofthe number of teachers in the school. For public schools, the 1990 CCD was used asthe frame and the teacher counts were in terms of FTEs. For private schools, the1989 PSS was used as the frame and teachers were in terms of headcounts.
For the set of certainty schools, the factor is 1.
Teacher Adjustment Factor is a factor that adjusts the inconsistency between theestimated number of teachers from the SASS school data files and the SASS teachersample files. It is the ratio of weighted number of teachers from the school data filefor a cell to the weighted number of teachers on the teacher data file for a cell. Theweight is the product of all previously defined components. This factor ensures thatteacher aggregates from the school file (after imputation) will agree with the corre-sponding teacher estimates from the teacher file.
The school nonresponse adjustments, the teacher within-school noninterviewadjustments, the frame ratio adjustments, and the teacher adjustments are computedwithin cells. The cells for the frame ratio adjustments are the same as those used inthe school weight except for BIA schools where no frame ratio adjustment was donefor the teacher weight because no teacher data existed on the BIA school sampleframe. The cells for the frame adjustments are described in the school weight section.
126

104 1990-91 SASS Data File Users' Manual
1. Public Adjustment Cells
For public schools, the school nonresponse adjustment cells were: the same asthose used for the school noninterview adjustment cells in the school weight exceptthat enrollment size classes were replaced by teacher size classes for Native Americanschools and other public schools. The collapsing criteria were also the same as thoseused in the school noninterview adjustment in the school weight.
The teacher within-school noninterview adjustment cells were: state by field ofteaching by teacher type (new, experienced, bilingual, Asian, American Indian) byschool urbanicity (only for experienced teachers). If the factor was less than 1.5 andthere were at least 15 teachers in the cell, no collapsing was done. Otherwise, cellswere collapsed (urbanicity first, teacher type second, and field of teaching third).
The teacher adjustment cells and the collapsing criteria were the same as thoseused for the frame ratio adjustments in the school weight.
2. Private Adjustment Cells
For private list frame schools, the school nonresponse adjustment cells were thesame as those used for the school noninterview adjustment cells in the school weight,and the collapsing criteria were also the same.
For private list frame schools, the noninterview adjustment cells were: 18associations by grade level. The Catholic and All Else associations additionally usedurbanicity to define the cells. If the factor was less than 2.0 and there were at least15 schools in the cell, no collapsing was done. If collapsing was done, urbanicity wascollapsed first (for Catholic and ALL ELSE associations), grade level second andassociation last. The frame ratio factor cells were the same, as the noninterviewadjustment cells. If the factor was between 0.667 and 1.5 and there were at least 15non-certainty schools in the cell, no collapsing was done. Otherwise, cells werecollapsed (urbanicity first, grade level second, and association last).
For private area frame schools, the noninterview adjustment cells were:affiliation (Catholic, other religious, non-sectarian, and unknown) by grade level byenrollment size class. If the factor was less than 2.0 and there were at least 15schools in the cell, no collapsing was necessary. If collapsing was necessary, theenrollment size class was collapsed first, grade level was second, and affiliation wascollapsed last.
The teacher within-school noninterview adjustment cells were: affiliation (fourlevels) by field of teaching by teaching experience (new/experienced). If the factorwas less than 1.5 and there was at least 15 teachers in the cell, no collapsing wasdone. If collapsing was done, teaching experience was collapsed first, field ofteaching was collapsed second, and affiliation was collapsed last.
127

Weighting 105
The teacher adjustment cells and the collapsing criteria were the same as thoseused for the frame ratio adjustments in the school weight.
123
X. Variance Estimation
129
107

108 1990-91 SASS Data File Users' Manual
X. Variance Estimation
Each SASS public use file includes a set of replicate weights designed to producebalanced repeated replication (BRR) variance estimates. The balanced repeated replication(BRR) technique was used because software to produce such variance estimates is relatively
common9.
Software which produces variance estimation from replicate weights using balancedrepeated replication is available from:
WESTAT, Inc.1650 Research Blvd.Rockville, MD 20850
Attention: Marilyn Rowen(301) 251-4232
A proprietary computer program (WESVAR), available at WESTAT, Inc., can beused to estimate these standard errors. The software runs under IBM/OS and VAX/VMS
systems.
A. Replicate Assignment
Below is a brief description of how the replicates were assigned.
1. Replicates: Public Schools
Replicates were created for the public school sample file by first forming 48variance strata. Each variance stratum contained at least two schools which werealternately divided into two half-samples. To form the variance strata, certaintyschools were placed in their own variance stratum where each certainty school wasassigned to both half-samples. The noncertainty schools within a state/school levelsampling stratum were sorted by the school's order of selection. Pairs of schoolswere then systematically placed into consecutive variance strata. When the 48variance strata were exhausted, the placement of paired schools started from the firstvariance stratum again. This continued until all the paired schools in the samplingstratum were placed into variance strata. Numbering for the next sampling stratumstarted where the previous sampling stratum left off. For example, when the last pairof the previous sampling stratum was assigned to variance stratum N, first pair in thenext sampling stratum is assigned N + 1. When there was an odd number ofnoncertainty schools within a sampling stratum, one variance stratum was assigned anodd number of cases and adjustments were made to the replicate factors to account forthis odd number of cases. After the variance strata were assigned, an orthogonalmatrix was used to form the 48 replicates.
9Wo lter, K. M.(1985). Introduction to Variance Estimation. New York: Springer-Verlag.
130
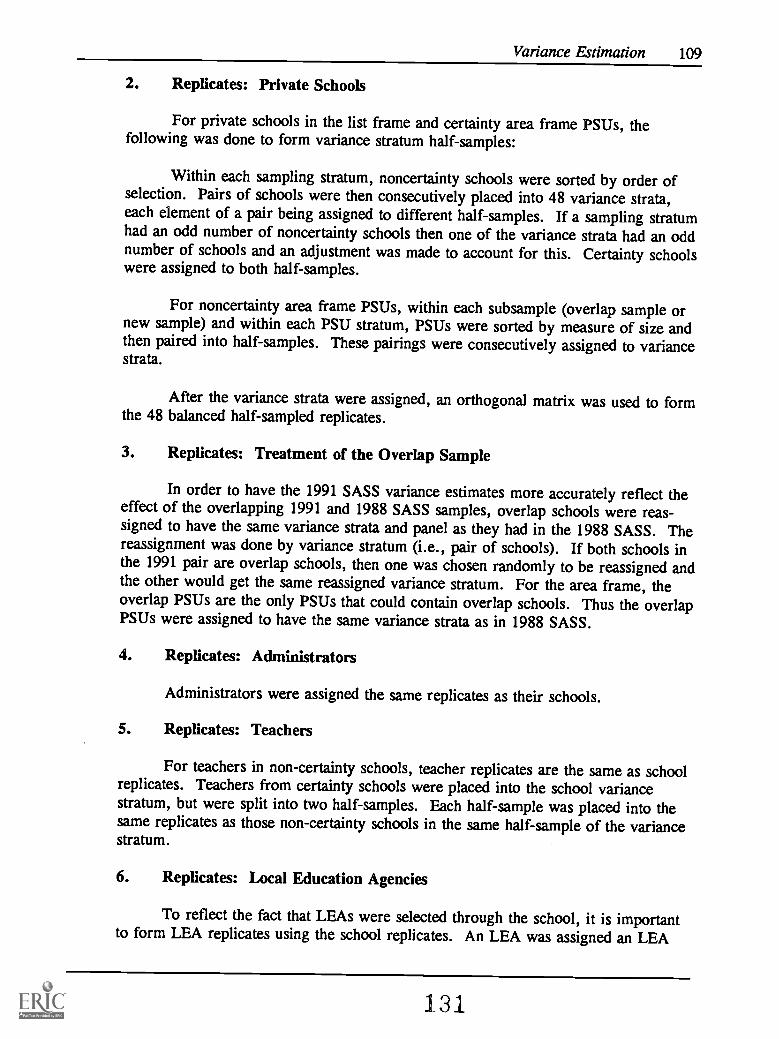
Variance Estimation 109
2. Replicates: Private Schools
For private schools in the list frame and certainty area frame PSUs, thefollowing was done to form variance stratum half-samples:
Within each sampling stratum, noncertainty schools were sorted by order ofselection. Pairs of schools were then consecutively placed into 48 variance strata,each element of a pair being assigned to different half-samples. If a sampling stratumhad an odd number of noncertainty schools then one of the variance strata had an oddnumber of schools and an adjustment was made to account for this. Certainty schoolswere assigned to both half-samples.
For noncertainty area frame PSUs, within each subsample (overlap sample ornew sample) and within each PSU stratum, PSUs were sorted by measure of size andthen paired into half-samples. These pairings were consecutively assigned to variancestrata.
After the variance strata were assigned, an orthogonal matrix was used to formthe 48 balanced half-sampled replicates.
3. Replicates: Treatment of the Overlap Sample
In order to have the 1991 SASS variance estimates more accurately reflect theeffect of the overlapping 1991 and 1988 SASS samples, overlap schools were reas-signed to have the same variance strata and panel as they had in the 1988 SASS. Thereassignment was done by variance stratum (i.e., pair of schools). If both schools inthe 1991 pair are overlap schools, then one was chosen randomly to be reassigned andthe other would get the same reassigned variance stratum. For the area frame, theoverlap PSUs are the only PSUs that could contain overlap schools. Thus the overlapPSUs were assigned to have the same variance strata as in 1988 SASS.
4. Replicates: Administrators
Administrators were assigned the same replicates as their schools.
5. Replicates: Teachers
For teachers in non-certainty schools, teacher replicates are the same as schoolreplicates. Teachers from certainty schools were placed into the school variancestratum, but were split into two half-samples. Each half-sample was placed into thesame replicates as those non-certainty schools in the same half-sample of the variancestratum.
6. Replicates: Local Education Agencies
To reflect the fact that LEAs were selected through the school, it is importantto form LEA replicates using the school replicates. An LEA was assigned an LEA
131
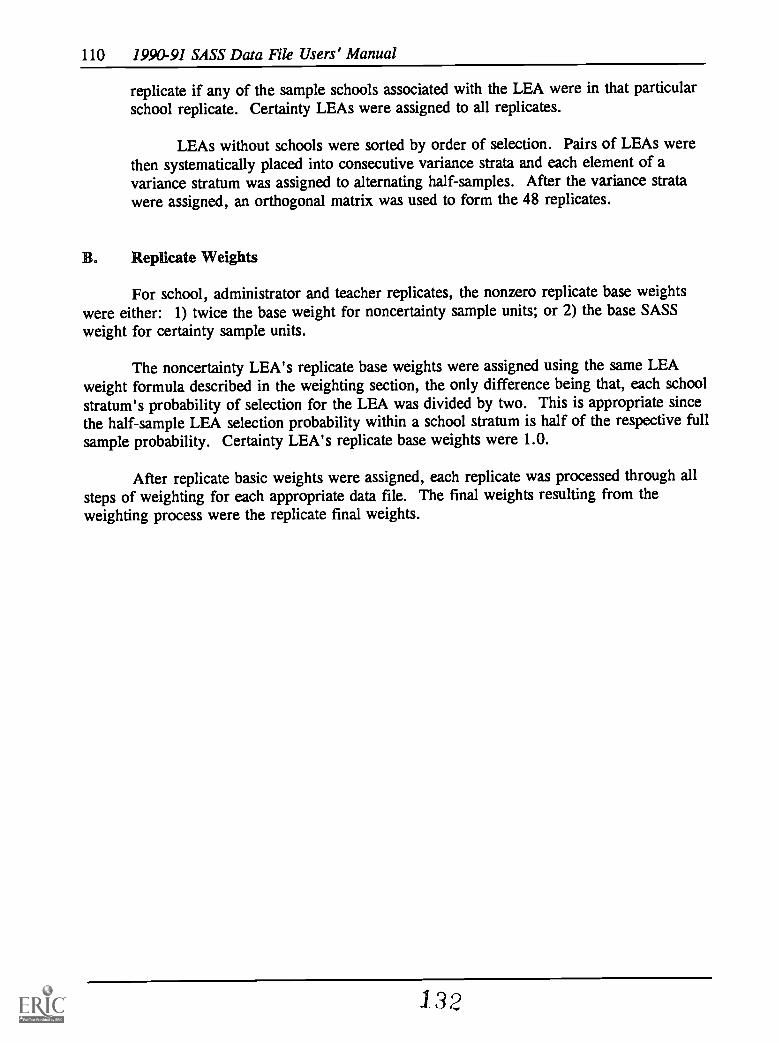
110 1990-91 SASS Data File Users' Manual
replicate if any of the sample schools associated with the LEA were in that particularschool replicate. Certainty LEAs were assigned to all replicates.
LEAs without schools were sorted by order of selection. Pairs of LEAs werethen systematically placed into consecutive variance strata and each element of avariance stratum was assigned to alternating half-samples. After the variance stratawere assigned, an orthogonal matrix was used to form the 48 replicates.
Replicate Weights
For school, administrator and teacher replicates, the nonzero replicate base weightswere either: 1) twice the base weight for noncertainty sample units; or 2) the base SASSweight for certainty sample units.
The noncertainty LEA's replicate base weights were assigned using the same LEAweight formula described in the weighting section, the only difference being that, each schoolstratum's probability of selection for the LEA was divided by two. This is appropriate sincethe half-sample LEA selection probability within a school stratum is half of the respective fullsample probability. Certainty LEA's replicate base weights were 1.0.
After replicate basic weights were assigned, each replicate was processed through allsteps of weighting for each appropriate data file. The final weights resulting from theweighting process were the replicate final weights.
1 3 2

111
XL Reinterview Program
133

112 1990-91 SASS Data File Users' Manual
XI. Reinterview Program
As in the previous administration of the SASS, the 1990-91 SASS included areinterview program. Reinterview programs are typically designed to evaluate field workand/or to estimate error components, such as simple response variance and response bias, in asurvey model"). The purpose of the SASS reinterview program was to estimate simpleresponse variance; that is, to measure the consistency in response between the original surveyand the reinterview (reliability of the data). High inconsistency indicates there is a problemwith the design of the question or the nature of the data being collected. It also can oftenindicate the presence of bias in the data. The SASS reinterview program consisted ofadministering a subset of questions to a subset of each sample School Administrator, School,and Teacher Surveys.
Field Representatives (FRs) conducted all reinterviews by telephone for the SchoolAdministrator and Teacher Surveys. For the School Survey, the school received a separatemail reinterview questionnaire if the school responded to the original survey by mail. FieldRepresentatives conducted reinterviews by telephone for those schools which did not respondto the mail reinterview or were interviewed by telephone in the original survey.
The consistency of interview data was measured by comparing original survey andreinterview responses and then computing indices of inconsistency and gross difference rates(see Forsman and Schreiner, 1991, for a discussion of these indices).
The reinterview sample design was a systematic subsample resulting in the selection of1,123 schools and administrators and 1,103 teachers. The reinterview sampling of public andprivate schools and public and private teachers was proportionate to their respective originalsamples. The following are the final response rates obtained from the SASS reinterview.
a. School Administrator Survey: 93.5%
b. School Survey
Mail Reinterview: 84.6%Telephone Reinterview: 84.3%Final: 91.0%
c. Teacher Survey: 82.8%
Since the reinterview sample was selected before the mailout of the survey question-naires, the sample includes losses due to original survey noninterviews. The base forcomputing the reinterview response rates excludes these original survey noninterviews. For
"Torsman, G. and Schreiner, I., "The Design and Analysis of Reinterview: An Overview," in Biemer, P.P., Groves, R. M., Lyberg, L. E., Mathiowetz, N. A., and Sudman, S., editors, Measurement Errors inSurveys. (New York: John Wiley & Sons, 1991), 279-301.
1.34
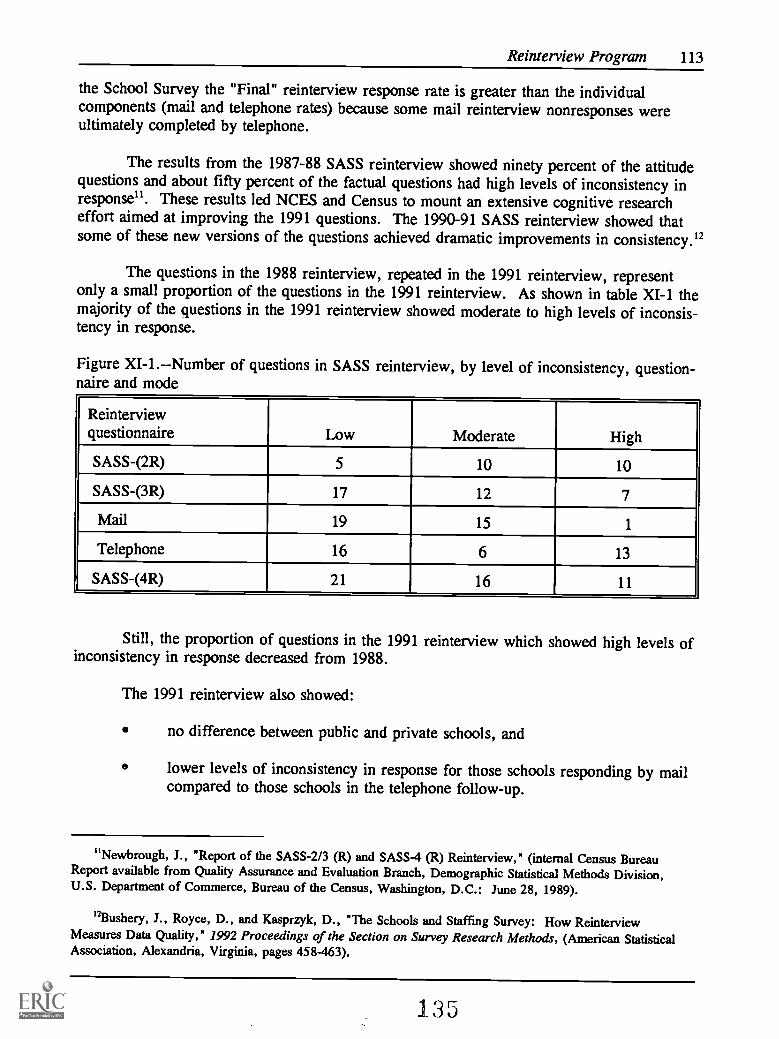
Reinterview Program 113
the School Survey the "Final" reinterview response rate is greater than the individualcomponents (mail and telephone rates) because some mail reinterview nonresponses wereultimately completed by telephone.
The results from the 1987-88 SASS reinterview showed ninety percent of the attitudequestions and about fifty percent of the factual questions had high levels of inconsistency inresponse". These results led NCES and Census to mount an extensive cognitive researcheffort aimed at improving the 1991 questions. The 1990-91 SASS reinterview showed thatsome of these new versions of the questions achieved dramatic improvements in consistency."
The questions in the 1988 reinterview, repeated in the 1991 reinterview, representonly a small proportion of the questions in the 1991 reinterview. As shown in table XI-1 themajority of the questions in the 1991 reinterview showed moderate to high levels of inconsis-tency in response.
Figure XI-1.--Number of questions in SASS reinterview, by level of inconsistency, question-naire and mode
Reinterviewquestionnaire Low Moderate High
SASS-(2R) 5 10 10
SASS-(3R) 17 12 7
Mail 19 15 1
Telephone 16 6 13
SASS-(4R) 21 16 11
Still, the proportion of questions in the 1991 reinterview which showed high levels ofinconsistency in response decreased from 1988.
The 1991 reinterview also showed:
no difference between public and private schools, and
lower levels of inconsistency in response for those schools responding by mailcompared to those schools in the telephone follow-up.
"Newbrough, J., "Report of the SASS-2/3 (R) and SASS-4 (R) Reinterview," (internal Census BureauReport available from Quality Assurance and Evaluation Branch, Demographic Statistical Methods Division,U.S. Department of Commerce, Bureau of the Census, Washington, D.C.: June 28, 1989).
'2Bushery, J., Royce, D., and Kasprzyk, D., "The Schools and Staffing Survey: How ReinterviewMeasures Data Quality," 1992 Proceedings of the Section on Survey Research Methods, (American StatisticalAssociation, Alexandria, Virginia, pages 458-463).
135

114 1990-91 SASS Data File Users' Manual
For those schools responding by mail the reliability of the data is significantly betterfor all but one question. However, the telephone follow-up includes the reluctant respondentsfor which the data are potentially worse.
While the 1991 reinterview results show some improvement in the quality of the SASSdata, more work still needs to be done. These reinterview results will serve as an aid in thedevelopment of the 1993-94 SASS questionnaires. They will also help in determining thedirection of the reinterview program for the 1993-94 SASS.
136

115
XII. Reviewing the Quality of SASS Data
137

116 1990-91 SASS Data File Users' Manual
XII. Reviewing the Quality of SASS Data
NCES program staff have the responsibility of ensuring a data base is acceptable forpublic release. Before microdata files are released to the public, staff in the Special Surveysand Analysis Branch of the Elementary and Secondary Education Statistics Division reviewthe microdata file for errors associated with the edit, imputation and weighting systems.Frequency counts, bivariate, and multivariate tables were reviewed, and when possiblecomparisons were made to external sources such as the Common Core of Data and thePrivate School Survey.
Unit nonresponse: Response rates were calculated at the state or association level forall SASS components (see Tables VI-1 through VI-4). Nonresponding districts, schools,principals, and teachers are being studied in greater detail to identify patterns of nonresponse(see Chapter VI).
Item nonresponse: The extent of item nonresponse for each SASS questionnaire wasdetermined. Items with high nonresponse rates were identified and reported (see Table VI-5).
Edits: The validity of the branching process (skip patterns) in the questionnaire wasestablished for each SASS questionnaire; that is, analysts verified that each item in thequestionnaire had the number of responses it should have had if branching instructions werefollowed correctly. Quality checks on the edit specifications were performed and resulted insome corrections (which were treated as imputations).
Reasonableness of Data: Univariate, bivariate and multivariate tabulations of keysurvey variables were obtained and compared to estimates from other data sources such as theprevious SASS survey, the Common Core of Data, and the Private School Universe Survey.Tabulations were reviewed to determine whether the basic relationships observed werereasonable.
Frequency counts: Unweighted record counts for every variable were examined fromthe restricted-use file. Variables with out-of-range values or inconsistent values wereidentified and values with these characteristics were corrected.
Unweighted Record Counts: Unweighted record counts are released with eachmicrodata file so that users can determine whether the correct number of records has beenidentified. The weighted record counts are to provide data users with selected final nationalestimates for comparison.
The review of the SASS replicate weights consisted of reviewing the distribution ofthese weights. The following was done:
1) For each replicate, the weights were totaled. Each replicate total, as well as,the average of these numbers was checked against the full-sample estimate.The standard error of the replicate totals was computed and checked forreasonableness.
1.38

Reviewing the Quality of SASS Data 117
2) The number of zero weights was checked against what would be expected withhalf-sample replication.
3) The replicate weights were verified to be approximately twice the full-sampleweights.
Additional details on each component of the SASS are detailed below:
A. Teacher Demand and Shortage Questionnaire for Public School Districts(SASS-1A)
For the district data collection on the Teacher Demand and Shortage Questionnaire,comparisons of the number of districts by selected characteristics were made to the 1988-89CCD which served as the sampling frame for the 1990-91 SASS. The only criterion fordistricts to be included in SASS was that they hired or employed teachers. All other districtswere defined as out-of-scope. Because not all districts in each state were considered in-scopefor SASS (i.e. supervisory unions and some other administrative districts that do not hireteachers were not eligible), two comparisons were made, one to the total number of districtsfor the state and one to the number of regular districts in the state. Depending upon thenumber of ineligible districts in each particular state, the SASS estimates are either closer tothe total or to the regular number of districts in CCD. Estimates of teachers and studentswere compared with the 1990-91 CCD, because that was the same year in which SASS datawere collected. The CCD estimates are independent from SASS.
States in which the SASS estimates of the number of districts or the number ofteachers and/or students within individual districts differed from CCD by 15 percent or morewere examined from the first edited data file. Eight states had overestimates using thiscriterion. They were: New Hampshire, Vermont, Minnesota, Montana, Massachusetts,Michigan, Mississippi, and Nebraska. Upon closer examination, it was determined that theseoverestimates resulted from including districts in SASS which are supervisory unions or otherdistricts that do not hire teachers. These districts should have been coded as ineligible butwere inadvertently allowed to complete the questionnaire. Edit checks failed to reveal theseineligible cases. In such cases, teachers and students were double counted because anotherregular district in the supervisory union also had a probability of selection and was alreadyincluded in the estimate for that state. A comparison of the SASS data from questionabledistricts with the CCD data on the same and associated districts indicated that several districtswere incorrectly included, thereby doubling the estimates of students or teachers. In eachduplicate pair, one district's record was corrected on the data tape by blanking all data fields,changing the final weight to zero and changing the interview status code to "out of scope" orineligible for the survey. The remaining district record's weight was recalculated, to reflect adifferent nonresponse adjustment factor.
After the data were corrected and new estimates computed, comparisons were againmade to CCD estimates. The results are reported in tables XII-1, XII-2, and XII-3. Theyreport the SASS estimate, the CCD number, and the SASS estimate as a percent of CCD. Tosummarize:
130

118 1990-91 SASS Data File Users' Manual
Table XII-1 contains counts of districts - Column 1 shows the total number of districtsreported on CCD, column 2 the number of regular districts on CCD, column 3 the SASSestimate for number of districts, column 4 the SASS estimate as a percent of total CCDdistricts, and column 5 the SASS estimate as percent of regular CCD districts. Depending onthe number of districts in the state that do not hire teachers, the SASS estimate should becloser to either the total number of districts or the number of regular districts. The followingstates differ from the CCD numbers by 15 percent or more on one of the estimates: Ken-tucky, Maine, Massachusetts, Michigan, Minnesota, Montana, Nebraska, New Hampshire,North Dakota, Pennsylvania, South Dakota, Utah, Vermont, and Wyoming. A summary ofthese differences follows by state:
Kentucky: CCD lists a total of 256 districts and 177 regular districts. The SASSestimate of districts is 229, an underestimate of total districts by 10.5 percent, and anoverestimate of regular districts by 29 percent. A call to Kentucky's state departmentof education revealed that of the 77 administrative districts on the CCD file, 13 statevocational-technical centers serve postsecondary students only, and two others arefederally operated agencies; thus reducing the number of in-scope districts to 241, andbringing the SASS estimate within 95 percent of the eligible CCD districts. Orexamined another way, the SASS file estimates that 51 districts in Kentucky areadministrative districts; therefore, subtracting 51 from the total SASS estimates yields178 regular districts, compared to 177 regular districts reported by CCD.
Maine: CCD lists 294 total and 210 regular districts. The SASS estimate of 234 is a20.5 percent underestimate of total and an 11.4 percent overestimate of regular. TheCCD directory, however, indicates that 34 districts are supervisory unions, ineligiblein SASS because they do not hire teachers. Subtracting 34 from 294 yields 260. TheSASS estimate of 234 underestimates this number by 10 percent.
Massachusetts: CCD reports 50 supervisory unions and 36 regional service agencies,neither type employing teachers. The valid count for district comparisons is thereforethe number of regular districts, which SASS underestimates by about 3.3 percent.
Michigan: CCD reports 61 administrative districts in Michigan which do not hireteachers. SASS underestimates regular districts, by slightly less than 15 percent.
Minnesota: Minnesota reports 505 total districts, 436 of which are regular. SASSunderestimates total districts by 16 percent and regular districts by 3 percent. Thirty-three of the administrative districts, however, employ teachers and thus are eligiblefor SASS. When those 33 are added to the 436 regular districts, SASS underestimatesthose eligible districts by 10 percent.
Montana: The large number of supervisory unions and regional education serviceagencies, none of which hire teachers, makes the number of regular districts inMontana the correct comparison. SASS underestimates this number by 4.5 percent.
140
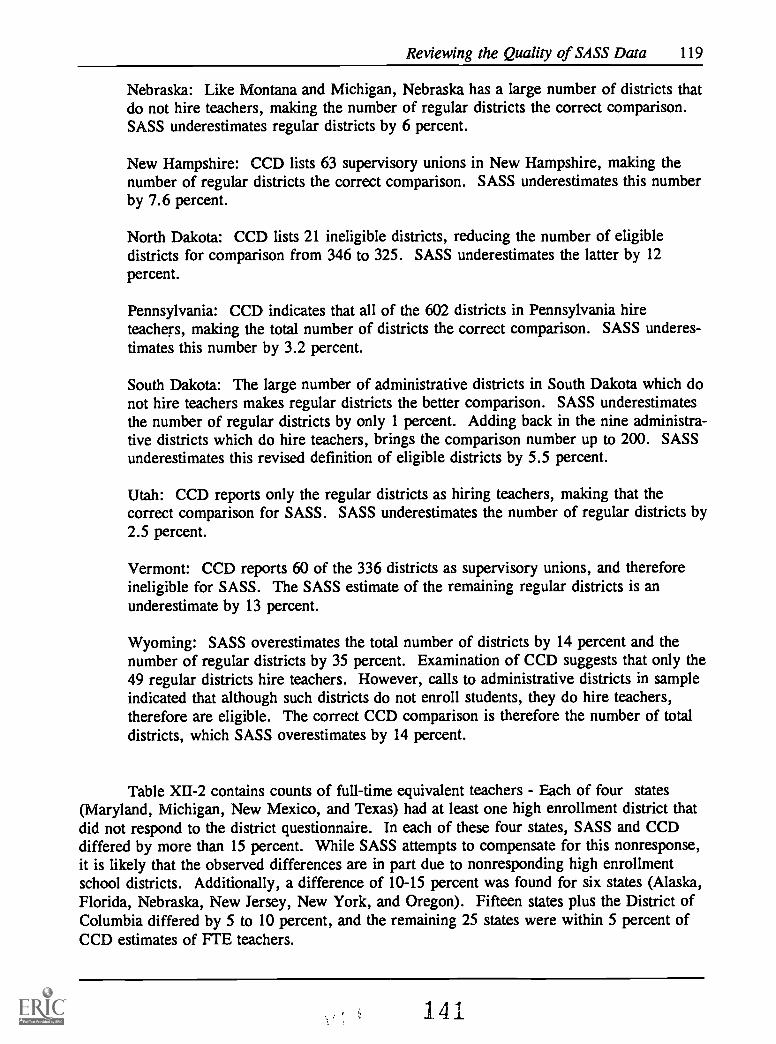
Reviewing the Quality of SASS Data 119
Nebraska: Like Montana and Michigan, Nebraska has a large number of districts thatdo not hire teachers, making the number of regular districts the correct comparison.SASS underestimates regular districts by 6 percent.
New Hampshire: CCD lists 63 supervisory unions in New Hampshire, making thenumber of regular districts the correct comparison. SASS underestimates this numberby 7.6 percent.
North Dakota: CCD lists 21 ineligible districts, reducing the number of eligibledistricts for comparison from 346 to 325. SASS underestimates the latter by 12percent.
Pennsylvania: CCD indicates that all of the 602 districts in Pennsylvania hireteachers, making the total number of districts the correct comparison. SASS underes-timates this number by 3.2 percent.
South Dakota: The large number of administrative districts in South Dakota which donot hire teachers makes regular districts the better comparison. SASS underestimatesthe number of regular districts by only 1 percent. Adding back in the nine administra-tive districts which do hire teachers, brings the comparison number up to 200. SASSunderestimates this revised definition of eligible districts by 5.5 percent.
Utah: CCD reports only the regular districts as hiring teachers, making that thecorrect comparison for SASS. SASS underestimates the number of regular districts by2.5 percent.
Vermont: CCD reports 60 of the 336 districts as supervisory unions, and thereforeineligible for SASS. The SASS estimate of the remaining regular districts is anunderestimate by 13 percent.
Wyoming: SASS overestimates the total number of districts by 14 percent and thenumber of regular districts by 35 percent. Examination of CCD suggests that only the49 regular districts hire teachers. However, calls to administrative districts in sampleindicated that although such districts do not enroll students, they do hire teachers,therefore are eligible. The correct CCD comparison is therefore the number of totaldistricts, which SASS overestimates by 14 percent.
Table XII-2 contains counts of full-time equivalent teachers Each of four states(Maryland, Michigan, New Mexico, and Texas) had at least one high enrollment district thatdid not respond to the district questionnaire. In each of these four states, SASS and CCDdiffered by more than 15 percent. While SASS attempts to compensate for this nonresponse,it is likely that the observed differences are in part due to nonresponding high enrollmentschool districts. Additionally, a difference of 10-15 percent was found for six states (Alaska,Florida, Nebraska, New Jersey, New York, and Oregon). Fifteen states plus the District ofColumbia differed by 5 to 10 percent, and the remaining 25 states were within 5 percent ofCCD estimates of FTE teachers.
141

120 1990-91 SASS Data File Users' Manual
Table XII-3 contains counts of Student Enrollment - Three states, Michigan, Nevada,and New Mexico, differed by 10 to 15 percent; and nine states plus the District of Columbiadiffered by 5 to 10 percent. The remaining 38 states were within 5 percent of the CCDenrollment counts.
Other aspects of reviewing the Teacher Demand and Shortage Questionnaire aredocumented in the NCES memorandum, "1991 SASS Public TDS file - data check".13
"Rollefson, M. "1991 SASS Public TDS file - data check". Unpublished memorandum available uponrequest from the U.S. Department of Education, National Center for Education Statistics, (Washington, D.C.:October 22, 1992).
142

Reviewing the Quality of SASS Data 121
Table XH-1.--Estimated number of districts by state compared with number of districts reported on 1988-89Common Core of. Data
State
Total Number of SASS as a SASS as anumber regular Number percent percent ofof districts districts of districts of total regularCCD CCD SASS districts districts
50 States and D.C. 16,982 15,376 15,512 91.34% 100.88%
Alabama 133 129 147 110.30% 113.72%Alaska 56 55 56 100.00% 101.82%Arizona 244 238 239 97.95% 100.42%Arkansas 350 329 322 92.00% 97.87%California 1,151 1,077 1,109 96.35% 102.97%
Colorado 197 176 193 97.97% 109.66%Connecticut 176 166 169 96.02% 101.81%Delaware 22 19 19 86.36% 100.00%District of Columbia 1 1 1 100.00% 100.00%Florida 67 67 68 101.49% 101.49%
Georgia 186 186 186 100.00% 100.00%Hawaii 1 1 1 100.00% 100.00%Idaho 115 115 117 101.74% 101.74%Illinois 1,053 972 1,032 98.01% 106.17%Indiana 331 303 316 95.47% 104.29%
Iowa 465 433 433 93.12% 100.00%Kansas 304 304 304 100.00% 100.00%Kentucky 256 177 229 89.45% 129.38%Louisiana 83 66 74 89.16% 112.12%Maine 294 210 234 79.59% 111.43%
Maryland 24 24 24 100.00% 100.00%Massachusetts 437 359 347 79.41% 96.66%Michigan 622 561 478 76.85% 85.20%Minnesota 505 436 424 83.96% 97.25%Mississippi 167 152 155 92.81% 101.97%
Missouri 545 544 545 100.00% 100.18%Montana 631 549 524 83.04% 95.45%Nebraska 981 862 811 82.67% 94.08%Nevada 17 17 17 100.00% 100.00%New Hampshire 230 170 157 68.26% 92.35%
New Jersey 615 602 581 94.47% 96.51%New Mexico 96 88 88 91.67% 100.00%New York 762 721 754 98.95% 104.58%North Carolina 142 140 139 97.89% 99.29%North Dakota 346 296 286 82.66% 96.62%
143
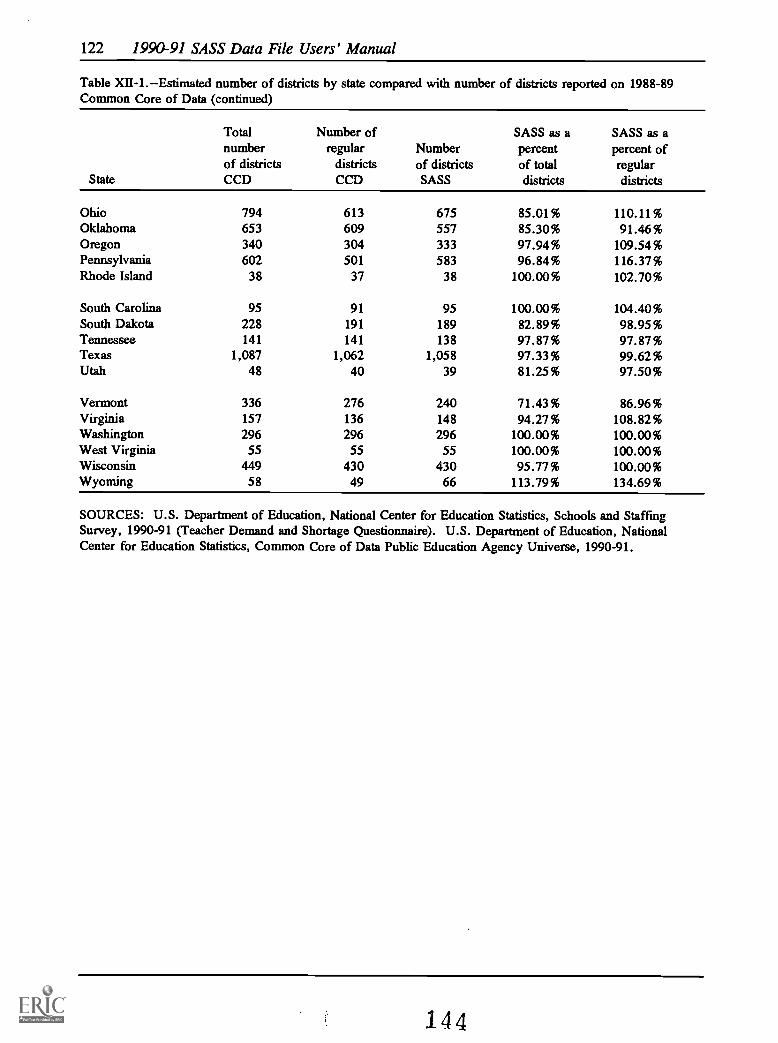
122 1990-91 SASS Data File Users' Manual
Table XII-1.--Estimated number of districts by state compared with number of districts reported on 1988-89Common Core of Data (continued)
State
Totalnumberof districtsCCD
Number ofregular
districtsCCD
Numberof districtsSASS
SASS as apercentof totaldistricts
SASS as apercent ofregulardistricts
Ohio 794 613 675 85.01% 110.11%Oklahoma 653 609 557 85.30% 91.46%Oregon 340 304 333 97.94% 109.54%Pennsylvania 602 501 583 96.84% 116.37%Rhode Island 38 37 38 100.00% 102.70%
South Carolina 95 91 95 100.00% 104.40%South Dakota 228 191 189 82.89% 98.95%Tennessee 141 141 138 97.87% 97.87%Texas 1,087 1,062 1,058 97.33% 99.62%Utah 48 40 39 81.25% 97.50%
Vermont 336 276 240 71.43% 86.96%Virginia 157 136 148 94.27% 108.82%Washington 296 296 296 100.00% 100.00%West Virginia 55 55 55 100.00% 100.00%Wisconsin 449 430 430 95.77% 100.00%Wyoming 58 49 66 113.79% 134.69%
SOURCES: U.S. Department of Education, National Center for Education Statistics, Schools and StaffingSurvey, 1990-91 (Teacher Demand and Shortage Questionnaire). U.S. Department of Education, NationalCenter for Education Statistics, Common Core of Data Public Education Agency Universe, 1990-91.
144

.
Reviewing the Quality of SASS Data 123
Table XII-2.--Estimated number of FTE teachers by state compared with 1990-91 Common Core of Data
State
FTEteachers
CCD
FIEteachers
SASS
SASS asa percent
of CCD
50 States and D.C. 2,397,351 2,255,331 94.08%
Alabama 36,266 38,769 106.90%Alaska 6,710 5,809 86.57%Arizona 32,987 31,044 94.11%Arkansas 25,984 25,891 99.64%California 217,228 199,400 91.79%
Colorado 32,342 31,699 98.01%Connecticut 34,549 31,923 92.40%Delaware 5,961 5,900 98.98%District of Columbia 5,950 5,543 93.16%Florida 108,088 97,379 90.09%
Georgia 63,058 64,351 102.05%Hawaii 9,083 8,443 92.95%Idaho 11,254 10,435 92.72%Illinois 108,775 107,203 98.55%Indiana 54,509 52,817 96.90%
Iowa 31,045 31,541 101.60%Kansas 29,140 27,952 95.92%Kentucky 36,777 38,528 104.76%Louisiana 45,377 41,955 92.46%Maine 15,513 15,213 98.07%
Maryland 42,562 35,878 84.30%Massachusetts 54,003 57,353 106.20%Michigan 80,008 67,782 84.72%Minnesota 43,753 40,491 92.54%Mississippi 28,062 26,159 93.22%
Missouri 52,304 50,041 95.67%Montana 9,613 10,537 109.61%Nebraska 18,764 18,977 101.14%Nevada 10,373 9,211 88.80%New Hampshire 10,637 10,684 100.44%
New Jersey 79,886 71,710 89.77%New Mexico 16,703 13,596 81.40%New York 176,390 152,814 86.63%North Carolina 64,283 63,445 98.70%North Dakota 7,591 7,805 102.82%
145

124 1990-91 SASS Data File Users' Manual
Table XII-2.--Estimated number of FTE teachers by state compared with 1990-91 Common Core of Data(continued)
State
FTEteachers
CCD
FTEteachers
SASS
SASS asa percentof CCD
Ohio 102,714 99,837 97.20%Oklahoma 37,221 35,377 95.05%Oregon 26,163 24,022 91.82%Pennsylvania 100,275 105,506 105.22%Rhode Island 9,522 8,771 92.11%
South Carolina 36,963 35,083 94.91%South Dakota 8,511 8,793 103.31%Tennessee 43,051 41,947 97.44%Texas 219,298 185,681 84.67%Utah 17,884 18,743 104.80%
Vermont 7,257 7,202 99.24%Virginia 63,638 60,486 95.05%Washington 41,764 41,353 99.02%West Virginia 21,476 19,837 92.37%Wisconsin 49,302 47,963 97.28%Wyoming 6,784 6,458 95.19%
SOURCES: U.S. Department of Education, National Center for Education Statistics, Schools and StaffingSurvey, 1990-91 (Teacher Demand and Shortage Questionnaire). U.S. Department of Education, NationalCenter for Education Statistics, Common Core of Data Public Education Agency Universe, 1990-91.
1.46

Reviewing the Quality of SASS Data 125
Table XII-3.--Estimated enrollment by state compared with 1990-91 Common Core of Data
StateEnrollment
CCDEnrollment
SASS
SASS as apercentof CCD
50 States and D.C. 41,223,804 40,092,448 97.26%
Alabama 721,806 681,152 94.37%Alaska 113,874 105,870 92.97%Arizona 639,853 624,851 97.66%Arkansas 436,286 431,318 98.86%California 4,950,474 4,852,640 98.02%
Colorado 574,213 553,543 96.40%Connecticut 469,123 458,626 97.76%Delaware 99,658 99,423 99.76%District of Columbia 80,694 72,654 90.04%Florida 1,861,592 1,830,616 98.34%
Georgia 1,151,687 1,170,123 101.60%Hawaii 171,708 170,738 99.44%Idaho 220,840 201,888 91.42%Illinois 1,821,407 1,841,872 101.12%Indiana 954,581 938,317 98.30%
Iowa 483,652 479,174 99.07%Kansas 437,034 430,172 98.43%Kentucky 636,401 667,769 104.93%Louisiana 784,757 746,885 95.17%Maine 215,149 219,431 101.99%
Maryland 715,176 661,472 92.49%Massachusetts 834,314 827,823 99.22%Michigan 1,581,925 1,382,498 87.39%Minnesota 756,374 769,164 101.69%Mississippi 502,417 493,300 98.19%
Missouri 812,234 812,727 100.06%Montana 152,974 158,842 103.84%Nebraska 274,081 268,598 98.00%Nevada 201,316 176,493 87.67%New Hampshire 172,785 160,841 93.09%
New Jersey 1,089,646 1,007,166 92.43%New Mexico 301,881 270,003 89.44%New York 2,598,337 2,388,129 91.91%North Carolina 1,086,871 1,136,219 104.54%North Dakota 117,825 121,473 103.10%
147

126 1990-91 SASS Data File Users' Manual
Table XII-3.--Estimated enrollment by state compared with 1991 Common Core of Data (continued)
StateEnrollment
CCDEnrollment
SASS
SASS as apercentof CCD
Ohio 1,771,516 1,764,445 99.60%Oklahoma 579,087 561,482 96.96%Oregon 484,652 476,745 98.37%Pennsylvania 1,667,836 1,764,705 105.81%Rhode Island 138,813 137,928 99.36%
South Carolina 622,112 592,297 95.21%South Dakota 129,164 137,002 106.07%Tennessee 824,595 797,454 96.71%Texas 3,382,887 3,103,275 97.31%Utah 447,891 426,916 95.32%
Vermont 95,762 96,298 100.56%Virginia 998,601 990,527 99.19%Washington 839,709 856,655 102.02%West Virginia 322,389 316,814 98.27%Wisconsin 797,621 761,239 95.44%Wyoming 98,226 96,830 98.58%
SOURCES: U.S. Department of Education, National Center for Education Statistics, Schools and StaffingSurvey, 1990-91 (Teacher Demand and Shortage Questionnaire). U.S. Department of Education, NationalCenter for Education Statistics, Common Core of Data Public Education Agency Universe, 1990-91.
1..48

Reviewing the Quality of SASS Data 127
B. School Administrator Questionnaires (SASS-2A and 2B)
Both Public and Private School Administrator Questionnaires had imputation rateshigher than 10 percent for ASCO1 1 ("Were you the principal of this school in the spring of1988?"). The imputation rates were 11.8 and 10.2 for public and private schools respective-ly.
Review of the Private School Administrator data revealed several cases in which skippatterns were not followed correctly. For ASCO20, ASC032, ASC053, and ASC122 respon-dents followed skip instructions when they should not have. Consequently, ASCO21 -ASCO29, ASC033, and ASC054 were not answered but should have been. Respondent errorswere corrected by creating a "not answered" category and correcting the data to reflect that,in fact, the respondents did not answer those questions. For more information, on thenumber of edit changes made per item, see "Results of Examination of 1990-91 SASS Publicand Private School Administrator Files (SASS 2A and 2B)".'4
Unweighted and weighted tabulations were reviewed comparing the 1987-88 SASSdata on principals with the 1990-91 SASS data; the 1990-91 SASS data appeared to bereasonable in those comparisons.
C. School Questionnaires (SASS-3A and 3B)
Post-processing edits (see Chapter VII Section F) revealed several schools thatrequired recoding from interviews to out-of-scope. A school was considered out-of-scope if:it did not serve any of grades 1-12; it no longer existed (due to merging with another school);or, in the case of private schools, if it had fewer than 10 students or was located in a privateresidence. Because interview status changed, data were reweighted and new estimates wereproduced.
Table XII-4 presents weighted estimates of public schools by state. Only one state(Oklahoma) had an estimate for number of schools that differed from CCD's estimate asmuch as 15 percent. Eight states (Alaska, Arizona, Louisiana, Minnesota, Nevada, SouthDakota, Wisconsin, and Wyoming) plus the District of Columbia differed by 5-10 percent,and the remaining 42 states were within 5 percent of CCD estimates.
Table XII-5 presents the weighted estimates for the private schools, students, andteachers by the 9-category private school typology. Data for the private schools werecompared to the 1989-90 Private School Survey (PSS) which served as its frame. The overallweighted expected number of schools in SASS was within two percentage points of the PSS,but the out-of-scope cases reduced the weighted estimate of respondent schools to a differenceof more than seven percentage points. This may reflect discrepancies due to the comparisonat two different time points or deficiencies in the frame, such as duplicate schools. A
"Hammer, C. "Results of Examination of 1990-91 SASS Public and Private School Administrator Files(SASS 2A and 2B)". Internal memorandum available from the U.S. Department of Education, National Centerfor Education Statistics, (Washington, D.C.: October 21, 1992).
49

128 1990-91 SASS Data File Users' Manual
discussion of these differences can be found in Section XVIII, "Cautions Concerning theMeasurement of Change Estimates using 1987-88 and 1990-91 SASS". This resulted inunderestimating the number of schools for all private school types.
The higher-than-expected counts of private school teachers and students may be due tosampling variability or to systemic changes in those schools sampled by SASS. For example,the higher demand for private school admission and consolidation of small schools into fewer,bigger schools resulted in increased enrollment, and, thus, higher teacher counts.
Comparisons of the 1987-88" with the 1990-91" SASS reveal that the number ofstudents participating in programs such as Chapter I, reduced or free lunch, and English as asecond language has grown at a higher rate than the population growth. The remedialreading and mathematics programs have maintained a steady level of student participation,while diagnostic and prescriptive programs have suffered major drops in participation. Thedecreased participation may reflect real differences in service levels or perhaps uncertainty onthe part of respondents about the level of student participation.
Initially, the total enrollment counts of students by race did not agree with enrollmentby grade totals. It is likely that this discrepancy resulted from the total enrollment questionasking respondents to report as of October 1st and the race/ethnicity question failing tospecify a reporting date. Consequently, an edit to retain a consistent enrollment number andratio adjustment to the race-ethnic categories was implemented for a large number of cases.
For both public and private schools imputation rates were high for the number of parttime staff. This occurred as a result of the layout of the questionnaire, as well as thedifficulty that many small schools had in assessing "part-time" after assigning staff to full-time categories. The next cycle of the SASS will make the part-time staff counts moreprominent, including very specific instructions for what constitutes a part-time staffer, andprominent use of a "none" box. Currently, it is likely that part-time staff are under reportedand full-time staff are over-reported as a result of the respondent errors mentioned above.
Other aspects of reviewing the SASS school data can be found in "SASS Public andPrivate Schools Data File Checking".17
"U.S. Department of Education, National Center for Education Statistics, Comparisons of Public andPrivate Schools, 1987-88, E.D. Tabs, NCES 90-075, July 1990.
"'U.S. Department of Education, National Center for Education Statistics, Schools and Staffing in the UnitedStates: Selected Data for Public and Private Schools, 1990-91, E.D. Tabs, NCES 93-453, June 1993.
"Gruber, K. "SASS Public and Private Schools Data File Checking". Internal memorandum availablefrom the U.S. Department of Education, National Center for Education Statistics, (Washington, D.C.:December 14, 1992).
n

Reviewing the Quality of SASS Data 129
Table XII -4. -- Estimated number of public schools by state compared with 1990-91 Common Core of Data
State
TotalCCD
schools
SampledCCD
schools
TotalSASS
schools
SASS as apercentof CCD
50 States and D.C. 84,538 81,618 79,885 97.9%
Alabama 1,297 1,277 1,243 97.4%Alaska 498 450 425 94.5%Arizona 1,049 929 992 106.8%Arkansas 1,098 1,088 1,074 98.7%California 7,913 7,253 7,193 99.2%
Colorado 1,344 1,330 1,304 98.0%Connecticut 985 960 933 97.1%Delaware 173 161 161 100.3%District of Columbia 181 185 170 91.8%Florida 2,516 2,307 2,269 98.3%
Georgia 1,734 1,724 1,650 95.7%Hawaii 235 231 231 100.0%Idaho 582 558 545 97.7%Illinois 4,239 4,099 3,949 96.3%Indiana 1,915 1,917 1,856 96.8%
Iowa 1,588 1,608 1,530 95.1%Kansas 1,477 1,454 1,442 99.2%Kentucky 1,400 1,387 1,323 95.4%Louisiana 1,533 1,564 1,449 92.6%Maine 747 743 738 99.3%
Maryland 1,220 1,180 1,128 95.6%Massachusetts 1,842 1,790 1,775 99.2%Michigan 3,313 3,216 3,110 96.7%Minnesota 1,590 1,527 1,434 93.9%Mississippi 972 950 913 96.1%
Missouri 2,199 2,127 2,063 97.0%Montana 900 753 739 98.1%Nebraska 1,506 1,489 1,455 97.7%Nevada 354 296 313 105.7%New Hampshire 439 433 417 96.3%
New Jersey 2,272 2,237 2,224 99.4%New Mexico 681 649 626 96.4%New York 4,010 3,918 3,889 99.3%North Carolina 1,955 1,905 1,917 100.6%North Dakota 663 635 647 102.0%
151

130 1990-91 SASS Data File Users' Manual
Table XII-4.--Estimated number of public schools by state compared with 1991 Common Core of Data(continued)
State
TotalCCD
schools
SampledCCD
schools
TotalSASS
schools
SASS as apercentof CCD
Ohio 3,731 3,730 3,623 97.1%Oldahoma 1,880 1,511 1,730 114.5%Oregon 1,190 1,198 1,164 97.1%Pennsylvania 3,260 3,267 3,205 98.1%Rhode Island 309 297 294 99.0%
South Carolina 1,097 1,096 1,085 99.0%South Dakota 802 787 732 93.0%Tennessee 1,543 1,556 1,485 95.4%Texas 5,991 5,796 5,651 97.5%Utah 714 711 718 100.9%
Vermont 397 331 331 100.0%Virginia 1,811 1,765 1,737 98.4%Washington 1,936 1,826 1,772 97.1%West Virginia 1,015 1,036 1,007 97.2%Wisconsin 2,018 1,974 1,848 93.6%Wyoming 415 407 376 92.3%
SOURCES: U.S. Department of Education, National Center for Education Statistics, Schools and StaffingSurvey, 1990-91 (School Questionnaire). U.S. Department of Education, National Center for EducationStatistics, Common Core of Data Public School Universe, 1990-91.
152
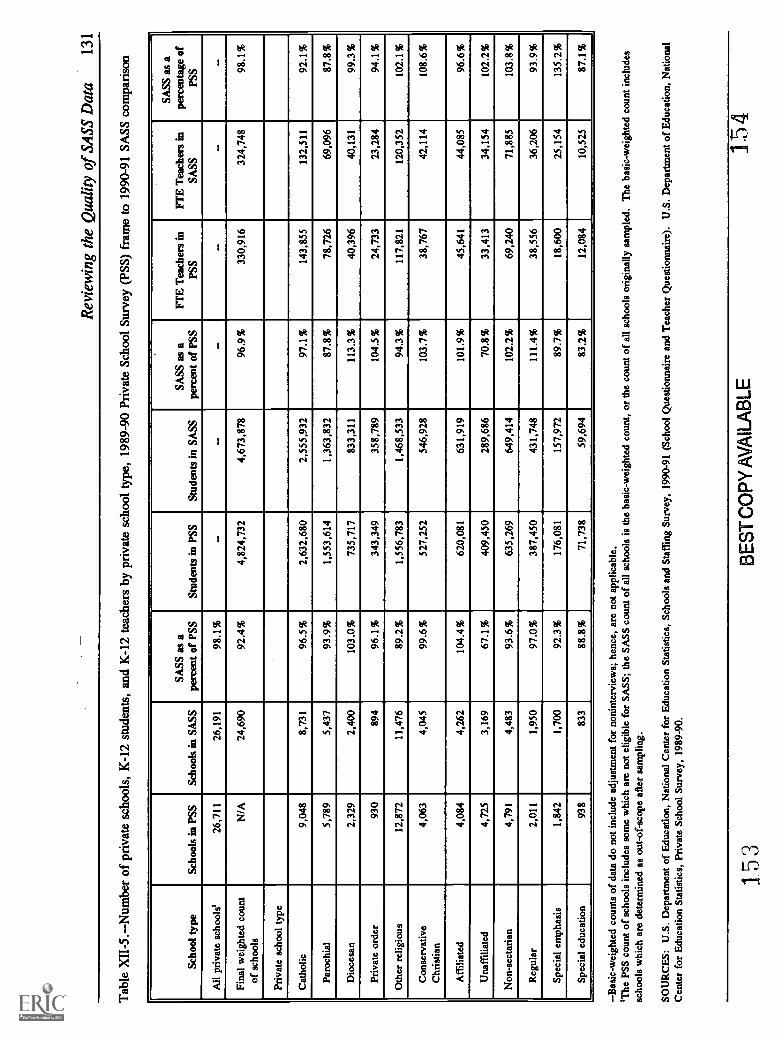
Rev
iew
ing
the
Qua
lity
of S
ASS
Dat
a13
1
Tab
le X
II-5
.--N
umbe
r of
pri
vate
sch
ools
, K-1
2 st
uden
ts, a
nd K
-12
teac
hers
by
priv
ate
scho
ol ty
pe, 1
989-
90 P
riva
te S
choo
l Sur
vey
(PSS
) fr
ame
to 1
990-
91 S
ASS
com
pari
son
Scho
ol ty
peSc
hool
s in
PSS
Scho
ols
in S
ASS
SASS
as
ape
rcen
t of
PSS
Stud
ents
in P
SSSt
uden
ts in
SA
SSSA
SS a
s a
perc
ent o
f PS
SFr
E T
each
ers
inPS
SFi
t Tea
cher
s in
SASS
SASS
as
ape
rcen
tage
of
PSS
All
priv
ate
scho
ols'
26,7
1126
,191
98.1
%-
--
--
-Fi
nal w
eigh
ted
coun
tof
sch
ools
N/A
24,6
9092
.4%
4,82
4,73
24,
673,
878
96.9
%33
0,91
632
4,74
898
.1%
Priv
ate
scho
ol ty
pe
Cat
holic
9,04
88,
731
96.5
%2,
632,
680
2,55
5,93
297
.1%
143,
855
132,
511
92.1
%
Paro
chia
l5,
789
5,43
793
.9%
1,55
3,61
41,
363,
832
87.8
%78
,726
69,0
9687
.8%
Dio
cesa
n2,
329
2,40
010
3.0%
735,
717
833,
311
113.
3%40
,396
40,1
3199
.3%
Priv
ate
orde
r93
089
496
.1%
343,
349
358,
789
104.
5%24
,733
23,2
8494
.1%
Oth
er r
elig
ious
12,8
7211
,476
89.2
%1,
556,
783
1,46
8,53
394
.3%
117,
821
120,
352
102.
1%
Con
serv
ativ
eC
hris
tian
4,06
34,
045
99.6
%52
7,25
254
6,92
810
3.7%
38,7
6742
,114
108.
6%
Aff
iliat
ed4,
084
4,26
210
4.4%
620,
081
631,
919
101.
9%45
,641
44,0
8596
.6%
Una
ffili
ated
4,72
53,
169
67.1
%40
9,45
028
9,68
670
.8%
33,4
1334
,154
102.
2%
Non
-sec
tari
an4,
791
4,48
393
.6%
635,
269
649,
414
102.
2%69
,240
71,8
8510
3.8%
Reg
ular
2,01
11,
950
97.0
%38
7,45
043
1,74
811
1.4%
38,5
5636
,206
93.9
%
Spec
ial e
mph
asis
1,84
21,
700
92.3
%17
6,08
115
7,97
289
.7%
18,6
0025
,154
135.
2%
Spec
ial e
duca
tion
938
833
88.8
%71
,738
59,6
9483
.2%
12,0
8410
,525
87.1
%
-Bas
ic-w
eigh
ted
coun
ts o
f da
ta d
o no
t inc
lude
adj
ustm
ent f
or n
onin
terv
iew
s; h
ence
, are
not
app
licab
le.
`The
PSS
cou
nt o
f sc
hool
s in
clud
es s
ome
whi
ch a
re n
ot e
ligib
le f
or S
ASS
; the
SA
SS c
ount
of
all s
choo
ls is
the
basi
c-w
eigh
ted
coun
t, or
the
coun
t of
all s
choo
ls o
rigi
nally
sam
pled
. The
bas
ic-w
eigh
ted
coun
t inc
lude
ssc
hool
s w
hich
are
det
erm
ined
as
out-
of-s
cope
aft
er s
ampl
ing.
SOU
RC
ES:
U.S
. Dep
artm
ent o
f E
duca
tion,
Nat
iona
l Cen
ter
for
Edu
catio
n St
atis
tics,
Sch
ools
and
Sta
ffin
g Su
rvey
, 199
0-91
(Sc
hool
Que
stio
nnai
re a
nd T
each
er Q
uest
ionn
aire
). U
.S. D
epar
tmen
t of
Edu
catio
n, N
atio
nal
Cen
ter
for
Edu
catio
n St
atis
tics,
Pri
vate
Sch
ool S
urve
y, 1
989-
90.
153
BE
ST
CO
PY
AV
AIL
AB
LE1:
54
132 1990-91 SASS Data File Users' Manual
D. Teacher Questionnaires (SASS-4A and 4B)
Table XII-6 shows the comparison of FIE teachers reported by CCD for 1990-91 andthe number of teachers from the SASS teacher file. Column 1 shows the number of 1-lbteachers reported on CCD, column 2 the SASS estimate, and column 3 the SASS estimate asa percent of CCD estimates.
The comparison revealed that the SASS estimate differed from the CCD estimate bymore than 20 percent for only one state (South Dakota). One state differed by 15-20 percent(Wisconsin), nine states differed by 10-15 percent (Alabama, Hawaii, Iowa, Kansas, Massa-chusetts, Montana, New Jersey, Pennsylvania, and Rhode Island), 12 states differed by 5-10percent (Arkansas, Colorado, Georgia, Illinois, Maryland, New Mexico, North Carolina,North Dakota, South Carolina, Vermont, Washington, and Wyoming), and the remaining 27states plus the District of Columbia were within 5 percent. Although estimates for severalstates were high, a comparison of 1987-88 SASS with CCD to 1990-91 SASS with CCDshows that the differences between SASS and CCD estimates have decreased.
Other aspects of reviewing the SASS teacher data can be found in "Results of DataChecking on 1991 SASS 4A/B (version 8)"."
1813obbitt, S. "Results of Data Checking on 1991 SASS 4A/B (Version 8)". Internal memorandum availablefrom the U.S. Department of Education, National Center for Education Statistics, (Washington, D.C.:December 2, 1992).
.1 5 5
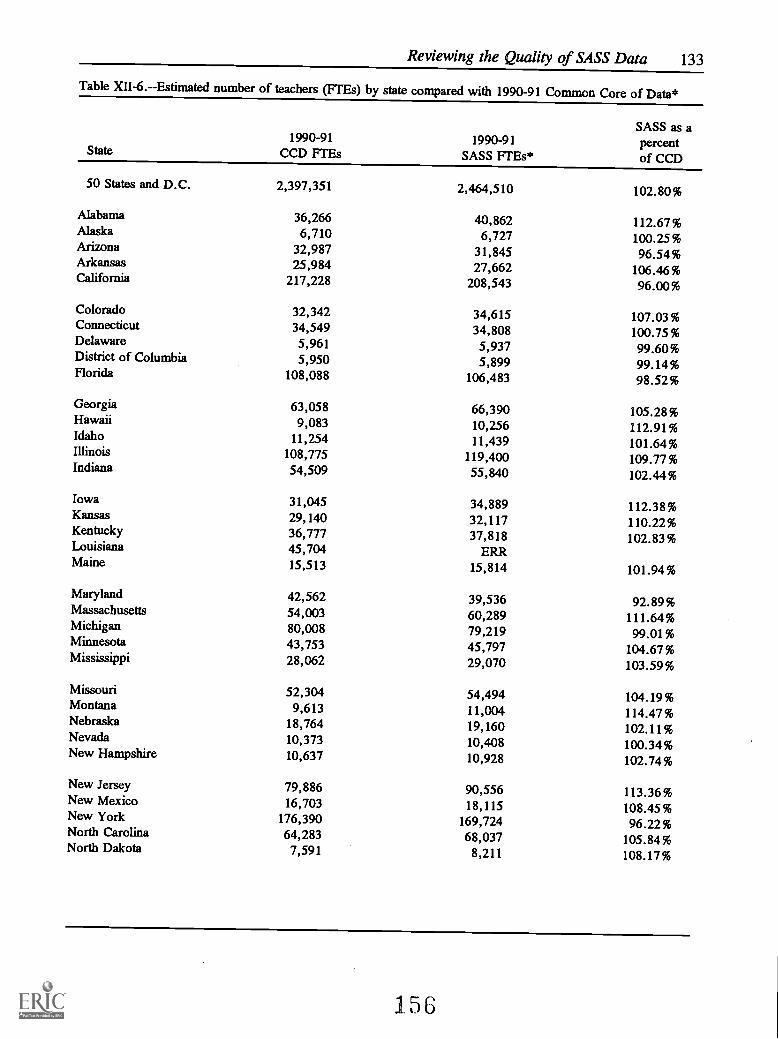
Reviewing the Quality of SASS Data 133
Table XII-6.--Estimated number of teachers (1.1Es) by state compared with 1990-91 Common Core of Data*
State1990-91
CCD FTEs1990-91
SASS FTEs*
SASS as apercentof CCD
50 States and D.C. 2,397,351 2,464,510 102.80%
Alabama 36,266 40,862 112.67%Alaska 6,710 6,727 100.25%Arizona 32,987 31,845 96.54%Arkansas 25,984 27,662 106.46%California 217,228 208,543 96.00%
Colorado 32,342 34,615 107.03%Connecticut 34,549 34,808 100.75%Delaware 5,961 5,937 99.60%District of Columbia 5,950 5,899 99.14%Florida 108,088 106,483 98.52%
Georgia 63,058 66,390 105.28%Hawaii 9,083 10,256 112.91%Idaho 11,254 11,439 101.64%Illinois 108,775 119,400 109.77%Indiana 54,509 55,840 102.44%
Iowa 31,045 34,889 112.38%Kansas 29,140 32,117 110.22%Kentucky 36,777 37,818 102.83%Louisiana 45,704 ERRMaine 15,513 15,814 101.94%
Maryland 42,562 39,536 92.89%Massachusetts 54,003 60,289 111.64%Michigan 80,008 79,219 99.01%Minnesota 43,753 45,797 104.67%Mississippi 28,062 29,070 103.59%
Missouri 52,304 54,494 104.19%Montana 9,613 11,004 114.47%Nebraska 18,764 19,160 102.11%Nevada 10,373 10,408 100.34%New Hampshire 10,637 10,928 102.74%
New Jersey 79,886 90,556 113.36%New Mexico 16,703 18,115 108.45%New York 176,390 169,724 96.22%North Carolina 64,283 68,037 105.84%North Dakota 7,591 8,211 108.17%
156
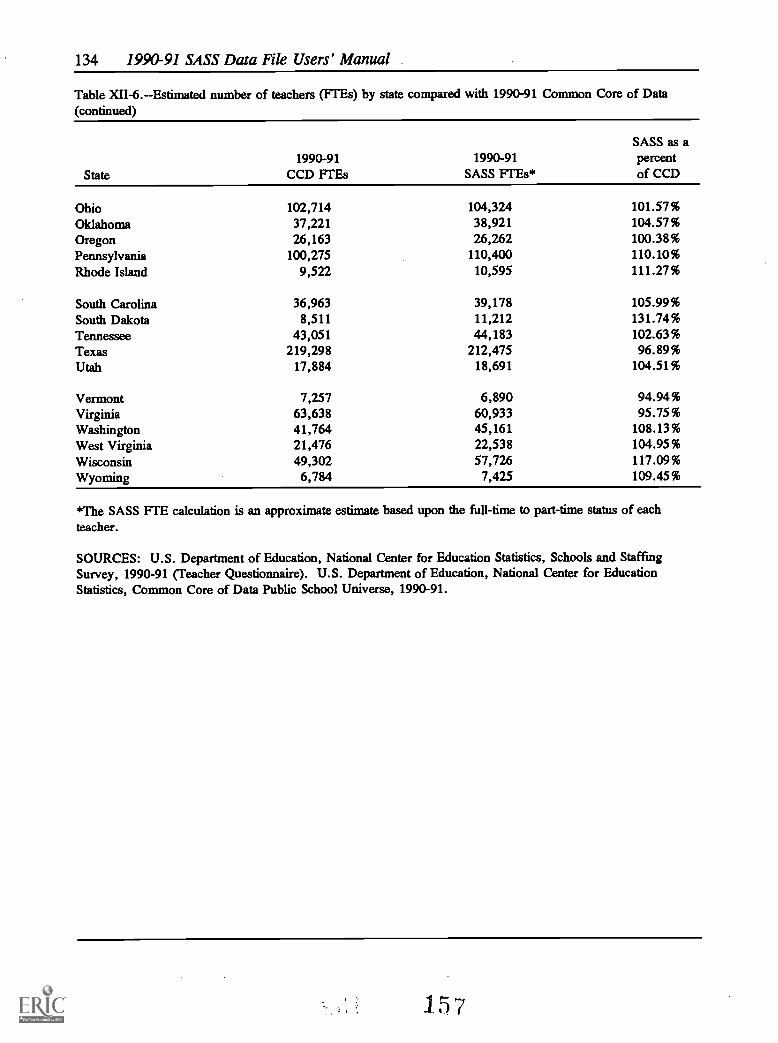
134 1990-91 SASS Data File. Users' Manual
Table XII-6.--Estimated number of teachers (F1 'Es) by state compared with 1990-91 Common Core of Data(continued)
State1990-91
CCD FrEs1990-91
SASS FTEs*
SASS as apercentof CCD
Ohio 102,714 104,324 101.57%Oklahoma 37,221 38,921 104.57%Oregon 26,163 26,262 100.38%Pennsylvania 100,275 110,400 110.10%Rhode Island 9,522 10,595 111.27%
South Carolina 36,963 39,178 105.99%South Dakota 8,511 11,212 131.74%Tennessee 43,051 44,183 102.63%Texas 219,298 212,475 96.89%Utah 17,884 18,691 104.51%
Vermont 7,257 6,890 94.94%Virginia 63,638 60,933 95.75%Washington 41,764 45,161 108.13%West Virginia 21,476 22,538 104.95%Wisconsin 49,302 57,726 117.09%Wyoming 6,784 7,425 109.45%
*The SASS FTE calculation is an approximate estimate based upon the full-time to part-time status of eachteacher.
SOURCES: U.S. Department of Education, National Center for Education Statistics, Schools and StaffingSurvey, 1990-91 (Teacher Questionnaire). U.S. Department of Education, National Center for EducationStatistics, Common Core of Data Public School Universe, 1990-91.
1.57

135
XIII. Cautions Concerning the Measurement ofChange Estimates using 1987-88 and 1990-91 SASS
153

136 1990-91 SASS Data File Users' Manual
XIII. Cautions Concerning the Measurement ofChange Estimates using 1987-88 and 1990-91 SASS
Care must be taken estimating 1987-88 to 1990-91 change in a SASS data element,because some of the measured change may not be attributable to a change in the educationsystem (like a 3% drop in enrollment). Some of the change may be due to changes in thedesign. Below are design changes in the 1990-91 SASS that might partially contribute todifficulties in measuring change.
Changing the sampling frame from QED to CCD. This is a concern becausethe definition of a school is different between the two frames. 1987-88 SASS (QED)defines a school as a physical location, while 1990-91 SASS (CCD) defines a schoolas an administrative unit with a principal. In states which have multiple administra-tive units in one physical location, the estimated number of schools could decrease.This decrease is at least partially caused from the definition difference.
It is possible to collapse the 1990-91 SASS data to the QED school as it wasdefined in the 1987-88 SASS; thereby eliminating this concern. However, theseestimates may no longer be consistent with CCD estimates.
To the extent that the coverage between CCD and QED are different, then partof the change in school related estimates can be attributable to this coverage differ-ence.
Private school sampling frame. Some differences exist between the number ofschools on the private school frames used in the 1987-88 SASS and the 1990-91SASS, and the number of schools on the respective SASS surveys. The samplingframe for private schools in the 1987-88 SASS was based on the 1986 QualityEducation Data (QED) file of private schools. The QED was supplemented with 17private school association lists and an area frame component to reflect schools missingfrom the list frame. The frame excluded both duplicate and out-of-scope schools asdetermined in a matching operation. Additional duplicate and out-of-scope schoolswere found during the SASS data collection and processing. The affect of theadditional deleted schools, as found in SASS, was that the weighted estimate ofnumber of schools from the frame was 31,848, while the weighted estimate of schoolsfrom the SASS was 26,807. In the first cycle of SASS, a rudimentary matchingoperation and the actual SASS data collection identified duplicates and out-of-scopes.
The frame for the 1990-91 SASS was the 1989-90 Private School Survey (PSS).The PSS methodology was similar to the 1987-88 SASS frame in that the QED file ofprivate schools was updated with association lists and an area frame component.Duplicates were excluded through an improved matching operation; however, thedevelopment of the PSS universe differed somewhat from the previous private schooluniverse development because all private schools were asked to update collection.This PSS operation reduced the number of schools on the frame prior to the 1990-91SASS data collection. The weighted number of schools on the 1989-90 PSS was26,712, while the weighted number of schools from the 1990-91 SASS was 24,690.
1,53

Cautions Concerning the Measurement of ChangeEstimates using 1987-88 & 1990-91 SA SS 137
In SASS, additional out-of-scope schools were identified and the design did not allowa reclassification of the out-of-scope schools in the 1989-90 PSS to an in-scope schoolin the SASS.
Adjusting the estimated number of teachers from the teacher file to the estimat-ed number of teachers from the school file. This was done to make estimates fromthe two files more consistent. Since this was not done in the 1987-88 survey, some ofthe distributional difference between the 1987-88 and 1990-91 teacher files may bepartially attributable to this adjustment. In the public 1987-88 files, the teacher countson the teacher file are smaller than the counts on the school file. In the 1990-91 files,the teacher file counts are increased to equalize the estimates between the teacher andschool files. This increase is not a change in the educational system, but a biascorrection between the files.
Missing data on the administrator and teacher files are imputed All data filesare adjusted for complete refusals. However, for the 1987-88 adminiitrator andteacher files, missing data elements within responding units are not imputed. Hence,estimates of totals use a value of zero for all missing data elements (i.e., 1987-88totals are underestimates whenever there are missing data). The 1990-91 estimates oftotals use imputed values for missing data elements. Therefore, some of the measuredchange between the 1987-88 and 1990-91 totals is inflated to correct for a bias in the1987-88 estimates. This inflation is not due to a change in the educational system.
Change estimates for ratios and averages are also inflated/deflated to correct fora possible bias in the 1987-88 estimates. However, the magnitude and direction of thebias is unknown and dependent on the variable of interest.
Questionnaire and Conceptual Differences. Care must also be observed in theinterpretation of change estimates between 1988 and 1991 since specific questions arenot always worded the same from the first SASS survey to the second. Both majorand minor changes in wording of specific items occur; the ordering of items may bedifferent and concepts can be different.
As an example, in both the 1987-88 and 1990-91 SASS, the question, "Whichbest describes the community in which the school is located?" was asked of the re-spondent to the school survey. The SASS reinterview program in both 1988 and 1991determined the responses to this item were highly subjective and exhibited moderateresponse variance. As a result of this finding, the 1990-91 SASS microdata filescontain an "urbanicity" code (LOCALE) developed by Johnson (1989)19. This code isbelieved to be a more accurate description of the community than the self-reports onSASS. This methodology assigns "type of locale codes" based on the school mailingaddress matched to Bureau of the Census data files containing population density data,Standard Metropolitan Statistical Area (SMSA) codes, and a Census code defining
°Johnson, F. (1989), Assigning Type of Locale Codes to the 1987-88 CCD Public School Universe, NationalCenter for Education Statistics Technical Report, Data Series: SP-CCD-87188-7.4, CS 89-194.

138 1990-91 SASS Data File Users' Manual
urban and rural areas. This rigorously defined locale code on the 1991 SASS files isconceptually different from the self-report of community type found on the 1987-88SASS files.
Rewording a question or moving a question to another part of the questionnairecan affect the size of the estimates. This "change" occurs because the context forresponding to the question has changed, and the question now may measure somethingdifferent than it did originally. An example of items changing between the 1987-88SASS and the 1990-91 SASS is the question about student participation in a vocation-al or technical program. In the 1987-88 SASS, the number of students participating ina vocational program was asked in a series along with student participation in variousprograms, such as in remedial reading or math programs. There was no restriction onthe students' grade levels included in the 1987-88 number of vocational programstudents. However, in the 1990-91 SASS, the vocational program participation itemwas restricted to schools with grades 10 through 12. The vocational program questionin 1990-91 is part of a sequence of items on enrollment of the school's students in theacademic, vocational, or general high school curriculum. The two estimates, from1987-88 and 1990-91, are not strictly comparable and do not measure the same groupof vocational students.
Another change in the administrator and teacher questionnaires from the 1987-88 SASS was in the layout of college major field codes. In both years, the collegemajor field codes were grouped into either Education or General majors. The 1987-88version put the General major codes at the top of the list (Administrators) or at theleft-hand side of the page (Teachers). This meant that the first major encountered fora math teacher would be "Mathematics" rather than "Mathematics education."Because more teachers (and many administrators) major in education with a special-ization in an academic field than in the general field, the order was switched in 1990-91. This has resulted in more mathematics teachers, for example, reporting a mathe-matics education major in 1990-91 than in 1987-88. Such a change could be due inlarge part to teachers noticing "Mathematics education" first, rather than "Mathemat-ics," and to a lesser extent, the real changes between two survey years.
Calculating the Standard Error for a Cross-Year Comparison. When analyzingthe change between two survey collections, such as between 1987-88 and 1990-91, thefollowing t statistic should be computed:
P1 -P2t-/ 2
Vsei *Se2
where P1 and P2 are the estimates to be compared and sel and se2 are thestandard errors for time 1 and time 2, respectively. This formula is valid only forindependent estimates.
1.61
139
XIV. Confidentiality Protection Measures
162

140 1990-91 SASS Data File Users' Manual
XIV. Confidentiality Protection Measures
The 1990-91 Schools and Staffing Survey data are released in accordance with theprovisions of the General Education Provisions Act (GEPA) [20-USC 1221e-1] and the CarlD. Perkins Vocational Education Act.
Under Public Law 100-297, the National Center for Education Statistics is responsiblefor protecting the confidentiality of individual respondents and releases data tapes forstatistical purposes only. Record matching or deductive disclosure by any user is prohibited.
To ensure that the confidentiality provisions contained in PL 100-297 have been fullyimplemented, procedures for disclosure avoidance were used in preparing public-use datatapes for release. Every effort has been made to provide the maximum research informationthat is consistent with reasonable confidentiality protections.
The data tapes are made available in an abridged form to researchers and the generalpublic. Identification elements on these public-use tapes are coded or deleted to protect theconfidentiality of survey participants. Researchers who meet a set of qualifications describedin Section B may purchase restricted-use tapes containing identification codes that facilitatelinkage between surveys for statistical research purposes.
A. Public-Use Files
The public-use data tapes include Census region and state codes. Census region isdefined in the codebooks; all region codes are based upon physical location of the school.State codes, however, were scrambled so as to prevent their use for state-level data. Thesecodes may be used to link the various datasets together though. This allows the TeacherDemand and Shortage file to be linked with the Public School, Administrator, and Teacherfiles without State identification.
The Teacher Demand and Shortage File for public schools was separated into twoparts: demand and shortage data and district policy information. The demand and shortagedata are contained on a separate tape which is unlinked and unmasked. The district policyinformation was attached to school records and, thus, allows linkage with school, principal,and teacher information.
The private school nine-category typology is based on methodological work completedat the National Center for Education Statistics. Each of the three primary divisions (Catholic,Other Religious and Non-sectarian) are subdivided into three additional groups: Catholic intoParochial, Diocesan, and Private Order; Other Religious into Conservative Christian, Affiliat-ed with a national denomination or other religious school association, and Unaffiliated; andNon-sectarian into Regular program, Special emphasis, and Special Education. This typologystarts with the three-group categorization (Catholic, Other Religious, and Nonsectarian), andfurther subdivides each group into three additional groups. Catholic school types includeParochial, Diocesan, and Private types; Other Religious schools include those affiliated with aConservative Christian school association, those affiliated with national denomination or other
163

Confidentiality Protection Measures 141
religious school association, and those that are Unaffiliated; Nonsectarian school typesinclude Regular programs, Special emphasis, and Special education. Information on therationale for the development of the typology can be found in the technical report entitledDiversity of Private Schools." Original affiliation identifiers were removed and each schoolwas recoded according to the typology.
On the School, Administrator, and Teacher files, continuous variables that wouldpermit disclosure of school, teacher, or administrator identity have been collapsed intocategories and top- and bottom-coded. On the School file, for example, enrollment, numberof teachers, community type, percent minority enrollment, and school level were coded. Onthe Administrator and Teacher files, income and age were coded.
Some categorical variables that were a disclosure problem have been recoded into newcategories. The new categories are defined for the appropriate source codes on the taperecord layouts. A few items have been deleted from the files altogether because of disclosureproblems. For example, the school names and addresses have been deleted from the file toprotect the identity of individual schools.
B. Restricted-Use Files
As discussed in the previous section, some elements on the public-use tapes are codedor deleted to protect the confidentiality of individual administrators or teachers. School,administrator, and teacher files may be linked within SASS but individuals data such asspecific salary or race are not on the public-use file. Researchers who can demonstrate aneed for more detailed information may request access to restricted-use tapes containingidentification codes that facilitate linkage between surveys for statistical research purposes.
Researchers requesting access to the restricted-use tapes must obtain a license to usethese data by providing the following information:
The title of the survey(s) to which access is desired.
A detailed discussion of the statistical research project which necessitatesaccessing the NCES survey.
The name and title of the most senior official having the authority to bind theorganization to the provisions of the license agreement.
The name and title of the principal project officer who will oversee the dailyoperations.
2°McMillen, M. and Benson P. (1991), Diversity of Private Schools, National Center for EducationStatistics, Office of Educational Research and Improvement, U.S. Department of Education, Washington, DC,Technical Report (NCES 92-082).
164

142 1990-91 SASS Data File Users' Manual
The number, names(s), and title(s) of professional and technical staff who willbe accessing the survey data base.
The estimated loan period necessary for accessing the NCES survey data base.
6 The desired computer media format and conversion (e.g., 9-track tape, CDROM and ASCII, EBCDIC).
Return all of the above information to:
Associate Commissioner for StatisticalStandards and MethodologyNCES/OERIU.S. Department of Education555 New Jersey Avenue, NWWashington, DC 20208
After reviewing the information, the Associate Commissioner for Statistical Standardsand Methodology will inform the requester whether a license to use the restricted data isapproved.
Researchers and/or institutions that violate the agreement are subject to a fine of notmore than $250,000 (under 18 U.S.C. 3559 and 3571) or imprisonment for not more thanfive years, or both.
C. File Linkage
When each school was selected for the Public and Private School Survey samples, itsprincipal was also selected for the Administrator Survey and a sample of teachers at thatschool was selected for the Teacher Survey. For public schools, the school district, or localeducation agency (LEA), with jurisdiction over the sample school was selected for theTeacher Demand and Shortage Survey.
Each school can be linked to the records for its principal and sample teachers by thefirst ten digits of the variable CNTL_NUM (control number). However, the records forschool districts on the Teacher Demand and Shortage Survey file cannot be linked to thepublic schools, administrators, or teachers because the variable CNTL_NUM has beenchanged to protect the confidentiality of individual schools, principals, and teachers.
Treatment of BIA Schools
Data on BIA schools, principals, and teachers were not included on the public usetape because the risk of identifying an individual school was too high (there were 101 schoolssampled out of a universe of 150 schools). Instead, the data are released on a separate
Confidentiality Protection Measures 143
restricted-use tape. This tape can be merged with the other restricted-use tape by licensedusers for analysis purposes, if desired.
166
145
XV. Created Variabes
I 7

146 1990-91 SASS Data File Users' Manual
XV. Created Variables
A. Variables Added to the Datafile
Several analysis variables were added to the restricted-use datafiles and public-usedatafiles (unless otherwise noted) for data users' convenience:
1. School level (SCHLEVEL) - Administrator and School files
School level is defined as elementary, secondary, or combined, where a combinedschool has some elementary and also some secondary grades. There was a school level var-iable asked on the questionnaire, but school respondents classify their schools in different waysfor the middle grades. Therefore, the following definition of school level was used todetermine a consistent school level, and replaces the self-assigned school level:
1. Elementary if the school has only grades below 8th grade;2. Secondary if the school has grades between 7th and 12th;3. Combined if the school has any other combination of grades.
Two examples of a combined school level are 4-8 and 5-12. Secondary schools canhave any combination of grades between 7th and 12th grade.
2. Type of private school (TYPOLOGY) - Administrator and School files
There is a wide diversity among private schools, between types of religiously-orientedschools, non-sectarian and special-purpose schools. NCES has adopted a nine-level groupingof private schools, developed by McMillen and Benson (1991)21:
1. Catholic, Parochial2. Catholic, Diocesan3. Catholic, Private order4. Other religious, Conservative Christian5. Other religious, denomination-affiliated6. Other religious, unaffiliated7. Non-sectarian, regular program8. Non-sectarian, special emphasis program9. Non-sectarian, special education program
3. 3-Level Affiliation (AFFIL) - Administrator and School files
These nine levels are also consolidated into the three major affiliation categoriestraditionally reported by NCES: Catholic, other Religious, and Non-sectarian. Typology levels
2tMcMillen, Marilyn M. and Peter F. Benson. (1991). Diversity of Private Schools. NCES TechnicalReport 92-082. Washington: Office of Educational Research and Improvement.
1 f'cg
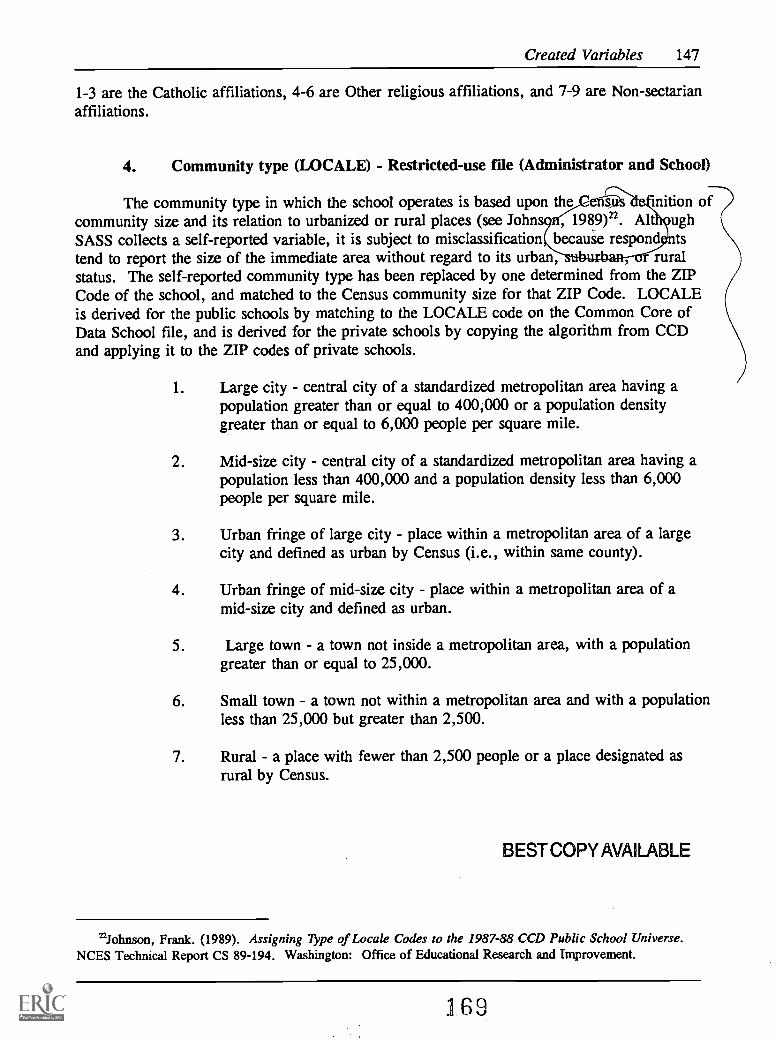
Created Variables 147
1-3 are the Catholic affiliations, 4-6 are Other religious affiliations, and 7-9 are Non-sectarianaffiliations.
4. Community type (LOCALE) - Restricted-use file (Administrator and School)
The community type in which the school operates is based upon the s inition ofcommunity size and its relation to urbanized or rural places (see Johns , 1989)22. Alt ughSASS collects a self-reported variable, it is subject to misclassification becauie respond istend to report the size of the immediate area without regard to its urban, : ruralstatus. The self-reported community type has been replaced by one determined from the ZIPCode of the school, and matched to the Census community size for that ZIP Code. LOCALEis derived for the public schools by matching to the LOCALE code on the Common Core ofData School file, and is derived for the private schools by copying the algorithm from CCDand applying it to the ZIP codes of private schools.
1. Large city central city of a standardized metropolitan area having apopulation greater than or equal to 400,000 or a population densitygreater than or equal to 6,000 people per square mile.
2. Mid-size city central city of a standardized metropolitan area having apopulation less than 400,000 and a population density less than 6,000people per square mile.
3. Urban fringe of large city - place within a metropolitan area of a largecity and defined as urban by Census (i.e., within same county).
4. Urban fringe of mid-size city - place within a metropolitan area of amid-size city and defined as urban.
5. Large town a town not inside a metropolitan area, with a populationgreater than or equal to 25,000.
6. Small town a town not within a metropolitan area and with a populationless than 25,000 but greater than 2,500.
7. Rural a place with fewer than 2,500 people or a place designated asrural by Census.
BEST COPY AVAILABLE
Johnson, Frank. (1989). Assigning Type of Locale Codes to the 1987-88 CCD Public School Universe.NCES Technical Report CS 89-194. Washington: Office of Educational Research and Improvement.
169
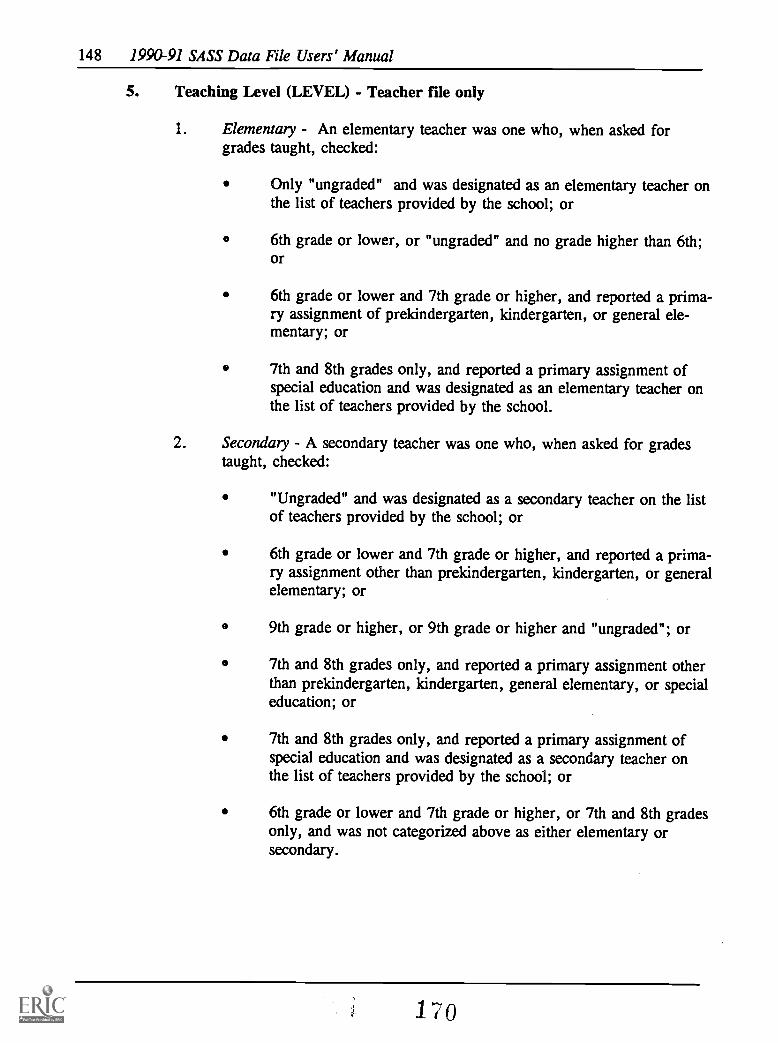
148 1990-91 SASS Data File Users' Manual
5. Teaching Level (LEVEL) - Teacher file only
1. Elementary - An elementary teacher was one who, when asked forgrades taught, checked:
Only "ungraded" and was designated as an elementary teacher onthe list of teachers provided by the school; or
6th grade or lower, or "ungraded" and no grade higher than 6th;or
6th grade or lower and 7th grade or higher, and reported a prima-ry assignment of prekindergarten, kindergarten, or general ele-mentary; or
7th and 8th grades only, and reported a primary assignment ofspecial education and was designated as an elementary teacher onthe list of teachers provided by the school.
2. Secondary A secondary teacher was one who, when asked for gradestaught, checked:
"Ungraded" and was designated as a secondary teacher on the listof teachers provided by the school; or
6th grade or lower and 7th grade or higher, and reported a prima-ry assignment other than prekindergarten, kindergarten, or generalelementary; or
9th grade or higher, or 9th grade or higher and "ungraded"; or
7th and 8th grades only, and reported a primary assignment otherthan prekindergarten, kindergarten, general elementary, or specialeducation; or
7th and 8th grades only, and reported a primary assignment ofspecial education and was designated as a secondary teacher onthe list of teachers provided by the school; or
6th grade or lower and 7th grade or higher, or 7th and 8th gradesonly, and was not categorized above as either elementary orsecondary.

Created Variables 149
6. Urbanicity Codes for School Districts - Restricted-use file (School)
As LOCALE codes have not been developed for districts, several other geographicidentifiers are included on the restricted-use file only for research purposes. These identifiersare:
a. State and County FIPS code (STCNTY) - The standardized FIPS codefor a county, combined with the FIPS code for the State. This five-digit code can belooked up in the FIPS publication cited in the User's Notes (see Section XVI).
b. CMSA code (CMSA) - This four-digit code identifies the specificmetropolitan statistical area as defined by OMB and can also be looked up in anotherFIPS guide. MSAs are areas with at least 50,000 people or with more than one citywith population totaling at least 50,000. There is no code for non-MSA districts.
c. Metropolitan status code (MSC8assigned to every di ye to its-
This is a categorical variable,litan sta
1. Urban area, primarily inside central city;2. Urban area, primarily outside central city;3. Non-urban area.
This variable is-on the Common Core of Data file an ed by NCES.
7. Percent minority (PMINENR) - Administrator and School files
This variable is computed from the SASS student race/ethnicity counts. The sum ofstudents of all racial/ethnic groups other than White is calculated as a percentage of students ofall race/ethnicity groups, and categorized as follows:
1. Less than 20 percent.2. 20 percent or greater.
B. Analysis Variables Used in NCES Publications
1. School size - Public-use school file
This variable is a categorization of the total enrollment for a school:
1. Less than 150 students;2. Between 150 and 500 students;3. From 500 to 750 students;4. 750 students or greater.
BEST COPY AVAILARI F
BEST COPY AVAILABLE
171
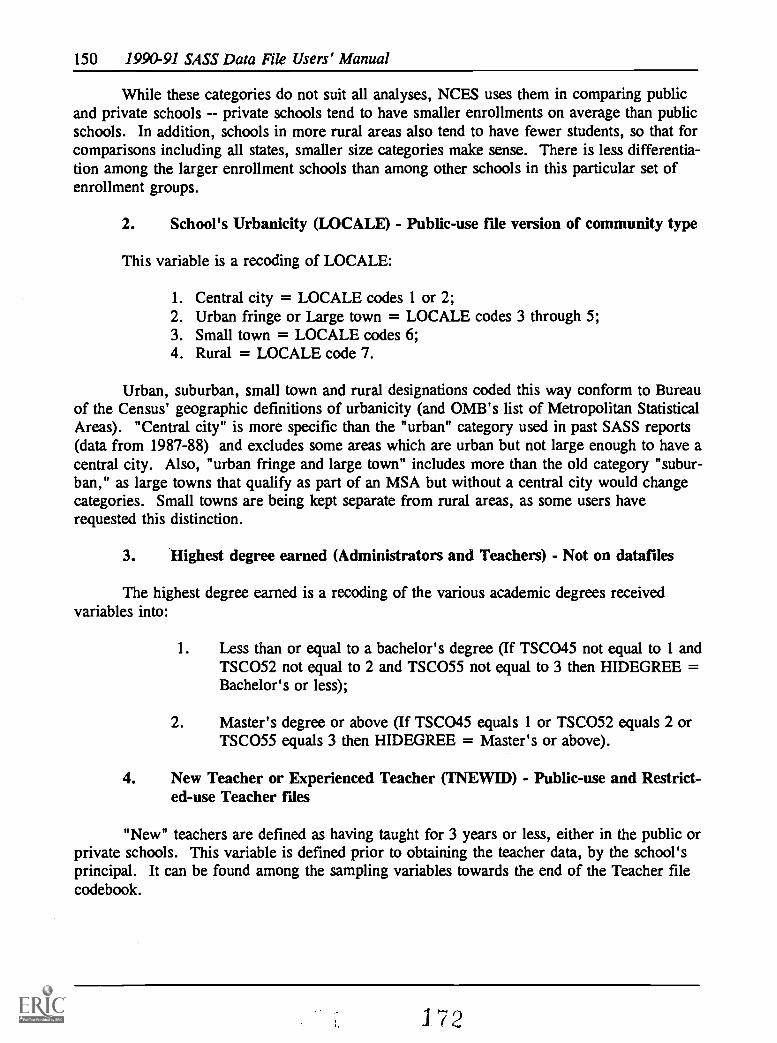
150 1990-91 SASS Data File Users' Manual
While these categories do not suit all analyses, NCES uses them in comparing publicand private schools private schools tend to have smaller enrollments on average than publicschools. In addition, schools in more rural areas also tend to have fewer students, so that forcomparisons including all states, smaller size categories make sense. There is less differentia-tion among the larger enrollment schools than among other schools in this particular set ofenrollment groups.
2. School's Urbanicity (LOCALE) - Public-use file version of community type
This variable is a recoding of LOCALE:
1. Central city = LOCALE codes 1 or 2;2. Urban fringe or Large town = LOCALE codes 3 through 5;3. Small town = LOCALE codes 6;4. Rural = LOCALE code 7.
Urban, suburban, small town and rural designations coded this way conform to Bureauof the Census' geographic definitions of urbanicity (and OMB's list of Metropolitan StatisticalAreas). "Central city" is more specific than the "urban" category used in past SASS reports(data from 1987-88) and excludes some areas which are urban but not large enough to have acentral city. Also, "urban fringe and large town" includes more than the old category "subur-ban," as large towns that qualify as part of an MSA but without a central city would changecategories. Small towns are being kept separate from rural areas, as some users haverequested this distinction.
3. Highest degree earned (Administrators and Teachers) - Not on datafiles
The highest degree earned is a recoding of the various academic degrees receivedvariables into:
1. Less than or equal to a bachelor's degree (If TSCO45 not equal to 1 andTSCO52 not equal to 2 and TSCO55 not equal to 3 then HIDEGREE =Bachelor's or less);
2. Master's degree or above (If TSCO45 equals 1 or TSCO52 equals 2 orTSCO55 equals 3 then HIDEGREE = Master's or above).
4. New Teacher or Experienced Teacher (TNEVVID) - Public-use and Restrict-ed-use Teacher files
"New" teachers are defined as having taught for 3 years or less, either in the public orprivate schools. This variable is defined prior to obtaining the teacher data, by the school'sprincipal. It can be found among the sampling variables towards the end of the Teacher filecodebook.
1.72

151
XVI. User Notes
173

152 1990-91 SASS Data File Users' Manual
XVI. User Notes
Subsetting a file
Each component within SASS is a distinct record on the datafile: districts, publicadministrators, private administrators, public schools, private schools, public teachers, andprivate teachers. The codebooks for each component cover both the public and private records;in addition, on the restricted-use school file and to a lesser extent, on the public-use file, thedistrict records are combined with the school records. In order to do an analysis on any onecomponent without extraneous "noise" from other components, the programmer or researcherhas to subset the file by the variable SURVEY.
FIPS codes
FIPS stands for Federal Information Processing Standards. FIPS publications areproduced by the U.S. Department of Commerce's National Institute of Standards and Technolo-gy (NIST). These codes standardize numeric codes for geographic areas. The detailed namesof counties and corresponding codes are published in FIPS Publication 6-4, "Counties andEquivalent Entities of the United States, Its Possessions, and Associated Areas," while thenames and codes for Metropolitan Statistical Areas are contained in FIPS Publication 8-5,"Metropolitan Statistical Areas (including CMSAs, PMSAs, and NECMAs)." Copies of FIPSPublications 6-4 and 8-5 are available for sale by the National Technical Information Service(NTIS), U.S. Department of Commerce, Springfield, VA. Write or call the NTIS ComputerProducts Office at 703/487-4650 for cost and ordering information. When ordering, refer toFederal Information Processing Standards Publication 6-4(FIPSPUB6-4) or Federal Information Processing Standards Publication 8-5 (FIPSPUB8-5) andits title.
Calculation of Average Years of Teaching Experience
Items 10 and 11 on the Teacher Questionnaire ask about the years of full- and part-timeteaching experience that the teacher has in both public and private schools. Public schoolteachers are skipped out of the questions on private school experience if they've never taught inprivate schools. similarly, private school teachers are skipped out of the questions on publicschool experience if they've never taught in public schools. As a result of this skip pattern,public school teachers who have never taught in private schools will have a value of "missing"on the file for the variables FTPVT and PTPVT; private school teachers who have never taughtin public schools will have a value of "missing" on the file for the variables FTPUB andPTPUB.
To calculate the average number of years that all public school teachers have taught inprivate schools, or the average number of years that all private school teachers have taught inpublic schools, you should recode these missing values to zeros. Otherwise, the average thatyou calculate will reflect the average number of years that public school teachers have taughtin private schools only for those public school teachers who have ever taught in private
174

User Notes 153
schools, or the average number of years that private school teachers have taught in publicschools only for those private school teachers who have ever taught in pubic schools.
This recoding will not be necessary if you are interested in the total years of teachingexperience in both sectors because the missing values will be treated as zeroes in the sum(FTPUB + FTPVT) or (PTPUB + PTPVT) or (FTPUB + PTPUB + FTPVT + PTPVT).
175
APPENDICES
176
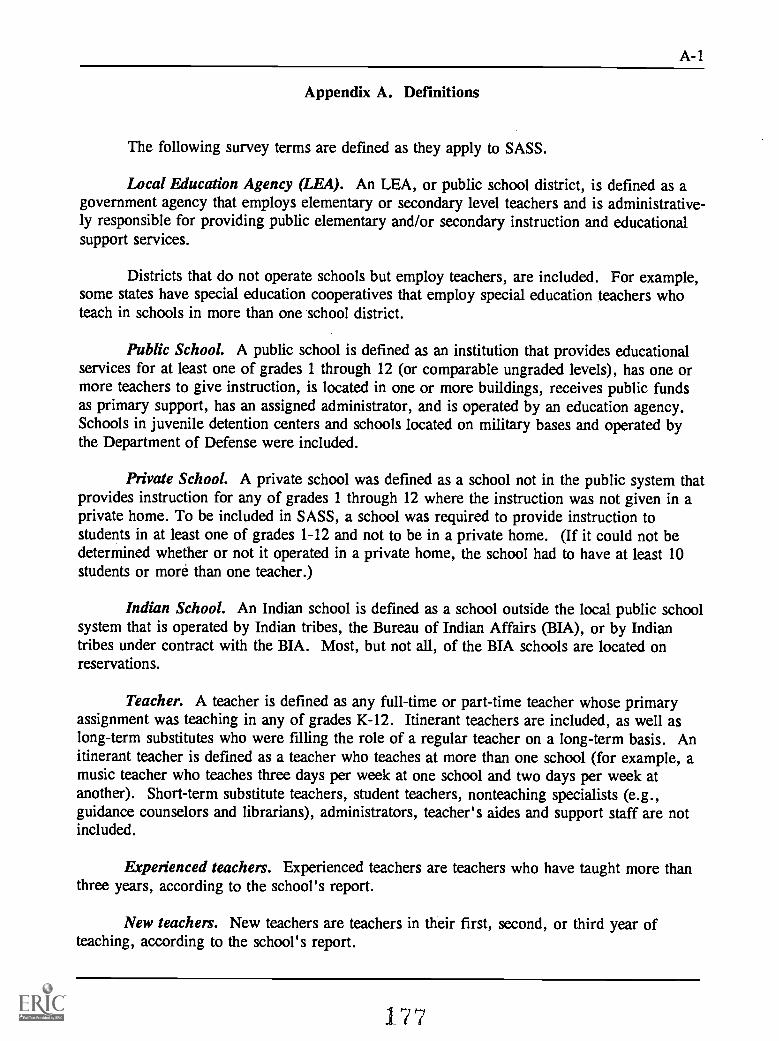
A-1
Appendix A. Definitions
The following survey terms are defined as they apply to SASS.
Local Education Agency (LEA). An LEA, or public school district, is defined as agovernment agency that employs elementary or secondary level teachers and is administrative-ly responsible for providing public elementary and/or secondary instruction and educationalsupport services.
Districts that do not operate schools but employ teachers, are included. For example,some states have special education cooperatives that employ special education teachers whoteach in schools in more than one school district.
Public School. A public school is defined as an institution that provides educationalservices for at least one of grades 1 through 12 (or comparable ungraded levels), has one ormore teachers to give instruction, is located in one or more buildings, receives public fundsas primary support, has an assigned administrator, and is operated by an education agency.Schools in juvenile detention centers and schools located on military bases and operated bythe Department of Defense were included.
Private School. A private school was defined as a school not in the public system thatprovides instruction for any of grades 1 through 12 where the instruction was not given in aprivate home. To be included in SASS, a school was required to provide instruction tostudents in at least one of grades 1-12 and not to be in a private home. (If it could not bedetermined whether or not it operated in a private home, the school had to have at least 10students or more than one teacher.)
Indian School. An Indian school is defined as a school outside the local public schoolsystem that is operated by Indian tribes, the Bureau of Indian Affairs (BIA), or by Indiantribes under contract with the BIA. Most, but not all, of the BIA schools are located onreservations.
Teacher. A teacher is defined as any full-time or part-time teacher whose primaryassignment was teaching in any of grades K-12. Itinerant teachers are included, as well aslong-term substitutes who were filling the role of a regular teacher on a long-term basis. Anitinerant teacher is defined as a teacher who teaches at more than one school (for example, amusic teacher who teaches three days per week at one school and two days per week atanother). Short-term substitute teachers, student teachers, nonteaching specialists (e.g.,guidance counselors and librarians), administrators, teacher's aides and support staff are notincluded.
Experienced teachers. Experienced teachers are teachers who have taught more thanthree years, according to the school's report.
New teachers. New teachers are teachers in their first, second, or third year ofteaching, according to the school's report.
177

A-2 1990-91 SASS Data File Users' Manual
Elementary School. A school is defined as elementary if it has no grade higher thaneight and at least one of grades 1-6. For example, schools with grades K-6, 1-3, or 6-8 areclassified as elementary schools.
Secondary School. A school is defined as secondary if it has no grade less than sevenand at least one of grades 7-12. For example, schools with grades 9-12, 7-8, 10-12, or 7-9are classified as secondary schools.
Combined School. A school is defined as combined if it has at least one grade of sixor below and at least one grade of nine or above. For example, schools with grades K-12,6-12, 6-9, or 1-12 are classified as combined schools. Schools in which students areungraded (i.e., not classified by standard grade levels) are also classified as combined.
Special Education School. Special education schools focus primarily on directinstructional activities required to educate students with mental handicaps, such as mentalretardation; physical handicaps, such as hearing- and speech-impairment, and learningdisabilities, such as dyslexia.
Vocational Education School. Vocational schools are schools which primarily servestudents who are being trained for semi-skilled or technical occupations.
Alternative Education School. Alternative education schools are schools that addressneeds of students that typically cannot be met in a regular school. They providenontraditional education, and may serve as an adjunct to a regular school. They fall outsideof the categories of regular, special education, and vocational education.
Native American schools. In order to improve estimates of the Native American(American Indian, Aleut, or Eskimo) student population, the sample of public schools wasdivided into two strata: Native American schools and all other schools. The Native Americanschool stratum contained all public schools with a population of at least 25% AmericanIndian, Aleut, or Eskimo students, based upon the school's Common Core of Data report in
1988-89.
QED school. Quality Education Data is a privately collected database of all publicand private schools in the United States. QED defines a school as a physical building,regardless of the administrative structure of the school or schools within a single building perschool. This differs from the CCD definition of a school as a single administrative unit,regardless of how many school buildings are occupied.
FIPS. FIPS stands for Federal Information Processing Standards and refers to avariety of codes for standardized reference. FIPS county and state codes are codes developedby the National Institute for Standards and Technology (NIST) as numeric identifiers for eachcounty and State in the United States; state codes are listed in the codebooks, while thecounty codes may be looked up in NIST publications. See the User's Notes section forfurther information.
178

Appendix A A-3
Full-Time Equivalent. Full-Time Equivalent (FTE) describes the number of teachingpositions in terms of an average full-time position. The FTE calculation for an individualteacher is a factor applied to the teacher's weight based upon the teacher's full-time or part-time status as reported in item 2: a full-time teacher is weighted as 1.0 position, 3/4 but lessthan full-time is weighted as .875 position, half-time but less than 3/4 time is weighted as.625 position, less than half-time but greater than 1/4 time is weighted as .375 position, andless than 1/4 time is weighted as .125 position.
Imputed Data. Imputed data refers to data obtained within the same record or alteredto be consistent with other data within the same record.
Donor-based imputation. Donor-based imputation refers to selecting data for an itemfrom a respondent with similar characteristics (i.e., a hot-deck matched donor).
Elementary school teacher. Teachers were classified as elementary or secondary onthe basis of the grades they taught rather than the schools in which they taught. Anelementary school teacher was one who, when asked for the grades taught, checked:
Only "ungraded" and was designated as an elementary teacher on the list ofteachers provided by the school; or
6th grade or lower, or "ungraded" and no grade higher than the 6th; or
6th grade or lower and 7th grade or higher, and reported a primary assignmentof prekindergarten, kindergarten, or general elementary; or
7th and 8th grades only, and reported a primary assignment of prekindergarten,kindergarten, or general elementary; or
6th grade or lower and 7th grade or higher, and reported a primary assignmentof special education and was designated as an elementary teacher on the list ofteachers provided by the school; or
7th and 8th grades only, and reported a primary assignment of specialeducation and was designated as an elementary teacher on the list of teachersprovided by the school.
Secondary school teacher. Teachers were classified as elementary or secondary on thebasis of the grades they taught rather than the schools in which they taught. A secondaryschool teacher was one who, when asked for the grades taught, checked:
"Ungraded" and was designated as a secondary teacher on the list of teachersprovided by the school; or
6th grade or lower and 7th grade or higher, and reported a primary assignmentother than prekindergarten, kindergarten, or general elementary; or
179

A-4 1990-91 SASS Data File Users' Manual
9th grade or higher, or 9th grade or higher and "ungraded"; or
7th and 8th grades only, and reported a primary assignment other thanprekindergarten, kindergarten, general elementary, or special education; or
7th and 8th grades only, and reported a primary assignment of specialeducation and was designated as a secondary teacher on the list of teachersprovided by the school; or
6th grade or lower and 7th grade or higher, or 7th and 8th grades only, andwas not categorized above as either elementary or secondary.
Private school typology. Private schools were assigned to one of three majorcategories, and within each major category, one of three subcategories. The categories andsubcategories are:
1) Catholic - parochial, diocesan, and private order; 2) other religious - affiliated withthe Conservative Christian School Association, affiliated with a national denomination,and unaffiliated; and 3) nonsectarian - regular, special program emphasis, and specialeducation.'
Census Region.
Northeast contains these states:
Maine, New Hampshire, Vermont, Massachusetts, Rhode Island, Con-necticut, New York, New Jersey, Pennsylvania
Midwest contains these states:
Ohio, Indiana, Illinois, Michigan, Wisconsin, Minnesota, Iowa,Missouri, North Dakota, South Dakota, Nebraska, Kansas
South contains these states:
Delaware, Maryland, District of Columbia, Virginia, West Virginia,North Carolina, South Carolina, Georgia, Florida, Kentucky, Tennessee,Alabama, Mississippi, Arkansas, Louisiana, Oklahoma, Texas
West contains these states:
Montana, Idaho, Wyoming, Colorado, New Mexico, Arizona, Utah,Nevada, Washington, Oregon, California, Alaska, Hawaii
'See M. McMillen and P. Benson, Diversity of Private Schools, Technical Report, NCES 92-082(Washington, D.C.: U.S. Department of Education, National Center for Education Statistics, 1991).
160

B-1
Appendix B. Crosswalk between items in the 1987-88 and 1990-91 SASS
NOTE: If there is a blank in the variable name for 1990-91, that particular item was not asked in 1990-91.
Teacher Demand and Shortage Questionnaire for Public School Districts (SASS 1A)
1987-88 1990-91 1990-91Variable name Variable name Source code
DSCO11 EMPLYTCH 011DSC012 LASTPK 015DSC013 NOWPK 014DSC014 LASTKG 017DSC015 NOWKG 016DSC016 LAST1_6 019DSC017 NOW1_6 018DSC018 LAST7 12 021DSC019 NOW7 12 020DSCO20DSCO21DSCO22 TPKLAST 034DSCO23 TPKNOW 033DSCO24 TKGLAST 036DSCO25 TKGNOW 035DSCO26 T1 6LAST 038DSCO27 T1 6NOW 037DSCO28 T7 12LST 040DSCO29 T7 12NOW 039DSC030 'TTOTLAST 044DSC031 TTOTNOW 043DSC032DSC033DSC034DSC035DSC036DSC037DSC038DSC039DSC040DSC041DSC042DSC043DSC044DSC045DSC046DSC047 TTOTK_12 045DSC048 VACANCY 047DSC049 ABOLISHD 048DSC050DSC051 APPROVED 049DSC052 CERTIFY 046DSC053 NEWHIRES 050DSC054 NEWCERTS 051DSC055
81

B-2 1990-91 SASS Data File Users' Manual
Teacher Demand and Shortage Questionnaire for Public School Districts (SASS 1A)
1987-88 1990-91 1990-91Variable name Variable name Source code
DSC056DSC057DSC058DSC059DSC060DSC061DSC062DSC063DSC064DSC065DSC066DSC067DSC068DSC069DSC070 MEDICAL 059DSC071 DENTAL 060DSC072 LIFE 061DSC073 PENSION 062DSC074 HOUSING 063DSC075 MEALS 064DSC076 TRANSPT 065DS C078 TUITION 066DSC079DSC080DSC081 LNGTHYR 068DSC082DSC083 MINMASTR 071DSC084 MAXMASTR 072DSC085DSC086 MERITPAY 076DSC087 MERITCS 077DSC088 MERITSTP 078DSC089 MERITINC 079DSC090 INCENTIV and SHORTAGE 080 and 084DSC091 INCNTCSH 081DSC092 INCNTSTP 082DSC093 INCNTINC 083DSC094DSC095 SHORTCSH 085DSC096 SHORTSTP 086DSC097 SHORTINC 087DSC098DSC099 SHRTSPEC 088DSC100 SHRTMATH 089DSC101 SHRTCOMP 090DSC102 SHRTPHYS 091DSC103 SHRTBIO 092DSC104 SHRTESOL 093DSC105 SHRTLANG 094DSC106 SHRTOTHR 096
182
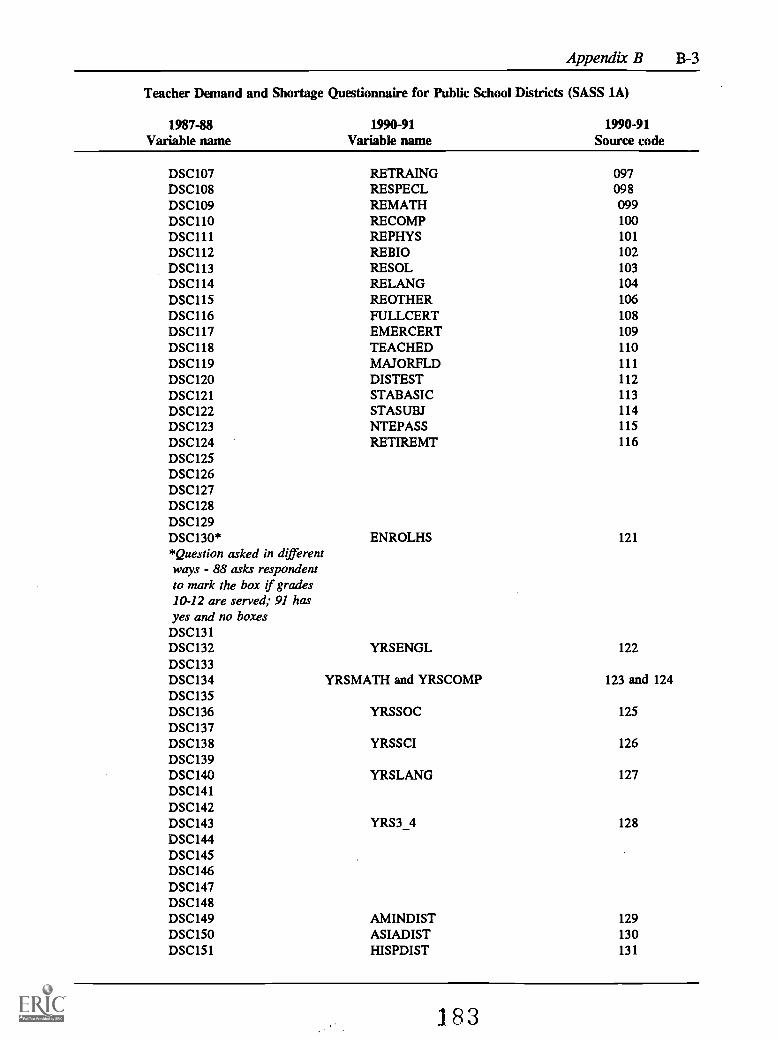
Appendix B B-3
Teacher Demand and Shortage Questionnaire for Public School Districts (SASS 1A)
1987-88 1990-91 1990-91Variable name Variable name Source code
DSC107 RETRAING 097DSC108 RESPECL 098DSC109 REMATH 099DSC110 RECOMP 100DSC111 REPHYS 101DSC112 REBIO 102DSC113 RESOL 103DSC114 RELANG 104DSC115 REOTHER 106DSC116 FULLCERT 108DSC117 EMERCERT 109DSC118 TEACHED 110DSC119 MAJORFLD 111DSC120 DISTEST 112DSC121 STABASIC 113DSC122 STASUBJ 114DSC123 NTEPASS 115DSC124 RETIREMT 116DSC125DSC126DSC127DSC128DSC129DSC130* ENROLHS 121*Question asked in differentways - 88 asks respondentto mark the box if grades10-12 are served; 91 hasyes and no boxesDSC131DSC132 YRSENGL 122DSC133DSC134 YRSMATH and YRSCOMP 123 and 124DSC135DSC136 YRSSOC 125DSC137DSC138 YRSSCI 126DSC139DSC140 YRSLANG 127DSC141DSC142DSC143 YRS3_4 128DSC144DSC145DSC146DSC147DSC148DSC149 AMINDIST 129DSC150 ASIADIST 130DSC151 HISPDIST 131
183

B-4 1990-91 SASS Data File Users' Manual
Teacher Demand and Shortage Questionnaire for Public School Districts (SASS 1A)
1987-88 1990-91 1990-91Variable name Variable name Source code
DSC152 BLKDIST 132DSC153 WHTDIST 133DSC154 TCHAMIND 134DSC155 TCHASIAN 135DSC156 TCHISPNC 136DSC157 TCHBLACK 137DSC158 TCHWHITE 138
DSC159
184

Appendix B B-5
NOTE: If there is a blank in the variable name for 1990-91, that particular item was not asked in 1990-91.
Teacher Demand and Shortage Questionnaire for Private Schools (SASS 1B)
TDS Form Private School Form1987-88 1990-91 1990-91
Variable name Variable name Source code
DSC011DSC012DSC013 NUMBRPK 019DSC014DSC015 NUMBRKG 021DSC016DSC017DSC018DSC019DSCO20DSCO21DSCO22 TPKLAST 168DSCO23 TPKNOW 167DSCO24 TKGLAST 170DSCO25 TKGNOW 169DSCO26 T1_6LAST 172DSCO27 T1_6NOW 171DSCO28 T7_12LST 174DSCO29 T7_12NOW 173DSC030 TTOTLAST 178DSC031 TTOTNOW 177DSC032DSC033DSC034DSC035DSC036DSC037DSC038DSC039DSC040DSC041DSC042DSC043DSC044DSC045DSC046DSC047 TTOTK_12 179DSC048 VACANCY 181DSC049 ABOLISHD 182DSC050DSC051 FULTEACH 209DSC052DSC053 NEWHIRES 184DSC054 NEWCERTS 185DSC055DSC056DSC057
.1

B-6 1990-91 SASS Data File Users' Manual
Teacher Demand and Shortage Questionnaire for Private Schools (SASS 1B)
TDS Form Private School Form1987-88 1990-91 1990-91
Variable name Variable name Source code
DSC058DSC059DSC060DSC061DSC062DSC063DSC064DSC065DSC066DSC067DSC068DSC069DSC070 MEDICAL 307DSC071 DENTAL 308DSC072 LIFE 309DSC073 PENSION 310DSC074 HOUSING 311DSC075 MEALS 312DSC076 TRANSPT 313DSC077 SCHOLAR 314DSC078 TUITION 315DSC079DSC080DSC081 LNGTHYR 269DSC082 MINBACH 271DSC083DSC084DSC085DSC086 MERITPAY 279DSC087 MERITCS 280DSC088 MERITSTP 281DSC089 MERITINC 282DSC090 SHORTAGE 283DSC095 SHORTCSH 284DSC096 SHORTSTP 285DSC097 SHORTINC 286DSC099 SHRTSPEC 287DSC100 SHRTMATH 288DSC101 SHRTCOMP 289DSC102 SHRTPHYS 290DSC103 SHRTBIO 291DSC104 SHRTESOL 292DSC105 SHRTLANG 293DSC106 SHRTOTHR 295DSC107 RETRAING 296DSC108 RESPECL 297DSC109 REMATH 298DSC110 RECOMP 299DSC111 REPHYS 300
1 Q
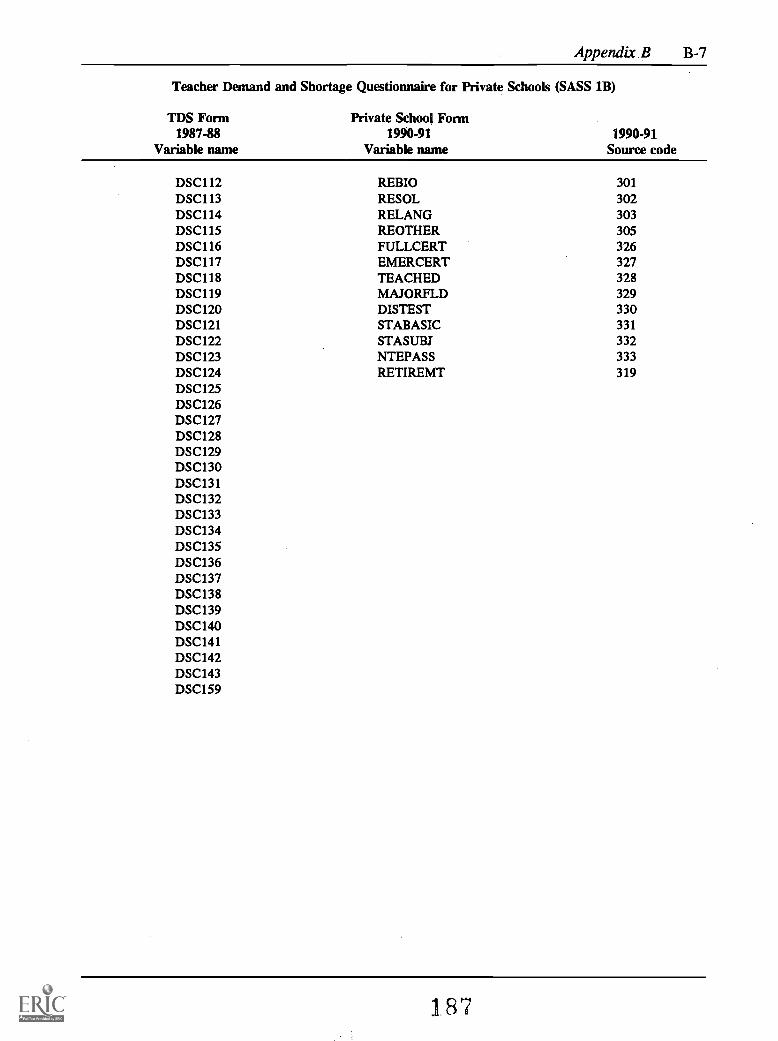
Appendix B B-7
Teacher Demand and Shortage Questionnaire for Private Schools (SASS 1B)
TDS Form Private School Form1987-88 1990-91 1990-91
Variable name Variable name Source code
DSC112 REBIO 301DSC113 RESOL 302DSC114 RELANG 303DSC115 REOTHER 305DSC116 FULLCERT 326DSC117 EMERCERT 327DSC118 TEACHED 328DSC119 MAJORFLD 329DSC120 DISTEST 330DSC121 STABASIC 331DSC122 STASUBJ 332DSC123 NTEPASS 333DSC124 RETIREMT 319DSC125DSC126DSC127DSC128DSC129DSC130DSC131DSC132DSC133DSC134DSC135DSC136DSC137DSC138DSC139DSC140DSC141DSC142DSC143DSC159
187

B-8 1990-91 SASS Data File Users' Manual
NOTE: If there is a blank in the variable name for 1990-91, that particular item was not asked in 1990-91.
Public School Administrator Questionnaire (SASS 2A)
1987-88 1990-91 1990-91Variable name Variable name Source code
ASCO11ASC012 ASCO21 021
ASC013 ASCO22 022
ASC014 ASCO23 023
ASC015 ASC012 012
ASC016 ASC013 013
ASC017 ASC014 014
ASC018ASC019ASCO20ASCO21 ASC017 017
ASCO22 ASC018 018
ASCO23 ASC019 019
ASCO24ASCO25ASCO26ASCO27 ASCO24 024
ASCO28 ASCO25 025
ASCO29 ASCO26 026
ASC030 and ASC033 ASCO27 027
ASC031 and ASC034 ASCO28 028
ASC032 and ASC035 ASCO29 029
ASC036ASC039 ASC030 030
ASC040ASC041 ASC033 033
ASC042ASC043ASC044ASC045 ASC034 034
ASC046 ASC035 035
ASC047 ASC036 036
ASC048 ASC037 037
ASC049 ASC038 038
ASC050 ASC040 040
ASC051 ASC044 044
ASC052 ASC045 045
ASC053 ASC046 046
ASC054 ASC047 047
ASC055 ASC048 048
ASC056 ASC049 049
ASC057 ASC050 050
ASC058 ASC051 051
ASC059 ASC052 052
ASC060 ASC055 055
ASC061 ASC056 056
ASC062 ASC057 057
ASC063 ASC058 058
1.83

Appendix B B-9
Public School Administrator Questionnaire (SASS 2A)
1987-88 1990-91 1990-91Variable name Variable name Source code
ASC064 ASC059 059
ASC065 ASC060 060
ASC066 ASC061 061
ASC067 ASC062 062
ASC068 ASC063 063
ASC069 ASC064 064
ASC070 ASC065 065
ASC071 ASC066 066
ASC072 ASC121 121
ASC073 ASC122 122
ASC074 ASC124 124
ASC075 ASC125 125
ASC076ASC077ASC078ASC079ASC080ASC081ASC082ASC083ASC084ASC085ASC086ASC087 ASC068 068
ASC088 ASC069 069
ASC089 ASC067 067
ASC090 ASC070 070
ASC091 ASC073 073
ASC092 ASC074 074
ASC093 ASC075 075
ASC094 ASC076 076
ASC095 ASC077 077
ASC096 ASC078 078
ASC097 ASC079 079
ASC098 ASC081 081
ASC099 ASC082 082
ASC100ASC101ASC102 BRDCURRC 101
ASC103 PRNCURRC 102
ASC104 TEACURRC 103
ASC105 BRDHIRNG 106
ASC106 PRNHIRNG 107
ASC107 TEAHIRNG 108
ASC108 BRDDISPL 111
ASC109 PRNDISPL 112
ASC110 TEADISPL 113
ASC111ASC112ASC113
189

B-10 1990-91 SASS Data File Users' Manual
Public School Administrator Questionnaire (SASS 2A)
1987-88 1990-91 1990-91Variable name Variable name Source code
ASC114ASC115ASC116ASC117ASC118ASC119ASC 120
190
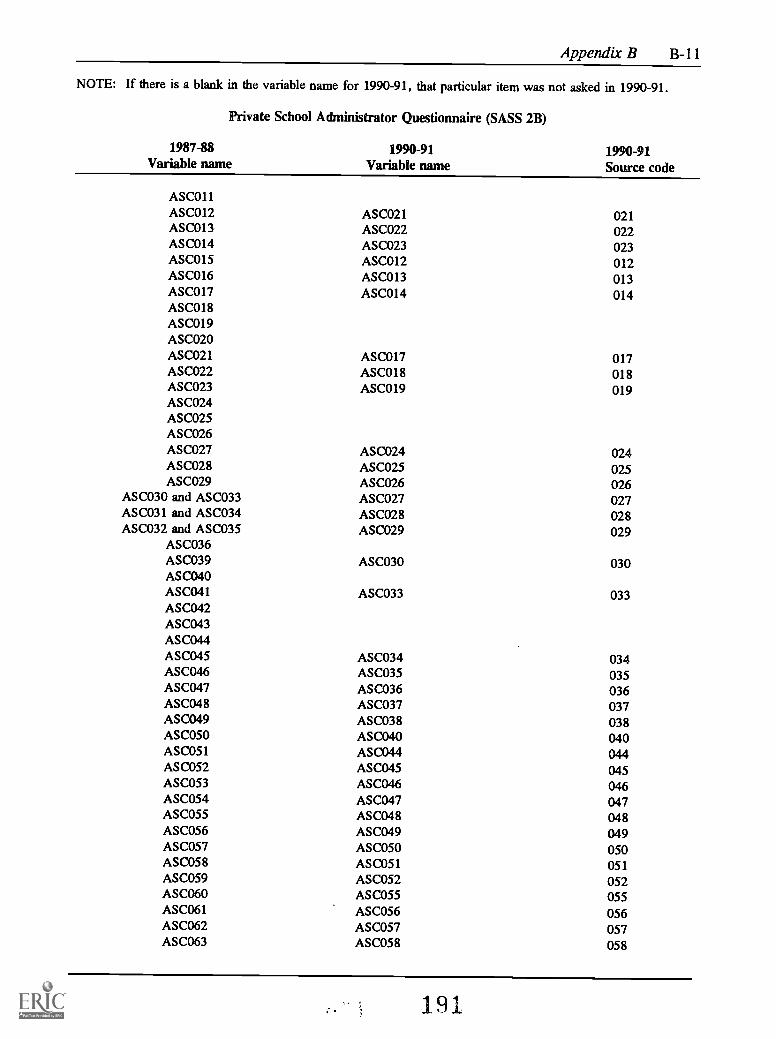
Appendix B B-11
NOTE: If there is a blank in the variable name for 1990-91, that particular item was not asked in 1990-91.
Private School Administrator Questionnaire (SASS 2B)
1987-88 1990-91 1990-91Variable name Variable name Source code
ASCO11ASC012 ASCO21 021ASC013 ASCO22 022ASC014 ASCO23 023ASC015 ASC012 012ASC016 ASC013 013ASC017 ASC014 014ASC018ASC019ASCO20ASCO21 ASC017 017ASCO22 ASC018 018ASCO23 ASC019 019ASCO24ASCO25ASCO26ASCO27 ASCO24 024ASCO28 ASCO25 025ASCO29 ASCO26 026
ASC030 and ASC033 ASCO27 027ASC031 and ASC034 ASCO28 028ASC032 and ASC035 ASCO29 029
ASC036ASC039 ASC030 030ASC040ASC041 ASC033 033ASC042ASC043ASC044ASC045 ASC034 034ASC046 ASC035 035ASC047 ASC036 036ASC048 ASC037 037ASC049 ASC038 038ASC050 ASC040 040ASC051 ASC044 044ASC052 ASC045 045ASC053 ASC046 046ASC054 ASC047 047ASC055 ASC048 048ASC056 ASC049 049ASC057 ASC050 050ASC058 ASC051 051ASC059 ASC052 052ASC060 ASC055 055ASC061 ASCO56 056ASC062 ASC057 057ASC063 ASC058 058
191

B-12 1990-91 SASS Data File Users' Manual
Private School Administrator Questionnaire (SASS 2B)
1987-88 1990-91 1990-91
Variable name Variable name Source code
ASC064 ASC059 059
ASC065 ASC060 060
ASC066 ASC061 061
ASC067 ASC062 062
ASC068 ASC063 063
ASC069 ASC064 064
ASC070 ASC065 065
ASC071 ASC066 066
ASC072 ASC121 121
ASC073 ASC122 122
ASC074 ASC124 124
ASC075 ASC125 125
ASC076ASC077ASC078ASC079ASC080ASC081ASC082ASC083ASC084ASC085ASC086ASC087 ASC068 068
ASC088 ASC069 069
ASC089 ASC067 067
ASC090 ASC070 070
ASC091 ASC073 073
ASC092 ASC074 074
ASC093 ASC075 075
ASC094 ASC076 076
ASC095 ASC077 077
ASC096 ASC078 078
ASC097 ASC079 079
ASC098 ASC081 081
ASC099 ASC082 082
ASC100ASC101ASC102 BRDCURRC 101
ASC103 PRNCURRC 102
ASC104 TEACURRC 103
ASC105 BRDHIRNG 106
ASC106 PRNHIRNG 107
ASC107 TEAHIRNG 108
ASC108 BRDDISPL 111
ASC109 PRNDISPL 112
ASC110 TEADISPL 113
ASC111ASC112ASC113
1 2

Appendix B B-13
Private School Administrator Questionnaire (SASS 2B)
1987-88 1990-91 1990-91Variable name Variable name Source code
ASC114ASC115ASC116ASC117ASC118ASC119ASC120
193
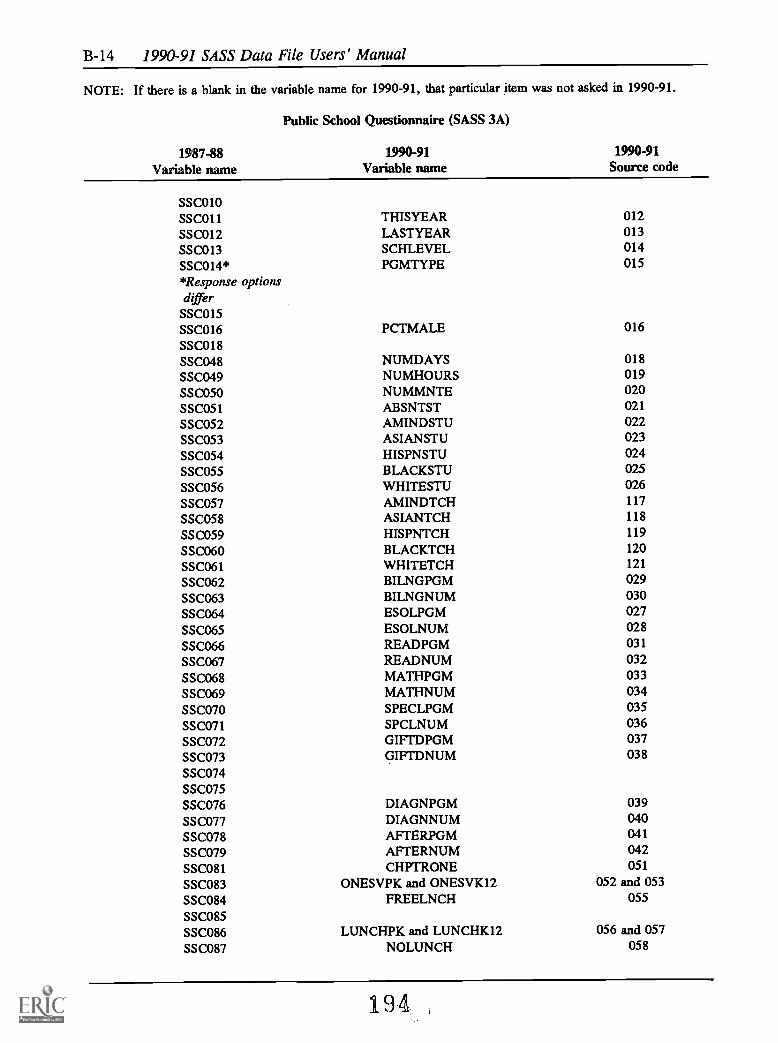
B-14 1990-91 SASS Data File Users' Manual
NOTE: If there is a blank in the variable name for 1990-91, that particular item was not asked in 1990-91.
Public School Questionnaire (SASS 3A)
1987-88 1990-91 1990-91
Variable name Variable name Source code
SSC010SSC011 THISYEAR 012SSC012 LASTYEAR 013SSC013 SCHLEVEL 014SSC014* PGMTYPE 015*Response optionsdiffer
SSC015SSC016 PCTMALE 016SSC018SSC048 NUMDAYS 018SSC049 NUMHOURS 019
SSC050 NUMMNTE 020SSC051 ABSNTST 021
SSC052 AMINDSTU 022SSC053 ASIANSTU 023
SSC054 HISPNSTU 024SSC055 BLACKSTU 025
SSC056 WHITESTU 026SSC057 AMINDTCH 117
SSC058 ASIANTCH 118
SSC059 HISPNTCH 119
SSC060 BLACKTCH 120
SSC061 WHITETCH 121
SSC062 BILNGPGM 029
SSC063 BILNGNUM 030SSC064 ESOLPGM 027
SSC065 ESOLNUM 028
SSC066 READPGM 031
SSC067 READNUM 032
SSC068 MATHPGM 033
SSC069 MATHNUM 034
SSC070 SPECLPGM 035
SSC071 SPCLNUM 036SSC072 GIFTDPGM 037
SSC073 GIFTDNUM 038
SSC074SSC075SSC076 DIAGNPGM 039SSC077 DIAGNNUM 040SSC078 AI, I ERPGM 041
SSC079 AFTERNUM 042SSC081 CHPTRONE 051
SSC083 ONESVPK and ONESVK12 052 and 053SSC084 FREELNCH 055
SSC085SSC086 LUNCHPK and LUNCHK12 056 and 057SSC087 NOLUNCH 058
194
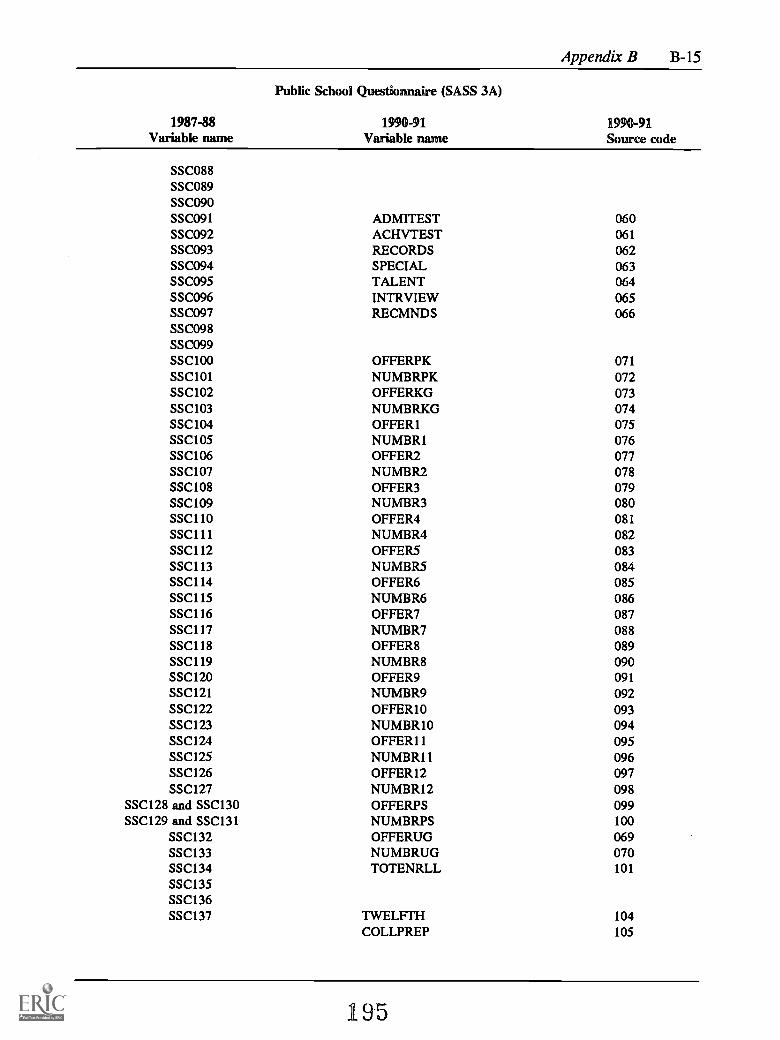
Appendix B B-15
Public School Questionnaire (SASS 3A)
1987-88 1990-91 1990-91Variable name Variable name Source code
SSC088SSC089SSC090SSC091 ADMITEST 060SSC092 ACHVTEST 061SSC093 RECORDS 062SSC094 SPECIAL 063SSC095 TALENT 064SSC096 INTRVIEW 065SSC097 RECMNDS 066SSC098SSC099SSC100 OFFERPK 071SSC101 NUMBRPK 072SSC102 OFFERKG 073SSC103 NUMBRKG 074SSC104 OFFER1 075SSC105 NUMBR1 076SSC106 OFFER2 077SSC107 NUMBR2 078SSC108 OFFER3 079SSC109 NUMBR3 080SSC110 01,1-,ER4 081SSC111 NUMBR4 082SSC112 OFFERS 083SSC113 NUMBRS 084SSC114 OFFER6 085SSC115 NUMBR6 086SSC116 OFFER? 087SSC117 NUMBR7 088SSC118 OFFER8 089SSC119 NUMBR8 090SSCI20 OFFER9 091SSC121 NUMBR9 092SSC122 OFFER10 093SSC123 NUMBRIO 094SSC124 OFFER11 095SSC125 NUMBR11 096SSC126 OFFER12 097SSC127 NUMBR12 098
SSC128 and SSC130 OFFERPS 099SSC129 and SSC131 NUMBRPS 100
SSC132 OFFERUG 069SSC133 NUMBRUG 070SSC134 TOTENRLL 101SSC135SSC136SSC137 TWELFTH 104
COLLPREP 105
195
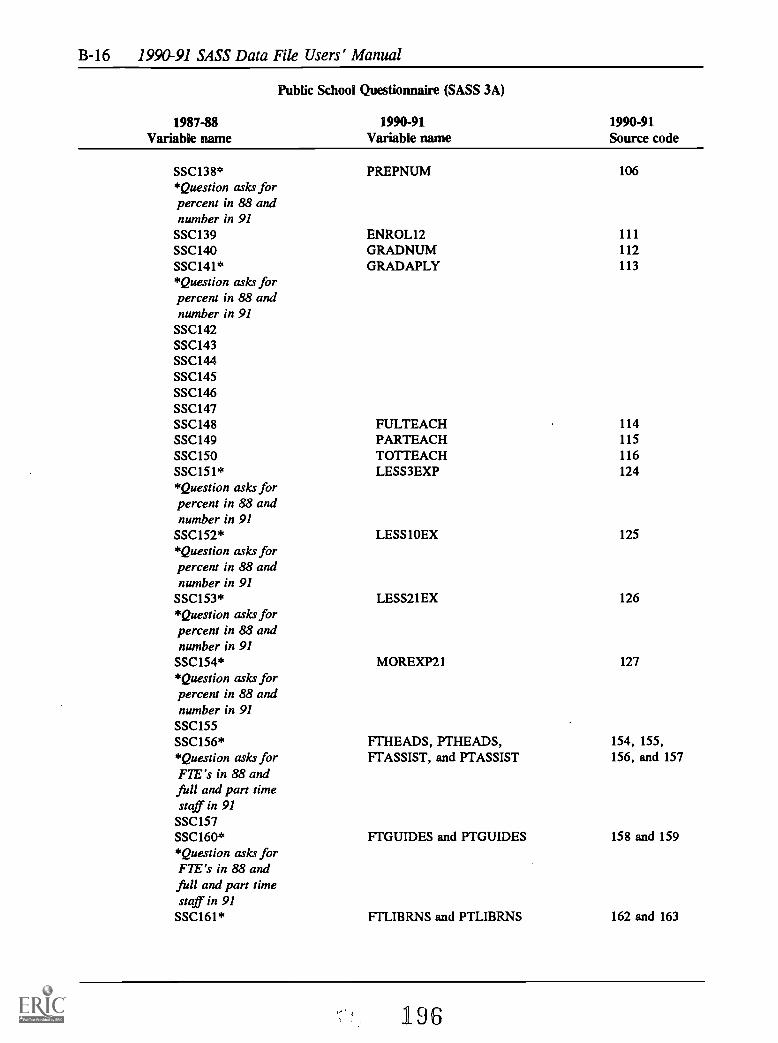
B-16 1990-91 SASS Data File Users' Manual
Public School Questionnaire (SASS 3A)
1987-88 1990-91 1990-91Variable name Variable name Source code
SSC138* PREPNUM 106*Question asks forpercent in 88 andnumber in 91
SSC139 ENROL12 111SSC140 GRADNUM 112SSC141* GRADAPLY 113*Question asks forpercent in 88 andnumber in 91
SSC142SSC143SSC144SSC145SSC146SSC147SSC148 FULTEACH 114SSC149 PARTEACH 115SSC150 TOTTEACH 116SSC151* LESS3EXP 124*Question asks forpercent in 88 andnumber in 91
SSC152* LESS10EX 125*Question asks forpercent in 88 andnumber in 91
SSC153* LESS21EX 126*Question asks forpercent in 88 andnumber in 91
SSC154* MOREXP21 127*Question asks forpercent in 88 andnumber in 91
SSC155SSC156* FTHEADS, PTHEADS, 154, 155,*Question asks for FTASSIST, and PTASSIST 156, and 157FTE's in 88 andfull and part timestaff in 91
SSC157SSC160* FTGUIDES and PTGUIDES 158 and 159*Question asks forF7E's in 88 andfull and part timestaff in 91SSC161* FTLIBRNS and PTLIBRNS 162 and 163
( 196

Appendix B B-17
Public School Questionnaire (SASS 3A)
1987-88 1990-91 1990-91Variable name Variable name Source code
*Question asks forFTE's in 88 andfull and part timestaff in 91
SSC162* FTPROSTF and PTPROSTF 164 and 165*Question asks forFTE's in 88 andfull and part timestaff in 91
SSC165* FTAIDES and PTAIDES 166 and 167*Question asks forFTE's in 88 andfull and part timestaff in 91
SSC166* FTALLOTH and PTALLOTH 170 and 171*Question asks forFTE's in 88 andfull and part timestaff in 91
SSC167 VOLNTSVC 172SSC168 VOLNTNUM 173SSC169SSC170SSC171 LFTTOTAL 140SSC172SSC173SSC174SSC175SSC176SSC177SSC178SSC179SSC180SSC181SSC182SSC183SSC184SSC185SSC186SSC187SSC188SSC189SSC190SSC191SSC192SSC193SSC194SSC195SSC196SSC197
197
B-18 1990-91 SASS Data File Users' Manual
Public School Questionnaire (SASS 3A)
1987-88 1990-91 1990-91Variable name Variable name Source code
SSC198SSC199SSC200SSC201SSC202SSC203SSC204SSC205SSC206SSC207SSC208SSC209SSC210SSC211SSC212SSC213SSC214SSC215SSC216SSC217SSC218SSC219SSC220SSC221SSC222SSC223SSC224SSC225SSC226SSC227SSC228SSC229SSC230SSC231SSC232SSC233SSC234SSC235SSC236SSC237SSC238SSC239SSC240SSC241SSC242SSC243SSC244SSC245SSC246SSC247
198

Appendix B B-19
Public School Questionnaire (SASS 3A)
1987-88 1990-91 1990-91Variable name Variable name Source code
SSC248SSC249SSC250SSC251SSC252SSC253SSC254SSC255SSC256SSC257SSC258SSC259SSC260SSC261SSC262SSC263SSC264SSC265SSC266SSC267SSC268SSC269SSC270SSC271SSC272SSC273SSC274SSC275SSC276SSC277SSC278SSC279SSC280SSC281SSC282SSC283SSC284SSC285SSC286SSC287SSC288SSC289SSC290SSC291SSC292SSC293SSC294SSC295SSC296SSC297
199
B-20 1990-91 SASS Data File Users' Manual
Public School Questionnaire (SASS 3A)
1987-88 1990-91 1990-91Variable name Variable name Source code
SSC298SSC299
200
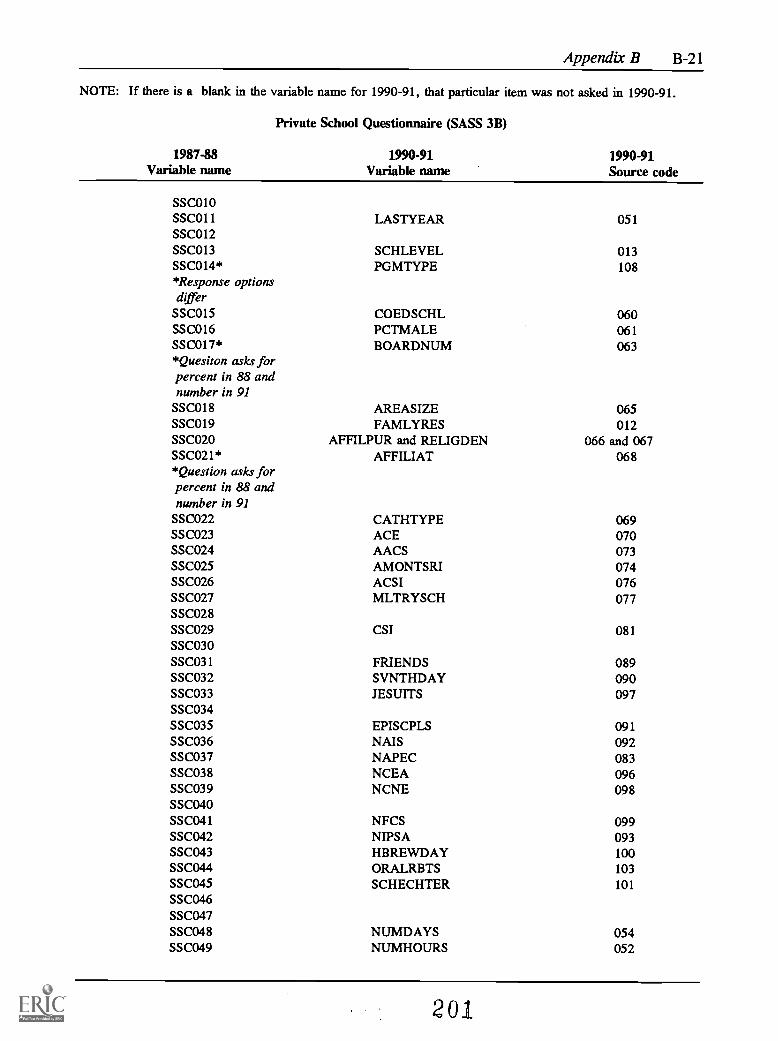
Appendix B B-21
NOTE: If there is a blank in the variable name for 1990-91, that particular item was not asked in 1990-91.
Private School Questionnaire (SASS 3B)
1987-88 1990-91 1990-91Variable name Variable name Source code
SSC010SSCO11 LASTYEAR 051SSC012SSC013 SCHLEVEL 013SSC014* PGMTYPE 108*Response optionsdifferSSC015 COEDSCHL 060SSC016 PCTMALE 061SSC017* BOARDNUM 063*Quesiton asks forpercent in 88 andnumber in 91
SSC018 AREASIZE 065SSC019 FAMLYRES 012SSCO20 AFFILPUR and RELIGDEN 066 and 067SSCO21* AFFILIAT 068*Question asks forpercent in 88 andnumber in 91
SSCO22 CATHTYPE 069SSCO23 ACE 070SSCO24 AACS 073SSCO25 AMONTSRI 074SSCO26 ACSI 076SSCO27 MLTRYSCH 077SSCO28SSCO29 CSI 081SSC030SSC031 FRIENDS 089SSC032 SVNTHDAY 090SSC033 JESUITS 097SSC034SSC035 EPISCPLS 091SSC036 NAIS 092SSC037 NAPEC 083SSC038 NCEA 096SSC039 NCNE 098SSC040SSC041 NFCS 099SSC042 NIPSA 093SSC043 HBREWDAY 100SSC044 ORALRBTS 103SSC045 SCHECHTER 101SSC046SSC047SSC048 NUMDAYS 054SSC049 NUMHOURS 052
201

B-22 1990-91 SASS Data File Users' Manual
Private School Questionnaire (SASS 3B)
1987-88 1990-91 1990-91Variable name Variable name Source code
SSC050 NUMMNTE 053SSC051* ABSNTST 062*Question asks forpercent in 88 andnumber in 91
SSC052 AMINDSTU 055SSC053 ASIANSTU 056SSC054 HISPNSTU 057SSC055 BLACKSTU 058SSC056 WHITESTU 059SSC057 AMINDTCH 212SSC058 ASIANTCH 213SSC059 HISPNTCH 214SSC060 BLACKTCH 215SSC061 WHITETCH 216SSC062 BILNGPGM 111
SSC063 BILNGNUM 112
SSC064 ESOLPGM 109
SSC065 ESOLNUM 110SSC066 READPGM 113
SSC067 READNUM 114
SSC068 MATHPGM 115SSC069 MATHNUM 116
SSC070 SPECLPGM 117
SSC071 SPCLNUM 118
SSC072 GIFTDPGM 119
SSC073 GIFTDNUM 120SSC074SSC075SSC076 DIAGNPGM 121
SSC077 DIAGNNUM 122
SSC078 AFTERPGM 123
SS C079 AFTERNUM 124SSC080 CHPTRONE 130SSC082SSC083 ONESVPK and ONESVK12 131 and 132SSC084SSC085SSC086SSC087SSC088 CHARGETU 134SSC089 DISCOUNT 135
SSC090 TUITIN 136
SSC091 ADMITEST 138
SSC092 ACHVTEST 139
SSC093 RECORDS 140SSC094 SPECIAL 141
SSC095 TALENT 142SSC096 INTRVIEW 143
SSC097 RECMNDS 144
202

Appendix B B-23
Private School Questionnaire (SASS 3B)
1989-88 1990-91 1990-91Variable name Variable name Source code
SSC098SSC099SSC100 OFFERPK 018SSC101 NUMBRPK 019SSC102 OFFERKG 020SSC103 NUMBRKG 021SSC104 OFFERI 022SSC105 NUMBRI 023SSC106 OFFER2 024SSC107 NUMBR2 025SSC108 OFFER3 026SSC109 NUMBR3 027SSC110 OFFER4 028SSC111 NUMBR4 029SSC112 OFFERS 030SSC113 NUMBR5 031SSC114 OFFER6 032SSC115 NUMBR6 033SSC116 OFFER? 034SSC117 NUMBR7 035SSC118 OFFER8 036SSC119 NUMBR8 037SSC120 OFFER9 038SSC121 NUMBR9 039SSC122 OFFER10 040SSC123 NUMBR10 041SSC124 OFFER11 042SSC125 NUMBRI I 043SSC126 OFFER12 044SSC127 NUMBR12 045
SSC128 and SSC130 OFFERPS 046SSC129 and SSC131 NUMBRPS 047
SSC132 OFFERUG 014SSC133 NUMBRUG 015SSC134 TOTENRLL 048SSC135SSC136SSC137 TWELFTH 148SSC138SSC139 ENROL12 162SSC140 GRADNUM 163SSC141* GRADAPLY 164*Question asks forpercent in 88 andnumber in 91
SSC142SSC143SSC144SSC145SSC146
203

B-24 1990-91 SASS Data File Users' Manual
Private School Questionnaire (SASS 3B)
1987-88 1990-91 1990-91Variable name Variable name Source code
SSC147SSC148 TTOTK_12 179
SSC149SSC150SSC151* LESS3EXP 219*Question asks forpercent in 88 andnumber in 91
SSC152* LESS10EX 220*Question asks forpercent in 88 andnumber in 91
SSC153* LESS21EX 221*Question asks forpercent in 88 andnumber in 91
SSC154* MOREXP21 222*Question asks forpercent in 88 andnumber in 91
SSC155 AFTERBAC 218SSC156SSC157SSC158SSC159SSC160 FTGUIDES 253
SSC161 FTLIBRNS 257SSC162 FTPROSTF 259SSC163SSC164SSC165SSC166 FTALLOTH 265SSC167 VOLNTSVC 267SSC168 VOLNTNUM 268SSC169SSC170SSC171SSC172SSC173 NEWHIRES 184
SSC174 FULTEACH 209SSC175SSC176SSC177SSC178SSC179SSC180SSC181SSC182SSC183SSC184
204

Appendix B B-25
Private School Questionnaire (SASS 3B)
1987-88 1990-91 1990-91Variable name Variable name Source code
SSC185SSC186SSC187SSC188SSC189SSC190SSC191SSC192SSC193SSC194SSC195SSC196SSC197SSC198SSC199SSC200SSC201SSC202SSC203SSC204SSC205SSC206SSC207SSC208SSC209SSC210SSC211SSC212SSC213SSC214SSC215SSC216SSC217SSC218SSC219SSC220SSC221SSC222SSC223SSC224SSC225SSC226SSC227SSC228SSC229SSC230SSC231SSC232SSC233SSC234
205
B-26 1990-91 SASS Data File Users' Manual
Private School Questionnaire (SASS 3B)
1987-88 1990-91 1990-91Variable name Variable name Source code
SSC235SSC236SSC237SSC238SSC239SSC240SSC241SSC242SSC243SSC244SSC245SSC246SSC247SSC248SSC249SSC250SSC251SSC252SSC253SSC254SSC255SSC256SSC257SSC258SSC259SSC260SSC261SSC262SSC263SSC264SSC265SSC266SSC267SSC268SSC269SSC270SSC271SSC272SSC273SSC274SSC275SSC276SSC277SSC278SSC279SSC280SSC281SSC282SSC283SSC284
206

Appendix B B-27
Private School Questionnaire (SASS 3B)
1987-88 1990-91 1990-91Variable name Variable name Source code
SSC285SSC286SSC287SSC288SSC289SSC290SSC291SSC292SSC293SSC294SSC295SSC296SSC297SSC298SSC299
207

B-28 1990-91 SASS Data File Users' Manual
NOTE: If there is a blank in the variable name for 1990-91, that particular item was not asked in 1990-91.
Public School Teacher Questionnaire (SASS 4A)
1987-88 1990-91 1990-91
Variable name Variable name Source code
TSC010* TSC011 011
*In 88 full and parttime are combined.Response optionsdifferTSC011TSC012TSC013 TSC015 015
TSC014* TSC014 014
*Response optionsdifferTSC015* TSC016 016
*Response optionsdifferTSC016 TSC017 017
TSC017TSC018 TSCO23 023
TSC019 TSCO24 024
TSCO20 TSCO25 025
TSCO21 TSCO26 026
TSCO22 TSCO27 027
TSCO23 TSC031 031
TSCO24 TSC032 032
TSCO25 TSCO29 029
TSCO26 TSC030 030
TSCO27 TSC033 033
TSCO28 TSC034 034
TSCO29 TSC035 035
TSC030 TSC037 037
TSC031 TSC038 038
TSC032 and TSC034* TSC039 039
*Response optionsdifferTSC033TSC035* TSC019 019
*Response optionsdifferTSC036 TSCO20 020
TSC037 TSCO21 021
TSC038 TSCO22 022
TSC039 TSC049 049
TSC040 TSC050 050
TSC041TSC042 TSC051 051
TSC043 TSC040 040
TSC044 TSC041 041
TSC045 TSC044 044
TSC046 TSC042 042
208

Appendix B B-29
Public School Teacher Questionnaire (SASS 4A)
1987-88 1990-91 1990-91Variable name Variable name Source code
TSC047TSC048TSC049TSC050TSC051 TSC045 045TSC052 TSC046 046TSC053TSC054 TSC047 047TSC055TSC056TSC057TSC058TSC059 TSC052 052TSC060 TSC053 053TSC061TSC062 TSC054 054
TSC063 and TSC067 TSC055 055TSC064 and TSC068 TSC056 056
TSC065TSC066 and TSC070 TSC057 057
TSC069TSC071TSC072TSC073TSC074TSC075 TSC058 058TSC076 TSC059 059TSC077 TSC060 060TSC078 TSC061 061TSC079 TSC069 069TSC080 TSC070 070TSC081 TSC071 071TSC082 TSC072 072TSC083 TSC073 073TSC084 TSC074 074TSC085TSC086TSC087TSC088TSC089TSC090TSC091TSC092TSC093TSC094TSC095TSC096TSC097TSC098TSC099
209

B-30 1990-91 SASS Data File Users' Manual
Public School Teacher Questionnaire (SASS 4A)
1987-88 1990-91 1990-91Variable name Variable name Source code
TSC100 and TSC101 TSC078 078
TSC102 and TSC103 TSC079 079
TSC104 and TSC105 TSC081 081
TSC106 and TSC107 TSC082 082TSC108 and TSC109 TSC084 084
TSC110 and TSC111 TSC085 085
TSC112 and TSC113 TSC087 087
TSC114 and TSC115 TSC088 088
TSC116 and TSC117 TSC090 090
TSC118 and TSC119 TSC091 091
TSC120 and TSC121 TSC093 093
TSC122 and TSC123 TSC094 094
TSC124 and TSC125 TSC096 096
TSC126 and TSC127 TSC097 097
TSC128 TSC098 098
TSC129TSC130* TSC100 100
*Response optionsdiffer
TSC131 TSC101 101
TSC132* TSC102 102
*Response optionsdiffer. See question23 part C of 88, andquestion 25 part Bof 91
TSC133 TSC103 103
TSC134TSC135TSC136TSC137TSC138TSC139TSC140 TSC113 113
TSC141 TSC114 114
TSC142 TSC115 115
TSC143 TSC116 116
TSC144 TSC117 117
TSC145 TSC118 118
TSC146 TSC119 119
TSC147 TSC120 120
TSC148 TSC121 121
TSC149 TSC122 122
TSC150 TSC123 123
TSC151 TSC124 124
TSC152 TSC125 125
TSC153 TSC126 126
TSC154 and TSC155 TSC127 127
TSC156 TSC112 112
210

Appendix B B-31
Public School Teacher Questionnaire (SASS 4A)
1987-88 1990-91 1990-91Variable name Variable name Source code
TSC157* TSC128 128*Response OptionsDiffer
TSC158 TSC129 129TSC159 TSC130 130TSC160 TSC131 131TSC161 TSC132 132TSC162 TSC133 133TSC163 TSC134 134TSC164 TSC135 135TSC165
TSC166, TSC173, TSC137, TSC145, 137, 145,TSC180, TSC187, TSC153, TSC161, 153, 161,TSC194, TSC201, TSC169, TSC177, 169, 177,TSC208, TSC215, TSC185, TSC193, 185, 193,
and TSC222* and TSC201 and 201*Subject matter codes
differTSC167, TSC174, TSC138, TSC146, 138, 146,TSC181, TSC188, TSC154, TSC162, 154, 162,TSC195, TSC202, TSC170, TSC178, 170, 178,TSC209, TSC216, TSC186, TSC194, 186, 194,
and TSC223 and TSC202 and 202TSC168, TSC175, TSC139, TSC147, 139, 147,TSC182, TSC189, TSC155, TSC163, 155, 163,TSC196, TSC203 TSC171, TSC179, 171, 179,TSC210, TSC217, TSC187, TSC195, 187, 195,
and TSC224 and TSC203 and 203TSC169, TSC176, TSC140, TSC148, 140, 148,TSC183, TSC190, TSC156, TSC164, 156, 164,TSC197, TSC204, TSC172, TSC180, 172, 180,TSC211, TSC218, TSC188, TSC196, 188, 196,
and TSC225 and TSC204 and 204TSC170TSC171, TSC178, TSC143, TSC151, 143, 151,TSC185, TSC192, TSC159, TSC167, 159, 167,TSC199, TSC206, TSC175, TSC183, 175, 183,TSC213, TSC220, TSC191, TSC199, 191, 199,
and TSC227 and TSC207 and 207TSC172, TSC179, TSC144, TSC152, 144, 152,TSC186, TSC193, TSC160, TSC168, 160, 168,TSC200, TSC207, TSC176, TSC184, 176, 184,TSC214, TSC221, TSC192, TSC200, 192, 200,
and TSC228* and TSC208 and 208*Response options differ.See question 27 part gof 88, and question 32part i of 91
TSC177TSC184
211

B-32 1990-91 SASS Data File Users' Manual
Public School Teacher Questionnaire (SASS 4A)
1987-88 1990-91 1990-91Variable name Variable name Source code
TSC191TSC198TSC205TSC212TSC219TSC226TSC229TSC230TSC231TSC232TSC233TSC234TSC235TSC236TSC237TSC238TSC239TSC240TSC241TSC242 TSC226 226TSC243TSC244TSC245TSC246TSC247TSC248 TSC227 227TSC249TSC250 TSC228 228TSC251TSC252TSC253TSC254TSC255TSC256TSC257TSC258TSC259TSC260TSC261 TSC236 236
TSC262 TSC254 254
TSC263 TSC255 255TSC264 TSC256 256
TSC265 TSC257 257
TSC266 TSC258 258TSC267 TSC259 259TSC268 TSC260 260TSC269 TSC261 261
TSC270 TSC262 262
TSC271 TSC263 263
TSC272 TSC264 264
212

Appendix B B-33
Public School Teacher Questionnaire (SASS 4A)
1987-88 1990-91 1990-91Variable name Variable name Source code
TSC273 TSC265 265TSC274 TSC266 266TSC275 TSC244 244TSC276 TSC245 245TSC277 TSC246 246TSC278 TSC247 247TSC279 TSC248 248TSC280 TSC249 249TSC281 TSC250 250TSC282 TSC252 252TSC283 TSC253 253TSC284TSC285TSC286TSC287TSC288 TSC276 276TSC289 TSC277 277TSC290* TSC278 278*Response optionsdiffer
TSC291* TSC279 279*Response optionsdiger
TSC292TSC293 TSC280 280TSC294TSC295 TSC281 281TSC296TSC297 TSC282 282TSC298TSC299 TSC283 283TSC300TSC301 TSC284 284TSC302TSC303 TSC285 285TSC304 TSC287 287TSC305 TSC289 289TSC306 TSC291 291TSC307 TSC292 292TSC308 TSC294 294TSC309 TSC296 296TSC310 TSC300 300TSC311 HOUSEXPS 301TSC312 MEALS 302TSC313 TUITION 303TSC314 CHLDCARE 304TSC315 COLLEGE 305TSC316 TRANSPT 306TSC317 NONE 307TSC318 FAMLYINC 308
213

B-34 1990-91 SASS Data File Users' Manual
Public School Teacher Questionnaire (SASS 4A)
1987-88 1990-91 1990-91Variable name Variable name Source code
TSC319 SEX 309TSC320 RACE 310TSC321 HISPANIC 312TSC322 BIRTHYR 313TSC323 MARITAL 314TSC324 DEPCHLDN 315TSC325 AGEYOUNG 316TSC326 OTHERDEP 317TSC327 DEPCOUNT 318TSC328 TSC319 319TSC329 TSC320 320TSC330 TSC321 321
214
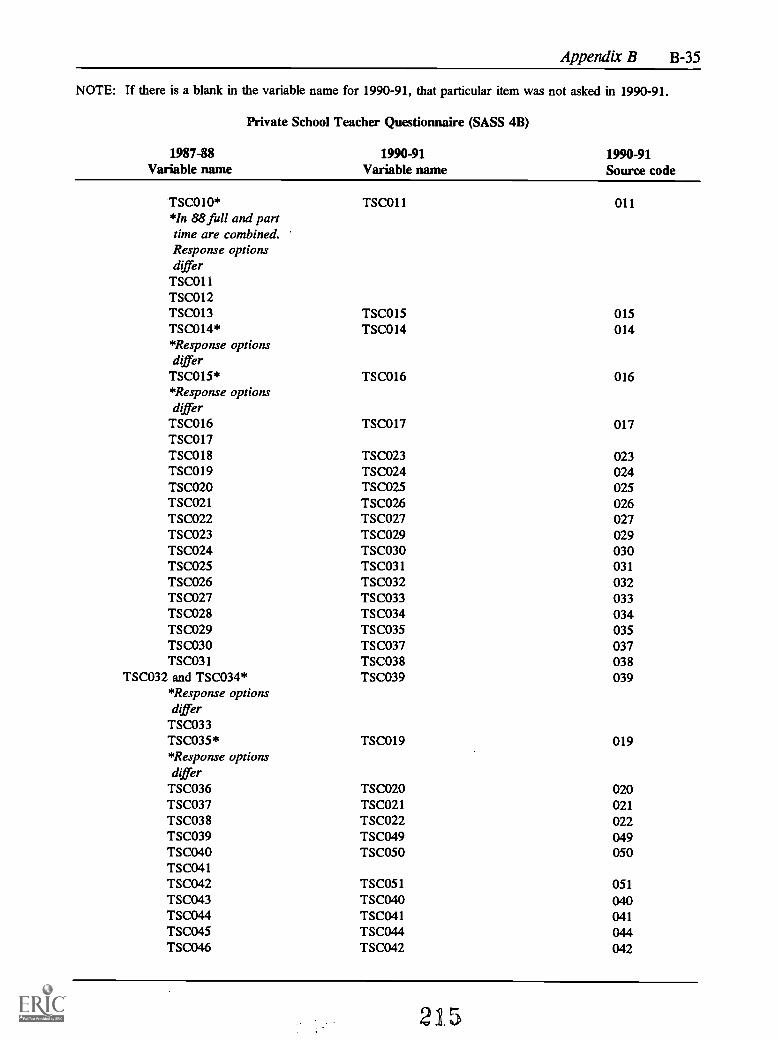
Appendix B B-35
NOTE: If there is a blank in the variable name for 1990-91, that particular item was not asked in 1990-91.
Private School Teacher Questionnaire (SASS 4B)
1987-88 1990-91 1990-91Variable name Variable name Source code
TSC010* TSC011 011*In 88 full and parttime are combined.Response optionsdifferTSC011TSC012TSC013 TSC015 015
TSC014* TSC014 014*Response optionsdifferTSC015* TSC016 016
*Response optionsdifferTSC016 TSC017 017
TSC017TSC018 TSCO23 023
TSC019 TSCO24 024
TSCO20 TSCO25 025
TSCO21 TSCO26 026
TSCO22 TSCO27 027
TSCO23 TSCO29 029
TSCO24 TSC030 030TSCO25 TSC031 031
TSCO26 TSC032 032
TSCO27 TSC033 033
TSCO28 TSC034 034
TSCO29 TSC035 035
TSC030 TSC037 037
TSC031 TSC038 038
TSC032 and TSC034* TSC039 039
*Response optionsdifferTSC033TSC035* TSC019 019
*Response optionsdifferTSC036 TSCO20 020
TSC037 TSCO21 021
TSC038 TSCO22 022TSC039 TSC049 049
TSC040 TSC050 050
TSC041TSC042 TSC051 051
TSC043 TSC040 040TSC044 TSC041 041
TSC045 TSC044 044TSC046 TSC042 042
215

B-36 1990-91 SASS Data File Users' Manual
Private School Teacher Questionnaire (SASS 4B)
1987-88 1990-91 1990-91Variable name Variable name Source code
TSC047TSC048TSC049TSC050TSC051 TSC045 045TSC052 TSC046 046TSC053TSC054 TSC047 047TSC055TSC056TSC057TSC058TSC059 TSC052 052TSC060 TSC053 053TSC061TSC062 TSC054 054
TSC063 and TSC067 TSC055 055TSC064 and TSC068 TSC056 056
TSC065TSC066 and TSC070 TSC057 057
TSC069TSC071TSC072TSC073TSC074TSC075 TSC058 058TSC076 TSC059 059TSC077 TSC060 060TSC078 TSC061 061TSC079 TSC069 069TSC080 TSC070 070TSC081 TSC071 071TSC082 TSC072 072TSC083 TSC073 073TSC084 TSC074 074TSC085TSC086TSC087TSC088TSC089TSC090TSC091TSC092TSC093TSC094TSC095TSC096TSC097TSC098TSC099
216

Appendix B B-37
Private School Teacher Questionnaire (SASS 4B)
1987-88 1990-91 1990-91Variable name Variable name Source code
TSC100 and TSC101 TSC078 078TSC102 and TSC103 TSC079 079TSC104 and TSC105 TSC081 081TSC106 and TSC107 TSC082 082TSC108 and TSC109 TSC084 084TSC110 and TSC111 TSC085 085TSC112 and TSC113 TSC087 087TSC114 and TSC115 TSC088 088TSC116 and TSC117 TSC090 090TSC118 and TSC119 TSC091 091TSC120 and TSC121 TSC093 093TSC122 and TSC123 TSC094 094TSC124 and TSC125 TSC096 096TSC126 and TSC127 TSC097 097
TSC128 TSC098 098TSC129TSC130* TSC100 100*Response optionsdiffer
TSC131 TSC101 101TSC132* TSC102 102*Response optionsdiffer. See question23 part C of 88, andquestion 25 part B of 91
TSC133 TSC103 103TSC134TSC135TSC136TSC137TSC138TSC139TSC140 TSC113 113TSC141 TSC114 114TSC142 TSC115 115TSC143 TSC116 116TSC144 TSC117 117TSC145 TSC118 118TSC146 TSC119 119TSC147 TSC120 120TSC148 TSC121 121TSC149 TSC122 122TSC150 TSC123 123TSC151 TSC124 124TSC152 TSC125 125TSC153 TSC126 126
TSC154 and TSC155 TSC127 127TSC156 TSC112 112
217

B-38 1990-91 SASS Data File Users' Manual
Private School Teacher Questionnaire (SASS 4B)
1987-88 1990-91 1990-91Variable name Variable name Source code
TSC157* TSC128 128
*Response optionsdiffer
TSC158 TSC129 129
TSC159 TSC130 130TSC160 TSC131 131
TSC161 TSC132 132
TSC162 TSC133 133
TSC163 TSC134 134
TSC164 TSC135 135TSC165
TSC166, TSC173, TSC137, TSC145, 137, 145,TSC180, TSC187, TSC153, TSC161, 153, 161,TSC194, TSC201, TSC169, TSC177, 169, 177,TSC208, TSC215, TSC185, TSC193, 185, 193,
and TSC222* and TSC201 and 201*Subject matter codes differ
TSC167, TSC174, TSC138, TSC146, 138, 146,TSC181, TSC188, TSC154, TSC162, 154, 162,TSC195, TSC202, TSC170, TSC178, 170, 178,TSC209, TSC216, TSC186, TSC194, 186, 194,
and TSC223 and TSC202 and 202TSC168, TSC175, TSC139, TSC147, 139, 147,TSC182, TSC189, TSC155, TSC163, 155, 163,TSC196, TSC203, TSC171, TSC179, 171, 179,TSC210, TSC217, TSC187, TSC195, 187, 195,
and TSC224 and TSC203 and 203TSC169, TSC176, TSC140, TSC148, 140, 148,TSC183, TSC190, TSC156, TSC164, 156, 164,TSC197, TSC204, TSC172, TSC180, 172, 180,TSC211, TSC218, TSC188, TSC196, 188, 196,
and TSC225 and TSC204 and 204TSC170
TSC171, TSC178, TSC143, TSC151, 143, 151,TSC185, TSC192, TSC159, TSC167, 159, 167,TSC199, TSC206, TSC175, TSC183, 175, 183,TSC213, TSC220, TSC191, TSC199, 191, 199,
and TSC227 and TSC207 and 207TSC172, TSC179, TSC144, TSC152, 144, 152,TSC186, TSC193, TSC160, TSC168, 160, 168,TSC200, TSC207, TSC176, TSC184, 176, 184,TSC214, TSC221, TSC192, TSC200, 192, 200,
and TSC228* and TSC208 and 208*Response options differ.See question 27 part gof 88, and question 32part i of 91
TSC177TSC184TSC191
218

Appendix B B-39
Private School Teacher Questionnaire (SASS 4B)
1987-88 1990-91 1990-91Variable name Variable name Source code
TSC198TSC205TSC212TSC219TSC226TSC229TSC230TSC231TSC232TSC233TSC234TSC235TSC236TSC237TSC238TSC239TSC240TSC241TSC242 TSC226 226TSC243TSC244TSC245TSC246TSC247TSC248 TSC227 227TSC249TSC250 TSC228 228TSC251TSC252TSC253TSC254TSC255TSC256TSC257TSC258TSC259TSC260TSC261 TSC236 236TSC262 TSC254 254TSC263 TSC255 255TSC264 TSC256 256TSC265 TSC257 257TSC266 TSC258 258TSC267 TSC259 259TSC268 TSC260 260TSC269 TSC261 261TSC270 TSC262 262TSC271 TSC263 263TSC272 TSC264 264TSC273 TSC265 265
219
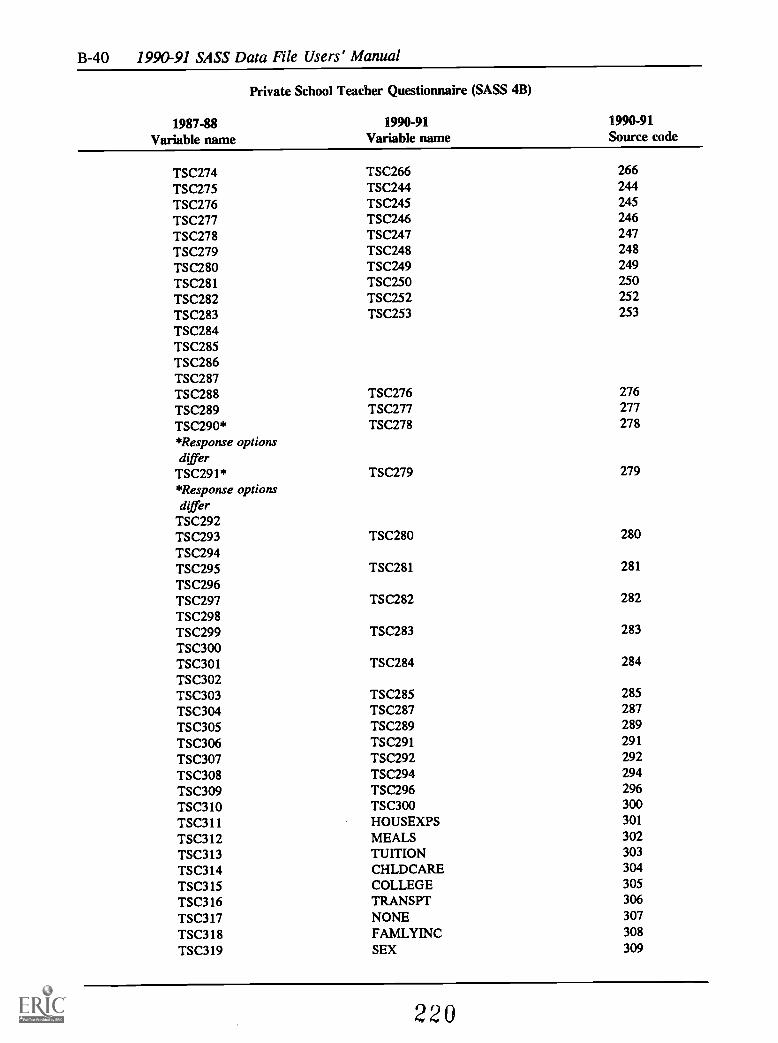
B-40 1990-91 SASS Data File Users' Manual
Private School Teacher Questionnaire (SASS 4B)
1987-88 1990-91 1990-91
Variable name Variable name Source code
TSC274 TSC266 266
TSC275 TSC244 244
TSC276 TSC245 245
TSC277 TSC246 246
TSC278 TSC247 247
TSC279 TSC248 248
TSC280 TSC249 249
TSC281 TSC250 250
TSC282 TSC252 252
TSC283 TSC253 253
TSC284TSC285TSC286TSC287TSC288 TSC276 276
TSC289 TSC277 277
TSC290* TSC278 278
*Response optionsdiffer
TSC291* TSC279 279
*Response optionsdiffer
TSC292TSC293 TSC280 280
TSC294TSC295 TSC281 281
TSC296TSC297 TSC282 282
TSC298TSC299 TSC283 283
TSC300TSC301 TSC284 284
TSC302TSC303 TSC285 285
TSC304 TSC287 287
TSC305 TSC289 289
TSC306 TSC291 291
TSC307 TSC292 292
TSC308 TSC294 294
TSC309 TSC296 296
TSC310 TSC300 300
TSC311 HOUSEXPS 301
TSC312 MEALS 302
TSC313 TUITION 303
TSC314 CHLDCARE 304
TSC315 COLLEGE 305
TSC316 TRANSPT 306
TSC317 NONE 307
TSC318 FAMLYINC 308
TSC319 SEX 309
220

Appendix B B-41
Private School Teacher Questionnaire (SASS 4B)
1987-88 1990-91 1990-91Variable name Variable name Source code
TSC320 RACE 310TSC321 HISPANIC 312TSC322 BIRTHYR 313TSC323 MARITAL 314TSC324 DEPCHLDN 315TSC325 AGEYOUNG 316TSC326 OTHERDEP 317TSC327 DEPCOUNT 318TSC328 TSC320 320TSC329 TSC321 321TSC330 TSC322 322
221

C-1
Appendix C. Crosswalk of codes for teachers' major field of study
(for undergraduate and advanced degrees) between SASS: 87-88 and SASS: 90-91
Education
General Education
1987-88 1990-91
Pre-elementary/early childhood education 52 01Elementary education 51 03Secondary education 53 04
Subject Area EducationAgricultural education 54 07Art education 55 11Bilingual education 56 13Business, commerce, and distributive education 57 15Crosscultural education' 89English education 59 22English as a second language 58 23Foreign languages education 60 24Home economics education 61 29Indian education (Native American) 88Industrial arts, vocational and technical, trade
and industry education 62 30Mathematics education 63 34Music education 64 38Physical education/health education 65 40Reading education 66 43Religious education 45Science education 67 46Social studies/social sciences education 68 48
Special EducationSpecial education, general 70 67Emotionally disturbed 71 68Mentally retarded 72 69Speech/language impaired' 73 70Deaf and hard-of-hearing' 73 71Visually handicapped' 73 72Orthopedically impaired 73
"--* is used to indicate that this field was not specified in the 1987-88 list of fields.21n 1987-88 this field was combined with training in the education of the hearing and visually handicapped.31n 1987-88 this field was combined with training in the education of the speech and visually handicapped.'In 1987-88 this field was combined with training in the education of speech and hearing impaired.
222
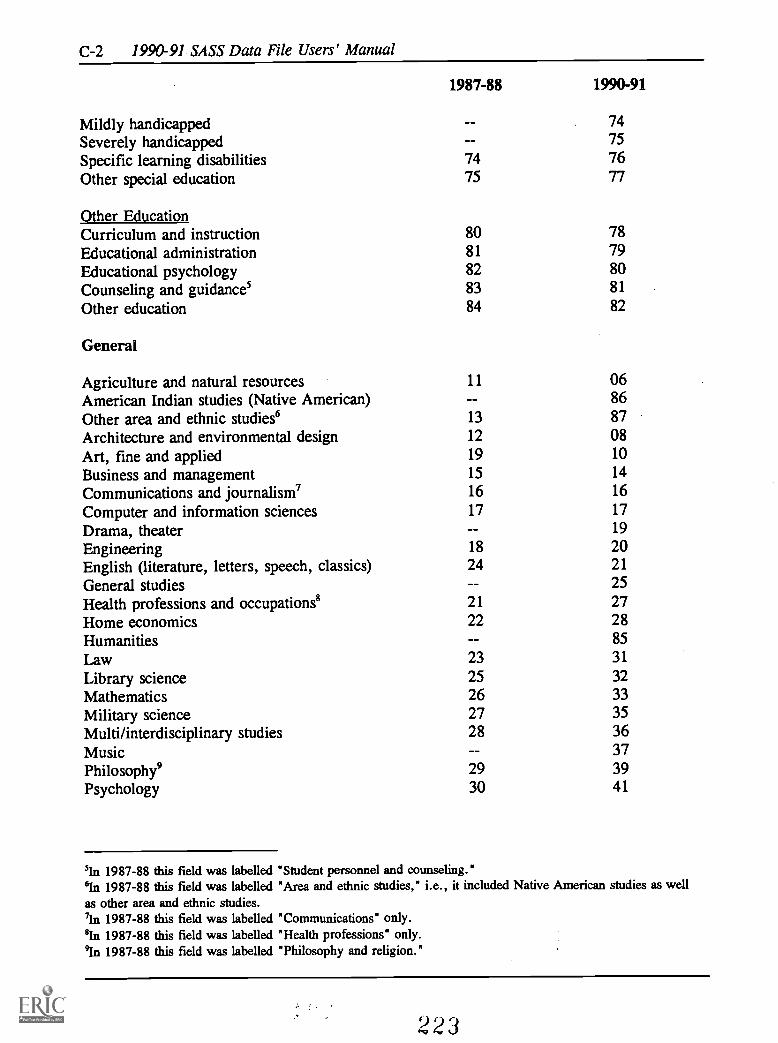
C-2 1990-91 SASS Data File Users' Manual
Mildly handicappedSeverely handicapped
1987-88 1990-91
7475
Specific learning disabilities 74 76Other special education 75 77
Other EducationCurriculum and instruction 80 78Educational administration 81 79Educational psychology 82 80Counseling and guidances 83 81
Other education 84 82
General
Agriculture and natural resources 11 06American Indian studies (Native American) 86
Other area and ethnic studies6 13 87Architecture and environmental design 12 08Art, fine and applied 19 10
Business and management 15 14
Communications and journalism' 16 16
Computer and information sciences 17 17
Drama, theater 19
Engineering 18 20English (literature, letters, speech, classics) 24 21
General studies 25Health professions and occupations' 21 27Home economics 22 28Humanities 85
Law 23 31
Library science 25 32Mathematics 26 33Military science 27 35Multi/interdisciplinary studies 28 36
Music 37Philosophy9 29 39
Psychology 30 41
51n 1987-88 this field was labelled'In 1987-88 this field was labelledas other area and ethnic studies.71n 1987-88 this field was labelled81n 1987-88 this field was labelled9In 1987-88 this field was labelled
"Student personnel and counseling.""Area and ethnic studies," i.e., it included Native American studies as well
"Communications" only."Health professions" only."Philosophy and religion."
223
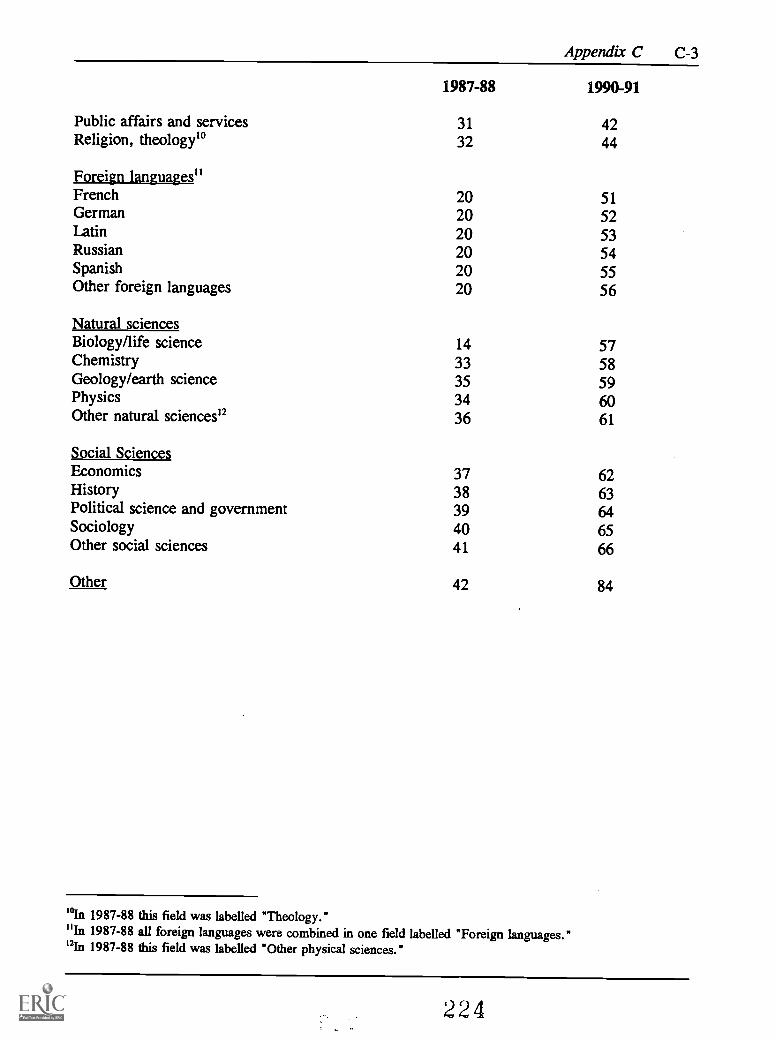
Appendix C
1987-88 1990-91
Public affairs and services 31 42Religion, theology' 32 44
Foreign languages"French 20 51German 20 52Latin 20 53Russian 20 54Spanish 20 55Other foreign languages 20 56
Natural sciencesBiology/life science 14 57Chemistry 33 58Geology/earth science 35 59Physics 34 60Other natural sciences" 36 61
Social SciencesEconomics 37 62History 38 63Political science and government 39 64Sociology 40 65Other social sciences 41 66
Other 42 84
min 1987-88 this field was labelled "Theology.""In 1987-88 all foreign languages were combined in one field labelled "Foreign languages."'In 1987-88 this field was labelled "Other physical sciences."
C-3
224

D-1
Appendix D. SAS Variable list
Teacher Demand and Shortage Survey, Public and Private School Surveys
Physical Name: ZEEWRM.SASS133.YR9091.NCES.SCHOOL.SASZEEWHL. S AS S133.YR9091.NCES S CHOOLDATA
Alphabetic List of Variables
VariableEBCDICPosition Label
AACS 513 ASSN SCH BELONGS TO: AM ASSN CHRISTIANABOLISHD 1094 NMBR FTE K-12 TCH POSITIONS ABOLISHEDABOLSHLB 1131 NMBR FTE LIB/MEDIA SPEC POSITNS ABOLISHDABSNTCH 795 NMBR K-12 TCHRS ABSENT MOST RECENT DAYABSNTST 555 NMBR K-12 STUDENTS ABSENT RECENT DAYACE 510 ASSN SCH BELONGS TO: ACCEL CHRISTIANACHVTEST 655 ADMIT REQUIREMENT: STD ACHIEVEMENT TESTACSI 516 ASSN SCH BELONGS TO: ASSN CHRSTN INTLADDSCTN 898 METHOD TO COVER VACANCIES: ADD SECTIONADMINPGM 1214 DIST HAS PROGRAM FOR ASPIRING SCH ADMINSADMITEST 654 ADMIT REQUIREMENT: ADMISSION TESTADMITREQ 563 SPECIAL ADMISSION REQUIREMENTSAFFIL 29 3-LEVEL RELIGIOUS AFFILIATION CODEAFFILIAT 507 SCHOOL RELIGIOUS ORIENTATION/AFFILIATIONAFFILPUR 505 SCHOOL HAS RELIGIOUS ORIENTATION/AFFILAFTERBAC 797 NMBR K-12 TCHRS HIGHER THAN BACHELOR
DEGAFTERNUM 614 NMBR EXTENDED DAY PROGRAM STUDENTSAFTERPGM 613 EXTENDED DAY PROGRAMS AVAILABLEALLBOARD 503 ALL K-12 STUDENTS BOARD AT THIS SCHOOLAMINDIST 1254 NMBR DIST K-12 STUDENTS: AMIND/ALASKANAMINDSTU 558 NMBR K-12 STUDENTS ARE: AMIND/ALASKANAMINDTCH 781 NMBR K-12 TEACHER ARE: AMERIND/ALASKANAMONTSRI 514 ASSN SCH BELONGS TO: AM MONTESSORI SOCAPIN 1364 PERMANENT ID NMBR ASSGND BY QED AP-APPROVED 1096 NMBR FTE K-12 TCH POSITIONS APPROVEDAPPRVLIB 1133 NMBR FTE LIB/MEDIA SPEC POSITNS APPROVEDASIADIST 1259 NMBR DIST K-12 STUDENTS: ASIAN/PACFC ISLASIANSTU 562 NMBR K-12 STUDENTS ARE: ASIAN/PAC ISLASIANTCH 783 NMBR K-12 TEACHER ARE: ASIAN/PACIFIC ISLASN 511 ASSN SCH BELONGS TO: ALTRNTV SCH NTWKBIA 1308 BIA(BUREAU OF INDIAN AFFAIRS)SCHOOL FLAGBILNGNUM 584 NMBR BILINGUAL ED STUDENTSBILNGPGM 583 BILINGUAL ED AVAILABLEBILNGSCH 518 ASSN SCH BELONGS TO: BILNGUAL SCH ASSC
225
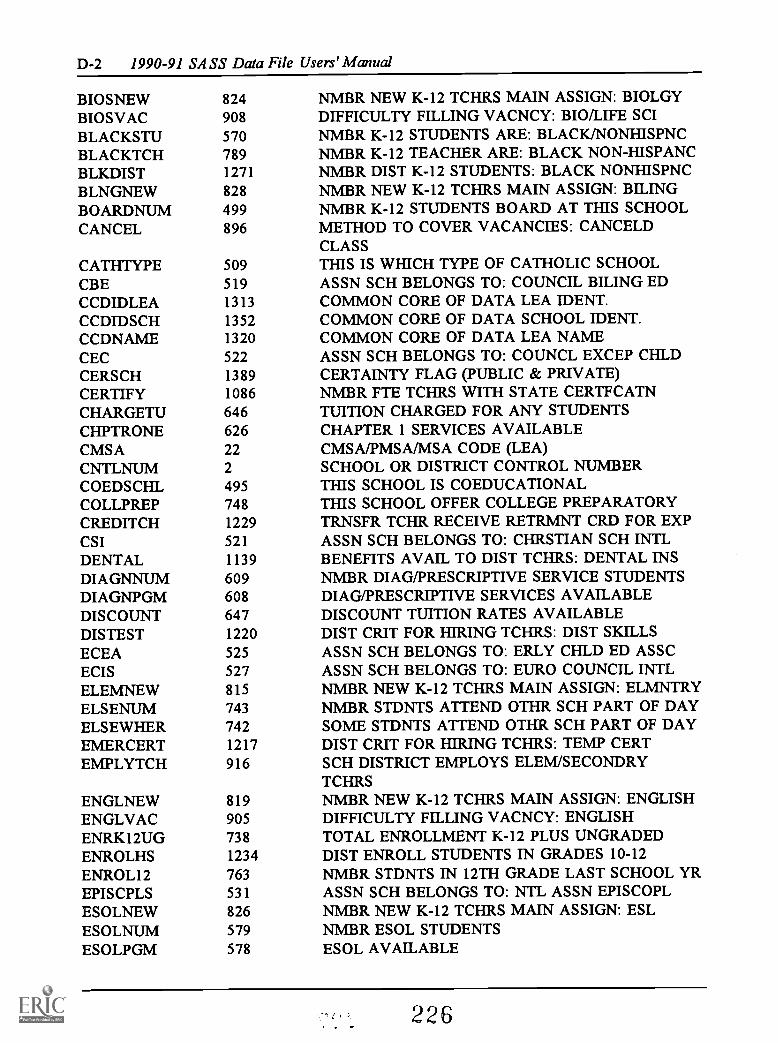
D-2 1990-91 SASS Data File Users' Manual
BIOSNEW 824 NMBR NEW K-12 TCHRS MAIN ASSIGN: BIOLGYBIOSVAC 908 DIFFICULTY FILLING VACNCY: BIO/LIFE SCIBLACKSTU 570 NMBR K-12 STUDENTS ARE: BLACK/NONHISPNCBLACKTCH 789 NMBR K-12 TEACHER ARE: BLACK NON-HISPANCBLKDIST 1271 NMBR DIST K-12 STUDENTS: BLACK NONHISPNCBLNGNEW 828 NMBR NEW K-12 TCHRS MAIN ASSIGN: BILINGBOARDNUM 499 NMBR K-12 STUDENTS BOARD AT THIS SCHOOLCANCEL 896 METHOD TO COVER VACANCIES: CANCELD
CLASSCATHTYPE 509 THIS IS WHICH TYPE OF CATHOLIC SCHOOLCBE 519 ASSN SCH BELONGS TO: COUNCIL BILING EDCCDIDLEA 1313 COMMON CORE OF DATA LEA IDENT.CCDIDSCH 1352 COMMON CORE OF DATA SCHOOL IDENT.CCDNAME 1320 COMMON CORE OF DATA LEA NAMECEC 522 ASSN SCH BELONGS TO: COUNCL EXCEP CHLDCERSCH 1389 CERTAINTY FLAG (PUBLIC & PRIVATE)CERTIFY 1086 NMBR FTE TCHRS WITH STATE CERTFCATNCHARGETU 646 TUITION CHARGED FOR ANY STUDENTSCHPTRONE 626 CHAPTER 1 SERVICES AVAILABLECMSA 22 CMSA/PMSA/MSA CODE (LEA)CNTLNUM 2 SCHOOL OR DISTRICT CONTROL NUMBERCOEDSCHL 495 THIS SCHOOL IS COEDUCATIONALCOLLPREP 748 THIS SCHOOL OFFER COLLEGE PREPARATORYCREDITCH 1229 TRNSFR TCHR RECEIVE RETRMNT CRD FOR EXPCSI 521 ASSN SCH BELONGS TO: CHRSTIAN SCH INTLDENTAL 1139 BENEFITS AVAIL TO DIST TCHRS: DENTAL INSDIAGNNUM 609 NMBR DIAG/PRESCRIPTIVE SERVICE STUDENTSDIAGNPGM 608 DIAG/PRESCRIPTIVE SERVICES AVAILABLEDISCOUNT 647 DISCOUNT TUITION RATES AVAILABLEDISTEST 1220 DIST CRIT FOR HIRING TCHRS: DIST SKILLSECEA 525 ASSN SCH BELONGS TO: ERLY CHLD ED ASSCECIS 527 ASSN SCH BELONGS TO: EURO COUNCIL INTLELEMNEW 815 NMBR NEW K-12 TCHRS MAIN ASSIGN: ELMNTRYELSENUM 743 NMBR STDNTS ATTEND OTHR SCH PART OF DAYELSEWHER 742 SOME STDNTS ATTEND OTHR SCH PART OF DAYEMERCERT 1217 DIST CRIT FOR HIRING TCHRS: TEMP CERTEMPLYTCH 916 SCH DISTRICT EMPLOYS ELEM/SECONDRY
TCHRSENGLNEW 819 NMBR NEW K-12 TCHRS MAIN ASSIGN: ENGLISHENGLVAC 905 DIFFICULTY FILLING VACNCY: ENGLISHENRK12UG 738 TOTAL ENROLLMENT K-12 PLUS UNGRADEDENROLHS 1234 DIST ENROLL STUDENTS IN GRADES 10-12ENROL12 763 NMBR STDNTS IN 12TH GRADE LAST SCHOOL YREPISCPLS 531 ASSN SCH BELONGS TO: NTL ASSN EPISCOPLESOLNEW 826 NMBR NEW K-12 TCHRS MAIN ASSIGN: ESLESOLNUM 579 NMBR ESOL STUDENTSESOLPGM 578 ESOL AVAILABLE
226

Appendix D D-3
ESOLVAC 909 DIFFICULTY FILLING VACNCY: ENGL SEC LANGEVALTCH 912 FORMAL TCHR EVALUATION PROGRAM THIS
SCHEXISTS 914 SCHOOL DISTRICT NO LONGER EXISTSEXPANDSZ 897 METHOD TO COVER VACANCIES: EXPND CLASSZF_AACS 1412 IMPUTATION FLAG FOR AACSF_ABOLIS 1667 IMPUTATION FLAG FOR ABOLISHDF_ABOLSH 1676 IMPUTATION FLAG FOR ABOLSHLBF_ABSNTC 1556 IMPUTATION FLAG FOR ABSNTCHF ABSNTS 1450 IMPUTATION FLAG FOR ABSNTSTFACE 1409 IMPUTATION FLAG FOR ACEFIACHVTE 1493 IMPUTATION FLAG FOR ACHVTESTF_ACSI 1415 IMPUTATION FLAG FOR ACSIF_ADDSCT 1612 IMPUTATION FLAG FOR ADDSCTNF_ADMINP 1729 IMPUTATION FLAG FOR ADMINPGMF_ADMITE 1492 IMPUTATION FLAG FOR ADMITESTF ADMITR 1491 IMPUTATION FLAG FOR ADMITREQF AFFILI 1407 IMPUTATION FLAG FOR AFFILIATFIAFFILP 1405 IMPUTATION FLAG FOR AFFILPURF_AFTERB 1557 IMPUTATION FLAG FOR AFTERBACF_AFTERN 1471 IMPUTATION FLAG FOR AFTERNUMF_AFTERP 1470 IMPUTATION FLAG FOR AFTERPGMF_ALLBOA 1404 IMPUTATION FLAG FOR ALLBOARDF_AMINDI 1757 IMPUTATION FLAG FOR AMINDISTF_AMINDS 1451 IMPUTATION FLAG FOR AMINDSTUF_AMINDT 1551 IMPUTATION FLAG FOR AMINDTCHF AMONTS 1413 IMPUTATION FLAG FOR AMONTSRIF APPROV 1668 IMPUTATION FLAG FOR APPROVEDF_APPRVL 1677 IMPUTATION FLAG FOR APPRVLIBF_ASIADI 1758 INPUTATION FLAG FOR ASIADISTF_ASIANS 1452 IMPUTATION FLAG FOR ASIANSTUF ASIANT 1552 IMPUTATION FLAG FOR ASIANTCHF ASN 1410 IMPUTATION FLAG FOR ASNFIBILNGN 1459 IMPUTATION FLAG FOR BILNGNUMF_BILNGP 1458 IMPUTATION FLAG FOR BILNGPGMF_BILNGS 1417 IMPUTATION FLAG FOR BILNGSCHF_BIOSNE 1568 IMPUTATION FLAG FOR BIOSNEWF_BIOSVA 1622 IMPUTATION FLAG FOR BIOSVACF_BLACKS 1454 IMPUTATION FLAG FOR BLACKSTUF_BLACKT 1554 IMPUTATION FLAG FOR BLACKTCHF_BLKDIS 1760 IMPUTATION FLAG FOR BLKDISTF_BLNGNE 1570 IMPUTATION FLAG FOR BLNGNEWF_BOARDN 1403 IMPUTATION FLAG FOR BOARDNUMF CANCEL 1610 IMPUTATION FLAG FOR CANCELF CATHTY 1408 IMPUTATION FLAG FOR CATHTYPEF CBE 1418 IMPUTATION FLAG FOR CBEF CEC 1421 IMPUTATION FLAG FOR CEC
227

D-4 1990-91 SASS Data File Users' Manual
F CERTIFF CHARGEF CHPTROF COEDSCF COLLPRF CREDITF CSIFIDENTALF_DIAGNNF_DIAGNPF_DISCOUF_DISTESF_ECEAF_ECISF_ELEMNEF_ELSENUF_ELSEWHF_EMERCEF_EMPLYTF_ENGLNEF_ENGLVAF_ENROL1F_ENROLHF_EPISCPF_ES OLNEF_ESOLNUF_ES OLPGF_ESOLVAF_EVALTCF_EXISTSF_EXPANDF_FAMLYRF_FOLLOWF_FORGNVF_FREELNF_FRIENDF_FTAIDEF_FTALLOF_FTAS SIF_FTGUIDF_FTHEADF_FTLIBRF_FTMEDIF_FTPROSF_FTVTCOF_FULLCEF_FULTEA
1665 IMPUTATION FLAG FOR1488 IMPUTATION FLAG FOR1480 IMPUTATION FLAG FOR1401 IMPUTATION FLAG FOR1539 IMPUTATION FLAG FOR1744 IMPUTATION FLAG FOR1420 IMPUTATION FLAG FOR1679 IMPUTATION FLAG FOR1469 IMPUTATION FLAG FOR1468 IMPUTATION FLAG FOR1489 IMPUTATION FLAG FOR1735 IMPUTATION FLAG FOR1424 IMPUTATION FLAG FOR1426 IMPUTATION FLAG FOR1563 IMPUTATION FLAG FOR1537 IMPUTATION FLAG FOR1536 IMPUTATION FLAG FOR1732 IMPUTATION FLAG FOR1630 IMPUTATION FLAG FOR1565 IMPUTATION FLAG FOR1619 IMPUTATION FLAG FOR1749 IMPUTATION FLAG FOR1545 IMPUTATION FLAG FOR1430 IMPUTATION FLAG FOR1569 IMPUTATION FLAG FOR1457 IMPUTATION FLAG FOR1456 IMPUTATION FLAG FOR1623 IMPUTATION FLAG FOR1626 IMPUTATION FLAG FOR1628 IMPUTATION FLAG FOR1611 IMPUTATION FLAG FOR1396 IMPUTATION FLAG FOR1629 IMPUTATION FLAG FOR1624 IMPUTATION FLAG FOR1484 IMPUTATION FLAG FOR1428 IMPUTATION FLAG FOR1600 IMPUTATION FLAG FOR1604 IMPUTATION FLAG FOR1590 IMPUTATION FLAG FOR1592 IMPUTATION FLAG FOR1588 IMPUTATION FLAG FOR1596 IMPUTATION FLAG FOR1602 IMPUTATION FLAG FOR1598 IMPUTATION FLAG FOR1594 IMPUTATION FLAG FOR1731 IMPUTATION FLAG FOR1548 IMPUTATION FLAG FOR
CERTIFYCHARGETUCHPTRONECOEDSCHLCOLLPREPCREDITCHCSIDENTALDIAGNNUMDIAGNPGMDISCOUNTDISTESTECEAECISELEMNEWELSENUMELSEWHEREMERCERTEMPLYTCHENGLNEWENGLVACENROL12ENROLHSEPISCPLSESOLNEWESOLNUMESOLPGMESOLVACEVALTCHEXISTSEXPANDSZFAMLYRESFOLLOWUPFORGNVACFREELNCHFRIENDSFTAIDESFTALLOTHFTASSISTFTGUIDESFTHEADSFTLIBRNSFTMEDIAFTPROSTFFTVTCOUNFULLCERTFULTEACH
228

Appendix D D-5
F_GENERA 1543F_GENLNU 1544F_GENLVA 1617F_GIFTDN 1467F_GIFTDP 1466F_GRADAP 1547F_GRADNU 1546F_HBREWD 1439F_HIGHSA 1693F_HISPDI 1759F_HISPNS 1453F_HISPNT 1553F_HOUSIN 1682FINCENT 1702F_INCNTC 1703F_INCNTI 1705F_INCNTS 1704F_INCRED 1740F_INPURC 1741F_INTRVI 1497F_JESUIT 1436F_KGLEND 1477F_KGNUMD 1476F_KGOFFE 1475F_LABSCH 1434F_LAIDOF 1671F_LANGNE 1571F_LASTKG 1636F_LASTOT 1644F_LASTPK 1634F_LASTPS 1642F_LASTUG 1632F_LASTYE 1398F_LAS1_6 1638F_LES SQU 1616F_LESS10 1559F_LESS21 1560F_LESS3E 1558F_LFTBIL 1584F_LFTBIO 1582F_LFTENG 1579F_LFTESO 1583F_LFTGEN 1577F_LFTLAN 1585F_LFTMAT 1580F_LFTOTH 1587F LFTPHY 1581
IMPUTATION FLAG FORIMPUTATION FLAG FORIMPUTATION FLAG FORIMPUTATION FLAG FORIMPUTATION FLAG FORIMPUTATION FLAG FORIMPUTATION FLAG FORIMPUTATION FLAG FORIMPUTATION FLAG FORIMPUTATION FLAG FORIMPUTATION FLAG FORIMPUTATION FLAG FORIMPUTATION FLAG FORIMPUTATION FLAG FORIMPUTATION FLAG FORIMPUTATION FLAG FORIMPUTATION FLAG FORIMPUTATION FLAG FORIMPUTATION FLAG FORIMPUTATION FLAG FORIMPUTATION FLAG FORIMPUTATION FLAG FORIMPUTATION FLAG FORIMPUTATION FLAG FORIMPUTATION FLAG FORIMPUTATION FLAG FORIMPUTATION FLAG FORIMPUTATION FLAG FORIMPUTATION FLAG FORIMPUTATION FLAG FORIMPUTATION FLAG FORIMPUTATION FLAG FORIMPUTATION FLAG FORIMPUTATION FLAG FORIMPUTATION FLAG FORIMPUTATION FLAG FORIMPUTATION FLAG FORIMPUTATION FLAG FORIMPUTATION FLAG FORIMPUTATION FLAG FORIMPUTATION FLAG FORIMPUTATION FLAG FORIMPUTATION FLAG FORIMPUTATION FLAG FORIMPUTATION FLAG FORIMPUTATION FLAG FORIMPUTATION FLAG FOR
GENERALGENLNUMGENLVACGIFTDNUMGIFTDPGMGRADAPLYGRADNUMHBREWDAYHIGHSALHISPDISTHISPNSTUHISPNTCHHOUSINGINCENTIVINCNTCSHINCNTINCINCNTSTPINCREDITINPURCHINTRVIEWJESUITSKGLENDAYKGNUMDAYKGOFFERLABSCHLSLAIDOFFLANGNEWLASTKGLASTTOTLASTPKLASTPSLASTUGLASTYEARLAST1_6LESSQUALLESS10EXLESS21EXLESS3EXPLFTBILNGLFTBIOLFTENGLLFTESOLLFTGENLLFTLANGLFTMATHLFTOTHERLFTPHYS
229
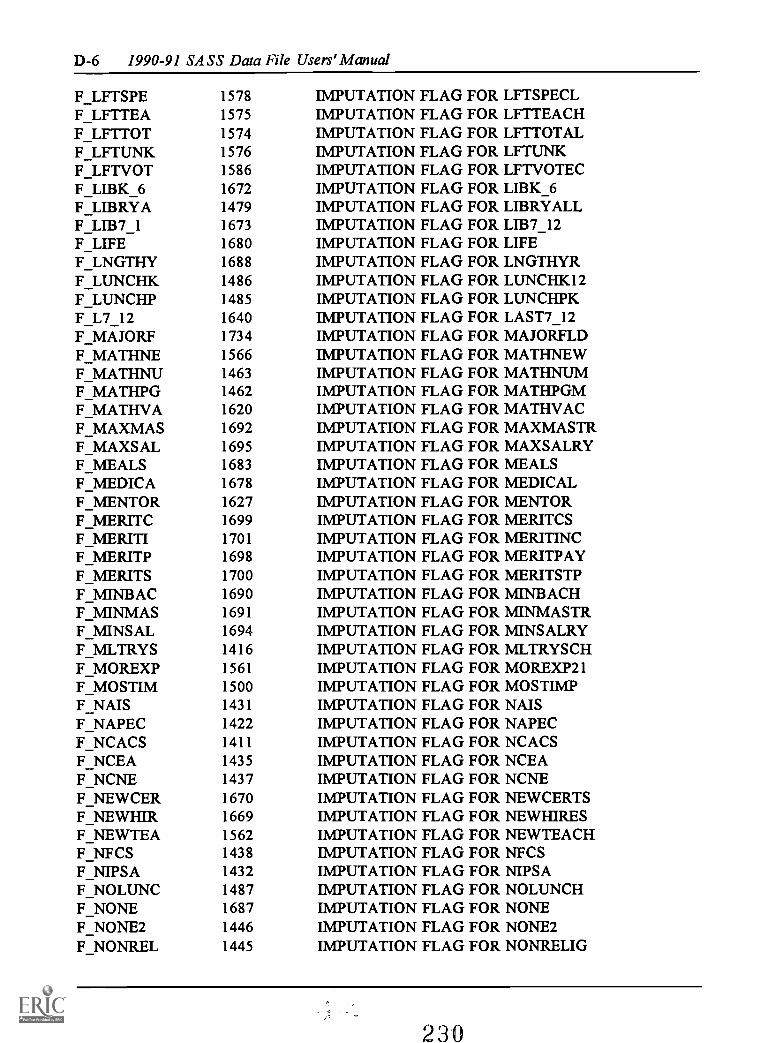
D-6 1990-91 SASS Data File Users' Manual
F_LFTSPE 1578F_LFTTEA 1575F_LFTTOT 1574F_LFTUNK 1576F_LFTVOT 1586F_LIBK_6 1672F_LIBRYA 1479F_LIB7_1 1673F_LIFE 1680F_LNGTHY 1688F_LUNCIIK 1486F_LUNCHP 1485F_L7_12 1640F_MAJORF 1734F_MATHNE 1566F_MATHNU 1463F_MATHPG 1462F_MATHVA 1620F_MAXMAS 1692F_MAXS AL 1695F_MEALS 1683F_MEDICA 1678F_MENTOR 1627F_MERITC 1699F_MERITI 1701F_MERITP 1698F_MERITS 1700F_MINBAC 1690F_MINMAS 1691F_MINSAL 1694F_MLTRYS 1416F_MOREXP 1561F_MOSTIM 1500F_NAIS 1431F_NAPEC 1422F_NCACS 1411F_NCEA 1435F_NCNE 1437F_NEWCER 1670F_NEWHIR 1669F_NEWTEA 1562F_NFCS 1438F_NIP S A 1432F_NOLUNC 1487F_NONE 1687F_NONE2 1446F_NONREL 1445
IMPUTATIONIMPUTATIONIMPUTATIONIMPUTATIONIMPUTATIONIMPUTATIONIMPUTATIONIMPUTATIONIMPUTATIONIMPUTATIONIMPUTATIONIMPUTATIONIMPUTATIONIMPUTATIONIMPUTATIONIMPUTATIONIMPUTATIONIMPUTATIONIMPUTATIONIMPUTATIONIMPUTATIONIMPUTATIONIMPUTATIONIMPUTATIONIMPUTATIONIMPUTATIONIMPUTATIONIMPUTATIONIMPUTATIONIMPUTATIONIMPUTATIONIMPUTATIONIMPUTATIONIMPUTATIONIMPUTATIONIMPUTATIONIMPUTATIONIMPUTATIONIMPUTATIONIMPUTATIONIMPUTATIONIMPUTATIONIMPUTATIONIMPUTATIONIMPUTATIONIMPUTATIONIMPUTATION
FLAG FOR LFTSPECLFLAG FOR LFTTEACHFLAG FOR LFTTOTALFLAG FOR LFTUNKFLAG FOR LFTVOTECFLAG FOR LIBK_6FLAG FOR LIBRYALLFLAG FOR LIB7 12FLAG FOR LIFEFLAG FOR LNGTHYRFLAG FOR LUNCHK12FLAG FOR LUNCHPKFLAG FOR LAST7_12FLAG FOR MAJORFLDFLAG FOR MATHNEWFLAG FOR MATHNUMFLAG FOR MATHPGMFLAG FOR MATHVACFLAG FOR MAXMASTRFLAG FOR MAXSALRYFLAG FOR MEALSFLAG FOR MEDICALFLAG FOR MENTORFLAG FOR MERITCSFLAG FOR MERITINCFLAG FOR MERITPAYFLAG FOR MERITSTPFLAG FOR MINBACHFLAG FOR MINMASTRFLAG FOR MINSALRYFLAG FOR MLTRYSCHFLAG FOR MOREXP21FLAG FOR MOSTIMPFLAG FOR NAISFLAG FOR NAPECFLAG FOR NCACSFLAG FOR NCEAFLAG FOR NCNEFLAG FOR NEWCERTSFLAG FOR NEWHIRESFLAG FOR NEWTEACHFLAG FOR NFCSFLAG FOR NIPSAFLAG FOR NOLUNCHFLAG FOR NONEFLAG FOR NONE2FLAG FOR NONRELIG
230

Appendix D D-7
F_NOWKG 1635F_NOWPK 1633F_NOWPS 1641F_NOWTOT 1643F_NOWKG 1631F_NOW1_6 1637F_NTEPAS 1738F_NUMBKG 1509F_NUMBPK 1507F_NUMBPS 1535F_NUMBR3 1515F_NUMBR4 1517F_NUMBR5 1519F_NUMBR6 1521F_NUMBR7 1523F_NUMBR8 1525F_NUMBR9 1527F_NUMBUG 1503F_NUMB1 1511F_NUMB10 1529F_NUMB11 1531F_NUMB12 1533F_NUMB 2 1513F_NUMDAY 1447F_NUMHOU 1448F_NUMMNT 1449F_NURSEN 1505F_NURSEO 1504F_N7_12 1639F OFFER3 1514F OFFER4 1516F OFFERS 1518F OFFER6 1520F OFFER7 1522F OFFER8 1524F OFFER9 1526F OFFRKG 1508F OFFRPK 1506F OFFRPS 1534F OFFRUG 1502F OFFR1 1510F OFFR10 1528F OFFR11 1530F OFFR12 1532F OFFR2 1512F ONESVK 1482F ONESVP 1481
IMPUTATIONIMPUTATIONIMPUTATIONIMPUTATIONIMPUTATIONIMPUTATIONIMPUTATIONIMPUTATIONIMPUTATIONIMPUTATIONIMPUTATIONIMPUTATIONIMPUTATIONIMPUTATIONIMPUTATIONIMPUTATIONIMPUTATIONIMPUTATIONIMPUTATIONIMPUTATIONIMPUTATIONIMPUTATIONIMPUTATIONIMPUTATIONIMPUTATIONIMPUTATIONIMPUTATIONIMPUTATIONIMPUTATIONIMPUTATIONIMPUTATIONIMPUTATIONIMPUTATIONIMPUTATIONIMPUTATIONIMPUTATIONIMPUTATIONIMPUTATIONIMPUTATIONIMPUTATIONIMPUTATIONIMPUTATIONIMPUTATIONIMPUTATIONIMPUTATIONIMPUTATIONIMPUTATION
FLAG FOR NOWKGFLAG FOR NOWPKFLAG FOR NOWPSFLAG FOR NOWTOTFLAG FOR NOWUGFLAG FOR NOW1_6FLAG FOR NTEPASSFLAG FOR NUMBRKGFLAG FOR NUMBRPKFLAG FOR NUMBRPSFLAG FOR NUMBR3FLAG FOR NUMBR4FLAG FOR NUMBR5FLAG FOR NUMBR6FLAG FOR NUMBR7FLAG FOR NUMBR8FLAG FOR NUMBR9FLAG FOR NUMBRUGFLAG FOR NUMBR1FLAG FOR NUMBR10FLAG FOR NUMBR11FLAG FOR NUMBR12FLAG FOR NUMBR2FLAG FOR NUMDAYSFLAG FOR NUMHOURSFLAG FOR NUMMNTEFLAG FOR NURSENUMFLAG FOR NURSEOFFFLAG FOR NOW7_12FLAG FOR OFFER3FLAG FOR OFFER4FLAG FOR OFFERSFLAG FOR OFFER6FLAG FOR OFFER?FLAG FOR OFFER8FLAG FOR OFFER9FLAG FOR OFFERKGFLAG FOR OFFERPKFLAG FOR OFFERPSFLAG FOR OFFERUGFLAG FOR OFFER1FLAG FOR OFFER10FLAG FOR OFFER11FLAG FOR OFFER12FLAG FOR OFFER2FLAG FOR ONESVK12FLAG FOR ONESVPK
231

D-8 1990-91 SASS Data File Users' Manual
F ONETEAF OPERATF ORALRBF OTHBILF OTHCHRF OTHECEF OTHERCF OTHERNF OTHINDF OTHINTF OTHJEWF OTHIVITSF_OTHRDIF OTHRELF OTHRKGF OTHRUGF OTHXPCF OTH1 6F OTH712F OUTCREF OUTPURF_OWNLIBF_PARTEAF_PCTMALFPENSIOF_PGMTYPF_PHONEIF_PHYSNEF_PHYSVAF_PKLENDF_PKNUMDF_PKOFFEF_PREPNUF_PRTEACF_PTAIDEF_PTALLOF_PTASSIF_PTGUIDF_PTHEADF_PTLIBRF_PTMEDIF_PTPROSF_PTVTCOF_PURCHAF_PVTCERF_READNUF_READPG
14831393144214191443142517481573143314271441141416451444164716461423164816491742174314781549140216811400139415671621147414731472154016151601160515911593158915971603159915951747173014611460
IMPUTATIONIMPUTATIONIMPUTATIONIMPUTATIONIMPUTATIONIMPUTATIONIMPUTATIONIMPUTATIONIMPUTATIONIMPUTATIONIMPUTATIONIMPUTATIONIMPUTATIONIMPUTATIONIMPUTATIONIMPUTATIONIMPUTATIONIMPUTATIONIMPUTATIONIMPUTATIONIMPUTATIONIMPUTATIONIMPUTATIONIMPUTATIONIMPUTATIONIMPUTATIONIMPUTATIONIMPUTATIONIMPUTATIONIMPUTATIONIMPUTATIONIMPUTATIONIMPUTATIONIMPUTATIONIMPUTATIONIMPUTATIONIMPUTATIONIMPUTATIONIMPUTATIONIMPUTATIONIMPUTATIONIMPUTATIONIMPUTATIONIMPUTATIONIMPUTATIONIMPUTATIONIMPUTATION
FLAG FOR ONETEACHFLAG FOR OPERATEFLAG FOR ORALRBTSFLAG FOR OTHBILNGFLAG FOR OTHCHRSTFLAG FOR OTHECEFLAG FOR OTHERCRDFLAG FOR OTHERNEWFLAG FOR OTHINDPVFLAG FOR OTHINTLFLAG FOR OTHJEWSHFLAG FOR OTHMTSRIFLAG FOR OTHRDISTFLAG FOR OTHRELIGFLAG FOR OTHRKGFLAG FOR OTHRUGFLAG FOR OTHXPCHLFLAG FOR OTHR1 6FLAG FOR OTHR7_12FLAG FOR OUTCREDTFLAG FOR OUTPURCHFLAG FOR OWNLIBRYFLAG FOR PARTEACHFLAG FOR PCTMALEFLAG FOR PENSIONFLAG FOR PGMTYPEFLAG FOR PHONEINTFLAG FOR PHYSNEWFLAG FOR PHYSVACFLAG FOR PKLENDAYFLAG FOR PKNUMDAYFLAG FOR PKOFFERFLAG FOR PREPNUMFLAG FOR PRTEACHFLAG FOR PTAIDESFLAG FOR PTALLOTHFLAG FOR PTASSISTFLAG FOR PTGUIDESFLAG FOR PTHEADSFLAG FOR PTLIBRNSFLAG FOR PTMEDIAFLAG FOR PTPROSTFFLAG FOR PTVTCOUNFLAG FOR PURCHASEFLAG FOR PVTCERTFLAG FOR READNUMFLAG FOR READPGM
232

Appendix D D-9
F_REASSI 1613F_REBIO 1724F_RECMND 1498F_RECOMP 1722F RECORD 1494F_RELANG 1726F_RELIGA 1499F_RELIGD 1406F_REMATH 1721F_REOTHE 1728F_REPHYS 1723F_RESOL 1725F_RESPEC 1720F_RETIRE 1739F RETRAI 1719F_REVOTE 1727F _ROLLOV 1746F SALSCH 1689F SAMEOR 1745F SCHECH 1440F SCHLEV 1399F SCHOLA 1685F SCREEN 1395F SECNDI 1501F SERVIC 1697F SHORTA 1706F SHORTC 1707F SHORTI 1709F SHORTS 1708F SHRTBI 1714F SHRTCO 1712F SHRTES 1715F SHRTLA 1716F SHRTMA 1711F SHRTOT 1718F SHRTPH 1713F SHRTSP 1710F SHRTVO 1717F SPCLNE 1564F SPCLNU 1465F SPECIA 1495F SPECLP 1464F SPECLV 1618F SRVHRS 1767F SRVYMI 1768F STABAS 1736F STASUB 1737
IMPUTATION FLAG FORIMPUTATION FLAG FORIMPUTATION FLAG FORIMPUTATION FLAG FORIMPUTATION FLAG FORIMPUTATION FLAG FORIMPUTATION FLAG FORIMPUTATION FLAG FORIMPUTATION FLAG FORIMPUTATION FLAG FORIMPUTATION FLAG FORIMPUTATION FLAG FORIMPUTATION FLAG FORIMPUTATION FLAG FORIMPUTATION FLAG FORIMPUTATION FLAG FORIMPUTATION FLAG FORIMPUTATION FLAG FORIMPUTATION FLAG FORIMPUTATION FLAG FORIMPUTATION FLAG FORIMPUTATION FLAG FORIMPUTATION FLAG FORIMPUTATION FLAG FORIMPUTATION FLAG FORIMPUTATION FLAG FORIMPUTATION FLAG FORIMPUTATION FLAG FORIMPUTATION FLAG FORIMPUTATION FLAG FORIMPUTATION FLAG FORIMPUTATION FLAG FORIMPUTATION FLAG FORIMPUTATION FLAG FORIMPUTATION FLAG FORIMPUTATION FLAG FORIMPUTATION FLAG FORIMPUTATION FLAG FORIMPUTATION FLAG FORIMPUTATION FLAG FORIMPUTATION FLAG FORIMPUTATION FLAG FORIMPUTATION FLAG FORIMPUTATION FLAG FORIMPUTATION FLAG FORIMPUTATION FLAG FORIMPUTATION FLAG FOR
REASSIGNREBIORECMNDSRECOMPRECORDSRELANGRELIGAFFRELIGDENREMATHREOTHERREPHYSRESOLRESPECLRETIREMTRETRAINGREVOTECROLLOVERSALSCHEDSAMEORGSCHECHTRSCHLEVELSCHOLARSCREENBSECNDIMPSERVICESHORTAGESHORTCSHSHORTINCSHORTSTPSHRTBIOSHRTCOMPSHRTESOLSHRTLANGSHRTMATHSHRTOTHRSHRTPHYSSHRTSPECSHRTVOCSPCLNEWSPCLNUMSPECIALSPECLPGMSPECLVACSRVHRSSRVYMINSSTABASICSTASUBJ
233

D-10 1990-91 SASS Data File Users' Manual
F SUBTEA 1614F SVNTHD 1429F_TALENT 1496F_TCHAMI 1762F_TCHASI 1763F_TCHBLA 1765F_TCHISP 1764F_TCHWHI 1766FTEACHE 1733F_TECHNE 1572F_TECHNU 1542F_THISYE 1397F_TKGLAS 1655F_TKGNOW 1654F_TOTLIB 1674F TOTTEA 1550F_TPKLAS 1653F_TPKNOW 1652F_TPKLAS 1661F_TPKNOW 1660F_TRANSP 1684F_TTOTK_ 1664F_TTOTLA 1663F_TTOTNO 1662F_TUGLAS 1651F_TUGNOW 1650F_TUITIN 1490F_TUMO 1686F_TWELFT 1538F_T1_6LA 1657F_T1_6NO 1656F T7 12L 1659F_T7 12N 1658F_UNFILL 1609F UNPAID 1696F VACANC 1666F VACNCY 1608F_VACNTL 1675F_VOCTEC 1541F_VOLNTN 1607F_VOLNTS 1606F_VOTECV 1625F WHITES 1455F_WHITET 1555F_WHTDIS 1761
F_YRSCOM 1752F YRSENG 1750
IMPUTATION FLAG FORIMPUTATION FLAG FORIMPUTATION FLAG FORIMPUTATION FLAG FORIMPUTATION FLAG FORIMPUTATION FLAG FORIMPUTATION FLAG FORIMPUTATION FLAG FORIMPUTATION FLAG FORIMPUTATION FLAG FORIMPUTATION FLAG FORIMPUTATION FLAG FORIMPUTATION FLAG FORIMPUTATION FLAG FORIMPUTATION FLAG FORIMPUTATION FLAG FORIMPUTATION FLAG FORIMPUTATION FLAG FORIMPUTATION FLAG FORIMPUTATION FLAG FORIMPUTATION FLAG FORIMPUTATION FLAG FORIMPUTATION FLAG FORIMPUTATION FLAG FORIMPUTATION FLAG FORIMPUTATION FLAG FORIMPUTATION FLAG FORIMPUTATION FLAG FORIMPUTATION FLAG FORIMPUTATION FLAG FORIMPUTATION FLAG FORIMPUTATION FLAG FORIMPUTATION FLAG FORIMPUTATION FLAG FORIMPUTATION FLAG FORIMPUTATION FLAG FORIMPUTATION FLAG FORIMPUTATION FLAG FORIMPUTATION FLAG FORIMPUTATION FLAG FORIMPUTATION FLAG FORIMPUTATION FLAG FORIMPUTATION FLAG FORIMPUTATION FLAG FORIMPUTATION FLAG FORIMPUTATION FLAG FORIMPUTATION FLAG FOR
SUBTEACHSVNTHDAYTALENTTCHAMINDTCHASIANTCHBLACKTCHISPNCTCHWHITETEACHEDTECHNEWTECHNUMTHISYEARTKGLASTTKGNOWTOTLIBRYTOTTEACHTPKLASTTPKNOWTPSLASTTPSNOWTRANSPTTTOTK_12TTOTLASTTTOTNOWTUGLASTTUGNOWTUITINTUITIONTWELFTHT1 6LA STT1 6NOWT7_12LSTT7_12NOWUNFILLEDUNPAIDVACANCYVACNCYVACNTLIBVOCTECHVOLNTNUMVOLNTSVCVOTECVACWHITESTUWHITETCHWHTDISTYRSCOMPYRSENGL
234

Appendix D D-11
F_YRSLAN 1755 IMPUTATION FLAG FOR YRSLANGF_YRSMAT 1751 IMPUTATION FLAG FOR YRSMATHF_YRSSCI 1754 IMPUTATION FLAG FOR YRSSCIF_YRSSOC 1753 IMPUTATION FLAG FOR YRSSOCF_YRS3_4 1756 IMPUTATION FLAG FOR YRS3_4FAMLYRES 484 SCHOOL LOCATED IN PRIVATE RESIDENCEFOLLOWUP 915 TELEPHONE FOLLOWUPFORGNVAC 910 DIFFICULTY FILLING VACNCY: FOREIGN LANGFREELNCH 637 STUDENTS ELIGIBLE FOR FREE LUNCHESFRIENDS 529 ASSN SCH BELONGS TO: FRNDS COUNCIL EDFTAIDES 876 NMBR FULL-TIME CLASSROOM TEACHER AIDESFTALLOTH 885 NMBR FULL-TIME OTHER NON-INSTRUC STAFFFTASSIST 857 NMBR FULL-TIME ASSISTANT PRINCIPALSFTGUIDES 861 NMBR FULL-TIME GUIDANCE COUNSELORSFTHEADS 855 NMBR FULL-TIME PRINCIPALSFTLIBRNS 868 NMBR FULL-TIME LIBRARIANS/MEDIA STAFFFTMEDIA 881 NMBR FULL-TIME LBRARY/MEDIA CENTER AIDESFTPROSTF 872 NMBR FULL-TIME OTHER PROFFESSIONAL STAFFFTVTCOUN 865 NUMBR FULL-TIME VOCATIONAL COUNSELORSFULLCERT 1216 DIST CRIT FOR HIRING TCHRS: STD ST CERTFULTEACH 772 NMBR FULL-TIME K-12 TEACHERSGENERAL 758 THIS SCHOOL OFFER GENERAL PROGRAMGENLNUM 759 NMBR 10-12 STDNTS IN GENERAL CLASSESGENLVAC 903 DIFFICULTY FILLING VACNCY: ELEMENTARYGIFTDNUM 604 NMBR GIFTED/TALENTED PROGRAM STUDENTSGIFTDPGM 603 GIFTED/TALENTED PROGRAM AVAILABLEGRADAPLY 769 NMBR LAST YR GRADS APPLIED TO 2/4 COLLGEGRADNUM 766 NMBR 12TH GRADE STDNTS GRADUATED LASTHBREWDAY 540 ASSN SCH BELONGS TO: NTL SOC HEBREW DAYHIGHSAL 1166 MAX YR BSE SAL PER SCHED: HIGHEST STEPHISPDIST 1265 NMBR DIST K-12 STUDENTS: HISPANICHISPNSTU 566 NMBR K-12 STUDENTS ARE: HISPANICHISPNTCH 786 NMBR K-12 TEACHER ARE: HISPANICHOUSING 1142 BENEFITS AVAIL TO DIST TCHRS: HOUSINGINCENTIV 1187 DIST USE INCNTVS TO RECRUIT/RETAIN TCHRSINCNTCSH 1188 PAY INCNTVS OFFERED TCHRS: CASH BONUSINCNTINC 1190 PAY INCNTVS OFFERED TCHRS: OTHR SAL INCRINCNTSTP 1189 PAY INCNTVS OFFERED TCHRS: STEP ON SCHEDINCREDIT 1225 IN-STATE TRANSFER OF RETIREMENT CREDITINPURCH 1226 TCHRS MUST BUY IN-ST TRNSFR RETRMNT CRDINTRVIEW 659 ADMIT REQUIREMENT: PERSONAL INTERVIEWJESUITS 537 ASSN SCH BELONGS TO: JESUIT SCNDRY ASSNKGLENDAY 623 LENGTH OF KINDERGARTEN SCHOOL DAYKGNUMDAY 622 NMBR DAYS PER WK KINDERGARTEN OFFEREDKGOFFER 621 KINDERGARTEN OFFEREDLABSCHLS 535 ASSN SCH BELONGS TO: NTL ASSN LABORATRYLAIDOFF 1111 NMBR FTE K-12 TCHRS LAIDOFF LAST YR
235

D-12 1990-91 SASS Data File Users' Manual
LANGNEW 829 NMBR NEW K-12 TCHRS MAIN ASSIGN: F LANGLASTKG 942 DISTRICT HEAD COUNT LAST YEAR: KINDERLASTPK 932 DISTRICT HEAD COUNT LAST YEAR: PREKINDLASTPS 976 DIST HEAD COUNT LAST YEAR:
POSTSECONDARYLASTTOT 987 TOTAL DIST HEAD COUNT ENROLLMENT LAST
YRLASTUG 922 DISTRICT HEAD COUNT LAST YEAR: UNGRADEDLASTYEAR 489 NMBR STUDENTS LAST YEAR K-12 OR
UNGRADEDLAST1 6 953 DIST HEAD COUNT LAST YEAR: GRADES 1-6LAST7 12 965 DIST HEAD COUNT LAST YEAR: GRADES 7-12LEAWGT 40 SCHOOL OR DISTRICT FINAL WEIGHTLESSQUAL 902 METHOD TO COVER VACANCIES: LESSQUALLES SlOEX 803 NMBR K-12 TCHRS TAUGHT 3-9 YEARSLESS21EX 806 NMBR K-12 TCHRS TAUGHT 10-20 YEARSLESS3EXP 800 NMBR K-12 TCHRS TAUGHT LESS THAN 3 YRSLFTBILNG 849 NMBR LFT K-12 TCHRS MAIN ASSIGN: BILINGLFTBIO 847 NMBR LFT K-12 TCHRS MAIN ASSIGN: BIOLGYLFTENGL 843 NUMBR LFT K-12 TCHRS MAIN ASSIGN: ENGLISHLFTESOL 848 NUMBR LFT K-12 TCHRS MAIN ASSIGN: ESLLFTGENL 840 NMBR LFT K-12 TCHRS MAIN ASSIGN: ELEMLFTLANG 850 NUMBR LFT K-12 TCHRS MAIN ASSIGN: F LANGLFTMATH 845 NMBR LFT K-12 TCHRS MAIN ASSIGN: MATHLFTOTHER 853 NMBR LFT K-12 TCHRS MAIN ASSIGN: OTHERLFTPHYS 846 NMBR LFT K-12 TCHRS MAIN ASSIGN: PHYSSCILFTSPECL 842 NMBR LFT K-12 TCHRS MAIN ASSIGN: SPCL EDLFTTEACH 837 NMBR K-12 TCHRS LEFT TEACHINGLFTTOTAL 835 NMBR K-12 TCHRS LEFT THIS SCHOOLLFTUNK 839 NMBR K-12 TCHRS LEFT TEACHING UNKNOWNLFTVOTEC 851 NMBR LFT K-12 TCHRS MAIN ASSIGN: VOTECHLIBK_6 1114 NMBR FTE K-6 LIBRARIANS/MEDIA SPECLIBRYALL 625 ALL STDNTS HAVE LBRY/MEDIA CNTR ACCESSLIB7 12 1119 NMBR FTE 7-12 LIBRARIANS/MEDIA SPECLIFE 1140 BENEFITS AVAIL TO DIST TCHRS: LIFE INSLNGTHYR 1148 NMBR MONTHS IN TCHR CONTRACT YEARLOCALE 504 TYPE OF LOCALELUNCHK12 641 NMBR K-12 STUDENTS RECEIVE FREE LUNCHLUNCHPK 638 NMBR PREKIND STUDENTS RECEIVE FREE LNCHMAJORFLD 1219 DIST CRIT FOR HIRING TCHRS: DEG IN FIELDMATHNEW 821 NMBR NEW K-12 TCHRS MAIN ASSIGN: MATHMATHNUM 594 NMBR REMEDIAL MATHEMATICS STUDENTSMATHPGM 593 REMEDIAL MATHEMATICS AVAILABLEMATHVAC 906 DIFFICULTY FILLING VACNCY: MATHMAXMASTR 1161 MIN YR BSE SAL PER SCHED: MSTR/20 YR EXPMAXSALRY 1176 MAX BASE YR TCHR SALARIES THIS DISTRICTMEALS 1143 BENEFITS AVAIL TO DIST TCHRS: MEALS
236

Appendix D D-13
MEDICAL 1138 BENEFITS AVAIL TO DIST TCHRS: MED INSMENTOR 913 MENTOR TCHR FOR NEW TEACHERS THIS SCHMERITCS 1184 PERF-BASED COMPENSATION: CASH BONUSMERITINC 1186 PERF-BASED COMPENSATION: OTHER SAL INCRMERITPAY 1183 DIST HAS MERIT PAY PLAN FOR TEACHERSMERITSTP 1185 PERF-BASED COMPENSATION: STEP ON SALSCHDMETRO 28 METRO STATUS CODE FOR LEAMINBACH 1151 MIN YR BSE SAL PER SCHED: BACH/NO YR EXPMINMASTR 1156 MIN YR BSE SAL PER SCHED: MSTR/NO YR EXPMINSALRY 1171 MIN BASE YR TCHR SALARIES THIS DISTRICTMLTRYSCH 517 ASSN SCH BELONGS TO: ASSN MILITARY SCHMOREXP21 809 NMBR K-12 TCHRS TAUGHT MORE THAN 20 YRSMOSTIMP 662 MOST IMPORTANT ADMISSION CONSIDERATIONNAIS 532 ASSN SCH BELONGS TO: NTL ASSN INDEPENDNAPEC 523 ASSN SCH BELONGS TO: NTL ASSN EXCP CHLNCACS 512 ASSN SCH BELONGS TO: ALTRNTV COMM SCHNCEA 536 ASSN SCH BELONGS TO: NTL CATH ED ASSNNCNE 538 ASSN SCH BELONGS TO: NTL CNTR NEIGHBORNEWCERTS 1105 NMBR FTE K-12 NEW TCHRS HAVE CERTIFICATNNEWHIRES 1101 NMBR FTE K-12 TCHRS NEWLY HIREDNEWTEACH 812 NMBR K-12 TCHRS NEW TO THIS SCH THIS YRNFCS 539 ASSN SCH BELONGS TO: NTL FED CHURCH SCHNIPSA 533 ASSN SCH BELONGS TO: NTL INDEP PVT SCHNOLUNCH 645 SCHOOL NOT PARTICIPATE IN FREE LUNCH PGMNONE 1147 BENEFITS AVAIL TO DIST TCHRS: NONENONE2 547 ASSN SCH BELONGS TO: NONENONRELIG 546 ASSN SCH BELONGS TO: OTHR NONRELIG ASSNNOWKG 937 DISTRICT HEAD COUNT THIS YEAR: KINDERNOWPK 927 DISTRICT HEAD COUNT THIS YEAR: PREKINDNOWPS 971 DIST HEAD COUNT THIS YEAR: POSTSECONDARYNOWTOT 981 TOTAL DIST HEAD COUNT ENROLLMENT THISNOWUG 917 DISTRICT HEAD COUNT THIS YEAR: UNGRADEDNOW' 6 947 DIST HEAD COUNT THIS YEAR: GRADES 1-6NOW7 12 959 DIST HEAD COUNT THIS YEAR: GRADES 7-12NTEPASS 1223 DIST CRIT FOR HIRING TCHRS: NTL TCHR TSTNUMBRI 682 NMBR STUDENTS ENROLLED IN 1ST GRADENUMBR2 686 NMBR STUDENTS ENROLLED IN 2ND GRADENUMBR3 690 NMBR STUDENTS ENROLLED IN 3RD GRADENUMBR4 694 NMBR STUDENTS ENROLLED IN 4TH GRADENUMBR5 698 NMBR STUDENTS ENROLLED IN 5TH GRADENUMBR6 702 NMBR STUDENTS ENROLLED IN 6TH GRADENUMBR7 706 NMBR STUDENTS ENROLLED IN 7TH GRADENUMBR8 710 NMBR STUDENTS ENROLLED IN 8TH GRADENUMBR9 714 NMBR STUDENTS ENROLLED IN 9TH GRADENUMBR10 719 NMBR STUDENTS ENROLLED IN 10TH GRADENUMBR I 1 724 NMBR STUDENTS ENROLLED IN 11TH GRADENUMBRI2 729 NMBR STUDENTS ENROLLED IN 12TH GRADE
237

D-14 1990-91 SASS Data File Users' Manual
NUMBRKG 678 NMBR STUDENTS ENROLLED IN KINDERGARTENNUMBRPK 674 NMBR STUDENTS ENROLLED IN PREKINDNUMBRPS 734 NMBR STUDENTS ENROLLED IN
POSTSECONDARYNUMBRUG 665 NMBR STUDENTS ENROLLED IN UNGRADEDNUMDAYS 548 NMBR DAYS IN SCHOOL YEARNUMHOURS 551 NMBR HOURS IN SCHOOL DAYNUM:MNTE 553 NMBR MINUTES IN SCHOOL DAYNURSENUM 670 NMBR OF NURSERY PARTICIPANTSNURSEOFF 669 NURSERY OFFERED THIS SCHOOLOFFER! 681 GRADE LEVELS SCHOOL OFFERS: 1ST GRADEOFFER2 685 GRADE LEVELS SCHOOL OFFERS: 2ND GRADEOFFER3 689 GRADE LEVELS SCHOOL OFFERS: 3RD GRADEOFFER4 693 GRADE LEVELS SCHOOL OFFERS: 4TH GRADEOFFERS 697 GRADE LEVELS SCHOOL OFFERS: 5TH GRADEOFFER6 701 GRADE LEVELS SCHOOL OFFERS: 6TH GRADEOFFER? 705 GRADE LEVELS SCHOOL OFFERS: 7TH GRADEOFFER8 709 GRADE LEVELS SCHOOL OFFERS: 8TH GRADE
OFFER9 713 GRADE LEVELS SCHOOL OFFERS: 9TH GRADEOFFER10 718 GRADE LEVELS SCHOOL OFFERS: 10TH GRADEOFFER!! 723 GRADE LEVELS SCHOOL OFFERS: 11TH GRADE
OFFER12 728 GRADE LEVELS SCHOOL OFFERS: 12TH GRADEOFFERKG 677 GRADE LEVELS SCHOOL OFFERS:
KINDERGARTENOFFERPK 673 GRADE LEVELS SCHOOL OFFERS: PREKINDOFFERPS 733 GRADE LEVELS SCHOOL OFFERS:
POSTSECONDRYOFFERUG 664 GRADE LEVELS SCHOOL OFFERS: UNGRADEDONESVKI2 630 NMBR K-12 CHAPTER 1 STUDENTS SERVEDONESVPK 627 NMBR PREKIND CHAPTER 1 STUDENTS SERVED
ONETEACH 634 NMBR CHAPTER 1 TEACHERS/TEACHER AIDESOPERATE 481 NONINTERVIEW REASONORALRBTS 543 ASSN SCH BELONGS TO: ORAL ROBERTS FELLWORDSEL 1390 ORDER OF SELECTION (PUBLIC & PRIVATE)OTHBILNG 520 ASSN SCH BELONGS TO: OTHER ASSN BILINGOTHCHRST 544 ASSN SCH BELONGS TO: OTHR CHRISM ASSNOTHECE 526 ASSN SCH BELONGS TO: OTHR ERLY CHLD EDOTHERCRD 1233 TCHR RECEIVE RETRMNT CRD: OTHEROTHERNEW 833 NMBR NEW K-12 TCHRS MAIN ASSIGN: OTHEROTHINDPV 534 ASSN SCH BELONGS TO: OTHR. INDEP ASSNOTHINTL 528 ASSN SCH BELONGS TO: OTHR ASSN INTLOTHJEWSH 542 ASSN SCH BELONGS TO: OTHR JEWISH ASSNOTHMTSRI 515 ASSN SCH BELONGS TO: OTHR MONTESSORIOTHRDIST 993 DIST STUDENTS ATTEND OTHER DIST PART DAY
OTHRELIG 545 ASSN SCH BELONGS TO: OTHR RELIGOUS ASSN
OTHRKG 999 NMBR ATTEND OTHR DIST PART DAY: KINDER
238
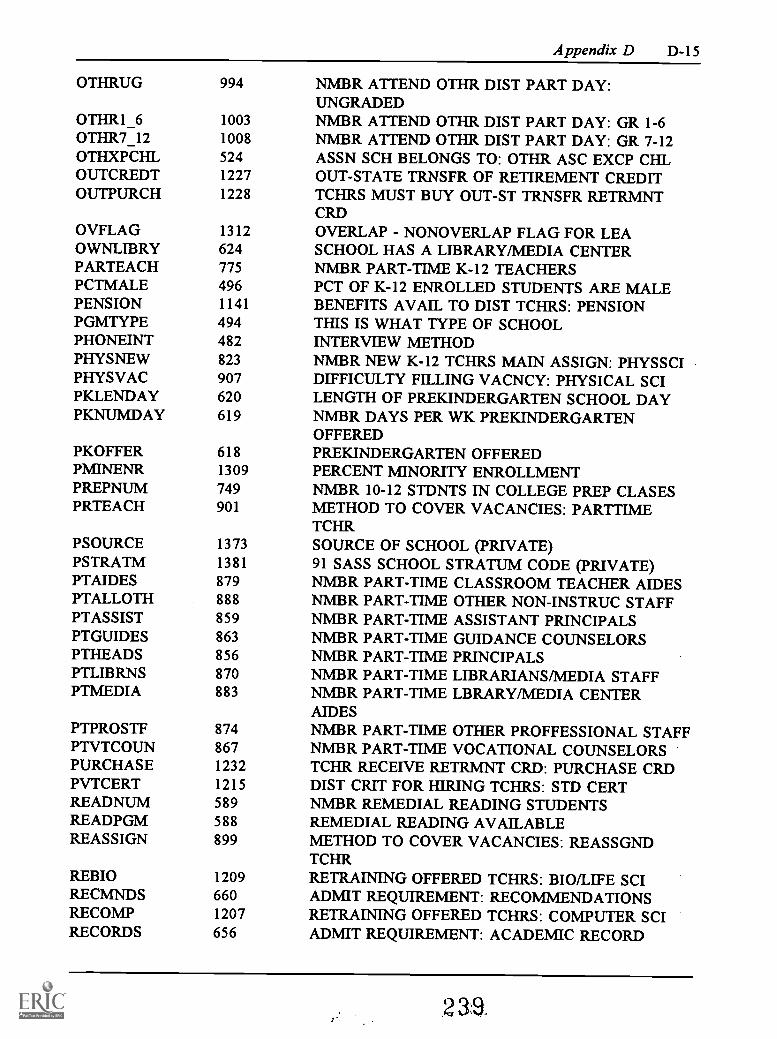
Appendix D D-15
OTHRUG 994 NMBR ATTEND OTHR DIST PART DAY:UNGRADED
OTHR1 6 1003 NMBR ATTEND OTHR DIST PART DAY: GR 1-60=7_12 1008 NMBR ATTEND OTHR DIST PART DAY: GR 7-12OTHXPCHL 524 ASSN SCH BELONGS TO: OTHR ASC EXCP CHLOUTCREDT 1227 OUT-STATE TRNSFR OF RETIREMENT CREDITOUTPURCH 1228 TCHRS MUST BUY OUT-ST TRNSFR RETRMNT
CRDOVFLAG 1312 OVERLAP - NONOVERLAP FLAG FOR LEAOWNLIBRY 624 SCHOOL HAS A LIBRARY/MEDIA CENTERPARTEACH 775 NMBR PART-TIME K-12 TEACHERSPCTMALE 496 PCT OF K-12 ENROLLED STUDENTS ARE MALEPENSION 1141 BENEFITS AVAIL TO DIST TCHRS: PENSIONPGMTYPE 494 THIS IS WHAT TYPE OF SCHOOLPHONEINT 482 INTERVIEW METHODPHYSNEW 823 NMBR NEW K-12 TCHRS MAIN ASSIGN: PHYSSCIPHYSVAC 907 DIFFICULTY FILLING VACNCY: PHYSICAL SCIPKLENDAY 620 LENGTH OF PREKINDERGARTEN SCHOOL DAYPKNUMDAY 619 NMBR DAYS PER WK PREKINDERGARTEN
OFFEREDPKOFFER 618 PREKINDERGARTEN OFFEREDPMINENR 1309 PERCENT MINORITY ENROLLMENTPREPNUM 749 NMBR 10-12 STDNTS IN COLLEGE PREP CLASESPRTEACH 901 METHOD TO COVER VACANCIES: PARTTIME
TCHRPSOURCE 1373 SOURCE OF SCHOOL (PRIVATE)PSTRATM 1381 91 SASS SCHOOL STRATUM CODE (PRIVATE)PTAIDES 879 NMBR PART-TIME CLASSROOM TEACHER AIDESPTALLOTH 888 NMBR PART-TIME OTHER NON-INSTRUC STAFFPTASSIST 859 NMBR PART-TIME ASSISTANT PRINCIPALSPTGUIDES 863 NMBR PART-TIME GUIDANCE COUNSELORSPTHEADS 856 NMBR PART-TIME PRINCIPALSPTLIBRNS 870 NMBR PART-TIME LIBRARIANS/MEDIA STAFFPTMEDIA 883 NMBR PART-TIME LBRARY/MEDIA CENTER
AIDESPTPROSTF 874 NMBR PART-TIME OTHER PROFFESSIONAL STAFFPTVTCOUN 867 NMBR PART-TIME VOCATIONAL COUNSELORSPURCHASE 1232 TCHR RECEIVE RETRMNT CRD: PURCHASE CRDPVTCERT 1215 DIST CRIT FOR HIRING TCHRS: STD CERTREADNUM 589 NMBR REMEDIAL READING STUDENTSREADPGM 588 REMEDIAL READING AVAILABLEREASSIGN 899 METHOD TO COVER VACANCIES: REASSGND
TCHRREBIO 1209 RETRAINING OFFERED TCHRS: BIO/LIFE SCIRECMNDS 660 ADMIT REQUIREMENT: RECOMMENDATIONSRECOMP 1207 RETRAINING OFFERED TCHRS: COMPUTER SCIRECORDS 656 ADMIT REQUIREMENT: ACADEMIC RECORD
239.
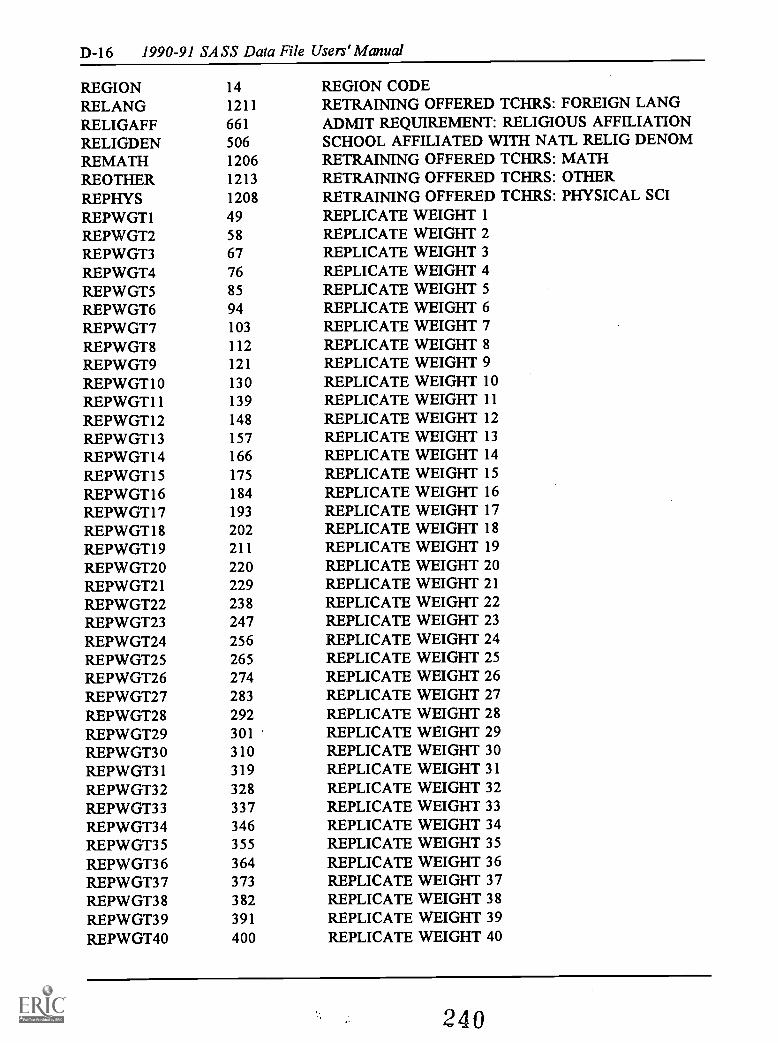
D-16 1990-91 SASS Data File Users' Manual
REGION 14RELANG 1211RELIGAFF 661RELIGDEN 506REMATH 1206REOTHER 1213REPHYS 1208REPWGT1 49REPWGT2 58REPWGT3 67REPWGT4 76REPWGT5 85
REPWGT6 94REPWGT7 103
REPW GT8 112REPWGT9 121
REPW GT10 130REPWGT11 139REPWGT12 148REPWGT13 157REPWGT14 166REPWGT15 175REPWGTI6 184REPWGT17 193REPWGT18 202REPWGT19 211REPWGT20 220REPW GT21 229REPWGT22 238REPWGT23 247REPWGT24 256REPWGT25 265REPWGT26 274REPWGT27 283
REPWGT28 292REPWGT29 301REPWGT30 310REPW GT31 319REPWGT32 328REPWGT33 337REPWGT34 346REPWGT35 355REPWGT36 364REP WGT37 373REPWGT38 382REPWGT39 391
REPWGT40 400
REGION CODERETRAINING OFFEREDADMIT REQUIREMENT:SCHOOL AFFILIATED WIRETRAINING OFFEREDRETRAINING OFFEREDRETRAINING OFFEREDREPLICATE WEIGHT 1REPLICATE WEIGHT 2REPLICATE WEIGHT 3REPLICATE WEIGHT 4REPLICATE WEIGHT 5REPLICATE WEIGHT 6REPLICATE WEIGHT 7REPLICATE WEIGHT 8REPLICATE WEIGHT 9REPLICATE WEIGHT 10REPLICATE WEIGHT 11REPLICATE WEIGHT 12REPLICATE WEIGHT 13REPLICATE WEIGHT 14REPLICATE WEIGHT 15REPLICATE WEIGHT 16REPLICATE WEIGHT 17REPLICATE WEIGHT 18REPLICATE WEIGHT 19REPLICATE WEIGHT 20REPLICATE WEIGHT 21REPLICATE WEIGHT 22REPLICATE WEIGHT 23REPLICATE WEIGHT 24REPLICATE WEIGHT 25REPLICATE WEIGHT 26REPLICATE WEIGHT 27REPLICATE WEIGHT 28REPLICATE WEIGHT 29REPLICATE WEIGHT 30REPLICATE WEIGHT 31REPLICATE WEIGHT 32REPLICATE WEIGHT 33REPLICATE WEIGHT 34REPLICATE WEIGHT 35REPLICATE WEIGHT 36REPLICATE WEIGHT 37REPLICATE WEIGHT 38REPLICATE WEIGHT 39REPLICATE WEIGHT 40
TCHRS: FOREIGN LANGRELIGIOUS AFFILIATIONTH NATL RELIG DENOM
TCHRS: MATHTCHRS: OTHERTCHRS: PHYSICAL SCI
240

Appendix D D-17
REPWGT41 409 REPLICATE WEIGHT 41REPWGT42 418 REPLICATE WEIGHT 42REPWGT43 427 REPLICATE WEIGHT 43REPWGT44 436 REPLICATE WEIGHT 44REPWGT45 445 REPLICATE WEIGHT 45REPWGT46 454 REPLICATE WEIGHT 46REPWGT47 463 REPLICATE WEIGHT 47REPWGT48 472 REPLICATE WEIGHT 48RESOL 1210 RETRAINING OFFERED TCHRS: ESL/BILING EDRESPECL 1205 RETRAINING OFFERED TCHRS: SPECIAL EDRETIREMT 1224 DIST TCHRS COVERED BY RETIREMENT PLANRETRAING 1204 DIST HAS RETRAINING AVAIL IN SHRTG FLDSREVOTEC 1212 RETRAINING OFFERED TCHRS: VOCATIONAL EDROLLOVER 1231 TCHR RECEIVE RETRMNT CRD: ROLLOVER PREVSALSCHED 1150 DISTRICT HAS A TCHR SALARY SCHEDULESAMEORG 1230 TCHR RECEIVE RETRMNT CRD: SAME
ORGANIZTNSCHECHTR 541 ASSN SCH BELONGS TO: SCHECHTER DAY SCHSCHLEVEL 493 SCHOOL LEVELSCHOLAR 1145 BENEFITS AVAIL TO DIST TCHRS: SCHOLRSHPSSCHWGT 31 SCHOOL OR DISTRICT FINAL WEIGHTSCREENB 483 SCHOOL STUDENTS IN GRADES 1-12/UNGRADEDSECNDIMP 663 2ND MOST IMPORTANT ADMISSION
CONSIDERATNSERVICE 1182 ALL TCHRS ON A CONTRIBUTD SERVICE BASEISSFLG88 1374 88 SASS SAMPLE FLAG INDICATORSHORTAGE 1191 DIST USE INCNTVS TO FILL SHORTAGESSHORTCSH 1192 SHORTGE INCNTV OFFERD TCHRS: CASH BONUSSHORTINC 1194 SHORTGE INCNTV OFFERD TCHRS: OTHR INCRSHORTSTP 1193 SHORTGE INCNTV OFFERD TCHRS: STEP INCRSHRTBIO 1199 INCENTIVES OFFERED TCHRS: BIO/LIFE SCISHRTCOMP 1197 INCENTIVES OFFERED TCHRS: COMPUTER SCISHRTESOL 1200 INCENTIVES OFFERED TCHRS: ESL/BILING EDSHRTLANG 1201 INCENTIVES OFFERED TCHRS: FOREIGN LANGSHRTMATH 1196 INCENTIVES OFFERED TCHRS: MATHSHRTOTHR 1203 INCENTIVES OFFERED TCHRS: OTHERSHRTPHYS 1198 INCENTIVES OFFERED TCHRS: PHYSICAL SCISHRTSPEC 1195 INCENTIVES OFFERED TCHRS: SPECIAL EDSHRTVOC 1202 INCENTIVES OFFERED TCHRS: VOCATIONAL EDSMPSIZ 1386 SAMPLE SIZE FOR SCH STRATUM (PUB & PVT)SOURCE 1372 SOURCE OF SCHOOL (PUBLIC)SPCLNEW 817 NMBR NEW K-12 TCHRS MAIN ASSIGN: SPCL EDSPCLNUM 599 NMBR HANDICAPPED PROGRAM STUDENTSSPECIAL 657 ADMIT REQUIREMENT: SPECIAL STUDENT NEEDSSPECLPGM 598 HANDICAPPED PROGRAMS AVAILABLESPECLVAC 904 DIFFICULTY FILLING VACNCY: SPECIAL EDSRVHRS 1304 NMBR HOURS TO COMPLETE THIS SURVEY
241

D-18 1990-91 SASS Data File Users' Manual
SRVYMINS 1306 NMBR MINUTES TO COMPLETE THIS SURVEYSTABASIC 1221 DIST CRIT FOR HIRING TCHRS: ST BSIC SKILSTASUBJ 1222 DIST CRIT FOR HIRING TCHRS: ST SUBJ TSTSTATABB 1350 STATE ABBREVIATIONSTATE 15 FIPS STATE CODESTCNTY 17 FIPS STATE AND COUNTY CODE (PUB & LEAS)STRATM 1375 SCHOOL STRATUM CODE (PUBLIC)SUBTEACH 900 METHOD TO COVER VACANCIES: SUBSTITUTESSURVEY 1 SASS SURVEY CODESVNTHDAY 530 ASSN SCH BELONGS TO: GNL CONF 7-DY ADVTALENT 658 ADMIT REQUIREMENT: SPECL STDNT APTITUDESTCHAMIND 1283 NMBR DIST K-12 TCHRS: AMIND/ALASKANTCHASIAN 1286 NMBR DIST K-12 TCHRS: ASIAN/PACFC ISLTCHBLACK 1294 NMBR DIST K-12 TCHRS: BLACK NONHISPNCTCHISPNC 1290 NMBR DIST K-12 TCHRS: HISPANICTCHWHITE 1299 NMBR DIST K-12 TCHRS: WHITE NONHISPNCTEACHED 1218 DIST CRIT FOR HIRING TCHRS: GRAD TCHR EDTECHNEW 831 NMBR NEW K-12 TCHRS MAIN ASSIGN: VOTECHTECHNUM 754 NMBR 10-12 STDNTS IN VOCAT/TECH CLASSESTHISYEAR 485 NMBR STUDENTS THIS YEAR K-12 OR
UNGRADEDTKGLAST 1033 NMBR DIST FTE TCHRS LAST YR: KINDERGRTNTKGNOW 1027 NMBR DIST FTE TCHRS THIS YR: KINDERGRTNTOTLIBRY 1124 NMBR FTE K-12 LIBRARIANS/MEDIA SPECTOTTEACH 778 TOTAL NMBR K-12 TEACHERSTPKLAST 1024 NMBR DIST FTE TCHRS LAST YR: PREKINDTPKNOW 1021 NMBR DIST FTE TCHRS THIS YR: PREKINDTPSLAST 1065 NMBR DIST FTE TCHRS LAST YR: POSTSECNDRYTPSNOW 1059 NMBR DIST FTE TCHRS THIS YR: POSTSECNDRYTRANSPT 1144 BENEFITS AVAIL TO DIST TCHRS: TRNSPRTATNTTOTK_12 1081 NMBR FTE TCHRS THIS YR: GRADES K-12TTOTLAST 1076 TOTAL NMBR DISTRICT FTE TEACHERS LAST YRTTOTNOW 1071 TOTAL NMBR DISTRICT FTE TEACHERS THIS YRTUGLAST 1017 NMBR DIST FTE TCHRS LAST YR: UNGRADEDTUGNOW 1013 NMBR DIST FTE TCHRS THIS YR: UNGRADEDTUITIN 648 HIGHEST ANNUAL TUITION CHARGEDTUITION 1146 BENEFITS AVAIL TO DIST TCHRS: TUIT REIMBTWELFTH 747 THIS SCHOOL OFFER 12TH GRADE INSTRUCTIONTYPOLOGY 30 NINE LEVEL RELIGIOUS TYPOLOGYT1 6LAST 1044 NMBR DIST FTE TCHRS LAST YR: GRADES 1-6T1 6NOW 1039 NMBR DIST FTE TCHRS THIS YR: GRADES 1-6T7 12LST 1054 NMBR DIST FTE TCHRS LAST YR: GRADES 7-12T7 12NOW 1049 NMBR DIST FTE TCHRS THIS YR: GRADES 7-12UNFILLED 895 TEACHING VACANCIES UNFILLED THIS YEARUNPAID 1181 ALL TEACHING POSITIONS ARE UNPAIDVACANCY 1091 NMBR FTE K-12 TCH POSITIONS VACANTVACNCY 894 TEACHING VACANCIES THIS SCHOOL THIS YEAR
242

Appendix D D-19
VACNTLIB 1129 NMBR FTE LIB/MEDIA SPEC POSITIONS VACANTVOCTECH 753 THIS SCH OFFER VOCATIONAL/TECHNICAL PGMVOLNTNUM 891 NMBR UNPAID VOLS ASSIST CONTINUING BASISVOLNTSVC 890 UNPAID VOLUNTEERS PROVIDE SERVICESVOTECVAC 911 DIFFICULTY FILLING VACNCY: VOCATIONAL EDWHITESTU 574 NMBR K-12 STUDENTS ARE: WHITE/NONHISPNCWHITETCH 792 NMBR K-12 TEACHER ARE: WHITE NON-HISPANCWHTDIST 1277 NMBR DIST K-12 STUDENTS: WHITE NONHISPNCYRSCOMP 1241 GRAD REQ YRS INSTRUCTION: COMP SCIYRSENGL 1235 GRAD REQ YRS INSTRUCTION: ENGLISHYRSLANG 1250 GRAD REQ YRS INSTRUCTION: FOREIGN LANGYRSMATH 1238 GRAD REQ YRS INSTRUCTION: MATHYRSSCI 1247 GRAD REQ YRS INSTRUCTION: BIO/PHYSCL SCIYRSSOC 1244 GRAD REQ YRS INSTRUCTION: SOCIAL SCIYRS3 4 1253 REQUIREMENTS REFLECT A 3 OR 4 YR PGM
243

D-20 1990-91 SASS Data File Users' Manual
Public and Private School Administrator Surveys
Physical Name: ZEEWRM.SASS2A2B.YR9091.NCES.ADMIN.SASZEEWHLSASS2A2B.YR9091.NCES.ADMIN.DATA
Variable
Alphabetic List of Variables and Attributes
EBCDICPosition Label
AACS 647 ASSN SCH BELONGS TO: AM ASSN CHRISTIANACE 644 ASSN SCH BELONGS TO: ACCEL CHRISTIANACSI 650 ASSN SCH BELONGS TO: ASSN CHRSTN INTLADMWGT 19 ADMINISTRATOR FINAL WEIGHTAFFIL 17 3-LEVEL RELIGIOUS AFFILIATION CODEAFFILIAT 642 SCHOOL RELIGIOUS ORIENTATION/AFFILIATIONAMONTSRI 648 ASSN SCH BELONGS TO: AM MONTESSORI SOCAPIN 605 PERMANENT IDENTIFICATION NMBR FROM QEDASC001 460 SCHOOL NO LONGER IN OPERATIONASC002 461 TELEPHONE INTERVIEWASC011 462 WAS PRINCIPAL HERE THE SPRING 1988ASC012 463 HAVE A BACHELORS DEGREEASC013 464 BACHELORS DEGREE MAJOR FIELD OF STUDYASC014 466 YR RECEIVED BACHELORS DEGREEASC015 468 HAVE A 2ND MAJOR OR MINOR FIELD OF STUDYASC016 469 SECOND MAJOR/MINOR FIELD OF STUDYASC017 471 HAVE A MASTERS DEGREEASC018 472 MASTERS DEGREE MAJOR FIELD OF STUDYASC019 474 YEAR RECEIVED MASTERS DEGREEASCO20 476 HAVE ANY OTHER TYPE OF DEGREEASCO21 477 HAVE EARNED AN ASSOCIATE DEGREEASCO22 478 MAJOR FIELD OF STUDY FOR ASSOC DEGREEASCO23 480 YR RECEIVED ACCOCIATE DEGREEASCO24 482 HAVE EARNED AN ED SPEC/PROF DIPLOMAASCO25 483 MAJOR STUDY FIELD FOR ED SPEC/PROF DPLMAASCO26 485 YR RECEIVED ED SPEC/PROF DIPLOMAASCO27 487 EARNED A DOCTORATE / 1ST PROF DEGREEASCO28 488 MAJOR FIELD OF STUDY FOR DOCTORATEASCO29 490 YEAR RECEIVED DOCTORATE/1ST PROF DEGREEASC030 492 YRS ELEM/SEC TCHING EXPER BEFORE PRINASC031 494 YRS ELEM/SEC TCHING EXPER AFTER PRINASC032 496 CHECK ITEM - 1 OR MORE YEARS EXPERIENCEASC033 497 MOST RECENT MAIN TEACHING ASSIGNMENTASC034 499 OTHER POSITIONS BEFORE PRIN - DEPT HEADASC035 500 OTHER POSITIONS BEFORE PRIN - ASST PRINASC036 501 OTHER POSITIONS BEFORE PRIN - GUID COUNASC037 502 OTHER POSITIONS BEFORE PRIN - ATHL COACHASC038 503 OTHER POSITIONS BEFORE PRIN - SPONSOR
244
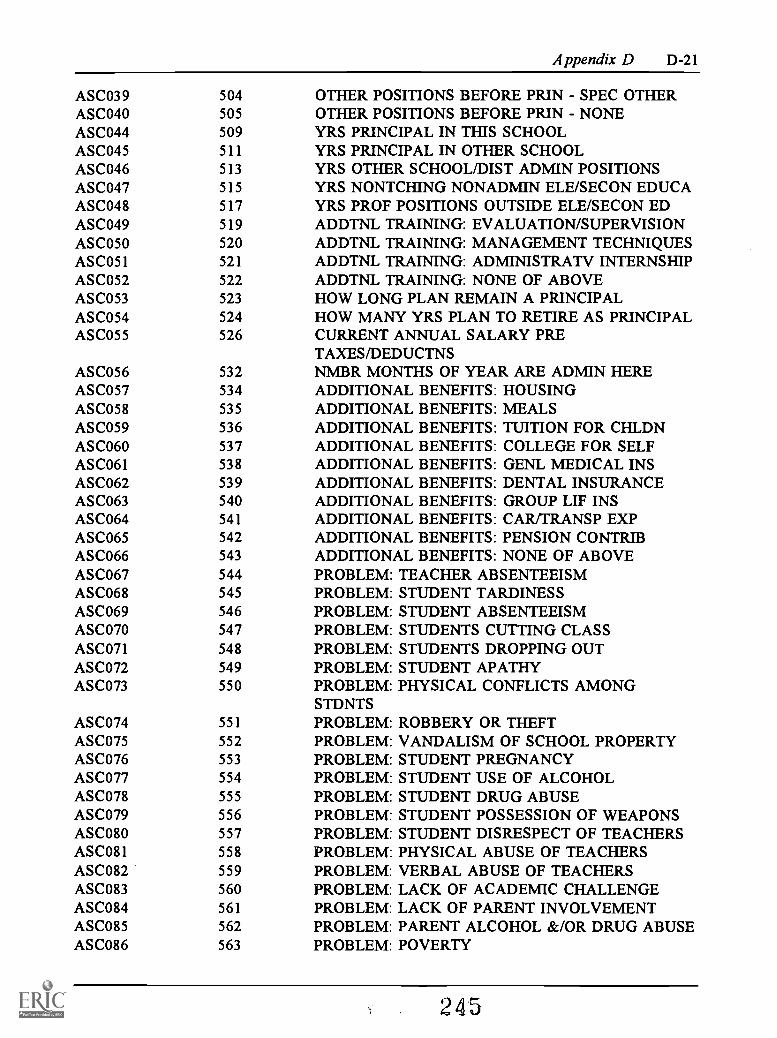
Appendix D D-21
ASC039 504 OTHER POSITIONS BEFORE PRIN - SPEC OTHERASC040 505 OTHER POSITIONS BEFORE PRIN - NONEASC044 509 YRS PRINCIPAL IN THIS SCHOOLASC045 511 YRS PRINCIPAL IN OTHER SCHOOLASC046 513 YRS OTHER SCHOOL/DIST ADMIN POSITIONSASC047 515 YRS NONTCHING NONADMIN ELE/SECON EDUCAASC048 517 YRS PROF POSITIONS OUTSIDE ELE/SECON EDASC049 519 ADDTNL TRAINING: EVALUATION/SUPERVISIONASC050 520 ADDTNL TRAINING: MANAGEMENT TECHNIQUESASC051 521 ADDTNL TRAINING: ADMINISTRATV INTERNSHIPASC052 522 ADDTNL TRAINING: NONE OF ABOVEASC053 523 HOW LONG PLAN REMAIN A PRINCIPALASC054 524 HOW MANY YRS PLAN TO RETIRE AS PRINCIPALASC055 526 CURRENT ANNUAL SALARY PRE
TAXES/DEDUCTNSASC056 532 NMBR MONTHS OF YEAR ARE ADMIN HEREASC057 534 ADDITIONAL BENEFITS: HOUSINGASC058 535 ADDITIONAL BENEFITS: MEALSASC059 536 ADDITIONAL BENEFITS: TUITION FOR CHLDNASC060 537 ADDITIONAL BENEFITS: COLLEGE FOR SELFASC061 538 ADDITIONAL BENEFITS: GENL MEDICAL INSASC062 539 ADDITIONAL BENEFITS: DENTAL INSURANCEASC063 540 ADDITIONAL BENEFITS: GROUP LIF INSASC064 541 ADDITIONAL BENEFITS: CAR/TRANSP EXPASC065 542 ADDITIONAL BENEFITS: PENSION CONTRIBASC066 543 ADDITIONAL BENEFITS: NONE OF ABOVEASC067 544 PROBLEM: TEACHER ABSENTEEISMASC068 545 PROBLEM: STUDENT TARDINESSASC069 546 PROBLEM: STUDENT ABSENTEEISMASC070 547 PROBLEM: STUDENTS CUTTING CLASSASC071 548 PROBLEM: STUDENTS DROPPING OUTASC072 549 PROBLEM: STUDENT APATHYASC073 550 PROBLEM: PHYSICAL CONFLICTS AMONG
STDNTSASC074 551 PROBLEM: ROBBERY OR THEFTASC075 552 PROBLEM: VANDALISM OF SCHOOL PROPERTYASC076 553 PROBLEM: STUDENT PREGNANCYASC077 554 PROBLEM: STUDENT USE OF ALCOHOLASC078 555 PROBLEM: STUDENT DRUG ABUSEASC079 556 PROBLEM: STUDENT POSSESSION OF WEAPONSASC080 557 PROBLEM: STUDENT DISRESPECT OF TEACHERSASC081 558 PROBLEM: PHYSICAL ABUSE OF TEACHERSASC082 559 PROBLEM: VERBAL ABUSE OF TEACHERSASC083 560 PROBLEM: LACK OF ACADEMIC CHALLENGEASC084 561 PROBLEM: LACK OF PARENT INVOLVEMENTASC085 562 PROBLEM: PARENT ALCOHOL &/OR DRUG ABUSEASC086 563 PROBLEM: POVERTY
245

D-22 1990-91 SASS Data File Users' Manual
ASC087 564 PROBLEM: RACIAL TENSIONASC088 565 PROBLEM: CULTURAL CONFLICTASC115 581 MOST IMPORTANT EIGHT EDUCATIONAL GOALSASC116 582 SECOND MOST IMPORTANT EDUCATION GOALSASC117 583 THIRD MOST IMPORTANT EDUCATION GOALSASC118 584 RATE: ALL TEACHERS IN THIS SCHOOLASC119 585 RATE: TEACHERS WITH MORE THAN 3 YRS EXPASC120 586 RATE: NEW TEACHERS WITH LESS THAN 3 YRSASC121 587 MALE OR FEMALEASC122 588 RACEASC123 589 ENROLLED IN A RECOGNIZED TRIBEASC124 590 HISPANIC ORIGINASC125 591 YEAR OF BIRTHASN 645 ASSN SCH BELONGS TO: ALTRNTV SCH NTWKASPIRING 506 PARTICIPATE IN TRAINING PGM FOR ADMINSBILNGSCH 652 ASSN SCH BELONGS TO: BILNGUAL SCH ASSCBRDCURRC 567 ESTABLISHING CURRICULUM - SCHOOL BOARDBRDDISPL 577 SET DISCIPLINE POLICY - SCHOOL BOARDBRDHIRNG 572 HIRING NEW FT TEACHERS - SCHOOL BOARDCBE 653 ASSN SCH BELONGS TO: COUNCIL BILING EDCCDIDSCH 593 COMMON CORE OF DATA SCHOOL IDENT.CEC 656 ASSN SCH BELONGS TO: COUNCL EXCEP CHLDCERSCH 630 CERTAINTY FLAG (PUBLIC & PRIVATE)CNTLNUM 2 1991 SCHOOL CONTROL NUMBERCSI 655 ASSN SCH BELONGS TO: CHRSTIAN SCH INTLECEA 659 ASSN SCH BELONGS TO: ERLY CHLD ED ASSCECIS 661 ASSN SCH BELONGS TO: EURO COUNCIL INTLENDTRAIN 508 COMPLETE TRAINING PROGRAMENRK12UG 687 TOTAL ENROLLMENT K-12 PLUS UNGRADEDEPISCPLS 665 ASSN SCH BELONGS TO: NTL ASSN EPISCOPLF ASC001 694 IMPUTATION FLAG FOR ASC001F_ASC002 695 IMPUTATION FLAG FOR ASC002F ASC011 696 IMPUTATION FLAG FOR ASC011F ASC012 697 IMPUTATION FLAG FOR ASC012F ASC013 698 IMPUTATION FLAG FOR ASC013F ASC014 699 IMPUTATION FLAG FOR ASC014F ASC015 700 IMPUTATION FLAG FOR ASC015F ASC016 701 IMPUTATION FLAG FOR ASC016F ASC017 702 IMPUTATION FLAG FOR ASC017F ASC018 703 IMPUTATION FLAG FOR ASC018F ASC019 704 IMPUTATION FLAG FOR ASC019F ASCO20 705 IMPUTATION FLAG FOR ASCO20F ASCO21 706 IMPUTATION FLAG FOR ASCO21F ASCO22 707 IMPUTATION FLAG FOR ASCO22F ASCO23 708 IMPUTATION FLAG FOR ASCO23F_ASCO24 709 IMPUTATION FLAG FOR ASCO24F ASCO25 710 IMPUTATION FLAG FOR ASCO25
246
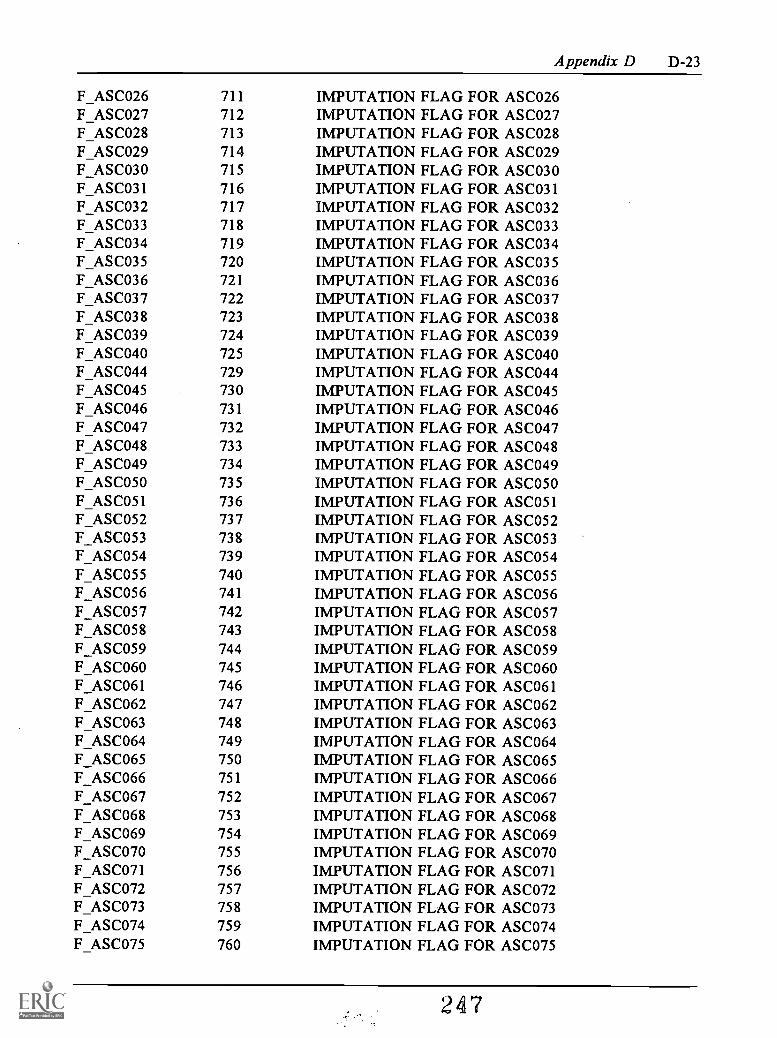
Appendix D D-23
F ASCO26 711 IMPUTATION FLAG FOR ASCO26F ASCO27 712 IMPUTATION FLAG FOR ASCO27F ASCO28 713 IMPUTATION FLAG FOR ASCO28F ASCO29 714 IMPUTATION FLAG FOR ASCO29F ASC030 715 IMPUTATION FLAG FOR ASC030F ASC031 716 IMPUTATION FLAG FOR ASC031F ASC032 717 IMPUTATION FLAG FOR ASC032F ASC033 718 IMPUTATION FLAG FOR ASC033F ASC034 719 IMPUTATION FLAG FOR ASC034F ASC035 720 IMPUTATION FLAG FOR ASC035F ASC036 721 IMPUTATION FLAG FOR ASC036F ASC037 722 IMPUTATION FLAG FOR ASC037F ASC038 723 IMPUTATION FLAG FOR ASC038F ASC039 724 IMPUTATION FLAG FOR ASC039F ASC040 725 IMPUTATION FLAG FOR ASC040F ASC044 729 IMPUTATION FLAG FOR ASC044F ASC045 730 IMPUTATION FLAG FOR ASC045F ASC046 731 IMPUTATION FLAG FOR ASC046F ASC047 732 IMPUTATION FLAG FOR ASC047F ASC048 733 IMPUTATION FLAG FOR ASC048F ASC049 734 IMPUTATION FLAG FOR ASC049F ASC050 735 IMPUTATION FLAG FOR ASC050F ASC051 736 IMPUTATION FLAG FOR ASC051F_ASC052 737 IMPUTATION FLAG FOR ASC052F_ASC053 738 IMPUTATION FLAG FOR ASC053F ASC054 739 IMPUTATION FLAG FOR ASC054F ASC055 740 IMPUTATION FLAG FOR ASC055F ASC056 741 IMPUTATION FLAG FOR ASC056F ASC057 742 IMPUTATION FLAG FOR ASC057F ASC058 743 IMPUTATION FLAG FOR ASC058F ASC059 744 IMPUTATION FLAG FOR ASC059F ASC060 745 IMPUTATION FLAG FOR ASC060F ASC061 746 IMPUTATION FLAG FOR ASC061F ASC062 747 IMPUTATION FLAG FOR ASC062F ASC063 748 IMPUTATION FLAG FOR ASC063F ASC064 749 IMPUTATION FLAG FOR ASC064F ASC065 750 IMPUTATION FLAG FOR ASC065F_ASC066 751 IMPUTATION FLAG FOR ASC066F ASC067 752 IMPUTATION FLAG FOR ASC067F ASC068 753 IMPUTATION FLAG FOR ASC068F_ASC069 754 IMPUTATION FLAG FOR ASC069F_ASC070 755 IMPUTATION FLAG FOR ASC070F_ASC071 756 IMPUTATION FLAG FOR ASC071F ASC072 757 IMPUTATION FLAG FOR ASC072F_ASC073 758 IMPUTATION FLAG FOR ASC073F ASC074 759 IMPUTATION FLAG FOR ASC074F ASC075 760 IMPUTATION FLAG FOR ASC075
247

D-24 1990-91 SASS Data File Users' Manual
F ASC076 761F ASC077 762F ASC078 763F ASC079 764F ASC080 765F ASC081 766F ASC082 767FASC083 768F ASC084 769F ASC085 770FASC086 771F ASC087 772F ASC088 773FIASC115 789F ASC116 790F ASC117 791F ASC118 792F ASC119 793F ASC120 794F ASC121 795F ASC122 796F ASC123 797F ASC124 798F ASC125 799FIASPIRI 726F_BRDCUR 775F_BRDDIS 785F_BRDHIR 780F_ENDTRA 728F_LIBCUR 778F_PARCUR 779F_PARDIS 788F_PARHIR 783F_PRNCUR 776F_PRNDIS 786F_PRNHIR 781F SEACUR 774F SEADIS 784F TEACUR 777F_TEADIS 787F_TEABIR 782F_TRAINI 727FRIENDS 663HBREWDAY 674JESUITS 671LABSCHLS 669LIBCURRC 570
IMPUTATION FLAG FORIMPUTATION FLAG FORIMPUTATION FLAG FORIMPUTATION FLAG FORIMPUTATION FLAG FORIMPUTATION FLAG FORIMPUTATION FLAG FORIMPUTATION FLAG FORIMPUTATION FLAG FORIMPUTATION FLAG FORIMPUTATION FLAG FORIMPUTATION FLAG FORIMPUTATION FLAG FORIMPUTATION FLAG FORIMPUTATION FLAG FORIMPUTATION FLAG FORIMPUTATION FLAG FORIMPUTATION FLAG FORIMPUTATION FLAG FORIMPUTATION FLAG FORIMPUTATION FLAG FORIMPUTATION FLAG FORIMPUTATION FLAG FORIMPUTATION FLAG FORIMPUTATION FLAG FORIMPUTATION FLAG FORIMPUTATION FLAG FORIMPUTATION FLAG FORIMPUTATION FLAG FORIMPUTATION FLAG FORIMPUTATION FLAG FORIMPUTATION FLAG FORIMPUTATION FLAG FORIMPUTATION FLAG FORIMPUTATION FLAG FORIMPUTATION FLAG FORIMPUTATION FLAG FORIMPUTATION FLAG FORIMPUTATION FLAG FORIMPUTATION FLAG FORIMPUTATION FLAG FORIMPUTATION FLAG FORASSN SCH BELONGS TO:ASSN SCH BELONGS TO:ASSN SCH BELONGS TO:ASSN SCH BELONGS TO:ESTABLISHING CURRIC
ASC076ASC077ASC078ASC079ASC080ASC081ASC082ASC083ASC084ASC085ASC086ASC087ASC088ASC115ASC116ASC117ASC118ASC119ASC120ASC121ASC122ASC123ASC124ASC125ASPIRINGBRDCURRCBRDDISPLBRDHIRNGENDTRAINLIBCURRCPARCURRCPARDISPLPARHIRNGPRNCURRCPRNDISPLPRNHIRNGSEACURRCSEADISPLTEACURRCTEADISPLTEAHIRNGTRAININDFRNDS COUNCIL EDNTL SOC HEBREW DAYJESUIT SCNDRY ASSNNTL ASSN LABORATRY
ULUM - LIB/MEDIA SPEC
248

Appendix D D-25
LOCALE 639 TYPE OF LOCALEMLTRYSCH 651 ASSN SCH BELONGS TO: ASSN MILITARY SCHNAIS 666 ASSN SCH BELONGS TO: NTL ASSN INDEPENDNAPEC 657 ASSN SCH BELONGS TO: NTL ASSN EXCP CHLNCACS 646 ASSN SCH BELONGS TO: ALTRNTV COMM SCHNCEA 670 ASSN SCH BELONGS TO: NTL CATH ED ASSNNCNE 672 ASSN SCH BELONGS TO: NTL CNTR NEIGHBORNFCS 673 ASSN SCH BELONGS TO: NTL FED CHURCH SCHNIPSA 667 ASSN SCH BELONGS TO: NTL INDEP PVT SCHNONE2 681 ASSN SCH BELONGS TO: NONENONRELIG 680 ASSN SCH BELONGS TO: OTHR NONRELIG ASSNORALRBTS 677 ASSN SCH BELONGS TO: ORAL ROBERTS FELLWORDSEL 634 ORDER OF SELECTION (PUBLIC & PRIVATE)OTHBILNG 654 ASSN SCH BELONGS TO: OTHER ASSN BILINGOTHCHRST 678 ASSN SCH BELONGS TO: OTHR CHRISTN ASSNOTHECE 660 ASSN SCH BELONGS TO: OTHR ERLY CHLD EDOTHINDPV 668 ASSN SCH BELONGS TO: OTHR INDEP ASSNOTHINTL 662 ASSN SCH BELONGS TO: OTHR ASSN INTLOTHJEWSH 676 ASSN SCH BELONGS TO: OTHR JEWISH ASSNOTHMTSRI 649 ASSN SCH BELONGS TO: OTHR MONTESSORIOTHRELIG 679 ASSN SCH BELONGS TO: OTHR RELIGOUS ASSNOTHXPCHL 658 ASSN SCH BELONGS TO: OTHR ASC EXCP CHLOVLPSS 631 OVERLAP SAMPLE SIZE (PUBLIC & PRIVATE)PARCURRC 571 ESTABLISHING CURRICULUM - PARENT ASSOC.PARDISPL 580 SET DISCIPLINE POLICY - PARENT ASSOCIATNPARHIRNG 575 HIRING NEW FT TEACHERS - PARENT ASSOCPGMTYPE 641 THIS IS WHAT TYPE OF SCHOOLPMINENR 691 PERCENT MINORITY ENROLLMENTPRNCURRC 568 ESTABLISHING CURRICULUM - PRINCIPAL/HEADPRNDISPL 578 SET DISCIPLINE POLICY - PRINCIPALPRNHIRNG 573 HIRING NEW FT TEACHERS - PRINCIPALPSOURCE 614 SOURCE OF SCHOOL (PRIVATE)PSTRATM 622 91 SASS SCHOOL STRATUM CODE (PRIVATE)REGION 14 REGION CODEREPWGT1 28 REPLICATE WEIGHT 1REPWGT2 37 REPLICATE WEIGHT 2REPWGT3 46 REPLICATE WEIGHT 3REPWGT4 55 REPLICATE WEIGHT 4REPWGT5 64 REPLICATE WEIGHT 5REPWGT6 73 REPLICATE WEIGHT 6REPWGT7 82 REPLICATE WEIGHT 7REPWGT8 91 REPLICATE WEIGHT 8REPWGT9 100 REPLICATE WEIGHT 9REPWGT I 0 109 REPLICATE WEIGHT 10REPWGT11 118 REPLICATE WEIGHT 11REPWGT12 127 REPLICATE WEIGHT 12REPW GT13 136 REPLICATE WEIGHT 13
249
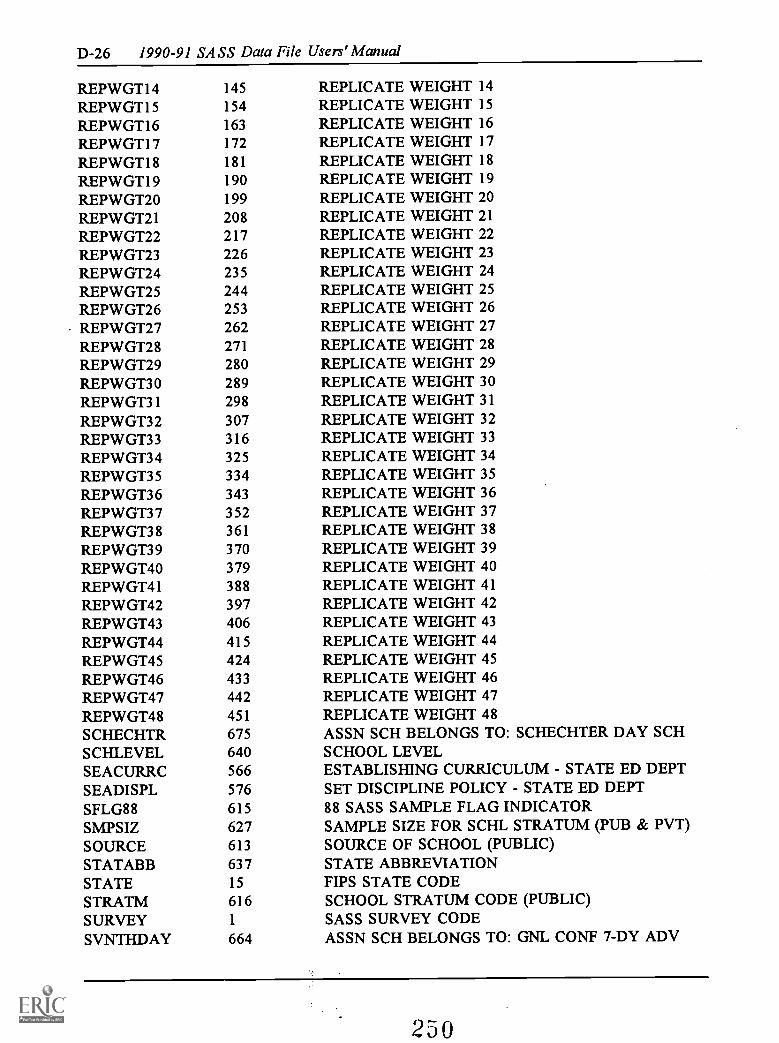
D-26 1990-91 SASS Data File Users' Manual
REPWGT14 145 REPLICATE WEIGHT 14REPWGT15 154 REPLICATE WEIGHT 15REPWGTI6 163 REPLICATE WEIGHT 16REPWGT17 172 REPLICATE WEIGHT 17REPWGT18 181 REPLICATE WEIGHT 18REPWGT19 190 REPLICATE WEIGHT 19REPWGT20 199 REPLICATE WEIGHT 20REPWGT21 208 REPLICATE WEIGHT 21REPWGT22 217 REPLICATE WEIGHT 22REPWGT23 226 REPLICATE WEIGHT 23REPWGT24 235 REPLICATE WEIGHT 24REPWGT25 244 REPLICATE WEIGHT 25REPWGT26 253 REPLICATE WEIGHT 26REPWGT27 262 REPLICATE WEIGHT 27REPWGT28 271 REPLICATE WEIGHT 28REPWGT29 280 REPLICATE WEIGHT 29REPWGT30 289 REPLICATE WEIGHT 30REPWGT31 298 REPLICATE WEIGHT 31REPWGT32 307 REPLICATE WEIGHT 32REPWGT33 316 REPLICATE WEIGHT 33REPWGT34 325 REPLICATE WEIGHT 34REPWGT35 334 REPLICATE WEIGHT 35REPWGT36 343 REPLICATE WEIGHT 36REPWGT37 352 REPLICATE WEIGHT 37REPWGT38 361 REPLICATE WEIGHT 38REPWGT39 370 REPLICATE WEIGHT 39REPWGT40 379 REPLICATE WEIGHT 40REPWGT41 388 REPLICATE WEIGHT 41REPWGT42 397 REPLICATE WEIGHT 42REPWGT43 406 REPLICATE WEIGHT 43REPWGT44 415 REPLICATE WEIGHT 44REPWGT45 424 REPLICATE WEIGHT 45REPWGT46 433 REPLICATE WEIGHT 46REPWGT47 442 REPLICATE WEIGHT 47REPWGT48 451 REPLICATE WEIGHT 48SCHECHTR 675 ASSN SCH BELONGS TO: SCHECHTER DAY SCHSCHLEVEL 640 SCHOOL LEVELSEACURRC 566 ESTABLISHING CURRICULUM - STATE ED DEPTSEADISPL 576 SET DISCIPLINE POLICY - STATE ED DEPTSFLG88 615 88 SASS SAMPLE FLAG INDICATORSMPSIZ 627 SAMPLE SIZE FOR San, STRATUM (PUB & PVT)SOURCE 613 SOURCE OF SCHOOL (PUBLIC)STATABB 637 STATE ABBREVIATIONSTATE 15 FIPS STATE CODESTRATM 616 SCHOOL STRATUM CODE (PUBLIC)SURVEY 1 SASS SURVEY CODESVNTHDAY 664 ASSN SCH BELONGS TO: GNL CONF 7-DY ADV
250

Appendix D D-27
TEACURRC 569 ESTABLISHING CURRICULUM - TEACHERSTEADISPL 579 SET DISCIPLINE POLICY - TEACHERSTEAHIRNG 574 HIRING NEW FT TEACHERS - TEACHERSTRAININD 507 PART IN TRAINING PGM FOR INDIAN ADMINSTUITIN 682 HIGHEST ANNUAL TUITION CHARGEDTYPOLOGY 18 NINE LEVEL RELIGIOUS TYPOLOGY
251
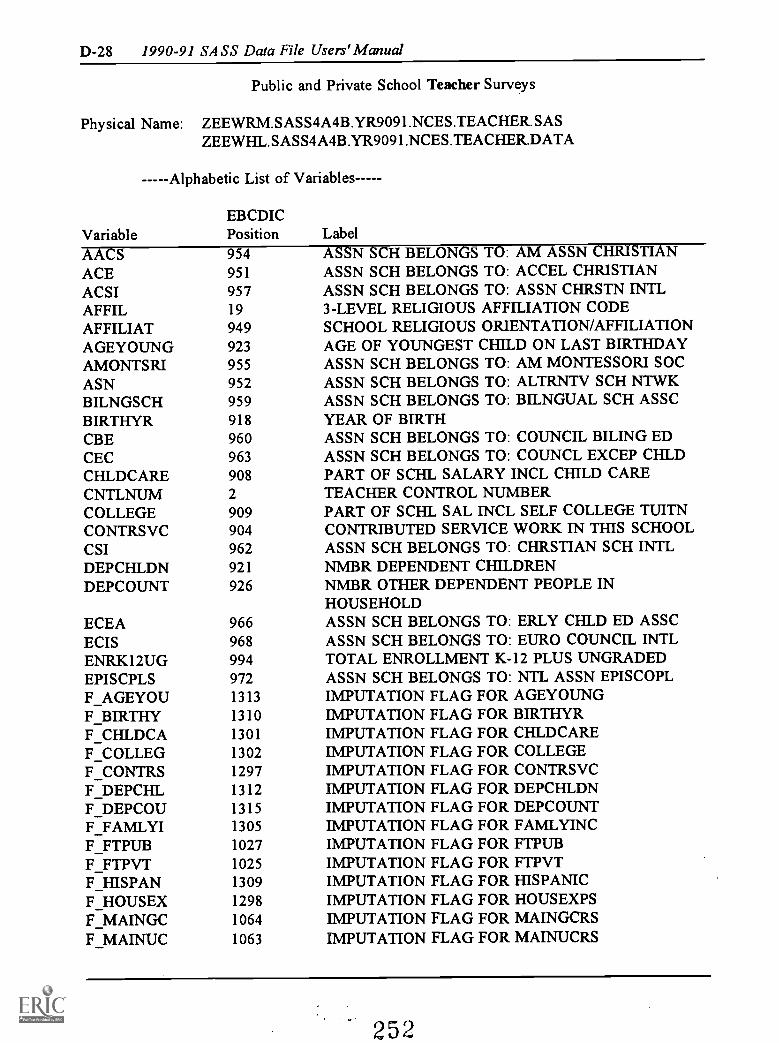
D-28 1990-91 SASS Data File Users' Manual
Public and Private School Teacher Surveys
Physical Name: ZEEWRM.SASS4A4B.YR9091.NCES.TEACHER.SASZEEWHL.SASS4A4B.YR9091.NCES.TEACHER.DATA
Variable
Alphabetic List of Variables
EBCDICPosition Label
AACSACEACSIAFFILAFFILIATAGEYOUNGAMONTSRIASNBILNGSCHBIRTHYRCBECECCHLDCARECNTLNUMCOLLEGECONTRSVCCSIDEPCHLDNDEPCOUNT
ECEAECISENRK12UGEPISCPLSF_AGEYOUF_BIRTHYF_CHLDCAF COLLEGF CONTRSFIDEPCHLF_DEPCOUF_FAMLYIF_FTPUBF_FTPVTF_HISPANF_HOUSEXF_MAINGCF_MAINUC
954 ASSN SCH BELONGS TO: AM ASSN CHRISTIAN951 ASSN SCH BELONGS TO: ACCEL CHRISTIAN957 ASSN SCH BELONGS TO: ASSN CHRSTN INTL19 3-LEVEL RELIGIOUS AFFILIATION CODE949 SCHOOL RELIGIOUS ORIENTATION/AFFILIATION923 AGE OF YOUNGEST CHILD ON LAST BIRTHDAY955 ASSN SCH BELONGS TO: AM MONTESSORI SOC952 ASSN SCH BELONGS TO: ALTRNTV SCH NTWK959 ASSN SCH BELONGS TO: BILNGUAL SCH ASSC918 YEAR OF BIRTH960 ASSN SCH BELONGS TO: COUNCIL BILING ED963 ASSN SCH BELONGS TO: COUNCL EXCEP CHLD908 PART OF SCHL SALARY INCL CHILD CARE2 TEACHER CONTROL NUMBER909 PART OF SCHL SAL INCL SELF COLLEGE TUITN904 CONTRIBUTED SERVICE WORK IN THIS SCHOOL962 ASSN SCH BELONGS TO: CHRSTIAN SCH INTL921 NMBR DEPENDENT CHILDREN926 NMBR OTHER DEPENDENT PEOPLE IN
HOUSEHOLD966 ASSN SCH BELONGS TO: ERLY CHLD ED ASSC968 ASSN SCH BELONGS TO: EURO COUNCIL INTL994 TOTAL ENROLLMENT K-12 PLUS UNGRADED972 ASSN SCH BELONGS TO: NTL ASSN EPISCOPL1313 IMPUTATION FLAG FOR AGEYOUNG1310 IMPUTATION FLAG FOR BIRTHYR1301 IMPUTATION FLAG FOR CHLDCARE1302 IMPUTATION FLAG FOR COLLEGE1297 IMPUTATION FLAG FOR CONTRSVC1312 IMPUTATION FLAG FOR DEPCHLDN1315 IMPUTATION FLAG FOR DEPCOUNT1305 IMPUTATION FLAG FOR FAMLYINC1027 IMPUTATION FLAG FOR FTPUB1025 IMPUTATION FLAG FOR FTPVT1309 IMPUTATION FLAG FOR HISPANIC1298 IMPUTATION FLAG FOR HOUSEXPS1064 IMPUTATION FLAG FOR MAINGCRS1063 IMPUTATION FLAG FOR MAINUCRS
252
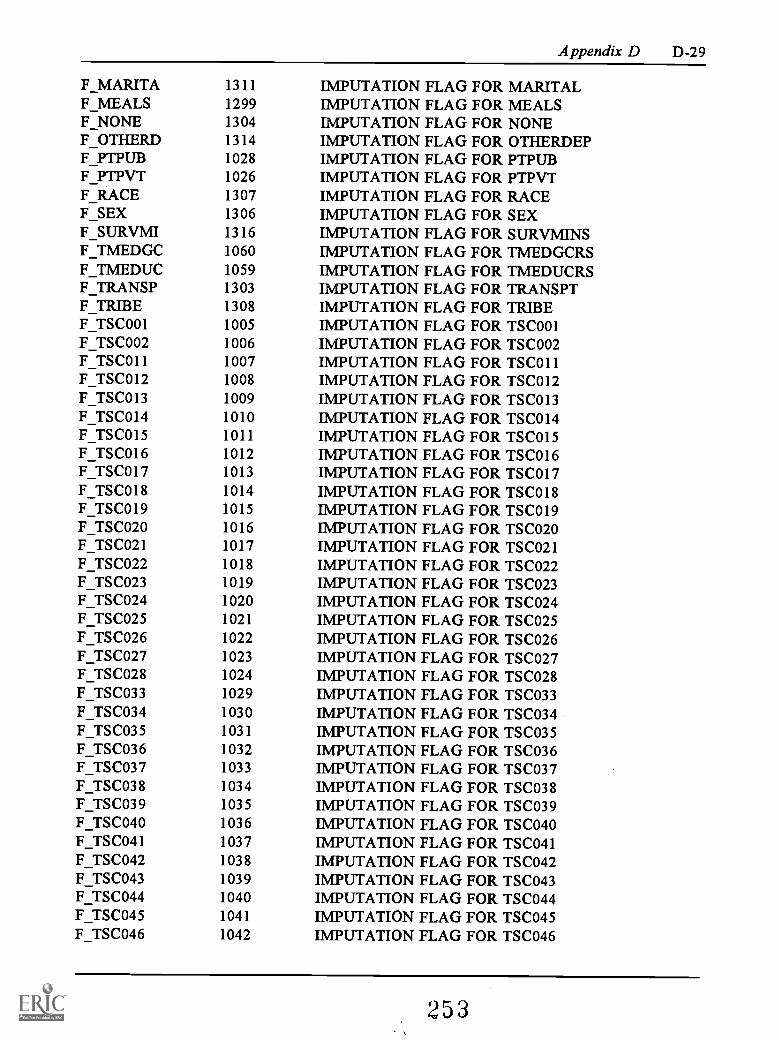
Appendix D D-29
F_MARITA 1311F_MEALS 1299F_NONE 1304F_OTHERD 1314F_PTPUB 1028F_PTPVT 1026F_RACE 1307F_SEX 1306F_SURVMI 1316F_TMEDGC 1060F_TMEDUC 1059F_TRANSP 1303F_TRIBE 1308F_TSC001 1005F_TSC002 1006F_TSCO1 1 1007F_TSC012 1008F_TSC013 1009F_TSC014 1010F_TSC015 1011F_TSC016 1012F_TSC017 1013F_TSC018 1014F_TSC019 1015F_TSCO20 1016F_TSCO21 1017F_TSCO22 1018F TSCO23 1019F_TSCO24 1020F_TSCO25 1021F TSCO26 1022F TSCO27 1023F_TSCO28 1024F TSC033 1029F TSC034 1030F_TSC035 1031F_TSC036 1032F TSC037 1033F_TSC038 1034F_TSC039 1035F_TSC040 1036F_TSC041 1037F_TSC042 1038F_TSC043 1039F_TSC044 1040F_TSC045 1041F TSC046 1042
IMPUTATIONIMPUTATIONIMPUTATIONIMPUTATIONIMPUTATIONIMPUTATIONIMPUTATIONIMPUTATIONIMPUTATIONIMPUTATIONIMPUTATIONIMPUTATIONIMPUTATIONIMPUTATIONIMPUTATIONIMPUTATIONIMPUTATIONIMPUTATIONIMPUTATIONIMPUTATIONIMPUTATIONIMPUTATIONIMPUTATIONIMPUTATIONIMPUTATIONIMPUTATIONIMPUTATIONIMPUTATIONIMPUTATIONIMPUTATIONIMPUTATIONIMPUTATIONIMPUTATIONIMPUTATIONIMPUTATIONIMPUTATIONIMPUTATIONIMPUTATIONIMPUTATIONIMPUTATIONIMPUTATIONIMPUTATIONIMPUTATIONIMPUTATIONIMPUTATIONIMPUTATIONIMPUTATION
FLAG FOR MARITALFLAG FOR MEALSFLAG FOR NONEFLAG FOR OTHERDEPFLAG FOR PTPUBFLAG FOR PTPVTFLAG FOR RACEFLAG FOR SEXFLAG FOR SURVMINSFLAG FOR TMEDGCRSFLAG FOR TMEDUCRSFLAG FOR TRANSPTFLAG FOR TRIBEFLAG FOR TSC001FLAG FOR TSC002FLAG FOR TSCO1 1FLAG FOR TSC012FLAG FOR TSC013FLAG FOR TSC014FLAG FOR TSC015FLAG FOR TSC016FLAG FOR TSC017FLAG FOR TSC018FLAG FOR TSC019FLAG FOR TSCO20FLAG FOR TSCO21FLAG FOR TSCO22FLAG FOR TSCO23FLAG FOR TSCO24FLAG FOR TSCO25FLAG FOR TSCO26FLAG FOR TSCO27FLAG FOR TSCO28FLAG FOR TSC033FLAG FOR TSC034FLAG FOR TSC035FLAG FOR TSC036FLAG FOR TSC037FLAG FOR TSC038FLAG FOR TSC039FLAG FOR TSC040FLAG FOR TSC041FLAG FOR TSC042FLAG FOR TSC043FLAG FOR TSC044FLAG FOR TSC045FLAG FOR TSC046
253

D-30 1990-91 SASS Data File Users' Manual
F_TSC047 1043 IMPUTATION FLAG FOR TSC047F_TSC048 1044 IMPUTATION FLAG FOR TSC048F_TSC049 1045 IMPUTATION FLAG FOR TSC049F TSC050 1046 IMPUTATION FLAG FOR TSC050F_TSC051 1047 IMPUTATION FLAG FOR TSC051F_TSC052 1048 IMPUTATION FLAG FOR TSC052F_TSC053 1049 IMPUTATION FLAG FOR TSC053F_TSC054 1050 IMPUTATION FLAG FOR TSC054F_TSC055 1051 IMPUTATION FLAG FOR TSC055F_TSC056 1052 IMPUTATION FLAG FOR TSC056F_TSC057 1053 IMPUTATION FLAG FOR TSC057F_TSC058 1054 IMPUTATION FLAG FOR TSC058F TSC059 1055 IMPUTATION FLAG FOR TSC059F_TSC060 1056 IMPUTATION FLAG FOR TSC060F_TSC061 1057 IMPUTATION FLAG FOR TSC061F_TSC062 1058 IMPUTATION FLAG FOR TSC062F_TSC065 1061 IMPUTATION FLAG FOR TSC065F_TSC066 1062 IMPUTATION FLAG FOR TSC066F TSC069 1065 IMPUTATION FLAG FOR TSC069F_TSC070 1066 IMPUTATION FLAG FOR TSC070F_TSC071 1067 IMPUTATION FLAG FOR TSC071F_TSC072 1068 IMPUTATION FLAG FOR TSC072F_TSC073 1069 IMPUTATION FLAG FOR TSC073FTSC074 1070 IMPUTATION FLAG FOR TSC074F_TSC075 1071 IMPUTATION FLAG FOR TSC075F TSC076 1072 IMPUTATION FLAG FOR TSC076F_TSC077 1073 IMPUTATION FLAG FOR TSC077F_TSC078 1074 IMPUTATION FLAG FOR TSC078F TSC079 1075 IMPUTATION FLAG FOR TSC079F_TSC080 1076 IMPUTATION FLAG FOR TSC080F_TSC081 1077 IMPUTATION FLAG FOR TSC081F_TSC082 1078 IMPUTATION FLAG FOR TSC082F_TSC083 1079 IMPUTATION FLAG FOR TSC083F_TSC084 1080 IMPUTATION FLAG FOR TSC084F_TSC085 1081 IMPUTATION FLAG FOR TSC085F TSC086 1082 IMPUTATION FLAG FOR TSC086F_TSC087 1083 IMPUTATION FLAG FOR TSC087F_TSC088 1084 IMPUTATION FLAG FOR TSC088F TSC089 1085 IMPUTATION FLAG FOR TSC089F_TSC090 1086 IMPUTATION FLAG FOR TSC090F_TSC091 1087 IMPUTATION FLAG FOR TSC091F_TSC092 1088 IMPUTATION FLAG FOR TSC092F_TSC093 1089 IMPUTATION FLAG FOR TSC093F_TSC094 1090 IMPUTATION FLAG FOR TSC094F_TSC095 1091 IMPUTATION FLAG FOR TSC095F TSC096 1092 IMPUTATION FLAG FOR TSC096F TSC097 1093 IMPUTATION FLAG FOR TSC097
254

Appendix D D-31
F_TSC098 1094 IMPUTATION FLAG FOR TSC098F_TSC099 1095 IMPUTATION FLAG FOR TSC099F_TSC100 1096 IMPUTATION FLAG FOR TSC100F_TSC101 1097 IMPUTATION FLAG FOR TSC101F_TSC102 1098 IMPUTATION FLAG FOR TSC102F_TSC103 1099 IMPUTATION FLAG FOR TSC103F_TSC104 1100 IMPUTATION FLAG FOR TSC104F_TSC105 1101 IMPUTATION FLAG FOR TSC105F_TSC106 1102 IMPUTATION FLAG FOR TSC106F TSC107 1103 IMPUTATION FLAG FOR TSC107F TSC108 1104 IMPUTATION FLAG FOR TSC108FTSC109 1105 IMPUTATION FLAG FOR TSC109F TSC110 1106 IMPUTATION FLAG FOR TSC110FITSC111 1107 IMPUTATION FLAG FOR TSC111F_TSC112 1108 IMPUTATION FLAG FOR TSC112F_TSC113 1109 IMPUTATION FLAG FOR TSC113F_TSC114 1110 IMPUTATION FLAG FOR TSC114F_TSC115 1111 IMPUTATION FLAG FOR TSC115F_TSC116 1112 IMPUTATION FLAG FOR TSC116F_TSC117 1113 IMPUTATION FLAG FOR TSC117F TSC118 1114 IMPUTATION FLAG FOR TSC118F TSC119 1115 IMPUTATION FLAG FOR TSC119F_TSC120 1116 IMPUTATION FLAG FOR TSC120F_TSC121 1117 IMPUTATION FLAG FOR TSC121F_TSC122 1118 IMPUTATION FLAG FOR TSC122F_TSC123 1119 IMPUTATION FLAG FOR TSC123F_TSC124 1120 IMPUTATION FLAG FOR TSC124F_TSC125 1121 IMPUTATION FLAG FOR TSC125F TSC126 1122 IMPUTATION FLAG FOR TSC126F TSC127 1123 IMPUTATION FLAG FOR TSC127FITSC128 1124 IMPUTATION FLAG FOR TSC128F_TSC129 1125 IMPUTATION FLAG FOR TSC129F TSC130 1126 IMPUTATION FLAG FOR TSC130F TSC131 1127 IMPUTATION FLAG FOR TSC131F_TSC132 1128 IMPUTATION FLAG FOR TSC132F_TSC133 1129 IMPUTATION FLAG FOR TSC133F_TSC134 1130 IMPUTATION FLAG FOR TSC134F_TSC135 1131 IMPUTATION FLAG FOR TSC135F_TSC136 1132 IMPUTATION FLAG FOR TSC136F TSC137 1133 IMPUTATION FLAG FOR TSC137F_TSC138 1134 IMPUTATION FLAG FOR TSC138F_TSC139 1135 IMPUTATION FLAG FOR TSC139F_TSC140 1136 IMPUTATION FLAG FOR TSC140F TSC141 1137 IMPUTATION FLAG FOR TSC141F TSC142 1138 IMPUTATION FLAG FOR TSC142F_TSC143 1139 IMPUTATION FLAG FOR TSC143F TSC144 1140 IMPUTATION FLAG FOR TSC144
25.5

D-32 1990-91 SA SS Data File Users' Manual
F_TSC145 1141 IMPUTATION FLAG FOR TSC145F_TSC146 1142 IMPUTATION FLAG FOR TSC146F_TSC147 1143 IMPUTATION FLAG FOR TSC147F_TSC148 1144 IMPUTATION FLAG FOR TSC148F_TSC149 1145 IMPUTATION FLAG FOR TSC149F TSC150 1146 IMPUTATION FLAG FOR TSC150F_TSC151 1147 IMPUTATION FLAG FOR TSC151F_TSC152 1148 IMPUTATION FLAG FOR TSC152F TSC153 1149 IMPUTATION FLAG FOR TSC153F_TSC154 1150 IMPUTATION FLAG FOR TSC154F_TSC155 1151 IMPUTATION FLAG FOR TSC155F_TSC156 1152 IMPUTATION FLAG FOR TSC156F_TSC157 1153 IMPUTATION FLAG FOR TSC157F_TSC158 1154 IMPUTATION FLAG FOR TSC158F_TSC159 1155 IMPUTATION FLAG FOR TSC159F TSC160 1156 IMPUTATION FLAG FOR TSC160F_TSC161 1157 IMPUTATION FLAG FOR TSC161F_TSC162 1158 IMPUTATION FLAG FOR TSC162F TSC163 1159 IMPUTATION FLAG FOR TSC163F_TSC164 1160 IMPUTATION FLAG FOR TSC164F_TSC165 1161 IMPUTATION FLAG FOR TSC165F_TSC166 1162 IMPUTATION FLAG FOR TSC166F_TSC167 1163 IMPUTATION FLAG FOR TSC167F_TSC168 1164 IMPUTATION FLAG FOR TSC168F TSC169 1165 IMPUTATION FLAG FOR TSC169F_TSC170 1166 IMPUTATION FLAG FOR TSC170F_TSC171 1167 IMPUTATION FLAG FOR TSC171F_TSC172 1168 IMPUTATION FLAG FOR TSC172F_TSC173 1169 IMPUTATION FLAG FOR TSC173F_TSC174 1170 IMPUTATION FLAG FOR TSC174F_TSC175 1171 IMPUTATION FLAG FOR TSC175F_TSC176 1172 IMPUTATION FLAG FOR TSC176F_TSC177 1173 IMPUTATION FLAG FOR TSC177F_TSC178 1174 IMPUTATION FLAG FOR TSC178F_TSC179 1175 IMPUTATION FLAG FOR TSC179F_TSC180 1176 IMPUTATION FLAG FOR TSC180F_TSC181 1177 IMPUTATION FLAG FOR TSC181F_TSC182 1178 IMPUTATION FLAG FOR TSC182F_TSC183 1179 IMPUTATION FLAG FOR TSC183F_TSC 184 1180 IMPUTATION FLAG FOR TSC184F_TSC185 1181 IMPUTATION FLAG FOR TSC185F_TSC186 1182 IMPUTATION FLAG FOR TSC186F_TSC187 1183 IMPUTATION FLAG FOR TSC187F_TSC188 1184 IMPUTATION FLAG FOR TSC188F_TSC189 1185 IMPUTATION FLAG FOR TSC189F_TSC190 1186 IMPUTATION FLAG FOR TSC190F_TSC191 1187 IMPUTATION FLAG FOR TSC191
256

Appendix D D-33
F_TSC192 1188 IMPUTATION FLAG FOR TSC192F_TSC193 1189 IMPUTATION FLAG FOR TSC193F_TSC194 1190 IMPUTATION FLAG FOR TSC194F_TSC195 1191 IMPUTATION FLAG FOR TSC195F_TSC196 1192 IMPUTATION FLAG FOR TSC196F TSC197 1193 IMPUTATION FLAG FOR TSC197F TSC198 1194 IMPUTATION FLAG FOR TSC198F TSC199 1195 IMPUTATION FLAG FOR TSC199F TSC200 1196 IMPUTATION FLAG FOR TSC200F_TSC201 1197 IMPUTATION FLAG FOR TSC201F_TSC202 1198 IMPUTATION FLAG FOR TSC202F_TSC203 1199 IMPUTATION FLAG FOR TSC203F_TSC204 1200 IMPUTATION FLAG FOR TSC204F_TSC205 1201 IMPUTATION FLAG FOR TSC205F_TSC206 1202 IMPUTATION FLAG FOR TSC206F_TSC207 1203 IMPUTATION FLAG FOR TSC207F_TSC208 1204 IMPUTATION FLAG FOR TSC208F_TSC209 1205 IMPUTATION FLAG FOR TSC209F TSC210 1206 IMPUTATION FLAG FOR TSC210F_TSC211 1207 IMPUTATION FLAG FOR TSC211F_TSC212 1208 IMPUTATION FLAG FOR TSC212F_TSC213 1209 IMPUTATION FLAG FOR TSC213F_TSC214 1210 IMPUTATION FLAG FOR TSC214F_TSC215 1211 IMPUTATION FLAG FOR TSC215F_TSC216 1212 IMPUTATION FLAG FOR TSC216F_TSC217 1213 IMPUTATION FLAG FOR TSC217F_TSC218 1214 IMPUTATION FLAG FOR TSC218F_TSC219 1215 IMPUTATION FLAG FOR TSC219F_TSC220 1216 IMPUTATION FLAG FOR TSC220F_TSC221 1217 IMPUTATION FLAG FOR TSC221F_TSC222 1218 IMPUTATION FLAG FOR TSC222F_TSC223 1219 IMPUTATION FLAG FOR TSC223F TSC224 1220 IMPUTATION FLAG FOR TSC224F_TSC225 1221 IMPUTATION FLAG FOR TSC225F_TSC226 1222 IMPUTATION FLAG FOR TSC226F_TSC227 1223 IMPUTATION FLAG FOR TSC227F_TSC228 1224 IMPUTATION FLAG FOR TSC228F_TSC229 1225 IMPUTATION FLAG FOR TSC229F_TSC230 1226 IMPUTATION FLAG FOR TSC230F_TSC231 1227 IMPUTATION FLAG FOR TSC231F_TSC232 1228 IMPUTATION FLAG FOR TSC232F_TSC233 1229 IMPUTATION FLAG FOR TSC233F_TSC234 1230 IMPUTATION FLAG FOR TSC234F_TSC235 1231 IMPUTATION FLAG FOR TSC235F TSC236 1232 IMPUTATION FLAG FOR TSC236F_TSC237 1233 IMPUTATION FLAG FOR TSC237F_TSC238 1234 IMPUTATION FLAG FOR TSC238
257

D-34 1990-91 SA SS Data File Users' Manual
F TSC239 1235 IMPUTATION FLAG FOR TSC239F TSC240 1236 IMPUTATION FLAG FOR TSC240F_TSC241 1237 IMPUTATION FLAG FOR TSC241F TSC242 1238 IMPUTATION FLAG FOR TSC242F TSC243 1239 IMPUTATION FLAG FOR TSC243F TSC244 1240 IMPUTATION FLAG FOR TSC244F_TSC245 1241 IMPUTATION FLAG FOR TSC245F_TSC246 1242 IMPUTATION FLAG FOR TSC246F_TSC247 1243 IMPUTATION FLAG FOR TSC247F_TSC248 1244 IMPUTATION FLAG FOR TSC248F TSC249 1245 IMPUTATION FLAG FOR TSC249F TSC250 1246 IMPUTATION FLAG FOR TSC250F TSC251 1247 IMPUTATION FLAG FOR TSC251F TSC252 1248 IMPUTATION FLAG FOR TSC252FITSC253 1249 IMPUTATION FLAG FOR TSC253F_TSC254 1250 IMPUTATION FLAG FOR TSC254F_TSC255 1251 IMPUTATION FLAG FOR TSC255F_TSC256 1252 IMPUTATION FLAG FOR TSC256F_TSC257 1253 IMPUTATION FLAG FOR TSC257F_TSC258 1254 IMPUTATION FLAG FOR TSC258F TSC259 1255 IMPUTATION FLAG FOR TSC259F TSC260 1256 IMPUTATION FLAG FOR TSC260FITSC261 1257 IMPUTATION FLAG FOR TSC261F_TSC262 1258 IMPUTATION FLAG FOR TSC262F_TSC263 1259 IMPUTATION FLAG FOR TSC263F_TSC264 1260 IMPUTATION FLAG FOR TSC264F_TSC265 1261 IMPUTATION FLAG FOR TSC265F_TSC266 1262 IMPUTATION FLAG FOR TSC266F_TSC267 1263 IMPUTATION FLAG FOR TSC267F_TSC268 1264 IMPUTATION FLAG FOR TSC268F_TSC269 1265 IMPUTATION FLAG FOR TSC269F TSC270 1266 IMPUTATION FLAG FOR TSC270F TSC271 1267 IMPUTATION FLAG FOR TSC271F TSC272 1268 IMPUTATION FLAG FOR TSC272F TSC273 1269 IMPUTATION FLAG FOR TSC273F TSC274 1270 IMPUTATION FLAG FOR TSC274F TSC275 1271 IMPUTATION FLAG FOR TSC275F TSC276 1272 IMPUTATION FLAG FOR TSC276FITSC277 1273 IMPUTATION FLAG FOR TSC277F_TSC278 1274 IMPUTATION FLAG FOR TSC278F_TSC279 1275 IMPUTATION FLAG FOR TSC279F_TSC280 1276 IMPUTATION FLAG FOR TSC280F TSC281 1277 IMPUTATION FLAG FOR TSC281F_TSC282 1278 IMPUTATION FLAG FOR TSC282F TSC283 1279 IMPUTATION FLAG FOR TSC283F TSC284 1280 IMPUTATION FLAG FOR TSC284F TSC285 1281 IMPUTATION FLAG FOR TSC285
258

Appendix D D-35
F TSC286 1282 IMPUTATION FLAG FOR TSC286F TSC287 1283 IMPUTATION FLAG FOR TSC287F TSC288 1284 IMPUTATION FLAG FOR TSC288F_TSC289 1285 IMPUTATION FLAG FOR TSC289F_TSC290 1286 IMPUTATION FLAG FOR TSC290F_TSC291 1287 IMPUTATION FLAG FOR TSC291F_TSC292 1288 IMPUTATION FLAG FOR TSC292F_TSC293 1289 IMPUTATION FLAG FOR TSC293F_TSC294 1290 IMPUTATION FLAG FOR TSC294F_TSC295 1291 IMPUTATION FLAG FOR TSC295F_TSC296 1292 IMPUTATION FLAG FOR TSC296F_TSC297 1293 IMPUTATION FLAG FOR TSC297F_TSC298 1294 IMPUTATION FLAG FOR TSC298F_TSC299 1295 IMPUTATION FLAG FOR TSC299F_TSC300 1296 IMPUTATION FLAG FOR TSC300F_TUITIO 1300 IMPUTATION FLAG FOR TUITIONFAMLYINC 912 CATEGORY OF TOTAL 1990 FAMILY INCOMEFRIENDS 970 ASSN SCH BELONGS TO: FRNDS COUNCIL EDFTPUB 494 YRS TEACHING FULL-TIME IN PUBLIC SCHLFTPVT 490 YRS TEACHING FULL-TIME IN PRIVATE SCHLHBREWDAY 981 ASSN SCH BELONGS TO: NTL SOC HEBREW DAYHISPANIC 917 ARE OF HISPANIC ORIGINHOUSEXPS 905 PART OF SCHOOL SALARY INCLUDES HOUSINGJESUITS 978 ASSN SCH BELONGS TO: JESUIT SCNDRY ASSNLABSCHLS 976 ASSN SCH BELONGS TO: NTL ASSN LABORATRYLEVEL 1004 TEACHER (EL/SEC) LEVELLOCALE 1003 TYPE OF LOCALEMAINGCRS 552 CATEGORIZED # GRADUATE CRSES MAIN FIELDMAINUCRS 551 CATEGORIZED # UNDERGRAD CRSES MAIN FIELDMARITAL 920 CURRENT MARITAL STATUSMEALS 906 PART OF SCHL SALARY INCL MEALSMLTRYSCH 958 ASSN SCH BELONGS TO: ASSN MILITARY SCHNAIS 973 ASSN SCH BELONGS TO: NTL ASSN INDEPENDNAPEC 964 ASSN SCH BELONGS TO: NTL ASSN EXCP CHLNCACS 953 ASSN SCH BELONGS TO: ALTRNTV COMM SCHNCEA 977 ASSN SCH BELONGS TO: NTL CATH ED ASSNNCNE 979 ASSN SCH BELONGS TO: NTL CNTR NEIGHBORNFCS 980 ASSN SCH BELONGS TO: NTL FED CHURCH SCHNIPSA 974 ASSN SCH BELONGS TO: NTL INDEP PVT SCHNONE 911 PART OF SCHL SAL INCL NO INCOME-IN-KINDNONE2 988 ASSN SCH BELONGS TO: NONENONRELIG 987 ASSN SCH BELONGS TO: OTHR NONRELIG ASSNORALRBTS 984 ASSN SCH BELONGS TO: ORAL ROBERTS FELLWOTHBILNG 961 ASSN SCH BELONGS TO: OTHER ASSN BILINGOTHCHRST 985 ASSN SCH BELONGS TO: OTHR CHRISTN ASSNOTHECE 967 ASSN SCH BELONGS TO: OTHR ERLY CHLD EDOTHERDEP 925 ARE OTHER DEPENDENT PEOPLE IN HOUSEHOLD
259

D-36 1990-91 SASS Data File Users.' Manual
OTHINDPV 975 ASSN SCH BELONGS TO: OTHR INDEP ASSNOTHINTL 969 ASSN SCH BELONGS TO: OTHR ASSN INTLOTHJEWSH 983 ASSN SCH BELONGS TO: OTHR JEWISH ASSNOTHMTSRI 956 ASSN SCH BELONGS TO: OTHR MONTESSORIOTHRELIG 986 ASSN SCH BELONGS TO: OTHR RELIGOUS ASSNOTHXPCHL 965 ASSN SCH BELONGS TO: OTHR ASC EXCP CHLPGMTYPE 948 THIS IS WHAT TYPE OF SCHOOLPMINENR 998 PERCENT MINORITY ENROLLMENTPTPUB 496 YRS TEACHING PART-TIME IN PUBLIC SCHLPTPVT 492 YRS TEACHING PART-TIME IN PRIVATE SCHLRACE 915 RACEREGION 16 REGION CODEREPWGT1 30 REPLICATE WEIGHT 1REPWGT2 39 REPLICATE WEIGHT 2REPWGT3 48 REPLICATE WEIGHT 3REPWGT4 57 REPLICATE WEIGHT 4REPWGT5 66 REPLICATE WEIGHT 5REPWGT6 75 REPLICATE WEIGHT 6REPWGT7 84 REPLICATE WEIGHT 7REPWGT8 93 REPLICATE WEIGHT 8REPWGT9 102 REPLICATE WEIGHT 9REPWGT10 111 REPLICATE WEIGHT 10REPWGT11 120 REPLICATE WEIGHT 11REPWGT12 129 REPLICATE WEIGHT 12REPWGT13 138 REPLICATE WEIGHT 13REPWGT14 147 REPLICATE WEIGHT 14REPW GT15 156 REPLICATE WEIGHT 15REPWGT16 165 REPLICATE WEIGHT 16REPW GT17 174 REPLICATE WEIGHT 17REPWGT18 183 REPLICATE WEIGHT 18REPWGT19 192 REPLICATE WEIGHT 19REPWGT20 201 REPLICATE WEIGHT 20REPWGT21 210 REPLICATE WEIGHT 21REPWGT22 219 REPLICATE WEIGHT 22REPWGT23 228 REPLICATE WEIGHT 23REPWGT24 237 REPLICATE WEIGHT 24REPWGT25 246 REPLICATE WEIGHT 25REPWGT26 255 REPLICATE WEIGHT 26REPWGT27 264 REPLICATE WEIGHT 27REPWGT28 273 REPLICATE WEIGHT 28REPWGT29 282 REPLICATE WEIGHT 29REPWGT30 291 REPLICATE WEIGHT 30REPW GT31 300 REPLICATE WEIGHT 31REPWGT32 309 REPLICATE WEIGHT 32REPWGT33 318 REPLICATE WEIGHT 33REPWGT34 327 REPLICATE WEIGHT 34REPWGT35 336 REPLICATE WEIGHT 35
260
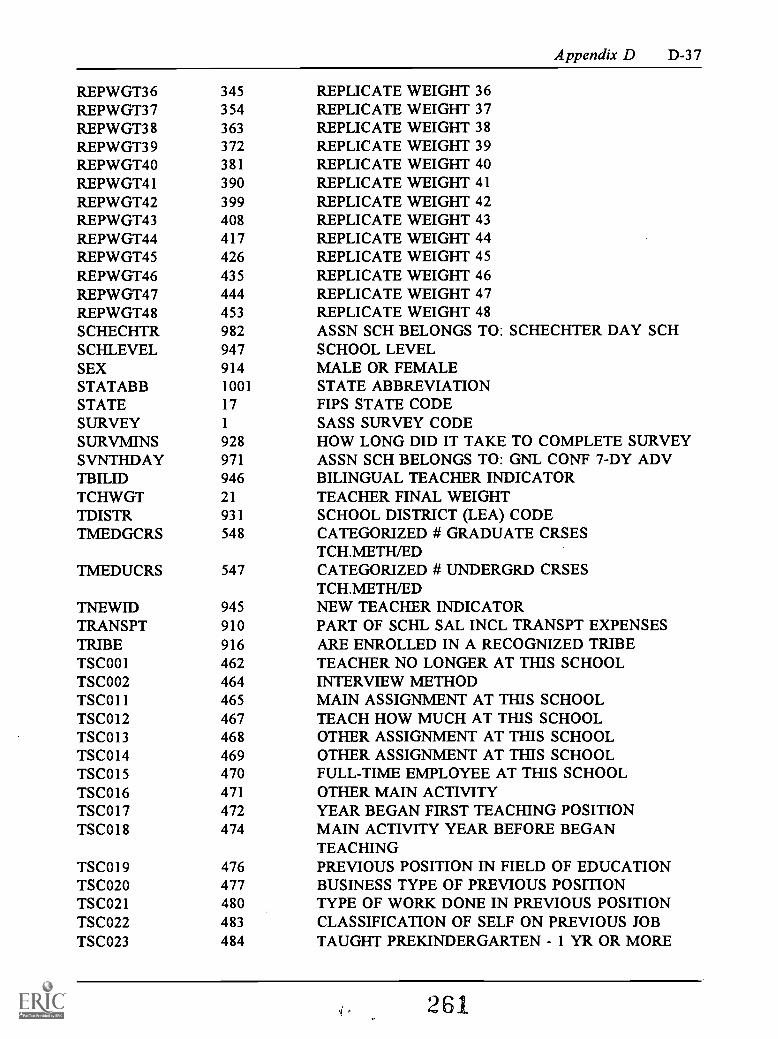
Appendix D D-37
REPWGT36 345 REPLICATE WEIGHT 36REPWGT37 354 REPLICATE WEIGHT 37REPWGT38 363 REPLICATE WEIGHT 38REPWGT39 372 REPLICATE WEIGHT 39REPWGT40 381 REPLICATE WEIGHT 40REPWGT41 390 REPLICATE WEIGHT 41REPWGT42 399 REPLICATE WEIGHT 42REPWGT43 408 REPLICATE WEIGHT 43REPWGT44 417 REPLICATE WEIGHT 44REPWGT45 426 REPLICATE WEIGHT 45REPWGT46 435 REPLICATE WEIGHT 46REPWGT47 444 REPLICATE WEIGHT 47REPWGT48 453 REPLICATE WEIGHT 48SCHECHTR 982 ASSN SCH BELONGS TO: SCHECHTER DAY SCHSCHLEVEL 947 SCHOOL LEVELSEX 914 MALE OR FEMALESTATABB 1001 STATE ABBREVIATIONSTATE 17 FIPS STATE CODESURVEY 1 SASS SURVEY CODESURVMINS 928 HOW LONG DID IT TAKE TO COMPLETE SURVEYSVNTHDAY 971 ASSN SCH BELONGS TO: GNL CONF 7-DY ADVTBILID 946 BILINGUAL TEACHER INDICATORTCHWGT 21 TEACHER FINAL WEIGHTTDISTR 931 SCHOOL DISTRICT (LEA) CODETMEDGCRS 548 CATEGORIZED # GRADUATE CRSES
TCH.METH/EDTMEDUCRS 547 CATEGORIZED # UNDERGRD CRSES
TCH.METH/EDTNEWID 945 NEW TEACHER INDICATORTRANSPT 910 PART OF SCHL SAL INCL TRANSPT EXPENSESTRIBE 916 ARE ENROLLED IN A RECOGNIZED TRIBETSC001 462 TEACHER NO LONGER AT THIS SCHOOLTSC002 464 INTERVIEW METHODTSC011 465 MAIN ASSIGNMENT AT THIS SCHOOLTSC012 467 TEACH HOW MUCH AT THIS SCHOOLTSC013 468 OTHER ASSIGNMENT AT THIS SCHOOLTSC014 469 OTHER ASSIGNMENT AT THIS SCHOOLTSC015 470 FULL-TIME EMPLOYEE AT THIS SCHOOLTSC016 471 OTHER MAIN ACTIVITYTSC017 472 YEAR BEGAN FIRST TEACHING POSITIONTSC018 474 MAIN ACTIVITY YEAR BEFORE BEGAN
TEACHINGTSC019 476 PREVIOUS POSITION IN FIELD OF EDUCATIONTSCO20 477 BUSINESS TYPE OF PREVIOUS POSITIONTSCO21 480 TYPE OF WORK DONE IN PREVIOUS POSITIONTSCO22 483 CLASSIFICATION OF SELF ON PREVIOUS JOBTSCO23 484 TAUGHT PREKINDERGARTEN - 1 YR OR MORE
261
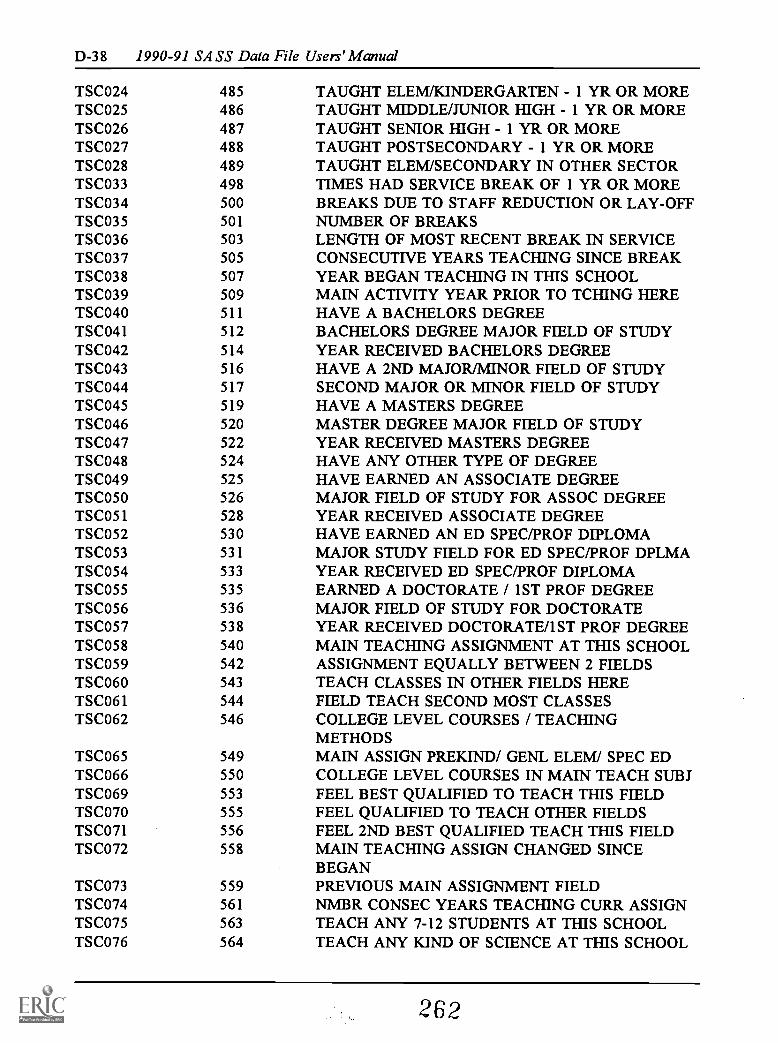
D -3 8 1990-91 SASS Data File Users' Manual
TSCO24 485 TAUGHT ELEM/KINDERGARTEN - 1 YR OR MORETSCO25 486 TAUGHT MIDDLE/JUNIOR HIGH - 1 YR OR MORETSCO26 487 TAUGHT SENIOR HIGH - 1 YR OR MORETSCO27 488 TAUGHT POSTSECONDARY - 1 YR OR MORETSCO28 489 TAUGHT ELEM/SECONDARY IN OTHER SECTORTSC033 498 TIMES HAD SERVICE BREAK OF 1 YR OR MORETSC034 500 BREAKS DUE TO STAFF REDUCTION OR LAY-OFFTSC035 501 NUMBER OF BREAKSTSC036 503 LENGTH OF MOST RECENT BREAK IN SERVICETS C037 505 CONSECUTIVE YEARS TEACHING SINCE BREAKTS C038 507 YEAR BEGAN TEACHING IN THIS SCHOOLTS C039 509 MAIN ACTIVITY YEAR PRIOR TO TCHING HERETSC040 511 HAVE A BACHELORS DEGREETSC041 512 BACHELORS DEGREE MAJOR FIELD OF STUDYTSC042 514 YEAR RECEIVED BACHELORS DEGREETSC043 516 HAVE A 2ND MAJOR/MINOR FIELD OF STUDYTSC044 517 SECOND MAJOR OR MINOR FIELD OF STUDYTSC045 519 HAVE A MASTERS DEGREETSC046 520 MASTER DEGREE MAJOR FIELD OF STUDYTSC047 522 YEAR RECEIVED MASTERS DEGREETSC048 524 HAVE ANY OTHER TYPE OF DEGREETSC049 525 HAVE EARNED AN ASSOCIATE DEGREETSC050 526 MAJOR FIELD OF STUDY FOR ASSOC DEGREETSC051 528 YEAR RECEIVED ASSOCIATE DEGREETSC052 530 HAVE EARNED AN ED SPEC/PROF DIPLOMATSC053 531 MAJOR STUDY FIELD FOR ED SPEC/PROF DPLMATSC054 533 YEAR RECEIVED ED SPEC/PROF DIPLOMATSC055 535 EARNED A DOCTORATE / 1ST PROF DEGREETSC056 536 MAJOR FIELD OF STUDY FOR DOCTORATETSC057 538 YEAR RECEIVED DOCTORATE/1ST PROF DEGREETSC058 540 MAIN TEACHING ASSIGNMENT AT THIS SCHOOLTSC059 542 ASSIGNMENT EQUALLY BETWEEN 2 FIELDSTSC060 543 TEACH CLASSES IN OTHER FIELDS HERETSC061 544 FIELD TEACH SECOND MOST CLASSESTSC062 546 COLLEGE LEVEL COURSES / TEACHING
METHODSTSC065 549 MAIN ASSIGN PREKIND/ GENL ELEM/ SPEC EDTSC066 550 COLLEGE LEVEL COURSES IN MAIN TEACH SUBJTSC069 553 FEEL BEST QUALIFIED TO TEACH THIS FIELDTSC070 555 FEEL QUALIFIED TO TEACH OTHER FIELDSTSC071 556 FEEL 2ND BEST QUALIFIED TEACH THIS FIELDTSC072 558 MAIN TEACHING ASSIGN CHANGED SINCE
BEGANTSC073 559 PREVIOUS MAIN ASSIGNMENT FIELDTSC074 561 NMBR CONSEC YEARS TEACHING CURR ASSIGNTSC075 563 TEACH ANY 7-12 STUDENTS AT THIS SCHOOLTSC076 564 TEACH ANY KIND OF SCIENCE AT THIS SCHOOL
262

Appendix D D-39
TSC077 565 TAKEN UNDERGRAD/GRAD COURSES IN MATHTSC078 566 NMBR UNDERGRADUATE COURSES IN MATHTSC079 568 NMBR GRADUATE COURSES IN MATH
TSC080 570 TAKEN UNDERGRAD/GRAD COURSES IN COMPSCI
TSC081 571 NMBR UNDERGRADUATE COURSES IN COMP SCITSC082 573 NMBR GRADUATE COURSES IN COMP SCIENCETSC083 575 TAKEN UNDERGRAD/GRAD COURSES IN BIOL SCITSC084 576 NMBR UNDERGRADUATE COURSES IN BIOL SCITSC085 578 NMBR GRADUATE COURSES IN BIOL SCIENCETSC086 580 TAKEN UNDERGRAD/GRAD COURSES IN
CHEMSTRYTSC087 581 NMBR UNDERGRADUATE COURSES IN
CHEMISTRYTSC088 583 NMBR GRADUATE COURSES IN CHEMISTRYTSC089 585 TAKEN UNDERGRAD/GRAD COURSES IN PHYSICSTSC090 586 NMBR UNDERGRADUATE COURSES IN PHYSICSTSC091 588 NMBR GRADUATE COURSES IN PHYSICSTSC092 590 TAKEN UNDERGRAD/GRAD COURSES / EARTH
SCITSC093 591 NMBR UNDERGRADUATE COURSES IN EARTH SCITSC094 593 NMBR GRADUATE COURSES IN EARTH SCITSC095 595 TAKEN UNDERGRAD/GRAD COURSES / OTHER
SCITSC096 596 NMBR UNDERGRADUATE COURSES IN OTHER SCITSC097 598 NMBR GRADUATE COURSES IN OTHER SCITSC098 600 ATTENDED IN-SERVICE TRAINING OF 30+ 'IRSTSC099 601 TRAINING IN MAIN TEACHING ASSIGNMENTTSC100 602 MAJOR PURPOSE FOR TAKING THIS TRAININGTSC101 603 MAIN ASSIGN TEACHING CERT IN THIS STATETSC102 604 TYPE OF CERT HOLD IN THIS FIELDTSC103 605 YR CERT MAIN TEACHING FIELD THIS STATETSC104 607 CERT IN OTHER TEACHING ASSIGN THIS STATETSC105 608 TYPE OF CERT IN OTHER TEACHING FIELDTSC106 609 YR CERT OTHER TEACHING FIELD THIS STATETSC107 611 MEMBER PROFESS TEACHER/ED ORGANIZATIONTSC108 612 PARTICIPATED IN SPONSORED SEMINARS, ETCTSC109 613 HOW OFTEN PARTICIPATE IN THESE ACTIVITYSTSC110 614 PARTICIPATE IN 1ST YR INDUCTION TRAININGTSC111 615 CURRENTLY MASTER OR MENTOR TEACHERTSC112 616 STUDENT GRADE LVLS IN CLASSES/UNGRADEDTSC113 617 STUDENT GRADE LVLS IN CLASSES/PREKINDTSC114 618 STUDENT GRADE LVLS IN CLASSES/KINDTSC115 619 STUDENT GRADE LVLS IN CLASSES/1STTSC116 620 STUDENT GRADE LVLS IN CLASSES/2NDTSC117 621 STUDENT GRADE LVLS IN CLASSES/3RD
263

D-40 1990-91 SASS Data File Users' Manual
TSC118 622 STUDENT GRADE LVLS IN CLASSES/4THTSC119 623 STUDENT GRADE LVLS IN CLASSES/5THTSC120 624 STUDENT GRADE LVLS IN CLASSES/6THTSC121 625 STUDENT GRADE LVLS IN CLASSES/7THTSC122 626 STUDENT GRADE LVLS IN CLASSES/8THTSC123 627 STUDENT GRADE LVLS IN CLASSES/9THTSC124 628 STUDENT GRADE LVLS IN CLASSES/10THTSC125 629 STUDENT GRADE LVLS IN CLASSES/11THTSC126 630 STUDENT GRADE LVLS IN CLASSES/12THTSC127 631 STUDENT GRADE LVLS IN CLASSES/POSTSECTSC128 632 WAY CLASSES ORGANIZED THIS SCHOOLTSC129 633 NMBR STUDENTS IN CLASS - RECENT FULL WKTSC130 636 RECENT FULL WK - NMBR HRS TAUGHT ENGLISHTSC131 638 RECENT FULL WK - NMBR HRS TAUGHT MATHTSC132 640 RECENT FULL WK - NMBR HRS TAUGHT
SOCSTUDTSC133 642 RECENT FULL WK - NMBR HRS TAUGHT SCIENCETSC134 644 RECENT FULL WK - ASSIGN HOMEWORKTSC135 645 GENL ACADEMIC ACHIEVMENT LVL IN
STUDENTSTSC136 646 NMBR SEP CLASSES TAUGHT RECENT FULL WKTSC137 648 SUBJECT MATTER CODE OF CLASS 1TSC138 650 NMBR OF TIMES A WEEK CLASS 1 MEETSTSC139 651 GRADE LEVEL OF MOST STUDENTS IN CLASS 1TSC140 653 NMBR STUDENTS ENROLLED IN CLASS 1TSC141 655 NMBR MALE STUDENTS IN CLASS 1TSC142 657 NMBR MINORITY STUDENTS IN CLASS 1TSC143 659 ACHIEV LVL STDNTS CLASS 1 W/ OTHR STDNTSTSC144 660 TYPE OF CLASS 1TSC145 661 SUBJECT MATTER CODE OF CLASS 2TSC146 663 NMBR OF TIMES A WEEK CLASS 2 MEETSTSC147 664 GRADE LEVEL OF MOST STUDENTS IN CLASS 2TSC148 666 NMBR STUDENTS ENROLLED IN CLASS 2TSC149 668 NMBR MALE STUDENTS IN CLASS 2TSC150 670 NMBR MINORITY STUDENTS IN CLASS 2TSC151 672 ACHIEV LVL STDNTS CLASS 2 W/ OTHR STDNTSTSC152 673 TYPE OF CLASS 2TSC153 674 SUBJECT MAI I'ER CODE OF CLASS 3TSC154 676 NMBR OF TIMES A WEEK CLASS 3 MEETSTSC155 677 GRADE LEVEL OF MOST STUDENTS IN CLASS 3TSC156 679 NMBR STUDENTS ENROLLED IN CLASS 3TSC157 681 NMBR MALE STUDENTS IN CLASS 3TSC158 683 NMBR MINORITY STUDENTS IN CLASS 3TSC159 685 ACHIEV LVL STDNTS CLASS 3 W/ OTHR STDNTSTSC160 686 TYPE OF CLASS 3TSC161 687 SUBJECT MATTER CODE OF CLASS 4TSC162 689 NMBR OF TIMES A WEEK CLASS 4 MEETS
264

Appendix D D-41
TSC163 690 GRADE LEVEL OF MOST STUDENTS IN CLASS 4TSC164 692 NMBR STUDENTS ENROLLED IN CLASS 4TSC165 694 NMBR MALE STUDENTS IN CLASS 4TSC166 696 NMBR MINORITY STUDENTS IN CLASS 4TSC167 698 ACHIEV LVL STDNTS CLASS 4 W/ OTHR STDNTSTSC168 699 TYPE OF CLASS 4TSC169 700 SUBJECT MATTER CODE OF CLASS 5TSC170 702 NMBR OF TIMES A WEEK CLASS 5 MEETSTSC171 703 GRADE LEVEL OF MOST STUDENTS IN CLASS 5TSC172 705 NMBR STUDENTS ENROLLED IN CLASS 5TSC173 707 NMBR MALE STUDENTS IN CLASS 5TSC174 709 NMBR MINORITY STUDENTS IN CLASS 5TSC175 711 ACHIEV LVL STDNTS CLASS 5 W/ OTHR STDNTSTSC176 712 TYPE OF CLASS 5TSC177 713 SUBJECT MATTER CODE OF CLASS 6TSC178 715 NMBR OF TIMES A WEEK CLASS 6 MEETSTSC179 716 GRADE LEVEL OF MOST STUDENTS IN CLASS 6TSC180 718 NMBR STUDENTS ENROLLED IN CLASS 6TSC181 720 NMBR MALE STUDENTS IN CLASS 6TSC182 722 NMBR MINORITY STUDENTS IN CLASS 6TSC183 724 ACHIEV LVL STDNTS CLASS 6 W/ OTHR STDNTSTSC184 725 TYPE OF CLASS 6TSC185 726 SUBJECT MATTER CODE OF CLASS 7TSC186 728 NMBR OF TIMES A WEEK CLASS 7 MEETSTSC187 729 GRADE LEVEL OF MOST STUDENTS IN CLASS 7TSC188 731 NMBR STUDENTS ENROLLED IN CLASS 7TSC189 733 NMBR MALE STUDENTS IN CLASS 7TSC190 735 NMBR MINORITY STUDENTS IN CLASS 7TSC191 737 ACHIEV LVL STDNTS CLASS 7 WI OTHR STDNTSTSC192 738 TYPE OF CLASS 7TSC193 739 SUBJECT MATTER CODE OF CLASS 8TSC194 741 NMBR OF TIMES A WEEK CLASS 8 MEETSTSC195 742 GRADE LEVEL OF MOST STUDENTS IN CLASS 8TSC196 744 NMBR STUDENTS ENROLLED IN CLASS 8TSC197 746 NMBR MALE STUDENTS IN CLASS 8TSC198 748 NMBR MINORITY STUDENTS IN CLASS 8TSC199 750 ACHIEV LVL STDNTS CLASS 8 W/ OTHR STDNTSTSC200 751 TYPE OF CLASS 8TSC201 752 SUBJECT MATTER CODE OF CLASS 9TSC202 754 NMBR OF TIMES A WEEK CLASS 9 MEETSTSC203 755 GRADE LEVEL OF MOST STUDENTS IN CLASS 9TSC204 757 NMBR STUDENTS ENROLLED IN CLASS 9TSC205 759 NMBR MALE STUDENTS IN CLASS 9TSC206 761 NMBR MINORITY STUDENTS IN CLASS 9TSC207 763 ACHIEV LVL STDNTS CLASS 9 W/ OTHR STDNTSTSC208 764 TYPE OF CLASS 9TSC209 765 SUBJECT MATTER CODE OF CLASS 10
265

D-42 1990-91 SASS Data File Users' Manual
TSC210 767 NMBR OF TIMES A WEEK CLASS 10 MEETSTSC211 768 GRADE LEVEL OF MOST STUDENTS IN CLASS 10TSC212 770 NMBR STUDENTS ENROLLED IN CLASS 10TSC213 772 NMBR MALE STUDENTS IN CLASS 10TSC214 774 NMBR MINORITY STUDENTS IN CLASS 10TSC215 776 ACHIEV LVL STDNTS CLASS 10 W/OTHR STDNTSTSC216 777 TYPE OF CLASS 10TSC217 778 TOT NMBR STUDENTS IN CLASSES HERETSC218 782 NMBR TIMES PER WK EACH CLASS MEETSTSC219 783 NMBR HRS REQUIRED - RECENT FULL WEEKTSC220 785 NON-SCHOOL HOURS, W/ STUDENT INTERACTIONTSC221 787 NON-SCHOOL HOURS, NO STUDENT
INTERACTIONTSC222 789 I LOOK FORWARD TO WORKING AT THIS
SCHOOLTSC223 790 STAFF MMBRS DONT HAVE MUCH SCHOOL
SPIRITTSC224 791 SCHOOL ADMIN KNOWS PROBLEMS STAFF
FACESTSC225 792 ALL AT SCHOOL AGREE ON SCHOOL DISCIPLINETSC226 793 STDNT BEHAVIOR INTERFERES WITH TEACHINGTSC227 794 PRINCIPAL ENFORCES RULES/BACKS TEACHERSTSC228 795 TEACHERS CONSISTENTLY ENFORCE RULESTSC229 796 STDNT CLASS ATTITUDES REDUCE ACAD
SUCCESTSC230 797 MANY STDNTS INCAPABLE LEARNING
MATERIALTSC231 798 TCHING ASSIGN MORE DIFF THAN OTHERSTSC232 799 TEACHING HAS MORE ADVAN THAN DISADVANTSC233 800 WOULD CHANGE JOBS IF COULDTSC234 801 PLAN WITH LIB/MEDIA SPEC FOR ASSISTANCETSC235 802 LIB/MEDIA ARE ADEQUATE TO HELP IN CLASSTSC236 803 WOULD BECOME A TEACHER AGAINTSC237 804 SCHOOL AIDS NEW TEACHERS W/ STDNT DISCIPTS C238 805 SCHOOL AIDS NEW TEACHERS W/ INSTR
METHODTSC239 806 SCHOOL AIDS NEW TEACHERS W/ CURRICULUMTSC240 807 SCHOOL AIDS NEW TEACHERS W/ ADJUSTINGTSC241 808 MOST IMPORTANT TEACHING GOALTSC242 809 SECOND MOST IMPORTANT TEACHING GOALTSC243 810 THIRD MOST IMPORTANT TEACHING GOALTSC244 811 TEACHERS HAVE INFLUENCE W/ DISCIP POLICYTSC245 812 TCHRS INFLU W/ CONTENT OF INSERVICE PGMSTSC246 813 TCHRS INFLU W/ POLICY ON GROUPING STDNTSTSC247 814 TCHRS INFLU W/ ESTABLISHING CURRICULUMTSC248 815 TEACHERS CONTROL SELECT INSTR MATERIALTSC249 816 TCHRS CONTROL SELECTING CONTENT, ETC
266

Appendix D D-43
TSC250 817 TCHRS CONTROL SELECT TEACHINGTECHNIQUES
TSC251 818 TCHRS CONTROL EVALUATING/GRADINGSTDNTS
TSC252 819 TCHRS CONTROL DISCIPLINING STDNTSTSC253 820 TCHRS CONTROL AMOUNT OF HOMEWORK
ASSIGNDTSC254 821 PROBLEM: STUDENT TARDINESSTSC255 822 PROBLEM: STUDENT ABSENTEEISMTSC256 823 PROBLEM: TEACHER ABSENTEEISMTSC257 824 PROBLEM: STUDENTS CUTTING CLASSTSC258 825 PROBLEM: PHYSICAL CONFLICTS AMONG
STDNTSTSC259 826 PROBLEM: ROBBERY OR THEFTTSC260 827 PROBLEM: VANDALISM OF SCHOOL PROPERTYTSC261 828 PROBLEM: STUDENT PREGNANCYTSC262 829 PROBLEM: STUDENT USE OF ALCOHOLTSC263 830 PROBLEM: STUDENT DRUG ABUSETSC264 831 PROBLEM: STUDENT POSSESSION OF WEAPONSTSC265 832 PROBLEM: PHYSICAL ABUSE OF TEACHERSTSC266 833 PROBLEM: VERBAL ABUSE OF TEACHERSTSC267 834 PROBLEM: STUDENT DISRESPECT FOR TEACHERSTSC268 835 PROBLEM: STUDENTS DROPPING OUTTSC269 836 PROBLEM: STUDENT APATHYTSC270 837 PROBLEM: LACK OF ACADEMIC INVOLVEMENTTSC271 838 PROBLEM: LACK OF PARENT INVOLVEMENTTSC272 839 PROBLEM: PARENT ALCOHOL &/OR DRUG ABUSETSC273 840 PROBLEM: POVERTYTSC274 841 PROBLEM: RACIAL TENSIONTSC275 842 PROBLEM: CULTURAL CONFLICTTSC276 843 PLAN TO REMAIN TEACHING FOR HOW LONGTSC277 844 DO PLAN TO RETIRE IN HOW MANY YRSTSC278 846 MAIN ACTIVITY LAST SCHOOL YEARTSC279 848 MAIN ACTIVITY NEXT SCHOOL YEARTSC280 850 RECV PAY INCENTIVES FOR ADDL RESPTSC281 851 RECV PAY INCENTIVES FOR ADDL TCHINGTSC282 852 RECV PAY INCENTIVES FOR SCHL LOCATIONTSC283 853 RECV PAY INCREASES DUE TO PERFORMNCETSC284 854 RECV MERIT PAY BONUS DUE TO PERFORMTSC285 855 RECV SCHL BONUS DUE TO EXCP PERFORMTSC286 856 SUMR 1990 INCOME FOR TEACHING SUMR SCHLTSC287 857 SUMR 1990 AMT EARNED IN TCHING SUMR SCHLTSC288 862 SUMR 1990 INCOME FOR NONTCHING SUMR
SCHLTSC289 863 SUMR 1990 AMT EARNED NONTCHING SUMR
SCHLTSC290 868 SUMR 1990 INCOME FOR NONSCHOOL JOB
26?

D-44 1990-91 SASS Data File Users' Manual
TSC291 869 SUMR 1990 AMT EARNED NONSCHOOL JOBTSC292 874 90-91 ACADEMIC BASE YEAR SALARYTSC293 879 90-91 SUPPLEMENTAL SCHOOL CONTRACTSTSC294 880 90-91 SUPPLEMENTAL SCHOOL INCOME AMTTSC295 885 90-91 SUPPLEMENTAL NON -SCHL JOBTSC296 886 90-91 SUPPLEMENTAL NON-SCHL INCOME AMTTSC297 891 90-91 SUPPLEMENTAL NON-SCHL JOB DESCTSC298 892 90-91 SUPPLEMENTAL INCOME (EX:BONUS)TSC299 893 90-91 SUPPLEMENTAL INCOME AMTTSC300 898 90-91 TOTAL EARNED INCOME - ALL SOURCESTSCSTR 938 SCHOOL STRATUM CODETSUBJ 944 TEACHER SUBJECT CATEGORYTUITIN 989 HIGHEST ANNUAL TUITION CHARGEDTUITION 907 PART OF SCHL SALARY INCL CHLDRN TUITIONTYPOLOGY 20 NINE LEVEL RELIGIOUS TYPOLOGY
268

E-1
Appendix E. Selected Unweighted and Weighted Tables
Note: All unweighted and weighted counts presented in this section are presented for thepurpose of checking the data. We encourage programmers to validate their programs bycomparing their results with the cross-tabulated number of observations in these tables.
269

Appendix E E-3
Teacher Demand and Shortage Survey
Selected Unweighted and Weighted Tables
270

E-4 1990-91 SASS Data File Users' Manual
Table E-1.--Unweighted number of districts by enrollment and by state: 1990-91
State
Enrollment
01 but lessthan 500
500 but lessthan 1,000
1,000 but leasthan 5,000
5,000 but lessthan 10,000
10,000 ormore
50 States and D.C. 4 870 651 2123 643 593
Alabama 0 3 0 58 27 10
Alaska 0 18 9 8 2 2Arizona 0 13 10 45 11 17
Arkansas 0 17 30 50 9 3
California 0 30 12 56 34 86
Colorado 1 22 6 27 1 17
Connecticut 0 3 7 55 16 4
Delaware 0 0 3 9 4 3
District of Columbia 0 0 0 0 0 1
Florida 0 0 0 10 9 32
Georgia 0 1 2 48 19 22Hawaii 0 0 0 0 0 1
Idaho 0 18 10 35 6 3
Illinois 0 37 32 60 20 13
Indiana 2 5 9 74 20 15
Iowa 0 27 46 49 6 5
Kansas 0 27 29 42 9 5
Kentucky 0 5 4 59 20 4
Louisiana 0 1 1 20 16 20Maine 0 20 13 54 2 0
Maryland 0 0 0 4 3 13
Massachusetts 0 6 9 81 17 8
Michigan 0 14 15 82 22 20Minnesota 0 21 23 47 14 11
Mississippi 0 1 2 86 18 5
Missouri 0 22 34 53 17 15
Montana 0 92 13 22 3 1
Nebraska 0 58 14 23 3 3
Nevada 0 3 1 8 3 2New Hampshire 0 17 11 42 1 2
New Jersey 0 6 18 72 21 8
New Mexico 0 9 12 18 9 4New York 1 16 35 82 20 9
North Carolina 0 0 1 28 31 26
North Dakota 0 69 16 9 2 2
Ohio 0 8 22 81 25 14
Oklahoma 0 73 35 57 8 9
Oregon 0 20 15 41 12 7
Pennsylvania 0 8 11 115 35 8
Rhode Island 0 0 3 22 5 2
South Carolina 0 0 2 27 17 19
South Dakota 0 40 22 23 0 2
Tennessee 0 2 1 50 26 13
Texas 0 60 30 79 24 58Utah 0 1 3 12 6 11
271

Appendix E E-5
Table E-1.Unweighted number of districts by enrollment and by state: 1990-91 (continued)
State
Enrollment
01 but lessthan 500
500 but lessthan 1,000
1,000 but lessthan 5,000
5,000 but lessthan 10,000
10,000 ormore
Vermont 0 43 22 17 0 0Virginia 0 3 2 38 23 16
Washington 0 12 11 36 15 25
West Virginia 0 0 0 29 17 8
Wisconsin 0 10 35 60 13 7
Wyoming 0 9 10 20 2 2
SOURCE: U.S. Department of Education, National Center for Education Statistics, Schools and Staffing Survey, 1990-91 (TeacherDemand and Shortage Questionnaire).
272

E-6 1990-91 SASS Data File Users' Manual
Table E-2.--Weighted number of districts by enrollment and by state: 1990-91
State
Enrollment
01 but lessthan 500
500 but lessthan 1,000
1,000 but lessthan 5,000
5,000 but lessthan 10,000
10,000 ormore
50 States and D.C. 29 5,722 2,606 5,549 918 688
Alabama 0 29 0 78 29 10Alaska 0 30 13 9 2 2Arizona 0 100 39 69 12 18Arkansas 0 108 109 93 10 3California 0 619 26 236 95 133
Colorado 17 91 18 48 1 17Connecticut 0 26 21 94 22 5Delaware 0 0 3 9 4 3District of Columbia 0 0 0 0 0 1
Florida 0 0 0 21 13 34
Georgia 0 4 8 124 25 25Hawaii 0 0 0 0 0 1
Idaho 0 44 19 40 7 3Illinois 0 418 241 310 46 18Indiana 11 12 36 214 28 15
Iowa 0 168 155 99 6 5Kansas 0 123 91 76 9 5Kentucky 0 58 17 125 25 4Louisiana 0 5 1 29 18 21Maine 0 119 31 82 2 0
Maryland 0 0 0 5 3 16Massachusetts 0 68 50 196 23 9Michigan 0 45 60 320 32 22Minnesota 0 154 97 141 19 13Mississippi 0 3 4 123 19 5
Missouri 0 210 159 143 18 14Montana 0 471 23 26 3 1
Nebraska 0 729 42 34 3 3Nevada 0 3 8 3 2New Hampshire 0 84 19 51 1 2
New Jersey 0 108 188 241 34 10New Mexico 0 30 24 21 9 4New York 1 78 210 404 49 12North Carolina 0 0 4 67 38 29North Dakota 0 250 23 9 2 2
Ohio 0 59 119 432 49 16Oklahoma 0 342 100 98 8 9Oregon 0 193 47 73 13 7Pennsylvania 0 25 45 450 53 9Rhode Island 0 0 5 25 6 2
South Carolina 0 0 7 49 19 20South Dakota 0 116 48 23 0 2Tennessee 0 3 8 84 29 13Texas 0 418 200 327 41 71Utah 0 2 6 14 6 11
273

Appendix E E-7
Table E-2.--Weighted number of districts by enrollment and by state: 1990-91 (continued)
State
Enrollment
01 but lessthan 500
500 but less 1,000 but lessthan 1,000 than 5,000
5,000 but lessthan 10,000
10,000 ormore
Vermont 0 170 45 24 0 0Virginia 0 8 7 87 28 18
West Virginia 0 0 0 29 18 8
Wisconsin 0 79 168 162 13 7
Wyoming 0 29 12 21 2 2
NOTE: Details may not add to totals due to rounding.
SOURCE: U.S. Department of Education, National Center for Education Statistics, Schools and Staffing Survey, 1990-91 (TeacherDemand and Shortage Questionnaire).
274

E-8 1990-91 SASS Data File Users' Manual
Table E-3.--Unweighted number of FTE K-12 teaching positions by region: 1990-91
Region
Type of teaching positions
Number Number Number Number Number Number ofof of of of of new certifica-
approved vacant abolished laidoff new hires tions
Northeast 263,250 1,190 68 2,396 12,746 11,106
Midwest 315,315 1,611 88 1,952 22,142 21,601
South 664,248 4,233 217 1,732 64,402 56,176
West 309,746 2,590 59 1,164 31,616 28,000
SOURCE: U.S. Department of Education, National Center for Education Statistics, Schools and StaffingSurvey, 1990-91 (Teacher Demand and Shortage Questionnaire).
Table E-4.-Weighted number of FTE K-12 teaching positions by region: 1990-91
Region
Type of teaching positions
Number Number Number Number Number Number ofof of of of of new certifica-
approved vacant abolished laidoff new hires tions
Northeast 486,926 2,245 138 4,250 24,722 22,546
Midwest 582,626 2,549 179 3,668 41,948 40,778
South 859,927 4,912 373 2,117 86,632 75,888
West 431,792 3,804 88 1,346 45,620 40,038
SOURCE: U.S. Department of Education, National Center for Education Statistics, Schools and StaffingSurvey, 1990-91 (Teacher Demand and Shortage Questionnaire).
275
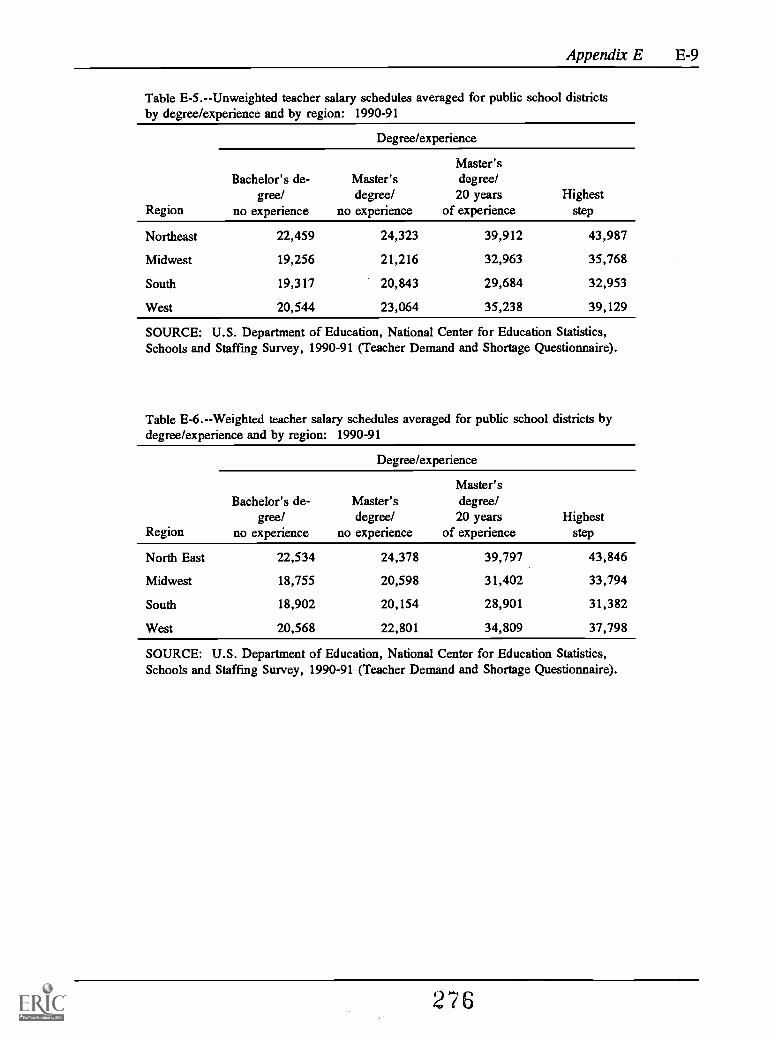
Appendix E E-9
Table E-5.--Unweighted teacher salary schedules averaged for public school districtsby degree/experience and by region: 1990-91
Degree/experience
Bachelor's de-gree/
Master'sdegree/
Master'sdegree/20 years Highest
Region no experience no experience of experience step
Northeast 22,459 24,323 39,912 43,987
Midwest 19,256 21,216 32,963 35,768
South 19,317 20,843 29,684 32,953
West 20,544 23,064 35,238 39,129
SOURCE: U.S. Department of Education, National Center for Education Statistics,Schools and Staffing Survey, 1990-91 (Teacher Demand and Shortage Questionnaire).
Table E-6.--Weighted teacher salary schedules averaged for public school districts bydegree/experience and by region: 1990-91
Degree/experience
Bachelor's de-gree/
Master'sdegree/
Master'sdegree/20 years Highest
Region no experience no experience of experience step
North East 22,534 24,378 39,797 43,846
Midwest 18,755 20,598 31,402 33,794
South 18,902 20,154 28,901 31,382
West 20,568 22,801 34,809 37,798
SOURCE: U.S. Department of Education, National Center for Education Statistics,Schools and Staffing Survey, 1990-91 (Teacher Demand and Shortage Questionnaire).
276
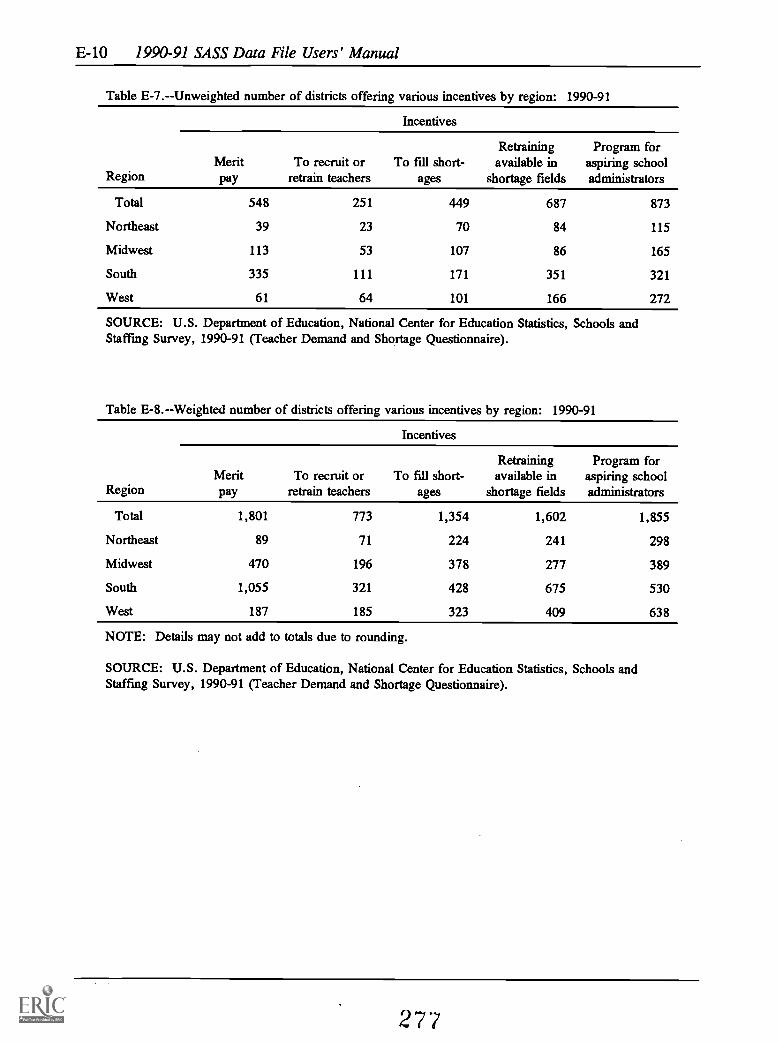
E-10 1990-91 SASS Data File Users' Manual
Table E-7.--Unweighted number of districts offering various incentives by region: 1990-91
Region
Incentives
Meritpay
To recruit orretrain teachers
To fill short-ages
Retraining Program foravailable in aspiring school
shortage fields administrators
Total
Northeast
Midwest
South
West
548
39
113
335
61
251
23
53
111
64
449
70
107
171
101
687
84
86
351
166
873
115
165
321
272
SOURCE: U.S. Department of Education, National Center for Education Statistics, Schools andStaffing Survey, 1990-91 (Teacher Demand and Shortage Questionnaire).
Table E-8.--Weighted number of districts offering various incentives by region: 1990-91
Incentives
MeritRegion pay
Total
Northeast
Midwest
South
West
To recruit or To fill short-retrain teachers ages
Retrainingavailable in
shortage fields
Program foraspiring schooladministrators
1,801
89
470
1,055
187
773
71
196
321
185
1,354
224
378
428
323
1,602
241
277
675
409
1,855
298
389
530
638
NOTE: Details may not add to totals due to rounding.
SOURCE: U.S. Department of Education, National Center for Education Statistics, Schools andStaffing Survey, 1990-91 (Teacher Demand and Shortage Questionnaire).
277

Appendix E E-11
Table E-9.--Unweighted number of FTE teachers and enrollmentby grade level: 1990-91
Grade level FTE teachers Enrollment
Ungraded 72,408 537,700
Pre-Kindergarten 11,510 247,598
Kindergarten 78,225 2,139,269
Grades 1 - 6 696,064 12,973,104
Grades 7 - 12 699,378 11,674,740
Postsecondary 9,696 337,457
SOURCE: U.S. Department of Education, National Center forEducation Statistics, Schools and Staffing Survey, 1990-91(Teacher Demand and Shortage Questionnaire).
Table E-10.--Weighted number of FIE teachers and enrollment bygrade level: 1990-91
Grade level FIE teachers Enrollment
Ungraded 97,153 705,564
Pre-Kindergarten 16,796 357,816
Kindergarten 117,155 3,237,850
Grades 1 6 1,053,450 19,419,747
Grades 7 - 12 1,084,726 17,434,850
Postsecondary 13,662 449,430
SOURCE: U.S. Department of Education, National Center forEducation Statistics, Schools and Staffing Survey, 1990-91(Teacher Demand and Shortage Questionnaire).
278

E-12 1990-91 SASS Data File Users' Manual
Table E-11.--Unweighted number of districts offering various benefits to teachers by region: 1990-91
Region
Benefits
Medicalinsurance
Dentalinsurance
Lifeinsurance Pension Housing Meals
Transport-ation
Tuitionreimburse-
ment
Total 4,596 3,050 3,245 3,145 85 218 2,262 1,936
Northeast 946 733 647 613 3 37 492 665
Midwest 1,415 904 1,100 964 12 68 689 506
South 1,277 607 816 887 31 73 683 488
West 958 806 682 681 39 40 398 277
*District (or other organization) pays part or all of premium.
SOURCE: U.S. Department of Education, National Center for Education Statistics, Schools and StaffingSurvey, 1990-91 (Teacher Demand and Shortage Questionnaire).
Table E-12.--Weighted number of districts offering various benefits to teachers by region: 1990-91
Region
Benefits
Medicalinsurance
Dentalinsurance'
Lifeinsurance' Pension Housing Meals
Transport-ation
Tuitionreimburse-
ment
Total 14,139 9,211 9,336 9,486 339 777 5,917 6,165
Northeast 3,095 2,373 1,960 2,066 12 113 1,348 2,249
Midwest 5,330 3,062 4,000 3,592 62 331 2,392 2,038
South 2,746 1,234 1,683 1,809 121 208 1,250 922
West 2,968 2,540 1,692 2,020 143 124 928 957
*District (or other organization) pays part or all of premium.NOTE: Details may not add to totals due to rounding.
SOURCE: U.S. Department of Education, National Center for Education Statistics, Schools and StaffingSurvey, 1990-91 (Teacher Demand and Shortage Questionnaire).
.279
Appendix E E-13
Public School Administrator Survey
Selected Unweighted and Weighted Tables
280

E-14 1990-91 SASS Data File Users' Manual
Table E-13.--Unweighted number of public school administrators, by highest degree earned and by state: 1990-91
StateNo
Total degree Associate Bachelor's Master'sEducationspecialist Doctorate*
50 States and D.C. 9,054 189 5,345 2,602 915
Alabama 221 91 111 19
Alaska 150 5 100 29 16
Arizona 192 4 127 33 27Arkansas 159 111 42 5
California 300 9 215 42 34
Colorado 178 98 46 32Connecticut 156 16 110 30Delaware 67 40 8 19
District of Columbia 61 42 9 10
Florida 242 176 39 27
Georgia 178 30 131 17
Hawaii 91 18 36 30 7
Idaho 157 96 45 15
Illinois 240 153 52 35
Indiana 188 89 78 21
Iowa 177 3 127 34 13
Kansas 158 111 24 22Kentucky 177 56 111 9
Louisiana 203 130 65 8
Maine 141 7 94 32
Maryland 145 97 25 23
Massachusetts 163 96 40 25Michigan 212 132 53 25Minnesota 192 51 117 22Mississippi 221 121 83 17
Missouri 205 98 78 27
Montana 155 4 135 10 6
Nebraska 148 3 75 54 16
Nevada 115 81 17 17
New Hampshire 113 6 62 33 12
New Jersey 181 125 37 19
New Mexico 143 94 39 9
New York 248 4 95 115 34
North Carolina 180 3 70 90 17
North Dakota 190 66 107 10 7
Ohio 199 158 26 15
Oklahoma 270 15 166 76 13
Oregon 169 3 101 53 12
Pennsylvania 225 134 48 41
Rhode Island 102 62 24 16
281

Appendix E E- 15
Table E-13.--Unweighted number of public school administrators, by highest degree earned and by state: 1990-91(continued)
StateNo
Total degree Associate Bachelor's Master'sEducationspecialist Doctorate*
South Carolina 177 87 71 19South Dakota 187 151 30 6Tennessee 189 112 58 18Texas 405 3 299 78 25Utah 174 7 73 66 28
Vermont 100 12 59 23 6Virginia 188 126 36 26Washington 171 124 31 16West Virginia 164 122 34 7Wisconsin 165 107 47 11Wyoming 122 87 29 6
--No sampled cases.*Includes a very small number of law and medicine degree recipients.NOTE: Details may not add to totals due to rounding or missing values in cells with too few sample cases, or itemnonresponse. Cell entries may be underestimates due to item nonresponse.
SOURCE: U.S. Department of Education, National Center for Education Statistics, Schools and Staffing Survey, 1990-91(Administrator Questionnaire).
282

E-16 1990-91 SASS Data File Users' Manual
Table E-14.--Weighted number of public school administrators, by highest degree earned and by state: 1990-91
StateNo
Total degree Associate Bachelor's Master'sEducationspecialist Doctorate"
50 States and D.C. 78,890 1,430 47,749 22,230 7,456
Alabama 1,225 486 636Alaska 414 291Arizona 990 607 181
Arkansas 1,074 792 239California 7,165 - 4,765 1,248 909
Colorado 1,290 - - 722 367 182
Connecticut 919 660 157
Delaware 159 100District of Columbia 167 115
Florida 2,245 1,642 367
Georgia 1,650 303 1,194Hawaii 231 92 73
Idaho 526 323 152Illinois 3,935 - - 2,725 815 395Indiana 1,842 - 915 708
Iowa 1,520 1,137 283Kansas 1,442 1,077Kentucky 1,274 - 417 782Louisiana 1,445 918 469Maine 731 - 471 149
Maryland 1,129 752Massachusetts 1,733 - 997 423Michigan 3,004 - 1,770 830Minnesota 1,402 388 870Mississippi 905 474 375
Missouri 2,059 - - 963 803
Montana 677 564 -Nebraska 1,113 - 582 403
Nevada 313 230New Hampshire 417 226 124
New Jersey 2,208 1,513 483New Mexico 626 411 172
New York 3,889 1,445 1,903 486North Carolina 1,917 820 935North Dakota 612 250 310
Ohio 3,623 2,897Oklahoma 1,730 1,066 499Oregon 1,160 679 335
Pennsylvania 3,200 1,996 699 459Rhode Island 294 180
283

Appendix E E-17
Table E-14.--Weighted number of public school administrators, by highest degree earned and by state: 1990-91 (continued)
StateNo
Total degree Associate Bachelor's Master'sEducationspecialist Doctorate'
South Carolina 1,070 543 438South Dakota 728 611 98Tennessee 1,460 905 435Texas 5,647 4,158 1,138Utah 690 290 269
Vermont 313 185Virginia 1,734 1,240 282Washington 1,765 1,310 294West Virginia 1,007 741 216Wisconsin 1,844 1,234 509Wyoming 376 268
--Too few sample cases (fewer than 30) for a reliable estimate.*Includes a very small number of law and medicine degree recipients.NOTE: Details may not add to totals due to rounding or missing values in cells with too few sample cases, or itemnonresponse. Cell entries may be underestimates due to item nonresponse.
SOURCE: U.S. Department of Education, National Center for Education Statistics, Schools and Staffing Survey, 1990-91(Administrator Questionnaire).
284
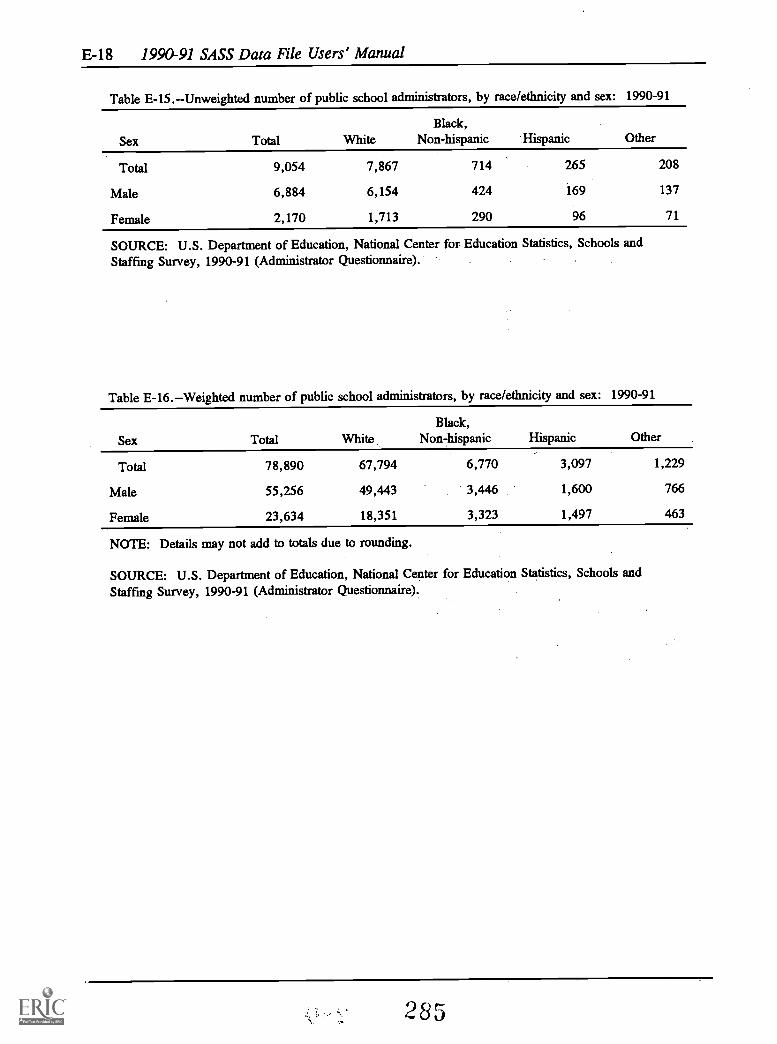
E-18 1990-91 SASS Data File Users' Manual
Table E-15.--Unweighted number of public school administrators, by race/ethnicity and sex: 1990-91
Sex Total WhiteBlack,
Non-hispanic 'Hispanic Other
Total
Male
Female
9,054
6,884
2,170
7,867
6,154
1,713
714
424
290
265
169
96
208
137
71
SOURCE: U.S. Department of Education, National Center for Education Statistics, Schools andStaffing Survey, 1990-91 (Administrator Questionnaire).
Table E-16.--Weighted number of public school administrators, by race/ethnicity and sex: 1990-91
Sex Total WhiteBlack,
Non-hispanic Hispanic Other
Total 78,890 67,794 6,770 3,097 1,229
Male 55,256 49,443 3,446 1,600 766
Female 23,634 18,351 3,323 1,497 463
NOTE: Details may not add to totals due to rounding.
SOURCE: U.S. Department of Education, National Center for Education Statistics, Schools andStaffing Survey, 1990-91 (Administrator Questionnaire)
285
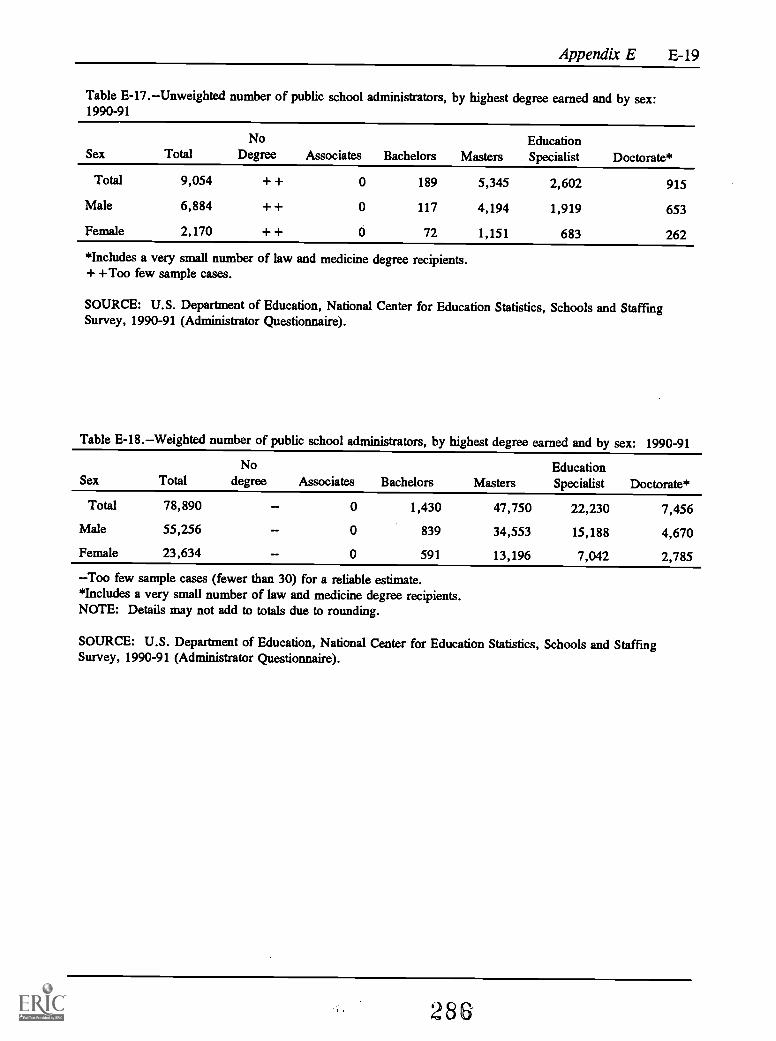
Appendix E E-19
Table E-17.Unweighted number of public school administrators, by highest degree earned and by sex:1990-91
SexNo Education
Total Degree Associates Bachelors Masters Specialist Doctorate*
Total 9,054 + + 0 189 5,345 2,602 915
Male 6,884 + + 0 117 4,194 1,919 653
Female 2,170 + + 0 72 1,151 683 262
*Includes a very small number of law and medicine degree recipients.+ +Too few sample cases.
SOURCE: U.S. Department of Education, National Center for Education Statistics, Schools and StaffingSurvey, 1990-91 (Administrator Questionnaire).
Table E-18.--Weighted number of public school administrators, by highest degree earned and by sex: 1990-91
SexNo Education
Total degree Associates Bachelors Masters Specialist Doctorate*
Total 78,890 0 1,430 47,750 22,230 7,456
Male 55,256 0 839 34,553 15,188 4,670
Female 23,634 0 591 13,196 7,042 2,785
Too few sample cases (fewer than 30) for a reliable estimate.*Includes a very small number of law and medicine degree recipients.NOTE: Details may not add to totals due to rounding.
SOURCE: U.S. Department of Education, National Center for Education Statistics, Schools and StaffingSurvey, 1990-91 (Administrator Questionnaire).
286-

E-20 1990-91 SASS Data File Users' Manual
Table E-19.--Unweighted number of public school administrators, by annualsalary and by sex: 1990-91
Annual salary Total Male Female
Total 9,054 6,884 2,170
Less than $10,000 17 13 4$10,000 - $14,999 7 + + 5
$15,000 - $19,999 18 7 11
$20,000 - $24,999 65 41 24$25,000 - $29,999 160 103 57$30,000 - $34,999 534 408 126
$35,000 - $39,999 967 699 268$40,000 - $49,999 3,119 2,406 713$50,000 - $59,999 2,379 1,795 584$60,000 - $74,999 1,628 1,275 353$75,000 - $99,999 160 135 25
+ +Too few sample cases.
SOURCE: U.S. Department of Education, National Center for Education Statis-tics, Schools and Staffing Survey, 1990-91(Administrator Questionnaire) .
Table E-20.--Weighted number of public school administrators, by annual salaryand by sex: 1990-91
Annual salary Total Male Female
Total 78,890 55,256 22,634
Less than $10,000 -$10,000 - $14,999$15,000 - $19,999 - -$20,000 - $24,999 535 320 -$25,000 - $29,999 1,066 643 423$30,000 - $34,999 4,122 2,901 1,228$35,000 - $39,999 7,916 5,432 2,485$40,000 - $49,999 27,592 19,747 7,845$50,000 - $59,999 20,817 13,909 6,908$60,000 - $74,999 15,253 11,116 4,137$75,000 - $99,999 1,255 1,029
--Too few sample cases (fewer than 30) for a reliable estimate.NOTE: Details may not add to totals due to rounding.
SOURCE: U.S. Department of Education, National Center for Education Statis-tics, Schools and Staffing Survey, 1990-91 (Administrator Questionnaire).
28"
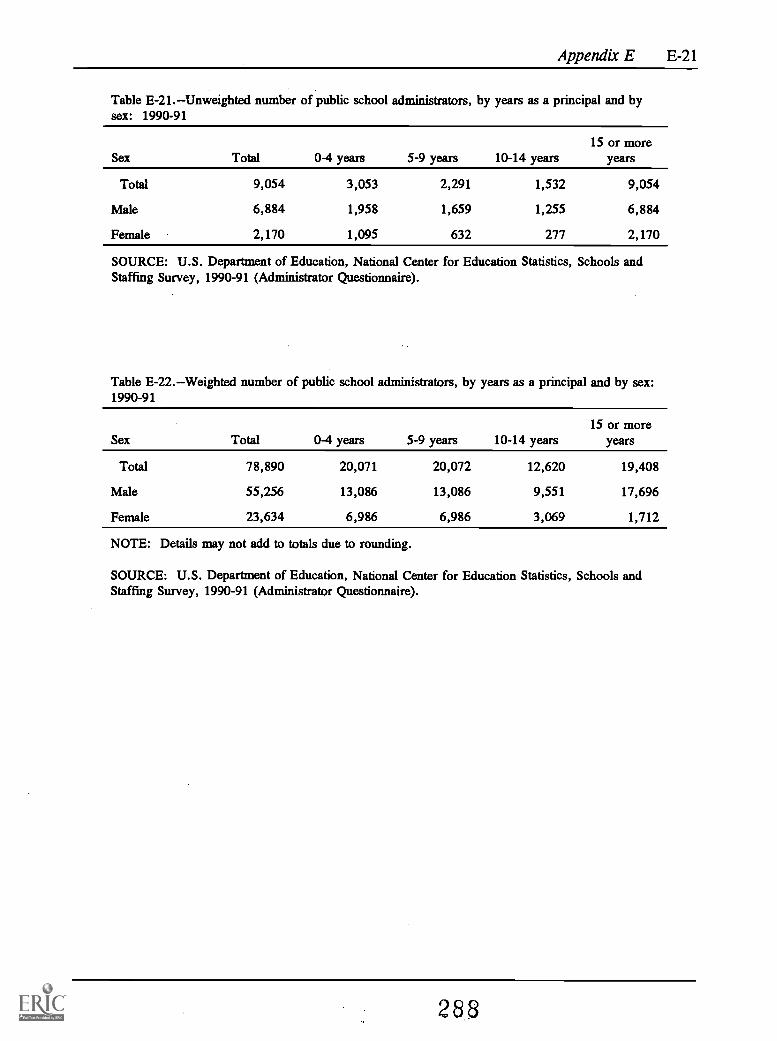
Appendix E E-21
Table E-21.--Unweighted number of public school administrators, by years as a principal and bysex: 1990-91
Sex15 or more
Total 0-4 years 5-9 years 10-14 years years
Total 9,054 3,053 2,291 1,532 9,054
Male 6,884 1,958 1,659 1,255 6,884
Female 2,170 1,095 632 277 2,170
SOURCE: U.S. Department of Education, National Center for Education Statistics, Schools andStaffing Survey, 1990-91 (Administrator Questionnaire).
Table E-22.--Weighted number of public school administrators, by years as a principal and by sex:1990-91
15 or moreSex Total 0-4 years 5-9 years 10-14 years years
Total 78,890 20,071 20,072 12,620 19,408
Male 55,256 13,086 13,086 9,551 17,696
Female 23,634 6,986 6,986 3,069 1,712
NOTE: Details may not add to totals due to rounding.
SOURCE: U.S. Department of Education, National Center for Education Statistics, Schools andStaffing Survey, 1990-91 (Administrator Questionnaire).
288

E-22 1990-91 SASS Data File Users' Manual
Table E-23.--Unweighted number of public school administrators, by age and by sex: 1990-91
Sex Total Under 40 40-44 45-49 50-54 55 and over
Total 9,054 888 2,212 2,353 1,784 1,817
Male 6,884 657 1,620 1,808 1,380 1,419
Female 2,170 231 592 545 404 398
SOURCE: U.S. Department of Education, National Center for Education Statistics, Schools andStaffing Survey, 1990-91 (Administrator Questionnaire).
Table E-24.--Weighted number of public school administrators, by age and by sex: 1990-91
Sex Total Under 40 40-44 45-49 50-54 55 and over
Total 78,890 7,969 19,412 18,933 15,533 17,042
Male 23,634 5,242 13,193 5,598 11,095 4,653
Female 12,389 2,727 6,219 13,335 4,437 12,389
NOTE: Details may not add to totals due to rounding.
SOURCE: U.S. Department of Education, National Center for Education Statistics, Schools andStaffing Survey, 1990-91 (Administrator Questionnaire).
289
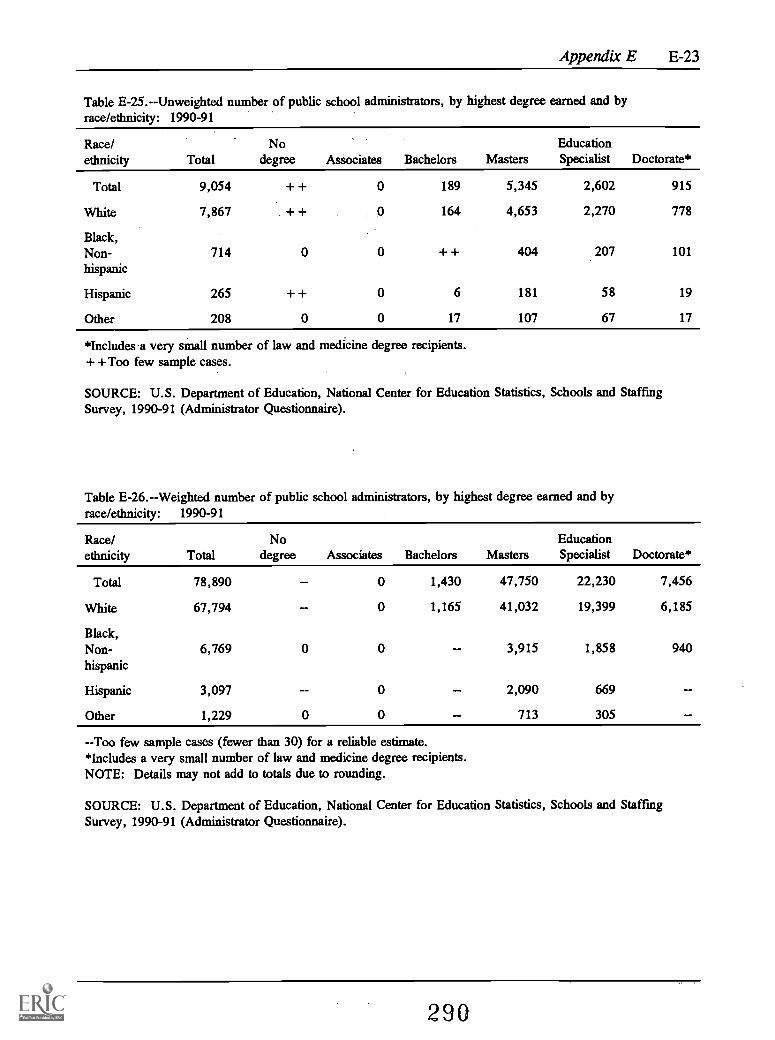
Appendix E E-23
Table E-25.--Unweighted number of public school administrators, by highest degree earned and byrace/ethnicity: 1990-91
Race/ethnicity Total
Nodegree Associates Bachelors Masters
EducationSpecialist Doctorate*
Total 9,054 + + 0 189 5,345 2,602 915
White 7,867 ++ 0 164 4,653 2,270 778
Black,Non-hispanic
714 0 0 + + 404 207 101
Hispanic 265 + + 0 6 181 58 19
Other 208 0 0 17 107 67 17
*Includes -a very small number of law and medicine degree recipients.+ +Too few sample cases.
SOURCE: U.S. Department of Education, National Center for Education Statistics, Schools and StaffingSurvey, 1990-91 (Administrator Questionnaire).
Table E-26.--Weighted number of public school administrators, by highest degree earned and byrace/ethnicity: 1990-91
Race/ethnicity Total
Nodegree Associates Bachelors Masters
EducationSpecialist Doctorate*
Total 78,890 0 1,430 47,750 22,230 7,456
White 67,794 0 1,165 41,032 19,399 6,185
Black,Non-hispanic
6,769 0 0 3,915 1,858 940
Hispanic 3,097 0 2,090 669
Other 1,229 0 0 713 305
Too few sample cases (fewer than 30) for a reliable estimate.*Includes a very small number of law and medicine degree recipients.NOTE: Details may not add to totals due to rounding.
SOURCE: U.S. Department of Education, National Center for Education Statistics, Schools and StaffingSurvey, 1990-91 (Administrator Questionnaire).
290
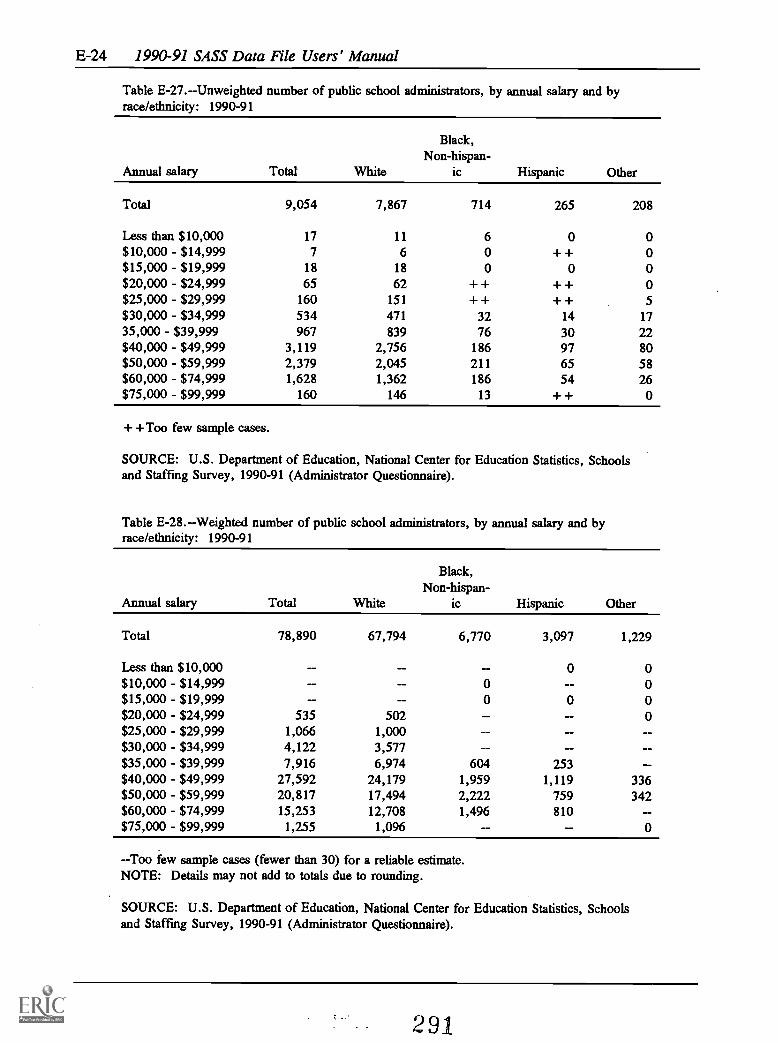
E-24 1990-91 SASS Data File Users' Manual
Table E-27.--Unweighted number of public school administrators, by annual salary and byrace/ethnicity: 1990-91
Black,Non-hispan-
Annual salary Total White ic Hispanic Other
Total 9,054 7,867 714 265 208
Less than $10,000 17 11 6 0 0$10,000 - $14,999 7 6 0 + + 0$15,000 - $19,999 18 18 0 0 0$20,000 - $24,999 65 62 + + + + 0$25,000 - $29,999 160 151 + + + + 5$30,000 - $34,999 534 471 32 14 1735,000 - $39,999 967 839 76 30 22$40,000 - $49,999 3,119 2,756 186 97 80$50,000 - $59,999 2,379 2,045 211 65 58$60,000 - $74,999 1,628 1,362 186 54 26$75,000 - $99,999 160 146 13 + + 0
+ +Too few sample cases.
SOURCE: U.S. Department of Education, National Center for Education Statistics, Schoolsand Staffing Survey, 1990-91 (Administrator Questionnaire).
Table E-28.--Weighted number of public school administrators, by annual salary and byrace/ethnicity: 1990-91
Black,Non-hispan-
Annual salary Total White ic Hispanic Other
Total 78,890 67,794 6,770 3,097 1,229
Less than $10,000 - 0 0$10,000 - $14,999 0 0$15,000 - $19,999 - 0 0 0$20,000 - $24,999 535 502 0$25,000 - $29,999 1,066 1,000$30,000 - $34,999 4,122 3,577$35,000 - $39,999 7,916 6,974 604 253$40,000 - $49,999 27,592 24,179 1,959 1,119 336$50,000 - $59,999 20,817 17,494 2,222 759 342$60,000 - $74,999 15,253 12,708 1,496 810$75,000 - $99,999 1,255 1,096 0
--Too few sample cases (fewer than 30) for a reliable estimate.NOTE: Details may not add to totals due to rounding.
SOURCE: U.S. Department of Education, National Center for Education Statistics, Schoolsand Staffing Survey, 1990-91 (Administrator Questionnaire).
291

Appendix E E-25
Table E-29.--Unweighted number of public school administrators, by years as a principal and byrace/ethnicity: 1990-91
Race/ethnicity Total 0-4 years 5-9 years 10-14 years15 or more
0 years
Total 9,054 3,053 2,291 1,532 2,178
White 7,867 2,590 1,974 1,344 1,959
Black,Non-hispanic 714 260 185 126 143
Hispanic 265 113 81 31 40
Other 208 90 51 31 36
SOURCE: U.S. Department of Education, National Center for Education Statistics, Schools andStaffing Survey, 1990-91 (Administrator Questionnaire).
Table E-30.--Weighted number of public school administrators, by years as a principal and byrace/ethnicity: 1990-91
Race/ethnicity Total 0-4 years 5-9 years 10-14 years15 or more
years
Total 78,890 26,790 20,072 12,620 19,408
White 67,794 22,501 16,844 10,992 17,457
Black,Non-hispanic 6,770 2,553 1,794 1,074 1,349
Hispanic 3,097 1,242 1,056 342 457
Other 1,229 494 378 213 144
NOTE: Details may not add to totals due to rounding.
SOURCE: U.S. Department of Education, National Center for Education Statistics, Schools andStaffing Survey, 1990-91 (Administrator Questionnaire).
292

E-26 1990-91 SASS Data File Users' Manual
Table E-31.Unweighted number of public school administrators, by age and by race/ethnicity: 1990-91
Race/ethnicity Total Under 40 40-44 45-49 50-54 55 and over
Total 9,054 888 2,212 2,353 1,784 1,817
White 7,867 799 1,928 2,055 1,537 1,548
Black,Non-hispanic 714 49 133 190 158 184
Hispanic 265 24 89 61 48 43
Other 208 16 62 47 41 42
SOURCE: U.S. Department of Education, National Center for Education Statistics, Schools and StaffingSurvey, 1990-91 (Administrator Questionnaire).
Table E-32.Weighted number of public school administrators, by age and by race/ethnicity:1990-91
Race/ethnicity Total Under 40 40-44 45-49 50-54 55 and over
Total 78,890 7,969 19,412 18,934 15,533 17,042
White 67,794 7,027 16,529 16,546 13,211 14,482
Black,Non-hispanic 6,770 561 1,408 1,498 1,481 1,823
Hispanic 3,097 1,067 561 614 587
Other 1,229 408 330 227 151
--Too few sample cases (less than 30) for a reliable estimate.NOTE: Details may not add to totals due to rounding.
SOURCE: U.S. Department of Education, National Center for Education Statistics, Schools and StaffingSurvey, 1990-91 (Administrator Questionnaire).

Appendix E E-27
Table E-33.--Unweighted number of public school administrators, by annual salary and by highest degreeearned: 1990-91
Annual salary TotalNo
degree Associates Bachelors MastersEducationSpecialist Doctorate*
Total 9,054 + + 0 189 5,345 2,602 915
Less than $10,000 17 0 0 + + 10 5 0$10,000 - $14,999 7 + + 0 4 + + 0 0$15,000 - $19,999 18 0 0 10 6 + + 0$20,000 - $24,999 65 ++ 0 23 29 11 ++$25,000 - $29,999 160 0 0 39 92 28 + +$30,000 - $34,999 534 0 0 25 381 116 12$35,000 - $39,999 967 + + 0 23 630 277 36$40,000 - $49,999 3,119 0 0 40 1,879 984 216$50,000 - $59,999 2,379 0 0 12 1,385 706 276$60,000 - $74,999 1,628 0 0 11 862 433 322$75,000 - $99,999 160 0 0 0 69 40 51
*Includes a very small number of law and medicine degree recipients.+ +Too few sample cases.
SOURCE: U.S. Department of Education, National Center for Education Statistics, Schools and StaffingSurvey, 1990-91 (Administrator Questionnaire).
Table E-34.--Weighted number of public school administrators, by annual salary and by highest degreeearned: 1990-91
Annual salary TotalNo
degree Associates Bachelors MastersEducationSpecialist Doctorate*
Total 78,890 0 1,430 47,749 22,230 7,456
Less than $10,000 0 0 - 0$10,000 - $14,999 0 - 0 0$15,000 - $19,999 0 0 - - 0$20,000 - $24,999 535 0 - - - 0$25,000 - $29,999 1,066 0 0 - 601 -$30,000 $34,999 4,122 0 0 - 2,944 923 -$35,000 - $39,999 7,916 0 - 5,180 2,307 256$40,000 - $49,999 27,592 0 0 306 17,113 8,396 1,776$50,000 - $59,999 20,817 0 0 - 12,463 6,144 2,120$60,000 - $74,999 15,253 0 0 8,5530 3,715 2,833$75,000 - $99,999 1,255 0 0 0 563 344 348
--Too few sample cases (fewer than 30) for a reliable estimate.*Includes a very small number of law and medicine degree recipients.NOTE: Details may not add to totals due to rounding.
SOURCE: U.S. Department of Education, National Center for Education Statistics, Schools and StaffingSurvey, 1990-91 (Administrator Questionnaire).
294
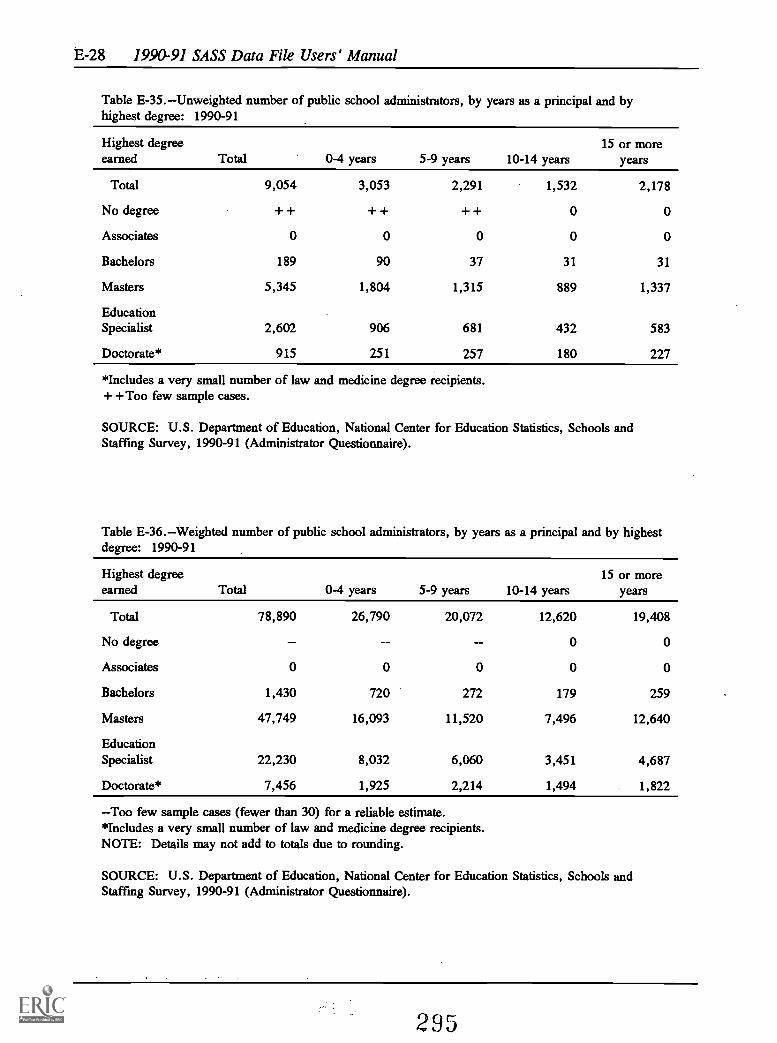
E-28 1990-91 SASS Data File Users' Manual
Table E-35.--Unweighted number of public school administrators, by years as a principal and byhighest degree: 1990-91
Highest degree 15 or moreearned Total 0-4 years 5-9 years 10-14 years years
Total 9,054 3,053 2,291 1,532 2,178
No degree + + + + + + 0 0
Associates 0 0 0 0 0
Bachelors 189 90 37 31 31
Masters 5,345 1,804 1,315 889 1,337
EducationSpecialist 2,602 906 681 432 583
Doctorate* 915 251 257 180 227
*Includes a very small number of law and medicine degree recipients.+ +Too few sample cases.
SOURCE: U.S. Department of Education, National Center for Education Statistics, Schools andStaffing Survey, 1990-91 (Administrator Questionnaire).
Table E-36.--Weighted number of public school administrators, by years as a principal and by highestdegree: 1990-91
Highest degree 15 or moreearned Total 0-4 years 5-9 years 10-14 years years
Total 78,890 26,790 20,072 12,620 19,408
No degree 0 0
Associates 0 0 0 0 0
Bachelors 1,430 720 272 179 259
Masters 47,749 16,093 11,520 7,496 12,640
EducationSpecialist 22,230 8,032 6,060 3,451 4,687
Doctorate* 7,456 1,925 2,214 1,494 1,822
--Too few sample cases (fewer than 30) for a reliable estimate.*Includes a very small number of law and medicine degree recipients.NOTE: Details may not add to totals due to rounding.
SOURCE: U.S. Department of Education, National Center for Education Statistics, Schools andStaffing Survey, 1990-91 (Administrator Questionnaire).
295
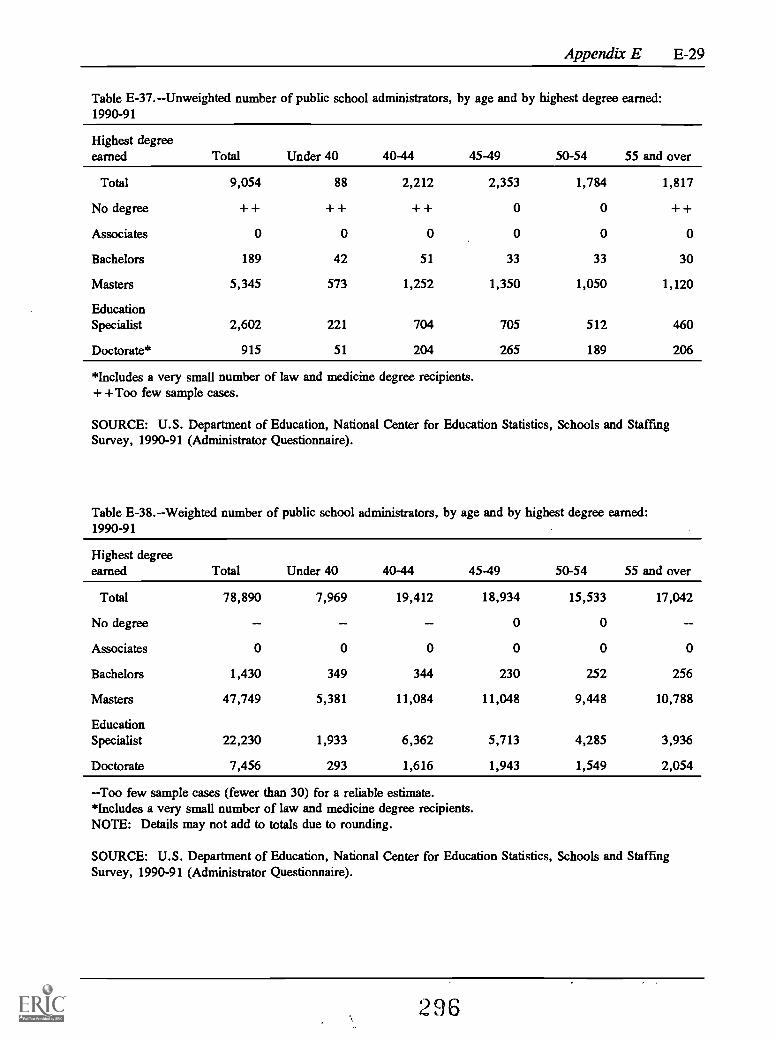
Appendix E E-29
Table E-37.--Unweighted number of public school administrators, by age and by highest degree earned:1990-91
Highest degreeearned Total Under 40 40-44 45-49 50-54 55 and over
Total 9,054 88 2,212 2,353 1,784 1,817
No degree + + + + + + 0 0 + +
Associates 0 0 0 0 0 0
Bachelors 189 42 51 33 33 30
Masters 5,345 573 1,252 1,350 1,050 1,120
EducationSpecialist 2,602 221 704 705 512 460
Doctorate* 915 51 204 265 189 206
*Includes a very small number of law and medicine degree recipients.+ +Too few sample cases.
SOURCE: U.S. Department of Education, National Center for Education Statistics, Schools and StaffingSurvey, 1990-91 (Administrator Questionnaire).
Table E-38.--Weighted number of public school administrators, by age and by highest degree earned:1990-91
Highest degreeearned Total Under 40 40-44 45-49 50-54 55 and over
Total 78,890 7,969 19,412 18,934 15,533 17,042
No degree - 0 0
Associates 0 0 0 0 0 0
Bachelors 1,430 349 344 230 252 256
Masters 47,749 5,381 11,084 11,048 9,448 10,788
EducationSpecialist 22,230 1,933 6,362 5,713 4,285 3,936
Doctorate 7,456 293 1,616 1,943 1,549 2,054
--Too few sample cases (fewer than 30) for a reliable estimate.*Includes a very small number of law and medicine degree recipients.NOTE: Details may not add to totals due to rounding.
SOURCE: U.S. Department of Education, National Center for Education Statistics, Schools and StaffingSurvey, 1990-91 (Administrator Questionnaire).
296

E-30 1990-91 SASS Data File Users' Manual
Table E-39.--Unweighted number of public school administrators, by years as a principal and byannual salary: 1990-91
Annual salary Total 0-4 years 5-9 years 10-14 years15 or more
years
Total 9,054 3,053 2,291 1,532 2,178
Less than$10,000 17 4 3 6 4
$10,000-$14,999 7 5 0 0 + +$15,000-$19,999 18 11 4 + + + +$20,000-$24,999 65 37 11 7 10
$25,000-$29,999 160 81 38 27 14
$30,000-$34,999 534 231 131 68 104
$35,000-$39,999 967 415 245 146 161
$40,000-$49,999 3,119 1,100 784 517 718$50,000-$59,999 2,379 743 613 410 613$60,000-$74,999 1,628 393 428 312 495$75,000-$99,999 160 33 34 37 56
+ +Too few sample cases.
SOURCE: U.S. Department of Education, National Center for Education Statistics, Schools andStaffing Survey, 1990-91 (Administrator Questionnaire).
Table E-40.--Weighted number of public school administrators, by years as a principal and by annualsalary: 1990-91
Annual salary Total 0-4 years 5-9 years 10-14 years15 or more
years
Total 78,890 26,790 20,072 12,620 19,408
Less than$10,000
$10,000-$14,999 - 0 0$15,000- $19,999$20,000- $24,999 535 279 - -$25,000-$29,999 1,066 521 262$30,000-$34,999 4,122 1,850 1,073 462 739$35,000-$39,999 7,916 3,529 2,025 1,151 1,211$40,000-$49,999 27,592 9,967 6,669 4,572 6,384$50,000- $59,999 20,817 6,659 5,429 3,186 5,544$60,000 - $74,999 15,253 3,589 4,143 2,743 4,778$75,000-$99,999 1,255 225 304 239 487
-Too few sample cases (fewer than 30) for a reliable estimate.NOTE: Details may not add to totals due to rounding.
SOURCE: U.S. Department of Education, National Center for Education Statistics, Schools andStaffing Survey, 1990-91 (Administrator Questionnaire).
297

Appendix E E-31
Table E-41.--Unweighted number of public school administrators, by age and by annual salary:1990-91
Annual salary Total Under 40 40-44 45-49 50-54 55 or over
Total 9,054 888 2,212 2,353 1,784 1,817
Less than$10,000 17 0 + + + + 7 7
$10,000-$14,999 7 4 + + 0 + + 0$15,000-$19,999 18 8 + + 4 + + + +$20,000-$24,999 65 24 11 11 9 10$25,000-$29,999 160 41 48 29 21 21$30,000-$34,999 534 111 144 129 82 68$35,000-$39,999 967 161 300 218 145 143$40,000-$49,999 3,119 349 891 780 546 553$50,000-$59,999 2,379 139 510 677 536 517$60,000-$74,999 1,628 47 288 463 387 443$75,000-$99,999 160 4 15 40 48 53
+ +Too few sample cases.
SOURCE: U.S. Department of Education, National Center for Education Statistics, Schools and StaffingSurvey, 1990-91 (Administrator Questionnaire)
Table E-42.--Weighted number of public school administrators, by age and by annual salary: 1990-91
Annual salary Total Under 40 40-44 45-49 50-54 55 or over
Total 78,890 7,969 19,412 18,934 15,533 17,042
Less than$10,000 - 0 - - - -
$10,000- $14,999 - - - 0 - 0$15,000-$19,999 - - - - - -$20,000- $24,999 535 - - - - -$25,000- $29,999 1,066 285 314 -$30,000- $34,999 4,122 993 1,134 960 543 492$35,000-$39,999 7,916 1,480 2,603 1,694 1,022 1,117$40,000-$49,999 27,592 3,316 8,130 6,138 4,740 5,268$50,000-$59,999 20,817 1,225 4,397 5,899 4,691 4,606$60,000-$74,999 15,253 366 2,628 3,649 3,804 4,807$75,000-$99,999 1,255 309 396 404
--Too few sample cases (fewer than 30) for a reliable estimate.NOTE: Details may not add to totals due to rounding.
SOURCE: U.S. Department of Education, National Center for Education Statistics, Schools and StaffingSurvey, 1990-91 (Administrator Questionnaire)
298
Appendix E E-33
Private School Administrator Survey
Selected Unweighted and Weighted Tables
299

E-34 1990-91 SASS Data File Users' Manual
Table E-43.--Unweighted number of private school administrators, by race/ethnicity and sex: 1990-91
Black,
Sex Total White Non-hispanic Hispanic Other
Total 2,757 2,577 83 62 35
Male 1,520 1,454 27 23 16
Female 1,237 1,123 56 39 19
SOURCE: U.S. Department of Education, National Center for Education Statistics, Schools and
Staffing Survey, 1990-91 (Administrator Questionnaire).
Table E-44.--Weighted number of private school administrators, by race/ethnicity and sex:
1990-91
Black,
Sex Total White Non-hispanic Hispanic Other
Total 23,881 22,366 643 607 265
Male 11,640 11,165
Female 12,241 11,201 411 446
--Too few sample cases (fewer than 30) for a reliable estimate.NOTE: Details may not add to totals due to rounding.
SOURCE: U.S. Department of Education, National Center for Education Statistics, Schools and
Staffing Survey, 1990-91 (Administrator Questionnaire).
300
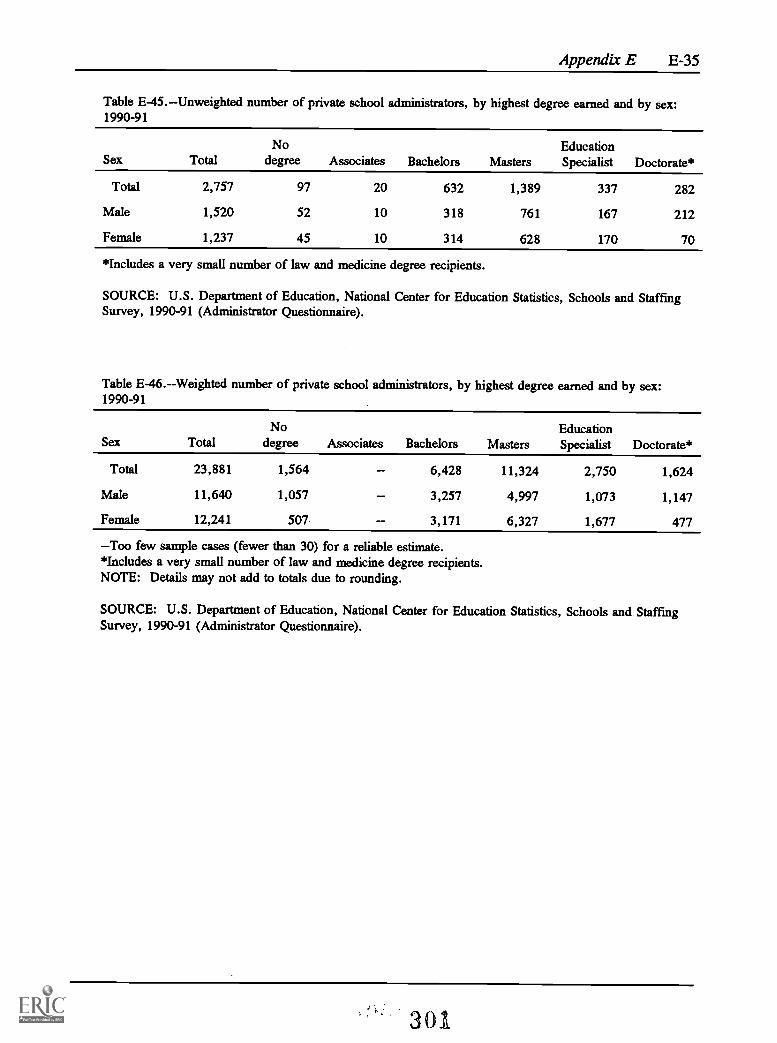
Appendix E E-35
Table E-45.--Unweighted number of private school administrators, by highest degree earned and by sex:1990-91
No EducationSex Total degree Associates Bachelors Masters Specialist Doctorate*
Total 2,757 97 20 632 1,389 337 282
Male 1,520 52 10 318 761 167 212
Female 1,237 45 10 314 628 170 70
*Includes a very small number of law and medicine degree recipients.
SOURCE: U.S. Department of Education, National Center for Education Statistics, Schools and StaffingSurvey, 1990-91 (Administrator Questionnaire).
Table E-46.--Weighted number of private school administrators, by highest degree earned and by sex:1990-91
SexNo Education
Total degree Associates Bachelors Masters Specialist Doctorate*
Total 23,881 1,564 6,428 11,324 2,750 1,624
Male 11,640 1,057 3,257 4,997 1,073 1,147
Female 12,241 507 3,171 6,327 1,677 477
--Too few sample cases (fewer than 30) for a reliable estimate.*Includes a very small number of law and medicine degree recipients.NOTE: Details may not add to totals due to rounding.
SOURCE: U.S. Department of Education, National Center for Education Statistics, Schools and StaffingSurvey, 1990-91 (Administrator Questionnaire).
301
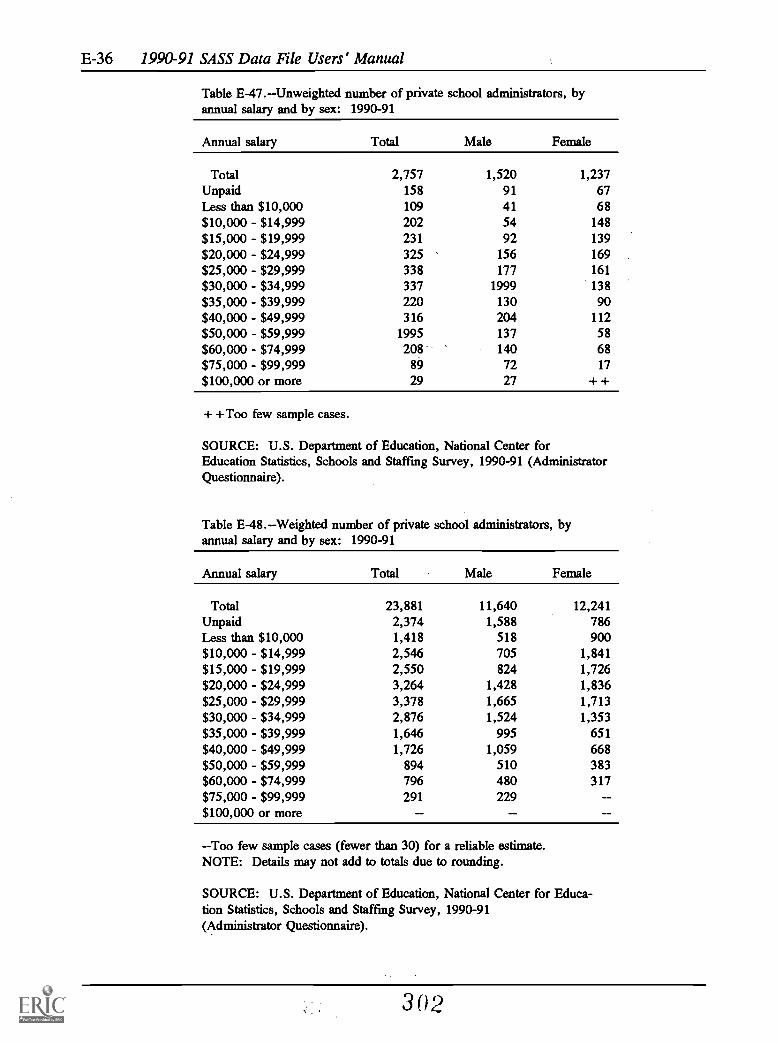
E-36 1990-91 SASS Data File Users' Manual
Table E-47.--Unweighted number of private school administrators, byannual salary and by sex: 1990-91
Annual salary Total Male Female
TotalUnpaidLess than $10,000
2,757158109
1,5209141
1,2376768
$10,000 - $14,999 202 54 148$15,000 - $19,999 231 92 139$20,000 - $24,999 325 156 169$25,000 - $29,999 338 177 161$30,000 - $34,999 337 1999 138$35,000 - $39,999 220 130 90$40,000 - $49,999 316 204 112$50,000 - $59,999 1995 137 58$60,000 - $74,999 208 140 68$75,000 - $99,999 89 72 17
$100,000 or more 29 27 + +
+ +Too few sample cases.
SOURCE: U.S. Department of Education, National Center forEducation Statistics, Schools and Staffing Survey, 1990-91 (AdministratorQuestionnaire).
Table E-48.--Weighted number of private school administrators, byannual salary and by sex: 1990-91
Annual salary Total Male Female
Total 23,881 11,640 12,241Unpaid 2,374 1,588 786Less than $10,000 1,418 518 900$10,000 - $14,999 2,546 705 1,841$15,000 - $19,999 2,550 824 1,726$20,000 - $24,999 3,264 1,428 1,836$25,000 - $29,999 3,378 1,665 1,713$30,000 - $34,999 2,876 1,524 1,353$35,000 - $39,999 1,646 995 651$40,000 - $49,999 1,726 1,059 668$50,000 - $59,999 894 510 383$60,000 - $74,999 796 480 317$75,000 - $99,999 291 229$100,000 or more
--Too few sample cases (fewer than 30) for a reliable estimate.NOTE: Details may not add to totals due to rounding.
SOURCE: U.S. Department of Education, National Center for Educa-tion Statistics, Schools and Staffing Survey, 1990-91(Administrator Questionnaire).
302
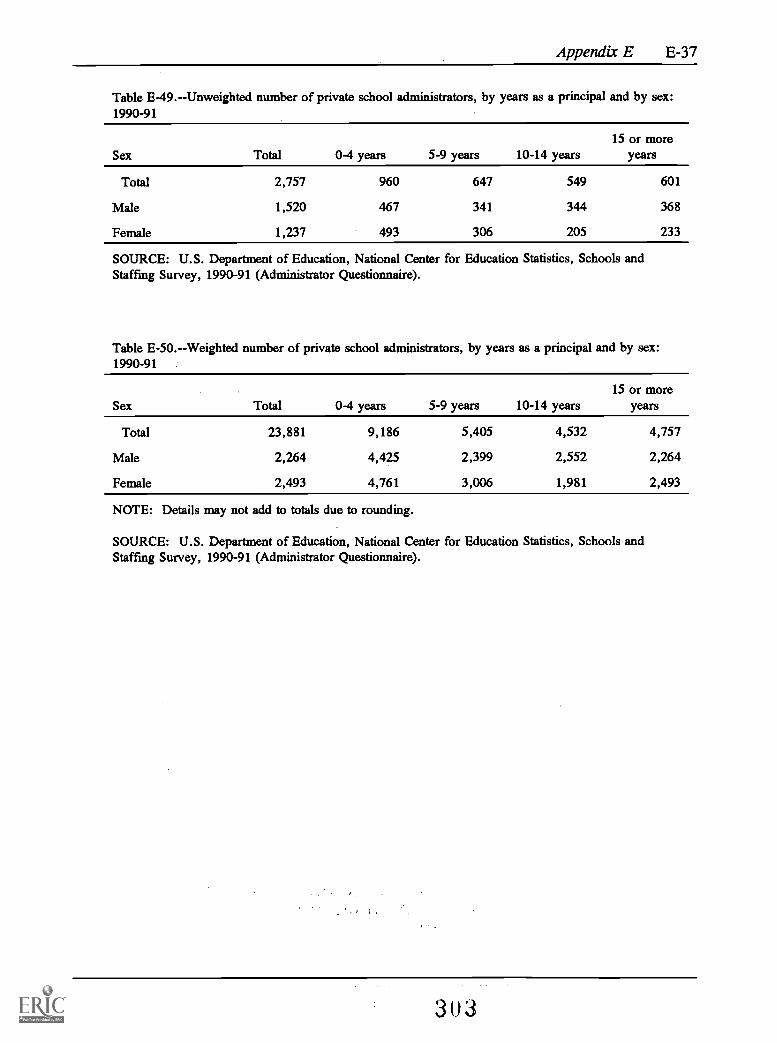
Appendix E E-37
Table E-49.--Unweighted number of private school administrators, by years as a principal and by sex:1990-91
15 or moreSex Total 0-4 years 5-9 years 10-14 years years
Total 2,757 960 647 549 601
Male 1,520 467 341 344 368
Female 1,237 493 306 205 233
SOURCE: U.S. Department of Education, National Center for Education Statistics, Schools andStaffing Survey, 1990-91 (Administrator Questionnaire).
Table E-50.--Weighted number of private school administrators, by years as a principal and by sex:1990-91
15 or moreSex Total 0-4 years 5-9 years 10-14 years years
Total 23,881 9,186 5,405 4,532 4,757
Male 2,264 4,425 2,399 2,552 2,264
Female 2,493 4,761 3,006 1,981 2,493
NOTE: Details may not add to totals due to rounding.
SOURCE: U.S. Department of Education, National Center for Education Statistics, Schools andStaffing Survey, 1990-91 (Administrator Questionnaire).
303

E-38 1990-91 SASS Data File Users' Manual
Table E-51.--Unweighted number of private school administrators, by age and by sex: 1990-91
Sex Total Under 40 40-44 45-49 50-54 55 and over
Total 2,757 559 605 547 407 639
Male 1,520 353 351 315 206 295
Female 1,237 206 254 232 201 344
SOURCE: U.S. Department of Education, National Center for Education Statistics, Schools and StaffingSurvey, 1990-91 (Administrator Questionnaire).
Table E-52.--Weighted number of private school administrators, by age and by sex: 1990-91
Sex Total Under 40 40-44 45-49 50-54 55 and over
Total 23,881 5,328 4,852 4,662 3,405 5,633
Male 11,640 3,050 2,587 2,454 1,416 2,134
Female 12,241 2,279 2,265 2,208 1,989 3,499
NOTE: Details may not add to totals due to rounding.
SOURCE: U.S. Department of Education, National Center for Education Statistics, Schools and StaffingSurvey, 1990-91 (Administrator Questionnaire).
304

Appendix E E-39
Table E-53.--Unweighted number of private school administrators, by highest degree earned and byrace/ethnicity: 1990-91
Race/ethnicity Total
Nodegree Associates Bachelors Masters
EducationSpecialist Doctorate*
Total 2,757 97 20 632 1,389 337 282
White 2,577 86 16 584 1,313 314 264
Black,Non-hispanic
83 8 + + 22 37 7 8
Hispanic 62 + + + + 18 27 11 3
Other 35 + + + + 8 12 5 7
*Includes a very small number of law and medicine degree recipients.+ +Too few sample cases.
SOURCE: U.S. Department of Education, National Center for Education Statistics, Schools and StaffingSurvey, 1990-91 (Administrator Questionnaire).
Table E-54.--Weighted number of private school administrators, by highest degree earned and byrace/ethnicity: 1990-91
Race/ethnicity Total
Nodegree Associates Bachelors Masters
EducationSpecialist Doctorate*
Total
White
Black,Non-hispanic
Hispanic
Other
23,881
22,366
642
607
265
1,564
1,466
6,428
5,959
11,324
10,710
283
2,750
2,609
1,624
1,473
--Too few sample cases (fewer than 30) for a reliable estimate.*Includes a very small number of law and medicine degree recipients.NOTE: Details may not add to totals due to rounding.
SOURCE: U.S. Department of Education, National Center for Education Statistics, Schools and StaffingSurvey, 1990-91 (Administrator Questionnaire).
, 305

E-40 1990-91 SASS Data File Users' Manual
Table E-55.--Unweighted number of private school administrators, by annual salary and by race/ethnicity:1990-91
Annual salary Total WhiteBlack,
Non-hispanic Hispanic Other
Total 2,757 2,577 83 62 35Unpaid 158 144 9 4 + +Less than $10,000 109 99 6 + + + +$10,000 - $14,999 202 192 3 5 + +$15,000 - $19,999 231 216 8 6 + +$20,000 - $24,999 325 308 6 7 4$25,000 - $29,999 338 318 12 4 4$30,000 - $34,999 337 306 12 15 4$35,000 - $39,999 220 201 9 7 3
$40,000 - $49,999 316 294 8 6 8
$50,000 - $59,999 195 185 4 4 + +$60,000 - $74,999 208 199 4 + + 3
$75,000 - $99,999 89 86 + + 0 + +$100,000 or more 29 29 0 0 0
+ +Too few sample cases.
SOURCE: U.S. Department of Education, National Center for Education Statistics, Schools and StaffingSurvey, 1990-91 (Administrator Questionnaire).
Table E-56.--Weighted number of private school administrators, by annual salary and by race/ethnicity:1990-91
Black,Annual salary Total White Non-hispanic Hispanic Other
Total 23,881 22,366 642 607 265Unpaid 2,374 2,250Less than $10,000 1,418 1,298$10,000 - $14,999 2,546 2,411$15,000 - $19,999 2,550 2,420$20,000 - $24,999 3,264 3,107$25,000 - $29,999 3,378 3,170$30,000 - $34,999 2,876 2,589$35,000 - $39,999 1,646 1,509$40,000 - $49,999 1,726 1,618$50,000 - $59,999 894 845$60,000 - $74,999 796 762$75,000 - $99,999 291 266 0$100,000 or more - - 0 0 0
--Too few sample cases (fewer than 30) for a reliable estimate.NOTE: Details may not add to totals due to rounding.
SOURCE: U.S. Department of Education, National Center for Education Statistics, Schools and StaffingSurvey, 1990-91 (Administrator Questionnaire).
306

Appendix E E-4 1
Table E-57.--Unweighted number of private school administrators, by years as a principal and byrace/ethnicity: 1990-91
Race/ethnicity15 or more
Total 0-4 years 5-9 years 10-14 years years
Total 2,757 960 647 549 601
White
Black,Non-hispanic
Hispanic
Other
2,577 891 596 513 577
10 36 22 15 10
6 26 18 12 6
8 7 11 9 8
SOURCE: U.S. Department of Education, National Center for Education Statistics, Schools andStaffing Survey, 1990-91 (Administrator Questionnaire).
Table E-58.--Weighted number of private school administrators, by years as a principal and byrace/ethnicity: 1990-91
15 or moreRace/ethnicity Total 0-4 years 5-9 years 10-14 years years
Total 23,881 9,186 5,405 4,532 4,757
White 22,366 8,633 5,000 4,189 4,544
Black,Non-hispanic 262
Hispanic
Other
--Too few sample cases (fewer than 30) for a reliable estimate.NOTE: Details may not add to totals due to rounding.
SOURCE: U.S. Department of Education, National Center for Education Statistics, Schools andStaffing Survey, 1990-91 (Administrator Questionnaire).
307
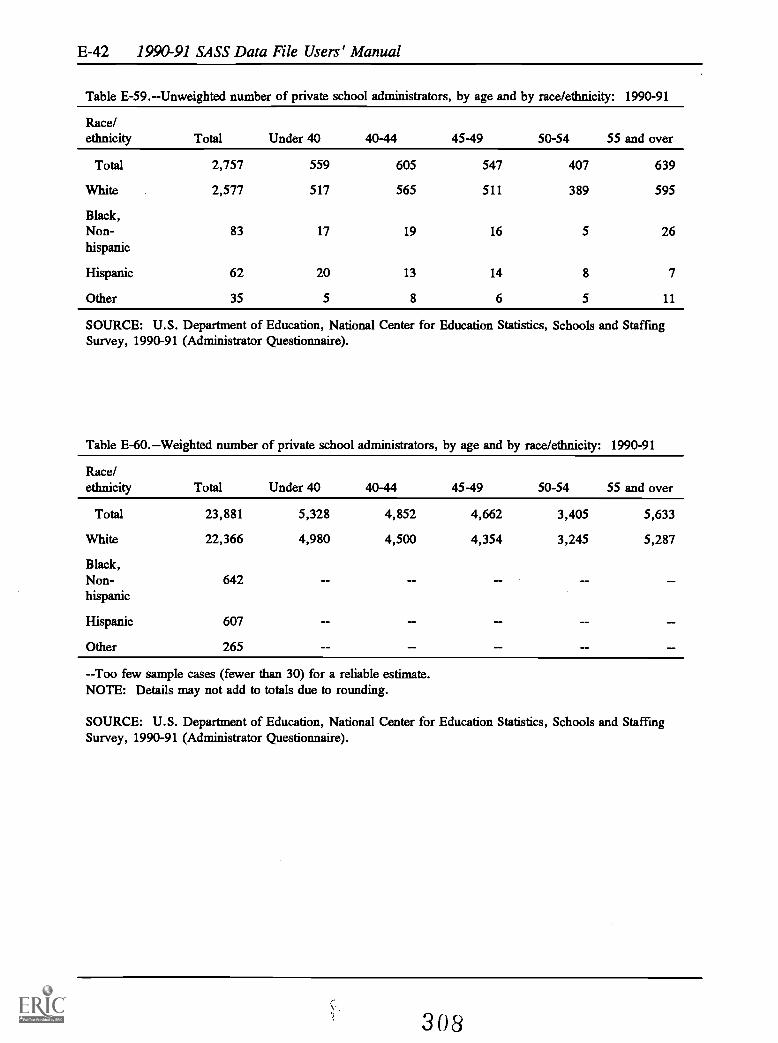
E-42 1990-91 SASS Data File Users' Manual
Table E-59.--Unweighted number of private school administrators, by age and by race/ethnicity: 1990-91
Race/ethnicity Total Under 40 40-44 45-49 50-54 55 and over
Total 2,757 559 605 547 407 639
White 2,577 517 565 511 389 595
Black,Non-hispanic
83 17 19 16 5 26
Hispanic 62 20 13 14 8 7
Other 35 5 8 6 5 11
SOURCE: U.S. Department of Education, National Center for Education Statistics, Schools and StaffingSurvey, 1990-91 (Administrator Questionnaire).
Table E-60.--Weighted number of private school administrators, by age and by race/ethnicity: 1990-91
Race/ethnicity Total Under 40 40-44 45-49 50-54 55 and over
Total
White
Black,Non-hispanic
Hispanic
Other
23,881
22,366
642
607
265
5,328
4,980
4,852
4,500
4,662
4,354
3,405
3,245
5,633
5,287
--Too few sample cases (fewer than 30) for a reliable estimate.NOTE: Details may not add to totals due to rounding.
SOURCE: U.S. Department of Education, National Center for Education Statistics, Schools and StaffingSurvey, 1990-91 (Administrator Questionnaire).
308
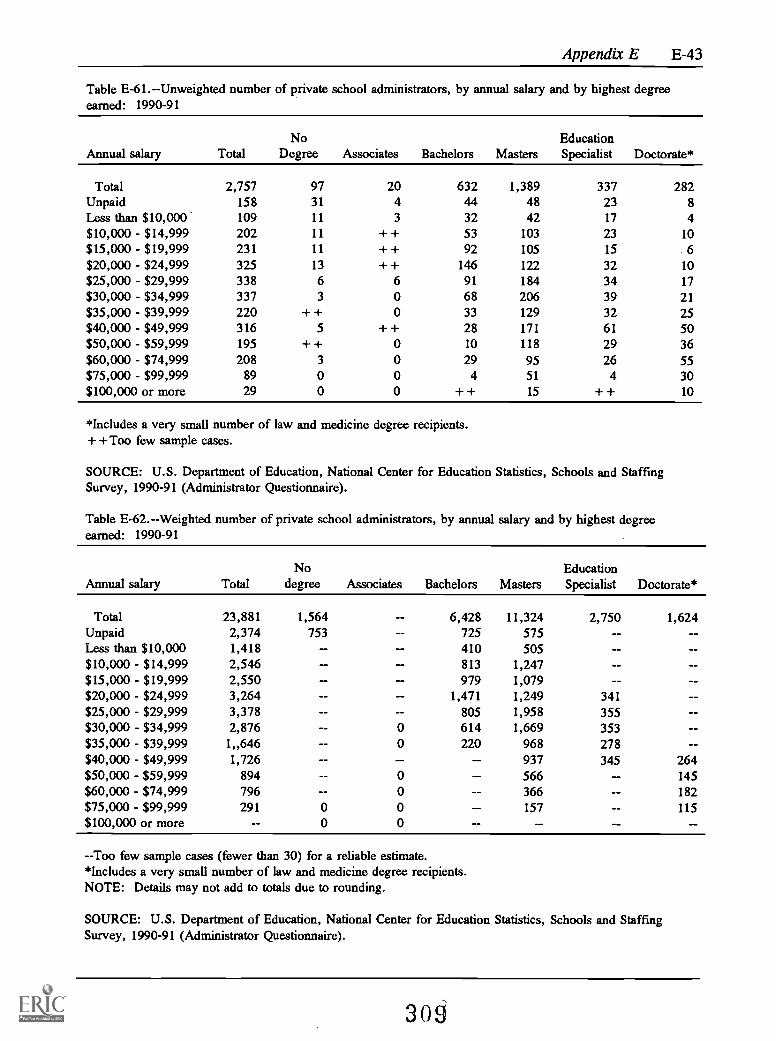
Appendix E E-43
Table E-61.--Unweighted number of private school administrators, by annual salary and by highest degreeearned: 1990-91
Annual salary TotalNo
Degree Associates Bachelors MastersEducationSpecialist Doctorate*
Total 2,757 97 20 632 1,389 337 282Unpaid 158 31 4 44 48 23 8Less than $10,000 109 11 3 32 42 17 4$10,000 - $14,999 202 11 ++ 53 103 23 10$15,000 - $19,999 231 11 ++ 92 105 15 6$20,000 - $24,999 325 13 ++ 146 122 32 10$25,000 - $29,999 338 6 6 91 184 34 17$30,000 - $34,999 337 3 0 68 206 39 21$35,000 - $39,999 220 ++ 0 33 129 32 25$40,000 - $49,999 316 5 -I- -I- 28 171 61 50$50,000 - $59,999 195 ++ 0 10 118 29 36$60,000 - $74,999 208 3 0 29 95 26 55$75,000 - $99,999 89 0 0 4 51 4 30$100,000 or more 29 0 0 ++ 15 ++ 10
*Includes a very small number of law and medicine degree recipients.+ +Too few sample cases.
SOURCE: U.S. Department of Education, National Center forSurvey, 1990-91 (Administrator Questionnaire).
Table E-62.--Weighted number of private school administrators,
Education Statistics,
by annual salary an
Schools and Staffing
d by highest degreeearned: 1990-91
Annual salary TotalNo
degree Associates Bachelors MastersEducationSpecialist Doctorate*
Total 23,881 1,564 6,428 11,324 2,750 1,624Unpaid 2,374 753 725 575Less than $10,000 1,418 410 505$10,000 $14,999 2,546 813 1,247$15,000 - $19,999 2,550 979 1,079$20,000 - $24,999 3,264 1,471 1,249 341$25,000 $29,999 3,378 805 1,958 355$30,000 - $34,999 2,876 0 614 1,669 353$35,000 - $39,999 1 646 0 220 968 278$40,000 - $49,999 1,726 937 345 264$50,000 $59,999 894 0 566 145$60,000 - $74,999 796 0 366 182$75,000 - $99,999 291 0 0 157 115$100,000 or more 0 0
--Too few sample cases (fewer than 30) for a reliable estimate.*Includes a very small number of law and medicine degree recipients.NOTE: Details may not add to totals due to rounding.
SOURCE: U.S. Department of Education, National Center for Education Statistics, Schools and StaffingSurvey, 1990-91 (Administrator Questionnaire).
3

E-44 1990-91 SASS Data File Users' Manual
Table E-63.--Unweightecl number of private school administrators, by years as a principal and byhighest degree: 1990-91
Highest degreeearned Total 0-4 years 5-9 years 10-14 years
15 or moreyears
Total 2,757 960 647 549 601
No degree 97 55 22 11 9
Associates 20 6 8 5 + +
Bachelors 632 297 133 106 96
Masters 1,389 431 336 293 329
EducationSpecialist 337 91 85 79 82
Doctorate* 282 80 63 55 84
*Includes a very small number of law and medicine degree recipients.+ +Too few sample cases.
SOURCE: U.S. Department of Education, National Center for Education Statistics, Schools andStaffing Survey, 1990-91 (Administrator Questionnaire).
Table E-64.--Weighted number of private school administrators, by years as a principal and by highestdegree: 1990-91
Highest degreeearned Total 0-4 years 5-9 years 10-14 years
15 or moreyears
Total 23,881 9,186 5,405 4,532 4,757
No degree 1,564 1,000
Associates
Bachelors 6,428 3,201 1,439 1,044 744
Masters 11,324 3,574 2,564 2,326 2,860
EducationSpecialist 2,750 782 730 599 639
Doctorate* 1,624 573 278 359 413
--Too few sample cases (fewer than 30) for a reliable estimate.*Includes a very small number of law and medicine degree recipients.
SOURCE: U.S. Department of Education, National Center for Education Statistics, Schools andStaffing Survey, 1990-91 (Administrator Questionnaire).
310

Appendix E E-45
Table E-65.--Unweighted number of private school administrators, by age and by highest degree earned:1990-91
Highest de-gree earned
Total Under 40 40-44 45-49 50-54 55 and over
Total 2,757 559 605 547 407 639
No degree 97 36 14 16 11 20
Associates 20 5 4 3 3 5
Bachelors 632 212 141 109 69 101
Masters 1,389 231 318 284 218 338
EducationSpecialist 337 46 67 64 62 98
Doctorate* 282 29 61 71 44 77
*Includes a very small number of law and medicine degree recipients.
SOURCE: U.S. Department of Education, National Center for Education Statistics, Schools and StaffingSurvey, 1990-91 (Administrator Questionnaire).
Table E-66.--Weighted number of private school administrators, by age and by highest degree earned:1990-91
Highest de-gree earned
Total Under 40 40-44 45-49 50-54 55 and over
Total 23,880 5,328 4,852 4,662 3,405 5,633
No dDegree 1,564 708
Associates
Bachelors 6,428 2,217 1,325 1,096 863 926
Masters 11,324 1,773 2,504 2,359 1,684 3,004
EducationSpecialist 2,750 344 525 541 485 854
Doctorate* 1,624 306 342 217 531
Too few sample cases (fewer than 30) for a reliable estimate.*Includes a very small number of law and medicine degree recipients.NOTE: Details may not add to totals due to rounding.
SOURCE: U.S. Department of Education, National Center for Education Statistics, Schools and StaffingSurvey, 1990-91 (Administrator Questionnaire).
311

E-46 1990-91 SASS Data File Users' Manual
Table E-67.--Unweighted number of private school administrators, by years as a principal and byannual salary: 1990-91
Annual salary Total 0-4 years 5-9 years 10-14 years15 or more
years
Total 2,757 960 647 549 601
Unpaid 158 65 33 26 34
Less than 109 44 30 17 18
$10,000$10,000- $14,999 202 60 44 35 63
$15,000-$19,999 231 93 56 42 40
$20,000-$24,999 325 149 64 60 52
$25,000-$29,999 338 142 76 50 70
$30,000-$34,999 337 122 71 71 73
$35,000- $39,999 220 78 48 49 45
$40,000-$49,999 316 93 97 63 63
$50,000-$59,999 195 51 54 52 38
$60,000-$74,999 208 42 52 50 64
$75,000-$99,999 89 18 15 28 28
$100,000 or more 29 3 7 6 13
SOURCE: U.S. Department of Education, National Center for Education Statistics, Schools andStaffing Survey, 1990-91 (Administrator Questionnaire).
Table E-68.--Weighted number of private school administrators, by years as a principal and by annualsalary: 1990-91
Annual salary Total 0-4 years 5-9 years 10-14 years15 or more
years
Total 23,881 9,186 5,405 4,532 4,757
Unpaid 2,375 1,058 522 436
Less than 1,418 516 398
$10,000$10,000 - $14,999 2,546 755 532 435 824
$15,000-$19,999 2,550 939 728 476 407
$20,000-$24,999 3,264 1,637 596 581 450
$25,000-$29,999 3,378 1,482 778 499 620
$30,000-$34,999 2,876 1,192 531 609 545
$35,000-$39,999 1,646 630 271 430 314
$40,000-$49,999 1,727 488 498 371 370
$50,000-$59,999 894 223 254 214 203
$60,000-$74,999 796 171 202 170 254
$75,000-$99,999 291$100,000 or more
--Too few sample cases (fewer than 30) for a reliable estimate.NOTE: Details may not add to totals due to rounding.
SOURCE: U.S. Department of Education, National Center for Education Statistics, Schools andStaffing Survey, 1990-91 (Administrator Questionnaire).
312

Appendix E E-47
Table E-69.--Unweighted number of private school administrators, by age and by annual salary:1990-91
Annual salary Total Under 40 40-44 45-49 50-54 55 or over
Total 2,757 559 605 547 407 639Unpaid 158 25 28 33 30 42Less than 109 25 16 18 15 35$10,000$10,000- $14,999 202 31 39 22 35 75$15,000-$19,999 231 61 49 46 32 43$20,000-$24,999 325 95 76 58 31 65$25,000-$29,999 338 92 76 67 37 66$30,000-$34,999 337 75 85 61 45 71$35,000-$39,999 220 45 50 51 24 50$40,000-$49,999 316 56 82 64 50 64$50,000-$59,999 195 25 44 46 34 46$60,000-$74,999 208 24 44 56 39 45$75,000- $99,999 89 5 14 19 27 24$100,000 or more 29 0 + + 6 8 13
+ +Too few sample cases for a reliable estimate.
SOURCE: U.S. Department of Education, National Center for Education Statistics, Schools and StaffingSurvey, 1990-91 (Administrator Questionnaire).
Table E-70.--Weighted number of private school administrators, by age and by annual salary:1990-91
Annual salary Total Under 40 40-44 45-49 50-54 55 or over
Total 23,881 5,328 4,852 4,662 3,405 5,633Unpaid 2,375 498 580 582Less than 1,418 435$10,000$10,000-$14,999 2,546 410 521 428 894$15,000-$19,999 2,550 602 494 536 416 502$20,000-$24,999 3,264 929 728 667 324 616$25,000-$29,999 3,378 955 808 598 363 654$30,000 - $34,999 2,876 687 735 501 326 626$35,000-$39,999 1,646 361 302 432 398$40,000-$49,999 1,727 319 433 398 255 322$50,000-$59,999 894 192 237 142 215$60,000-$74,999 796 133 228 105 231$75,000-$99,999 291$100,000 or more 0
Too few sample cases (fewer than 30) for a reliable estimate.NOTE: Details may not add to totals due to rounding.
SOURCE: U.S. Department of Education, National Center for Education Statistics, Schools and StaffingSurvey, 1990-91 (Administrator Questionnaire).
313
Appendix E E-49
Public School Survey
Selected Unweighted and Weighted Tables
314

E-50 1990-91 SASS Data File Users' Manual
Table E-71.--Unweighted number of public K-12 teachers by level: 1990-91
Total Elementary Secondary Combined
Total number of K-12 teachers 343,072 126,593 189,328 27,151
Number of full-time K-12teachers 313,865 112,118 176,366 25,381
Number of part-time K-12teachers 29,207 14,475 12,962 1,770
Number of K-12 teachers newto school this year
35,389 15,233 17,254 2,902
Number of K-12 left thisschool 26,736 10,648 13,929 2,159
Teaching vacancies thisschool, this year
10,653 5,280 4,328 1,025
Teaching vacancies unfilledthis year 13,425 6,451 5,745 1,229
SOURCE: U.S. Department of Education, National Center for Education Statistics, Schools and Staffing Survey, 1990-91(School Questionnaire).
Table E-72.--Weighted number of public K-12 teachers by level: 1990-91
Total Elementary Secondary Combined
Total number of K-12 teachers 2,559,488 1,545,080 905,027 109,380
Number of full-time K-12teachers 2,297,682 1,357,653 838,947 101,082
Number of part-time K-12teachers 261,805 187,427 66,080 8,298
Number of K-12 teachers newto school this year
277,739 179,741 85,273 12,724
Number of K-12 left thisschool 199,693 123,526 67,032 9,136
Teaching vacancies thisschool, this year
97,983 69,722 23,381 4,879
Teaching vacancies unfilledthis year 113,830 78,969 29,377 5,484
SOURCE: U.S. Department of Education, National Center for Education Statistics, Schools and Staffing Survey, 1990-91(School Questionnaire).
31.5
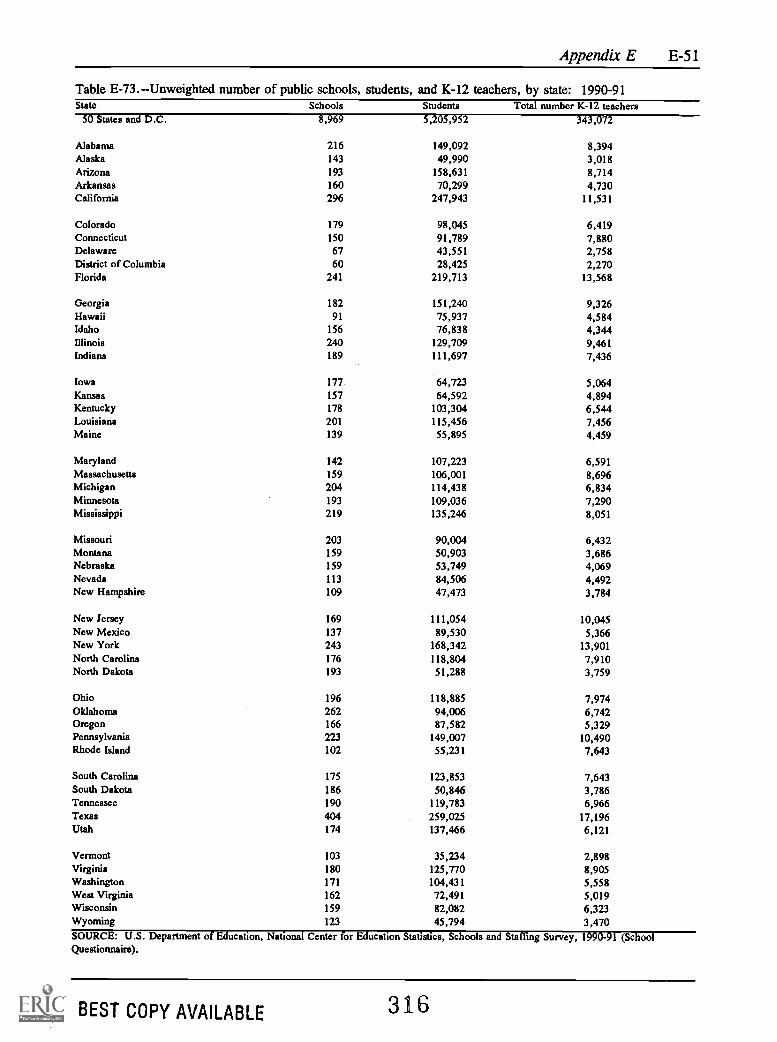
Appendix E E-5 1
Table E-73.-Unweighted number of public schools, students, and K-12 teachers, by state: 1990-91State Schools Students Total number K-12 teachers
50 States and D.C. 8,969 5,205,952 343,072
Alabama 216 149,092 8,394Alaska 143 49,990 3,018Arizona 193 158,631 8,714Arkansas 160 70,299 4,730California 296 247,943 11,531
Colorado 179 98,045 6,419Connecticut 150 91,789 7,880Delaware 67 43,551 2,758District of Columbia 60 28,425 2,270Florida 241 219,713 13,568
Georgia 182 151,240 9,326Hawaii 91 75,937 4,584Idaho 156 76,838 4,344Illinois 240 129,709 9,461Indiana 189 111,697 7,436
Iowa 177. 64,723 5,064Kansas 157 64,592 4,894Kentucky 178 103,304 6,544Louisiana 201 115,456 7,456Maine 139 55,895 4,459
Maryland 142 107,223 6,591Massachusetts 159 106,001 8,696Michigan 204 114,438 6,834Minnesota 193 109,036 7,290Mississippi 219 135,246 8,051
Missouri 203 90,004 6,432Montana 159 50,903 3,686Nebraska 159 53,749 4,069Nevada 113 84,506 4,492New Hampshire 109 47,473 3,784
New Jersey 169 111,054 10,045New Mexico 137 89,530 5,366New York 243 168,342 13,901North Carolina 176 118,804 7,910North Dakota 193 51,288 3,759
Ohio 196 118,885 7,974Oklahoma 262 94,006 6,742Oregon 166 87,582 5,329Pennsylvania 223 149,007 10,490Rhode Island 102 55,231 7,643
South Carolina 175 123,853 7,643South Dakota 186 50,846 3,786Tennessee 190 119,783 6,966Texas 404 259,025 17,196Utah 174 137,466 6,121
Vermont 103 35,234 2,898Virginia 180 125,770 8,905Washington 171 104,431 5,558West Virginia 162 72,491 5,019Wisconsin 159 82,082 6,323Wyoming 123 45,794 3,470SOURCE: U.S. Department of Education, National Center for Education Statistics, Schools and Staffing Survey, 1990-91 (SchoolQuestionnaire).
BEST COPY AVAILABLE 316
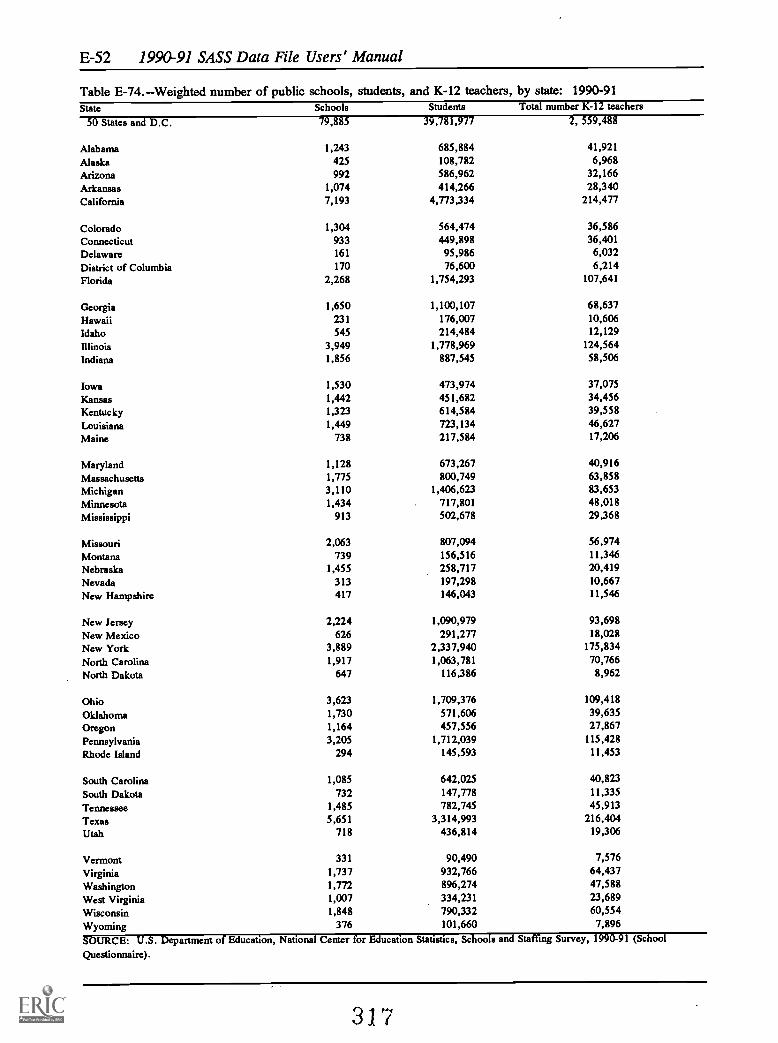
E-52 1990-91 SASS Data File Users' Manual
Table E-74.--Weighted number of public schools, students, and K-12 teachers, by state: 1990-91State Schools Students Total number K-12 teachers
50 States and D.C. 79,885 39,781,977 2, 559,488
Alabama 1,243 685,884 41,921
Alaska 425 108,782 6,968Arizona 992 586,962 32,166Arkansas 1,074 414,266 28,340California 7,193 4,773,334 214,477
Colorado 1,304 564,474 36,586Connecticut 933 449,898 36,401Delaware 161 95,986 6,032District of Columbia 170 76,600 6,214Florida 2,268 1,754,293 107,641
Georgia 1,650 1,100,107 68,637Hawaii 231 176,007 10,606
Idaho 545 214,484 12,129
Illinois 3,949 1,778,969 124,564Indiana 1,856 887,545 58,506
Iowa 1,530 473,974 37,075
Kansas 1,442 451,682 34,456Kentucky 1,323 614,584 39,558
Louisiana 1,449 723,134 46,627Maine 738 217,584 17,206
Maryland 1,128 673,267 40,916Massachusetts 1,775 800,749 63,858Michigan 3,110 1,406,623 83,653
Minnesota 1,434 717,801 48,018Mississippi 913 502,678 29,368
Missouri 2,063 807,094 56,974Montana 739 156,516 11,346
Nebraska 1,455 258,717 20,419Nevada 313 197,298 10,667New Hampshire 417 146,043 11,546
New Jersey 2,224 1,090,979 93,698
New Mexico 626 291,277 18,028New York 3,889 2,337,940 175,834
North Carolina 1,917 1,063,781 70,766North Dakota 647 116,386 8,962
Ohio 3,623 1,709,376 109,418
Oklahoma 1,730 571,606 39,635
Oregon 1,164 457,556 27,867Pennsylvania 3,205 1,712,039 115,428
Rhode Island 294 145,593 11,453
South Carolina 1,085 642,025 40,823
South Dakota 732 147,778 11,335
Tennessee 1,485 782,745 45,913
Texas 5,651 3,314,993 216,404Utah 718 436,814 19,306
Vermont 331 90,490 7,576
Virginia 1,737 932,766 64,437Washington 1,772 896,274 47,588
West Virginia 1,007 334,231 23,689
Wisconsin 1,848 790,332 60,554
Wyoming 376 101,660 7,896
SOURCE: U.S. Department of Education, National Center for Education Statistics, Schools and Staffing Survey, 1990-91 (SchoolQuestionnaire).
317

App
endi
x E
E-5
3
Tab
le E
-75.
--U
nwei
ghte
d nu
mbe
r of
pub
lic s
choo
ls o
ffer
ing
a pa
rtic
ular
pro
gram
or
serv
ice,
by
stat
e:19
90-9
1
Stat
eT
otal
scho
ols
Bili
ngua
led
ucat
ion
Eng
lish
as a
seco
nd la
ngua
geR
emed
ial
read
ing
Rem
edia
lm
athe
mat
ics
Prog
ram
s fo
r th
eha
ndic
appe
d
Prog
ram
s fo
r th
egi
fted
and
tale
nted
Voc
atio
nal/
tech
nica
l pro
gram
sD
iagn
ostic
and
pres
crip
tive
Aft
er s
choo
l
prog
ram
s
50 S
tate
s an
d D
.C.
8,92
51,
481
3,40
57,
042
5,58
88,
003
6,50
52,
975
7,18
71,
403
Ala
bam
a21
69
1715
811
620
414
711
416
130
Ala
ska
141
9577
102
8612
412
457
128
20A
rizo
na19
366
143
153
113
165
168
5115
145
Ark
ansa
s15
95
1113
310
414
615
648
102
12C
alif
orni
a29
215
821
720
518
023
720
983
242
75
Col
orad
o17
940
9313
399
148
127
6015
623
Con
nect
icut
150
2992
141
120
136
111
4014
431
Del
awar
e67
1235
6145
6356
1862
15D
istr
ict o
f C
olum
bia
6011
1854
4651
544
4536
Flor
ida
241
7312
216
816
022
617
270
197
78
Geo
rgia
182
1269
165
162
173
158
7414
535
Haw
aii
9132
8260
3184
8718
7873
Idah
o15
633
6713
512
814
610
147
140
9Il
linoi
s24
044
6319
013
720
616
011
420
132
Indi
ana
188
1947
138
9816
512
873
154
30
Iow
a17
45
4413
189
152
157
5113
514
Kan
sas
155
1445
9575
140
142
3711
912
Ken
tuck
y17
64
1914
396
161
126
7112
857
Lou
isia
na19
722
4511
510
518
013
562
152
26M
aine
139
852
109
8913
312
250
118
13
Mar
ylan
d14
216
6611
389
116
112
4911
729
Mas
sach
uset
ts15
942
8413
810
112
957
3013
824
Mic
higa
n20
444
5516
213
218
513
175
162
35M
inne
sota
193
1692
154
137
181
137
5616
034
Mis
siss
ippi
219
1923
165
145
196
148
104
137
25
Mis
sour
i20
36
4012
684
184
9377
157
27M
onta
na15
09
1612
710
513
255
5212
56
Neb
rask
a15
68
2711
394
138
9748
135
10N
evad
a11
219
6383
4610
574
2292
37N
ew H
amps
hire
109
970
8652
105
4928
100
20
318
319

E-5
419
90-9
1 SA
SS D
ata
File
Use
rs' M
anua
l
Tab
le E
-75.
--U
nwei
ghte
d nu
mbe
r of
pub
lic s
choo
ls o
ffer
ing
a pa
rtic
ular
pro
gram
or
serv
ice,
by
stat
e:19
90-9
1 (c
ontin
ued)
Stat
eT
otal
scho
ols
Bili
ngua
led
ucat
ion
Eng
lish
as a
seco
nd la
ngua
geR
emed
ial
read
ing
Rem
edia
lm
athe
mat
ics
Prog
ram
sfo
r th
e
hand
icap
ped
Prog
ram
s fo
r th
egi
fted
and
tale
nted
Voc
atio
nal/
tech
nica
l pro
gram
sD
iagn
ostic
and
pres
crip
tive
Aft
er s
choo
l
prog
ram
s
New
Jer
sey
169
3911
915
515
314
712
953
146
31
New
Mex
ico
136
6786
101
7212
110
933
121
22
New
Yor
k24
358
132
234
222
229
180
9420
838
Nor
th C
arol
ina
176
1831
140
109
167
155
5912
663
Nor
th D
akot
a18
97
2913
610
215
749
6615
96
Ohi
o19
615
4616
776
187
119
7915
420
Okl
ahom
a26
2 -
3433
190
108
225
235
7317
319
Ore
gon
166
2892
144
127
150
114
5614
826
Penn
sylv
ania
223
1988
191
161
190
190
8116
629
Rho
de I
slan
d10
218
7689
4891
6216
968
Sout
h C
arol
ina
175
1842
165
166
165
143
8212
517
Sout
h D
akot
a18
59
2813
713
415
516
546
134
6
Ten
ness
ee18
912
3913
613
017
714
178
147
37
Tex
as40
412
230
232
723
236
035
914
234
350
Uta
h17
339
5815
013
515
010
254
146
19
Ver
mon
t10
34
2792
6995
4515
8712
Vir
gini
a18
010
8014
511
417
316
277
133
23
Was
hing
ton
170
4810
415
314
115
311
758
137
26
Wes
t Vir
gini
a16
15
1711
586
142
141
5411
912
Wis
cons
in15
917
4811
979
148
129
5113
414
Wyo
min
g12
115
3410
060
110
6625
104
12
SOU
RC
E: U
.S. D
epar
tmen
t of
Edu
catio
n, N
atio
nal C
ente
r fo
r E
duca
tion
Stat
istic
s, S
choo
ls a
nd S
taff
ing
Surv
ey, 1
990-
91 (
Scho
ol Q
uest
ionn
aire
).
320
321

App
endi
x E
E-5
5
Tab
le E
-76.
--W
eigh
ted
num
ber
of p
ublic
sch
ools
off
erin
g a
part
icul
ar p
rogr
am o
r se
rvic
e, b
y st
ate:
1990
-91
Stat
eT
otal
scho
ols
Bili
ngua
led
ucat
ion
Eng
lish
as a
seco
nd la
ngua
geR
emed
ial
read
ing
Rem
edia
lm
athe
mat
ics
Prog
ram
s fo
r th
eha
ndic
appe
dPr
ogra
ms
for
the
gift
ed a
nd ta
lent
edV
ocat
iona
l/te
chni
cal p
rogr
ams
Dia
gnos
tic a
ndpr
escr
iptiv
eA
fter
sch
ool
prog
ram
s
50 S
tate
s an
d D
.C.
79,3
8915
,022
32,5
7064
,472
48,1
8068
,466
59,8
1714
,783
64,1
9816
,353
Ala
bam
a1,
243
--
924
671
1,15
678
834
591
425
3A
lask
a41
627
220
829
525
136
734
719
438
0-
Ari
zona
992
375
725
750
505
778
822
132
753
277
Ark
ansa
s1,
071
--
905
709
987
1,05
027
469
0-
Cal
ifor
nia
7,05
03,
810
5,38
45,
130
4,15
65,
504
5,19
81,
150
5,76
92,
323
Col
orad
o1,
304
307
725
914
591
1,05
61,
009
217
1,12
3-
Con
nect
icut
933
524
888
715
821
716
112
882
249
Del
awar
e16
189
152
105
151
138
-15
0-
Dis
tric
t of
Col
umbi
a17
0-
152
131
144
153
-12
598
Flor
ida
2,26
973
01,
157
1,59
31,
360
2,12
61,
654
373
1,84
993
9
Geo
rgia
1,65
0-
660
1,46
21,
448
1,52
51,
418
321
1,32
248
0H
awai
i23
180
204
151
7720
822
1-
201
185
Idah
o54
510
420
147
545
450
336
211
348
5-
Illin
ois
3,94
965
297
63,
286
2,15
33,
319
3,18
586
03,
242
682
Indi
ana
1,85
4-
463
1,43
998
01,
463
1,28
035
91,
546
360
Iow
a1,
506
-39
71,
217
755
1,21
51,
386
250
1,11
1-
Kan
sas
1,41
6-
352
947
656
1,24
11,
264
200
1,07
3-
Ken
tuck
y1,
306
--
1,15
375
61,
149
960
258
933
491
Lou
isia
na1,
435
-30
189
978
21,
297
976
263
1,15
2-
Mai
ne73
8-
236
587
479
707
642
134
629
-M
aryl
and
1,12
8-
496
955
629
888
916
164
898
-M
assa
chus
etts
1,77
542
587
01,
544
1,02
71,
289
585
112
1,55
5-
Mic
higa
n3,
110
685
815
2,52
11,
829
2,69
32,
048
553
2,61
482
6M
inne
sota
1,43
4-
667
1,15
51,
032
1,29
91,
029
321
1,18
630
9M
issi
ssip
pi91
3-
-66
458
781
361
629
956
7-
Mis
sour
i2,
063
-40
41,
483
915
1,84
51,
074
506
1,62
5-
Mon
tana
676
--
574
466
575
258
132
565
-N
ebra
ska
1,37
8-
-1,
065
909
1,06
470
222
91,
184
-N
evad
a30
4-
162
226
127
276
193
-24
796
New
Ham
pshi
re41
7-
258
338
201
396
178
-38
0-
322
323

E -
5619
90-9
1 SA
SS D
ata
File
Use
rs' M
anua
l
Tab
le E
-76.
--W
eigh
ted
num
ber
of p
ublic
sch
ools
off
erin
g a
part
icul
ar p
rogr
am o
r se
rvic
e, b
y st
ate:
1990
-91
(con
tinue
d)
Stat
eT
otal
scho
ols
Bili
ngua
led
ucat
ion
Eng
lish
as a
seco
nd la
ngua
geR
emed
ial
read
ing
Rem
edia
lm
athe
mat
ics
Prog
ram
sfo
r th
eha
ndic
appe
d
Prog
ram
s fo
r th
egi
fted
and
tale
nted
Voc
atio
nal/
tech
nica
l pro
gram
sD
iagn
ostic
and
pres
crip
tive
Aft
er s
choo
l
prog
ram
s
New
Jer
sey
2,22
450
81,
505
2,09
32,
060
1,88
01,
800
305
1,92
254
7N
ew M
exic
o62
130
935
247
632
152
846
995
551
-N
ew Y
ork
3,88
985
72,
396
3,77
73,
524
3,53
32,
966
684
3,50
91,
023
Nor
th C
arol
ina
1,91
7-
366
1,51
794
91,
830
1,72
831
51,
408
799
Nor
th D
akot
a63
2-
-43
231
948
713
519
153
9-
Ohi
o3,
623
-85
73,
148
1,10
93,
377
2,37
062
52,
841
Okl
ahom
a1,
730
192
246
1,24
663
91,
389
1,51
839
01,
157
Ore
gon
1,16
4-
629
1,00
482
31,
022
795
196
1,05
3
Penn
sylv
ania
3,20
5-
1,21
92,
931
2,37
72,
533
2,93
259
22,
330
Rho
de I
slan
d29
4-
216
256
131
256
174
-27
3
Sout
h C
arol
ina
1,08
5-
242
1,03
31,
028
1,03
193
226
076
7-
Sout
h D
akot
a71
1-
-55
054
458
962
410
253
3-
Ten
ness
ee1,
477
-27
61,
076
999
1,39
91,
219
313
1,15
037
8T
exas
5,65
11,
905
4,33
84,
549
3,01
04,
979
5,13
91,
147
4,87
983
9
Uta
h71
015
019
660
252
460
739
615
460
4-
Ver
mon
t33
1-
-30
022
530
113
8-
275
Vir
gini
a1,
737
-69
91,
521
1,15
71,
585
1,64
134
71,
291
Was
hing
ton
1,74
848
71,
056
1,62
81,
423
1,51
91,
165
357
1,41
3W
est V
irgi
nia
991
--
740
574
805
841
172
732
Wis
cons
in1,
848
-57
41,
469
820
1,64
11,
480
329
1,51
6
Wyo
min
g36
5-
7528
217
031
718
5-
305
-Too
few
sam
ple
case
s (f
ewer
than
30)
for
a r
elia
ble
estim
ate.
NO
TE
: Det
ails
may
not
add
to to
tals
bec
ause
of
roun
ding
or
mis
sing
val
ues
in c
ells
with
too
few
cas
es.
SOU
RC
E: U
.S. D
epar
tmen
t of
Edu
catio
n, N
atio
nal C
ente
r fo
r E
duca
tion
Stat
istic
s, S
choo
ls a
nd S
taff
ing
Surv
ey, 1
990-
91 (
Scho
ol Q
uest
ionn
aire
).
324
325

App
endi
x E
E-5
7
Tab
le E
-77.
--U
nwei
ghte
d nu
mbe
r of
pub
lic s
choo
l stu
dent
s pa
rtic
ipat
ing
in a
par
ticul
ar p
rogr
am o
r se
rvic
e, b
y st
ate:
1990
-91
Stat
eT
otal
stud
ents
Bili
ngua
led
ucat
ion
Eng
lish
as a
seco
nd la
ngua
geR
emed
ial
read
ing
Rem
edia
lm
athe
mat
ics
Prog
ram
s fo
r th
eha
ndic
appe
d
Prog
ram
s fo
r th
egi
fted
and
tale
nted
Voc
atio
nal/
tech
nica
l pro
gram
sD
iagn
ostic
and
pres
crip
tive
Aft
er s
choo
l
prog
ram
s
50 S
tate
s an
d D
.C.
5,25
2,50
810
1,20
213
0,33
347
8,59
734
3,67
039
6,43
236
4,98
651
7,43
043
7,44
477
,961
Ala
bam
a14
9,34
695
307
13,9
407,
652
12,5
015,
982
13,2
019,
209
1,03
6A
lask
a50
,154
4,85
72,
229
3,56
42,
314
3,59
12,
407
3,58
65,
735
702
Ari
zona
159,
165
3,42
410
,997
14,4
728,
438
10,4
5214
,448
13,7
928,
932
2,36
6A
rkan
sas
70,5
3065
538,
130
5,27
94,
992
7,65
25,
099
3,96
760
5C
alif
orni
a2.
50,4
5121
,757
30,8
2426
,837
24,2
2614
,945
18,3
2428
,677
30,7
575,
453
Col
orad
o99
,623
1,66
62,
060
5,82
14,
009
5,74
68,
282
6,65
26,
612
883
Con
nect
icut
92,3
401,
927
3,21
07,
759
5,33
16,
686
4,44
37,
401
7,06
12,
057
Del
awar
e43
,707
145
256
4,81
23,
389
4,33
03,
100
3,28
14,
509
694
Dis
tric
t of
Col
umbi
a29
,106
1,44
31,
432
4,68
63,
906
1,99
62,
863
1,00
82,
502
2,43
1Fl
orid
a22
2,00
54,
784
10,3
7418
,682
16,2
3321
,454
10,3
6419
,624
22,2
857,
183
Geo
rgia
151,
595
5769
313
,144
11,2
429,
890
7,79
515
,930
7,70
31,
552
Haw
aii
75,9
911,
624
3,59
26,
141
2,94
84,
305
4,80
15,
723
4,32
09,
731
Idah
o77
,233
389
778
5,61
94,
073
3,56
22,
609
6,92
68,
621
211
Illin
ois
133,
837
3,47
32,
394
14,8
7111
,574
12,7
5610
,458
21,5
8618
,983
2,52
7In
dian
a11
3,40
068
938
17,
959
4,79
57,
763
7,91
09,
923
7,05
770
0
Iow
a65
,266
262
1,04
14,
127
2,73
65,
121
4,18
73,
955
6,60
127
3K
ansa
s64
,740
571
507
3,10
71,
974
3,48
43,
682
2,06
35,
275
415
Ken
tuck
y10
3,70
214
397
810
,431
5,96
07,
358
7,00
19,
697
5,76
53,
087
Lou
isia
na11
7,77
71,
207
761
9,03
57,
984
7,37
92,
966
8,05
810
,758
1,57
1M
aine
56,1
3418
039
93,
595
2,42
44,
930
2,87
83,
530
3,62
240
3
Mar
ylan
d10
7,74
713
41,
125
9,40
47,
718
8,10
310
,046
8,18
89,
141
1,28
4M
assa
chus
etts
.10
6,75
74,
868
3,47
210
,366
5,69
18,
894
5,93
49,
569
11,5
651,
323
Mic
higa
n11
5,92
31,
125
639
9,46
35,
960
8,20
78,
901
10,3
828,
401
1,29
6M
inne
sota
109,
400
603
2,15
68,
140
6,80
17,
370
8,36
25,
367
8,08
91,
292
Mis
siss
ippi
136,
254
485
6718
,465
14,7
7710
,358
6,76
913
,378
7,28
41,
049
Mis
sour
i91
,255
220
812
7,04
63,
558
8,38
92,
877
6,33
28,
212
1,74
5M
onta
na51
,178
499
343
3,47
32,
235
2,55
61,
911
5,52
75,
014
169
Neb
rask
a53
,911
3415
63,
123
2,25
04,
223
6,60
95,
072
3,47
636
5N
evad
a84
,535
469
2,76
46,
241
3,76
15,
332
4,95
77,
832
6,58
01,
709
New
Ham
pshi
re47
,758
024
13,
036
1,54
14,
162
5,06
83,
481
6,51
847
6
327
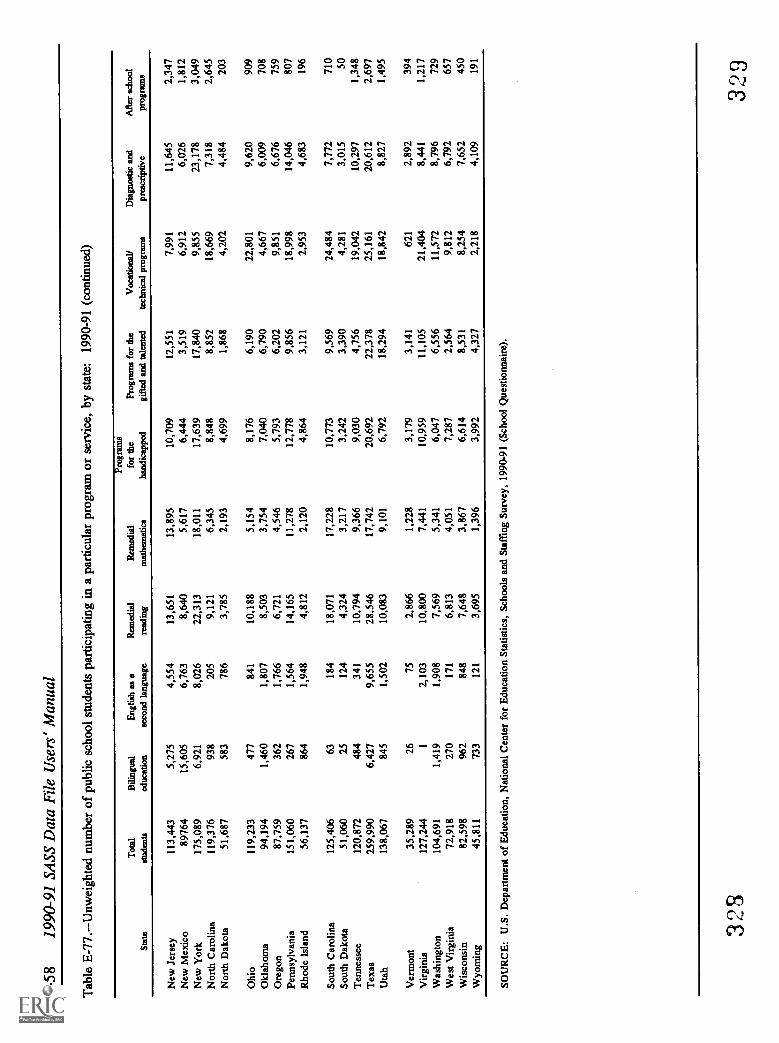
E -
5819
90-9
1 SA
SS D
ata
File
Use
rs' M
anua
l
Tab
le E
-77.
--U
nwei
ghte
d nu
mbe
r of
pub
lic s
choo
l stu
dent
s pa
rtic
ipat
ing
in a
par
ticul
ar p
rogr
am o
r se
rvic
e, b
y st
ate:
1990
-91
(con
tinue
d)
Stat
eT
otal
stud
ents
Bili
ngua
led
ucat
ion
Eng
lish
as a
seco
nd la
ngua
ge
Rem
edia
l
read
ing
Rem
edia
lm
athe
mat
ics
Prog
ram
sfo
r th
e
hand
icap
ped
Prog
ram
s fo
r th
egi
fted
and
tale
nted
Voc
atio
nal/
tech
nica
l pro
gram
sD
iagn
ostic
and
pres
crip
tive
Aft
er s
choo
l
prog
ram
s
New
Jer
sey
113,
443
5,27
54,
554
13,6
5113
,895
10,7
0912
,551
7,99
111
,645
2,34
7N
ew M
exic
o89
764
15,6
056,
763
8,64
05,
617
6,44
43,
519
6,91
26,
026
1,81
2
New
Yor
k17
5,08
96,
921
8,02
622
,313
18,0
1117
,639
17,8
409,
855
23,1
783,
049
Nor
th C
arol
ina
119,
376
938
205
9,12
16,
345
8,84
88,
852
18,6
697,
318
2,64
5N
orth
Dak
ota
51,6
8758
378
63,
785
2,19
34,
699
1,86
84,
202
4,48
420
3
Ohi
o11
9,23
347
784
110
,188
5,15
48,
176
6,19
022
,801
9,62
090
9
Okl
ahom
a94
,194
1,46
01,
807
8,50
33,
754
7,04
06,
790
4,66
76,
009
708
Ore
gon
87,7
5936
21,
766
6,72
14,
546
5,79
36,
202
9,85
16,
676
759
Penn
sylv
ania
151,
060
267
1,56
414
,165
11,2
7812
,778
9,85
618
,998
14,0
4680
7
Rho
de I
slan
d56
,137
864
1,94
84,
812
2,12
04,
864
3,12
12,
953
4,68
319
6
Sout
h C
arol
ina
125,
406
6318
418
,071
17,2
2810
,773
9,56
924
,484
7,77
271
0
Sout
h D
akot
a51
,060
2512
44,
324
3,21
73,
242
3,39
04,
281
3,01
550
Ten
ness
ee12
0,87
248
434
110
,794
9,36
69,
030
4,75
619
,042
10,2
971,
348
Tex
as25
9,99
06,
427
9,65
528
,546
17,7
4220
,692
22,3
7825
,161
20,6
122,
697
Uta
h13
8,06
784
51,
502
10,0
839,
101
6,79
218
,294
18,8
428,
827
1,49
5
Ver
mon
t35
,289
2675
2,86
61,
228
3,17
93,
141
621
2,89
239
4
Vir
gini
a12
7,24
41
2,10
310
,800
7,44
110
,959
11,1
0521
,404
8,44
11,
217
Was
hing
ton
104,
691
1,41
91,
908
7,56
95,
341
6,04
76,
556
11,5
728,
796
729
Wes
t Vir
gini
a72
,918
270
171
6,81
34,
051
7,28
72,
564
9,81
26,
792
657
Wis
cons
in82
,598
962
848
7,64
83,
867
6,61
48,
531
8,25
47,
652
450
Wyo
min
g45
,811
733
121
3,69
51,
396
3,99
24,
327
2,21
84,
109
191
SOU
RC
E: U
.S. D
epar
tmen
t of
Edu
catio
n, N
atio
nal C
ente
r fo
r E
duca
tion
Stat
istic
s, S
choo
ls a
nd S
taff
ing
Surv
ey, 1
990-
91 (
Scho
ol Q
uest
ionn
aire
).
328
329

App
endi
x E
E-5
9
Tab
le E
-78.
--W
eigh
ted
num
ber
of p
ublic
sch
ool s
tude
nts
part
icip
atin
g in
a p
artic
ular
pro
gram
or
serv
ice,
by
stat
e:19
90-9
1
Stat
eT
otal
stud
ents
Bili
ngua
led
ucat
ion
Eng
lish
as a
seco
nd la
ngua
geR
emed
ial
read
ing
Rem
edia
lm
athe
mat
ics
Prog
ram
s fo
r th
e
hand
icap
ped
Prog
ram
s fo
r th
egi
fted
and
tale
nted
Voc
atio
nal/
tech
nica
l pro
gram
sD
iagn
ostic
and
pres
crip
tive
Aft
er s
choo
l
prog
ram
s
50 S
tate
s an
d D
.C.
40,0
92,2
851,
123,
920
1,35
1,57
44,
337,
617
2,86
3,31
62,
833,
521
2,74
9,85
32,
317,
402
3,53
3,61
188
2,83
5
Ala
bam
a68
8,94
0-
-89
,261
51,2
7257
,294
26,6
8339
,508
51,6
989,
041
Ala
ska
109,
098
12,3
325,
734
8,83
65,
332
8,02
85,
253
7,93
212
,772
-A
rizo
na59
0,35
214
,929
46,9
2059
,719
31,1
8637
,125
45,9
1929
,284
35,1
6413
,836
Ark
ansa
s41
5,93
6-
-53
,929
34,3
5829
,215
47,2
6123
,157
24,7
17-
Cal
ifor
nia
4,79
5,80
048
9,07
960
5,30
060
6,76
550
5,39
622
5,43
431
0,09
633
1,90
456
7,48
817
8,10
9
Col
orad
o57
5,79
012
,400
9,11
239
,887
19,8
7432
,479
55,4
3618
,880
42,4
57-
Con
nect
icut
453,
562
-12
,451
42,0
7325
,922
30,2
7322
,067
20,8
7734
,203
16,8
06D
elaw
are
96,3
75-
587
11,5
817,
551
9,34
26,
733
-10
,030
-D
istr
ict o
f C
olum
bia
78,3
23-
-12
,775
10,5
495,
186
7,88
9-
6,22
26,
559
Flor
ida
1,76
6,89
046
,549
90,4
0616
1,26
612
4,28
417
3,85
778
,459
95,5
2221
5,90
474
,273
Geo
rgia
1,10
2,59
1-
6,24
311
1,90
793
,315
75,0
9653
,266
66,3
5869
,563
18,6
44H
awai
i17
6,12
33,
597
8,37
114
,283
6,19
010
,190
11,8
19-
10,0
1622
,788
Idah
o21
5,65
01,
149
2,46
617
,136
12,2
7510
,640
7,28
612
,598
21,8
80-
Illin
ois
1,80
4,14
557
,537
33,2
7619
9,75
813
1,23
013
1,68
814
9,73
613
2,88
116
5,78
451
,859
Indi
ana
894,
518
-3,
572
78,1
8240
,534
56,3
4658
,562
37,7
4658
,037
8,35
0
Iow
a47
8,94
1-
10,0
4539
,548
21,2
3333
,181
32,0
1316
,924
38,7
49-
Kan
sas
453,
170
-3,
522
27,4
8913
,847
23,6
2119
,844
8,89
938
,612
-K
entu
cky
617,
621
--
77,9
0341
,827
43,5
1144
,380
32,1
7239
,922
24,3
57L
ouis
iana
736,
937
-4,
485
71,3
9354
,108
44,0
7518
,741
31,5
7182
,437
-M
aine
218,
593
-1,
331
17,7
7211
,592
20,8
8311
,053
10,0
5616
,869
-
Mar
ylan
d67
5,49
1-
6,16
576
,244
56,8
1451
,510
60,3
6524
,692
61,8
88-
Mas
sach
uset
ts80
9,33
635
,936
22,0
2094
,815
41,3
8167
,947
34,9
6231
,439
102,
074
-M
ichi
gan
1,41
8,90
713
,386
12,7
1814
7,38
184
,122
87,8
5412
0,96
270
,313
87,3
0330
,309
Min
neso
ta71
9,58
1-
15,6
7755
,649
44,9
1947
,217
56,3
4326
,245
55,0
4912
,278
Mis
siss
ippi
506,
405
--
76,4
8162
,164
36,0
7323
,798
40,2
8327
,139
-M
isso
uri
818,
191
-10
,108
78,6
6236
,246
72,3
3923
,231
30,5
9875
,854
-M
onta
na15
7,53
0-
-10
,956
6,58
18,
236
5,27
29,
001
12,1
27-
Neb
rask
a25
9,97
4-
-17
,350
11,1
6020
,636
24,6
5214
,037
17,3
15-
Nev
ada
197,
376
-6,
388
14,8
948,
210
12,3
3710
,946
-15
,402
4,04
2N
ew H
amps
hire
147,
023
-63
910
,792
4,88
412
,863
17,6
05-
19,4
44-
330
331

E-6
019
90-9
1 SA
SS D
ata
File
Use
rs' M
anua
l
Tab
le E
-78.
--W
eigh
ted
num
ber
of p
ublic
sch
ool s
tude
nts
part
icip
atin
g in
a p
artic
ular
pro
gram
or
serv
ice,
by
stat
e:19
90-9
1 (c
ontin
ued)
Stat
eT
otal
stud
ents
Bili
ngua
led
ucat
ion
Eng
lish
as a
seco
nd la
ngua
ge
Rem
edia
l
read
ing
Rem
edia
lm
athe
mat
ics
Prog
ram
sfo
r th
e
hand
icap
ped
Prog
ram
s fo
r th
egi
fted
and
tale
nted
Voc
atio
nal/
tech
nica
l pro
gram
sD
iagn
ostic
and
pres
crip
tive
Aft
er s
choo
l
prog
ram
s
New
Jer
sey
1,11
2,61
636
,699
43,1
1213
8,49
313
0,06
088
,230
107,
999
42,1
1112
0,71
224
,771
New
Mex
ico
292,
482
54,3
8623
,197
37,4
6721
,150
19,7
8211
,482
12,4
3823
,724
New
Yor
k2,
384,
600
108,
149
119,
631
314,
904
222,
724
193,
131
206,
757
75,5
1324
3,29
482
,619
Nor
th C
arol
ina
1,06
9,59
0-
2,25
510
5,69
157
,750
87,8
7083
,940
94,4
1871
,409
33,7
76
Nor
th D
akot
a11
8,75
5-
-9,
831
5,68
114
,403
3,55
17,
430
14,2
76-
Ohi
o1,
716,
955
-14
,965
153,
481
47,1
4211
5,88
177
,654
104,
439
130,
292
Okl
ahom
a57
4,51
76,
776
10,1
1055
,861
23,4
0640
,480
41,9
6518
,803
37,7
65
Ore
gon
459,
095
-9,
178
43,1
3724
,797
32,7
0228
,279
27,7
0135
,254
Penn
sylv
ania
1,72
1,89
6-
14,1
8317
4,64
210
5,50
910
7,09
610
1,06
296
,844
126,
850
Rho
de I
slan
d14
7,99
3-
5,55
312
,870
5,65
812
,546
7,54
9-
12,2
90
Sout
h C
arol
ina
649,
513
-1,
030
96,4
0688
,708
62,2
4851
,912
71,2
5638
,825
-So
uth
Dak
ota
148,
722
--
14,9
3612
,387
9,94
810
,106
6,63
59,
436
-T
enne
ssee
789,
303
-1,
546
86,4
7372
,569
62,8
0630
,716
73,0
7485
,990
12,5
93
Tex
as3,
323,
322
115,
725
127,
819
403,
258
239,
115
252,
758
300,
243
197,
953
265,
831
47,2
46
Uta
h43
8,73
22,
233
4,00
838
,016
32,6
4722
,276
53,8
1036
,590
31,0
04-
Ver
mon
t90
,632
--
7,76
73,
283
8,19
08,
302
-7,
824
Vir
gini
a94
2,69
9-
10,9
0010
6,14
064
,447
81,0
6771
,087
88,5
9968
,044
Was
hing
ton
897,
858
13,1
5515
,707
83,1
3450
,842
48,5
9049
,880
66,6
5173
,306
Wes
t Vir
gini
a33
6,57
3-
-38
,254
23,3
7030
,393
10,3
5829
,876
31,3
18
Wis
cons
in79
5,56
1-
8,48
482
,919
30,3
5460
,348
92,5
1347
,543
80,7
18
Wyo
min
g10
1,70
4-
264
9,25
23,
363
8,30
010
,055
-9,
330
-Too
few
sam
ple
case
s (f
ewer
than
30)
for
a r
elia
ble
estim
ate.
NO
TE
: Det
ails
may
not
add
to to
tals
bec
ause
of
roun
ding
or
mis
sing
val
ues
in c
ells
with
too
few
cas
es.
SOU
RC
E: U
.S. D
epar
tmen
t of
Edu
catio
n, N
atio
nal C
ente
r fo
r E
duca
tion
Stat
istic
s, S
choo
ls a
nd S
taff
ing
Surv
ey, 1
990-
91 (
Scho
ol Q
uest
ionn
aire
).
332
333
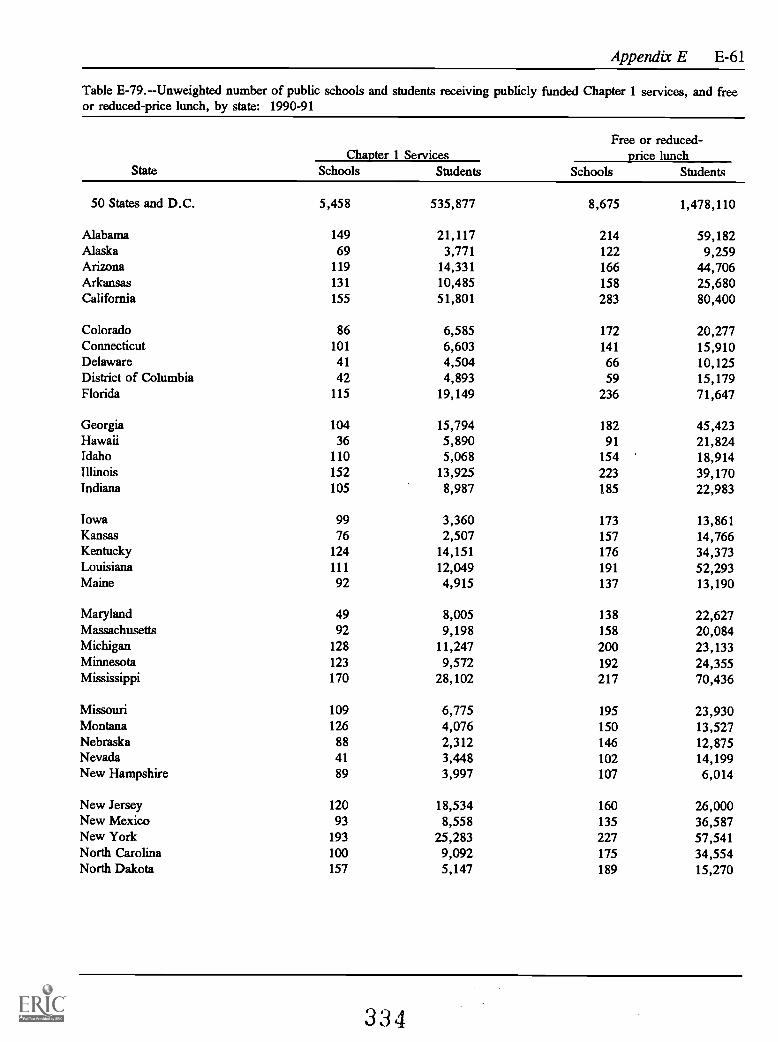
Appendix E E-61
Table E-79.--Unweighted number of public schools and students receiving publicly funded Chapter 1 services, and freeor reduced-price lunch, by state: 1990-91
StateChapter 1 Services
Free or reduced-price lunch
Schools Students Schools Students
50 States and D.C. 5,458 535,877 8,675 1,478,110
Alabama 149 21,117 214 59,182Alaska 69 3,771 122 9,259Arizona 119 14,331 166 44,706Arkansas 131 10,485 158 25,680California 155 51,801 283 80,400
Colorado 86 6,585 172 20,277Connecticut 101 6,603 141 15,910Delaware 41 4,504 66 10,125District of Columbia 42 4,893 59 15,179Florida 115 19,149 236 71,647
Georgia 104 15,794 182 45,423Hawaii 36 5,890 91 21,824Idaho 110 5,068 154 18,914Illinois 152 13,925 223 39,170Indiana 105 8,987 185 22,983
Iowa 99 3,360 173 13,861Kansas 76 2,507 157 14,766Kentucky 124 14,151 176 34,373Louisiana 111 12,049 191 52,293Maine 92 4,915 137 13,190
Maryland 49 8,005 138 22,627Massachusetts 92 9,198 158 20,084Michigan 128 11,247 200 23,133Minnesota 123 9,572 192 24,355Mississippi 170 28,102 217 70,436
Missouri 109 6,775 195 23,930Montana 126 4,076 150 13,527Nebraska 88 2,312 146 12,875Nevada 41 3,448 102 14,199New Hampshire 89 3,997 107 6,014
New Jersey 120 18,534 160 26,000New Mexico 93 8,558 135 36,587New York 193 25,283 227 57,541North Carolina 100 9,092 175 34,554North Dakota 157 5,147 189 15,270
334

E-62 1990-91 SASS Data File Users' Manual
Table E-79.--Unweighted number of public schools and students receiving publicly funded Chapter 1 services, and freeor reduced-price lunch, by state: 1990-91 (continued)
State
Chapter 1 servicesFree or reduced-
Price lunch
Schools Students Schools Students
Ohio 108 6,986 189 23,979Oklahoma 195 10,408 255 40,144Oregon 103 6,519 160 17,610Pennsylvania 142 14,926 216 29,525Rhode Island 61 4,933 102 12,643
South Carolina 78 13,717 167 40,602South Dakota 131 6,680 184 16,128Tennessee 96 13,737 187 33,232Texas 241 28,821 397 97,421Utah 83 10,376 170 28,512
Vermont 95 3,634 99 6,464Virginia 76 6,279 171 24,541Washington 107 7,277 164 23,315West Virginia 88 8,373 161 28,194Wisconsin 98 6,538 155 15,720Wyoming 61 3,442 121 9,786
SOURCE: U.S. Department of Education, National Center for Education Statistics, Schools and Staffing Survey,1990-91 (School Questionnaire).
335
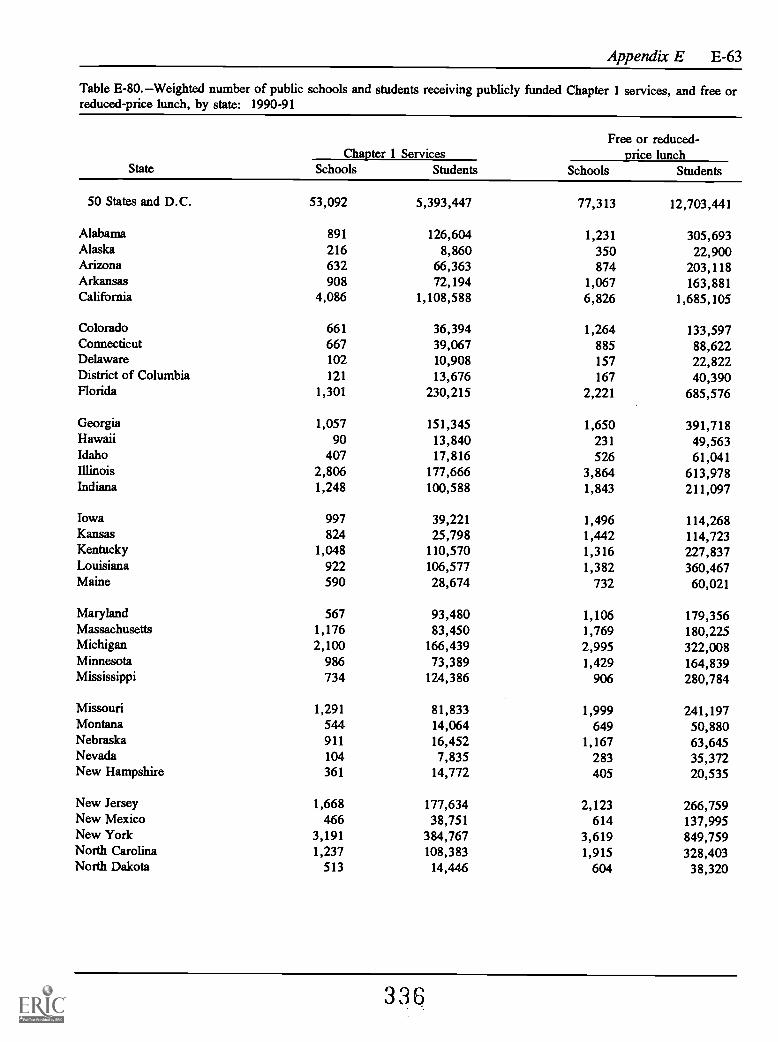
Appendix E E-63
Table E-80.--Weighted number of public schools and students receiving publicly funded Chapter 1 services, and free orreduced-price lunch, by state: 1990-91
StateChapter 1 Services
Free or reduced-price lunch
Schools Students Schools Students
50 States and D.C. 53,092 5,393,447 77,313 12,703,441
Alabama 891 126,604 1,231 305,693Alaska 216 8,860 350 22,900Arizona 632 66,363 874 203,118Arkansas 908 72,194 1,067 163,881California 4,086 1,108,588 6,826 1,685,105
Colorado 661 36,394 1,264 133,597Connecticut 667 39,067 885 88,622Delaware 102 10,908 157 22,822District of Columbia 121 13,676 167 40,390Florida 1,301 230,215 2,221 685,576
Georgia 1,057 151,345 1,650 391,718Hawaii 90 13,840 231 49,563Idaho 407 17,816 526 61,041Illinois 2,806 177,666 3,864 613,978Indiana 1,248 100,588 1,843 211,097
Iowa 997 39,221 1,496 114,268Kansas 824 25,798 1,442 114,723Kentucky 1,048 110,570 1,316 227,837Louisiana 922 106,577 1,382 360,467Maine 590 28,674 732 60,021
Maryland 567 93,480 1,106 179,356Massachusetts 1,176 83,450 1,769 180,225Michigan 2,100 166,439 2,995 322,008Minnesota 986 73,389 1,429 164,839Mississippi 734 124,386 906 280,784
Missouri 1,291 81,833 1,999 241,197Montana 544 14,064 649 50,880Nebraska 911 16,452 1,167 63,645Nevada 104 7,835 283 35,372New Hampshire 361 14,772 405 20,535
New Jersey 1,668 177,634 2,123 266,759New Mexico 466 38,751 614 137,995New York 3,191 384,767 3,619 849,759North Carolina 1,237 108,383 1,915 328,403North Dakota 513 14,446 604 38,320
336

E-64 1990-91 SASS Data File Users' Manual
Table E-80.--Weighted number of public schools and students receiving publicly funded Chapter 1 services, and free orreduced-price lunch, by state: 1990-91 (continued)
State
Chapter 1 servicesFree or reduced-
Price lunch
Schools Students Schools Students
Ohio 2,456 144,847 3,557 405,090Oklahoma 1,317 66,888 1,674 242,055Oregon 787 42,259 1,107 108,591Pennsylvania 2,412 212,938 3,145 396,656Rhode Island 175 13,009 294 34,177
South Carolina 559 92,174 1,056 244,577South Dakota 555 24,035 708 54,253Tennessee 960 138,605 1,471 259,618Texas 3,589 446,129 5,608 1,328,759Utah 386 37,774 697 103,148
Vermont 308 9,759 313 17,234Virginia 956 76,302 1,707 232,654Washington 1,116 76,052 1,702 221,950West Virginia 616 49,723 999 140,398Wisconsin 1,300 70,013 1,808 172,631Wyoming 177 7,895 357 25,155
NOTE: Details may not add to totals.
SOURCE: U.S. Department of Education, National Center for Education Statistics, Schools and Staffing Survey,1990-91 (School Questionnaire).
337

Appendix E E-65
Table E-81.--Unweighted number of public high schools with 12th grade students, graduation rate and collegeapplication rate of 1989-90 seniors, by state: 1990-91
State
Number ofschools with12th gradestudents
Averagegraduation rate
of 1989-90seniors
Average collegeapplication rate of
1989-90 seniors
50 States and D.C. 3,620 94 53
Alabama 126 94 47Alaska 73 93 36Arizona 63 90 48Arkansas 58 96 49California 116 86 51
Colorado 74 93 57Connecticut 58 96 59Delaware 20 86 50District of Columbia 10 93 62Florida 90 84 39
Georgia 79 96 49Hawaii 19 95 50Idaho 56 93 54Illinois 116 92 49Indiana 80 93 49
Iowa 72 97 63Kansas 60 98 65Kentucky 79 94 51Louisiana 93 93 43Maine 56 97 59
Maryland 63 96 54Massachusetts 68 96 64Michigan 94 90 53Minnesota 82 96 62Mississippi 114 93 60
Missouri 98 97 49Montana 66 94 53Nebraska 63 96 69Nevada 29 93 44New Hampshire 30 97 59
New Jersey 62 95 58New Mexico 44 95 47New York 119 92 65North Carolina 65 94 62North Dakota 85 97 68
338

E-66 1990-91 SASS Data File Users' Manual
Table E-81.--Unweighted number of public high schools with 12th grade students, graduation rate and collegeapplication rate of 1989-90 seniors, by state: 1990-91 (continued)
State
Number ofschools with12th gradestudents
Averagegraduation rate
of 1989-90seniors
Average collegeapplication rate of
1989-90 seniors
Ohio 95 92 43
Oklahoma 79 96 50
Oregon 67 93 55
Pennsylvania 96 96 50
Rhode Island 21 97 60
South Carolina 85 92 45
South Dakota 63 97 67
Tennessee 86 95 46
Texas 164 93 56
Utah 58 89 51
Vermont 22 97 60
Virginia 77 96 55
Washington 65 89 50
West Virginia 60 96 44
Wisconsin 64 95 57
Wyoming 38 97 61
SOURCE: U.S. Department of Education, National Center for Education Statistics, Schools and Staffing Survey,
1990-91 (School Questionnaire).
339
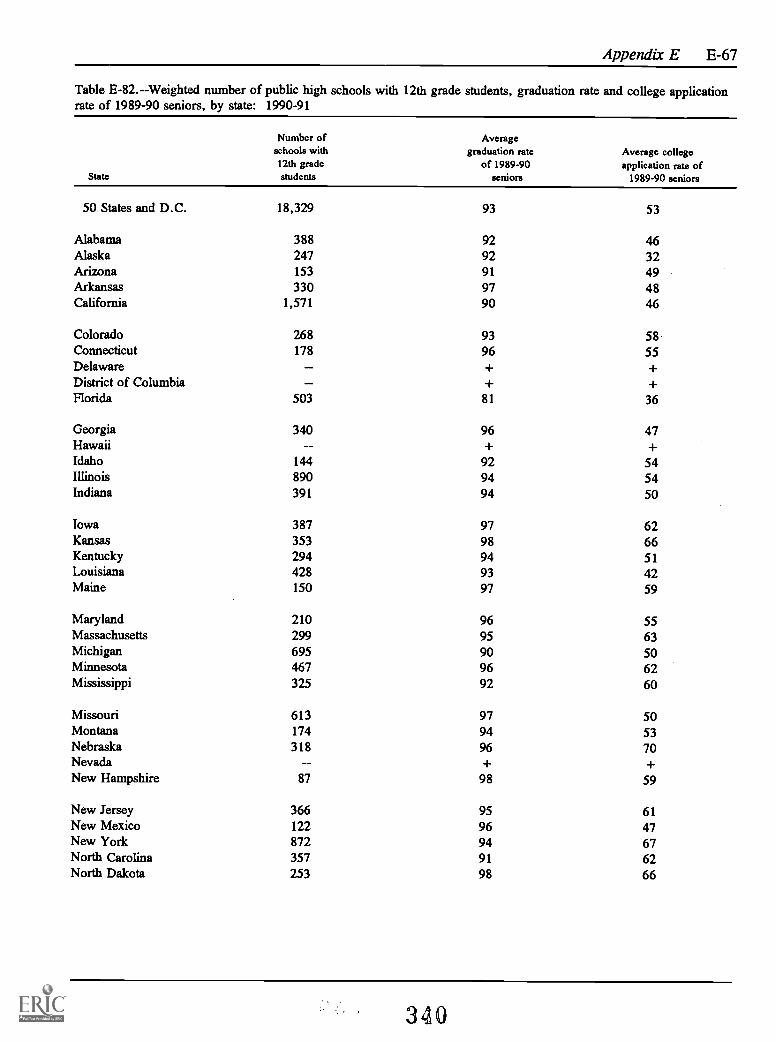
Appendix E E-67
Table E-82.--Weighted number of public high schools with 12th grade students, graduation rate and college applicationrate of 1989-90 seniors, by state: 1990-91
State
Number ofschools with12th gradestudents
Averagegraduation rate
of 1989-90seniors
Average collegeapplication rate of
1989-90 seniors
50 States and D.C. 18,329 93 53
Alabama 388 92 46Alaska 247 92 32Arizona 153 91 49Arkansas 330 97 48California 1,571 90 46
Colorado 268 93 58Connecticut 178 96 55Delaware + +District of Columbia + +Florida 503 81 36
Georgia 340 96 47Hawaii + +Idaho 144 92 54Illinois 890 94 54Indiana 391 94 50
Iowa 387 97 62Kansas 353 98 66Kentucky 294 94 51Louisiana 428 93 42Maine 150 97 59
Maryland 210 96 55Massachusetts 299 95 63Michigan 695 90 50Minnesota 467 96 62Mississippi 325 92 60
Missouri 613 97 50Montana 174 94 53Nebraska 318 96 70Nevada + +New Hampshire 87 98 59
New Jersey 366 95 61New Mexico 122 96 47New York 872 94 67North Carolina 357 91 62North Dakota 253 98 66
340
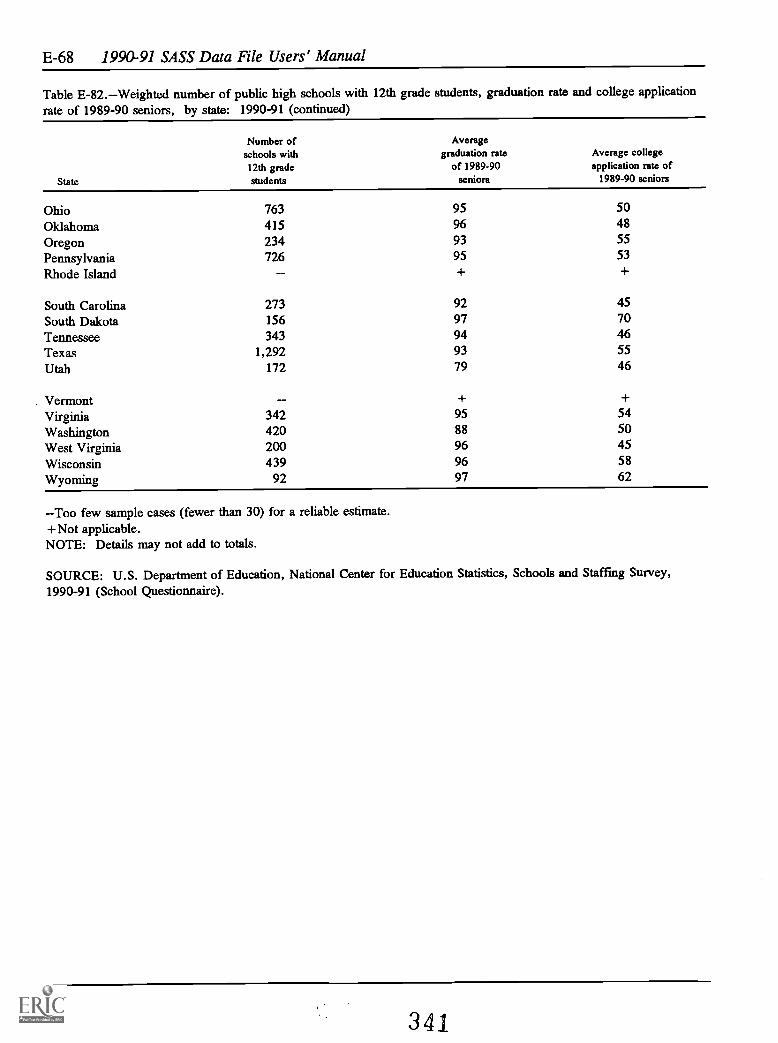
E-68 1990-91 SASS Data File Users' Manual
Table E-82.--Weighted number of public high schools with 12th grade students, graduation rate and college applicationrate of 1989-90 seniors, by state: 1990-91 (continued)
State
Number ofschools with12th gradestudents
Averagegraduation rate
of 1989-90seniors
Average collegeapplication rate of
1989-90 seniors
Ohio 763 95 50
Oklahoma 415 96 48
Oregon 234 93 55
Pennsylvania 726 95 53
Rhode Island + +
South Carolina 273 92 45
South Dakota 156 97 70
Tennessee 343 94 46
Texas 1,292 93 55
Utah 172 79 46
Vermont + +Virginia 342 95 54
Washington 420 88 50
West Virginia 200 96 45
Wisconsin 439 96 58
Wyoming 92 97 62
--Too few sample cases (fewer than 30) for a reliable estimate.+Not applicable.NOTE: Details may not add to totals.
SOURCE: U.S. Department of Education, National Center for Education Statistics, Schools and Staffing Survey,1990-91 (School Questionnaire).
341

Appendix E E-69
Private School Survey
Selected Unweighted and Weighted Tables
342

E-70 1990-91 SASS Data File Users' Manual
Table E-83.--Unweighted number of private K-12 teachers by level: 1990-91
Total Elementary Secondary Combined
Total number of K-12 teachers 55,049 18,879 14,840 21,330
Number of full-time K-12teachers 44,108 14,288 12,225 17,595
Number of part-time K-12teachers 10,941 4,591 2,615 3,735
Number of K-12 teachers newto school this year
7,595 2,856 1,889 2,850
Number of K-12 left thisschool 6,224 2,355 1,555 2,314
Teaching vacancies thisschool, this year
3,400 1,955 550 895
Teaching vacancies unfilledthis year 3,433 1,763 706 964
SOURCE: U.S. Department of Education, National Center for Education Statistics, Schools and Staffing Survey,1990-91 (School Questionnaire).
Table E-84.--Weighted number of private K-12 teachers by level: 1990-91
Total Elementary Secondary Combined
Total number of K-12 teachers 356,286 167,805 73,156 115,325
Number of full-time K-12teachers 291,169 135,504 61,086 94,579
Number of part-time K-12teachers 65,117 32,301 12,070 20,746
Number of K-12 teachers newto school this year
53,720 27,335 9,035 17,351
Number of K-12 left thisschool 44,938 23,194 7,640 14,103
Teaching vacancies thisschool, this year
33,314 21,085 2,848 9,382
Teaching vacancies unfilledthis year 29,940 18,556 3,816 7,568
SOURCE: U.S. Department of Education, National Center for Education Statistics, Schools and Staffing Survey,1990-91 (School Questionnaire).
343

Appendix E E-71
Table E-85.--Unweighted number of private schools, students, and K-12teachers by private school type: 1990-91
Private school type Schools StudentsTotal numberK-12 teachers
Total 2,620 637,003 55,049
CatholicParochial 352 98,305 5,542Diocesan 198 91,393 5,264Private order 112 53,897 3,925
Other religiousConservative Christian 292 54,041 4,004Affiliated 815 169,127 15,198Unaffiliated 238 44,999 4,501
Non-sectarianRegular 280 92,642 10,420Special emphasis 205 27,561 3,835Special education 128 5,038 2,360
SOURCE: U.S. Department of Education, National Center for EducationStatistics, Schools and Staffing Survey, 1990-91 (School Questionnaire).
Table E-86.--Weighted number of private schools, students, and K-12teachers by private school type: 1990-91
Private school type Schools StudentsTotal numberK-12 teachers
Total 24,690 4,667,596 356,286
CatholicParochial 5,437 1,366,011 75,571Diocesan 2,400 833,702 47,371Private order 894 358,039 26,826
Other religiousConservative Christian 4,045 548,278 43,864Affiliated 4,262 650,670 53,970Unaffiliated 3,169 290,860 27,860
Non-sectarianRegular 1,950 442,182 46,990Special emphasis 1,700 149,659 22,796Special education 832 28,196 11,036
SOURCE: U.S. Department of Education, National Center for EducationStatistics, Schools and Staffing Survey, 1990-91 (School Questionnaire).
344

Appendix E E-73
Public School Teacher Survey
Selected Unweighted and Weighted Tables
345
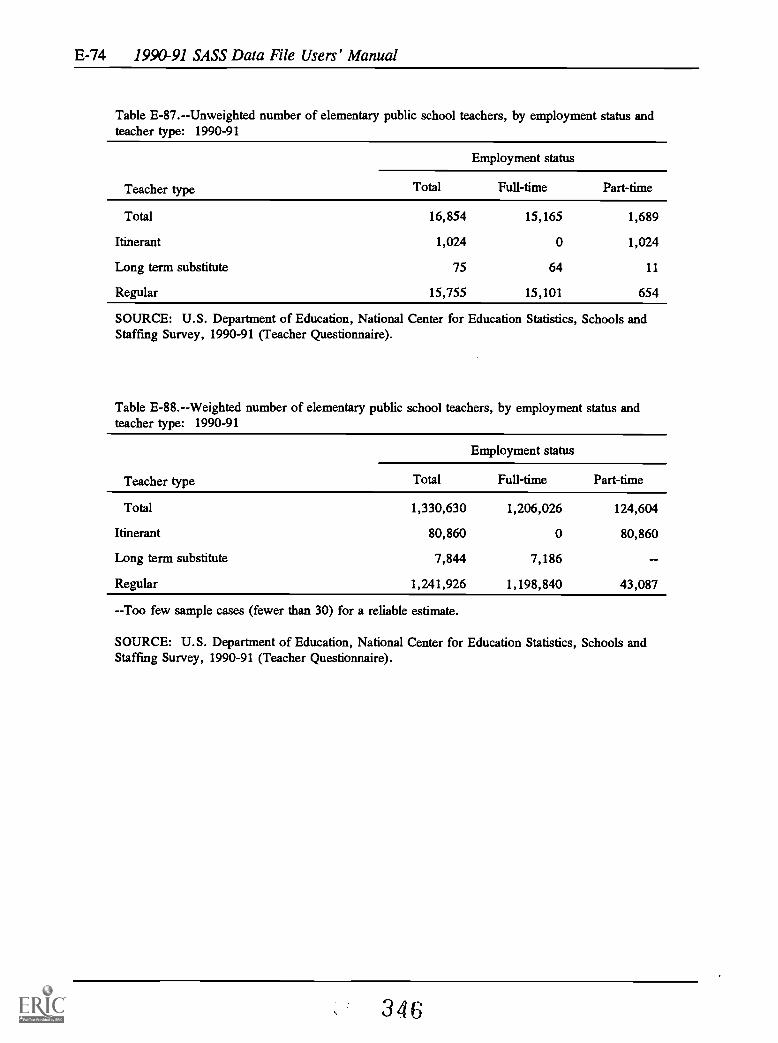
E-74 1990-91 SASS Data File Users' Manual
Table E-87.--Unweighted number of elementary public school teachers, by employment status andteacher type: 1990-91
Teacher type
Employment status
Total Full-time Part-time
Total 16,854 15,165 1,689
Itinerant 1,024 0 1,024
Long term substitute 75 64 11
Regular 15,755 15,101 654
SOURCE: U.S. Department of Education, National Center for Education Statistics, Schools andStaffing Survey, 1990-91 (Teacher Questionnaire).
Table E-88.--Weighted number of elementary public school teachers, by employment status andteacher type: 1990-91
Teacher type
Employment status
Total Full-time Part-time
Total 1,330,630 1,206,026 124,604
Itinerant 80,860 0 80,860
Long term substitute 7,844 7,186
Regular 1,241,926 1,198,840 43,087
--Too few sample cases (fewer than 30) for a reliable estimate.
SOURCE: U.S. Department of Education, National Center for Education Statistics, Schools andStaffing Survey, 1990-91 (Teacher Questionnaire).
346

Appendix E E-75
Table E-89.--Unweighted number of secondary public school teachers, by employment status andby teacher type: 1990-91
Employment status
Teacher type Total Full-time Part-time
Total 29,851 27,573 2,278
Itinerant 970 0 970
Long term substitute 78 70 8
Regular 28,803 27,503 1,300
SOURCE: U.S. Department of Education, National Center for Education Statistics, Schools andStaffmg Survey, 1990-91 (Teacher Questionnaire).
Table E-90.--Weighted number of secondary public school teachers, by employment status and byteacher type: 1990-91
Teacher type
Employment status
Total Full-time Part-time
Total 1,228,858 1,142,288
Itinerant 39,663 0
Long term substitute 4,682 4,375
Regular 1,184,513 1,137,913
86,569
39,663
46,600
--Too few sample cases (fewer than 30) for a reliable estimate.
SOURCE: U.S. Department of Education, National Center for Education Statistics, Schools andStaffing Survey, 1990-91 (Teacher Questionnaire).
347

E-76 1990-91 SASS Data File Users' Manual
Table E-91.--Unweighted number of all public school teachers, by employment status and byteacher type: 1990-91
Employment status
Teacher type Total Full-time Part-time
Total 46,705 42,738 3,967
Itinerant 1,994 0 1,994
Long term substitute 153 134 19
Regular 44,558 42,604 1,954
SOURCE: U.S. Department of Education, National Center for Education Statistics, Schools andStaffing Survey, 1990-91 (Teacher Questionnaire).
Table E-92.--Weighted number of all public school teachers, by employment status and by teachertype: 1990-91
Employment status
Teacher type Total Full-time Part-time
Total 2,559,488 2,348,315 211,173
Itinerant 120,523 0 120,523
Long term substitute 12,526 11,562
Regular 2,426,439 2,336,753 89,686
--Too few sample cases (fewer than 30) for a reliable estimate.
SOURCE: U.S. Department of Education, National Center for Education Statistics, Schools andStaffing Survey, 1990-91 (Teacher Questionnaire).
343

Appendix E E-77
Table E-93.--Unweighted number of elementary public school teachers, by race/ethnicity and by sex:1990-91
Sex
Race/ethnicity
Asian/ Black, White,American Pacific Non- Non-
Total Indian Islander hispanic Hispanic hispanic
Total 16,854 528 618 1,139 806 13,763
Male 2,015 48 50 146 101 1,670
Female 14,839 480 568 993 705 12,093
SOURCE: U.S. Department of Education, National Center for Education Statistics, Schools and StaffingSurvey, 1990-91 (Teacher Questionnaire).
Table E-94.--Weighted number of elementary public school teachers, by race/ethnicity and by sex:1990-91
Sex
Race/ethnicity
Asian/ Black, White,American Pacific Non- Non-
Total Indian Islander hispanic Hispanic hispanic
Total 1,330,630 11,127 17,035 119,454 49,799 1,133,215
Male 163,978 614 1,633 14,343 7,070 140,319
Female 1,166,652 10,513 15,402 105,111 42,730 992,896
SOURCE: U.S. Department of Education, National Center for Education Statistics, Schools and StaffingSurvey, 1990-91 (Teacher Questionnaire).
349
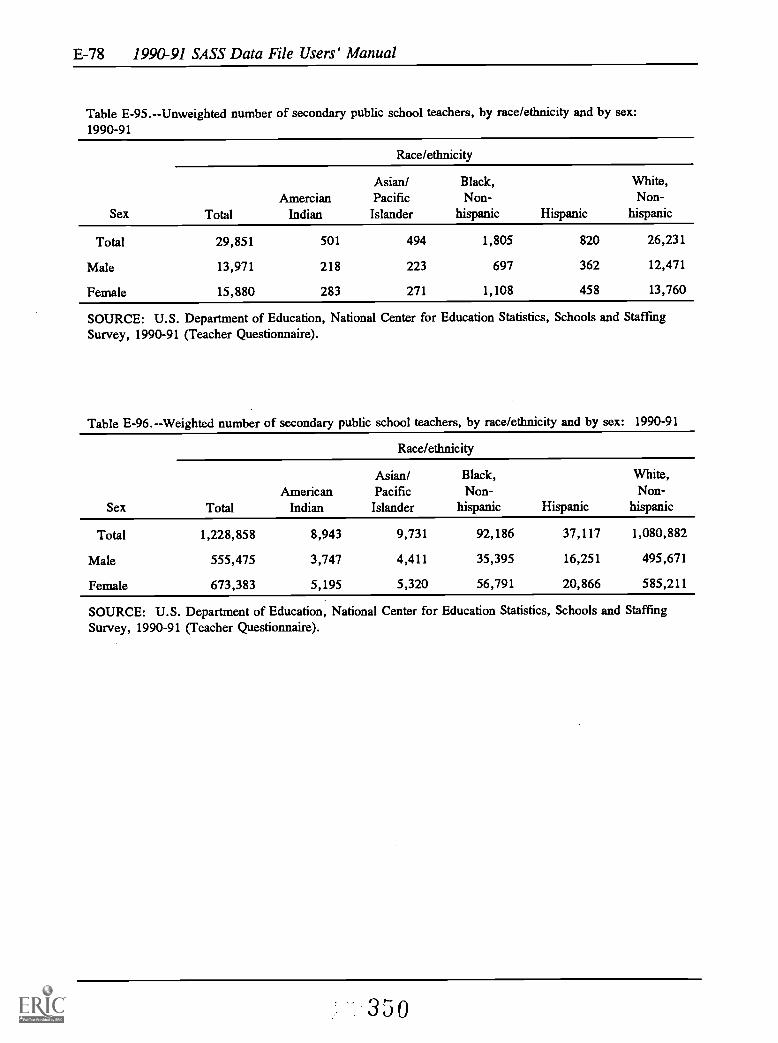
E-78 1990-91 SASS Data File Users' Manual
Table E-95.--Unweighted number of secondary public school teachers, by race/ethnicity and by sex:1990-91
Sex
Race/ethnicity
Asian/ Black, White,Amercian Pacific Non- Non-
Total Indian Islander hispanic Hispanic hispanic
Total 29,851 501 494 1,805 820 26,231
Male 13,971 218 223 697 362 12,471
Female 15,880 283 271 1,108 458 13,760
SOURCE: U.S. Department of Education, National Center for Education Statistics, Schools and StaffingSurvey, 1990-91 (Teacher Questionnaire).
Table E-96.--Weighted number of secondary public school teachers, by race/ethnicity and by sex: 1990-91
Sex
Race/ethnicity
Asian/ Black, White,American Pacific Non- Non-
Total Indian Islander hispanic Hispanic hispanic
Total 1,228,858 8,943 9,731 92,186 37,117 1,080,882
Male 555,475 3,747 4,411 35,395 16,251 495,671
Female 673,383 5,195 5,320 56,791 20,866 585,211
SOURCE: U.S. Department of Education, National Center for Education Statistics, Schools and StaffingSurvey, 1990-91 (Teacher Questionnaire).
350
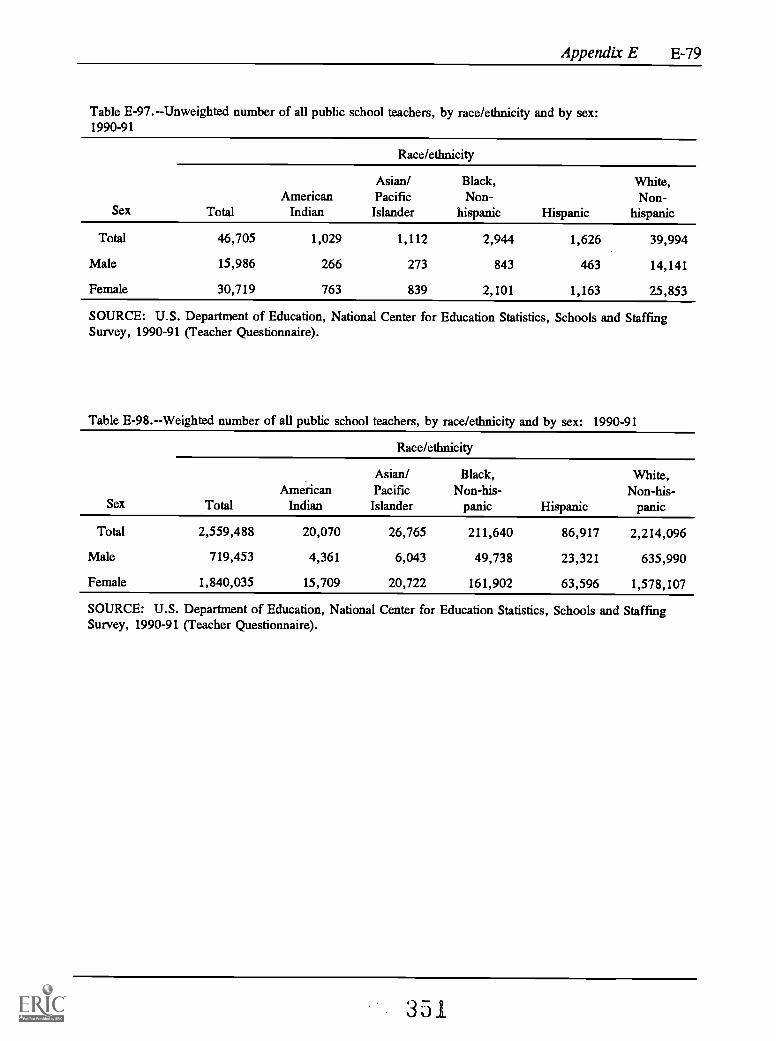
Appendix E E-79
Table E-97.--Unweighted number of all public school teachers, by race /ethnicity and by sex:1990-91
Sex
Race/ethnicity
Asian/ Black, White,American Pacific Non- Non-
Total Indian Islander hispanic Hispanic hispanic
Total 46,705 1,029 1,112 2,944 1,626 39,994
Male 15,986 266 273 843 463 14,141
Female 30,719 763 839 2,101 1,163 25,853
SOURCE: U.S. Department of Education, National Center for Education Statistics, Schools and StaffingSurvey, 1990-91 (Teacher Questionnaire).
Table E-98.--Weighted number of all public school teachers, by race/ethnicity and by sex: 1990-91
Sex
Race/ethnicity
Asian/ Black, White,American Pacific Non-his- Non-his-
Total Indian Islander panic Hispanic panic
Total 2,559,488 20,070 26,765 211,640 86,917 2,214,096
Male 719,453 4,361 6,043 49,738 23,321 635,990
Female 1,840,035 15,709 20,722 161,902 63,596 1,578,107
SOURCE: U.S. Department of Education, National Center for Education Statistics, Schools and StaffingSurvey, 1990-91 (Teacher Questionnaire).
351

E-80 1990-91 SASS Data File Users' Manual
Table E-99.--Unweighted number of elementary public school teachers, by highest degree earned and bymain assignment field: 1990-91
Highest degree earned
Main assignment field TotalLess or equal to
bachelor's Master's or higher
Total 16,854 10,266 6,588
Pre-kindergarten Elementary 11,182 7,272 3,910
Vocational Education 12 5 7
Specialty Areas 2,396 1,333 1,063
English 241 137 104
Math 254 134 120
Social Studies .133 73 60
Foreign Language 48 30 18
Science 170 98 72
Special Education 2,345 1,149 1,196
All others 73 35 38
SOURCE: U.S. Department of Education, National Center for Education Statistics, Schools and StaffingSurvey, 1990-91 (Teacher Questionnaire).
Table E-100.--Weighted number of elementary public school teachers, by highest degree earned and by mainassignment field: 1990-91
Highest degree earned
Main assignment field TotalLess or equal to
bachelor's Master's or higher
Total 1,330,630 753,426 577,204
Pre-kindergarten Elementary 887,037 531,765 355,272
Vocational Education -- --
Specialty Areas 196,587 104,867 91,721
English 22,403 13,094 9,309
Math 24,317 12,288 12,029
Social Studies 11,408 5,336 6,073
Foreign Language 2,541 1,225 --
Science 15,377 8,744 6,633
Special Education 164,336 73,115 91,222
All others 6,208 2,830 3,378
--Too few sample cases (fewer than 30) for a reliable estimate.
SOURCE: U.S. Department of Education, National Center for Education Statistics, Schools and StaffingSurvey, 1990-91 (Teacher Questionnaire).
352

Appendix E E-81
Table E-101.--Unweighted number of secondary public school teachers, by highest degree earned and bymain assignment field: 1990-91
Highest degree earned
Main assignment field TotalLess or equal to
bachelor's Master's or higher
Total 29,851 15,569 14,282
Pre-kindergarten Elementary 23 14 9Vocational Education 3,876 2,194 1,682Specialty Areas 7,360 4,154 3,206English 4,165 2,160 2,005Math 3,543 1,854 1,689Social Studies 3,143 1,538 1,605Foreign Language 1,285 654 631Science 3,143 1,491 1,652Special Education 2,709 1,195 1,514All others 604 315 289
SOURCE: U.S. Department of Education, National Center for Education Statistics, Schools and StaffingSurvey, 1990-91 (Teacher Questionnaire).
Table E-102.--Weighted number of secondary public school teachers, by highest degree earned and by mainassignment field: 1990-91
Highest degree earned
Main assignment field TotalLess or equal to
bachelor's Master's or higher
Total 1,228,858 591,045 637,813
Pre-kindergarten Elementary - - -Vocational Education 135,119 69,308 65,811Specialty Areas 315,122 164,254 150,868English 174,972 87,760 87,212Math 146,510 71,570 74,940Social Studies 132,078 58,384 73,694Foreign Language 56,402 25,876 30,526Science 133,708 57,851 75,856Special Education 109,620 44,152 65,467All others 24,400 11,365 13,035
-Too few sample cases (fewer than 30) for a reliable estimate.
SOURCE: U.S. Department of Education, National Center for Education Statistics, Schools and StaffingSurvey, 1990-91 (Teacher Questionnaire).
353

E-82 1990-91 SASS Data File Users' Manual
Table E-103.--Unweighted number of all public school teachers, by highest degree earned and by mainassignment field: 1990-91
Highest degree earned
Main assignment field TotalLess or equal to
bachelor's Master's or higher
Total 46,705 25,835 20,870
Pre-kindergarten Elementary 11,205 7,286 3,919
Vocational Education 3,888 2,199 1,689
Specialty Areas 9,756 5,487 4,269English 4,406 2,297 2,109
Math 3,797 1,988 1,809
Social Studies 3,276 1,611 1,665
Foreign Language 1,333 684 649
Science 3,313 1,589 1,724
Special Education 5,054 2,344 2,710All others 677 350 327
SOURCE: U.S. Department of Education, National Center for Education Statistics, Schools and StaffmgSurvey, 1990-91 (Teacher Questionnaire).
Table E-104.--Weighted number of all public school teachers, by highest degree earned and by mainassignment field: 1990-91
Highest degree earned
Main assignment field TotalLess or equal to
bachelor's Master's or higher
Total 2,559,488 1,344,471 1,215,017
Pre-kindergarten Elementary 887,965 532,289 355,675
Vocational Education 135,534 69,472 66,062Specialty Areas 511,709 269,121 242,588English 197,374 100,854 96,520Math 170,827 83,858 86,969
Social Studies 143,486 63,720 79,767Foreign Language 58,943 27,100 31,843Science 149,084 66,595 82,489Special Education 273,956 117,267 156,689
All others 30,608 14,194 16,414
SOURCE: U.S. Department of Education, National Center for Education Statistics, Schools and StaffmgSurvey, 1990-91 (Teacher Questionnaire).
3 5 4

Appendix E E-83
Table E-105.--Unweighted number of public school teachers, by level andby teaching experience: 1990-91
Level
Teaching experience Total Elementary Secondary
Total 46,705 16,854 29,851
Experienced 40,280 14,297 25,983
New 6,425 2,557 3,868
SOURCE: U.S. Department of Education, National Center for EducationStatistics, Schools and Staffing Survey, 1990-91 (Teacher Questionnaire).
Table E-106.--Weighted number of public school teachers, by level and byteaching experience: 1990-91
Teaching experience
Level
Total Elementary Secondary
Total 2,559,488 1,330,630 1,228,858
Experienced 2,244,529 1,152,964 1,091,565
New 314,959 177,666 137,293
SOURCE: U.S. Department of Education, National Center for EducationStatistics, Schools and Staffing Survey, 1990-91 (Teacher Questionnaire).
355

Appendix E E-85
Private School Teacher Survey
Selected Unweighted and Weighted Tables
356

E-86 1990-91 SASS Data File Users' Manual
Table E-107.--Unweighted number of elementary private school teachers, by employment status andteacher type: 1990-91
Teacher type
Employment status
Total Full-time Part-time
Total
Itinerant
Long term substitute
Regular
3,415
13
4
3,398
2,922
0
+ +
2,920
493
13
+ +
478
+ +Too few sample cases.
SOURCE: U.S. Department of Education, National Center for Education Statistics, Schools and StaffingSurvey, 1990-91 (Teacher Questionnaire).
Table E-108.--Weighted number of elementary private school teachers, by employment status and teachertype: 1990-91
Employment status
Teacher type Total Full-time Part-time
Total 176,252 154,786 21,465
Itinerant 0
Long term substitute
Regular 175,078 154,605 20,473
--Too few sample cases (fewer than 30) for a reliable estimate.
SOURCE: U.S. Department of Education, National Center for Education Statistics, Schools and StaffingSurvey, 1990-91 (Teacher Questionnaire).
357

Appendix E E-87
Table E-109.--Unweighted number of secondary private school teachers, by employment status and byteacher type: 1990-91
Employment status
Teacher type Total Full-time Part-time
Total 3,227 2,558 669
Itinerant 42 0 42
Long term substitute 5 ++ 3
Regular 3,180 2,556 624
+ +Too few sample cases.
SOURCE: U.S. Department of Education, National Center for Education Statistics, Schools and StaffingSurvey, 1990-91 (Teacher Questionnaire).
Table E-110.Weighted number of secondary private school teachers, by employment status and by teachertype: 1990-91
Teacher type
Employment status
Total Full-time Part-time
Total 180,035 146,471 33,564
Itinerant 2,158 0 2,158
Long term substitute
Regular 177,639 146,375 31,264
--Too few sample cases (fewer than 30) for a reliable estimate.
SOURCE: U.S. Department of Education, National Center for Education Statistics, Schools and StaffingSurvey, 1990-91 (Teacher Questionnaire).
358

E-88 1990-91 SASS Data File Users' Manual
Table E-111.Unweighted number of all private school teachers, by employment status and by teachertype: 1990-91
Employment status
Teacher type Total Full-time Part-time
Total 6,642 5,480 1,162
Itinerant 55 0 55
Long term substitute 9 4 5
Regular 6,578 5,476 1,102
SOURCE: U.S. Department of Education, National Center for Education Statistics, Schools and StaffingSurvey, 1990-91 (Teacher Questionnaire).
Table E-112.--Weighted number of all private school teachers, by employment status and by teacher type:1990-91
Employment status
Teacher type Total Full-time Part-time
Total 356,287 301,257 55,029
Itinerant 2,872 0 2,872
Long term substitute
Regular 352,718 300,980 51,737
--Too few sample cases (fewer than 30) for a reliable estimate.
SOURCE: U.S. Department of Education, National Center for Education Statistics, Schools and StaffingSurvey, 1990-91 (Teacher Questionnaire).
359

Appendix E E-89
Table E-113.--Unweighted number of elementary private school teachers, by race/ethnicity and by sex:1990-91
Sex
Race/ethnicity
TotalAmerican
Indian
Asian/PacificIslander
Black,Non-
hispanic Hispanic
White,Non-
hispanic
Total
Male
Female
3,415
367
3,048
28
4
24
115
12
103
126
20
106
102
12
90
3,044
319
2,725
SOURCE: U.S. Department of Education, National Center for Education Statistics, Schools and StaffingSurvey, 1990-91 (Teacher Questionnaire).
Table E-114.--Weighted number of elementary private school teachers, by race/ethnicity and by sex:1990-91
Race/ethnicity
Asian/ Black, White,American Pacific Non- Non-
Sex Total Indian Islander hispanic Hispanic hispanic
Total 176,252 3,023 5,377 5,480 161,730
Male 12,825 11,430
Female 163,426 2,643 4,795 5,098 150,300
--Too few sample cases (fewer than 30) for a reliable estimate.
SOURCE: U.S. Department of Education, National Center for Education Statistics, Schools and StaffmgSurvey, 1990-91 (Teacher Questionnaire).
360

E-90 1990-91 SASS Data File Users' Manual
Table E-115.--Unweighted number of secondary private school teachers, by race/ethnicity and by sex:1990-91
Sex
Race/ethnicity
Asian/ Black, White,American Pacific Non- Non-
Total Indian Islander hispanic Hispanic hispanic
Total 3,227 20 88 77 125 2,917
Male 1,320 11 33 33 44 1,199
Female 1,907 9 55 44 81 1,718
SOURCE: U.S. Department of Education, National Center for Education Statistics, Schools and StaffingSurvey, 1990-91 (Teacher Questionnaire).
Table E-116.--Weighted number of secondary private school teachers, by race /ethnicity and by sex:1990-91
Race/ethnicity
Asian/ Black, White,American Pacific Non- Non-
Sex Total Indian Islander hispanic Hispanic hispanic
Total 180,035 2,167 4,084 6,171 166,894
Male 68,940 895 1,816 1,967 63,986
Female 111,095 1,272 2,269 4,204 102,908
--Too few sample cases (fewer than 30) for a reliable estimate.
SOURCE: U.S. Department of Education, National Center for Education Statistics, Schools and StaffingSurvey, 1990-91 (Teacher Questionnaire).
361

Appendix E E-9 1
Table E-117.--Unweighted number of all private school teachers, by race/ethnicity and by sex:1990-91
Sex
Race/ethnicity
TotalAmerican
Indian
Asian/PacificIslander
Black,Non-
hispanic Hispanic
White,Non-
hispanic
Total 6,642 48 203 203 227 5,961
Male 1,687 15 45 53 56 1,518
Female 4,955 33 158 150 171 4,443
SOURCE: U.S. Department of Education, National Center for Education Statistics, Schools and StaffingSurvey, 1990-91 (Teacher Questionnaire).
Table E-118.--Weighted number of all private school teachers, by race/ethnicity and by sex:1990-91
Sex
Race/ethnicity
TotalAmerican
Indian
Asian/PacificIslander
Black,Non-
hispanic Hispanic
White,Non-
hispanic
Total
Male
Female
356,287
81,765
274,521
1,360
1,032
5,190
1,275
3,915
9,462
2,398
7,064
11,651
2,350
9,302
328,624
75,416
253,208
--Too few sample cases (fewer than 30) for a reliable estimate.
SOURCE: U.S. Department of Education, National Center for Education Statistics, Schools and StaffingSurvey, 1990-91 (Teacher Questionnaire).
362
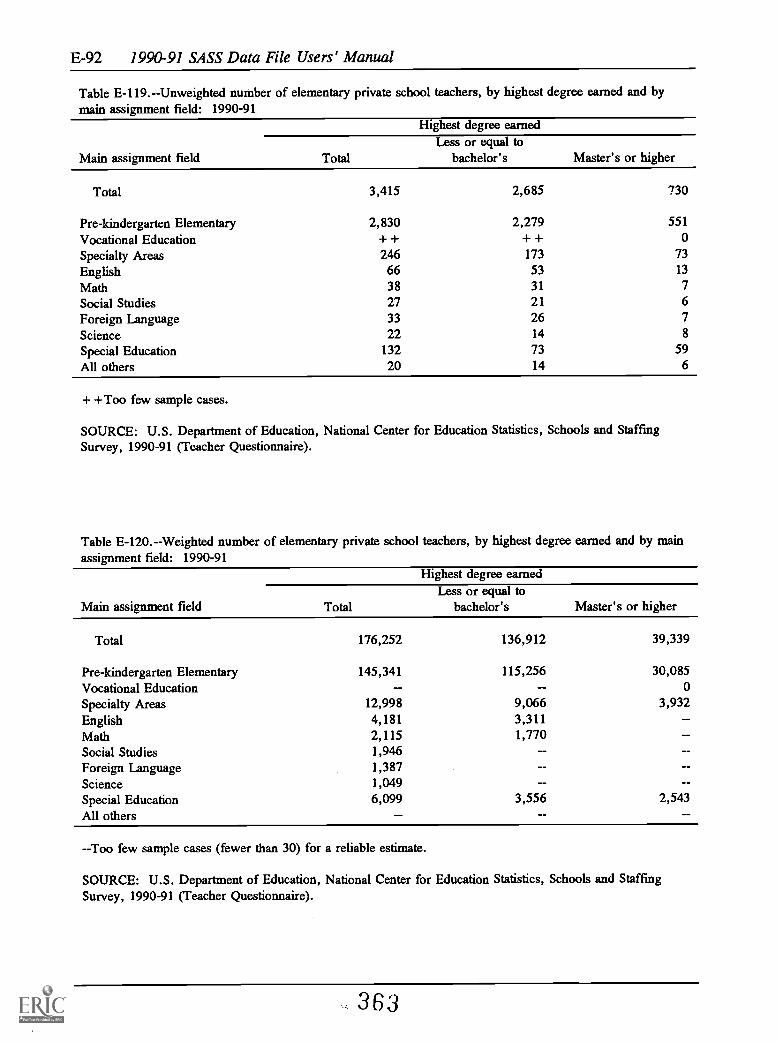
E-92 1990-91 SASS Data File Users' Manual
Table E-119.--Unweighted number of elementary private school teachers, by highest degree earned and bymain assignment field: 1990-91
Highest degree earned
Main assignment field TotalLess or equal to
bachelor's Master's or higher
Total 3,415 2,685 730
Pre-kindergarten Elementary 2,830 2,279 551
Vocational Education + + + + 0
Specialty Areas 246 173 73English 66 53 13
Math 38 31 7
Social Studies 27 21 6
Foreign Language 33 26 7
Science 22 14 8
Special Education 132 73 59All others 20 14 6
+ +Too few sample cases.
SOURCE: U.S. Department of Education, National Center for Education Statistics, Schools and StaffingSurvey, 1990-91 (Teacher Questionnaire).
Table E-120.--Weighted number of elementary private school teachers, by highest degree earned and by mainassignment field: 1990-91
Highest degree earned
Main assignment field TotalLess or equal to
bachelor's Master's or higher
Total 176,252 136,912 39,339
Pre-kindergarten Elementary 145,341 115,256 30,085Vocational Education -- -- 0Specialty Areas 12,998 9,066 3,932English 4,181 3,311Math 2,115 1,770Social Studies 1,946Foreign Language 1,387Science 1,049Special Education 6,099 3,556 2,543All others
--Too few sample cases (fewer than 30) for a reliable estimate.
SOURCE: U.S. Department of Education, National Center for Education Statistics, Schools and StaffingSurvey, 1990-91 (Teacher Questionnaire).
363
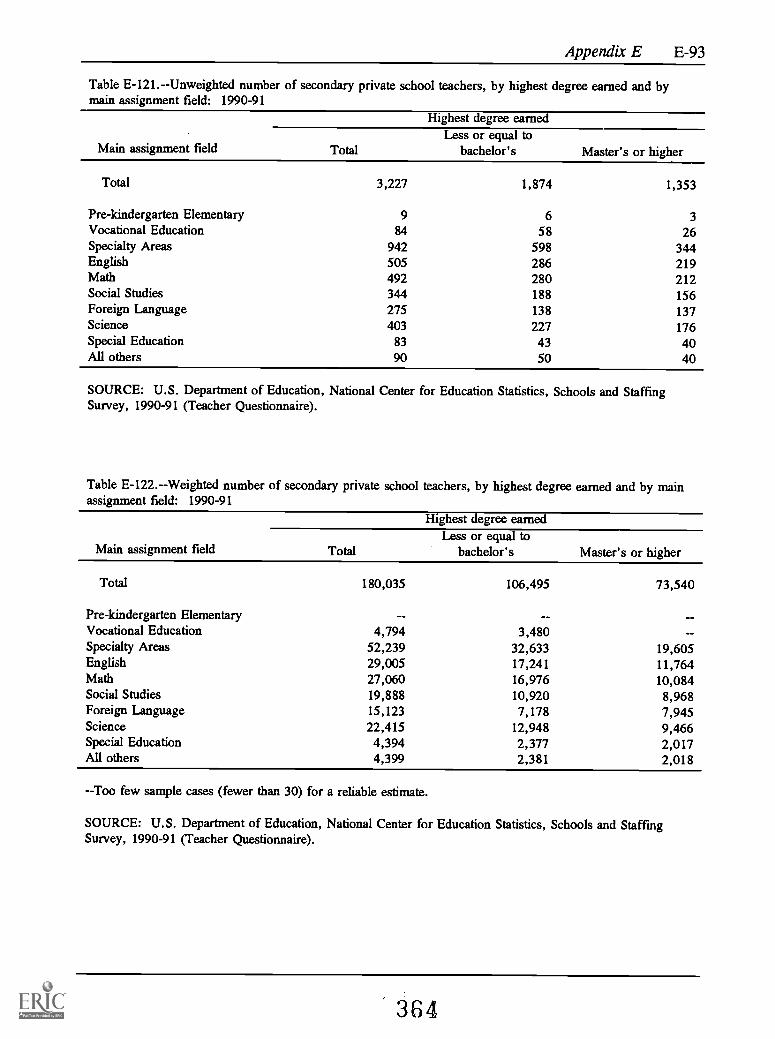
Appendix E E-93
Table E-121.--Unweighted number of secondary private school teachers, by highest degree earned and bymain assignment field: 1990-91
Highest degree earned
Main assignment field TotalLess or equal to
bachelor's Master's or higher
Total 3,227 1,874 1,353
Pre-kindergarten Elementary 9 6 3Vocational Education 84 58 26Specialty Areas 942 598 344English 505 286 219Math 492 280 212Social Studies 344 188 156Foreign Language 275 138 137Science 403 227 176Special Education 83 43 40All others 90 50 40
SOURCE: U.S. Department of Education, National Center for Education Statistics, Schools and StaffingSurvey, 1990-91 (Teacher Questionnaire).
Table E-122.--Weighted number of secondary private school teachers, by highest degree earned and by mainassignment field: 1990-91
Highest degree earned
Main assignment field TotalLess or equal to
bachelor's Master's or higher
Total 180,035 106,495 73,540
Pre-kindergarten ElementaryVocational Education 4,794 3,480Specialty Areas 52,239 32,633 19,605English 29,005 17,241 11,764Math 27,060 16,976 10,084Social Studies 19,888 10,920 8,968Foreign Language 15,123 7,178 7,945Science 22,415 12,948 9,466Special Education 4,394 2,377 2,017All others 4,399 2,381 2,018
--Too few sample cases (fewer than 30) for a reliable estimate.
SOURCE: U.S. Department of Education, National Center for Education Statistics, Schools and StaffingSurvey, 1990-91 (Teacher Questionnaire).
364

E-94 1990-91 SASS Data File Users' Manual
Table E-123.--Unweighted number of all private school teachers, by highest degree earned and by mainassignment field: 1990-91
Highest degree earned
Main assignment field TotalLess or equal to
bachelor's Master's or higher
Total 6,642 4,559 2,083
Pre-kindergarten Elementary 2,839 2,285 554Vocational Education 85 59 26Specialty Areas 1,188 771 417English 571 339 232Math 530 311 219Social Studies 371 209 162Foreign Language 308 164 144Science 425 241 184Special Education 215 116 99All others 110 64 46
SOURCE: U.S. Department of Education, National Center for Education Statistics, Schools and StaffingSurvey, 1990-91 (Teacher Questionnaire).
Table E-124.--Weighted number of all private school teachers, by highest degree earned and by mainassignment field: 1990-91
Highest degree earned
Main assignment field TotalLess or equal to
bachelor's Master's or higher
Total 356,287 243,407 112,879
Pre-kindergarten Elementary 146,060 115,617 30,443Vocational Education 4,823 3,509 --Specialty Areas 65,236 41,699 23,537English 33,187 20,553 12,634Math 29,175 18,745 10,430Social Studies 21,835 12,256 9,578Foreign Language 16,510 8,317 8,193Science 23,464 13,742 9,723Special Education 10,492 5,932 4,560All others 5,505 3,036 2,468
--Too few sample cases (fewer than 30) for a reliable estimate.
SOURCE: U.S. Department of Education, National Center for Education Statistics, Schools and StaffingSurvey, 1990-91 (Teacher Questionnaire).
365

Appendix E E-95
Table E-125.--Unweighted number of private school teachers, by level andby teaching experience: 1990-91
Level
Teaching experience Total Elementary Secondary
Total 6,642 3,415 3,227
Experienced 4,550 2,327 2,223
New 2,092 1,088 1,004
SOURCE: U.S. Department of Education, National Center for EducationStatistics, Schools and Staffing Survey, 1990-91 (Teacher Questionnaire).
Table E-126.--Weighted number of private school teachers, by level andby teaching experience: 1990-91
Level
Teaching experience Total Elementary Secondary
Total 356,287 176,252 180,035
Experienced 261,137 129,123 132,014
New 95,149 47,128 48,021
SOURCE: U.S. Department of Education, National Center for EducationStatistics, Schools and Staffing Survey, 1990-91 (Teacher Questionnaire).
366

F-1
Appendix F. Questionnaires
367

Appendix F F-3
Teacher Demand and Shortage Questionnaire (SASS 1A)
368

FORM SASS-1A111-14-90) U.S. DEPARTMENT OF COMMERCE
BUREAU OF THE CENSUS
ACTING AS COLLECTING AGENT FORU.S. DEPARTMENT OF EDUCATION
NATIONAL CENTER FOR EDUCATION STATISTICS
SCHOOLS AND STAFFING SURVEYTEACHER DEMAND AND SHORTAGE QUESTIONNAIRE
FOR PUBLIC SCHOOL DISTRICTS(LEAs)
1990-1991
OMB No. 1850-0598Approval Expires 12/31/92
This report is authorized by law (20 USC 1221 el. Your answerswill be kept strictly confidential. Results from this survey willappear in summary or statistical form only, so that individualscannot be identified.
Bureau of the CensusCurrent Projects Branch1201 East Tenth StreetJeffersonville, IN 47132
Please complete this questionnaire with informationabout the SCHOOL DISTRICT named on the label, andreturn it to the Bureau of the Census in the enclosedpreaddressed envelope. Please return it within 3 weeks.
If you have any questions about this survey, please callthe Census Bureau collect at (301) 763-5507.
If the district named on the label no longer exists, markthe box below and return this questionnaire to theBureau of the Census in the enclosed preaddressedenvelope.
001 t School district no longer exists
EXISTS
THIS SURVEY HAS BEEN ENDORSED BY:
American Association for Counseling and Development
American Association of School Administrators
American Federation of Teachers
Council of Chief State School Officers
National Association of Elementary School Principals
National Association of Secondary School Principals
National Education Association
Please correct any errors in nameand address, including
ZIP Code.
BESTCOPYAVAILABLE
369

Dear District Administrator:
The National Center for Education Statistics (NCES) of the U.S. Department of Educationrequests your participation in the Teacher Demand and Shortage Survey for the 1990-91Schools and Staffing Survey. Your district is one of 5,400 districts across the Nation selectedto be in the sample.
The Schools and Staffing Survey, first conducted in school year 1987-88, is an integratedset of surveys consisting of the Teacher Demand and Shortage Survey, the School Survey, theSchool Administrator Survey, and the Teacher Survey. These surveys are being conductedperiodically to measure critical aspects of teacher supply and demand, the composition of theadministrator and teacher work force, and the general status of teaching and schooling. Thepurpose of the Teacher Demand and Shortage Survey is to obtain information about suchfactors as district enrollment and teacher counts including the number of teaching positionsthat are filled or remain unfilled. The 1990-91 questionnaire has been revised, and theresulting burden is significantly less than the 1987-88 version.
The U.S. Bureau of the Census is conducting the survey for the National Center for EducationStatistics by the authority of Section 406(b) of the General Education Provisions Act, asamended (20 USC 1221e). The data will be treated as confidential and will be reported only instatistical summaries that preclude the identification of any individual participating in thesurvey.
We are conducting this survey with a sample of districts. While this minimizes overall responseburden, the value of each individual survey response is greatly increased because it representsmany other school districts. I, therefore, encourage you to participate in this voluntary surveyby completing this questionnaire and returning it within 3 weeks to the Bureau of theCensus, Current Projects Branch, 1201 East Tenth Street, Jeffersonville, IN 47132,in the preaddressed envelope enclosed for your convenience.
Thank you for your cooperation in this very important effort.
Sincerely,
Emerson J. DionActing CommissionerNational Center for Education Statistics
Enclosures
INFORMATION ABOUT YOUR PARTICIPATION
Public reporting burden for this collection of information is estimated to average one hour andthirty minutes per response, including the time for reviewing instructions, gathering the dataneeded, and completing and reviewing the collection of information. Send comments regardingthis burden estimate or any other aspect of this collection of information, including suggestionsfor reducing this burden, to the U.S. Department of Education, Information Management andCompliance Division, Washington, DC 20202-4651; and to the Office of Management andBudget, Paperwork Reduction Project 1850-0598, Washington, DC 20503.
Page 2
BEST COPY AVAILABLE370
FORM SASS-1A (11-14.90)

INSTRUCTIONS
Please use a typewriter or a pencil to complete this If you have any questions, please call the Bureau of thequestionnaire. Do not use an ink pen or marker. Census COLLECT at (301) 763-5507.
If you are unsure about how to answer a question, give" Use the enclosed preaddressed envelope to return thisthe best answer you can and make a comment in the questionnaire to the Bureau of the Census. Please return"Remarks" section. it within the next 3 weeks.
Please keep count of the time required to complete this questionnaire.At the end of the survey, you are asked to record the amount of time spent.
a. Please give your name, title, telephone number,and the most convenient days/times to reachyou. This information will be used only if it isnecessary to clarify any of your responses.
Name
Title
Telephone number (Include area code)Area code I Number
i
1
i
Convenient days/times to reach you, if necessary
b.1
Does this school district employ elementaryand/or secondary teachers?
I
with item 1 below011 I II _i Yes Please continue20 No EKPLYTCH
IF YOU ANSWERED "NO" TO ITEM (b) ABOVE, PLEASE STOP NOW AND RETURN THISQUESTIONNAIRE TO THE BUREAU OF THE CENSUS. THANK YOU FOR YOUR TIME.
SECTION A ENROLLMENT AND TEACHING POSITIONS
. What was the enrollment (in headcounts) in this district on orabout October 1 of THIS schoolyear, and on or about October 1of LAST school year?
For prekindergarten, include onlystudents who are in the yearimmediately prior to kindergarten.Do NOT duplicate counts betweentwo categories.
NOTE: If this district's grade levelorganization differs fromthe grade level categories(PK, K, 1 6, 7-12) foritems 1 and 2, pleaseapportion the district'scounts to match thecategories of these items.
Grade level This year'senrollment
Last year'senrollment
a. Ungraded
012 NorfuG 013LASTUG
o f i None o Li None
b. Prekindergarten014 1 NOWPKIC
015 LASTPK
oi-iNone o li None
c. Kindergarten
016 017 LASINGNOWKG
0 ri None o None
d. Grades 1-6018 NOW16 019
LAST1_6
o None0 o [ii None
e. Grades 7-12020 021 LAST7 12NOW7 12 -
on None 0 II None
f. Postsecondary022 023
NOWPS LASTPS
0 None o None
g. Totalenrollment
024 NOWTOT 025LASTTOT
o None o NoneFORM SASS-1A 111-14-901
BEST COPY AVAILABLE371
Page 3
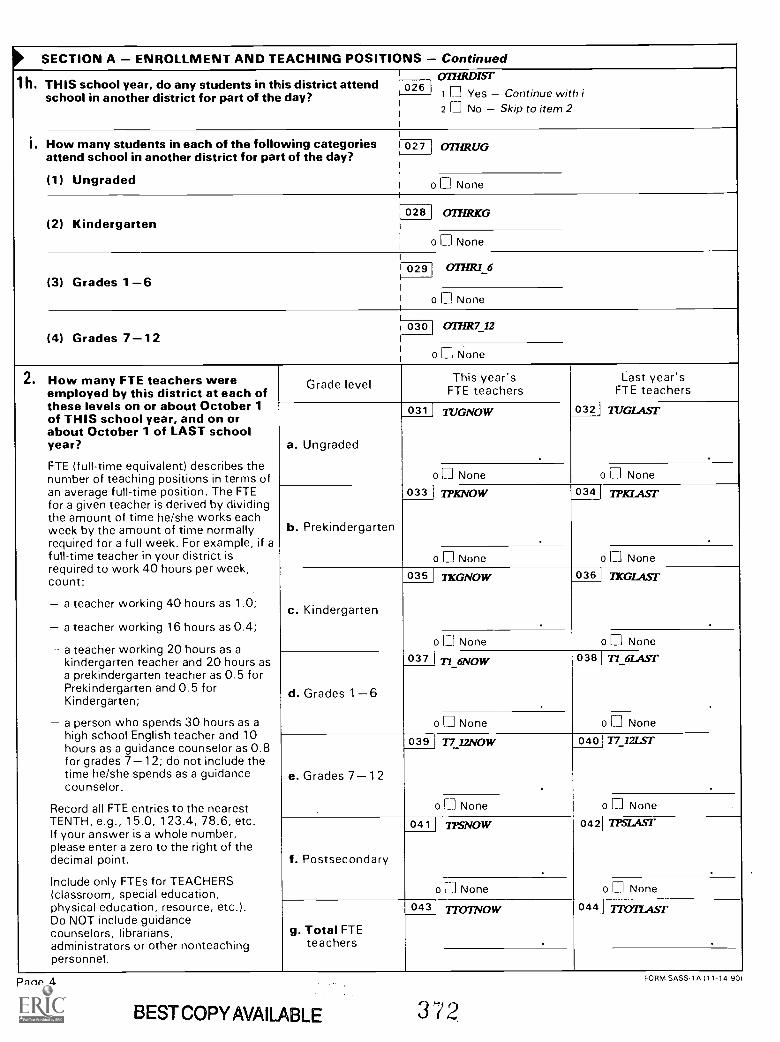
SECTION A ENROLLMENT AND TEACHING POSITIONS Continued
1 h.
i.
THIS school year, do any students in thisschool in another district for part of the
077ERDIST
with iitem 2
district attend 1 026I 1 0 Yes Continueday?
2 li No Skip to
How many students in each of the followingattend school in another district for part
(1) Ungraded
categories 1 027 OTHRUGof the day?
0 None
(2) Kindergarten028 oTHRKG
o 0 None
(3) Grades 1 6029 OTHR1_6
0 0 None
(4) Grades 7-12 I
030 OT7IR7 12
o 0 None
2. How many FTE teachers wereemployed by this district at each ofthese levels on or about October 1of THIS school year, and on orabout October 1 of LAST schoolyear?
FTE (full-time equivalent) describes thenumber of teaching positions in terms ofan average full-time position. The FTEfor a given teacher is derived by dividingthe amount of time he/she works eachweek by the amount of time normallyrequired for a full week. For example, if afull-time teacher in your district isrequired to work 40 hours per week,count:
a teacher working 40 hours as 1.0;
a teacher working 16 hours as 0.4;
a teacher working 20 hours as akindergarten teacher and 20 hours asa prekindergarten teacher as 0.5 forPrekindergarten and 0.5 forKindergarten;
a person who spends 30 hours as ahigh school English teacher and 10hours as a guidance counselor as 0.8for grades 7-12; do not include thetime he/she spends as a guidancecounselor.
Record all FTE entries to the nearestTENTH, e.g., 15.0, 123.4, 78.6, etc.If your answer is a whole number,please enter a zero to the right of thedecimal point.
Include only FTEs for TEACHERS(classroom, special education,physical education, resource, etc.).Do NOT include guidancecounselors, librarians,administrators or other nonteachingpersonnel.
Grade level This year'sFTE teachers
Last year'sFTE teachers
a. Ungraded
031 TUGNOW 0321 TuGLAsr
o El None o 0 None
b. Prekindergarten
033 TPKNOW 034 7PKL4S1'
o 0 None o None
c. Kindergarten
0351 TUGNOW 036 TKGLAsT
o 0 None o 0 None
d. Grades 1 6
037 T1 6NOW 038 n6LAsr
.
o 0 None o 0 None
e. Grades 7 12
039] 77 12NOW
.
040 77 12LST
.
a Li None o 0 None
f. Postsecondary
041 TPSNOW 042 TPSLAST
.
o 0 None
0431 7TOTNOW
o 0 None
044 I 77omAyr
g. Total FTEteachers
Page 4
BESTCOPYAVAILABLE 372
FORM SASS 1 A 11 1- 14.901

SECTION A ENROLLMENT AND TEACHING POSITIONS Continued
Items 3-12 refer ONLY to FTEs for grades K-12 and comparable ungraded levels; i.e., for these items DO NOTINCLUDE prekindergarten and postsecondary FTEs.
Record all FTE entries to the nearest TENTH.
Refer to item 2.
3. Record the total number of FTE teachers whoteach grades K-12 and comparable ungradedlevels, i.e., this year's total FTE teachers minusprekindergarten and postsecondary.
2'2'027C 12
1 045
4. Of the total FTE teachers cited in item 3, howmany hold regular or standard statecertification in their fields of assignment?
Count a teacher as certified if he/she has met yourstate's regular or standard certification requirementsin his/her assigned field. Include those who havecompleted all necessary course work and practiceteaching, and are eligible for full certification uponcompletion of a probationary period.
NOTE: Do NOT count teachers who have onlyemergency or other nonstandardcertification.
I CERTIFY
046
5a. As of October 1 of this school year, howmany FTE teaching positions for gradesK-12 and comparable ungraded levelswere vacant or temporarily filled by asubstitute teacher?
Report the number of K 12 FTE teachingpositions approved for the 1990 1991 schoolyear that were vacant or filled by a substituteteacher as of October 1, 1990, because suitablecandidates could not be found.
VACANCY
047
I o None
b. How many FTE teaching positions for gradesK-12 and comparable ungraded levels wereabolished or withdrawn between the start ofthe hiring season and October 1 of thisschool year because suitable candidatescould not be found?
1ABOLSED
1 048
o None
6. How many FTE teaching positions forgrades K-12 and comparable ungradedlevels were approved for this school year,whether filled or not?
Entry should equal the sum of the entries foritems 3, 5a, and 5b.
i APPROVED
049
FORM SASS-1A 111-14-901
BESTCOPYAVAILABLE
373 Page 5

SECTION A ENROLLMENT AND TEACHING POSITIONS Continued
7a. As of October 1 of this school year, how manyFTE teachers for grades K-12 and comparableungraded levels were NEWLY HIRED by thisschool district for this school year?
Include teachers returning from unpaid leave ofabsence of one school year or more. Do not includesubstitute teachers.
NE WM1RESContinue with b
1 050
None Skip to item 8o
I
b. How many of these newly hired FTE teachershold regular or standard state certification intheir fields of assignment?
IVEWCERTS1 051
Noneo
8. At the end of LAST SCHOOL YEAR, howmany FTE teachers for grades K-12 andcomparable ungraded levels were laid off?
Count teachers whose contracts were not renewedat the end of the 1989-90 school year because ofbudget limitations, declining enrollment, orelimination of courses. Do NOT include teachers whowere fired or whose contracts were not renewedbecause of performance reasons.
LA1DOFF052
NoneI o
9. As of October 1 of this school year, howmany FTE librarians/media specialistswere employed in this district for
a. Grades K 6?
L1BK 6
053
Noneo
b. Grades 7-12?L1B7 12
-054
None0
C. Total FTE librarians/media specialists forgrades K-12
Sum of the entries for 9a and 9b
7TITLIBRY1055
NoneI o
10. As of October 1 of this school year, howmany FTE librarian/media specialistpositions were vacant or temporarily filledby a substitute?
VACN1L1B1 056
Noneo
11. How many FTE librarian/media specialistpositions were abolished or withdrawnbetween the start of the hiring season andOctober 1 of this school year becausesuitable candidates could not be found?
1
1 ABOLSHLB057
Noneo
12. How many FTE librarian/media specialistpositions were approved for this schoolyear, whether filled or not?
I
APPRVL1B058
None0
Page 6
374
FORM SASS-1A (11-14-90)

SECTION B DISTRICT POLICIES
Staff Compensation and Training
13. Which of these benefits are available toTEACHERS in this district?
Mark (X) all that apply.MEDICAL
DENTAL
GENERAL MEDICAL INSURANCE
059 10 District (or other organization)pays part or all of premium
060
LIFE 061
PENSION 1 062
HOUSING 063
MEALS064 I
TRANSPT
2 Teachers pay all of premium
DENTAL INSURANCE
3 District (or other organization)pays part or all of premium
4 Teachers pay all of premium
GROUP LIFE INSURANCE
5 District (or other organization)pays part or all of premium
6 Teachers pay all of premium
70 PENSION CONTRIBUTIONS
INCOME-IN-KIND
80 Housing
9 Meals (including free orreduced-price lunch)
065 HO Transportation (includingmileage reimbursement foritinerant teachers(
TUITION 1 066 HO REIMBURSEMENT FORTEACHERS' TUITION ANDCOURSE FEES
NONE 067 o None of the above
14. How many months is the normal contract year for ateacher?
LNGTHYR 068Report months in whole numbers.
Months
1 5. Is there a salary schedule for teachers in thisdistrict? SALSCICED 069 10 Yes Continue with item 16
2 No Skip to item 17
FORM SASS-1A (11-14-901 375BEST COPY AVAILABLE
Page 7

SECTION B DISTRICT POLICIES Continued
Staff Compensation and Training Continued
MIIVI3ACH
per year
16. According to the salary schedule, what is thenormal yearly base salary for
Enter salary amounts in whole dollars.
a. A teacher with a bachelor's degree and noteaching experience?
.0o070 $
b. A teacher with a master's degree (or itsequivalent in credit hours beyond a bachelor's)and no teaching experience?
MINMAS7R
per year.00071 $
C. A teacher with a master's degree (or itsequivalent in credit hours) and 20 years ofteaching experience?
MAJOfASTR
per year072 $
d. A teacher at the highest possible step on thesalary schedule?
HIGHSAL
per year
PLEASE SKIP TO ITEM 18.
.00073 $
NOTE: IF YOU COMPLETED ITEM 16,
17. What is the range of base year teacher salariesin this district?
Enter salary amounts in whole dollars.
MINSALRY
(Lowest)
I (Highest)
.001074 $1
toMAXSALRY
.01 075 $
i
Remarks Please use this space for any explanations that may be essential in understanding your reported data.Please include item number.
Page 8
376
FORM SASS-1A 111-14-901

SECTION B DISTRICT POLICIES Continued
Staff Compensation and Training Continued
The following definitions pertain to items 18-20.
Cash bonus A supplement to regular compensationover the year, but no permanent increase in salary
Different step on the salary schedule Placement ofa teacher on a higher step of the salary schedule
Other salary increase Increase in base salary orother raise in salary through reclassification (other thana step increase on the salary schedule)
nTRITPAY18a. In this school year, does this district have a 076 1 Yes Continue with b
"merit pay" plan for teachers?A "merit is a system in which a teacher's 2 No Skip to item 19apay" planperformance is a significant factor in determininghis or her compensation.
b. How is this performance-based IIIIRITCS 077 1 Cash bonuscompensation given?MAMITSTP 078 2 Different step on the salary schedule
Mark (X) thatall apply.MERITING 079 3 Other salary increase
19a. Does this school district use any of the pay oso 1 Yes Continue with b INCENTIVincentives listed above to recruit or retainteachers to teach in less desirable I 2 No Skip to item 20alocations?
b. Which of these pay incentives are offered to 1 081 1 Cash bonus nrcarrcsiiattract teachers to less desirable locations?
082 2 Different step on the salary schedule INCNTSTPMark (X) thatall apply.
083 3 Other salary increase nforrirrc
20a. Does this district use any of the pay incentives 084 1 Yes Continue hw.ti h b SHORTAGElisted above to attract teachers to fieldsspecified by this district as fields of shortage? 2 No Skip to item 21a
b. Which of these pay incentives are offered to 085 I 1 Cash bonus SHORTCSHattract teachers to fields of shortage?
0861
2 Different step on the salary schedule SHORTSTPMark (X) all that apply.
087 3 Other salary increase swim=
C. In which fields are incentives offered? 088 1 Special education SHRTSPHC
Mark (X) all that apply. 089 2 Matheinatics mama=090 3 Computer science PRIZTCOMP
091 4 Physical sciences sEIRTPlas
092 I s Biology/life sciences siERTSIOSKSTESOL 093 6 English as a second language (ESL)/Bilingual educationSItRTLANG f 094
7 Foreign languagessiairtrocl 095 8 Vocational education
1
swRrown:11096 9 Other Specify -I
I
I
FORM SASS-1A (11-14901
3 7 7 BEST COPYAVAILABt F
Page 9
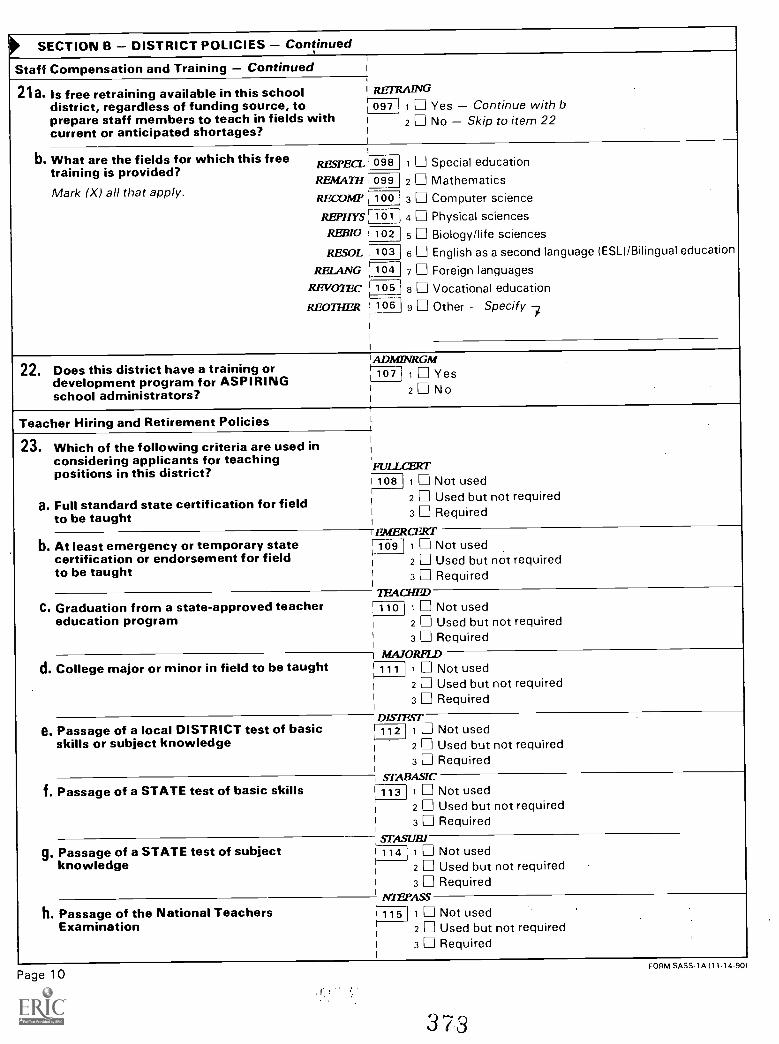
) SECTION B DISTRICT POLICIES Continued
Staff Compensation and Training Continued
1 Yes Continue with b2 No Skip to item 22
21a. Is free retraining available in this school RETRAING
district, regardless of funding source, to 097prepare staff members to teach in fields withcurrent or anticipated shortages?
b.1 Special educationWhat are the fields for which this free RESPELL' 098
training is provided?REMATH109912
Mark (X) thatMathematics
3 Computer science
4 Physical sciences5 Biology/life sciences6 English as a second language (ESL) /Bilingual education
all apply. RECOMP , 100 j
REPHYS ,I 101
REBIO i 102
RESOL 103RELANG 104 7 Foreign languages
REVO7EC 105 8 Vocational educationREanTER 106 9 Other Specify
i ADMINRGM22. Does this district have a training or }______,
development for ASPIRING i107 I 1 Yes
2 N oprogram
school administrators?
Teacher Hiring and Retirement Policies
1 Not used2 Used but not required
23. Which of the following criteria are used inconsidering applicants for teachingpositions in this district? FULLCERT
108
a. Full standard state certification for field i
to be taught 3 Required
I EMERCERTb. At least emergency or temporary state r09 1 Not used
certification or endorsement for fieldto be taught
2 Used but not required3 Required
7EACITED1 I Not used
2 Used but not requiredC. Graduation from a state-approved teacher 110
education program i
3 RequiredMAIORFLD
1 Not usedd. College major or minor in field to be taught 1 1 1
2 Used but not required3 Required
DIS7ES7'I 1 Not used
2 Used but not requirede. Passage of a local DISTRICT test of basic 112
skills or subject knowledge3 Required
STABASIC1 Not usedf. Passage of a STATE test of basic skills 1 1132 Used but not required3 Required
STASURI1 Not usedg. Passage of a STATE test of subject i 114
knowledge i 2 Used but not required3 Required
NIEPASS1 Not usedh. Passage of the National Teachers 115
Examination i 2 Used but not required3 Required
Page 10
3 73
FORM SASS-1 A111 -14-90)
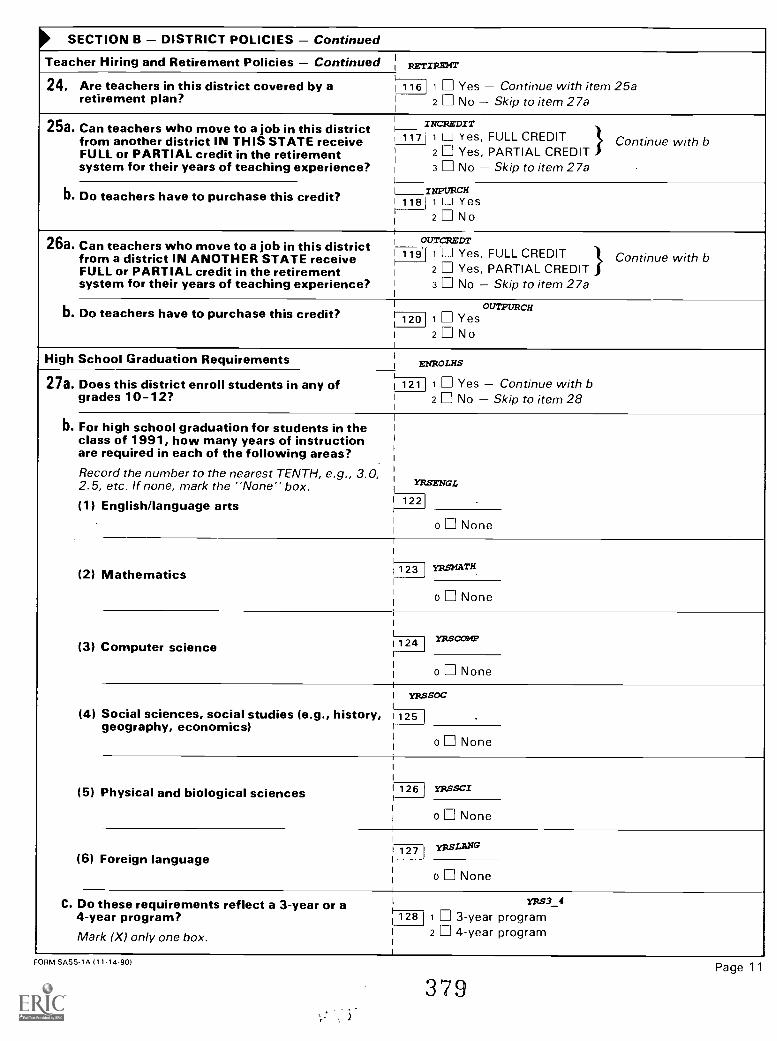
SECTION B DISTRICT POLICIES Continued
Teacher Hiring and Retirement Policies Continued RETIREHT
24. Are teachers in this district covered by aretirement plan?
116 1 Yes Continue with item 25a2 [i] No Skip to item 27a
25a. Can teachers who move to a job in this districtfrom another district IN THIS STATE receiveFULL or PARTIAL credit in the retirementsystem for their years of teaching experience?
1--- INCREDIT1 Y1_1 es,117 FULL CREDIT Continue with b1 1
2 Yes, PARTIAL CREDIT3 No Skip to item 27a
b. Do teachers have to purchase this credit? L____INPURCH1181 1 LI Yes
2 N 0
26a. Can teachers who move to a job in this districtfrom a district IN ANOTHER STATE receiveFULL or PARTIAL credit in the retirementsystem for their years of teaching experience?
OUTCREDT
119 1 L.J Yes, FULL CREDIT Continue with b2 Yes, PARTIAL CREDIT
I 3 No Skip to item 27a
b. Do teachers have to purchase this credit?OUTPURCH
120 1 Yes2 N o
High School Graduation Requirements ENFt0LHS
27a. Does this district enroll students in any ofgrades 10 -12?
121 1 Yes Continue with bI 2 No Skip to item 28
b. For high school graduation for students in theclass of 1991, how many years of instructionare required in each of the following areas?Record the number to the nearest TENTH, e.g., 3.0,2.5, etc. If none, mark the "None" box.
(1) English/language arts
YRSENGL
i 122
o None
(2) Mathematics 123 YRSHATH
o None
(3) Computer scienceYRSCOMP124
o None
(4) Social sciences, social studies (e.g., history,geography, economics)
YRSSOC
1 125
o None
(5) Physical and biological sciences 126 YRSSCX
o None
(6) Foreign language127 YESLAZIG
o None
C. Do these requirements reflect a 3-year or a4-year program?Mark (X) only one box.
134YRS
128 1 3-year programI 2 4-year programI
FORM SASS-1A 111-14-R01
379Page 11
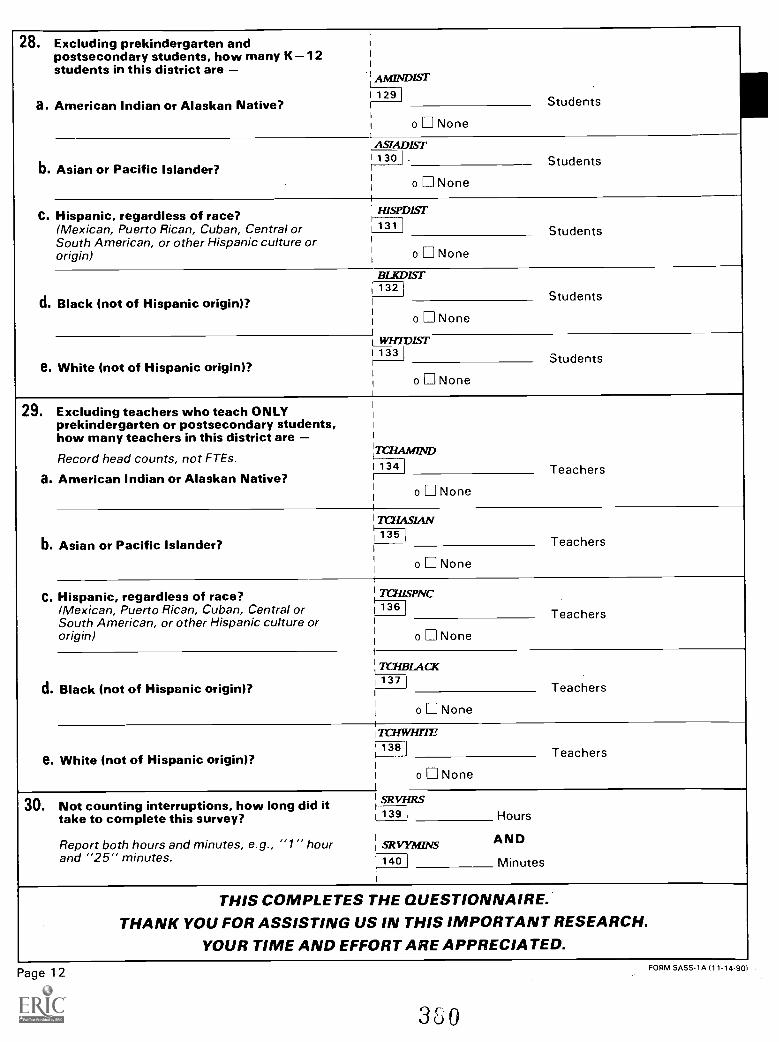
}
28. Excluding prekindergarten andpostsecondary students, how many K 12 I
students in this district areAMINDIST129
Studentsa. American Indian or Alaskan Native?o None
ASIADIS7'1301 . Studentsb. Asian or Pacific Islander?
o None
C. Hispanic, regardless of race? IHSPDIST
(Mexican, Puerto Rican, Cuban, Central or 131Students
South American, or other Hispanic culture ororigin) i o None
BLKDIST132
Studentsd. Black (not of Hispanic origin)? I
o None
i WH7DIS7'133 i
Studentse. White (not of Hispanic origin)?
o None
29. Excluding teachers who teach ONLYprekindergarten or postsecondary students,how many teachers in this district are
ITCHAMINDRecord head not FTEs. tcounts,
134 Teachersa. American Indian or Alaskan Native?
o None
Parmsbusi135
b. Asian Pacific Islander? Teachersor I
o None
C. Hispanic, regardless of race? TCHISPNC
(Mexican, Puerto Rican, Cuban, Central or 136Teachers
South American, or other Hispanic culture ororigin) i o None
TCHBLACK137
d. Black (not of Hispanic origin)? Teachersi
o None
TCHWHTTE138
Teacherse. White (not of Hispanic origin)?o None
SRHRS30. Not interruptions, how long did it Vcountingtake to complete this survey? 139 Hours
Report both hours and minutes, e.g., "1 "hour i SIWYMINS AND"25"and minutes. i 140 Minutes
THIS COMPLETES THE QUESTIONNAIRE.THANK YOU FOR ASSISTING US IN THIS IMPORTANT RESEARCH.
YOUR TIME AND EFFORT ARE APPRECIATED.
Page 12
330
FORM SASS-1A (11-14-90)

Appendix F F-17
Public School Administrator Questionnaire (SASS 2A)
381

FORM SASS-2A111-16-901
U.S. DEPARTMENT OF COMMERCEBUREAU OF THE CENSUS
ACTING AS COLLECTING AGENT FORU.S. DEPARTMENT OF EDUCATION
NATIONAL CENTER FOR EDUCATION STATISTICS
SCHOOLS AND STAFFING SURVEYPUBLIC SCHOOL ADMINISTRATOR
QUESTIONNAIRE1990-1991
OMB No. 1850-0598Approval Expires 12/31/92
This report is authorized by law 120 USC 1221e). Youranswers will be kept strictly confidential. Results from thissurvey will appear in summary or statistical form only, so thatindividuals cannot be identified.
Bureau of the CensusCurrent Projects Branch1201 East Tenth StreetJeffersonville, IN 47132
The principal of the school named on the address label shouldcomplete this questionnaire and return it to the Bureau of theCensus in the enclosed preaddressed envelope. Please returnit within 2 weeks.
If you have any questions, please call the Census BureauCOLLECT at (301) 763-5507.
If the school named on the label is no longer in operation ordoes NOT have an administrator or principal, mark theappropriate box below.
001 1 School no longer in operation
2 School has no administrator
If you marked one of the boxes above, do not complete thisquestionnaire. Please return it to the Bureau of the Census in
the enclosed preaddressed envelope.Thank you for your cooperation.
THIS SURVEY HAS BEEN ENDORSED BY
American Association for Counseling and Development
American Association of School Administrators
American Federation of Teachers
Council of Chief State School Officers
National Association of Elementary School Principals
National Association of Secondary School Principals
National Education Association
Please correct any errors in nameand address, including
ZIP Code.
352

Dear Principal:
The National Center for Education Statistics (NCES) of the U.S. Department of Educationrequests your participation in the School Administrator Survey for the 1990-91 Schoolsand Staffing Survey. Your school is one of 9,900 public and 3,300 private schools acrossthe Nation selected to be in the sample.
The Schools and Staffing Survey, first conducted in school year 1987-88, is anintegrated set of surveys consisting of the Teacher Demand and Shortage Survey, theSchool Survey, the School Administrator Survey, and the Teacher Survey. These surveysare being conducted periodically to measure critical aspects of teacher supply anddemand, the composition of the administrator and teacher work force, and the generalstatus of teaching and schooling. The purpose of the School Administrator Survey is toobtain information about the training, experience, and professional background of schoolprincipals.
The U.S. Bureau of the Census is conducting the survey for the National Center forEducation Statistics by the authority of Section 406(b) of the General EducationProvisions Act, as amended (20 USC 1221e). The data will be treated as confidential andwill be reported only in statistical summaries that preclude the identification of anyindividual participating in the surveys.
We are conducting this survey with a sample of schools. While this minimizes overallresponse burden, the value of each individual survey response is greatly increasedbecause it represents many other principals. I, therefore, encourage you to participate inthis voluntary survey by completing this questionnaire and returning it within 2 weeks tothe Bureau of the Census, Current Projects Branch, 1201 East Tenth Street,Jeffersonville, IN 47132, in the preaddressed envelope enclosed for yourconvenience.
Thank you for your cooperation in this very important effort.
Sincerely,
Emerson J. ElliottActing CommissionerNational Center for Education Statistics
Enclosures
INFORMATION ABOUT YOUR PARTICIPATION
Public reporting burden for this collection of information is estimated to average 20 minutes.Send comments regarding this burden estimate or any other aspect of this collection ofinformation, including suggestions for reducing this burden, to the U.S. Department ofEducation, Information Management and Compliance Division, Washington,DC 20202-4651; and to the Office of Management and Budget, Paperwork ReductionProject 1850-0598, Washington, DC 20503.
Page 2
383
FORM SASS-2A (11-16-90)

INSTRUCTIONS
It is important that this questionnaire be completed by Notice that at the end of some answer categories andthe school PRINCIPAL, not by anyone else. answer spaces, there are instructions to skip to later
items or to continue with the next item on theMost of the items on this form are arranged so that the questionnaire.questions are on the left side and the answer categoriesor spaces for written answers are on the right. Please If you have any questions, call the Bureau of the Censusanswer the questions by marking the appropriate answer COLLECT at (301) 763-5507.category with an X, or recording your answer in theanswer space provided. We suggest that you use a pencil Return your completed questionnaire to the Bureau ofrather than a pen or marker. the Census in the enclosed preaddressed envelope.
Please return it within 2 weeks.
1. Were you the principal of this schoolYes
N oin the spring of 1988? 011 I 1
2
MAJOR AND MINOR FIELD OF STUDY CODES FOR QUESTIONS 2, 3, AND 4
EDUCATION GENERAL
General education Special education 06 Agriculture and natural resources Foreign languages01 Pre-elementary/early 67 Special education, general 86 American Indian studies (Native American) 51 French
childhood education 68 Emotionally disturbed 87 Other area and ethnic studies 52 German03 Elementary education 69 Mentally retarded 08 Architecture and environmental design 53 Latin04 Secondary education 70 Speech/language impaired 10 Art, fine and applied 54 Russian
71 Deaf and hard-of-hearing 14 Business and management 55 SpanishSubject area education 72 Visually handicapped 16 Communications and journalism 56 Other foreign languages07 Agricultural education 73 Orthopedically impaired 17 Computer and information sciences11 Art 74 Mildly handicapped 19 Drama, theatereducation13 Bilingual education 75 Severely handicapped 20 Engineering15 Business, commerce, and 76 Specific learning disabilities 21 English (literature, letters, speech, classics)
77 Other special education 25 General studies Natural sciencesdistributive education 57 Biology/life science27 Health professions and occupations89 Cross-cultural education 58
22 English education 28 Home economics85 Humanities 59 GeoloChemistrygy/earth science
23 English as a second language Other education 31 Law 60 Physics24 Foreign languages education 78 Curriculum and instruction 61 Other natural32 Library science29 Home economics education 79 Educational administration sciences88 Indian education (Native 80 Educational psychology 33
35 Military scienceAmerican) 81 Counseling and guidance 36 Multi/interdisciplinary studies30 Industrial arts, vocational and 82 Other education 37 Musictechnical, trade and industryeducation 39 Philosophy Social sciences
34 Mathematics education 41 Psychology 62 Economics38 Music education 42 Public affairs and services 63 History40 Physical education/health 44 Religion, theology 64 Political science
education and government43 Reading education 65 Sociology45 Religious education 66 Other social46 Science education sciences48 Social studies/social sciences
education 84 Other
Yes Continue with bNo Skip to item 4a
2a. Do you have a bachelor's degree? i 012 1
2
b. What was your major field of study? i 013 I
Enter the major field and the two-digitcode from list above.
Code Major field
InC. what year did you receive yourbachelor's degree? I 014
Yes Continue with eNo Skip to item 3a
d. Did you have a second major or minor i 015 I 1field of study?2
e. What was your second major or minorfield of study? 016
Enter the field and the two-digit codefrom list above. I Code Second major or minor field
FORM SASS-2A (11-16-90)
3 8 4 EIESTCOPYAVAILARLF
Page 3

3a. Do you have a master's degree? i 017 1 Yes Continue with b2 No Skip to item 4a
b. What was major fieldyour of study?Enter the major field and the two-digit code from I 018
list on page 3. j Code Major field
C. In what year did you receive your master's degree? 019 I
. 4a. Do you have any other type of degree? i 020 1 Yes Continue with b2 No Skip to item 5a
b. What other degree(s) have you earned?Mark (X) all that apply in column (b) below.
C. What was your major field of study for each degree?In column (c) below, enter the field name and the appropriatetwo-digit code from the list on page 3.
d. In what year did you receive each degree?
(b)
Other degree(s) earned Mark (X) all that apply.IC) Ilk
Major field code (See list on page 3)Id)
Year degree received
0211 Associate degree 022 I 023
Code Major field
024 2 Education specialist or professional 025 I 026
diploma (at least one year beyondMaster's level)
! 9Code Major field
027 3 Doctorate or first professional degree 028 029(Ph.D., Ed. D., M.D., L.L.B., J.D.,D.D.S.)
Code Major field
5a. How many of elementaryyears or secondaryteaching experience did you have PRIOR to 1 030 Years of teachingbecoming a principal? - Count part of a year as 1 year. i o None
b. How many years of elementary or secondaryteaching experience have you had SINCE becoming 1 031 Years of teachinga principal?- Count part of a year as 1 year.
I o None
CHECK ITEM A032 1 Yes Continue with item 6
Refer to items 5a and 5b aboVe.2 No Skip to item 7
Did you answer "1" or more to question 5a or 5b?TEACHING ASSIGNMENT FIELD CODES FOR QUESTION 6
01 Prekindergarten Special areas (Continued) Science Vocational education02 Kindergarten 11 Foreign language 21 Biology 41 Agriculture03 General elementary 12 Gifted 22 Chemistry 42 Business
13 Health, physical education 23 Geology/earth science 43 MarketingSpecial areas 14 Home economics 24 Physics 44 Health occupations
Inonvocationall 25 General and all other science 45 Vocational home04 American Indian/Native American 15 Mathematics economicsstudies 16 Music 31 Library/media 46 Trade and industry05 Art 17 Reading specialist 47 Technical06 Basic skills and remedial education 18 Religion/philosophy 48 Other vocational07 Bilingual education 19 Social studies/social science education08 Computer science09 English/language arts 51 Special education10 English as a second language 61 All others
6. In your most recent year of teaching, what wasthe field of your MAIN TEACHINGASSIGNMENT, i.e., the field in which you taughtthe most classes? Use the codes listed above torecord your assignment field. If your teachingschedule was divided equally between two fields,record either field as your main assignment field.
033 1
Main assignment field code
Page 4
38BEST COPY AVAILABLE
FORM SASS-2A 111-16-901

7. What other school positions, if any, did youhold before you became a principal?
Mark (X) all that apply.
1
2
4
5
6
o
Department head or curriculum coordinator
or program director
clubs, debate teams
034
035 Assistant principal036 Guidance counselor037 Athletic coach038 Sponsor for student039 Other Specify040 None
8a. Prior to becoming an administrator, did youparticipate in any district or school training ordevelopment program for ASPIRING school ASPIRINGadministrators?
1
2
Yes041
III No
b. Have you ever participated in a training programfor Indian education administration?
TRAIN/ND
1
2
Yes Continue with c9
042No Skip to item
C. Did you complete the program? ENDTRAIN 1 Yes043 IN o
9. Prior to this school year, how many years have youbeen employed in each of the following positions?If less than one year, enter "1." If none, mark the box.
a. As the principal in this school? o
Years044 I
None
b. As the principal in other schools?o
Years045
None
C. In other school or district administrativepositions?
o
Years046
None
d. In other nonteaching nonadministrative positionsin elementary and secondary education, e.g., aguidance counselor or school psychologist? o
Years1
047
None
e. In professional positions outside elementaryand secondary education?
o
Years048
None
10. Aside from college coursework for a degree,have you had any of these types of training foryour current position?
Mark (X) all that apply.
1
2
3
o
Inservice training in evaluation and supervision
techniques
internship
i 049
Training in management
An administrative
i 050
051
None of the above052
11a. How long do you plan to remain a principal?
Mark (X) only one box.
053 1
2
3
4
5
ableContinue with b
for retirement
unlesscomes along
leave as Skip to item 12a
time
As long as I am
Until I am eligible
Will probably continuesomething betterDefinitely plan tosoon as possible
Undecided at this
b. In how many years do you plan to retire from yourposition as a principal?- if less than one year, enter 1. Yearsi 054
12a. What is your current ANNUAL salary for thisposition before taxes and deductions?
$ Annual salary.00055
b. For how many months of the year are youemployed as the administrator in this school? Months employed056
FORM SASS-2A (11-16-90)
386Page 5
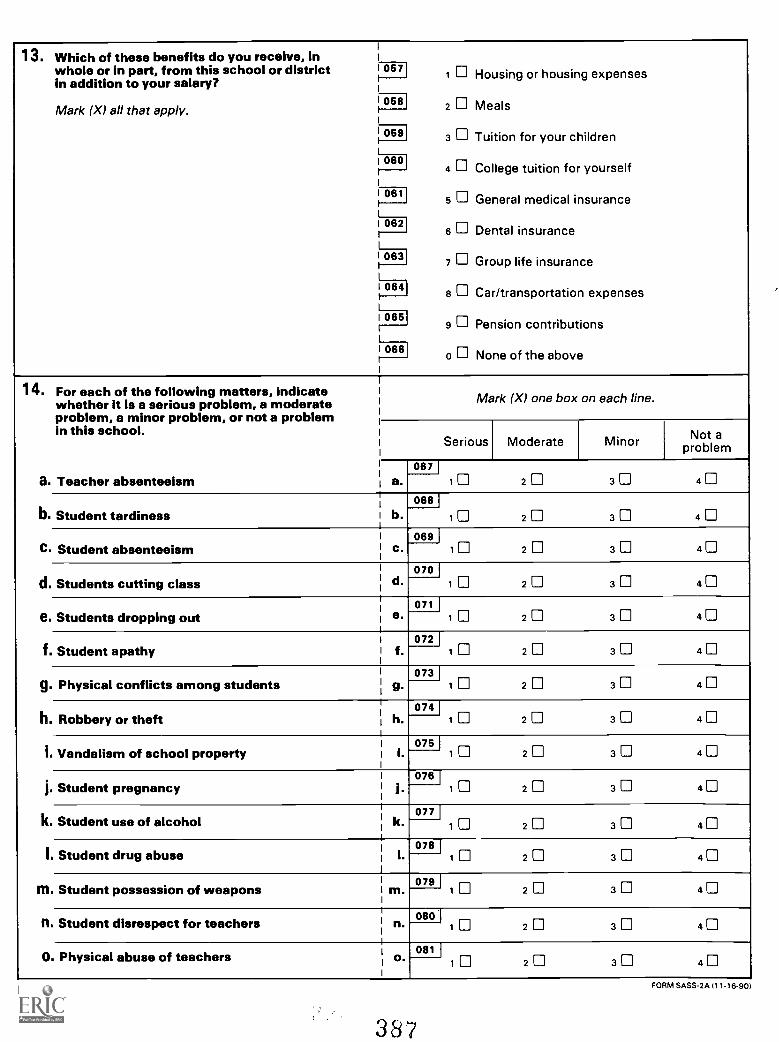
13. Which of these benefits do you receive, inwhole or in part, from this school or districtin addition to your salary?
05711 Housing or housing expenses
Mark (X) all that apply.0581
2 Meals
0591 3 Tuition for your children
4 College tuition for yourself0601
0615 General medical insurance
6 Dental insurance082J
06317 Group life insurance
8
s
Car/transportation expenses
Pension contributions
064
oes 1
066o None of the above
14. For each of the following matters, indicatewhether it is a serious problem, a moderate Mark (X) one box on each line.
problem, a minor problem, or not a problemNot ain this school.
Serious Moderate Minor problem067
a. Teacher absenteeism a. 1 2 3 4
068 Ib. Student tardiness b. 1 2 3 4
089IC. Student absenteeism c. 1 2 3 4
070d. Students cutting class d.
1 2 3 4
071e. Students dropping out e 1 2 3 4 101
072f. Student apathy f. 1 2 3 4
073g. Physical conflicts among students g. 1 2 3 4
074h. Robbery or theft h. 1 2 3 4
I Vandalism of school property i.075
1 42 3
078j. Student pregnancy j. 1 2 3 4
k. Student use of alcohol k.077
1 2 3 4
078 II. Student drug abuse I. 1 2 3 4
M. Student possession of weapons m. 079 I42 3 III
n. Student disrespect for teachers n. 080 142 3
0. Physical abuse of teachers o.081
1 2 3 4
Page 6
387
FORM SASS-2A (11-16-90)

14. ContinuedFor each of the following matters, indicatewhether it is a serious problem, a moderateproblem, a minor problem, or not a problem inthis school.
p. Verbal abuse of teachers
Mark (X) one box on each line.
Serious Moderate Minor Not aproblem
P.082
2 41 3
q. Lack of academic challenge R.083
2 41 3
r. Lack of parent involvement r.084
2 41 3
S. Parental alcoholism and/or drug abuse 3.085
2 41 3
t. Poverty t. 086 I2 41 3
U. Racial tension u. 0872 41 3
V. Cultural conflict v. 0882 41 3
15. Using the scale 1 -6, where 1 is "None" and 6 is"A great deal," indicate how much ACTUAL in-fluence you think each group or person has ondecisions concerning the following activities.
a. Establishing curriculum
(1) State Department of Education SEACURRC1-100
None
Mark (X) the appropriate box on each line.
2 3 5
greatdeal
61 4
(2) School board BRDCURRC 1012 3 5 64
(3) Principal PRNCURRC 1022 3 5 64
(4) Teachers TEACURRC 1032 3 5 64
(5) Librarians/Media specialists LIBCURRC 1042 3 5 6i 4
(6) Parent association PARCU RRC 1052 3 5 64
b. Hiring new full-time teachers
(1) School board BRDHIRNG2 3 5 6
106 4
(2) PrincipalPRNHIRNG 107
2 3 5 64
(3) Teachers TEAHIRNG 108 12 3 5 6IIII 4
(4) Parent association PARH RNGI 1092 3 5 64
C. Setting discipline policy
(1) State Department of Education SEADISPL i 2 3 4 5 6110 1
(2) School board BRDDISPL 111I
2 3 5 61 4
PRNDISPL(3) Principal 112 1
2 3 5 61 1 4 1TEADISPL(4) Teachers 113 I
2 3 5 641
(5) Parent association PARD /SPL 1 114 I2 3 5 641
FORM SASS-2A (11-16-90)
388Page 7
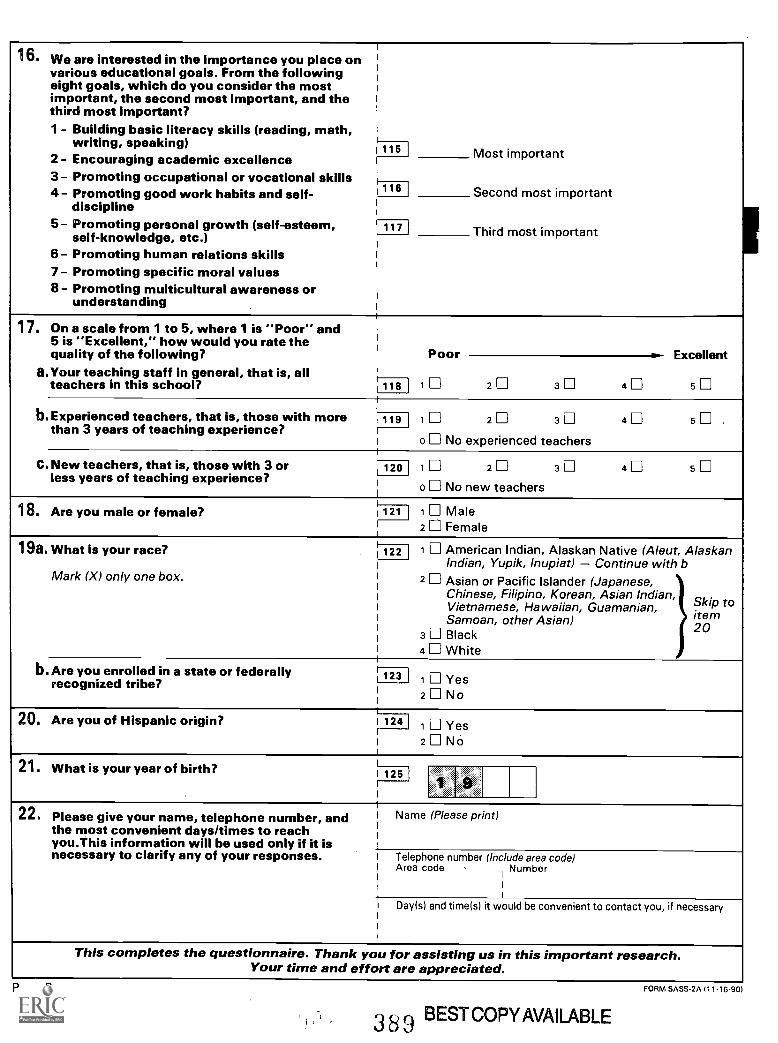
16. We are interested in the importance you place onvarious educational goals. From the followingeight goals, which do you consider the mostimportant, the second most important, and thethird most important?1 - Building basic literacy skills (reading, math,
writing, speaking)2 - Encouraging academic excellence3- Promoting occupational or vocational skills4- Promoting good work habits and self-
discipline5- Promoting personal growth (self-esteem,
self-knowledge, etc.)6- Promoting human relations skills7 - Promoting specific moral values8- Promoting multicultural awareness or
understanding
115 Most important
116 Second most important
117 I Third most important
17. On a scale from 1 to 5, where 1 is "Poor" and5 is "Excellent," how would you rate thequality of the following?
a.Your teaching staff in general, that is, allteachers in this school?
Poor ..- Excellent
118 1 ill 2 3 4 5
b. Experienced teachers, that is, those with morethan 3 years of teaching experience?
i 119 1 2 III 3 4 5 .
I o No experienced teachers
C. New teachers, that is, those with 3 orless years of teaching experience?
120 1 2 3 4 5
o No new teachers
18. Are you male or female? i 121 1 Male2 Female
19a. What is your race?
Mark (X) only one box.
122 1 American Indian, Alaskan Native (Aleut, AlaskanIndian, Yupik, Inupiat) Continue with b
2 Asian or Pacific Islander (Japanese,Chinese, Filipino, Korean, Asian Indian,Vietnamese, Hawaiian, Guamanian, Skip toSamoan, other Asian) item
203 Black4 White
b. Are you enrolled in a state or federally i 1231 Yesrecognized tribe?2 No
20. Are you of Hispanic origin? 1 124 I1 Yes2 N o
21. What is your year of birth? 125 I
22. Please give your name, telephone number, and Name (Please pr'nt)the most convenient days/times to reachyou.This information will be used only if it isnecessary to clarify any of your responses. Telephone number (Include area code)
Area code Number
I
1
I Day(s) and timels) it would be convenient to contact you, if necessaryi
I
I
This completes the questionnaire. Thank you for assisting us in this important research.Your time and effort are appreciated.
Page 8
BEST COPY AVAILABLE
FORM SASS-2A (11-16-90)

Appendix F F-27
Private School Administrator Questionnaire (SASS 2B)
390

FORM SASS-2B111-16-901
U.S. DEPARTMENT OF COMMERCEBUREAU OF THE CENSUS
ACTING AS COLLECTING AGENT FORU.S. DEPARTMENT OF EDUCATION
NATIONAL CENTER FOR EDUCATION STATISTICS
SCHO LS ND STAFFING SURVEYPRIVATE SCHOOL ADMINISTRATOR
QUESTIONNAIRE1990-1991
The principal/head of the school named on the address labelshould complete this questionnaire and return it to the Bureauof the Census in the enclosed preaddressed envelope. Pleasereturn it within 2 weeks.
If you have any questions, please call the Census BureauCOLLECT at (301) 763-5507.
If the school named on the label is no longer in operation ordoes NOT have an administrator, head, or principal, mark theappropriate box below.
001 1 School no longer in operation
2 School has no administrator
If you marked one of the boxes above, do not complete thisquestionnaire. Please return it to the Bureau of the Census in
the enclosed preaddressed envelope.Thank you for your cooperation.
THIS SURVEY H S BEEN ENDORSED BY
American Montessori Society
Christian Schools International
Council on American Private Education
Evangelical Lutheran Church in America
Friends Council on Education
General Council of Seventh-Day Adventists
Lutheran Church, Missouri Synod
National Association of Episcopal Schools
National Association of Independent Schools
National Catholic Educational Association
U.S. Catholic Conference
OMB No. 1850-0598Approval Expires 12/31/92
This report is authorized by law (20 USC 1221el. Youranswers will be kept strictly confidential. Results from thissurvey will appear in summary or statistical form only, so thatindividuals cannot be identified.
Bureau of the CensusCurrent Projects Branch1201 East Tenth StreetJeffersonville, IN 47132
Please correct any errors in nameand address, including
ZIP Code.
BEST COPY AVAILABLE
391

Dear Principal/Headmaster/Headmistress:
The National Center for Education Statistics (NCES) of the U.S. Department of Educationrequests your participation in the School Administrator Survey for the 1990-91 Schoolsand Staffing Survey. Your school is one of 9,900 public and 3,300 private schools acrossthe Nation selected to be in the sample.
The Schools and Staffing Survey, first conducted in school year 1987-88, is anintegrated set of surveys consisting of the School Survey, the School AdministratorSurvey, and the Teacher Survey. These surveys are being conducted periodically tomeasure critical aspects of teacher supply and demand, the composition of theadministrator and teacher work force, and the general status of teaching and schooling.The purpose of the School Administrator Survey is to obtain information about thetraining, experience, and professional background of school principals.
The U.S. Bureau of the Census is conducting the survey for the National Center forEducation Statistics by the authority of Section 406(b) of the General EducationProvisions Act, as amended (20 USC 1221e). The data will be treated as confidential andwill be reported only in statistical summaries that preclude the identification of anyindividual participating in the surveys.
We are conducting this survey with a sample of schools. While this minimizes overallresponse burden, the value of each individual survey response is greatly increasedbecause it represents many other principals/headmasters/headmistresses. I thereforeencourage you to participate in this voluntary survey by completing this questionnaire andreturning it within 2 weeks to the Bureau of the Census, Current Projects Branch,1201 East Tenth Street, Jeffersonville, IN 47132, in the preaddressed envelopeenclosed for your convenience.
Thank you for your cooperation in this very important effort.
Sincerely,
Emerson J. ElliottActing CommissionerNational Center for Education Statistics
Enclosures
INFORMATION ABOUT YOUR PARTICIPATION
Public reporting burden for this collection of information is estimated to average 20 minutes.Send comments regarding this burden estimate or any other aspect of this collection ofinformation, including suggestions for reducing this burden, to the U.S. Department ofEducation, Information Management and Compliance Division, Washington, DC 20202-4651;and to the Office of Management and Budget, Paperwork Reduction Project 1850-0598,Washington, DC 20503.
Page 2
.392
FORM SASS-2B (11-16-90)
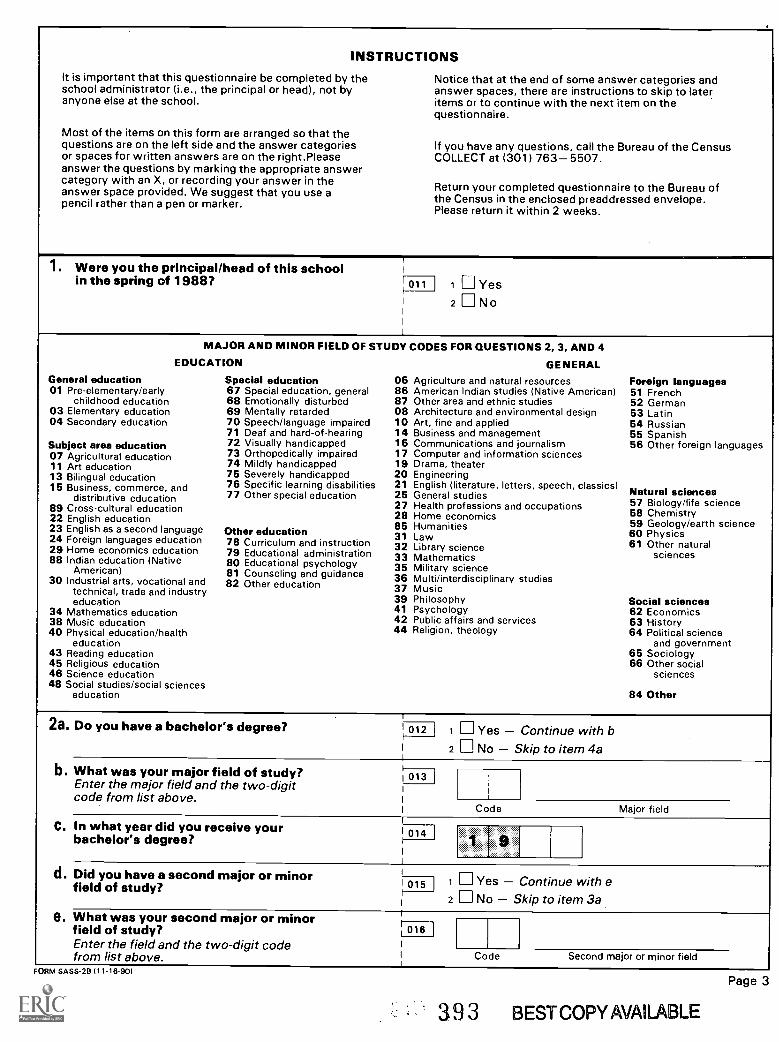
INSTRUCTIONS
It is important that this questionnaire be completed by the Notice that at the end of some answer categories andschool administrator (i.e., the principal or head), not by answer spaces, there are instructions to skip to lateranyone else at the school, items or to continue with the next item on the
questionnaire.
Most of the items on this form are arranged so that thequestions are on the left side and the answer categories If you have any questions, call the Bureau of the Censusor spaces for written answers are on the right.Please COLLECT at (301) 763 -5507.answer the questions by marking the appropriate answercategory with an X, or recording your answer in the
Return your completed questionnaire to the Bureau ofanswer space provided. We suggest that you use a the Census in the enclosed preaddressed envelope.pencil rather than a pen or marker. Please return it within 2 weeks.
1. Were you the principal/head of this schoolYesNo
in the spring of 1988? r oll 1
2
MAJOR AND MINOR FIELD OF STUDY CODES FOR QUESTIONS 2, 3, AND 4
EDUCATION GENERALGeneral education Special education 06 Agriculture and natural resources Foreign languages01 Pre-elementary/early 67 Special education, general 86 American Indian studies (Native American) 51 French
childhood education 68 Emotionally disturbed 87 Other area and ethnic studies 52 German03 Elementary education 69 Mentally retarded 08 Architecture and environmental design 53 Latin04 Secondary education 70 Speech/language impaired 10 Art, fine and applied 54 Russian
71 Deaf and hard-of-hearing 14 Business and management 55 SpanishSubject area education 72 Visually handicapped 16 Communications and journalism 56 Other foreign languages07 Agricultural education 73 Orthopedically impaired 17 Computer and information sciences11 Art 74 Mildly handicapped 19 Drama, theatereducation13 Bilingual education 75 Severely handicapped 20 Engineering
76 Specific learning disabilities 21 English (literature, letters, speech, classics)15 Business, commerce, and Natural sciencesli t diter special education 25 General suesh li ddistributive education 77 O
57 Biology/life science27 Health professions and occupations89 Cross-cultural education 58 Chemistry28 Home economics22 English education 59 Geology/earth science85 Humanities23 English as a second language Other education 31 Law 60 Physics24 Foreign languages education 78 Curriculum and instruction 32 Library science 61 Other natural29 Home economics education 79 Educational administration 33 Mathematics sciences88 Indian education (Native 80 Educational psychology 35 Military scienceAmerican) 81 Counseling and guidance 36 Multi/interdisciplinary studies30 Industrial arts, vocational and 82 Other education 37 Musictechnical, trade and industryeducation 39 Philosophy Social sciences
34 Mathematics education 41 Psychology 62 Economics38 Music education 42 Public affairs and services 63 History40 Physical education/health 44 Religion, theology 64 Political science
education and government43 Reading education 65 Sociology45 Religious education 66 Other social46 Science education sciences48 Social studies/social sciences
education 84 Other
Yes Continue with bNo Skip to item 4a
2a. Do you have a bachelor's degree? 1 012 1
2
b. What was your major field of study? 013Enter the major field and the two-digitcode from list above.
Code Major field
C. In what year did you receive your1 014
1 9bachelor's degree? I
d. Did have Yes Continue with eNo Skip to item 3a
you a second major or minorfield of study? 015 I
1
2
e. What was second majoryour or minorfield of study? 1 016
Enter the field and the two-digit codefrom list above. I Code Second major or minor field
FORM SASS-2B (11-16-901
3 9 3 BEST COPY AVAILABLE
Page 3
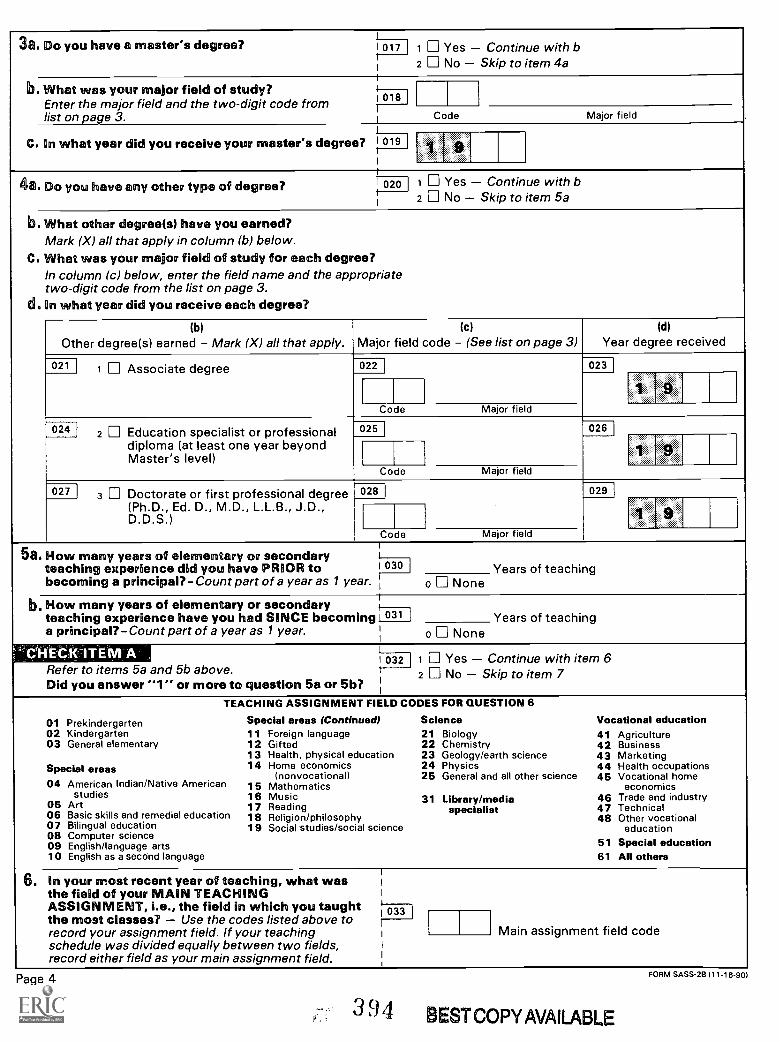
3a. Do you have a master's degree? 1 017 I 1 Yes Continue with bNo Skip to item 4a2
b. fieldWhat was your major of study?Enter field from I 018the major and the two-digit codelist on page 3. Code Major field
C. In what year did you receive your master's degree? 019
4a. Do you have any other type of degree? t 020 I 1 Yes Continue with b2 No Skip to item 5a
b. What other degree(s) have you earned?Mark (X) all that apply in column (b) below.
C. What was your major field of study for each degree?In column (c) below, enter the field name and the appropriatetwo-digit code from the list on page 3.
d. On what year did you receive each degree?
(b)
Other degree(s) earned Mark (X) all that apply.(c)
Major field code (See list on page 3)Id)
Year degree received
0211 Associate degree 022 023
Code Major field
024 2 Education specialist or 025 026professionaldiploma (at least one year beyondMaster's level)
Code Major field
027 3 Doctorate or first professional degree 028 I 029
(Ph.D., Ed. D., M.D., L.L.B., J.D.,D.D.S.) . 9
Code Major field
5a. How many of elementary or secondaryyearsteaching experience did you have PRIOR to 1 030 Years of teachingbecoming a principal?- Count part of a year as 1 year. o None
b. How many years of elementary or secondaryteaching experience have you had SINCE becoming 1 031 I Years of teachinga principal?-Count part of a year as 1 year. o None
CHECK . AITEM 032 I 1 Yes Continue with item 6Refer to items 5a and 5b above. t 2 No Skip to item 7Did you answer "1" or more to question 5a or 5b?
TEACHING ASSIGNMENT FIELD CODES FOR QUESTION 6
01 Prekindergarten Special areas (Continued) Science Vocational education02 Kindergarten 11 Foreign language 21 Biology 41 Agriculture03 General elementary 12 Gifted 22 Chemistry 42 Business
13 Health, physical education 23 Geology/earth science 43 MarketingSpecial areas 14 Home economics 24 Physics 44 Health occupations
Inonvocational) 25 General and all other science 45 Vocational home04 American Indian/Native American 15 Mathematics economics
studies 16 Music05 Art 17 Readin
31 Library/media 46 Trade and industryg Technical
06 Basic skills and remedial education 18 Religionspecialist 47
/philosophy 48TechnOther
vocational07 Bilingual education 19 Social studies/social science education08 Computer science09 English/language arts 51 Special education10 English as a second language 61 All others
6. In your most recent year of teaching, what wasthe field of your MAIN TEACHINGASSIGNMENT, i.e., the field in which you taught 033 1
Main assignment field codethe most classes? Use the codes listed above torecord your assignment field. If your teaching I
schedule was divided equally between two fields,record either field as your main assignment field.
Page 4
3 94 BEST COPY AVAILABLE
FORM SASS -28 (11 -1 8-901

7. What other school positions, if any, did you ihold before you became a principal?
Mark (X) all that apply.
or curriculum coordinator
or program director
clubs, debate teams
034 i 1 Department head
035 1 2 Assistant principal
°36 I 3 Guidance counselor037 4 Athletic coach038
5 Sponsor for student039
6 Other Specify040 0 None
8. Prior to becoming an administrator, did youparticipate in any school training or development i
program for ASPIRING school administrators?
ASPIRING
0411 Yes
2 N o
9. Prior to this school year, how many years haveyou been employed in each of the followingpositions? If less than one year, enter "1." Ifnone, mark the box.
a. As the principal in this school?i
044 Yearso None
b. As the principal in other schools?045
Yearso None
C. In other school administrativei
positions?046 Years
o Noned. In other nonteaching nonadministrative positions
in elementary and secondary education, e.g., aguidance counselor or school psychologist?
047Years
o None
e. In professional positions outside elementaryand secondary education?
048 I Yearso None
10. Aside from college coursework for a degree,have you had any of these types of training foryour current position?
Mark (X) all that apply.
in evaluation and supervision
techniques
internship
049 I 1 Inservice training
050 12 Training in management
051 13 An administrative
052 I o None of the above11a. How long do you plan to remain a principal?
Mark (X) only one box.able
Continue with bfor retirement
unlesscomes along
leave as Skip to item 12a
time
j 053 1 As long as I am
2 Until I am eligible3 Will probably continue
something better4 Definitely plan to
soon as possible5 Undecided at this
b. In how many years do you plan to retire fromyour position as a principal?If less than one year, enter 1.
i 054 Years
12a. What is your current ANNUAL salary for thisposition before taxes and deductions?
Annual salary.001 055 1 $
o Position is unpaid
b. For how many months of the year are youemployed as the administrator in this school? 056 I Months employed
FORM SASS-2B (11 -16 -901
3 9 5 BEST COPY AVAILABLE
Page 5

13. Which Of these benefits do you receive, inwhole or in part, from this school in addition or housing expenses1 057
1 Housingto your salary?
Mark (X) all that apply.058
2 Meals
059 3 Tuition for your children
tuition for yourself0604 College
0615 General medical insurance
insurance06216 Dental
0637 Group life insurance
0648 Car/transportation expenses
065 contributions9 Pension
0660 None of the above
14. For each of the following matters, indicatewhether it is a serious problem, a moderateproblem, a minor problem, or not a problemin this school.
Mark (X) one box on each line.
I Not aSerious Moderate Minor problem
067
a. Teacher absenteeism I a. 1 2 3 4
068
b. Student tardiness I b. 1 2 3 4
069C. Student absenteeism I c. 1 2 3 4
070
d. Students cutting class d. 1 2 3 4
071
e. Students dropping out Ie. 1 2 3 4
072f. Student apathy I f. 1 2 3 4
0739. Physical conflicts among students g. 1 2 3 4
074h. Robbery or theft i h. 1 2 3 4
075i. Vandalism of school property I i. 1 2 3 4
076j. Student pregnancy i j. 1 2 3 4
077k. Student use of alcohol k.
1 2 3 4
I Student drug abuse I.078
1 2 3 4
M. Student possession of weapons i m.079
1 2 3 4
080R. Student disrespect for teachers n. 1 2 3 4
-4
0. Physical abuse of teachers i o. 0811 2 3 4
Page 6
396
FORM SASS-28111-16-90)

14. ContinuedFor each of the following matters, indicatewhether it is a serious problem, a moderateproblem, a minor problem, or not a problemin this school.
p. Verbal abuse of teachers
Mark (X) one box on each line.
Serious Moderate Minor Not aproblem
P.082
2 41 3
q. Lack of academic challenge q.083
2 41 3
r. Lack of parent involvement r.084
2 41 3
S. Parental alcoholism and/or drug abuse s.085
2 41 3
t. Poverty t. 0862 3 41
U. Racial tension u. 0872 41 3
V. Cultural conflict 0882 41 3
15. Using the scale 1 -6, where 1 is "None" and 6 is"A great deal," indicate how much ACTUALinfluence you think each group or person has ondecisions concerning the following activities.
a. Establishing curriculum
(1) Governing board BRDCURRC
None
Mark (X) the appropriate box on each line.A
2 3 4 5
greatdeal
6101 1
(2) Principal/Head PRNCURRC102
2 III 3 4 5 61
(3) Teachers TEACURRC 1 3El 2 3 4 5 6i
LIBCURRC(4) Librarians/Media specialists1 104
2 3 4 5 6I 1
PARCURRC(5) Parent association 1052 3 4 5 61
b. Hiring new full-time teachers
(1) Governing board BRDHIRNG 2 3 4 5 6i 106 1
(2) Principal/Head PRNHIRNG 1072 3 4 5 61
TEAHIRNG(3) Teachers
1 1082 3 4 61
(4) Parent association PARHIRNG 1092 3 4 5 61
C. Setting discipline policy
(1) Governing board BRDDISPL 2 3 4 5 6111 i
PRNDISPL(2) Principal/Head 1122 3 4 5 61
(3) Teachers TEADISPL 1132 3 4 5 61
PARDISPL(4) Parent association y 114
2 3 4 111 5 6I 1
FORM SASS-2B (11-16-90S
397Page 7

1
16. We are interested in the importance you place onvarious educational goals. From the followingeight goals, which do you consider the mostimportant, the second most important, and thethird most important?1 - Building basic literacy skills (reading, math,
writing, speaking)2 - Encouraging academic excellence3 - Promoting occupational or vocational skills4 Promoting good work habits and self-
discipline5 - Promoting personal growth (self-esteem,
self-knowledge, etc.)6 - Promoting human relations skills7 - Promoting specific moral values8- Fostering religious or spiritual development
Most important
most important
most important
115
Second116 1
Third117
17. On a scale from 1 to 5, where 1 is "Poor" and 5is "Excellent," how would you rate the quality ofthe following?
a. Your teaching staff in general, that is, allteachers in this school?
I Poor I.- Excellent
2 3 4 5i 118 1
b. Experienced teachers, that is, those with morethan 3 years of teaching experience? experienced
2 3 4 5i 119 1
o teachersNo
C. New teachers, that is, those with 3 orless years of teaching experience? new
2 3 4 5i 120 1
o No teachers
18. Are you male or female? Male1 121 1
2 Female
19a. What is your race?
Mark (X) only one box.
American Indian, Alaskan Native (Aleut, AlaskanYupik, Inupiat) Continue with b
or Pacific Islander (Japanese,Filipino, Korean, Asian Indian,
Hawaiian, Guamanian, Skip toother Asian) item 20
i 122 1
i 2
3
4
Indian,AsianChinese,Vietnamese,Samoan,BlackWhite
b. Are you enrolled in a state or federallyrecognized tribe?
Yesi 123 1
I 21_
No
20. Are you of Hispanic origin? Yes124 I 1
2 II No
21. What is your year of birth? i 125
22. Please give your name, telephone number, andthe most convenient days/times to reachyou.This information will be used only if it isnecessary to clarify any of your responses.
Name (Please pr'nt)
Telephone number (Include area code)Area code
INumber
I
I
Day(s) and time(s) it would be convenient to contact you, if necessary
This completes the questionnaire. Thank you for assisting us in this important research.Your time and effort are appreciated.
Page 8
393
. FORM SASS-28 111-16-90)
Appendix F F-37
Public School Questionnaire (SASS 3A)
399

FORM SASS-3A111-16-90) U.S. DEPARTMENT OF COMMERCE
BUREAU OF THE CENSUSACTING AS COLLECTING AGENT FOR
U.S. DEPARTMENT OF EDUCATIONNATIONAL CENTER FOR EDUCATION STATISTICS
SCHOOLS AND STAFFING SURVEYPUBLIC SCHOOL QUESTIONNAIRE
1990-1991
OMB No. 1850-0598Approval Expires 12/31/92
This report is authorized by law 120 USC 1221e). Your answerswill be kept strictly confidential. Results from this survey willappear in summary or statistical form only, so that individualscannot be identified.
Bureau of the CensusCurrent Projects Branch1201 East Tenth StreetJeffersonville, IN 47132
Please complete this questionnaire with information about theSCHOOL named on the label and return it to the Bureau of theCensus in the enclosed preaddressed envelope. Please returnit within 3 weeks.
If the school's name or level is different from that indicated onthe label, please call the Census Bureau collect at (301)763-5507.
If you have any other questions, you can call the CensusBureau collect.
If the school named on the label is no longer in operation,mark the box below and return this questionnaire to theCensus Bureau in the enclosed envelope.
001 1 School no longer in operationOPERATE
THIS SURVEY HAS BEEN ENDORSED BY
American Association for Counseling and Development
American Association of School Administrators
American Federation of Teachers
Council of Chief State School Officers
National Association of Elementary School Principals
National Association of Secondary School Principals
National Education Association
Please correct any errors in nameand address, including
ZIP Code.
400

Dear Principal:
The National Center for Education Statistics (NCES) of the U.S. Department of Educationrequests your participation in the School Survey for the 1990-91 Schools and StaffingSurvey. Your school is one of 9,900 public and 3,300 private schools across the Nationselected to be in the sample.
The Schools and Staffing Survey, first conducted in school year 1987-88, is an integratedset of surveys consisting of the Teacher Demand and Shortage Survey, the School Survey, theSchool Administrator Survey, and the Teacher Survey. These surveys are being conductedperiodically to measure critical aspects of teacher supply and demand, the composition of theadministrator and teacher work force, and the-general status of teaching and schooling. Thepurpose of the School Survey is to obtain information about schools such as staff-pupil ratio,student characteristics, staffing patterns, and teacher turnover.
The U.S. Bureau of the Census is conducting the survey for the National Center for EducationStatistics by the authority of Section 406(b) of the General Education Provisions Act, asamended (20 USC 1221e). The data will be treated as confidential and will be reported only instatistical summaries that preclude the identification of any individual participating in thesurveys.
We are conducting this survey with a sample of schools. While this minimizes overall responseburden, the value of each individual survey response is greatly increased because it representsmany other schools. I, therefore, encourage you to participate in this voluntary survey bycompleting this questionnaire and returning it within 3 weeks to the Bureau of the Census,Current Projects Branch, 1201 East Tenth Street, Jeffersonville, IN 47132, in thepreaddressed envelope enclosed for your convenience.
Thank you for your cooperation in this very important effort.
Sincerely,
Emerson J. ElliottActing CommissionerNational Center for Education Statistics
Enclosures
INFORMATION ABOUT YOUR PARTICIPATION
Public reporting burden for this collection of information is estimated to average one hour perresponse, including the time for reviewing instructions, gathering the data needed, andcompleting and reviewing the collection of information. Send comments regarding this burdenestimate or any other aspect of this collection of information, including suggestions forreducing this burden, to the U.S. Department of Education, Information Management andCompliance Division, Washington, DC 20202-4651; and to the Office of Management andBudget, Paperwork Reduction Project 1850-0598, Washington, DC 20503.
Page 2
401
FORM SASS-3A 111 -16 -901

DRISTRUCTOONSMost of the items on this questionnaire are arranged sothat the questions are on the left side of the page andthe answer categories or spaces for written answersare on the right. Please answer the questions bymarking the appropriate answer category with an X, orrecording your answer in the space provided. Wesuggest that you use a pencil or a typewriter, ratherthan a pen or marker.
Notice that at the end of some answer categories andanswer spaces, there are instructions to skip to a lateritem or to continue with the next item on thequestionnaire.
Unless otherwise indicated, all questions refer to the1990-91 school year.
If you are unsure about how to answer a question,give the best answer you can and make a commentin the "Remarks" space. Please include the itemnumber.
If you have any questions, call the Bureau of the CensusCOLLECT at (301) 763-5507.
Return your completed questionnaire to the Bureau of theCensus in the enclosed preaddressed envelope. Pleasereturn it within 3 weeks.
a. Please give your name, title, telephone number,and the most convenient days/times to reach you.This information will be used only if it isnecessary to clarify any of your responses.
Name
Title
Telephone number (Include area code)Area code i Number
Convenient days/times to reach you, if necessary
b. Does this school serve students in ANYof grades 1 through 12 or comparableungraded levels?
oil]SCRE&VB
1 Yes Continue with item 1 on next page2 No Stop now and return this questionnaire
to the Bureau of the Census in theenclosed envelope
Thank you for your time.
Remarks Please use this space for any explanations that may be essential in understanding your reported data.Please include item number.
BESTCOPYAVAILABLE
FORM SASS-3A 111-16-90)
402
Page 3

SECTION 1 SCHOOL CHARACTERISTICS
. How many students (in head counts) wereenrolled in THIS SCHOOL in grades K-12or comparable ungraded levels
Include only students enrolled in the school namedon the questionnaire label. Do NOT includeprekindergarten or postsecondary students.
a. On or about October 1 of THIS SCHOOL YEAR?illSYEAR
012 Students
b. On or about October 1 of LAST SCHOOL YEAR? 1013iLAW
1
StudentsYEAR
io 0 School not operating in Fall 1989
2. What is the level of this school?
Mark (X) only one box.sair--EvEL
! 0141 Elementary2 Middle school/junior high3 Secondary4 Combined elementary and secondary
3. What type of school is this?PGAITYPE
Mark (X) only one box.
015 1 REGULAR elementary or secondary
3 Elementary or secondary with a SPECIALPROGRAM EMPHASIS e.g., science/mathschool, performing arts high school,talented/gifted school, foreign languageimmersion school, etc.
4 SPECIAL EDUCATION serves primarilyhandicapped students
5 VOCATIONAL/TECHNICAL serves primarilystudents being trained for occupations
6 ALTERNATIVE offers a curriculum designed toprovide alternative or nontraditional education;does not specifically fall into regular, specialeducation, or vocational school
4. What percent of K-12 studentsenrolled in this school are male?Do NOT include prekindergarten or postsecondarystudents. Record the percent in whole numbers, nottenths; do not enter a decimal point. PCIMALE
016 %,
5. Which of these best describes the communityin which this school is located?Mark (X) only one box.
LOCALE
1 0171
I
1 Large Central City2 Mid-size Central City3 Urban fringe of Large City
4 Urban fringe of Mid-size City
5 Large town6 Small town7 Rural
6. How many days are in the school yearfor students in this school?
-_
0 8 Days
Paae 4 FORM SASS-3A 111-16-90)

Ot SECTION 1 SCHOOL CHARACTERISTICS Continued
7. How long is the school day for most students 1
in this school? 1
Report BOTH hours and minutes, e.g., "6" hoursand "0" minutes, "5" hours and "45" minutes,etc. If the length of day varies by grade level,record the longest day.
ianwiwArrE
1
019 I HoursNUMHOURS
1
1 ANI
I 0201 Minutes
8. How many K-12 students were absent themost recent school day?
Include both excused and unexcusedabsences. Do NOT include prekindergarten 1
A
or postsecondary students. 1
I
1
1 021 1 StudentsBSNTST
o None
1
9. How many K-12 students in this school areDo NOT include prekindergarten orpostsecondary students.
AMINDS7'Ua. American Indian or Alaskan Native?
0221 Studentso None
b. Asian or Pacific Islander? 1
r
023 Studentso None
1
C. Hispanic, regardless of race?(Mexican, Puerto Rican, Cuban, Central or SouthAmerican, or other Hispanic culture or origin) HISPNSTU
1 024 Students1
o None1
1
d. Black (not of Hispanic origin)?BLACKSTU
1 025 StudentsI o None
e. White (not of Hispanic origin)?WHI773STU
I
! 0261 Studentso None
Remarks Please use this space for any explanations that may be essential in understanding your reported data.Please include item number.
FORM SASS-3A (11-16-90)
404Page 5

SECTION 1 - SCHOOL CHARACTERISTICS -:- Continued
10. For each of the following programs or services,please indicate whether it is available to studentsin this school, either during or outside of regularschool hours, and regardless of funding source.
Do not include prekindergarten orpostsecondary students.
a. English as a second language students withlimited English proficiency are provided withintensive instruction in English.
ESOLPGM ESOLNUM
0271 Yes- How many students 028
participate in this program? --2 No
b. Bilingual education - native language is usedto varying degrees in instructing students withlimited English proficiency.For example, transitional bilingual education andstructured immersion
BILNGPGM BILNGNUM
1 0291 Yes- How many students 030
participate in this program? 0.I 2 No
C. Remedial reading organized compensatory,diagnostic, and remedial activities designed tocorrect and prevent difficulties in thedevelopment of reading skills.
READPGM READIVUM
1 031 1 Yes- How many students 10321
1
participate in this program? -i 2 No
d. Remedial mathematics - organizedcompensatory, diagnostic, and remedial activities]designed to correct and prevent difficulties in thedevelopment of mathematics skills.
MATHPGM MATIINUM
033i 1 Yes- How many students 034i participate in this program?
2 No
e. Programs for handicapped students -instruction for the mentally retarded, specificlearning disabled, physically handicapped, andother handicapped students.
SPECLPGM SPCLNUM
0351 Yes- How many students 036
participate in this program? --I 2 No
f. Programs for the gifted and talented -activities designed to permit gifted and talentedstudents to further develop their abilities.
GIFTDPGM GIFTDNUM
i 0371 Yes- How many students. 038
I participate in this program? --No2
g. Diagnostic and prescriptive services servicesprovided by trained professionals to diagnoselearning problems of students and to plan andprovide therapeutic or educational programsbased upon such services.
I DIAGNPGM DIAGNNUM
i 039 0401 Yes- How many studentsI
received this service? 0.I 2 No
h. Extended day or before- or after-schoolday-care programs.
ERPGM AFIERNUMAFT
i 0411 1 Yes- How many students 042participate in this program? 1'.
2 No
11a. Does this school offer a PREKINDERGARTENprogram, i.e., a program for students in the yearimmediately before kindergarten?
PKOFPER1--- .- 1"3 1 Yes Continue with b1
2 No Skip to item 12a
b. How many days per week is prekindergartenoffered at this school?
I
PKNUMDAY
10-4-4j1--- Days per weeki PKLENDAY
C. How long is the school day for theprekindergarten program?
Mark (X) only one box.
Ir "51 1 Half dayI
1
1 2 Full day
3 Both offered1
Page 6
4 05
FORM SASS-3A (11-16-90)
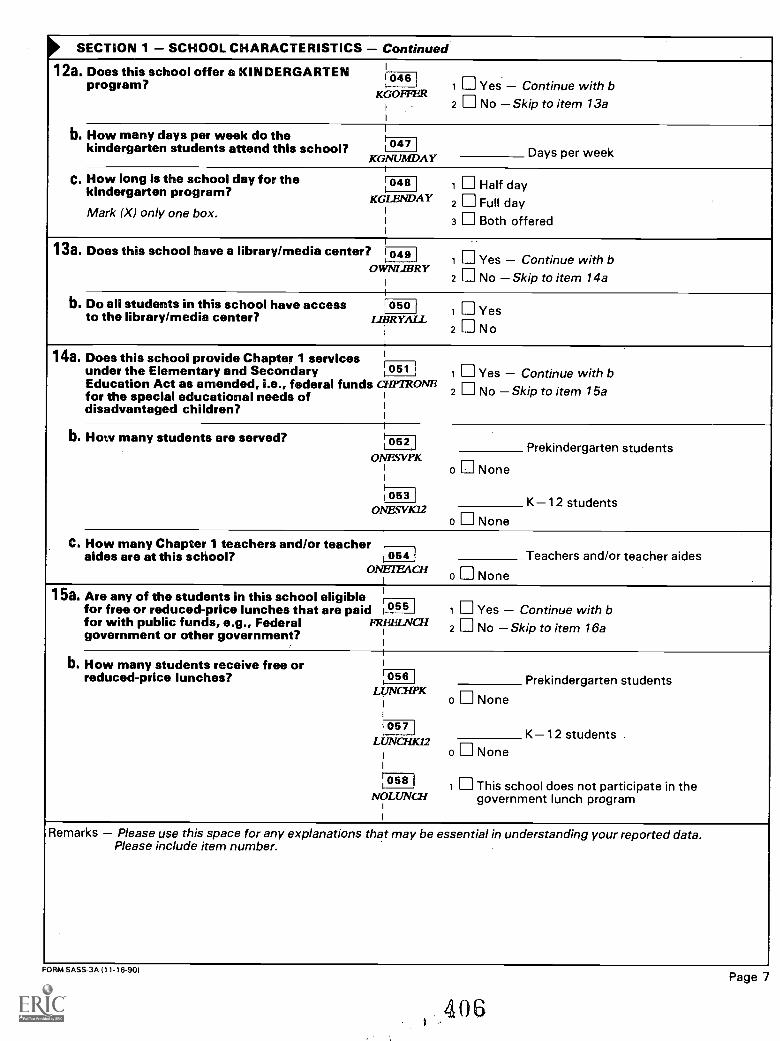
SECTION 1 SCHOOL CHARACTERISTICS ContinuedI12a. Does this school offer a KINDERGARTEN 1046program? 1 Yes Continue with b
3RIC,OFF7I
2 No Skip to item 13a1
b. How many days per week do the I
kindergarten students attend this school? 1 047Days per weekKGNUMDAY
I
C. How long is the school day for the1048 1 Half daykindergarten program?
KGLENDAY 2 Full dayMark (X) only one box. 1
I 3 Both offered1
1
13a. Does this school have a library/media center? 10491 Yes Continue with b
OWIVLIBRYI
2 No Skip to item 14a1
b. Do all students in this school have access 1 0501 Yesto the library/media center? LIBRYALL
1
2 N oi
14a. Does this school provide Chapter 1 services li
under the Elementary and Secondary 0511 Yes Continue with b
Education Act as amended, i.e., federal funds CHPFRONEfor the special educational needs of I
2 No Skip to item 15adisadvantaged children? 1
1
1
b. How many students are served? 052 Prekindergarten studentsOIVESVPK
I 0 II None1
I 053 K 12 studentsONESVKI2
I o None1
C. How many Chapter 1 teachers and/or teacher 1
aides are at this school? 1 054 Teachers and/or teacher aidesOIVETEACH
1
o None
15a. Are any of the students in this school eligible ir
for free or reduced-price lunches that are paid 1055 I 1 Yes Continue with bfor with public funds, e.g., Federal FREELNCHgovernment or other government?
1
I2 No Skip to item 16a
1
b. How many students receive free or I
reduced-price lunches? 1 056 I Prekindergarten studentsLUNGIPK
o None1
1057K -12 studentsLinvalia2
1o None
1
li 05811 This school does not in theparticipate
NOLUNGI government lunch program1
1
Remarks Please use this space for any explanations that may be essential in understanding your reported data.Please include item number.
FORM SASS-3A (11-16-90)
406Page 7
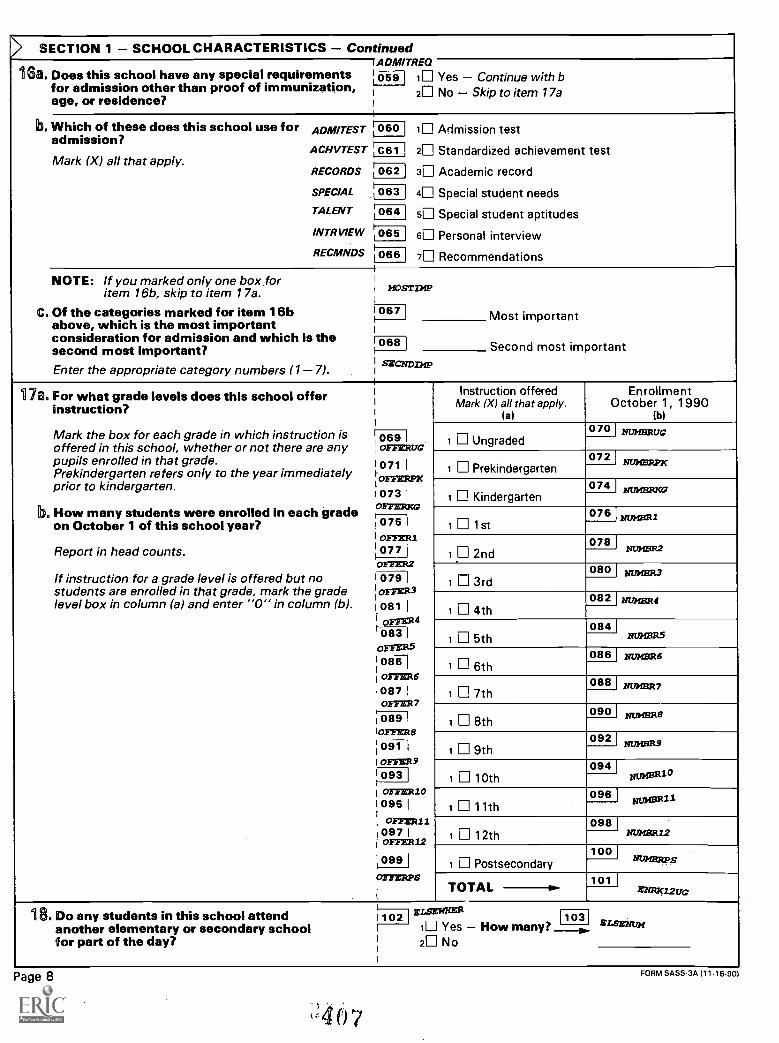
SECTION 1 SCHOOL CHARACTERISTICS ContinuedADMITREQ
18a. Does this school have any special requirements,
for admission other than proof of immunization,age, or residence?
Yes Continue with bNo Skip to item 17a
059 I illzb. Which of these does this school use for ADMITEST
admission?ACHVTEST
Mark (X) all that apply.RECORDS
SPECIAL
TALENT
INTRVIEW
RECMNDS
Admission test
Standardized achievement test
Academic record
Special student needs
Special student aptitudes
Personal interview
Recommendations
060 i061 z062 I 3063 4064 I 5065 6066 7
NOTE: If you marked only one box foritem 16b, skip to item 17a.
C. Of the categories marked for item 16babove, which is the most importantconsideration for admission and which is thesecond most important?Enter the appropriate category numbers (1 7).
MONT I:HP
Most important067
Second most important068
SECND.13fP
117a. For what grade levels does this school offerinstruction?
Mark the box for each grade in which instruction isoffered in this school, whether or not there are anypupils enrolled in that grade.Prekindergarten refers only to the year immediatelyprior to kindergarten.
b. How many students were enrolled in each gradeon October 1 of this school year?
Report in head counts.
If instruction for a grade level is offered but nostudents are enrolled in that grade, mark the gradelevel box in column (a) and enter "0" in column (b).
Instruction offeredMark (X) all that apply.
la)
EnrollmentOctober 1, 1990
(b)
1 Ungraded070 NUMBRUG069
OFFERUG
I 071 I
lI 073 IOFFERKG
1 Prekindergarten072 NMI:ERRE
1 Kindergarten074 zamsztxar
1 1st076 NUMBR1107 5
I OFFER110771OFFERS
1 2nd078
NUMBR2
1 3rd080 NumBR3
I 079 I1 OFFER31
I 081 IrOFPIER4; alTIoFFER508-11027E326
1087 IOFFER7
1 4th082 mairal4
1 5th084 I
liumnR5
086 NumBR61 6th
088 NUMER7i 7th
1 8th090 I Num3R8
I 0891OFFER8
1 9th092 I NUMBR90-97-11
1 OFFER9
1 10th0941I 093 trumBRio
I OFFER10I 0951FOFFER11
1097 I1
OFEER12
I 099
1 11th0961
NUMBR11
1 12th0981
NU1 BR12
Postsecondary100 I
1 GPsOFFH:RPs
TOTAL 101 iENRK22UG
i 8. Do any students in this school attendanother elementary or secondary schoolfor part of the day?
102 ELSEVIDER 103 /marmot1 LI Yes How many?2M No
Page 8
0 7
FORM SASS-3A (11-16-90)

SECTION 1 SCHOOL CHARACTERISTICS Continued19. Does THIS school (the school named on the
questionnaire label) provide instruction for ;
1grade 12?1
TWELFTH104 I 1 Yes Continue with item 20a
2 No Skip to the note above item 24iFor items 20a -22b, students may be enrolled in1
more than one program.
20a. Does this school offer a college preparatory1program?1
I
COLLPREP
1-
1051 Yes Continue with b2 No Skip to item 21a
b. How many students in grades 10-12 IPREPNUMare enrolled in this program?
1
1
1
1
1061
Studentso -None
218. Does this school offer a VOCTECH 1107vocational/technical program?1
1
1 Yes Continue with b2 No Skip to item 22a
1b. How many students in grades 10-12TECHNUM11108are enrolled in this program?
1
I
Students1
o None1
I22a. Does this school offer a general program forstudents who do not plan to attend college?
GENERAL
111091 Yes Continue with b2 No Skip to item 23a
1
b. How many students in grades 10-12are enrolled in this program? GENLNUM 110 Students
o None
23a. LAST SCHOOL YEAR, how many studentswere enrolled in 12th grade?
1
IENROL121111 1 Students Continue with b
1 o No 12th graders in 1989-90 Skip to the note1
above item 241
b. How many students were graduated from the12th grade last year? Include 1990 summergraduates.
:GRADNUM11121 Students Continue with c1
1o None Skip to the note above item 24
C. How many of last year's graduates appliedto two- or four-year colleges? 1
GRADAPLY1 113
Graduates1
o None1
Remarks Please use this space for any explanations that may be essential in understanding your reported data.Please include item number.
FORM SASS-3A 11 1-1 6-30)
408Page 9

SECTION 2 STAFFING PATTERNS
NOTE: For items 24 -30, report the number ofteachers for grades K 12 and comparableungraded levels only. Do not includeteachers who teach ONLY prekindergartenor postsecondary students.Report in head counts, not FTEs.
24a. How many K-12 teachers have FULL-TIMEteaching positions at THIS school?
FULTEACH
Full-time teachers1141
o None
b. How many K-12 teachers have PART-TIME 1
teaching positions at THIS school? Includeitinerant teachers. I
PARTEACHPart-time teachers
1
1115
I o None
C. What is the total number of K-12 teachersat this school?Total must equal 24a + 24b.
1 TOTTEACH
Total teachers1116
I
25. How many K-12 teachers in this school areInclude both full- and part-time teachers.
a. merican Indian orI
laskan Native?
1
1
I AHINDTCHTeachers1 117
1 o None
b. Asian or Pacific Islander? 11181 ASIANTCH
Teachers1
I o None
C. Hispanic, regardless of race?(Mexican, Puerto Rican, Cuban, Central or SouthAmerican, or other Hispanic culture or origin)
I
I
HISPNTCH Teachers1 1191
1
o None
d. Black (not of Hispanic origin)?1
BLACKTCH Teachers120i
1
1
o None
e. White (not of Hispanic origin)?1
WHITETCH Teachers1121I
1
to None
26. How many K-12 teachers were absent the mostrecent school day?Include both full- and part-time teachers.
II
ABSNTCHTeachers1122
1
o None
27. How many K-12 teachers have a degree beyondthe bachelor's degree?Include both full- and part-time teachers.
AETERBAC Teachers123
o None
28. How many K-12 teachers have taught for eachof the following periods of time? Include years ofteaching at this school and at any other elementaryor secondary school either public or private,part-time or full-time. Include this school year.
Include both full- and part-time teachers.
a. Less than 3 years
1 LESS3EXP
Teachersi 124
i o None
b. 3-9 years LESS10EX
rTeachers125i
o None
C. 10-20 years LESS2LEX Teachers126
0 None
d. More than 20 yearsnoltExp21
NOTE: Sum of a-d must equal the entry in item 24c.Teachersi127I
i o None
Page 10
4BEST COPY AVAILABLE
FORM SASS-3A (11-16-90)

SECTION 2 STAFFING PATTERNS Continued129a. How many K-12 teachers are NEW to this i
school this year? Include teachers who taught I
in this school in previous years but were not I
here last year.
Include both full- and part-time teachers. I
NEWIEACH1128
I New teachers Continue with bo None Skip to item 30a
b. Of those K-12 teachers who are new to thisschool (item 29a above), how many have theirmain teaching assignment in each of the IEZEAINEWfollowing fields?
I
1(1) General elementary
129 I1 Teachers
1 o None
(2) Special educationSPCLNEW130 Teachers
o None
(3) EnglishENGLNEW131 Teachers
o None1
(4) Mathematics1
I MATIEVEW1
1132 ( Teachers1
o None1
(5) Physical sciences
1
I PHYSNEW
i 133 Teachersi
1 o None
(6) Biology or life sciencesBIOSNEW134 I Teachers
o None
(7) English as a second language (ESL)
1
ESOLNEWI 135 TeachersI-I
o None1
(8) Bilingual education
1
BLNGNEW136 Teachers
o None
(9) Foreign language
1
LANG1VEW
i 137 Teachers1
1 o None
(10) Vocational or technical educationTECIEVEW138
Teachers
o None
(11) Other SpecifyOTHERNEW
1391 Teachers
NOTE: Sum of (1)-(11) must equal theentry in item 29a above.
o None
FORM SASS-3A (11-1640)
41 CI BEST COPY AVAILABLE
Page 11
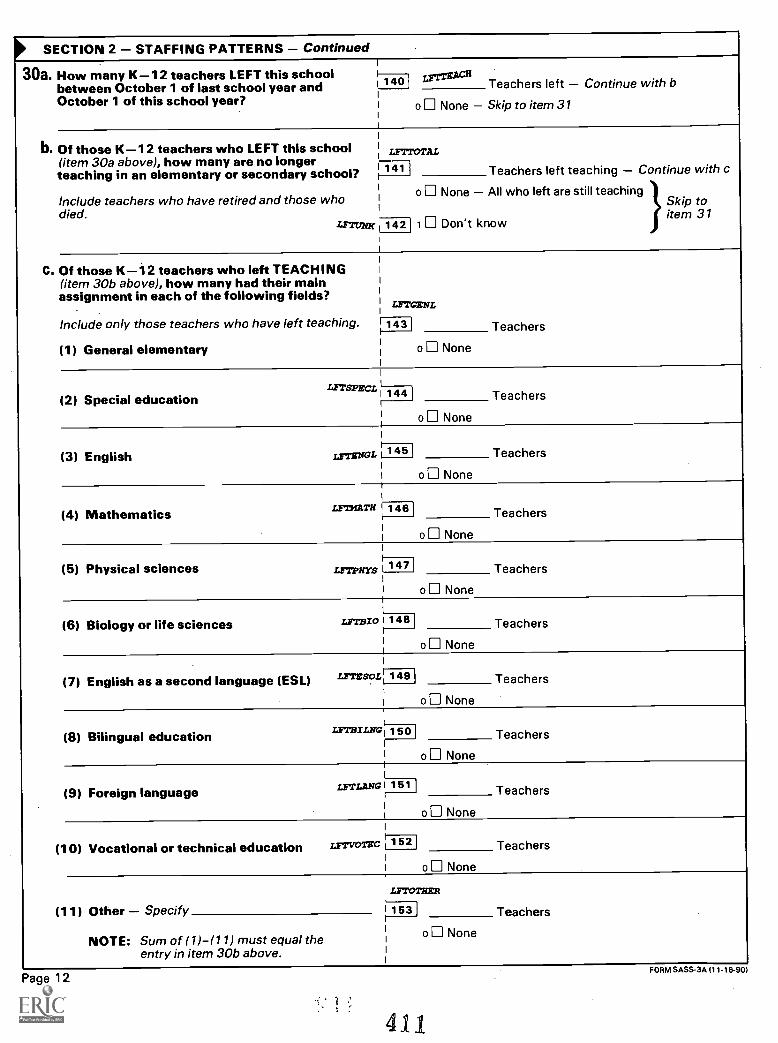
SECTION 2 STAFFING PATTERNS Continued
30a. How many K-12 teachers LEFT this school 1
between October 1 of last school year andOctober 1 of this school year?
IrrTgAcm Teachers left Continue with b1 a o
o None Skip to item 31
b. Of those K-12 teachers who LEFT this school(item 30a above), how many are no longerteaching in an elementary or secondary school?
Include teachers who have retired and those whodied.
LETONE
LETTOTAL
Teachers left teaching Continue with c141
o None All who left are still teachingSkip to
Don't knowitem 31
142 1
C. Of those K-12 teachers who left TEACHING(item 30b above), how many had their mainassignment in each of the following fields?
Include only those teachers who have left teaching.
(1) General elementary
LFTGENL
Teachers143
o None
LETSPECL
(2) Special education Teachers1 44 1
o None
(3) English
1
TeachersI145 I
o None
(4) Mathematics LETS Teachers146
o None
(5) Physical sciences zrrpzirs Teachers1 147
o None
(6) Biology or life sciences zamixo Teachers1 148 I
o None
(7) English as a second language (ESL) ISTESOL Teachers149
o None
(8) Bilingual education LF173ILNG Teachers150
o None
(9) Foreign language LFELA NGL
Teachers151 I
o None
(10) Vocational or technical education LETVOTEC Teachersi152 1
o None
(11) Other Specify
LETOTKER
Teachers153 Ir
NOTE: Sum of (1)-(11) must equal the o
entry in item 30b above.
None
Page 12
411
FORM SASS-3A (11-16-90)

11 SECTION 2 STAFFING PATTERNS Continued
31. How many employees hold full- or part-timepositions in this school in each of thefollowing categories?
If an employee holds a position in more than one ofthe categories, count that person as part-time ineach category that applies.
a. Principal(s)
FULL-TIME PART-TIME
FTHEADSPTHEADS
15411551
0 None o None
b. Assistant principal(s)FTASSIST FTASSIST
156 1571
0 None o None
C. Guidance counselorsFIVUIDES P7UUIDES
1581 159
0 None o None
d. Vocational counselorsF7V7rOUN PTVTCOUN
i 1601 1611
0 None o None
e. Librarians and other professional media staffFTLIBRNS PTLII3RNS162 1631
0 None o None
f. Other professional staff such as curriculumspecialists, administrative and business staff,social workers, and health professionals
F7PRO5TF PTPROSTF164 1651
o None o None
9. Classroom teacher aides (paraprofessionalswho assist classroom teachers)
FTAIDES PTAIDES166 1671
o None o None
h. Library or media center aidesFlMEDIA PTMEDIAi 168 169
0 None o None
I. All other noninstructional staff (includemaintenance, food service, and clerical staff)
FTALLOTH PTALLOTHi 1701 171
o None o None
32a. Do any UNPAID VOLUNTEERS provide servicesfor this school? Do not include students from thisschool as unpaid volunteers.
VOLNTSVC
b1721 1 Yes Continue with2 No Skip to item 33a
b. How many unpaid volunteers provide services atthis school on a CONTINUING OR SCHEDULEDBASIS this school year?
VOLN7NUM1731
Unpaid volunteerso None
Remarks Please use this space for any explanations that may be essential in understanding your reported data.Please include item number.
BEST COPY AVAILABLE
FORM SASS-3A (11-16-90)
4.12Page 13
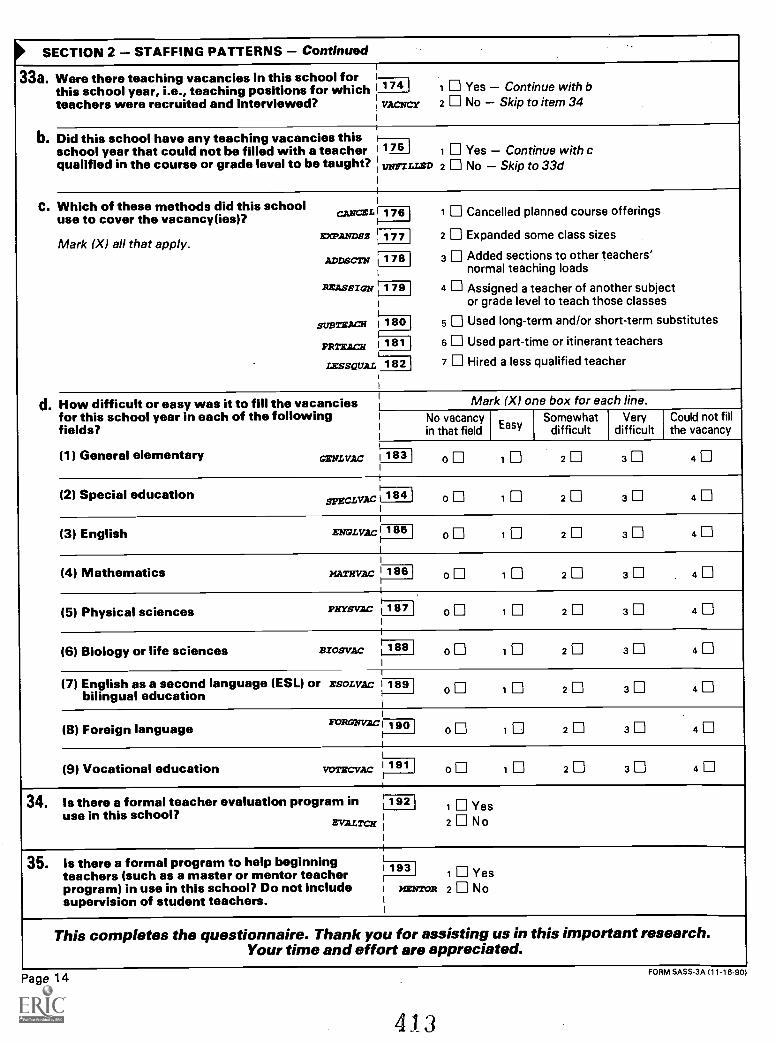
SECTION 2 STAFFING PATTERNS Continued1
33a. Were there teaching vacancies in this school for 1
this school year, i.e., teaching positions for which Iteachers were recruited and interviewed? 1
I
Continue with bSkip to item 34
114 I 1 Yestram= 2 No
b. Did this school have any teaching vacancies thisschool year that could not be filled with a teacher I
qualified in the course or grade level to be taught?Continue with c
Skip to 33d178 I 1 Yes
i uzirrLLED 2 No
C. Which of these methods did this schooluse to cover the vacancy(ies)? CANCEL
Mark (X) all that aEXPAND=
pply.ADDBCTN
REASSIGN
suB2TAcif
PRTEACH
LESSQUAL
planned course offerings
some class sizes
sections to other teachers'teaching loads
a teacher of another subjectlevel to teach those classes
long-term and/or short-term substitutes
part-time or itinerant teachers
a less qualified teacher
176 I 1 Cancelled
L177 2 Expanded
178 I 3 Addednormal
179 I 4 AssignedI or grade
1 180 5 Used
1 181 6 Used
182 7 Hired
1
d. How difficult or easy was it to fill the vacanciesfor this school year in each of the followingfields?
(1) General elementary GENLVAC
Mark (X) one box for each line.No vacancyin that field Easy
Somewhatdifficult
Verydifficult
Could not fillthe vacancy
183 I o 1 2 3 4
(2) Special educationSPECLVAC
t
I 184 o 1 2 3 4I
(3) EnglishI
18510 1 2 3 4
(4) Mathematics HATHvAc i 1861 o 1 2 3 4
(5) Physical sciences PHYSVAC 1 187 0 1 2 3 4
(6) Biology or life sciences BIOSVAC i 1881 0 1 2 3 4
(7) English as a second language (ESL) or EsoLv Acbilingual education
1 189 10 1 2 3 4
(8) Foreign languageFO RONVAC
2790I o 1 3 4 1
(9) Vocational education VOTECVAC 1911 o 1 2 3 4
34. Is there a formal teacher evaluation program inuse in this school?
EVALTCH
i 19211 Yes2 No
1
35. Is there a formal program to help beginningteachers (such as a master or mentor teacherprogram) in use in this school? Do not includesupervision of student teachers.
i 19311 Yes
I rarwroR 2 No
This completes the questionnaire. Thank you for assisting us in this important research.Your time and effort are appreciated.
Page 14
413
FORM SASS-3A 111-16-901
Remarks Please use this space for any explanations that may be essential in understanding your reported data.Please include item number.
FORM SASS-3A (11-16-90)
414
Page 15

Appendix F F-53
Private School Questionnaire (SASS 3B)
415

FORM SASS-3B112 4 90)
U.S. DEPARTMENT OF COMMERCEBUREAU OF THE CENSUS
ACTING AS COLLECTING AGENT FORU.S. DEPARTMENT OF EDUCATION
NATIONAL CENTER FOR EDUCATION STATISTICS
SCHOOLS AND STAFFING SURVEYPRIVATE SCHOOL QUESTIONNAIRE
1990-1991
Please complete this questionnaire with information about theschool named on the label and return it to the Bureau of theCensus in the enclosed preaddressed envelope. Please returnit within 3 weeks.
If you have any questions, please call the Census BureauCOLLECT at (301) 763-5507.
If the school named on the label is no longer in operation,mark the box below and return this questionnaire to theCensus Bureau in the enclosed envelope.
001
OPERATE
School no longer in operation
THIS SURVEY HAS BEEN ENDORSED BY
American Montessori Society
Christian Schools International
Council on American Private Education
Evangelical Lutheran Church in America
Friends Council on Education
General Council of Seventh-Day Adventists
Lutheran Church Missouri Synod
National Association of Episcopal Schools
National Association of Independent Schools
National Catholic Educational Association
U.S. Catholic Conference
OMB No. 1850-0598Approval Expires 12/31/92
This report is authorized by law 120 USC 1221e). Youranswers will be kept strictly confidential. Results from thissurvey will appear in summary or statistical form only, so thatindividuals cannot be identified.
Bureau of the CensusCurrent Projects Branch1201 East Tenth StreetJeffersonville, IN 47132
Please correct any errors in nameand address, including
ZIP Code.
BEST COPY AVAILABLE
416

Dear Principal/Headmaster/Headmistress:
The National Center for Education Statistics (NCES) of the U.S. Department of Educationrequests your participation in the Private School Survey for the 1990-91 Schools and StaffingSurvey. Your school is one of 9,900 public and 3,300 private schools across the nationselected to be in the sample.
The Schools and Staffing Survey, first conducted in school year 1987-88, is an integratedset of surveys consisting of the Teacher Demand and Shortage Survey, the School Survey, theSchool Administrator Survey, and the Teacher Survey. These surveys are being conductedperiodically to measure critical aspects of teacher supply and demand, the composition of theadministrator and teacher work force, and the general status of teaching and schooling. ThePrivate School Survey is a combination of the Teacher Demand and Shortage Survey and theSchool Survey. These questionnaires have been combined and revised, and the resultingburden is significantly less than the 1987-88 version of these questionnaires. The purpose ofthe Private School Survey is to obtain information about schools such as staff-pupil ratio,student characteristics, staffing patterns, and teacher turnover, including the number ofteaching positions that are filled or remain unfilled.
The U.S. Bureau of the Census is conducting the surveys for the NCES by the authority ofSection 406(b) of the General Education Provisions Act, as amended (20 USC 1221e). Thedata will be treated as confidential and will be reported only in statistical summaries thatpreclude the identification of any individual participating in the surveys.
We are conducting this survey with a sample of schools. While this minimizes overall responseburden, the value of each individual survey response is greatly increased because it representsmany other schools. I, therefore, encourage you to participate in this voluntary survey bycompleting this questionnaire and returning it within 3 weeks to the Bureau of the Census,Current Projects Branch, 1201 East Tenth Street, Jeffersonville, IN 47132, in thepreaddressed envelope enclosed for your convenience.
Thank you for your cooperation in this very important effort.
Sincerely,
Emerson J. ElliottActing CommissionerNational Center for Education Statistics
Enclosures
INFORMATION ABOUT YOUR PARTICIPATION
Public reporting burden for this collection of information is estimated to average two hours perresponse, including the time for reviewing instructions, gathering the data needed, andcompleting and reviewing the collection of information. Send comments regarding this burdenestimate or any other aspect of this collection of information, including suggestions forreducing this burden, to the U.S. Department of Education, Information Management andCompliance Division, Washington, DC 20202-4651; and to the Office of Management andBudget, Paperwork Reduction Project 1850-0598, Washington, DC 20503.
Page 2
417 BEST COPY AVAILABLE
FORM SASS-3B (12-4-90
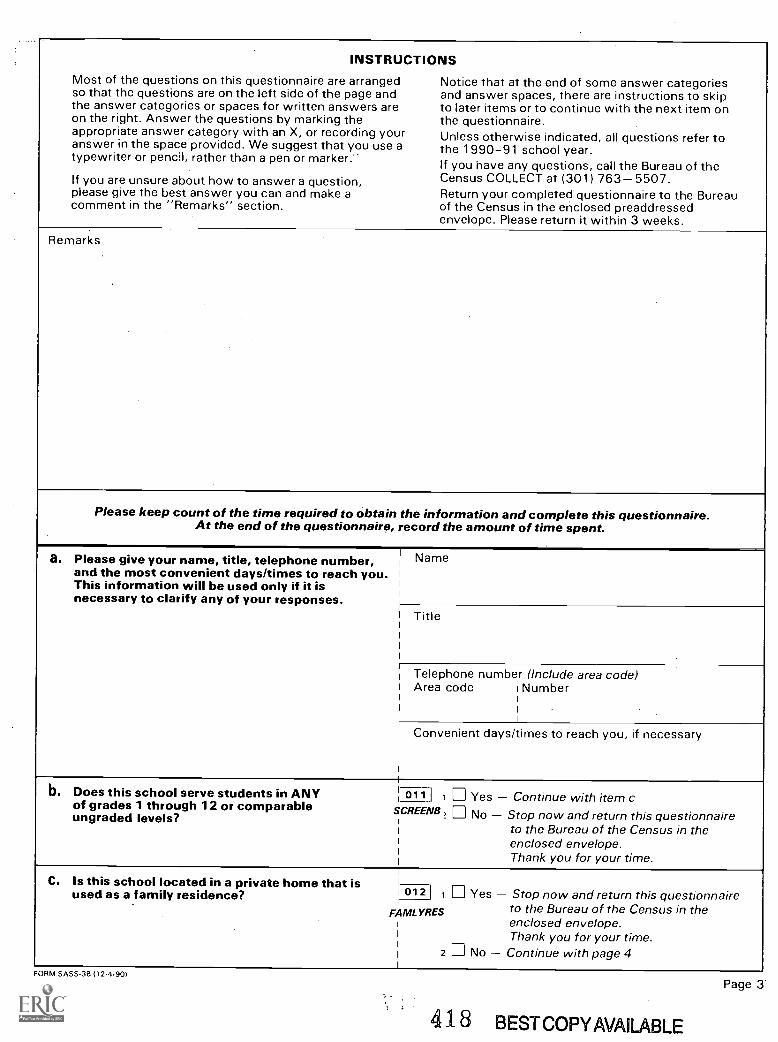
INSTRUCTIONSMost of the questions on this questionnaire are arranged Notice that at the end of some answer categoriesso that the questions are on the left side of the page and and answer spaces, there are instructions to skipthe answer categories or spaces for written answers are to later items or to continue with the next item onon the right. Answer the questions by marking the the questionnaire.appropriate answer category with an X, or recording your Unless otherwise indicated, all questions refer toanswer in the space provided. We suggest that you use a the 1990-91 school year.typewriter or pencil, rather than a pen or marker.-
If you have any questions, call the Bureau of theIf you are unsure about how to answer a question, Census COLLECT at (301) 763-5507.please give the best answer you can and make a Return your completed questionnaire to the Bureaucomment in the "Remarks" section. of the Census in the enclosed preaddressed
envelope. Please return it within 3 weeks.
Remarks
Please keep count of the time required to obtain the information and complete this questionnaire.At the end of the questionnaire, record the amount of time spent.
. Please give your name, title, telephone number, iName
and the most convenient days/times to reach you.This information will be used only if it isnecessary to clarify any of your responses.
Title
Telephone number (Include area code)Area code (Number
1
1
Convenient days/times to reach you, if necessary
b. Does this school serve students in ANY 011 I 1 Yes Continue with item cof grades 1 through 12 or comparable SCREENS, No Stop now and return this questionnaireungraded levels?
to the Bureau of the Census in theenclosed envelope.Thank you for your time.
C. Is this located in home that isschool a private012 Iused as a family residence? 1 Yes Stop now and return this questionnaire
FAMLYRES to the Bureau of the Census in theenclosed envelope.Thank you for your time.
2 No Continue with page 4FORM SASS-3B 112-4-901
418 BESTCOPYAVAILABLE
Page 3

SECTION 1 SCHOOL CHARACTERISTICS
. What is the level of this school?
Mark (X) only one box.
SCHLEVEL0131 1 Elementary
20 Middle school/junior high3 Secondary40 Combined elementary and secondary
2a. For what grade levels does this school offer Instruction offeredMark (X) all that apply.instruction?
Mark (X) the box for each grade in which instruction (a)
is offered in this school, whether or not there are any L0141
pupils enrolled in that grade. OFFERUG 1 0 Ungraded
EnrollmentOctober 1, 1990
(b)
015NUMBRUG
!0161 017Prekindergarten refers only to the year immediately NURSEOFF 1 Nursery
prior to kindergarten. 1018] 019
b. How many students were enrolled in each grade1 OFFERPK 1 El Prekindergarten
1+0201
NUMBRPK1.0211
on October 1 of this school year? OFFERKG 1 CI Kindergarten1
NUMBRKG
Report in head counts. 02311 1st NUMBR1OFFERI
10241 025If instruction for a grade level is offered but no OFFER2 1 2ndstudents are enrolled in that grade, mark the grade
NUMBR2I 0261 027
level box in column (a) and enter "0" in column (b). OFFER3 1 3rd
1028]NUMBR3
0291t-----1
I OFFER4 1 4th03i1 0310311
iOFFERS 1 5th NUMBRS
10321 033OFFER6 1 6th
4]NUMBR6
103 035OFFER7 1 7th
L0361
NUMBR7037
OFFERS 1 8thlt9 38
IVUMBRS
X 039OFFER9 1 9th
1040 NUMBR9041OFFERIO 1 10th1
OFFERII 1 0 11thNrIMB1R1°1042 043NUMBR11
t 04 4 I 045oFFER12 111112th
NUMB047 R121_1046OFFERPS 1 ill Postsecondary
kENUMBRPS048 IAIRK12UGTOTAL
Do any students in this school attendanother elementary or secondary schoolfor part of the day?
EL5EWHER 050 IELSENUM
049 1 Yes How many?2 No
On October 1 of LAST SCHOOL YEAR, howmany students were enrolled in grades K-12 orcomparable ungraded levels in THIS school(the school named on the cover page label)?Include only students who were enrolled in the schoolnamed on the questionnaire label. Do NOT include anynursery, prekindergarten, or postsecondary students.
LASTYEARF051 I Students
How long is the school day for most students inthis school?
Report BOTH hours and minutes, e.g., "5" hours and"45" minutes, "6" hours and "0" minutes, etc.If the length of the day varies by grade level, recordthe longest day.
INUMHOURS1052 Hours
ANDNUMMNTE0531 Minutes
It
Page 4
419
FORM SASS -36 11 2 -4 -901

SECTION 1 SCHOOL CHARACTERISTICS Continued1
6. How many days are in the school year for students 1
in this school? I
10541 DaysNUMDAYS
. How many K-12 students in this school are 1
i
I
Do NOT include nursery, prekindergarten, or ! 055 Studentspostsecondary students.AMINDSTU
o Nonea. American Indian or Alaskan Native?
b. Asian or Pacific Islander? i 056J StudentsAS /ANSTU
o None
C. Hispanic, regardless of race?(Mexican, Puerto Rican, Cuban, Central or 1057
StudentsSouth American, or other Hispanic culture HISPNSTUor origin) o None
1
i
1
1
d. Black (not of Hispanic origin)? 1058 StudentsBLACKSTU o None
1
1
e. White (not of Hispanic origin)? ! 059 I StudentsWHITESTU o None
1
1
8a. Is this school coeducational?
Skip to item 9
060 1 Yes Continue with b
COEDSCHL2 No, it is an all-female school
3 No, it is an all-male school
b. What percent of K-12 students enrolled inthis school are male?Do NOT include nursery, prekindergarten, or
Ipostsecondary students.1061
Record percentage in whole numbers, not tenths. PCTMALEDo not enter a decimal point.
9. How many K-12 students were absent the mostrecent school day?
Include both excused and unexcused absences.062 StudentsNOTDo include nursery, prekindergarten, or
postsecondary students. ABSNTSTo None
10. How many K-12 students board at this school?
Do NOT include nursery, prekindergarten, or 1063 i Studentspostsecondary students.BOARDNUM
o None1
iT6,TI 1 All students board
FORM SASS-3B 112-4-901
420
Page 5

SECTION 1 SCHOOL CHARACTERISTICS Continued
11. Which of these best describes the communityin which this school is located?
Mark (X) only one box.
1
1 LOCALE
1
065 I
1 Large Central City2 Mid-size Central City3 Urban fringe of Large City4 Urban fringe of Mid-size City5 Large town6 Small town7 Rural
12a. Does this school have a religiousorientation, purpose, or affiliation?
1 AFFELPURI 61 1 I i Yes Continue with b061
2 D No Skip to item 13 on page 7
b. Is this school formally affiliated with anational religious denomination?
RELIGDEN106711 ill Yes
1
I20 No
C. What is this school's religiousorientation or affiliation?
Mark (X) only one box.
AFFILIAT
Skip toitem 13onpage 7
1
1068 I 1 0 Roman Catholic Continue with d2 Amish3 Assembly of Godi
4 0 Baptist5D Calvinist6 Christian (no specific denomination)7 0 Church of Christ8 Church of God9 Disciples of Christ
to Episcopalii Friends
12 Greek Orthodox13 Islamic14 II Jewish15 Latter Day Saints16 Lutheran Church Missouri Synod17 0 Evangelical Lutheran Church in
America (formerly AELC, ALC, or LCA)18 Ei Wisconsin Evangelical Lutheran Synod
19 0 Other Lutheranzo Mennonite21 Methodist22 Pentecostal23 Presbyterian24 Seventh-Day Adventist25D Other Specify 7
Answer this item if you marked Roman Catholic(box 1) in item 12c above.
d. Is this schoolMark (X) only one box.
CATIITYPE069 I 1 Parochial (or inter-parochial)?
I 2 Diocesan?i 3 Private?
Page 6
4 21 BESTCOPYAVAILABLE
FORM SASS-3B 112-4-901

SECTION 1 SCHOOL CHARACTERISTICS Continued
13. Which associations or organizations 0r.71ACE
1 071_1,ASN1
072 1INCACS1.073;1 AAC
does this school belong to?
Mark (X) all that apply.
FORM SASS-3B (12-4-901
1 Accelerated Christian Education
2 Alternative School Network
3 National Coalition of Alternative Community Schools
4 American Association of Christian Schools
I 074 I 5 American Montessori SocietyAMONTSRI075 I s Li Other Montessori association(s)
OTHMTSRII 076] 7 Association of Christian Schools InternationalA CSII 0771 a Association of Military Colleges and SchoolsFATILTRYSCH' 078 1 9111 Bilingual School AssociationBILNGSCH079 I 10 Li Council of Bilingual Education
I. CBE0 I 11 Other association(s) for bilingual educationOTHBILNG
I j 12 Li Christian Schools InternationalI. CS/i 082_1 13 Council for Exceptional ChildrenI
1 14 El National Association of Private Schools for Exceptional ChildrenC0E8C3
I. NAPEC1 084 I 15 Other association(s) for exceptional children
1° 0:81:5AXI6PC1111-11 Early Childhood Education Association
1 086 I 17 Other early childhood education association(s)I OTHECE1087 I 18 European Council for International Schools
Other association(s) for international schools008TH87T 1L
70 Friends Council on EducationI
E0FCR981 I1E
FRIENDS0 1 General Conference of Seventh-Day Adventists
SVNTHDAY091 I 22 Li National Association of Episcopal SchoolsEPIS1PLS092 National Association of Independent Schools
IAONnis31:I 1 24 El National Independent Private School Association
1 094 I 25 Other independent school association(s)OTHINDPV4::191 26 National Association of Laboratory Schools
ILABSCHLSI 096 I 27 National Catholic Educational AssociationI NCEA1 0971 28 Jesuit Secondary Education AssociationJESUITS
1008 I 29 National Center for Neighborhood EnterpriseINCNE
30 National Federation of Church SchoolsI NFCS! 100 I 31 National Society of Hebrew Day Schools
HB10R 1E WI D3A2
Solomon Schechter Day SchoolsSCHECHTR102 33 Other Jewish school association(s)
JEWSH1103 I 34 Oral Roberts Educational Fellowship
ORA4RBTS104 I 15 Other Christian school association(s)
1
OTHCHRST105 I le Ii Other religious school association(s)OTHRELIG
I 106 I 37 Other nonreligious school association(s)I NONRELIG1107 1NONE2
o None
422BESTCOPYAVA1LABLE
Page 7
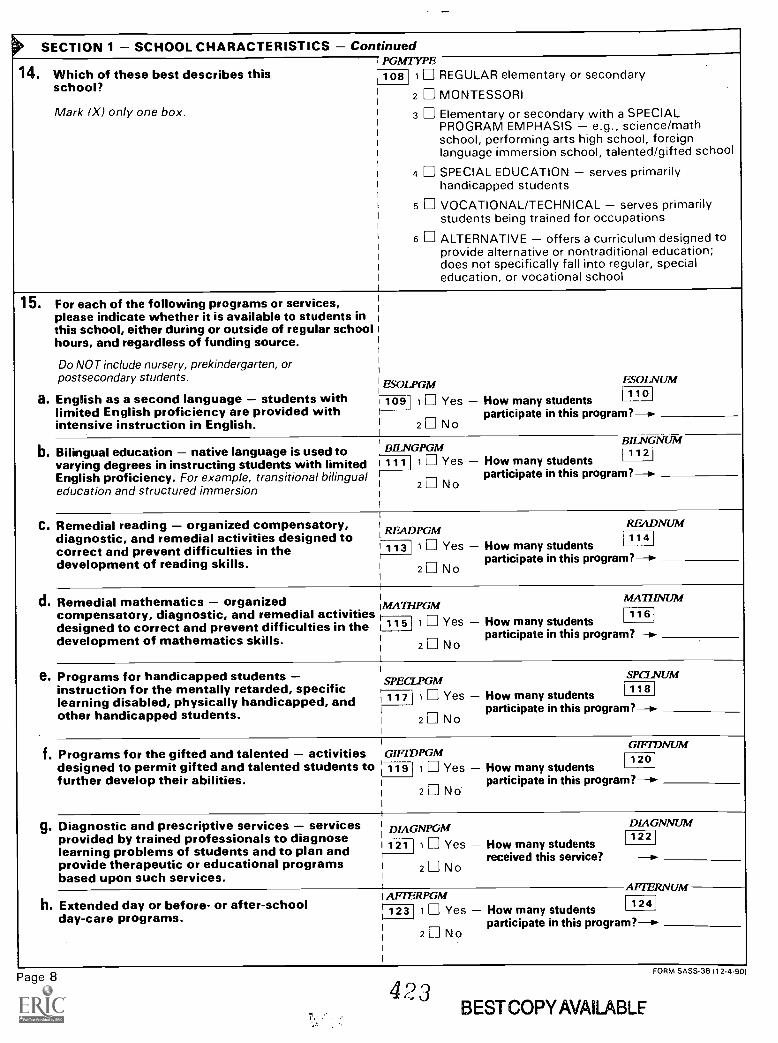
SECTION 1 SCHOOL CHARACTERISTICS Continued
14. Which of these best describes thisschool?
Mark (X) only one box.
r PGMTYPE108 1 REGULAR elementary or secondary
2 II] MONTESSORI
3 Elementary or secondary with a SPECIALPROGRAM EMPHASIS e.g., science/mathschool, performing arts high school, foreignlanguage immersion school, talented/gifted school
4 SPECIAL EDUCATION serves primarilyhandicapped students
s [I] VOCATIONAL/TECHNICAL serves primarilystudents being trained for occupations
6 ALTERNATIVE offers a curriculum designed toprovide alternative or nontraditional education;does not specifically fall into regular, specialeducation, or vocational school
15. For each of the following programs or services,please indicate whether it is available to students inthis school, either during or outside of regular schoolhours, and regardless of funding source.
Do NOT include nursery, prekindergarten, orpostsecondary students.
a. English as a second language students withlimited English proficiency are provided withintensive instruction in English.
ESOLPGM
109 1 Yes How many studentsparticipate in this program?--o.
ESOLNUM110
2 No
b. Bilingual education native language is used tovarying degrees in instructing students with limitedEnglish proficiency. For example, transitional bilingualeducation and structured immersion
BILNGPGM111 1 Yes How many students
participate in this program?-0-
BILNGNUM1 1121
2 0 No
C. Remedial reading organized compensatory,diagnostic, and remedial activities designed tocorrect and prevent difficulties in thedevelopment of reading skills.
READNUM114RE?ADPGM
I 113 1 Yes How many studentsparticipate in this program?2 No
d. Remedial mathematics organized I
compensatory, diagnostic, and remedial activities1 MATHPGM
designed to correct and prevent difficulties in the i115
development of mathematics skills.1 Yes How many students
participate in this program?2 No
MATHNUM
116
e. Programs for handicapped studentsinstruction for the mentally retarded, specificlearning disabled, physically handicapped, andother handicapped students.
SPECLPGM117 1 Yes How many students
participate in this program?2 [1] No
SPCLNUM118
f. Programs for the gifted and talented activities GIFIDPGMdesigned to permit gifted and talented students to 119 1 Yes How many studentsfurther develop their abilities. i participate in this program?
2 El No
GIFTDNUM120
g. Diagnostic and prescriptive services servicesprovided by trained professionals to diagnoselearning problems of students and to plan andprovide therapeutic or educational programsbased upon such services.
DIAGNPGM121 1 Yes How many students
received this service?2 0 No
h. Extended day or before- or after-schoolday-care programs.
APTERPGM123 I 1 Yes How many students
participate in this program?2 0 No
DIAGNNUM122_1
AFIERNUM124
Page 8
423BESTCOPYAVAILABLE
FORM SASS-3B 112.4-90

SECTION 1 SCHOOL CHARACTERISTICS Continued116a. Does this school offer a kindergarten program? 1125 I 1 Yes Continue with b
KGOFFER : No Skip to item 17ab. How many days per week do the kindergarten
I
students attend this school?t1126 KGNUMDAY Days per week
C. How long is the school day for students inL
F127 i 1 Half daythe kindergarten program?
KGLENDAY 2 Full dayMark (X) only one box.
I 3 Both offered17a. Does this school have a library/media center? ! 128 1 Yes Continue with b
2 No Skip to item 18aOWNLIBRY
b. Do all students in this school have access to the11129 1 Yeslibrary/media center?
2 N oLIBRYALL18a. Does this school provide Chapter 1 services under
the Elementary and Secondary Education Act as ! 130 1 Yes Continue with bamended, i.e., federal funds for the special2 No Skip to item 19aeducational needs of disadvantaged children? CHPTRONE
1b. How many students are served? 11311 Prekindergarten and nursery students
o None011ISVPK
1132K 12 students
o NoneONESVK12C. How many Chapter 1 teachers and/or teacher
! 133aides are at this school?ONETEACH Teachers and/or teacher aides
19a. Does this school charge tuition for any 1134 I 1 Yes Continue with bstudents?CHARGETU 2 No Skip to item 20a
b. Does this school have any policy for modifying or il
discounting tuition rates, e.g., on the basis of 1 Yes1135additional students from the same family, DISCOUNT 2 N ofinancial need, church membership, etc.? i
C. What is the highest ANNUAL tuition charged 1
by this school for a full-time student? Do notinclude boarding fees. I 136 $ L.00
per yearTUITIN20a.
I
Does this school have any special requirements1137 I 1 Yes Continue with bfor admission other than proof of immunization, ,
2 No Skip to item 21 on page 10age, or residence?ADMITREO
b. Which of these does this school use for 138 i Admission test,admission?ADM /TEST
:139 I 2 Standardized achievement testMark (X) all that apply.AC ST
140 3 Academic recordRECORDS
1411 4 Special student needsSPEC /AL
142 I 5 Special student aptitudesTALENT
143 16 Personal interviewINTRVIEW
1144 17 RecommendationsRECMNDS
11451 a Religious affiliationRELIGAFF NOTE: If you marked only one box for
1 item 20b, skip to item 21.aC. Of the categories marked for item 20b above, 1
which is the most important consideration for 11 4s Most important$admission and which is the second most MOST /MPimportant?147 J Second most importantiEnter the appropriate category numbers (1-91.
ORM SASS-3B112-4-901SECND /MP
Paae 9
424BEST COPY AVAILABLE

SECTION 1 SCHOOL CHARACTERISTICS ContinuedTWELFTH
21. Does this school provide instruction for 1 148 I 1 Li Yes Continue with item 22a
grade 12? 2 No Skip to the instructions above item 27 on page 11
22a. For high school graduation for students in theclass of 1991, how many years of instruction arerequired in each of the following areas?Record the number to the nearest tenth, e.g., 3.0,2.5, etc. If none, mark (X) the "None" box. YRSENGL
t------11491(1) English/language arts
1 o NoneYRSMATH
(2) Mathematics 11501 .
1
1o [11 None
YRSCOMP
(3) Computer science 1
151 1 .
i o ri NoneYRSSOC
(4) Social sciences/social studies (e.g., 11521 .
history, geography, economics) 1
Io None
YRSSCI
(5) Physical and biological sciences 171311
i OE NoneYRSLAArG
(6) Foreign language I 1541
1
o El NoneYRS3I:). Do these requirements reflect a 3-year or a !
4
4-year program? 1155 10 3-year program1 2 4-year program1
For items 23a -25b, students may be enrolled in 1
COLLPREPL
more than 'one program. I 156 11__1 Yes Continue with b23a. Does this school offer a college 1
2 No Skip to item 24apreparatory program?
b. How many students in grades 10-12PREPNUM
are enrolled in this program? 1571 Studentso None
VOCTECH24a. Does this school offer a vocational or 158 1 Yes Continue with b
technical program? r2 No Skip to item 25a
b. How many students in grades 10-12 are enrolled TEGINUMin this program? 159 Studentsr
0E1 NoneGENERAL
25a. Does this school offer a general program for r 160 1 LJ Yes Continue with bstudents who do not plan to attend college? 2 No Skip to item 26a
b. How many students in grades 10-12 are enrolled I GENLNUM
in this program? 161 Students0 None
26a. LAST SCHOOL YEAR, how many students were I ENROL/2
enrolled in 12th grade on or about October 1? i 1 621 Students Continue with b
i
o El None Skip to instructions above item 27
b. How many students graduated from 12th grade 'GRADNUMlast year? Include 1990 summer graduates. I161 Graduates Continue with c
1
o None Skip to instructions above item 27.
C. How many of last year's graduates appliedi GRADAPLY .
to two- or four-year colleges? 1164 Students1
1
o None
Page 10
425
FORM SASS-313 112.4 -90)

SECTION 2 STAFFING PATTERNS
In questions 27-33, you are asked to report the number of teachers in this school in full-time equivalents (FTEs).For an individual teacher, the FTE would be the ratio of the time the person spends working as a teacher at thisschool to the time that would be spent by a full-time teacher.The following are some examples:
A teacher who works full time would have an FTE of 1.0 .
A teacher who works half days for five days a week would have an FTE of .5.A teacher who works all day for one day each week would have an FTE of .2.A teacher who spends one-fifth of her time as a guidance counselor and four-fifths as ateacher would have an FTE of .8.
Someone who works one-third time as a teacher in this school would have an FTE of .3.A school that has three full-time teachers (3.0) and one half-time teacher (.5) wouldhave a total of 3.5 FTE teachers.
A school that has five full-time teachers (5.0) and three half-time teachers (1.5) wouldhave a total of 6.5 FTE teachers.
Note that FTEs are reported to the nearest tenth.
Count only TEACHERS. Do not count FTEs for guidance counselors, teachers aides, daycare aides, etc.
27. How many FTE teachers were employed by thisllGrade eveschool at each of these levels on October 1 of Gra
THIS school year, and on October 1 of LAST
This year'sFTE teachers
Last year'sFTE teachers
school year?
Enter only one digit to the right of the decimal point.I
If the answer is a whole number, enter a zero (0) toa. U ngradedthe right of the decimal point, e.g., 5.0.
165 1661
TKGNOW TUGLAST
o None o NoneI
b. Nursery andprekindergarten
167 168
TPKNOW TPK LAST
o None o None
c. Kindergarten
169 170TKGNOW TKGLAST
o None o None
I
d. Grades 1-6
171 172T1_6NOW T1 6LAST
o None o None
e. Grades 7-12
1731 174T7 12NOW_ T7 12LAST
o None o None
f. Postsecondary
175 176TPSNOW - TPS LAST
o Noneo None
g. TOTAL FTE teachers
177 178TTOTNOW TTOTLAST
28.
In items 28 -33, report FTE teachers or teachingpositions for grades K 12. Include FTE teachers orteaching positions for ungraded if the students arethe same ages as those in grades K-12. Do NOTinclude nursery, prekindergarten, or postsecondaryteaching positions or teachers. BESTRefer to item 27 above.
TTOTK 12
COPY AVAILABLE
Record the total number of FTE teachers who teach 179grades K-12 or comparable ungraded levels, i.e.,this year's total FTE teachers minus nursery,prekindergarten, and postsecondary.
FORM SASS-3B 112-4-90)
426
Page 11
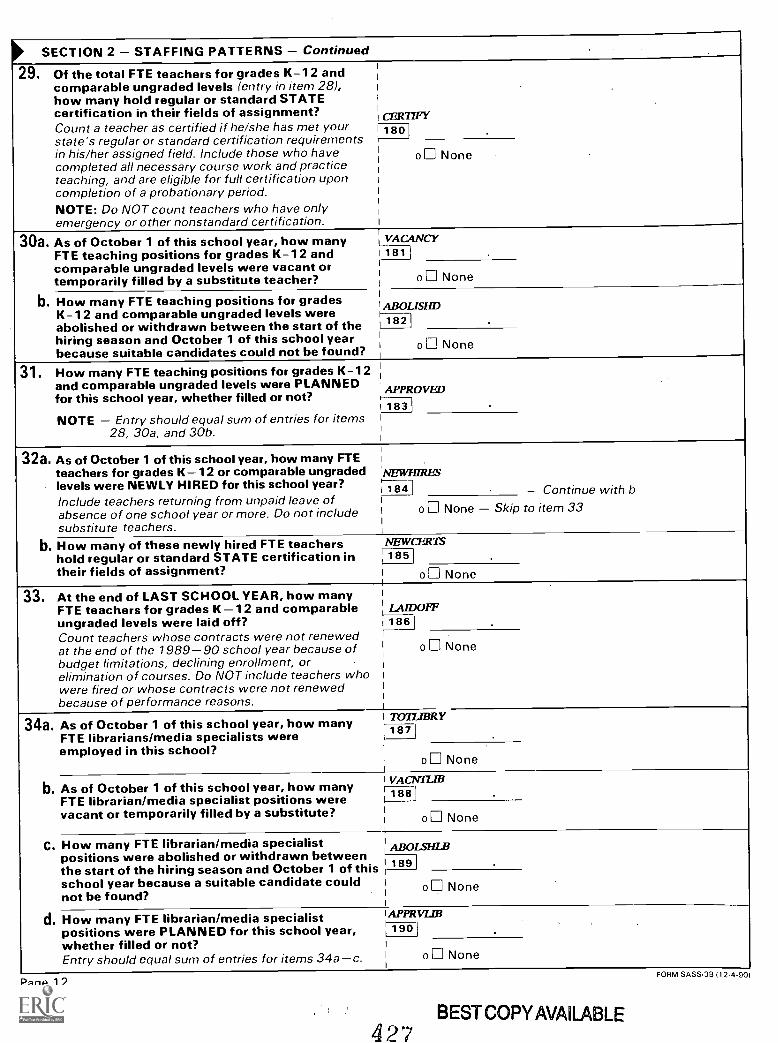
SECTION 2 STAFFING PATTERNS Continued
29. Of the total FTE teachers for grades K -12 andcomparable ungraded levels (entry in item 28),how many hold regular or standard STATEcertification in their fields of assignment?Count a teacher as certified if he/she has met your i
state's regular or standard certification requirementsin his/her assigned field. Include those who have i
completed all necessary course work and practiceteaching, and are eligible for full certification uponcompletion of a probationary period.NOTE: Do NOT count teachers who have onlyemergency or other nonstandard certification.
CERTIFY180
o[.] None
30a. As of October 1 of this school year, how many j
FTE teaching positions for grades K -12 and i
comparable ungraded levels were vacant ortemporarily filled by a substitute teacher?
VACANCY181 I .
o 0 None
b. How many FTE teaching positions for grades1
K -12 and comparable ungraded levels were 1----1abolished or withdrawn between the start of the 11821
hiring season and October 1 of this school yearbecause suitable candidates could not be found?
ABOLISFID
o 0 None
31. How many FTE teaching positions for grades K -12and comparable ungraded levels were PLANNEDfor this school year, whether filled or not?
NOTE Entry should equal sum of entries for items28, 30a, and 30b.
APPROVED
183
32a. As of October 1 of this school year, how many FTEteachers for grades K -12 or comparable ungradedlevels were NEWLY HIRED for this school year?Include teachers returning from unpaid leave ofabsence of one school year or more. Do not includesubstitute teachers.
NEwHiRus
184 Continue with bo None Skip to item 33
b. How many of these newly hired FTE teachershold regular or standard STATE certification intheir fields of assignment?
IVEWCERTS185 .
o 0 None
33. At the end of LAST SCHOOL YEAR, how manyFTE teachers for grades K 1 2 and comparableungraded levels were laid off?Count teachers whose contracts were not renewedat the end of the 1989-90 school year because ofbudget limitations, declining enrollment, orelimination of courses. Do NOT include teachers whowere fired or whose contracts were not renewedbecause of performance reasons.
LAIDOFF186 .
o None
34a. As of October 1 of this school year, how manyFTE librarians/media specialists wereemployed in this school?
CRYTOTL
t-1871
.
0 None
b. As of October 1 of this school year, how manyFTE librarian/media specialist positions werevacant or temporarily filled by a substitute?
i VACNTLIB
1_188
o0 None
C. How many FTE librarian/media specialistpositions were abolished or withdrawn betweenthe start of the hiring season and October 1 of thisschool year because a suitable candidate couldnot be found?
1
LABOLSHLB
i 189i 0 None
d. How many FTE librarian/media specialistpositions were PLANNED for this school year,whether filled or not?Entry should equal sum of entries for items 34ac.
1 APPRVLIBL1901I
IIo None
Paae 12FORM SASS-3B 112-4.901
427BEST COPY AVAILABLE

SECTION 2 STAFFING PATTERNS Continued
35a. Were there teaching vacancies in this school forthis school year, i.e., teaching positions forwhich teachers were recruited and interviewed?vACNcY
1
Continue with bSkip to item 36a
4---,11911 1 = Yes
2 No
--tb. Did this school have any teaching vacancies this
school year that could not be filled with a teacherqualified in the course or grade level to be taug
UNFILLED
t______,Continue with c
to 35d
planned course offerings
some class sizes
sections to other teachers'teaching loads
a teacher of another subjectlevel to teach those classes
and/or short-term substitutes
or itinerant teachers
less qualified teacher
1192 I 1 III Yes2 ii No Skip
C. Which of these methods did this schoolCANCELuse to cover the vacancy(ies)?
Mark (X) all that apply.EXPANDSZ
ADDSCTN
REASSIGN1196
SUBTEACH
PRTEACH
LESSQUAL
1 193 i Cancelled4--
11942 Expanded
195 3 Addednormal
4 Assigned1
or grade1
1197 5 Used long-termI
I 198 60 Used part-time1
199 7 Hired a
d. How difficult or easy was it to fill thevacancies for this school year in each of thefollowing fields?
(1) General elementary GENLVAC
I Mark (X) one box for each line.
I
No vacancies1
in that field Easy Somewhatdifficult
Verydifficult
Could not fillvacancy
1
1 2 3 4ri12°0 o
I
(2) Special educationSPECLVAC
I
1 2 3 4011201
(3) EnglishENGLVAC
1
1 2 3 41202 Or]i
(4) Mathematics MATHVAC1
1 2 3 41
1203 0
(5) Physical sciences PHYSVAC1204 1 2 3 40
(6) Biology or life sciences BIOSVAC 1 2 3 4205 0
(7) English as a second language (ESL) orbilingual education ESOLVAC 1 r] 2n 3 4 0206 0
(8) Foreign language FORGNVAC 1 2 3 4207 0
(9) Vocational educationVOTECVAC 1 2 3 4208 a
For items 36-42, report the number of teachers forgrades K 12 and comparable ungraded levels only.Do not include teachers who teach ONLY nursery,prekindergarten, or postsecondary students.NOTE Report in head counts, not FTEs.
36a. How many K-12 teachers have FULL-TIMEteaching positions at this school?
Full-time teachers209 FULTEACH
o None
b. How many K-12 teachers have PART-TIMEteaching positions at this school? Includeitinerant teachers.
Part-time teachers210 PARTEACH
0 None
C. What is the total number of K-12 teachers atthis school?
Total must equal sum of items 36a and 36b. 1
1
Total K 12 teachersI 211 TOTTEACH
FORM SASS 38 112 4 901
428 BEST COPY AVAILABLE
Page 13

SECTION 2 STAFFING PATTERNS Continued
37. How many K-12 teachers in this school areInclude both full- and part-time teachers.
a. American Indian or Alaskan Native?
1
I
1 AAHNDTCH
Teachers1
1 212I
1o None
1
b. Asian or Pacific Islander?
ASIANTCH
Teachers1213
o None
C. Hispanic, regardless of race?( Mexican, Puerto Rican, Cuban, Central or SouthAmerican, or other Hispanic culture or origin)
huspnrratTeachers214 ]
1 o None
d. Black (not of Hispanic origin)?
1
I BLAC7C1CH
Teachers1215
o None
e. White (not of Hispanic origin)?WHITETCH
Teachers216
o None
38. How many K-12 teachers were absent the mostrecent school day?Include both full- and part-time teachers.
ABSWWH
Teachers1217 II_o None
39. How many K-12 teachers have a degreebeyond the bachelor's degree?
Include both full- and part-time teachers.
AFTERBAC
Teachers218
o None
40. How many K-12 teachers have taught for each ofthe following periods of time? Include years ofteaching at this school and at any other elementaryor secondary school either public or private,part-time or full-time. Include this school year.Include both full- and part-time teachers.
a. Less than 3 years
1 LESS3EXP
Teachers1219
1 o None1
b. 3 to 9 years
i
( LESSIOEX1 2201 Teachers
o None
C. 10 to 20 years
LESS2IEX
Teachers1
2211
1
o None1
d. More than 20 years
NOTE The sum of parts a d must equal the entryfor item 36c.
MOREXP2/
I
1!----1222 Teachers
I op None1
1
Page 14
429
FORM SASS-3B 112-4.901

SECTION 2 STAFFING PATTERNS Continued
41 a. How many K-12 teachers are NEW to thisschool this year? Include teachers who taughtin this school in previous years but were nothere last year.
Include both full- and part-time teachers.
I NEWTEACH
New teachers Continue with b1223
I o None Skip to item 42a on page 16
b. Of those K-12 teachers who are NEW to thisschool (item 41 a above), how many have theirmain teaching assignment in each of thefollowing fields?
(1) General elementary224 ELEMNEW
Teachers
o None
(2) Special education 225 I SPCLNEWTeachers
o None
(3) English 226 I ENGLNEW Teachers
o None
(4) Mathematics 227 I MATHNEWTeachers
o None
(5) Physical sciences 228 PHYSNEWI Teachers
o None
(6) Biology or life sciences 1229 I BIOSNEW Teachers
o None
(7) English as a second language (ESL) (
ESOLNEW1230 Teachers
o None
(8) Bilingual education 1231 Teachers
(9) Foreign languageLANGNEW
1232 Teachers
o None
(10) Vocational or technical educationI TECHNEW1233 I
Teachers
o None
(11) Other SpecifyOTHERNEW
i 234 Teachers
NOTE: The sum of items (1)-(11) mustequal the entry in item 41 a.
o None
FORM SASS 38 112-4-901
4 3 0 BEST COPY AVAILABLE
Page 15

SECTION 2 STAFFING PATTERNS Continued
42a. How many K-12 teachers LEFT this school betweenOctober 1 of last school year and October 1 of thisschool year?
Include both full- and part-time teachers.
1 uerroTAL
i 235 Teachers Continue with bo None Skip to item 43 on page 17
b. Of those K-12 teachers who LEFT this school(item 42a above), how many are no longer teachingin an elementary or secondary school?
Include teachers who have retired and thosewho died.
i IF TEACH1 236 Teachers Continue with c
o None - All who leftare still teaching Skip to item 43
LFTUNK on page 17237 1 Don't know
C. Of those K-12 teachers who have LEFT TEACHING(item 42b above), how many had their mainassignment in each of the following fields?Include only those teachers who have left teaching.
(1) General elementary
LPIENLG
i 238Teachers
1 o None
(2) Special educationLFISPECL
i 239 Teacherso None
(3) English' LFTENGL1
1
240 Teachers1
1o None
(4) Mathematics
1
LFTMATIIi 241 Teachers1
o Nonei
(5) Physical sciences
i
1 LPIPHYS; 242 TeachersI o None1
(6) Biology or life sciences
1
1 LF113I01 243 Teachers
o None
(7) English as a second language (ESL)
LPIESOL
i
244 Teacherso None
(8) Bilingual education
_LF773ILNG245 Teachers
o None
(9) Foreign languageLFTLANG
i 246 Teacherso None
(10) Vocational or technical educationLF7VOTEC
i 2471 Teacherso None
(11) Other SpecifyLFMTHER248 Teachers
NOTE The sum of parts (1) (1 1) must equalthe entry in item 42b.
o 0 None
Page 16
431
FORM SASS-3B 112 4.9p1

SECTION 2 STAFFING PATTERNS Continued
43. How many employees hold full- or part-timepositions at this school in each of the followingcategories?
If an employee holds a position in more than one ofthe categories, count that person as part-time ineach category that applies.
a. Headmaster, headmistress, or principal
FULL-TIME PART-TIME
249 FTHEADS
op None
250 PTHEADS
0 None
b. Assistant headmaster, headmistress, orprincipal
251 FTASS /ST
o None
252 PTASSIST
o None
C. Guidance counselors 253FTGUIDES
o None
254 PTGU /DES
o None
d. Vocational counselors 255FTVTCOUN
o None
256PTVTCOUN
o None
e. Librarians and other professional media staff 257FTL /BRNS
o None
258 PTLIBRNS
o None
f. Other professional staff such as curriculumspecialists, administrative and business staff,social workers, and health professionals
259FTPROSTF
o None
260PTPROSTF
o None
J. Classroom teacher aides (paraprofessionalswho assist classroom teachers)
261FTA /DES
o None
262 PTA /DES
o None
h. Library or media center aides 263 FTMED /A
o None
264PTMEDIA
o None
I. All other noninstructional staff (includemaintenance, food service, and clerical staff) 265
FTALLOTH
o None
266 PTALLOTH
o None
44a. Do any UNPAID VOLUNTEERS provideservices for this school? Do not includestudents from this school as unpaid (6'7121 Yes Continue with bvolunteers. VOLNTSVC 2 No Skip to item 45 on page 18
b. How many unpaid volunteers provide servicesat this school on A CONTINUING ORSCHEDULED BASIS this school year? 268
VOLNTNUM
o None
Unpaid volunteers
FORM SASS-3B 112-4-901 Page 17
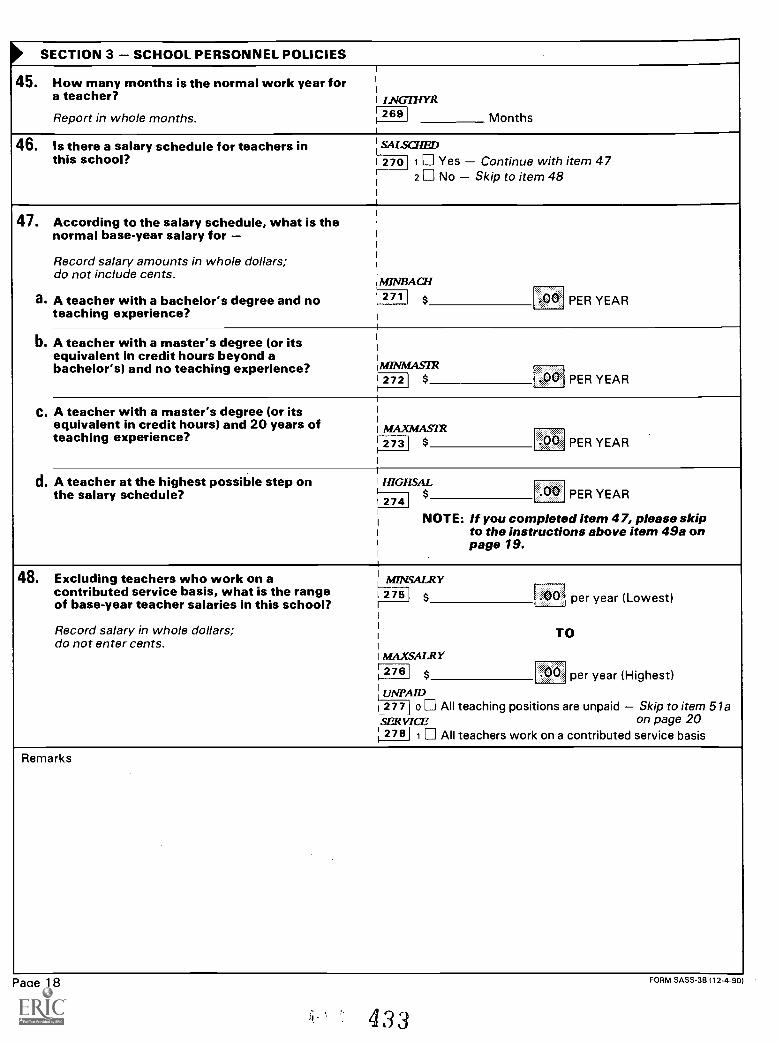
SECTION 3 SCHOOL PERSONNEL POLICIES
45. How many months is the normal work year fora teacher?
Report in whole months.
I
i
LNGTHYR269 Months
46. Is there a salary schedule for teachers inthis school?
1
SALSCHED
270 1 Yes Continue with item 472 No Skip to item 48
47. According to the salary schedule, what is thenormal base-year salary for
Record salary amounts in whole dollars;do not include cents.
a. A teacher with a bachelor's degree and noteaching experience?
i
MEVBACII271 $
. 0 PER YEAR
b. A teacher with a master's degree (or itsequivalent in credit hours beyond abachelor's) and no teaching experience?
1
IMINMAS7R
i
1272 $ - 0 PER YEAR
C. A teacher with a master's degree (or itsequivalent in credit hours) and 20 years ofteaching experience?
MAXMASTR273 $ .00 PER YEAR
d. A teacher at the highest possible step onthe salary schedule?
1
1 H7GHSAL1 0$ . PER YEAR1274
NOTE: If you completed item 47, please skip1 to the instructions above item 49a onI page 19.1
1
48. Excluding teachers who work on acontributed service basis, what is the rangeof base-year teacher salaries in this school?
Record salary in whole dollars;do not enter cents.
I MINSALRYI_1 275 $ . 0 per year (Lowest)i
1
1
TOI
I
1 MAXSALRY276 $ 0 per year (Highest)
1
I UNPAID1277] o All teaching positions are unpaid Skip to item 51aSERVICE on page 20278 1 All teachers work on a contributed service basis
Remarks
Page 18
433
FORM SASS-3B 112 -4 -901

SECTION 3 SCHOOL PERSONNEL POLICIES Continued
The following definitions of pay incentives pertain to questions 49a-50c.
Cash bonus A supplement to regular compensation over the year, but no permanent increase in salary
Different step on salary schedule Placement of a teacher on a higher step of the salary schedule
Other salary increase Increase in base salary or other raise in salary through reclassification (other than astep increase on the salary schedule)
49a. In this school year, does this school have a MERITPAY"merit pay" plan for teachers?
L279 1 Yes Continue with b_A "merit pay" plan is a system in which a teacher's2 No Skip to item 50aperformance is a significant factor in determining his
or her compensation.MERITCS
b. How is this performance-based compensation 211:TI 1 Cash bonusgiven?MERITSTP
F 281 2 Different step on salary scheduleMark (X) all that apply.MERIT/NC 1 282 3 Other salary increase
50a. Does this school or organization use any of theincentives listed above to recruit or retain 28311 Yes Continue with bpay
teachers to teach in fields of shortage? SHORTAGE 2 No Skip to item 51a on page 20
SHORTCSHb. Which of these pay incentives are offered to
28411 Cash bonusattract teachers to fields specified by this schoolas fields of shortage? SHORTSTP 1 288 2 Different step on salary schedule
Mark (X) all that apply. 1 286 3 Other salary increaseSHORT /NC
C. In which fields are incentives offered?SHRTSPEC 287 1 Special education
Mark (X) all that apply.SHRTMATH 288 2 Mathematics
i 289 3 Computer scienceSHRTCOMP
SHRTPHYS 290 4 Physical sciences
SHRTBIO 291 5 Biology/life sciences
SHRTESOL 292 6 English as a second language (ESL) orbilingual education
SHRTLANG 293 7 Foreign languages
SHRTVOC 294 8 Vocational education
SHRTOTHR 1 295 9 Other Specify 7
Remarks
BEST COPY AVAILABLE
FORM SASS-3B I 1 2-4-901
434Page 19

SECTION 3 SCHOOL PERSONNEL POLICIES Continued
51a. 1
RETRAINGIs free retraining available in this school 296 1 Yes Continue with b(regardless of funding source) to prepare
2 No Skip to item 52staff members to teach in fields with currentor anticipated shortages?
b. What fields for freeare the which this RESPECL 297 1 Special educationtraining is provided?
Mark (X) all that apply. REMATH 298 1 2 Mathematics
RECOMP1299 3 Computer science1
REPHYS 1 300 4 Physical sciences
REBID 01 5 Biology/life sciences
RESOL1302 6 English as a second language (ESL) or1
bilingual education1
RELANG1303 7 Foreign languages1
REVOTECI 304J 8 Vocational education
REUTHER' 3051 9 Other SpecifyEVAL TCH52. Is there formal teacher evaluationa program
in use in this school? 306 1 Yes2 Li No
53. Which of these benefits are available to GENERAL MEDICAL INSURANCEteachers in this school?
MEDICAL 307 1School (or other organization) pays part
Mark (X) all that apply. or all of premium
2 Teachers pay all of premiumMark the last category if none of thesebenefits is available.
DENTAL INSURANCE
DENIAL 1 308 3 School (or other organization) pays partor all of premium
4 Teachers pay all of premium
GROUP LIFE INSURANCEi___
LIFE 1 309 5 School (or other organization) pays partor all of premium
6 Teachers pay all of premium
PENSION 310 7 PENSION CONTRIBUTIONS
INCOME-IN-KIND
HOUSING 311 8 Housing
MEALS 9 Meals (including free or reduced-price lunches)L3121
TRANspT 3131100 Transportation (including mileagereimbursement for itinerant teachers)
SCHOLAR 314 110 Tuition scholarships for children to attendthis school
TTJIITONI 3151 12 REIMBURSEMENT FOR TEACHERS'TUITION AND COURSE FEES
NONE 1 316 0 None of the above
54. Does this school (or the organization with which ADMNPG,Mthis school is affiliated) have a training or 317 1 Yesdevelopment program for ASPIRING school i 2 N oadministrators?
55 Is there a formal program to help beginning MENTOR.
teachers (such as a master or mentor teacher 1 318 1 Yesprogram) in use in this school? Do not include i 20 N osupervision of student teachers.
Page 20
435
FORM SASS -38 (1 2-4-90)

SECTION 3 SCHOOL PERSONNEL POLICIES Continued56. Are teachers in this school covered by a
retirement plan?1
Yes Continue with item 57aNo Skip to item 58
r 3191 1
RETIREMT2
57a. Can teachers who transfer to this schoolfrom another school receive credit in theretirement system for their years ofteaching experience?
I
Yes Continue with bNo Skip to item 58
1
Eli T 1i
CREDITCH2
1
III
b. Under what circumstances can teachersreceive this credit?
Mark (X) all that apply.
i
By transferring from another school within theSAME organization or body (i.e., from a schoolof the same church affiliation)
From a rollover of the previous retirement planinto this school's retirement plan
By purchasing credit in this school'sretirement plan
Other Specify ,If-
r----L3211 1
SAMEORGSA
322] 2
ROLLOVER
1 323 1 3
PURCHASE
1
13244
OTHERCRD1
1
1
1
58. Which of the following criteria are used inconsidering applicants for teaching positionsin this school?
a. Full standard certification by a privateschool organization or association
1
I
1
1
1
Not usedUsed but not requiredRequired
1325 1
CERTPVT 2
3
b. Full standard STATE certification for fieldto be taught
Not usedUsed but not requiredRequired
326 1
2
FULLCERT 3
C. At least emergency or temporarySTATE certification or endorsementfor field to be taught
Not usedUsed but not requiredRequired
1 327 1
2EMERCERT
3
d. Graduation from a state-approved teachereducation program
i
Not usedUsed but not requiredRequired
I 328 1
2TEACHED
3
e. College major or minor in field to be taughtIII Not used
Used but not requiredRequired
325 1 1
MAJORFLE;3
f. Passage of a local SCHOOL test of basicskills or subject knowledge
Not usedUsed but not requiredRequired
--I 30 11
DISTEST2
3
9. Passage of a STATE test of basic skills
1
III Not usedUsed but not requiredRequired
1 331 ] 1
STABASIC2
3
h. Passage of a STATE test of subject knowledgeNot usedUsed but not requiredRequired
3321 i
STASUBJ 2
3
I. Passage of the National Teachers Examination
t
Not usedUsed but not requiredRequired
It 333) i
NTEPASS !3
FORM SASS-3B 11 2-4-901
436Page 21

> SECTION 3 SCHOOL PERSONNEL POLICIES Continued
59. Not counting interruptions, how long did it SRVHRS
take to complete this survey? 1 334 Hours
Please record both hours and minutes, ANDe.g., "1" hour and "30" minutes. I SRVYMINS
1 335 Minutes
Remarks
THIS COMPLETES THE QUESTIONNAIRE.
THANK YOU FOR ASSISTING US IN THIS IMPORTANT RESEARCH.
YOUR TIME AND EFFORT ARE APPRECIATED.
Page 22
Ag7
FORM SASS -3R 112-4-901

Appendix F F-77
Public School Teacher Questionnaire (SASS 4A)
438

FORM SASS-4A112 -27 -901 U.S. DEPARTMENT OF COMMERCE
BUREAU OF THE CENSUSACTING AS COLLECTING AGENT FOR
U.S. DEPARTMENT OF EDUCATIONNATIONAL CENTER FOR EDUCATION STATISTICS
SCHOOLS AND STAFFING SURVEYPUBLIC SCHOOL TEACHER QUESTIONNAIRE
1990-1991
OMB No. 1850-0598Approval Expires 12/31/92
This report is authorized by law 120 USC 1221e). Your answerswill be kept strictly confidential. Results from this survey willappear in summary or statistical form only, so that individualscannot be identified.
Bureau of the CensusCurrent Projects Branch1201 East Tenth StreetJeffersonville, IN 47132
This questionnaire is intended only for the teacher whosename appears on the address label.
If you are that teacher, please complete this questionnaireand return it to the Bureau of the Census in the enclosedpreaddressed envelope. Please return it within 2 weeks.
If you have any questions, call the Bureau of the CensusCOLLECT at (301) 763-5507.
If the teacher named on the label is no longer teaching atthis school, please mark the appropriate box below andreturn this questionnaire to the Bureau of the Census in theenclosed envelope.
i Teacher has transferred to another school2 Teacher has retired3 Teacher is deceased4 Teacher has left this school for another reason5 Teacher named on label has never worked at this school
THIS SURVEY HAS BEEN ENDORSED BY
American Association for Counseling and Development
American Association of School Administrators
American Federation of Teachers
Council of Chief State School Officers
National Association of Elementary School Principals
National Association of Secondary School Principals
National Education Association
Please correct any errors in nameand address, including
ZIP Code.
BEST COPY AVAILABLE
439

Dear Teacher:
The National Center for Education Statistics (NCES) of the U.S. Department of Educationrequests your participation in the Teacher Survey for the 1990-1991 Schools and StaffingSurvey. You are one of 65,000 teachers from public and private schools across the nationselected to be in the sample.
The Schools and Staffing Survey, first conducted in school year 1987-88, is an integrated setof surveys consisting of the Teacher Demand and Shortage Survey, the School Survey, theSchool Administrator Survey, and the Teacher Survey. These surveys are being conductedperiodically to measure critical aspects of teacher supply and demand, the composition of theadministrator and teacher work force, and the general status of teaching and schooling. Thepurpose of the Teacher Survey is to obtain information about such factors as the education andtraining, current assignment, job mobility, workplace conditions, and career choices of teachers,as well as their opinions about various policy issues such as merit pay or incentive pay.
The U.S. Bureau of the Census is conducting the survey for the National Center for EducationStatistics by the authority of Section 406(b) of the General Education Provisions Act, asamended (20 USC 1221e). The data will be treated as confidential and will be reported only instatistical summaries so that individual teachers cannot be identified.
We are conducting this survey with a sample of teachers. While this minimizes overall responseburden, the value of each individual survey response is greatly increased because it representsmany other teachers. I therefore encourage you to participate in this voluntary survey bycompleting this questionnaire and returning it within 2 weeks to the Bureau of the Census,Current Projects Branch, 1201 East Tenth Street, Jeffersonville, IN 47132, in thepreaddressed envelope enclosed for your convenience.
I thank you for your cooperation in this very important effort.
Sincerely,
Emerson J. ElliottActing CommissionerNational Center for Education Statistics
Enclosures
INFORMATION ABOUT YOUR PARTICIPATION
Public reporting burden for this collection of information is estimated to average one hour perresponse, including the time for reviewing instructions, gathering the data needed, andcompleting and reviewing the collection of information. Send comments regarding this burdenestimate or any other aspect of this collection of information, including suggestions forreducing this burden, to the U.S. Department of Education, Information ManagementandCompliance Division, Washington, DC 20202-4651; and to the Office of Management andBudget, Paperwork Reduction Project 1850-0598, Washington, DC 20503.
Page 2
440 BESTCOPYAVAILABLE
FORM SASS4A 112-27-90)

INSTRUCTIONS
Most of the items on this questionnaire are arranged so If you are unsure about how to answer a question, pleasethat the questions are on the left side of the page and the give the best answer you can and make a comment in theanswer categories or spaces for written answers are on "Remarks" space. Please include the item number.the right. Please answer the questions by marking theappropriate answer category with an X, or recording youranswer in the space provided. We suggest that you use a If you have any questions, call the Bureau of the Censuspencil, rather than a pen or marker. COLLECT at (301) 763-5507.
Notice that at the end of some answer categories andanswer spaces, there are instructions to skip to later Return your completed questionnaire to the Bureau of theitems or to continue with the next item on the Census in the enclosed postage-paid envelope. Pleasequestionnaire. return it within 2 weeks.
Remarks
Please keep count of the time you spend completing this questionnaire.At the end of the survey, you are asked to record the amount of time spent.
SECTION I CURRENT TEACHING STATUS
1 . How do you classify your MAIN assignmentat THIS school (i.e., the activity at which youspend MOST of your time) during thisschool year?
Mark (X) only one box.
011 1 Regular full-time teacher Skip to item 5
2 Regular part-time teacher3 Itinerant teacher (i.e., your
assignment requires you to provideinstruction at more than one school) Continue
4 Long-term substitute (i.e., your with item 2assignment requires that you fill therole of a regular teacher on a long-term basis, but you are stillconsidered a substitute)
5 Short-term substitute6 Student teacher7 Other professional staff (e.g., counselor, librarian,
curriculum coordinator, social worker)8 Administrator (e.g., principal, assistant
principal, director, head)9 Teacher's aide
10 Support staff (e.g., secretary)
IF YOU MARKED BOX 5, 6, 7, 8, 9, OR 10 ABOVE, PLEASE STOP NOW AND RETURN THIS QUESTIONNAIRETO THE BUREAU OF THE CENSUS. THANK YOU FOR YOUR TIME.
FORM SASS-4A 112-27-90)
BEST COPY AVAILABLE 441Page 3

SECTION I CURRENT TEACHING STATUS ContinuedT
2. How much time do you work as a TEACHER 1
at this school? 1
Mark (X) only one box. i
Full time Skip to item 5time or more, but less than full-time Continuetime or more, but less than 3/4 time withtime or more, but less than 1/2 time item 3
than 1/4 time
012 1
2
3
4
5
3/4
1/2
1/4
Less
3a. Do you have any other assignment at THISschool? Continue with b
Skip to item 4013 1 Yes
2 No
b. Which of these best describes your other Administrator (e.g., principal, assistant014 I 1
assignment at this school?
Mark (X) only one box. 2
principal, director, head)CounselorLibrarian/media3 specialist
4 Coach5 Other professional staff (e.g.,
department head, curriculumcoordinator)
6 Support staff (e.g., secretary, aide)7 Other Describe 7
C. Including your teaching and other assignment, areyou a FULL-TIME EMPLOYEE at this school? Skip to item 5015 1 Yes
1
2 No Continue with item 41
4. In addition to employment at this school, what isyour OTHER main activity?
in another schoolWorking as a paid tutor
016 1 Teaching2
Mark (X) only one box. 3 Student at a college or university4 Working in a nonteaching occupation in the
field of education (e.g., guidance counselor)5 Working in an occupation outside the
field of education6 Caring for family members7 Seeking work
SECTION 2 TEACHING EXPERIENCE
5. In what year did you begin your first teachingposition (full-time or part-time) at the elementaryor secondary level? Do not include time spent as astudent teacher.
017
6. What was your MAIN activity the year before youbegan teaching at the elementary or secondarylevel?
Student at a college or universityCaring for family members
ip to
018 1
2
3
Mark (X) only one box. 4
Working as a substitute teacher item 9in a preschoolTeaching
5 Teaching at a college or university
6 Working in a nonteaching position in the fieldeducation Continue with item 7of
7 Working in an occupation outside the field ofSkip to item 8education
8 Military service Skip toSeeking9 work item 9
10 Retired from another job
Page 4
442
r_,P.M SASS-4A 112-27901

SECTION 2 TEACHING EXPERIENCE Continued
NOTE: Answer item 7 ONLY if you marked box 6in answer to question 6 on page 4.
7. Which of these categories best describesyour previous position in the field ofeducation?
Mark (X) only one box.
I
1 Administrator (e.g., principal,assistant principal, director)
019
2 Counselor3 Librarian/media specialist4 Coach Skip to5 Other professional staff (e.g., department item 9
head, curriculum coordinator)6 Instructional aide7 Noninstructional support
staff (e.g., secretary)
NOTE: Answer items 8a e ONLY if you marked box 7 in li
answer to question 6 on page 4. I
8a. For whom did you work? Record the name of the II
company, business, or organization.1
b. What kind of business or industry was this?For example, retail shoe store, State LaborDepartment, bicycle manufacturer, farm.
1
I
41020I
1
C. What kind of work were you doing?Please record your job title; for example, electricalengineer, cashier, typist, farmer, loan officer.
021
d. What were your most important activities orduties at that job? For example, typing, sellingcars, driving delivery truck, caring for livestock.
e. How would you classify yourself on that job?
Mark (X) only one box.1 An employee of a PRIVATE company, business, or022
i individual for wages, salary, or commission2 A FEDERAL government employee3 A STATE government employee4 A LOCAL government employee5 SELF-EMPLOYED in your own business,
professional practice, or farm6 Working WITHOUT PAY in a
family business or farm7 Working WITHOUT PAY in a volunteer job
9. Including this school year, at which of theseschool levels have you taught, either full- orpart-time, for one year or more?
Mark (X) all that apply.
1 Prekindergarten023
2 Elementary (including kindergarten)0241
3 Middle school or junior high025
4 Senior high026
5 Postsecondary027
10a. Have you ever worked as an elementary orsecondary teacher in a PRIVATE SCHOOL?
1
Yes Continue with br 0282 El No Skip to item 1 1 a
b. How many years did you teach FULL-TIME inprivate schools?
Record whole years, not fractions or months.
Years029
i0 None
C. How many years did you teach PART-TIME inprivate schools?
Record whole years, not fractions or months.Years030
i o None
ORM SASS-4A 112-27-90)
4 4 3- - BEST COPY AVAILABLE
Page 5

SECTION 2 TEACHING EXPERIENCE Continued
11a. How many years have you worked as aFULL-TIME elementary or secondaryteacher in PUBLIC schools? Include thecurrent school year if you are a full-time Years031
FTPUB
teacher this year. o NoneRecord whole years, not fractions or months.
b.
If less than 4 months, mark "None."
How many years have you worked as aPART-TIME elementary or secondary I
teacher in PUBLIC schools? Include thisschool year if you are a part-time teacherthis year.
PTPUB
Years032
o NoneRecord whole years, not fractions or months.If less than 4 months, mark "None."
12a. Since you began teaching, how many times haveyou had a break in service of one year or more? t 033
I Breaks in service Continue with b
b.
o None Skip to item 13
Were any of these breaks due to areduction-in-force or a lay-off? I 035
034 1 Yes How many? ....-
2 No
C. How long was the most recent break in service?
d.
036 Years
Since your most recent break in service, howmany consecutive years have you been teaching?Include the current year and count each year, whetherfull- or part-time, as one year.
037 Years
13. In what year did you begin teachingin THIS school? 038
If your assignment at this school has included abreak in service of one year or more, please reportthe year that you returned to this school from yourmost recent break in service.
1
14. What was your main activity the year before you 1 039 i 1 Teaching in another elementary orbegan teaching in THIS school? secondary school IN THIS SCHOOL SYSTEM
If you left this school and then returned, please 2 Teaching in an elementary or secondary schoolIN A DIFFERENT SCHOOL SYSTEM IN THIS
report your main activity the year before you mostrecently returned to this school.
STATE3 Teaching in an elementary or secondary
Mark (X) only one box. school IN A DIFFERENT STATE4 Working as a substitute teacher
Teaching in a preschool5
Teaching at a college or university6
Working in a position in the field of7
education, but not as a teachera Working in an occupation outside
the field of education9 Caring for family members
10 Student at a college or university11 Military service12 Unemployed and seeking work
13 Retired from another job
Page 6
444FORM SASS-4A (12 -27 -901

SECTION 3 TEACHER TRAINING
MAJOR AND MINOR FIELD OF STUDY CODES FOR QUESTIONS 15, 16, AND 17
EDUCATION GENERALGeneral education Special education 06 Agriculture and natural 37 Music01 Pre-elementary/early 67 Special education, general resources 39 Philosophy
childhood education 68 Emotionally disturbed 86 American Indian studies 41 Psychology03 Elementary education 69 Mentally retarded (Native American) 42 Public affairs and services04 Secondary education 70 Speech/language impaired 87 Other area and ethnic 44 Religion, theology
71 Deaf and hard-of-hearing studiesSubject area education 72 Visually handicapped 08 Architecture and Foreign languages07 Agricultural education 73 Orthopedically impaired environmental design 51 French11 Art education 74 Mildly handicapped 10 Art, fine and applied 52 German13 Bilingual education 75 Severely handicapped 14 Business and management 53 Latin15 Business, commerce, and 76 Specific learning disabilities 16 Communications and 54 Russian
distributive education 77 Other special education journalism 55 Spanish89 Crosscultural education 17 Computer and information 56 Other foreign languages22 English education sciences Natural sciences23 English as a second language Other education 19 Drama, theater 57 Biology/life science24 Foreign languages education 78 Curriculum and instruction 20 Engineering 58 Chemistry29 Home economics education 79 Educational administration 21 English (literature, letters, 59 Geology/earth science88 Indian education (Native American) 80 Educational psychology speech, classics) 60 Physics30 Industrial arts, vocational 81 Counseling and guidance
and technical, trade 82 Other education25 General studies 61 Other natural sciences27 Health professions and
and industry education occupations Social sciences34 Mathematics education 28 Home economics 62 Economics38 Music education 85 Humanities 63 History40 Physical education/health 31 Law 64 Political science and
education 32 Library science government43 Reading education 33 Mathematics 65 Sociology45 Religious education 35 Military science 66 Other social sciences46 Science education 36 Multi/interdisciplinary48 Social studies/social
sciences educationstudies 84 Other
1
15a. Do you have a bachelor's degree? 1 040 1 Yes Continue with bt1
2 No Skip to item 17a
b. What was your major field of study? 1
I 041Enter the major field and the two-digit t
code from the list above. i Code Major field
C. In what year did you receive yourbachelor's degree?
042
d. Did you have a second major or a minor 1 Yes Continue with e043field of study?
2 No Skip to item 16a
e. What was your second major or minorfield of study? 044Enter the field and the two-digit code fromthe list above. Code Second major or minor field
16a. Do you have a master's degree? 1 Yes Continue with b0452 No Skip to item 17a
b. What was your major field of study? 046Enter the major field and the two-digit
Code Major fieldcode from the list above.
C. In what year did you receive yourmaster's degree? 047
Remarks
BEST COPY AVAILABLE
ORM SASS-4A 112-27-901
445
Page 7

SECTION 3 TEACHER TRAINING Continued
17a. Do you have any other type of degree? I 0481 Yes Continue with b
I 2 No Skip to item 18a1
b. What other degree(s) have you earned?Mark (X) all that apply in column (b) below.
C. What was your major field of study for each degree?In column (c) below, enter the appropriate field name andtwo-digit code from the list at the top of the previous page.
d. On what year did you receive each degree?
(b)Degree(s) earned
Mark (X) all that apply.
(c)
Major field code
(d)
Year degree received
0491 0501 051
1 Associate degree [ICode Major field
052 Education 053 I 054 I2 specialist orprofessional diploma (at leastone year beyond Master's level)
I
Code Major field
055 13 Doctorate or first professional 0561 057
degree (Ph.D., Ed. D., M. D.,L.L.B., J.D., D.D.S.)
I19
Code Major field
TEACHING ASSIGNMENT FIELD CODES FOR QUESTIONS 18, 21, and 22
01 Prekindergarten 28 Home economics Science Special education02 Kindergarten 16 Journalism 57 Biology/life science 67 Special education, general03 General elementary 33 Mathematics 58 Chemistry 68 Emotionally disturbed
35 Military science 59 Geology/earth 69 Mentally retarded37 Music science/space science 70 Speech/language impaired
Special areas 39 Philosophy 60 Physics 71 Deaf and hard-of-hearing86 American Indian studies 40 Physical education, 61 General and all other 72 Visually handicapped
(Native American) health science 73 Orthopedically impaired10 Art 43 Reading 74 Mildly handicapped12 Basic skills and remedial education 44 Religion Vocational education 75 Severely handicapped13 Bilingual education 47 Social studies/social 05 Accounting 76 Specific learning disabilities17 Computer science science 06 Agriculture 77 Other special education18 Dance 14 Business, marketing19 Drama/theater Foreign language 27 Health occupations21 English/language arts 51 French 30 Industrial arts 84 All others23 English as a second language 52 German 49 Trade and industry26 Gifted 53 Latin 50 Technical
54 Russian 83 Other vocational education55 Spanish56 Other foreign language
18a. What is your MAIN teaching assignment at thisschool, that is, the field in which you teach themost classes?Enter your main teaching assignment field and thetwo-digit code from the list above. If your teachingschedule is divided equally between two fields,record either field as your main assignment for thisitem, mark box 1, and enter the code for the otherfield in item 18b.
058
Code Main assignment field
059 1 Teaching assignment equallydivided between two fields
b. Do you teach classes in OTHER fields atthis school?
BEST COPY AVAILABLE
060 1 Yes In what field do youteach the secondmost classes?Use the assignment 061field codes listedabove. ir.
Code2 No
Page 8
446
FORM SASS-4A (12-27-901

SECTION 3 TEACHER TRAINING Continued
19a. Have you ever taken any college level COURSES 10624
1 Yes Continue with bin teaching methods or education?2 No Skip to Check Item A
b. How many graduate and undergraduate i Number of education COURSESCOURSES in teaching methods or education i Undergraduate Graduatehave you ever taken?Include courses you are now taking, as well ascourses taken to earn a degree and courses takenoutside a degree program.Please record the number of COURSES, not credithours.
063 Course(s) 064 Course(s)ro None o None
-CHECKITEM A
Is your main teaching assignment field 10651 Yes Skip to item 21aprekindergarten, kindergarten, general2 No Continue with item 20aelementary, or special education?
20a. Have you ever taken any college level COURSESin the subject area that is your MAIN teaching i 066 1 Yes Continue with bassignment (i.e., the subject in which you teach i
the most classes)? 2 No Skip to item 21a
b. How many COURSES have you ever taken in Number of subject matter COURSESthis subject area? i Undergraduate GraduateInclude all college level COURSES that are related to 1067
Course(s) 068 Course(s)the main subject you teach. Include courses you are I
now taking. Include both undergraduate and graduate o Nonecourses. Include courses taken to earn a degree andthose taken outside a degree program.
Please record the number of COURSES, notcredit hours.
o None
21a. What field do you feel BEST QUALIFIED to teach,regardless of whether you currently teach in that 069field? Enter the field and the two-digit code from thelist on page 8.
Code Best qualified field
b. Do you feel qualified to teach any other fields? 0701 1 Yes For what field do you feelsecond best qualified?Use codes listed on page 8.
071
Code2 N o
22. Has MAIN teaching assignment fieldyouri What was your previouschanged since you began teaching?
field?-
main assignmentUse codes listed on page 8. i
Code072 1 Yes Counting this year, howmany consecutive yearshave you been teaching inyour current assignment 074field? ..-
Years2 N o
23a. At this school, do you teach any students in anyof grades 7-12?
1 07511 0 Yes Continue with b2 No Skip to item 24a
b. At this school, do you teach any classes incomputer kindscience, mathematics, or any of
1science, such as biology, chemistry, or general 076 Yes Continue with cscience? i 2 No Skip to item 24a
FORM SASS-4A 112-27-901
287-585 91 - 2 : QL 3
BESTCOPYAVAILABLE
Page 9
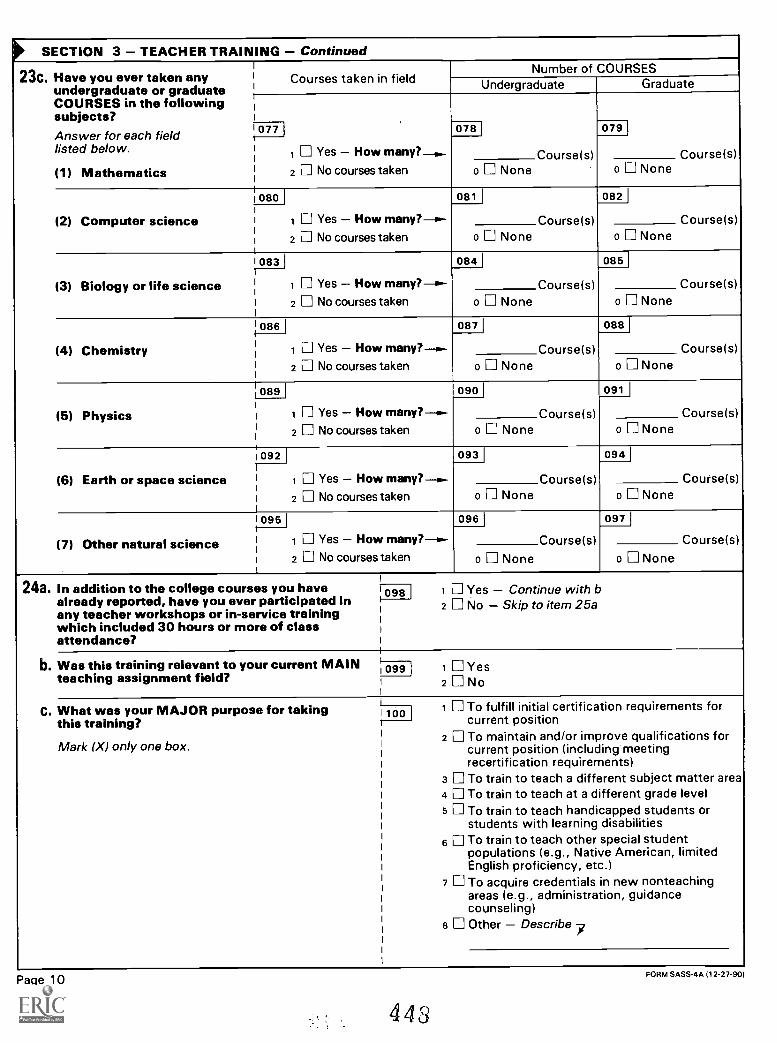
SECTION 3 TEACHER TRAINING Continued
23c. Have you ever taken anyundergraduate or graduateCOURSES in the followingsubjects?
Courses taken in fieldNumber of COURSES
Undergraduate Graduate
Answer for each field 077 1 078 079
listed below.1 Yes How many?, Coursels) Course(s)
(1) Mathematics 2 No courses taken o None o None
080 1 081 1 082
(2) Computer science many?-- Course(s) Course(s)1 Yes How2 No courses taken o None o None
1083 1 084 1 085
(3) Biology or life science many?-1.- Coursels) Course(s)1 Yes How1
I 2 No courses taken o None o None1
: 086 1 087 1 088
(4) Chemistry many? Course(s) Course(s)I
1
1 Yes How1 2 No courses taken o None o None1
089 090 1 091 1
(5) PhysicsI many?..-- Course(s) Course(s)1 Yes How1
2 No courses taken o None o None1
i
1092 1 093 1 094 1
(6) Earth or space science many?o- Course(s) Course(si 1 Yes How2 No courses taken o None o None
1095 1 096 1 097
(7) Other natural science many? Course(s) Coursels)i 1 Yes How
2 No courses taken o None o None
i
24a. In addition to the college courses you havealready reported, have you ever participated in I
any teacher workshops or in-service training
1098 1 Yes Continue with b
1
2
1
No Skip to item 25a
which included 30 hours or more of class1
attendance? 1
1
b. Was this training relevant to your current MAIN 10991 Yes
teaching assignment field?I 2 N o1
C. What was your MAJOR purpose for takingthis training?
1To fulfill initial certification requirements for
1001
current position2 To maintain and/or improve qualifications for
Mark (X) only one box. current position (including meetingrecertification requirements)
3 To train to teach a different subject matter area4 To train to teach at a different grade level5 To train to teach handicapped students or
disabilitiesstudents with learning6 To train to teach other special student
populations (e.g., Native American, limitedEnglish proficiency, etc.)
7 To acquire credentials in new nonteachingareas (e.g., administration, guidancecounseling)
8 Other Describe 7
Page 10
443
FORM SASS-4A 112-27-90)

SECTION 3 TEACHER TRAINING Continued
25a. Do you have a teaching certificate in ithis state in your MAIN teachingassignment field?
1
YesNo
Continue with bSkip to item 26a
101 1 1
1 2
1
b. What type of certification do youhold in this field? Advanced professional certificate
or standard state certification (the
102 1
2 RegularMark (X) only one box. standard certification offered in your state)
3 Probationary certification (the initial certificateissued after satisfying all requirements except thecompletion of a probationary period)
4 Temporary, provisional, or emergency certification(requires additional coursework before regularcertification can be obtained)
1
C. In what year were you certified in your mainteaching field by this state?
I 103
26a. Do you have a teaching certificate inthis state in your OTHER teachingassignment field at this school?
Yes Continue with b
o
i 104 1
2 I. N3 Not applicable; I do not
Skip to item 27aanother teachinghaveassignment field.
b. What type of certification do youhold in this field? Advanced professional certificate
or standard state certification (the105 1
2 RegularMark (X) only one box. standard certification offered in your state)
3 Probationary certification (the initial certificateissued after satisfying all requirements except thecompletion of a probationary period)
4 Temporary, provisional, or emergency certification(requires additional coursework before regularcertification can be obtained)
C. In what year were you certified in this 1-106
field by this state?
27a. Are you a member of any professional Yes107 1teacher or educational organization?1 2 ONo
b. Have you participated in workshops,i Yes Continue with c108 1seminars or conferences sponsored by1any of these organizations? 2 No Skip to item 28a
C. How often do you participate in theseactivities? Less than once a year1091 1
4-
2 Once or twice a yearMark (X) only one box.
i 3 Three or more times a year
28a. During your first year of teaching, did youparticipate in a formal teacher inductionprogram, i.e., a program to help beginningteachers by assigning them to master ormentor teachers? Do not include studentteaching.
YesNo
11() 1
i 2
b. Are you currently a master or mentor teacher Yes111 1
(i.e., a teacher who provides guidance and2 N oassistance for beginning teachers) in a formal
teacher induction program? Do not includesupervision or training of student teachers.
BESTCOPYAVAILABLE
FORM SASS-4A (12-27-901
449
Page 11
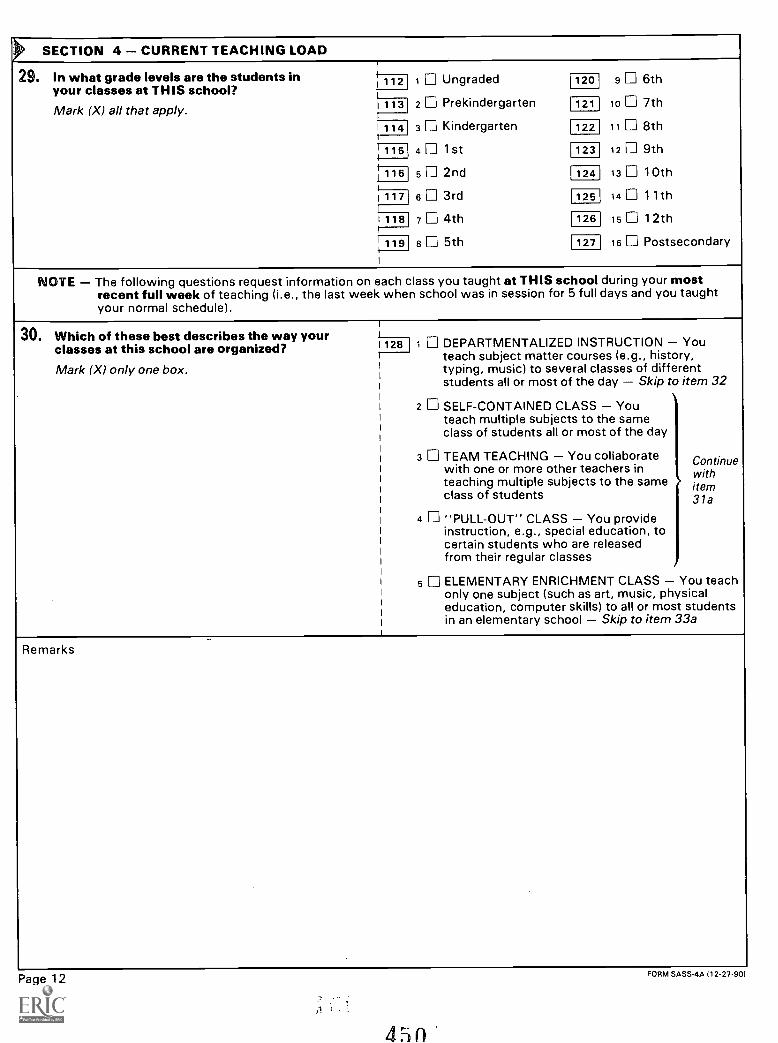
)'- SECTION 4 CURRENT TEACHING LOAD
29. In what grade levels are the students in i 112 1 Ungraded 120 9 6thyour classes at THIS school?Mark (X) that 1131 2 Prekindergarten 121 10 7th
all apply.1141 3 Kindergarten 122 11 8th
115 4 II 1St 123 12 9th
1 161 5 2nd 124 13 10th
117 6 3rd 125 14 1 1 th
118 7 4th 126 15 12th
119 8 5th 127 16 Postsecondary
NOTE The following questions request information on each class you taught at THIS school during your mostrecent full week of teaching (i.e., the last week when school was in session for 5 full days and you taughtyour normal schedule).
30. Which of these best describes the way your You
item 32
Continuewithitem31a
You teach
students33a
classes at this school are organized? 128 1 DEPARTMENTALIZED INSTRUCTIONteach subject matter courses (e.g., history,
Mark (X) only one box. i typing, music) to several classes of differentstudents all or most of the day Skip to
2 SELF-CONTAINED CLASS Youteach multiple subjects to the sameclass of students all or most of the day
3 TEAM TEACHING You collaboratewith one or more other teachers inteaching multiple subjects to the sameclass of students
4 "PULL-OUT" CLASS You provideinstruction, e.g., special education, tocertain students who are releasedfrom their regular classes
5 ELEMENTARY ENRICHMENT CLASSonly one subject (such as art, music, physicaleducation, computer skills) to all or mostin an elementary school Skip to item
Remarks
Page 12
4511
FORM SASS-4A (12-27-90)

SECTION 4 CURRENT TEACHING LOAD
NOTE Answer this question if you marked category2, 3, or 4 in item 30 on page 12.
31a. At THIS school, how many students were enrolledin the class or program you taught during yourmost recent full week of teaching?If teach two kindergartenyou or prekindergarten 1sessions per day, report the average number of 1129 Studentsstudents. I
b. During your most recent full week of teaching,approximately how many hours did you spendteaching each of these subjects at THIS school?
If you taught two or more subjects at the same time,apportion the time to each subject as best you can.
Report hours to the nearest whole hour, e.g., 1, 2.
If you did not teach a particular subject during theweek, mark the "None" box.
Subject Hours per week
(1 English/reading/language arts)
130
o None
(2) Arithmetic/mathematics
131
o None
(3) Social studies/history
1321
o None
(4) Science
133
o None
C. Did you assign any homework during your mostrecent full week of teaching at THIS school? 1134 1 Yes
2 N o
students
students
students
achievement levels
ON PAGE 16.
d. Which of these best describes the general 135 1 Primarily higher achievingacademic achievement level of your studentsrelative to the other students at this school?
Mark (X) only one box.
I 2 Primarily average achieving
3 Primarily lower achievingi 4 Students of widely differing
PLEASE SKIP NOW TO ITEM 34a
Remarks
BEST COPY AVAILABLE
FORM SASS-4A (12- 27 -90)
451Page 13

SECTION 4 CURRENT TEACHING LOAD Continued
NOTE: Answer items 32a-i ONLY if you taught subjectmatter (departmentalized) courses to differentgroups of students, i.e., you marked box 1 for item30 on page 12.
Item 32 refers to the subject matter classes youtaught at THIS SCHOOL during your most recentFULL week of teaching. Exclude study halls,homeroom period, unscheduled tutoring, etc.
32a. How many separate classes (sections) did youteach at this school during your most recentFULL week of teaching?
If you teach two classes of the same subject (e.g.,algebra I) to two different groups of students, countthem as two separate classes. For example, if youteach two classes of chemistry and three classes ofphysics, you would enter "5."
136 Classes
Answer b-i by completing a line in the table on page 15 for each class that you taught at THIS school.The number of lines completed in the table should equal the number entered for item 32a above.
b. What was the subject matter of the class? Use subject matter codes listed on page 15.
C. How many times per week does the class meet?
d. What is the grade level of MOST of the students in the class? Use numerals 1 to 12 for grades 1-12, Kfor kindergarten, PS for postsecondary, U for ungraded, and PK for prekindergarten.
e. How many students are enrolled in the class?
f. How many students in the class are male?
g. What is the total number of students in the class who are Black, Hispanic, American Indian,Alaskan Native, Pacific Islander, or Asian?
h. What is the achievement level of the students in the class compared to other students in the school?Use these codes to record the answer in column (hl.
1 Primarily higher achieving 3 Primarily lower achieving2 Primarily average achieving 4 Widely differing achievement levels
1. Which one of the following best describes the class? Enter only one code for each class in column (i).
1 General track 6 Gifted2 Academic/college preparatory 7 Remedial3 Advanced placement/college credit 8 Special education
allows completion of college credit 9 Vocational4 Honors course 0 None of the above5 Bilingual
Page 14
452
FORM SASS-4A (12-27-901

SECTION 4 CURRENT TEACHING LOAD Continued
SUBJECT MATTER CODES FOR ITEM 32b Enter code in column (b) below.Vocational education Foreign languages Computer science Social science Visual and performing arts01 Agriculture 31 French 52 Computer 70 Social studies 81 Arts and crafts02 Business, marketing 32 German awareness/applications 71 History 82 Filmmaking/photography03 Industrial arts 33 Latin 53 Computer programming 72 World civilization 83 Chorus04 Health occupations 34 Russian 54 Other computer science 73 Political science/ 84 Band05 Vocational home economics 36 Spanish government 85 Drama/theater/dance06 Trade and industry 36 Other foreign language 74 Geography 86 Music07 Technical 76 Economics 87 Other visual/performing arts08 Accounting/bookkeeping 76 Civics09 Shorthand Mathematics 77 Sociology/social10 Typing 41 General mathematics Natural science organization11 Career education 42 Business math 61 General science 78 Other social science Other areas12 Other vocational education 43 Algebra, elementary 62 Biology/life science 91 Driver educationEnglish/language arts 44 Algebra, intermediate 63 Chemistry 92 Health45 Algebra, advanced 64 Physics 93 Nonvocational home21 Literature 46 Geometry, plane/solid 66 Geology/earth science/ economics22 Composition/journalism/ 47 Trigonometry space science 94 Philosophycreative writing 48 Analytic geometry/ 66 Other physical science 95 Physical education23 Reading math analysis 67 Other natural science 96 Psychology24 English as a second language 49 Probability/statistics
97 Religion25 Other English/language arts 50 Calculus98 Other courses notcourses 61 Other mathematics
elsewhere classified
Class(section)
Subjectmattercode
(2 digits)
(b)
Number oftimes per
week
(c)
Grade levelof MOST
students inclass
(d)
Number ofstudents inthe class
(a)
Number ofmales in the
class
(f)
Number ofminorities in
the class
(g)
Classachievement
levelUse codes on
page 14(h)
Type of classUse codes on
page 14
(i)
1
137 1 138_1 1 140 1 :141 I 142 1 143 1 144_139.1
2
145 1 146] 147 I 148 1 149 1 150 1 151 1 152 I
3
153 1 154 1 155 156 I "157 1 158 159 1 160 I
4
161 I 162 ,_163 1 164 I 165 I 166 1 167 1 168 I_1
5
169 1 170] 171 I 172 1 1 174 1 175 I 176 I_173
6177 1 178] 179 I 180_l :181 I 182 I 183 1 184 1
7
185 I 186 .1 187 1 188] 189 1 190 1 192 1_191
8193_1 194 ] 195 I 196 1 197 I 198 I I 200,199
9201 1 202 203 I 204 1 205 I 206 1 207 1 208 I_1
10209 1 210.1 211 1 212] 213 1 214 215 I 216 I_1
PLEASE SKIP NOW TO ITEM 34a ON PAGE 16.
FORM SASS-4A 112-27-901
4 5 3 BESTCOPYAVAILABLE,
Page 15

SECTION 4 CURRENT TEACHING LOAD Continued
NOTE: Answer items 33a and b below only if you marked"Elementary enrichment class" (box 5) in item 30on page 12.
33a. What is the total number of students enrolled inall the classes you teach at THIS school? Students217
b. How many times per week does each class usually imeet?
If your classes have alternating schedules, e.g., 3 i
times one week and 2 times the next, mark the box for ithe most times a class would meet in one week.
Mark (X) only one box.
1 Once2 Twice
218
3 Three times4 Four times5 Five times6 More than 5 times
34a. How many hours were you required to be atthis school during your most recent full WEEKof teaching?
Report in whole hours, not fractions or minutes.
If you are an itinerant teacher, report only the hoursrequired for THIS school. Hours per week2191
b. During your most recent full week, how manyhours did you spend AFTER school, BEFOREschool, and ON THE WEEKEND on each of thefollowing types of activities?
Report in whole hours.
(1) School-related activities involving studentinteraction (e.g., coaching, field trips,tutoring, transporting students)
Hours per week22017
j o None
(2) Other school-related activities (e.g.,preparation, grading papers, parentconferences, attending meetings)
Hours per week221
o None
SECTION 5 PERCEPTIONS AND ATTITUDES TOWARD TEACHING
35. For each of the following statements, indicatewhether you strongly agree, somewhat agree,somewhat disagree, or strongly disagree.
a. I usually look forward to each working day atthis school.
1
1
1 Strongly agreet- 222i
i
i
2 Somewhat agree3 Somewhat disagree4 Strongly disagree
b. Staff members in this school generally do nothave much school spirit.
1 Strongly agreei-223
i
i
2 Somewhat agree3 Somewhat disagree4 Strongly disagree
C. This school's administration knows theproblems faced by the staff.
1-1 Strongly agree2241
1-
i
2 Somewhat agree3 Somewhat disagree4 Strongly disagree
d. In this school, the teachers and theadministration are in close agreement onschool discipline policy.
1 Strongly agreei_225
i
i
2 Somewhat agree3 Somewhat disagree4 Strongly disagree
Page 16
454
FORM SASS-4A 112-27-90)
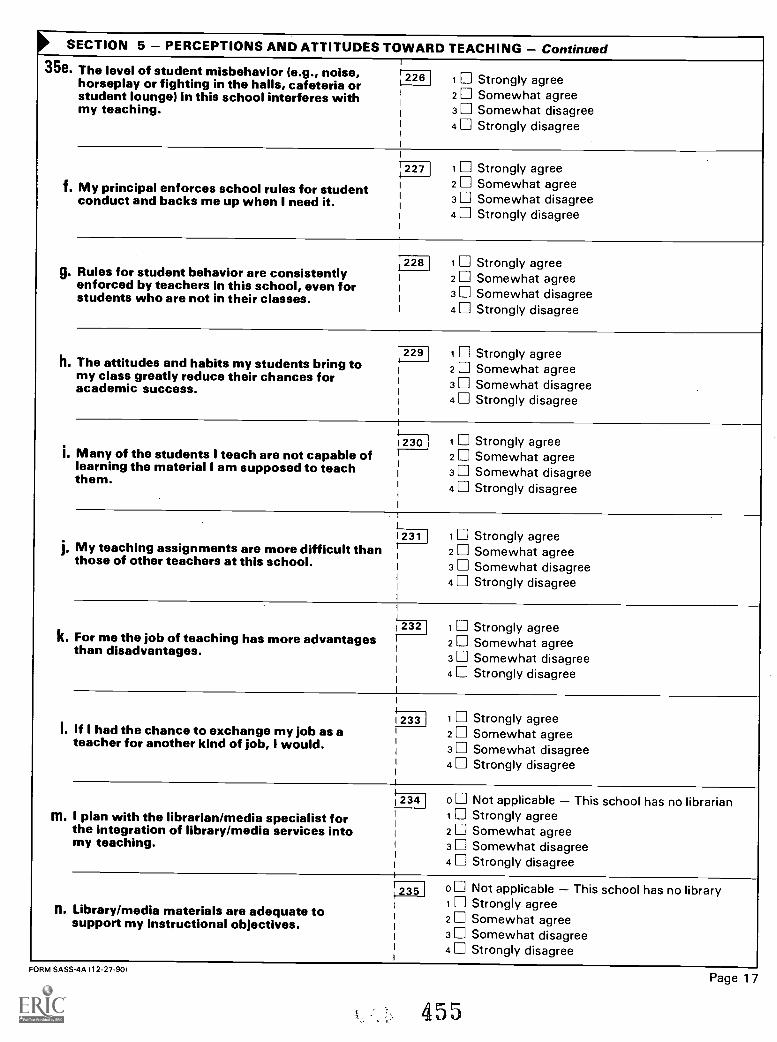
O' SECTION 5 PERCEPTIONS AND ATTITUDES TOWARD TEACHING Continued35e. The level of student misbehavior (e.g., noise,
horseplay or fighting in the halls, cafeteria orstudent lounge) in this school interferes withmy teaching.
1
2
Strongly agreeSomewhat agreeSomewhat disagreeStrongly disagree
226
3
4
1 Strongly agree227
f. My principal enforces school rules for student 2 Somewhat agreeconduct and backs me up when I need it. 3 Somewhat disagree
4 Strongly disagree
i1
1
1 Strongly agree2282
g. Rules for student behavior are consistently Somewhat agreeenforced by teachers in this school, even forstudents who are not in their classes. 3 Somewhat disagree
4 Strongly disagree
1
1229 1 Strongly agreeh. The attitudes and habits my students bring to
i 2 Somewhat agreemy class greatly reduce their chances fori
academic success. 3 Somewhat disagreeStrongly disagree4
1 Strongly agree230i. Many of the students I teach are not capable of 2 Somewhat agree
learning the material I am supposed to teach 3 Somewhat disagreethem.4 Strongly disagree
1 Strongly agreeI 231j, My teaching assignments are more difficult than 2 Somewhat agree
those of other teachers at this school.i 3 Somewhat disagree
4 Strongly disagree
1 Strongly agree232k. For me the job of teaching has more advantages 2 Somewhat agreethan disadvantages.
3 Somewhat disagree4 Strongly disagree
1 Ei Strongly agree233 1I. If I had the chance to exchange my job as a 2 Somewhat agreeteacher for another kind of job, I would. 3 Somewhat disagree
4 Strongly disagree
0 Not applicable This school has no librarian234111. I plan with the librarian/media specialist for 1 Strongly agree
2the integration of library/media services into Somewhat agreemy teaching. 3 Somewhat disagree
4 Strongly disagree
0 Not applicable This school has no library2351 Strongly agreeFL Library/media materials are adequate to i
support my instructional objectives. 2 Somewhat agree3 Somewhat disagree4 Strongly disagree
FORM SASS-4A (12-27-901
455
Page 17

SECTION 5 PERCEPTIONS AND ATTITUDES TOWARD TEACHING Continued
36. If you could go back to your college days andstart over again, would you become ateacher or not?
Mark (X) only one box.
236 1Certainly would become a teacher
2 Probably would become a teacher3 Chances about even for and against4 Probably would not become a teacher
Certainly would not become a teacher
37. Indicate whether you strongly agree, somewhatagree, somewhat disagree, or strongly disagreethat this school is effective in assisting newteachers in each of the following matters.
a. Student discipline
237 Strongly agree2 Somewhat agree3 Somewhat disagree4 Strongly disagree
b. Instructional methods
238 I 1 Strongly agree2 Somewhat agree3 Somewhat disagree4 Strongly disagree
C. Curriculum
239 I 1 Strongly agree2 Somewhat agree3 Somewhat disagree4 Strongly disagree
d. Adjusting to the school environment
240 1 Strongly agree2 Somewhat agree3 Somewhat disagree4 Strongly disagree
38. We are interested in the importance you place onvarious education goals. From the following eightgoals, which do you consider the most important,the second most important, and the third mostimportant?
1 Building basic literacy skills (reading, math,writing, speaking)
2 Encouraging academic excellence3 Promoting occupational or vocational skills4 Promoting good work habits and
self-discipline5 Promoting personal growth (self-esteem,
self-knowledge, etc.)6 Promoting human relations skills7 Promoting specific moral values8 Promoting multicultural awareness
or understanding
241 Most important
242 Second most important
i-243Third most important
39. At this school, how much actual influence do youthink teachers have over school policy in each ofthe following areas?
Use the scale of 1 6, where 1 means "Noinfluence" and 6 means "A great deal of influence."
a. Determining discipline policy
N o A great deal.....
influence of influence
LI 244 1 2 3 4 5 5
1
b. Determining the content of in-service programsI
1 245 1 2 3 4 5 6
I
C. Setting policy on grouping students in classesby ability
I
1246 1 2 3 4 5 6ii
d. Establishing curriculumI
1-
1247 1 2 3 4 5 6
I
Page 18
456
FORM SASS-4A (12-17-90)
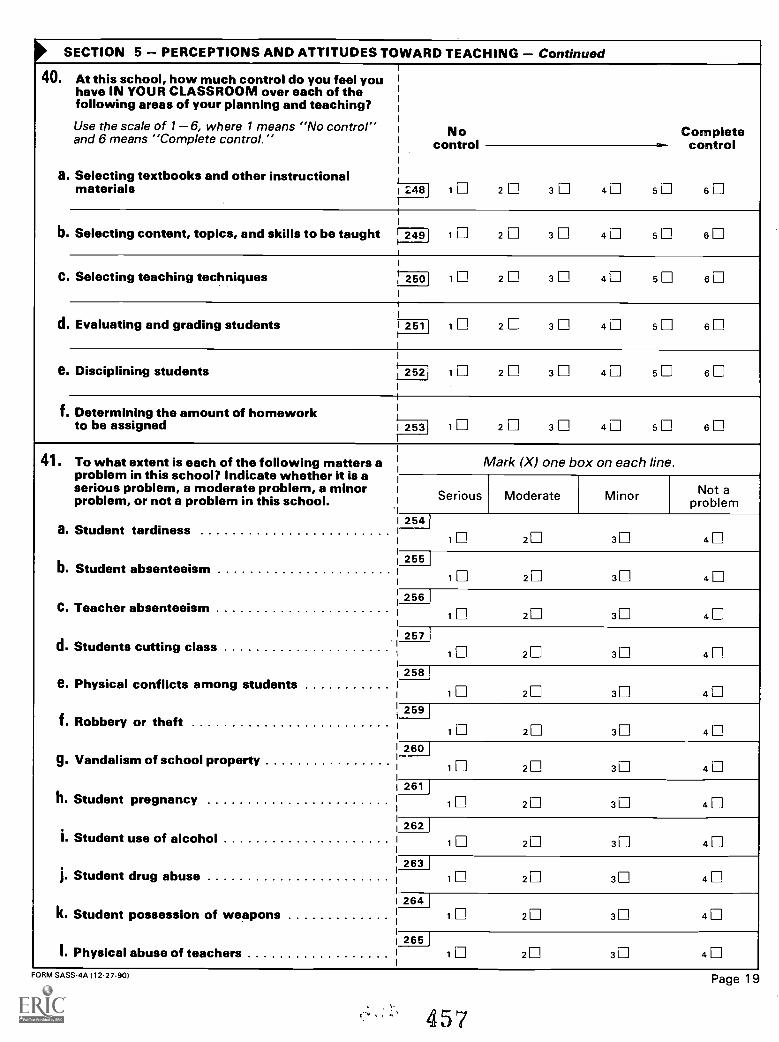
SECTION 5 PERCEPTIONS AND ATTITUDES TOWARD TEACHING Continued
40. At this school, how much control do you feel youhave IN YOUR CLASSROOM over each of thefollowing areas of your planning and teaching?
Use the scale of 1 6, where 1 means "No control"and 6 means "Complete control."
a. Selecting textbooks and other instructionalmaterials 1
No Completecontrol
6
control
1 2 3 4 5248
b. Selecting content, topics, and skills to be taught 1 2 3 4 5 62491
C. Selecting teaching techniques 1 2 3 4 5 6250
d. Evaluating and grading students 1 2 3 4 5 62511
e. Disciplining students 1 2 3 4 5 6252
f. Determining the amount of homeworkto be assigned 1 2 3 4 5 62531
41. To what extent is each of the following matters aproblem in this school? Indicate whether it is aserious problem, a moderate problem, a minorproblem, or not a problem in this school.
a. Student tardiness
b. Student absenteeism
C. Teacher absenteeism
d. Students cutting class
e. Physical conflicts among students
f. Robbery or theft
g. Vandalism of school property
h. Student pregnancy
I. Student use of alcohol
J. Student drug abuse
k. Student possession of weapons
I. Physical abuse of teachers
Mark (X) one box on each line.
Serious Moderate Minor Not aproblem
254
1 2 3 4
255
1 2 3 4
256
1 2E 31 4
257
1 2E 3 4
258
1 2 3E 4
259
1 21 31 4
260
1 21 31 4
261
1 2 31 4
2621 2E 31 4
2631 2 3 4
2641 2 3E 4
2651 2 31 4
FORM SASS-4A 112-27-901
F, 457
Page 19

SECTION 5 PERCEPTIONS AND ATTITUDES TOWARD TEACHING Continued
41. ContinuedTo what extent is each of the following mattersa problem in this school? Indicate whether it isa serious problem, a moderate problem, a minorproblem, or not a problem in this school.
m. Verbal abuse of teachers
n. Student disrespect for teachers
o. Students dropping out
p. Student apathy
q. Lack of academic challenge
r. Lack of parent involvement
s. Parental alcoholism and/or drug abuse
t. Poverty
u. Racial tension
v. Cultural conflict
Mark (X) one box on each line.
Serious Moderate MinorNot a
problem266
2 3 41
267 I
2 3 41 III
2682 3 41
2692 3 41
270
2 3 41
271
2 3 41
272
41 2 3
2732 3 41
274
2 3 41
275
i 2 3 4
42. How long do you plan to remain in teaching?
Mark (X) only one box.
as I am able
I am eligible for retirement
probably continue unlessbetter comes along
plan to leave teachingas I can
at this time
Continuewith item 43
kip toitem 44a
276 I 1 As long
2 Until3 Will
something
4 Definitelyas soon
5 Undecided
43. In how many years do you plan to retirefrom teaching?
Years2771
1
Remarks
Page 20
458
FORM SASS-4A (12 -27 -901

SECTION 5 PERCEPTIONS AND ATTITUDES TOWARD TEACHING Continued
44a. What was your MAIN activity LAST278 1 Teaching in this schoolSCHOOL YEAR?
2 Teaching in another school in this school systemMark (X) only one box. 3 Teaching in another public school system
4 Teaching in a private school5 Teaching in a preschool6 Teaching at the postsecondary level7 Working as a substitute teacher8 Student at a college or university9 Working in a nonteaching occupation in the
field of education10 Working in an occupation outside the field
of educationii Caring for family members12 Unemployed and seeking work13 Military service14 Retired from another job
b. What do you expect your MAIN activity will beNEXT SCHOOL YEAR? 279 1 Teaching in this school
2 Teaching in another school in this school systemMark (X) only one box.
3 Teaching in another public school system4 Teaching in a private school5 Teaching in a preschool6 Teaching at the postsecondary level7 Working as a substitute teacher8 Student at a college or university9 Working in a nonteaching occupation in the
field of education10 Working in an occupation outside the field
of educationii Caring for family members12 Unemployed and seeking work13 Military service14 Retired
SECTION 6 INCENTIVES AND COMPENSATION
45. Do you currently receive the followingpay incentives?
a. Additional pay for assuming additional 1 Yes280responsibilities as a master or mentor teacher(e.g., supervising new teachers)
2 N o
b. Additional pay for teaching in a shortage field1 Yes281
(e.g., math, science)i 2 N o
C. Additional pay for teaching in a high-prioritylocation (e.g., an inner-city school) 1 Yes282
2 No
d. Salary increases as part of a career ladder inwhich you progress through several promotional i 1 Yes283levels based on your performance i 2 N o
e. A merit pay bonus for exceptional performancein a given year 1 Yes284
2 N o
f. A schoolwide bonus because your school285showed exceptional performance or 1 Yes
2 N oimprovement in a given year
FORM SASS-4A 112-27-901 Page 21
4 59 BESTCOPYAVAILAst F

SECTION 6 INCENTIVES AND COMPENSATION Continued
46. The following questions refer to your before-taxearnings from teaching and other employment fromthe summer of 1990 through the end of the1990-91 school year.Record earnings in whole dollars.
a. DURING THE SUMMER OF 1990, did you haveany earnings from
(1) Teaching summer school in this or anyother school?
286 287.00
1 Yes How much? $
2 N o
2881 289.00(2) Working in a nonteaching job in this or
1 Yes How much?any other school?2 No
$
290 291
$. 0(3) Working in any NONSCHOOL job? i 1 Yes How much?
2 No
b. DURING THE CURRENT SCHOOL YEAR
year.(30 per(1) What is your academic base year salary 292 i $
for teaching in this school?
(2) Do you, or will you, earn any additionalcompensation from your school for extra 293 I 294
.00curricular or additional activities such ascoaching, student activity sponsorship, or 1 Yes How much?evening classes? 2 N o
$
295 I(3) Do 296.00you, or will you, earn additional
compensation from working in any job 1 Yes How much? -- $outside the school system? 2 No Skip to item 46b(4)
(a) Which of these best describes this job 2971 1 Teaching or tutoringoutside the school system?
2 Nonteaching, but education relatedMark (X) only one box. 3 Not related to education
(4) Have you EARNED income from any 298 I 299other sources this year, e.g., a bonus,
1 Yes How much? -- $ .00state supplement, etc.?
2 N o
C. What will be your total EARNED income from allsources from the summer of 1990 through theend of this school year?Your answer should equal the sum of answers to 300 $ .00
youritems 46a(1)b(4).
HOUSEXPS47. Do you receive any income-in-kind in addition to 1 3011 1 Housing or housing expenses
or in lieu of your school salary?MEALS 302 12 Meals
Mark (X) all that apply.TUITION 303 3 Tuition for your children
CHLDCARE 11 304 4 Child care
5 College tuition for yourselfCOLLEGE , 3051
TRANSPT 1 306 6 Car/transportation expenses1
NONE' 307 0 None of the above
Page 22
460
FORM SASS-4A 112-27-901

SECTION 7 El CKGROUND ONFORItil TOO
148. Which category represents the total combinedincome of all FAMOLY members age 14 and olderin your household during 1990? Include moneyfrom jobs, net business or farm income, pensions,dividends, interest, rent, social securitypayments, and any other income received byfamily members in your household.
Mark (X) only one box.
FAMLYINC
Less than $ 10,000$ 10,000 $14,999$ 15,000 $19,999$ 20,000 $24,999$ 25,000 $29,999$ 30,000 $34,999$ 35,000 $39,999$ 40,000 $49,999$ 50,000 $59,999$ 60,000 $74,999S 75,000 $99,999$100,000 or more
1 3084
10
ill12
2
3
4
5
6
7
8
9
49. Are you male or female? SEX
1 MaleFemale
1309
I
1
2
50a.
b.
What is your race?
Mark (X) only one box.
LRACE1310 American Indian, Alaskan Native (Aleut, Alaskan
Indian, Yupik, Inupiat) Continue with bAsian or Pacific Islander (Japanese,Chinese, Filipino, Korean, AsianIndian, Vietnamese, Hawaiian, Skip toGuamanian, Samoan, other Asian) item 51BlackWhite
1
2
3
4
Are you enrolled in a state or federallyrecognized tribe?
TRIBE
102
YesNo
1 311
51. Are you of Hispanic origin? ,H ISPANIC
1 YesN o
1312i
1
1
2
52. What is your year of birth?II BIRTHYR
101311
1
9
53.53. What is your current marital status?I-
AL
MarriedWidowed, divorced, or separatedNever married
1------'1
I
1
2
3
54. How many children do you have who aredependent on you (and your spouse) for morethan half of their financial support?
1DEPCHLDN1 Number
supportedof children
Continue with 55Skip to item 56
I 315
i
1
1
Noneo
55. What was the age of your youngest child onhis/her last birthday?If child is less than one year, please enter "0."
1
1
AGEYOUNG
4
Age of youngest child1 316I
1
i
56. Do you have persons other than your spouseor children who are dependent on you formore than half of their financial support?
1
OTHERDEP
1 Yes HowNo
I 317 318 DEPCOUNT
I
I
I
1
many persons?2 III
FORM SASS-4A 112-27-901
43j BEST COPY AVAILABI F
Page 23

SECTION 8 RESPONDENT INFORMATION
The survey you have completed may involve a brief followupmovements in the labor force. The following informationchanged jobs.
57. Please PRINT your name, your spouse's name
at a later time in order to gain information on teachers'would assist us in contacting you if you have moved or
(if applicable), your home address,time to reach you.I your telephone number, and the most convenientPGM 4 j
Your name 1 319 Spouse's full name
Street address
City State ZIP Code
Telephone number (Include area code)
( )
In whose name is the telephone number listed? (Mark (X) only one.)
1 No phoneDays/times convenient to reach you 2 My name
3 Other Specify
58. What are the names and addresses of two other people who will know where to get in touch with youduring the coming years? List no more than one person who now lives with you. Remember to record therelationship of these persons to you (for example, parent, friend, sister, cousin, etc.)
Name 320 I Relationship to you
Street address
City State ZIP Code
Telephone number (Include area code)
( )
In whose name is the telephone number listed? (Mark (X) only one.)
1 No phone2 Name entered above3 Other Specify
Name 321 Relationship to you
Street address
City State ZIP Code
Telephone number (Include area code)
( )
In whose name is the telephone number listed? (Mark (X) only one.)
1 No phone2 Name entered above3 Other Specify
59. Not counting interruptions, how long did it take to complete this survey?PGM 3
322 I MinutesSIM/MUMS
THIS COMPLETES THE QUESTIONNAIRE.THANK YOU FOR ASSISTING US IN THIS IMPORTANT RESEARCH.
YOUR TIME AND EFFORT ARE APPRECIATED.
Page 24 U.S. GOVERNMENT PRINTING OFFICE : 1991 - 287-585 QL 3
4 6 2
FORM SASS -4A (12- 27 -90)
Appendix F F-103
Private School Teacher Questionnaire (SASS 4B)
463
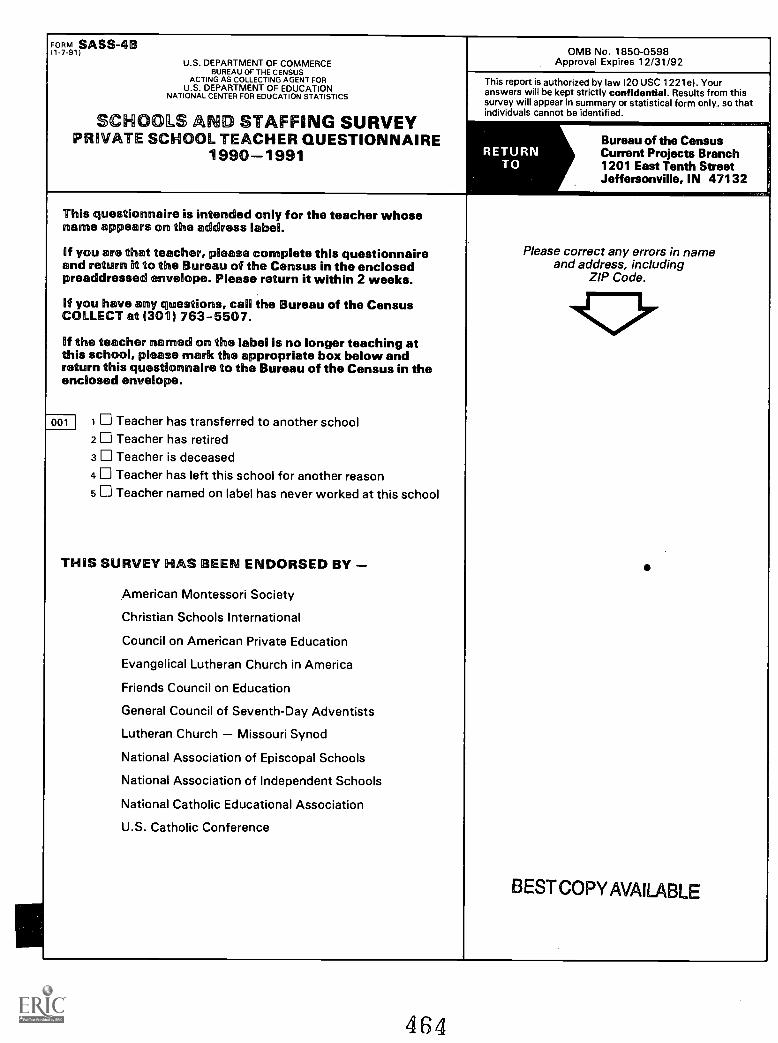
FORM SASS-4B11-7-911
U.S. DEPARTMENT OF COMMERCEBUREAU OF THE CENSUS
ACTING AS COLLECTING AGENT FORU.S. DEPARTMENT OF EDUCATION
NATIONAL CENTER FOR EDUCATION STATISTICS
SOHO' LS r,N STAFFING SURVEYPRIVATE SCHOOL TEACHER QUESTIONNAIRE
1990-1991
OMB No. 1850-0598Approval Expires 12/31/92
This report is authorized by law (20 USC 1221e). Youranswers will be kept strictly confidential. Results from thissurvey will appear in summary or statistical form only so thatindividuals cannot be identified.
Bureau of the CensusCurrent Projects Branch1201 East Tenth StreetJeffersonville, IN 47132
This questionnaire is intended only for the teacher whosename appears on the address label.
Of you are that teacher, please complete this questionnaireand return it to the Bureau of the Census in the enclosedpreaddressed envelope. Please return it within 2 weeks.
If you have any questions, call the Bureau of the CensusCOLLECT at (301) 763-5507.
Of the teacher named on the label is no longer teaching atthis school, please mark the appropriate box below andreturn this questionnaire to the Bureau of the Census in theenclosed envelope.
001 1 Teacher has transferred to another school2 Teacher has retired3 Teacher is deceased4 Teacher has left this school for another reason5 Teacher named on label has never worked at this school
THIS SURVEY HAS BEEN ENDORSED BY
American Montessori Society
Christian Schools International
Council on American Private Education
Evangelical Lutheran Church in America
Friends Council on Education
General Council of Seventh-Day Adventists
Lutheran Church Missouri Synod
National Association of Episcopal Schools
National Association of Independent Schools
National Catholic Educational Association
U.S. Catholic Conference
Please correct any errors in nameand address, including
ZIP Code.
BEST COPY AVAILABLE
464

Dear Teacher:
The National Center for Education Statistics (NCES) of the U.S. Department of Educationrequests your participation in the Teacher Survey for the 1990-1991 Schools and StaffingSurvey. You are one of 65,000 teachers from public and private schools across the nationselected to be in the sample.
The Schools and Staffing Survey, first conducted in school year 1987-88, is an integrated setof surveys consisting of the Teacher Demand and Shortage Survey, the School Survey, theSchool Administrator Survey, and the Teacher Survey. These surveys are being conductedperiodically to measure critical aspects of teacher supply and demand, the composition of theadministrator and teacher work force, and the general status of teaching and schooling. Thepurpose of the Teacher Survey is to obtain information about such factors as the education andtraining, current assignment, job mobility, workplace conditions, and career choices of teachers,as well as their opinions about various policy issues such as merit pay or incentive pay.
The U.S. Bureau of the Census is conducting the survey for the National Center for EducationStatistics by the authority of Section 406(b) of the General Education Provisions Act, asamended (20 USC 1221e). The data will be treated as confidential and will be reported only instatistical summaries so that individual teachers cannot be identified.
We are conducting this survey with a sample of teachers. While this minimizes overall responseburden, the value of each individual survey response is greatly increased because it representsmany other teachers. I therefore encourage you to participate in this voluntary survey bycompleting this questionnaire and returning it within 2 weeks to the Bureau of the Census,Current Projects Branch, 1201 East Tenth Street, Jeffersonville, IN 47132, in thepreaddressed envelope enclosed for your convenience.
I thank you for your cooperation in this very important effort.
Sincerely,
Emerson J. ElliottActing CommissionerNational Center for Education Statistics
Enclosures
INFORMATION ABOUT YOUR PARTICIPATION
Public reporting burden for this collection of information is estimated to average one hour perresponse, including the time for reviewing instructions, gathering the data needed, andcompleting and reviewing the collection of information. Send comments regarding this burdenestimate or any other aspect of this collection of information, including suggestions forreducing this burden, to the U.S. Department of Education, Information Management andCompliance Division, Washington, DC 20202-4651; and to the Office of Management andBudget, Paperwork Reduction Project 1850-0598, Washington, DC 20503.
Page 2FORM SASS-4B (1-7-91)

INSTRUCTIONS
Most of the items on this questionnaire are arranged so If you are unsure about how to answer a question, pleasethat the questions are on the left side of the page and the give the best answer you can and make a comment in theanswer categories or spaces for written answers are on "Remarks" space. Please include the item number.the right. Please answer the questions by marking theappropriate answer category with an X, or recording youranswer in the space provided. We suggest that you use a If you have any questions, call the Bureau of the Censuspencil, rather than a pen or marker. COLLECT at (301) 763-5507.
Notice that at the end of some answer categories andanswer spaces, there are instructions to skip to later Return your completed questionnaire to the Bureau of theitems or to continue with the next item on the Census in the enclosed postage-paid envelope. Pleasequestionnaire. return it within 2 weeks.
Remarks
Please keep count of the time you spend completing this questionnaire.At the end of the survey, you are asked to record the amount of time spent.
SECTION I CURRENT TEACHING STATUS
1 . How do you classify your MAIN assignmentat THIS school (i.e., the activity at which youspend MOST of your time) during thisschool year?
Mark (X) only one box.
011 1 Regular full-time teacher Skip to item 5
2 Regular part-time teacher3 Itinerant teacher (i.e., your
assignment requires you to provideinstruction at more than one school) Continue
4 Long-term substitute (i.e., your with item 2assignment requires that you fill therole of a regular teacher on a long-term basis, but you are stillconsidered a substitute)
5 Short-term substitute6 Student teacher7 Other professional staff (e.g., counselor, librarian,
curriculum coordinator, social worker)a Administrator (e.g., principal, assistant
principal, director, head)a Teacher's aide
io Support staff (e.g., secretary)
IF YOU MARKED BOX 5, 6, 7, 8, 9, OR 10 ABOVE, PLEASE STOP NOW AND RETURN THIS QUESTIONNAIRETO THE BUREAU OF THE CENSUS. THANK YOU FOR YOUR TIME.
FORM SASS- 4811 -7.91)
466BEST COPY AVAILABLE
Page 3

110SECTION I CURRENT TEACHING STATUS Continued
2. How much time do you work as a TEACHERat this school?
Mark (X) only one box.
1
2
3
4
5
Full time Skip to item 5time or more, but less than full-time Continue
1/2 time or more, but less than % time withtime or more, but less than 1/2 time item 3
than % time
012 I3/4
%
Less
3a. Do you have any other assignment at THISschool?
I
1
1
2
Continue with bSkip to item 4
013 Yes
1
No
b. Which of these best describes your other '
assignment at this school?
1
1 Administrator (e.g., principal, assistantprincipal, director, head)
014 I
Mark (X) only one box. 2 Counselor3 Librarian/media specialist4 Coach5 Other professional staff (e.g.,
department head, curriculumcoordinator)
6 Support staff (e.g., secretary, aide)7 Other Describe
C. Including your teaching and other assignment, areyou a FULL-TIME EMPLOYEE at this school?
I 1 Skip to item 5015 Yes2 No Continue with item 4
4. In addition to employment at this school, what isyour OTHER main activity?
I 1
2
in another schoolWorking as a paid tutor
016 Teaching
Mark (X) only one box. 3 Student at a college or university4 Working in a nonteaching occupation in the
field of education (e.g., guidance counselor)5 Working in an occupation outside the
field of education6 Caring for family members7 Seeking work
SECTION 2 TEACHING EXPERIENCE
5. In what year did you begin your first teachingposition (full-time or part-time) at the elementaryor secondary level? Do not include time spent as astudent teacher.
0171 9
,
6. What was your MAIN activity the year before youbegan teaching at the elementary or secondarylevel?
1
2
StudentCaring
at a college or universityfor family members
ip to
018
Mark (X) only one box.3
4
Working as a substitute teacher item 9in a preschoolTeaching
5 Teaching at a college or university
6 Working in a nonteaching position in the fieldof education Continue with item 7
7 Working in an occupation outside the field ofeducation Skip to item 8
8 Military service Skip toSeeking9 work item 9Retiredio from another job
Page 4
467
FORM SASS-4B 11-7-91)

SECTION 2 TEACHING EXPERIENCE Continued
NOTE: Answer item 7 ONLY if you marked box 6 1.019in answer to question 6 on page 4.
7. Which of these categories best describesyour previous position in the field ofeducation?
Mark (X) only one box.
1 Administrator (e.g., principal,assistant principal, director)
2 Counselor3 Librarian/media specialist4 Coach Skip to5 Other professional staff (e.g., department item 9
head, curriculum coordinator)6 Instructional aide7 Noninstructional support
staff (e.g., secretary)
NOTE: Answer items 8a e ONLY if you marked box 7 inanswer to question 6 on page 4.
8a. For whom did you work? Record the name of thecompany, business, or organization.
b. What kind of business or industry was this?For example, retail shoe store, State Labor
10201Department, bicycle manufacturer, farm.
1
I
1
1
C. What kind of work were you doing?Please record your job title; for example, electrical 1
engineer, cashier, typist, farmer, loan officer.
1
I
0211I
d. What were your most important activities or I
duties at that job? For example, typing, sellingcars, driving delivery truck, caring for livestock.
I
O. How would you classify yourself on that job?Mark (X) only one box.
1 An employee of a PRIVATE company, business, or022individual for wages, salary, or commission
2 A FEDERAL government employee3 A STATE government employee4 A LOCAL government employee5 SELF-EMPLOYED in your own business,
professional practice, or farm6 Working WITHOUT PAY in a
family business or farm7 Working WITHOUT PAY in a volunteer job
9. Including this school year, at which of theseschool levels have you taught, either full- orpart-time, for one year or more?
Mark (X) all that apply.
1
i1 PrekindergartenI 0231
102412 Elementary (including kindergarten)
3 Middle school or junior high025
4 Senior high026
5 Postsecondary027
10a. Have you ever worked as an elementary orsecondary teacher in a PUBLIC SCHOOL?
1
1 Yes Continue with b1 0281iI 2 No Skip to item 11 a
b. How many years did you teach FULL-TIME inpublic schools?
Record whole years, not fractions or months.
1
1
Years10291I1
i
o None
C. How many years did you teach PART-TIME inpublic schools?
Record whole years, not fractions or months.
1
Years1030 I
1
1
1
o None
FORM SASS -4B (1-7.91)
468Page 5
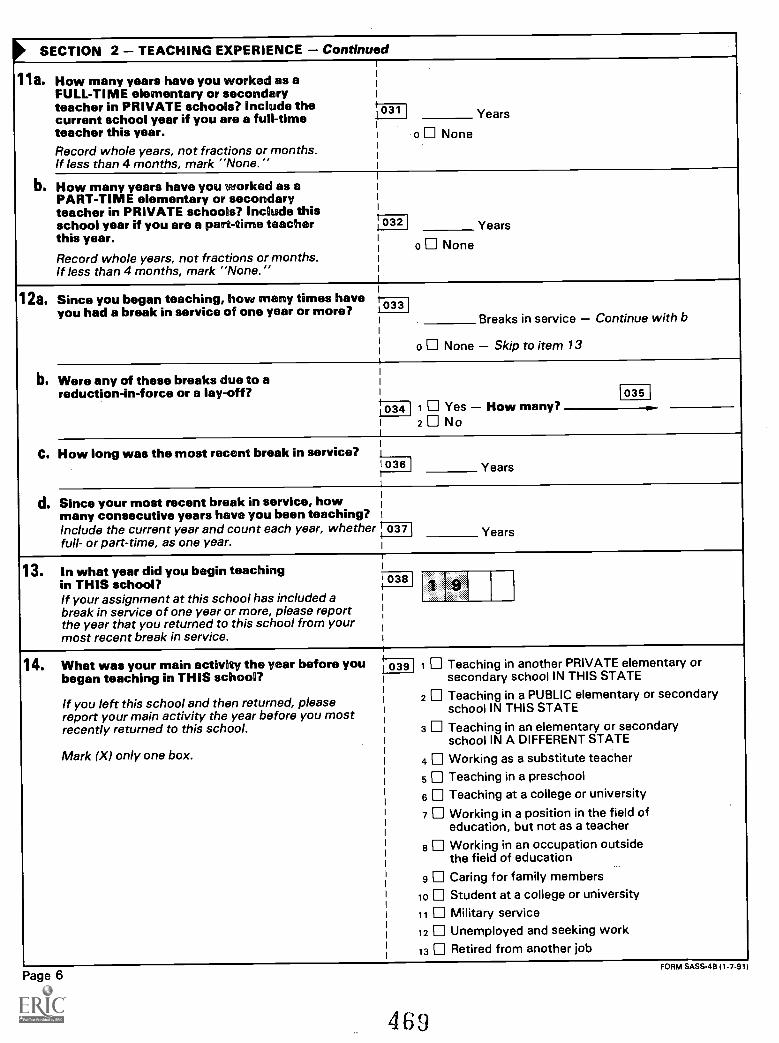
SECTION 2 TEACHING EXPERIENCE Continued
118. How many years have you worked as aFULL-TIME elementary or secondary
Yearsteacher in PRIVATE schools? Include thecurrent school if full-time
031year you are a
teacher this year. o NoneRecord whole years, not fractions or months.If less than 4 months, mark "None."
b. How many years have you worked as a 1
PART-TIME elementary or secondary I
teacher in PRIVATE schools? Include this I
1
school year if you are a part-time teacher ithis year. 1
Years032
Record whole years, not fractions or months.I
o None
If less than 4 months, mark "None." I
1
12a. Since you began teaching, how many times have 033you had a break in service of one year or more? Breaks in service Continue with b
o None Skip to item 13
b. Were any of these breaks due to areduction-in-force or a lay-off? 035
0341 1 Yes How many?2 No
1
C. How long was the most recent break in service? j
1
1036 Years
d. Since your most recent break in service, howmany consecutive years have you been teaching?
1
1
i
Include the current year and count each year, whetherfull- or part-time, as one year.
1 037 I YearsI
13. In what year did you begin teaching 1
1 038 Iin THIS school?If your assignment at this school has included abreak in service of one year or more, please reportthe year that you returned to this school from yourmost recent break in service.
I
I
I
I
14. What was your main activity the year before you 1 039 1 Teaching in another PRIVATE elementary orbegan teaching in THIS school? secondary school IN THIS STATE
If you left this school and then returned, please2 ryTeaching in a PUBLIC elementary or secondary
report your main activity the year before you most school IN THIS STATE
recently returned to this school. 3 Teaching in an elementary or secondaryschool IN A DIFFERENT STATE
Mark (X) only one box. Working as a substitute teacher4
Teaching in a preschool5
Teaching at a college or university6
Working in a position in the field of7
education, but not as a teacher
8 Working in an occupation outsidethe field of education
6 Caring for family members
io Student at a college or university
11 Military service12 Unemployed and seeking work
13 Retired from another job
Page 6
466
FORM SASS -4B (1-7-91)

SECTION 3 TEACHER TRAINING
MAJOR AND MINOR FIELD OF STUDY CODES FOR QUESTIONS 15,16, AND 17EDUCATION GENERAL
General education Special education 06 Agriculture and natural 37 Music01 Pre-elementary/early 67 Special education, general resources 39 Philosophychildhood education 68 Emotionally disturbed 86 American Indian studies 41 Psychology03 Elementary education 69 Mentally retarded (Native American) 42 Public affairs and services04 Secondary education 70 Speech/language impaired 87 Other area and ethnic 44 Religion, theology71 Deaf and hard-of-hearing studies
Subject area education 72 Visually handicapped 08 Architecture and Foreign languages07 Agricultural education 73 Orthopedically impaired environmental design 51 French11 Art education 74 Mildly handicapped 10 Art, fine and applied 52 German13 Bilingual education 75 Severely handicapped 14 Business and management 53 Latin15 Business, commerce, and 76 Specific learning disabilities 16 Communications and 54 Russian
distributive education 77 Other special education journalism 55 Spanish89 Crosscultural education 17 Computer and information 56 Other foreign languages22 English education sciences Natural sciences23 English as a second language Other education 19 Drama, theater
57 Biology/life science24 Foreign languages education 78 Curriculum and instruction 20 Engineering 58 Chemistry29 Home economics education 79 Educational administration 21 English (literature, letters,59 Geology/earth science88 Indian education (Native American) 80 Educational psychology speech, classics) 60 Physics30 Industrial arts, vocational 81 Counseling and guidance 25 General studies 61 Other natural sciencesand technical, trade 82 Other education 27 Health professions and
and industry education occupations Social sciences34 Mathematics education 28 Home economics 62 Economics38 Music education 86 Humanities 63 History40 Physical education/health 31 Law 64 Political science andeducation 32 Library science government43 Reading education 33 Mathematics 65 Sociology45 Religious education 35 Military science 66 Other social sciences46 Science education 36 Multi/interdisciplinary48 Social studies/social studies 84 Other
sciences education
15a. Do you have a bachelor's degree?1
1
i
Yes Continue with bNo Skip to item 17a
040 1
2
b. What was your major field of study?Enter the major field and the two-digitcode from the list above.
i041
i Code Major field
C. In what year did you receive yourbachelor's degree? 042
d. Did you have a second major or a minorfield of study? Yes Continue with e
No Skip to item 16a043 I 1
2
0. What was your second major or minorfield of study?Enter the field and the two-digit code fromthe list above.
044 I
Code Second major or minor field
16a. Do you have a master's degree? Yes Continue with bNo Skip to item 17a
045 I 1
2
b. What was your major field of study?Enter the major field and the two-digitcode from the list above.
0461
Code Major field
C. In what year did you receive yourmaster's degree? 047-I 1 9
Remarks
FORM SASS-4B 11-7-91)
470
Page 7

SECTION 3 TEACHER TRAINING Continued
17a. Do you have any other type of degree? 1-6478 i Yes Continue with b1
I2 No Skip to item 18a
1
b. What other degree(s) have you earned?Mark (X) all that apply in column (b) below.
C. What was your major field of study for each degree?In column (c) below, enter the appropriate field name andtwo-digit code from the list at the top of the previous page.
d. In what year did you receive each degree?
(b)Degreels) earned
Mark (X) all that apply.
(c)
Major field code
(d)
Year degree received
0491 050] 051
1 Associate degreeCode Major field
052 2 Education specialist or 0531 054 I
professional diploma (at leastone year beyond Master's level)
ICode Major field
0551 Doctorate first 056 0573 = or professionaldegree (Ph.D., Ed. D., M. D.,L.L.B., J.D., D.D.S.)
1
Code Major field
TEACHING ASSIGNMENT FIELD CODES FOR QUESTIONS 18, 21, and 22
01 Prekindergarten 28 Home economics Science Special education02 Kindergarten 16 Journalism 67 Biology/life science 67 Special education, general03 General elementary 33 Mathematics 58 Chemistry 68 Emotionally disturbed
35 Military science 59 Geology/earth 69 Mentally retarded37 Music science/space science 70 Speech/language impaired
Special areas 39 Philosophy 60 Physics 71 Deaf and hard-of-hearing86 American Indian studies 40 Physical education, 61 General and all other 72 Visually handicapped
(Native American) health science 73 Orthopedically impaired10 Art 43 Reading 74 Mildly handicapped12 Basic skills and remedial education 44 Religion Vocational education 75 Severely handicapped13 Bilingual education 47 Social studies/social 05 Accounting 76 Specific learning disabilities
17 Computer science science 06 Agriculture 77 Other special education18 Dance 14 Business, marketing19 Drama/theater Foreign language 27 Health occupations21 English/language arts 51 French 30 Industrial arts 84 All others23 English as a second language 52 German 49 Trade and industry26 Gifted 53 Latin 50 Technical
54 Russian 83 Other vocational education55 Spanish56 Other foreign language
18a. What is your MAIN teaching assignment at thisschool, that is, the field in which you teach themost classes?Enter your main teaching assignment field and thetwo-digit code from the list above. If your teachingschedule is divided equally between two fields,record either field as your main assignment for thisitem, mark box 1, and enter the code for the otherfield in item 18b.
058
Code Main assignment field
059 1 Teaching assignment equallydivided between two fields
1
b. Do you teach classes in OTHER fields at i
this school? I0601 i Yes In what field do you
teach the secondmost classes?Use the assignment 061field codes listedabove.
Code2 M IN o
Page 8
471BEST COPY AVAILABLE
FORM SASS-4B (1-7-91)

SECTION 3 TEACHER TRAINING Continued
19a. Have you ever taken any college level COURSES I 062 I 1 Yes Continue with b1in teaching methods or education?I 2 No Skip to Check Item A1
b. How many graduate and undergraduateCOURSES in teaching methods or educationhave you ever taken?Include courses you are now taking, as well ascourses taken to earn a degree and courses takenoutside a degree program.Please record the number of COURSES, not credithours.
Number of education COURSESUndergraduate Graduate
063 I Course(s) 064 Coursels)o None o None
CHECK Is your main teaching assignment fieldIT E M' A prekindergarten, kindergarten, general 0651 i Yes Skip to item 21a
:
2 No Continue with item 20aI
elementary, or special education?
20a. Have you ever taken any college level COURSESin the subject area that is your MAIN teachingassignment (i.e., the subject in which you teachthe most classes)?
066 I 1 Yes Continue with b2 No Skip to item 21a
b. How many COURSES have you ever taken inthis subject area?
Include all college level COURSES that are related tothe main subject you teach. Include courses you arenow taking. Include both undergraduate and graduatecourses. Include courses taken to earn a degree andthose taken outside a degree program.
Please record the number of COURSES, notcredit hours.
Number of subject matter COURSESUndergraduate Graduate
067 I Course(s) 068 I Course(s)o None o None
21a. What field do you feel BEST QUALIFIED to teach,regardless of whether you currently teach in thatfield? Enter the field and the two-digit code from thelist on page 8.
069
Code Best qualified field
b. Do you feel qualified to teach any other fields? 070 I Yes For what field do you feelsecond best qualified?Use codes listed on page 8. E.-
"1
Code2 No
22. Has your MAIN teaching assignment fieldchanged since you began teaching?
What was your previousfield?main assignment
Use codes listed on page 8.-4.-Code
07211 Yes Counting this year, howmany consecutive yearshave you been teaching inyour current assignment 074field?
Years2 No
23a. At this school, do you teach any students in anyof grades 7-12? 075 I 1 Yes Continue with b
2 No Skip to item 24a
b. At this school, do you teach any classes incomputer science, mathematics, or any kind ofscience, such as biology, chemistry, or generalscience?
076 1 Yes Continue with c2 No Skip to item 24a
FORM SASS-4B 11-7-911
472.BEST COPY AVAILABLE
Page 9

SECTION 3 TEACHER TRAINING Continued
23c. Have you ever taken any Courses taken in fieldundergraduate or graduate
Number of COURSESUndergraduate Graduate
COURSES in the followingsubjects?Answer for each field 077 078 I 079
listed below.1 Yes How many?_,... Course(s) Course (s)
(1) Mathematics 2 No courses taken o None o None
080 1 081 1 082
many?-1.- Course(s) Course(s)(2) Computer science 1 Yes How2 No courses taken o None o None
10831 084 1 0851
many?-0.- Coursels) Coursels)(3) Biology or life science 1
1 Yes How1
I 2 No courses o None o Nonetaken1
II 0861 0871 0881
many? Course(s) Coursels)(4) Chemistry 1
1
1 Yes HowI 2 No courses taken o None o None1
It 089 I 090 1 091I many?...- Course(s) Course(s)(5) Physics 1 III Yes HowI
2 No courses taken o None o None1
1
1 092 1 093 1 094 I
many ?y Course(s) Course(s)(6) Earth or space science i 1 Yes How2 No courses taken o None o None
10951 096 1 097 1
many?..- Course(s) Course(s)(7) Other natural science I1 Yes How2 No courses taken o None o None
24a. In addition to the college courses you have Yes Continue with b098 1
already reported, have you ever participated inany teacher workshops or in-service trainingwhich included 30 hours or more of classattendance?
2 No Skip to item 25a
b. Was this training relevant to your current MAIN1
Yes1 099 1
teaching assignment field?i
I 2 N o
C. What was your MAJOR purpose for takingthis training?
To fulfill initial certification requirements for100 I 1
current position2 To maintain and/or improve qualifications for
Mark (X) only one box. current position (including meetingrecertification requirements)
3 To train to teach a different subject matter area4 To train to teach at a different grade level5 To train to teach handicapped students or
disabilitiesstudents with learning6 To train to teach other special student
populations (e.g., Native American, limited
7
English proficiency, etc.)in new nonteachingTo acquire credentials
BESTCOPYAVAIL4BLE8
areas (e.g., administration,counseling)
guidance
Other Describe
Page 10
473FORM SASS -4B (1-7-91)
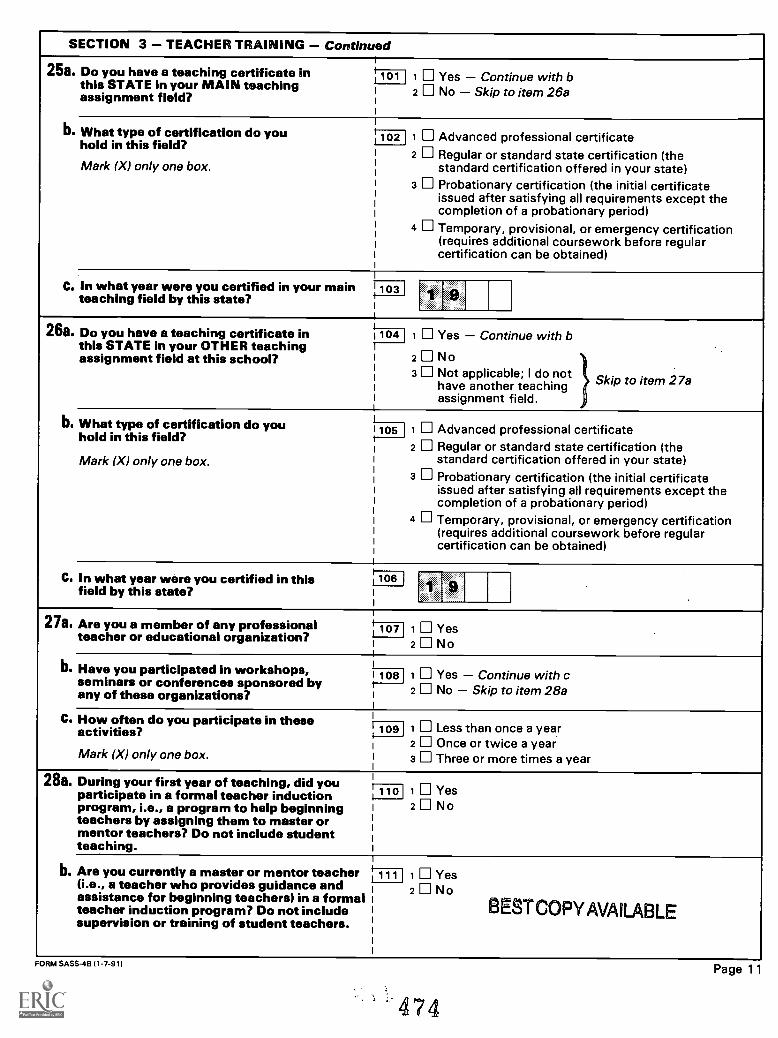
SECTION 3 TEACHER TRAINING Continued
25a. Do you have a teaching certificate inthis STATE in your MAIN teachingassignment field?
I
1
2
YesNo
Continue with bSkip to item 26a
101
I
I
b. What type of certification do you thold in this field? 102 1 1
2
Advanced professional certificateor standard state certification (theRegular
Mark (X) only one box. standard certification offered in your state)3 Probationary certification (the initial certificate
issued after satisfying all requirements except thecompletion of a probationary period)
4 Temporary, provisional, or emergency certification(requires additional coursework before regularcertification can be obtained)
C. In what year were you certified in your mainteaching field by this state? iI 103 I i
26a. Do you have a teaching certificate inthis STATE in your OTHER teachingassignment field at this school?
1
2
Yes Continue with b
o
i 1041
N
3 Not applicable; I do not Skip to item 27aanother teachinghaveassignment field.
b. What type of certification do youhold in this field? 1
2
Advanced professional certificateor standard state certification (the
i 105 1
RegularMark (X) only one box. standard certification offered in your state)
3 Probationary certification (the initial certificateissued after satisfying all requirements except thecompletion of a probationary period)
4 Temporary, provisional, or emergency certification(requires additional coursework before regularcertification can be obtained)
C. In what year were you certified in this jfield by this state?
106 1
27a. Are you a member of any professional1 Yes107teacher or educational organization?
i 2 N o
b. Have you participated in workshops,1 Yes Continue with ci 108seminars or conferences sponsored by t
any of these organizations? 2 No Skip to item 28a
C. How often do you participate in these109activities? 1 Less than once a year
2 Once or twice a yearMark (X) only one box. 3 Three or more times a year
28a. During your first year of teaching, did youin formal teacher induction 1 Yes1 1 o lparticipate a
program, i.e., a program to help beginningteachers by assigning them to master ormentor teachers? Do not include studentteaching.
i 2 No
b. Are you currently a master or mentor teacher,
1 Yes111(i.e., a teacher who provides guidance andassistance for beginning teachers) in a formal
2 N o
teacher induction program? Do not includesupervision or training of student teachers.
BESTCOPYAVAILABLE
FORM SASS-4B 11 -7 -911
474
Page 11

SECTION 4 CURRENT TEACHING LOAD1
29. In what grade levels are the students inyour classes at THIS school?Mark (X) all that apply.
1121 1 Ungraded 120 9 6th
113 2 Prekindergarten 121 10 7th
114 3 Kindergarten 122 11 8th
1151 4 1st 123 12 9th
1161 5 2nd 124 13 10th
14 11th117 6 3rd 125
1181 7 4th 126 15 12th
1191 8 5th 127 16 Postsecondary
NOTE The following questions request information on each class you taught at THIS school during your mostrecent full week of teaching (i.e., the last week when school was in session for 5 full days and you taughtyour normal schedule).
30. Which of these best describes the way yourclasses at this school are organized? 128 I 1 DEPARTMENTALIZED INSTRUCTION You
teach subject matter courses (e.g., history,Mark (X) only one box. typing, music) to several classes of different
students all or most of the day Skip to
2 SELF-CONTAINED CLASS Youteach multiple subjects to the sameclass of students all or most of the day
3 TEAM TEACHING You collaboratewith one or more other teachers inteaching multiple subjects to the sameclass of students
4 "PULL-OUT" CLASS You provideinstruction, e.g., special education, tocertain students who are releasedfrom their regular classes
5 ELEMENTARY ENRICHMENT CLASSonly one subject (such as art, music, physicaleducation, computer skills) to all or mostin an elementary school Skip to item
item 32
Continuewithitem31a
You teach
students33a
Remarks
Page 12
475
FORM SASS-4B (1-7-91)

SECTION 4 CURRENT TEACHING LOAD
NOTE Answer this question if you marked category2, 3, or 4 in item 30 on page 12.
31a. At THIS school, how many students were enrolledin the class or program you taught during yourmost recent full week of teaching?If you teach two kindergarten or prekindergartensessions per day, report the average number ofstudents.
1291 Students
b. During your most recent full week of teaching,approximately how many hours did you spendteaching each of these subjects at THIS school?
If you taught two or more subjects at the same time,apportion the time to each subject as best you can.
Report hours to the nearest whole hour, e.g., 1, 2.
If you did not teach a particular subject during theweek, mark the "None" box.
Subject Hours per week
1301
(1) English/reading/language artso 111 None
131
(2) Arithmetic/mathematicso None
132
(3) Social studies/history
(4) Science
133
o None
o None
C. Did you assign any homework during your mostrecent full week of teaching at THIS school? 134 1 0 Yes
2 0 No
d. Which of these best describes the generalacademic achievement level of your studentsrelative to the other students at this school?
Mark (X) only one box.
135 1 Primarily higher achieving students
2 Primarily average achieving students
3 Primarily lower achieving students
4 Students of widely differing achievement levels
PLEASE SKIP NOW TO ITEM 34a ON PAGE 16.
Remarks
FORM SASS-4B 11-7-91)
476
Page 13
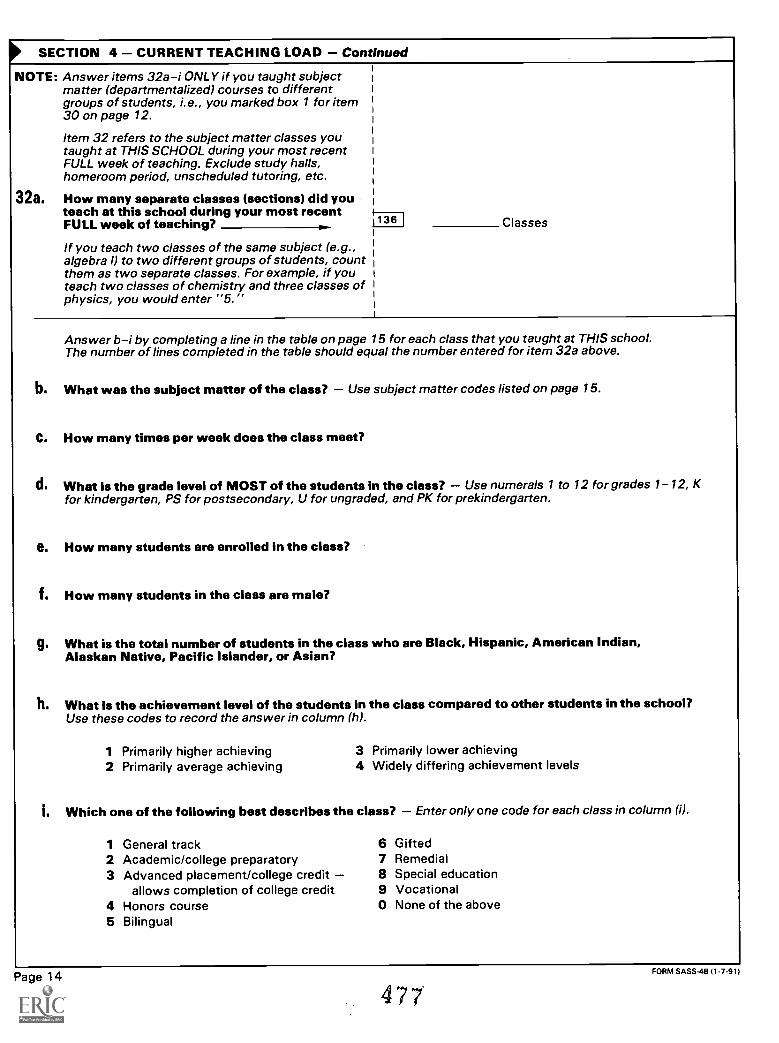
SECTION 4 CURRENT TEACHING LOAD Continued
NOTE: Answer items 32a-i ONLY if you taught subjectmatter (departmentalized) courses to differentgroups of students, i.e., you marked box 1 for item30 on page 12.
Item 32 refers to the subject matter classes youtaught at THIS SCHOOL during your most recentFULL week of teaching. Exclude study halls,homeroom period, unscheduled tutoring, etc.
32a. How many separate classes (sections) did youteach at this school during your most recentFULL week of teaching? 136
If you teach two classes of the same subject (e.g.,algebra I) to two different groups of students, countthem as two separate classes. For example, if youteach two classes of chemistry and three classes ofphysics, you would enter "5."
Classes
Answer b-i by completing a line in the table on page 15 for each class that you taught at THIS school.The number of lines completed in the table should equal the number entered for item 32a above.
b. What was the subject matter of the class? Use subject matter codes listed on page 15.
C. How many times per week does the class meet?
d. What is the grade level of MOST of the students in the class? Use numerals 1 to 12 for grades 1-12, Kfor kindergarten, PS for postsecondary, U for ungraded, and PK for prekindergarten.
e. How many students are enrolled in the class?
f. How many students in the class are male?
J. What is the total number of students in the class who are Black, Hispanic, American Indian,Alaskan Native, Pacific Islander, or Asian?
h. What is the achievement level of the students in the class compared to other students in the school?Use these codes to record the answer in column (h).
1 Primarily higher achieving 3 Primarily lower achieving2 Primarily average achieving 4 Widely differing achievement levels
i. Which one of the following best describes the class? Enter only one code for each class in column (i).
1 General track 6 Gifted2 Academic/college preparatory 7 Remedial3 Advanced placement/college credit 8 Special education
allows completion of college credit 9 Vocational4 Honors course 0 None of the above5 Bilingual
Page 14
477,
FORM SASS-4B (1-7-91)

SECTION 4 CURRENT TEACHING LOAD Continued
SUBJECT MATTER CODES FOR ITEM 32b Enter code in column (b) below.Vocational education Foreign languages Computer science Social science Visual and performing arts01 Agriculture 31 French 52 Computer 70 Social studies 81 Arts and crafts02 Business, marketing 32 German awareness/applications 71 History 82 Filmmaking/photography03 Industrial arts 33 Latin 53 Computer programming 72 World civilization 83 Chorus04 Health occupations 34 Russian 54 Other computer science 73 Political science/ 84 Band06 Vocational home economics 35 Spanish government 85 Drama/theater/dance06 Trade and industry 36 Other foreign language 74 Geography 86 Music07 Technical 75 Economics 87 Other visual/performing arts08 Accounting/bookkeeping 76 Civics09 Shorthand Mathematics 77 Sociology/social10 Typing 41 General mathematics Natural science organization11 Career education 42 Business math 61 General science 78 Other social science Other areas12 Other vocational education 43 Algebra, elementary 62 Biology/life science 91 Driver education44 Algebra, intermediate 63 ChemistryEnglish/language arts 92 Health45 Algebra, advanced 64 Physics
93 Nonvocational home21 Literature 46 Geometry, plane/solid 65 Geology/earth science/economics22 Composition/journalism/ 47 Trigonometry space science 94 Philosophycreative writing 48 Analytic geometry/ 66 Other physical science
95 Physical education23 Reading math analysis 67 Other natural science 96 Psychology24 English as a second language 49 Probability/statistics97 Religion25 Other English/language arts 50 Calculus98 Other courses notcourses 51 Other mathematics
elsewhere classified
Class(section)
Subjectmattercode
(2 digits)
(b)
Number oftimes per
week
(c)
Grade levelof MOST
students inclass
(d)
Number ofstudents inthe class
(e)
Number ofmales in the
class
(f)
Number ofminorities in
the class
(g)
Classachievement
levelUse codes on
page 14(h)
14F1
Type of classUse codes on
page 14
(i)144
137 1 737 139 1 140 1 141 1 142 1
2
145 1 146 147 148 149 150 151 152
3
153] 154 155 156 157 158 159 160
4
161] 162 163 164 165 166 167 168
5169 1 170 171 172 173 174 175 176
6177] 178 179 180 181 182 183 184
7185 1 186 187 188 189 190 191 192
8
193 1 , 194 195 196 197 198 199 200
9
201 1 202 203 204 205 206 207 208
10209 I 210 211 212 213 214 215 216
PLEASE SKIP NOW TO ITEM 34a ON PAGE 16.
FORM SASS-4B 9-7-91)
4 78 BEST COPY AVAILABLE
Page 15
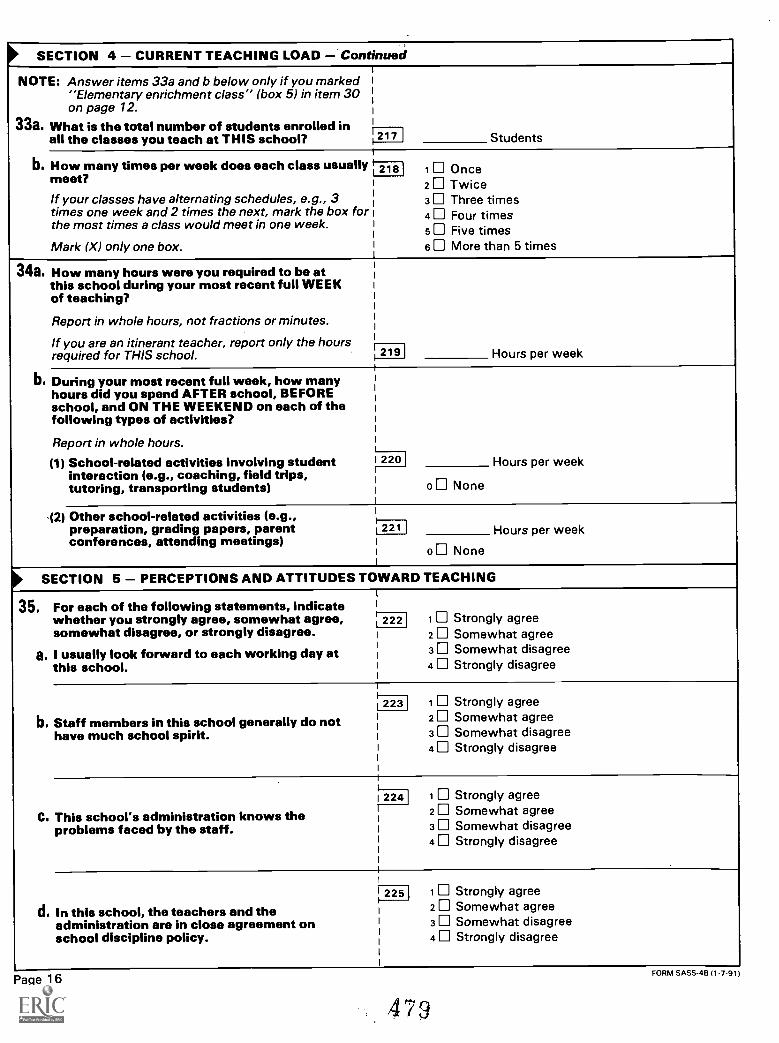
SECTION 4 CURRENT TEACHING LOAD Continued
NOTE: Answer items 33a and b below only if you marked"Elementary enrichment class" (box 5) in item 30on page 12.
33a. What is the total number of students enrolled inStudentsall the classes you teach at THIS school? 217 1
b. How many times per week does each class usuallymeet?
If your classes have alternating schedules, e.g., 3times one week and 2 times the next, mark the box forthe most times a class would meet in one week.
Mark (X) only one box.
1 Once2 Twice
2181
3 Three times4 Four times5 Five times6 More than 5 times
34a. How many hours were you required to be atthis school during your most recent full WEEKof teaching?
Report in whole hours, not fractions or minutes.
If you are an itinerant teacher, report only the hoursrequired for THIS school. Hours per week2191
b. During your most recent full week, how manyhours did you spend AFTER school, BEFOREschool, and ON THE WEEKEND on each of thefollowing types of activities?
Report in whole hours.
(1) School-related activities involving studentinteraction (e.g., coaching, field trips,tutoring, transporting students)
Hours per week220
o None
-12) Other school-related activities (e.g.,preparation, grading papers, parentconferences, attending meetings)
Hours per week221
o None
Il SECTION 5 PERCEPTIONS AND ATTITUDES TOWARD TEACHING
35. For each of the following statements, indicatewhether you strongly agree, somewhat agree,somewhat disagree, or strongly disagree.
a. I usually look forward to each working day atthis school.
1 Strongly agree2222 Somewhat agree3 Somewhat disagree4 Strongly disagree
b. Staff members in this school generally do nothave much school spirit.
1
1 Strongly agree2232 Somewhat agree3 Somewhat disagree4 Strongly disagree
C. This school's administration knows theproblems faced by the staff.
1 Strongly agree2242 Somewhat agree3 Somewhat disagree4 Strongly disagree
d. In this school, the teachers and theadministration are in close agreement onschool discipline policy.
1 Strongly agree22512 Somewhat agree3 Somewhat disagree4 Strongly disagree
Page 16
479
FORM SASS-4B (1-7-91)

SECTION 5 PERCEPTIONS AND ATTITUDES TOWARD TEACHING Continued35e. The level of student misbehavior (e.g., noise,
horseplay or fighting in the halls, cafeteria or i Strongly agree226
student lounge) in this school interferes with 2 Somewhat agreemy teaching. 3 Somewhat disagree
Strongly disagree
1 Strongly agree227
f. My principal enforces school rules for student 2 Somewhat agreeconduct and backs me up when I need it. 3 Somewhat disagree
4 Strongly disagree
1 Strongly agree228g. Rules for student behavior are consistently
2 Somewhat agreeenforced by teachers in this school, even forstudents who are not in their classes. 3 Somewhat disagree
4 Strongly disagree
1 Strongly agree2291h. The attitudes and habits my students bring to 2 Somewhat agreemy class greatly reduce their chances for
academic success. 3 Somewhat disagree4 Strongly disagree
1 Strongly agree230 Ii. Many of the students I teach are not capable of 2 Somewhat agree
learning the material I am supposed to teach3 Somewhat disagreethem.4 Strongly disagree
i
231 1 Strongly agreej. My teaching assignments are more difficult than 2 Somewhat agree
those of other teachers at this school.3 Somewhat disagree4 Strongly disagree
1 Strongly agree232k. For me the job of teaching has more advantages 2 Somewhat agreethan disadvantages.
3 Somewhat disagree4 Strongly disagree
1 Strongly agree233 II. If I had the chance to exchange my job as a 2 Somewhat agree
teacher for another kind of job, I would. 3 Somewhat disagree4 Strongly disagree
0 Not applicable This school has no librarian234 I
M. I plan with the librarian/media specialist for 1 Strongly agreethe integration of library/media services into 2 Somewhat agreemy teaching. 3 Somewhat disagree
4 Strongly disagree
0 Not applicable This school has no library235
11. Library/media materials are adequate tosupport my instructional objectives.
1
3
Strongly agreeSomewhat agreeSomewhat disagree
4 Strongly disagreeFORM SASS-4B 11-7-91)
460
Page 17

SECTION 5 PERCEPTIONS AND ATTITUDES TOWARD TEACHING Continued,
36. Of you could go back to your college days andstart over again, would you become ateacher or not?
Mark (X) only one box.
236 j 1 Certainly would become a teacher2 Probably would become a teacher3 El Chances about even for and against4 Probably would not become a teacher5 Certainly would not become a teacher
37. Indicate whether you strongly agree, somewhatagree, somewhat disagree, or strongly disagreethat this school is effective in assisting newteachers in each of the following matters.
8. Student discipline
237 1 Strongly agree2 Somewhat agree3 Somewhat disagree4 Strongly disagree
b. Instructional methods
238 1 Strongly agree_I
2 Somewhat agree3 Somewhat disagree4 Strongly disagree
C. Curriculum
239) 1 Strongly agree2 Somewhat agree3 Somewhat disagree4 Strongly disagree
d. Adjusting to the school environment
240 1 Strongly agree2 Somewhat agree3 Somewhat disagree4 Strongly disagree
33. We are interested in the importance you place onvarious education goals. From the following eightgoals, which do you consider the most important,the second most important, and the third mostimportant?
'I Building basic literacy skills (reading, math,writing, speaking)
2 Encouraging academic excellence3 Promoting occupational or vocational skills4 Promoting good work habits and
self-discipline5 Promoting personal growth (self-esteem,
self-knowledge, etc.)6 Promoting human relations skills7 Promoting specific moral values8 Fostering religious or spiritual
development
241 I Most important
242 Second most important
243 Third most important
39. At this school, how much actual influence do youthink teachers have over school policy in each ofthe following areas?
Use the scale of 1 6, where 1 means "Noinfluence" and 6 means "A great deal of influence."
8. Determining discipline policy
No , A great dealinfluence of influence
244) 1 2 3 4 5 6
b. Determining the content of in-service programs1
1 245 1 2 3 4 5 6
1
C. Setting policy on grouping students in classesby ability
I
11 2 3 4 5 61246
1
d. Establishing curriculum1
1
1 247 1 1 2 3 4 5 6
1
Page 18
481
FORM SASS-4B 11-7-91)

SECTION 5 PERCEPTIONS AND ATTITUDES TOWARD TEACHING Continued
40. At this school, how much control do you feel youhave IN YOUR CLASSROOM over each of thefollowing areas of your planning and teaching?
Use the scale of 1 6, where 1 means "No control"and 6 means "Complete control."
8. Selecting textbooks and other instructionalmaterials
Nocontrol
1
Completecontrol
62 3 4 52481
b. Selecting content, topics, and skills to be taught 1 2 3 4 5 62491
C. Selecting teaching techniques 1 2 3 4 1 5 62501
d. Evaluating and grading students 1 2 3 4 5 6251
e. Disciplining students i 2 3 4 5 62521
f. Determining the amount of homeworkto be assigned 1 2 3 4 5 62531
41. To what extent is each of the following matters aproblem in this school? Indicate whether it is aserious problem, a moderate problem, a minorproblem, or not a problem in this school.
8. Student tardiness
b. Student absenteeism
C. Teacher absenteeism
d. Students cutting class
O. Physical conflicts among students
f. Robbery or theft
9. Vandalism of school property
II. Student pregnancy
I. Student use of alcohol
J. Student drug abuse
k. Student possession of weapons
I. Physical abuse of teachers
Mark (X) one box on each line.
SerSerious MModerated t Minor Not aproblem
254
1 3 42
255
1 42 3 1
256
1 42 3
257
1 42 3
258 1
1 42 3
259 1
1 42 3
260 1
1 42 3
261 1
1 2 3 4
262
1 2 3 4
2631 2 31 4,
264J1 21 31 4
265 11 2 3 4
FORM SASS-48 (1-7-911
482
Page 19

SECTION 5 PERCEPTIONS AND ATTITUDES TOWARD TEACHING Continued
41. ContinuedTo what extent is each of the following mattersa problem in this school? Indicate whether it isa serious problem, a moderate problem, a minorproblem, or not a problem in this school.
m. Verbal abuse of teachers
n. Student disrespect for teachers
o. Students dropping out
p. Student apathy
q. Lack of academic challenge
r. Lack of parent involvement
s. Parental alcoholism and/or drug abuse
Mark (X) one box on each line.
Serious Moderate MinorNot a
problem266 I
1 2 3 4
2671
1 2 3 4
268i 2 3 4
269 I1 2 3 4
270
1 2 3 4
271 I
i 2 3 4
272 1
i 2 3 4
273
t. Poverty
u. Racial tension
v. Cultural conflict
1 2 3 4
274 1
1 2 3 4
275 1
1 2 3 4
42. How long do you plan to remain in teaching?
Mark (X) only one box.
276 1 As long as I am able Continue
2 Until I am eligible for retirementwith item 43
3 Will probably continue unlesssomething better comes along
Skip to4 Definitely plan to leave teaching item 44a
as soon as I can
5 Undecided at this time
43. In how many years do you plan to retirefrom teaching?
277 Years
Remarks
_____....._ . _ ....Page 20
483

SECTION 5 PERCEPTIONS AND ATTITUDES TOWARD TEACHING Continued
44a. What was your MAIN activity LAST278 ISCHOOL YEAR? 1 Teaching in this school
2 Teaching in another PRIVATE schoolMark (X) only one box.4 Teaching in a PUBLIC school5 Teaching in a preschool6 Teaching at the postsecondary level7 Working as a substitute teachera Student at a college or university9 Working in a nonteaching occupation in the
field of education10 Working in an occupation outside the field
of education11 Caring for family members12 Unemployed and seeking work13 Military service14 Retired from another job
b. What do you expect your MAIN activity will beNEXT SCHOOL YEAR? 279 I 1 Teaching in this school
2 Teaching in another PRIVATE schoolMark (X) only one box.4 Teaching in a PUBLIC school5 Teaching in a preschool6 Teaching at the postsecondary level7 Working as a substitute teacher8 Student at a college or university9 Working in a nonteaching occupation in the
field of education10 Working in an occupation outside the field
of educationii Caring for family members12 Unemployed and seeking work13 Military service14 Retired
k SECTION 6 INCENTIVES AND COMPENSATION
45. Do you currently receive the followingpay incentives?
a. Additional pay for assuming additional 1 Yes280 I2responsibilities as a master or mentor teacher
(e.g., supervising new teachers)N o
b. Additional pay for teaching in a shortage field1 Yesi 281 I(e.g., math, science)
i 2 N o
C. Additional pay for teaching in a high-prioritylocation (e.g., an inner-city school) 1 Yes
N o282
2
d. Salary increases as part of a career ladder inwhich you progress through several promotional 1 Yes283 Ii
i 2levels based on your performance N o
O. A merit pay bonus for exceptional performancein a given year 1 Yes284 I 2 No
f. A schoolwide bonus because your schoolshowed exceptional performance orimprovement in a given year
1 YesN o
285 I2
FORM SASS-48 (1-7-91)
484 BESTCOPYAVAILABLEPage 21
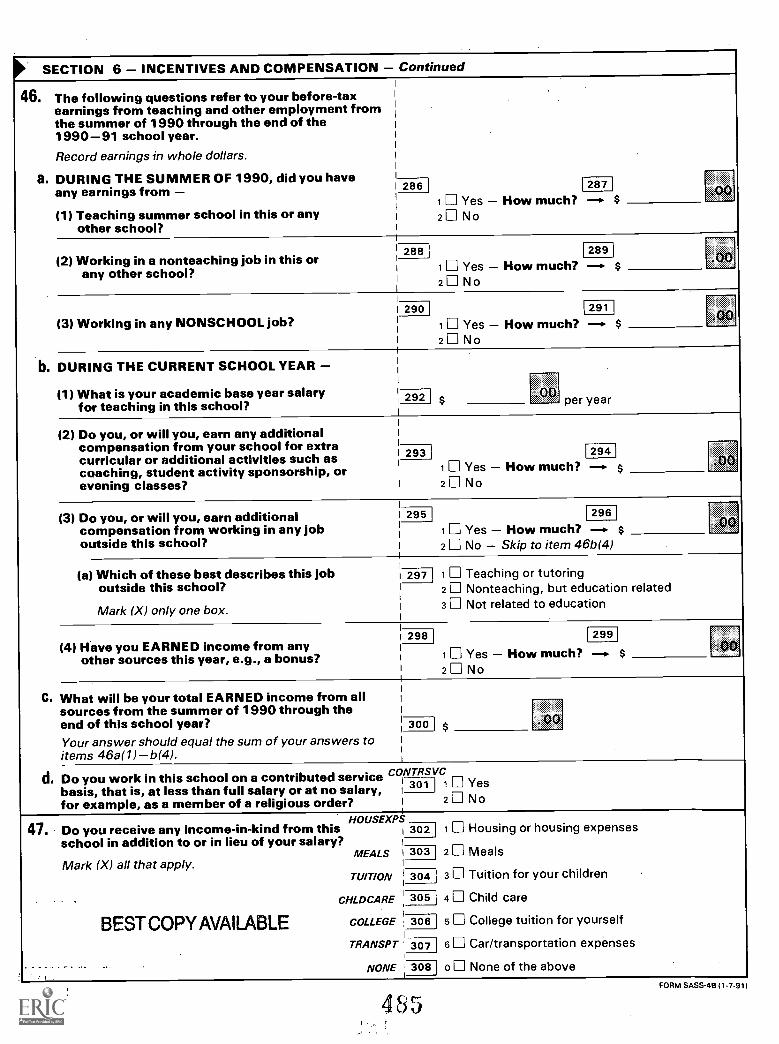
SECTION 6 INCENTIVES AND COMPENSATION Continued
46. The following questions refer to your before-taxearnings from teaching and other employment fromthe summer of 1990 through the end of the1990-91 school year.Record earnings in whole dollars.
a. DURING THE SUMMER OF 1990, did you haveany earnings from
(1) Teaching summer school in this or anyother school?
286 287
1 Yes How much? -- $2 N o
(2) Working in a nonteachin job in this orany other school?
288 289. 00.....2l Yes How much? --
2 No$
(3) Working in any NONSCHOOL job?290 291
$.00
i 1 Yes How much? --2 No
b. DURING THE CURRENT SCHOOL YEAR
(1) What is your academic base year salaryfor teaching in this school? per year292 $
(2) Do you, or will you, earn any additionalcompensation from your school for extracurricular or additional activities such ascoaching, student activity sponsorship, orevening classes?
293 294$1 Yes How much? --.
2 N o
(3) Do you, or will you, earn additional i 295 ] 296
compensation from working in any job i
outside this school? i
l Yes How much? --. $2 No Skip to item 46b(4)
(a) Which of these best describes this job 297 1 Teaching or tutoringoutside this school?
Mark (X) only one box.
2 Nonteaching, but education related3 Not related to education
298 299(4) Have you EARNED income from any
other sources this year, e.g., a bonus? 1 Yes How much? --. $ .00
2 No
C. What will be your total EARNED income from allsources from the summer of 1990 through the
$end of this school year? i 300Your answer should equal the sum of your answers toitems 46a(1) b(4).
d. Do you work in this school on a contributed service CONTRSVC
basis, that is, at less than full salary or at no salary, 301 I 1 Yes2 N ofor example, as a member of a religious order? i
HOUSEXPS1 Housing or housing expenses47. Do you receive any income-in-kind from this i 302
school in addition to or in lieu of your salary?MEALS 1 303 2 Meals
Mark (X) all that apply.TUITION 304 3 Tuition for your children
CHLDCARE 305 4 Child care
BEST COPY AVAILABLE COLLEGE 306 5 College tuition for yourself
TRANSPT 307 6 Car/transportation expenses
NONE 308 0 None of the above
Page 224 o
FORM SASS-4B (1-7-91)

SECTION 7 BACKGROUND INFORMATIONFA MLYINC
48. Which category represents the total combined oos I 10 Less than $10,000income of all FAMILY members age 14 and olderin your household during 1990? Include money 2 $ 10,000 $14,999from jobs, net business or farm income, pensions, 3 $ 15,000 $19,999dividends, interest, rent, social securitypayments, and any other income received by 4 $ 20,000 $24,999family members in your household. 5 $ 25,000 $29,999
6 $ 30,000 $34,999Mark (X) only one box.7 $ 35,000 $39,9998 $ 40,000 $49,9999 $ 50,000 $59,999
io $ 60,000 $74,999ii $ 75,000 $99,99912 $100,000 or more
49. Are you male or female? I SEX
310 1 Malei 2 Female1
i
1 RACE50a. What is your race? 311 I 1 American Indian, Alaskan Native (Aleut, AlaskanIndian, Yupik, lnupiat) Continue with b
Mark (X) only one box. 2 Asian or Pacific Islander (Japanese,Chinese, Filipino, Korean, AsianIndian, Vietnamese, Hawaiian, Skip toGuamanian, Samoan, other Asian) item 51
3 Black4 White
b. Are you enrolled in a state or federally 1 TRIBErecognized tribe? 131211 Yes
i
2 No
51. Are you of Hispanic origin?1
1
HISPANIC1313
1 YesI 2 No1
i52. What is your year of birth? 1 SIR THYR
13141
I
53.1
j MARITALWhat is your current marital status?1315 I 1 Married
2 Widowed, divorced, or separatedI 3 Never married
54. How many children do you have who are I DEPCHLDNdependent on you (and your spouse) for more 1 Number of childrenthan half of their financial support? 316 I supported Continue with 55
o None Skip to item 56
55. What was the age of your youngest child onhis/her last birthday?
A GEYOUNG
317If child is less than one year, please enter "0." Age of youngest child
56. Do you have persons other than your spouseor children who are dependent on you for
OTHERDEP318 [319 DEPCOUNT
more than half of their financial support? 1 Yes How many persons?2 No
FORM SASS -48 (1-7-91)
486 BESTrem".v11.!'
Page 23
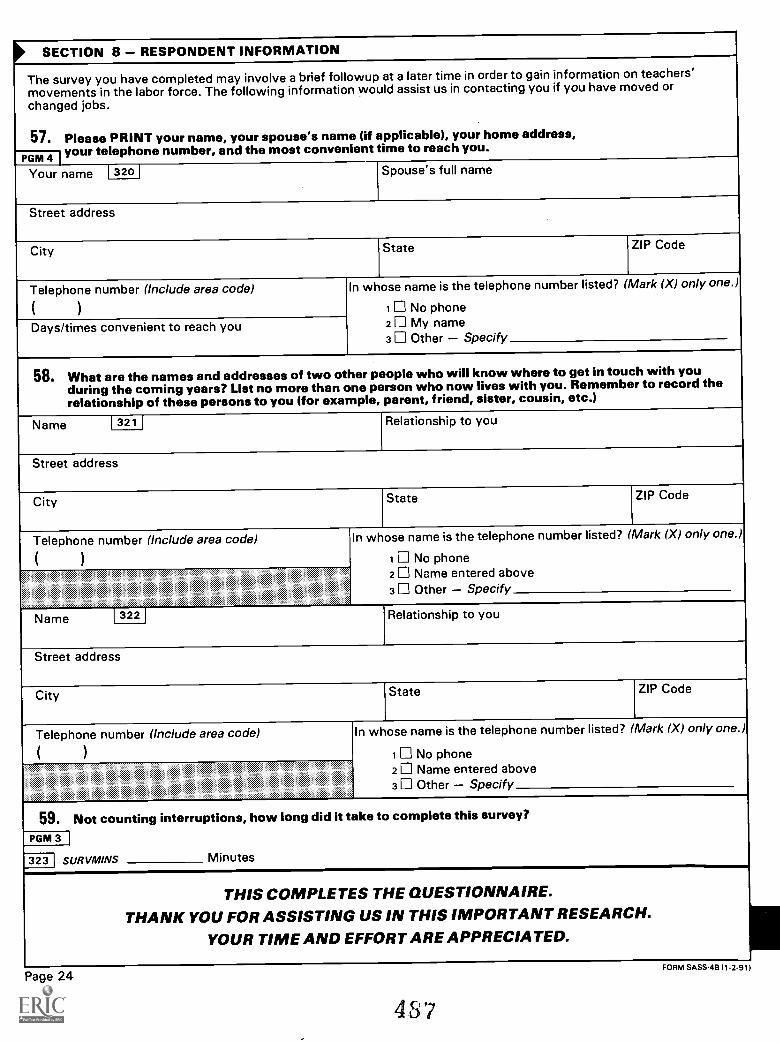
SECTION 8 RESPONDENT INFORMATION
The survey you have completed may involve a brief followupmovements in the labor force. The following informationchanged jobs.
57. Please PRINT your name, your spouse's name
at a later time in order to gain information on teachers'would assist us in contacting you if you have moved or
(if applicable), your home address,time to reach you.
PGMI your telephone number, and the most convenient
Your name 3201 Spouse's full name
Street address
City State ZIP Code
Telephone number (Include area code)
( )
In whose name is the telephone number listed? (Mark (X) only one.)
1 No phone
Days/times convenient to reach you 2 My name3 Other Specify
58. What are the names and addresses of two other people who will know where to get in touch with youduring the coming years? List no more than one person who now lives with you. Remember to record therelationship of these persons to you (for example, parent, friend, sister, cousin, etc.)
Name 1 321 I Relationship to you
Street address
City State ZIP Code
Telephone number (Include area code)
(
In whose name is the telephone number listed? (Mark (X) only one.)
1 No phone2 Name entered above3 Other Specify
Name 322 I Relationship to you
Street address
City State ZIP Code
Telephone number (Include area code)
( )
In whose name is the telephone number listed? (Mark (X) only one.)
1 No phone2 Name entered above3 Other Specify
59. Not counting interruptions, how long did it take to complete this survey?
PGNI 3
323 SUR VMINS Minutes
THIS COMPLETES THE QUESTIONNAIRE.THANK YOU FOR ASSISTING US IN THIS IMPORTANT RESEARCH.
YOUR TIME AND EFFORT ARE APPRECIATED.
Page 24
487
FORM SASS-4B 11-2-91)

G-1
Appendix G. Industry and Occupation Codes
1980 Census Of Population Industry Classifications
The 3 digit number in the left margin is the code symbol for the occupation category.The number in parentheses to the right of the description is the SIC definition.
AGRICULTURE, FORESTRY, AND FISHERIES
010 Agricultural production, crops (01)011 Agricultural production, livestock (02)020 Agricultural services, except horticultural (07, except 078)021 Horticultural services (078)030 Forestry (08)031 Fishing hunting, and trapping (09)
MINING
040 Metal mining (10)041 Coal mining (11, 12)042 Crude petroleum and natural gas extraction (13)050 Nonmetallic mining and quarrying, except fuel (14)060 Construction (15, 16, 17)
MANUFACTURING
NONDURABLE GOODS
FOOD AND KINDRED PRODUCTS
100 Meat products (201)101 Dairy products (202)102 Canned and preserved fruits and vegetables (203)110 Grain mill products (204)111 Bakery products (205)112 Sugar and confectionery products (206)120 Beverage industries (208)121 Miscellaneous food preparations and kindred products (207,209)122 Not specified food industries130 Tobacco manufactures (21)
TEXTILE MILL PRODUCTS
132 Knitting mills (225)140 Dyeing and finishing textiles, except wool and knit goods (226)141 Floor coverings, except hard surface (227)
488
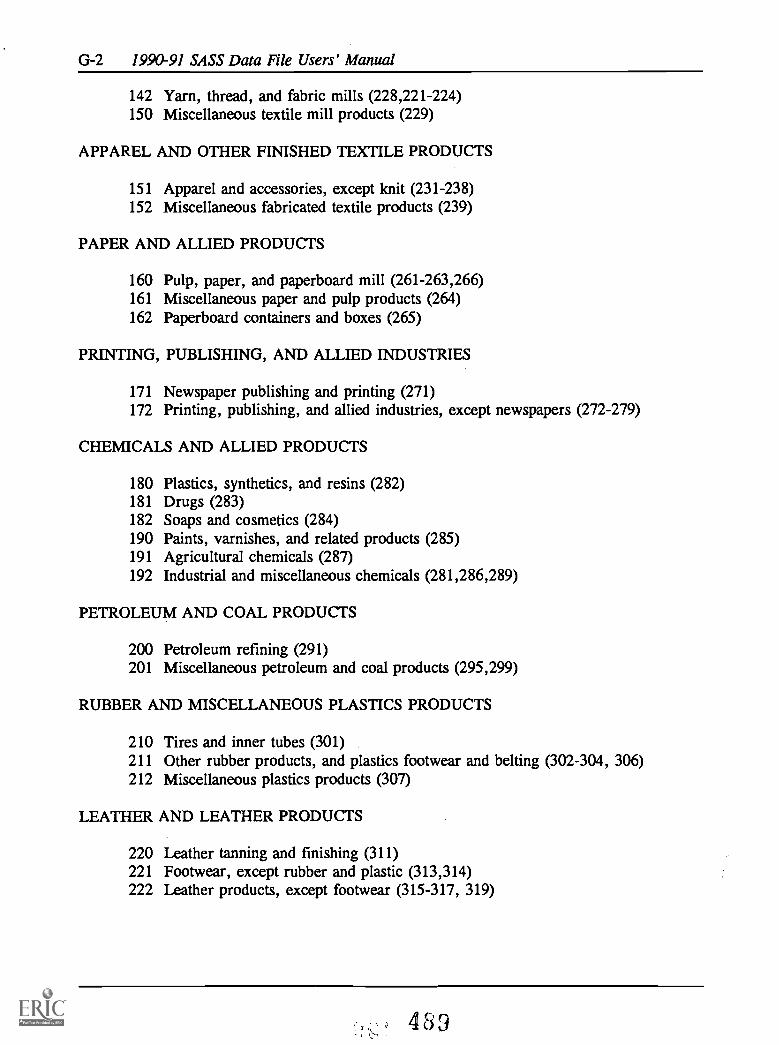
G-2 1990-91 SASS Data File Users' Manual
142 Yarn, thread, and fabric mills (228,221-224)150 Miscellaneous textile mill products (229)
APPAREL AND OTHER FINISHED TEXTILE PRODUCTS
151 Apparel and accessories, except knit (231-238)152 Miscellaneous fabricated textile products (239)
PAPER AND ALLIED PRODUCTS
160 Pulp, paper, and paperboard mill (261-263,266)161 Miscellaneous paper and pulp products (264)162 Paperboard containers and boxes (265)
PRINTING, PUBLISHING, AND ALLIED INDUSTRIES
171 Newspaper publishing and printing (271)172 Printing, publishing, and allied industries, except newspapers (272-279)
CHEMICALS AND ALLIED PRODUCTS
180 Plastics, synthetics, and resins (282)181 Drugs (283)182 Soaps and cosmetics (284)190 Paints, varnishes, and related products (285)191 Agricultural chemicals (287)192 Industrial and miscellaneous chemicals (281,286,289)
PETROLEUM AND COAL PRODUCTS
200 Petroleum refining (291)201 Miscellaneous petroleum and coal products (295,299)
RUBBER AND MISCELLANEOUS PLASTICS PRODUCTS
210 Tires and inner tubes (301)211 Other rubber products, and plastics footwear and belting (302-304, 306)212 Miscellaneous plastics products (307)
LEATHER AND LEATHER PRODUCTS
220 Leather tanning and finishing (311)221 Footwear, except rubber and plastic (313,314)222 Leather products, except footwear (315-317, 319)
489

Appendix G G-3
DURABLE GOODS
LUMBER AND WOOD PRODUCTS, EXCEPT FURNITURE
230 Logging (241)231 Sawmills, planning mills, and millwork (242, 243)232 Wood buildings and mobile homes (245)241 Miscellaneous wood products (244,249)242 Furniture and fixtures (25)
STONE, CLAY, GLASS, AND CONCRETE PRODUCTS
250 Glass and glass products (321-323)251 Cement, concrete, gypsum, and plaster products (324,327)252 Structural clay products (325)261 Pottery and related products (326)262 Miscellaneous nonmetallic mineral and stone products (328,329)
METAL INDUSTRIES
270 Blast furnaces, steelworks, rolling and finishing mills(331)271 Iron and steel foundries (332)272 Primary aluminum industries (3334, pt 334, 3353-55,3361)280 Other primary metal industries (3331-3333, 3339, 334, 3351, 3356, 3357, 3362,
3369, 339)281 Cutlery, hand tools, and other hardware (342)282 Fabricated structural metal products (344)290 Screw machine products (345)291 Metal forgings and stampings (346)292 Ordinance (348)300 Miscellaneous fabricated metal products (341,343,349)301 Not specified metal industries
MACHINERY, EXCEPT ELECTRICAL
310 Engines and turbines (351)311 Farm machinery and equipment (352)312 Construction and material handling machines (353)320 Metal working machinery (354)321 Office and accounting machines (357, except 3573)322 Electronic computing equipment (3573)331 Machinery, except electrical, N.E.C. (355, 356, 359)332 Not specified machinery
490
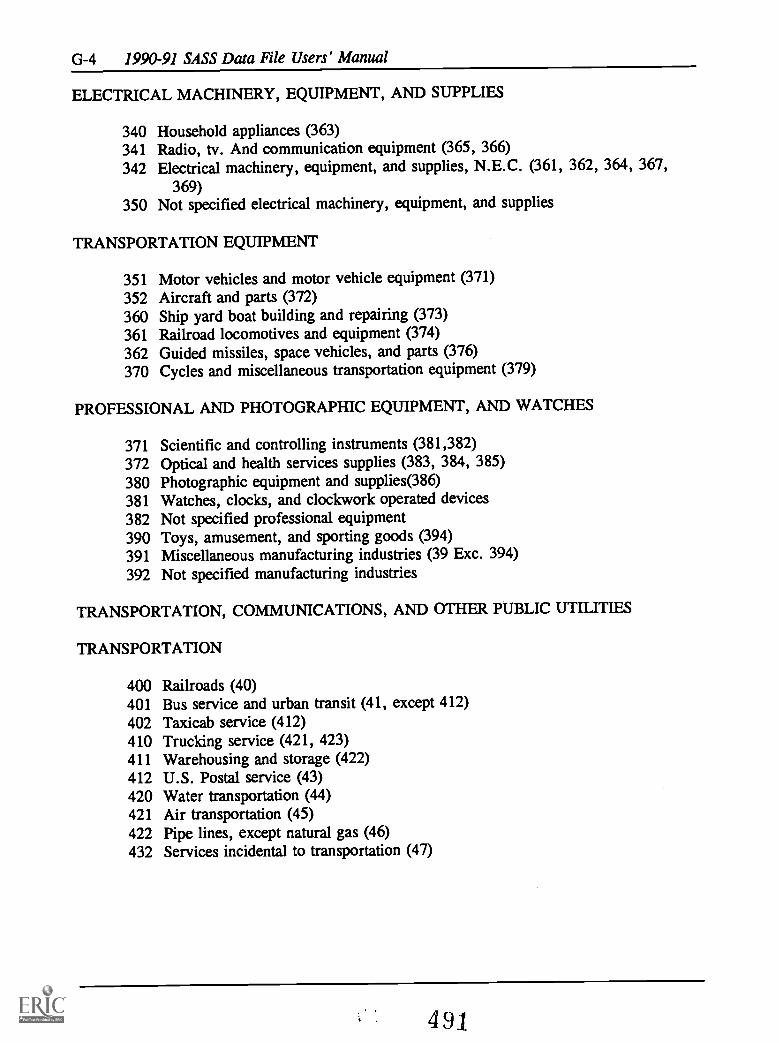
G-4 1990-91 SASS Data File Users' Manual
ELECTRICAL MACHINERY, EQUIPMENT, AND SUPPLIES
340 Household appliances (363)341 Radio, tv. And communication equipment (365, 366)342 Electrical machinery, equipment, and supplies, N.E.C. (361, 362, 364, 367,
369)350 Not specified electrical machinery, equipment, and supplies
TRANSPORTATION EQUIPMENT
351 Motor vehicles and motor vehicle equipment (371)352 Aircraft and parts (372)360 Ship yard boat building and repairing (373)361 Railroad locomotives and equipment (374)362 Guided missiles, space vehicles, and parts (376)370 Cycles and miscellaneous transportation equipment (379)
PROFESSIONAL AND PHOTOGRAPHIC EQUIPMENT, AND WATCHES
371 Scientific and controlling instruments (381,382)372 Optical and health services supplies (383, 384, 385)380 Photographic equipment and supplies(386)381 Watches, clocks, and clockwork operated devices382 Not specified professional equipment390 Toys, amusement, and sporting goods (394)391 Miscellaneous manufacturing industries (39 Exc. 394)392 Not specified manufacturing industries
TRANSPORTATION, COMMUNICATIONS, AND OTHER PUBLIC UTILITIES
TRANSPORTATION
400 Railroads (40)401 Bus service and urban transit (41, except 412)402 Taxicab service (412)410 Trucking service (421, 423)411 Warehousing and storage (422)412 U.S. Postal service (43)420 Water transportation (44)421 Air transportation (45)422 Pipe lines, except natural gas (46)432 Services incidental to transportation (47)
491

Appendix G G-5
COMMUNICATIONS
440 Radio and television broadcasting (483)441 Telephone (wire and radio) (481)442 Telegraph and miscellaneous communication services (482, 489)
UTILITIES AND SANITARY SERVICES
460 Electric light and power (491)461 Gas and steam supply systems (492, 496)462 Electric and gas, and other combination (493)470 Water supply and irrigation (494, 497)471 Sanitary services (495)472 Not specified utilities
WHOLESALE TRADE
DURABLE GOODS
500 Motor vehicles and equipment (501)501 Furniture and home furnishings (502)502 Lumber and construction materials (503)510 Sporting goods, toys, and hobby goods (504)511 Metals and minerals, except petroleum (505)512 Electrical goods (506)521 Hardware, plumbing and heating supplies (507)522 Not specified electrical and hardware products530 Machinery, equipment, and supplies (508)531 Scrap and waste materials (5093)532 Miscellaneous wholesale, durable goods (5094, 5099)
NONDURABLE GOODS
540 Paper and paper products (511)541 Drugs, chemicals, and allied products (512, 516)542 Apparel, fabrics, and notions (513)550 Groceries and related products (514)551 Farm-product raw materials (515)552 Petroleum products (517)560 Alcoholic beverages (518)561 Farm supplies (5191)562 Miscellaneous wholesale, nondurable goods (5194,5198,5199)571 Not specified wholesale trade
492

G-6 1990-91 SASS Data File Users' Manual
RETAIL TRADE
580 Lumber and building material retailing (521,523)581 Hardware stores (525)582 Retail nurseries and garden stores (526)590 Mobile home dealers (527)591 Department stores (531)592 Variety stores (533)600 Miscellaneous general merchandise stores (539)601 Grocery stores (541)602 Dairy products stores (545)610 Retail bakeries (546)611 Food stores, N.E.C. (542,543,544,549)612 Motor vehicle dealers (551,552)620 Auto and home supply stores (553)621 Gasoline service stations (554)622 Miscellaneous vehicle dealers (555,556,557,559)630 Apparel and accessory stores, except shoe (56, except 566)631 Shoe stores (566)632 Furniture and home furnishings stores (571)640 Household appliances, tv, and radio stores (572,573)641 Eating and drinking places (58)642 Drug stores (591)650 Liquor stores (592)651 Sporting goods, bicycles, and hobby stores (5941,5945,5946)652 Book and stationery stores (5942,5943)660 Jewelry stores (5944)661 Sewing, needlework, and piece goods stores (5949)662 Mail order houses (5961)670 Vending machine operators (5962)671 Direct selling establishments (5963)672 Fuel and ice dealers (598)681 Retail florists (5992)682 Miscellaneous retail stores (593,5947,5948,5993,5994,5999)691 Not specified retail trade
FINANCE, INSURANCE, AND REAL ESTATE
700 Banking (60)701 Savings and loan associations (612)702 Credit agencies, N.E.C. (61,Except 612)710 Security, commodity brokerage, and investment companies (62,67)711 Insurance (63,64)712 Real estate, including real estate-insurance-law offices (65,66)
4 9 3

Appendix G G-7
BUSINESS AND REPAIR SERVICES
721 Advertising (731)722 Services to dwellings and other buildings (734)730 Commercial research, development, and testing labs (7391,7397)731 Personnel supply services (736)732 Business management and consulting services (7392)740 Computer and data processing services (737)741 Detective and protective services (7393)742 Business services, N.E.C. (732,733,735,7394,7395,7396,7399)750 Automotive services, except repair (751,752,754)751 Automotive repair shops (753)752 Electrical repair shops (762,7694)760 Miscellaneous repair services (763,764,7692,7699)
PERSONAL SERVICES
761 Private households (88)762 Hotels and motels (701)770 Lodging places, except hotels and motels (702,703,704)771 Laundry, cleaning, and garment services (721)772 Beauty shops (723)780 Barber shops (724)781 Funeral service and crematories (726)782 Shoe repair shops (725)790 Dressmaking shops(Pt 729)791 Miscellaneous personal services (722,Pt 729)
ENTERTAINMENT AND RECREATION SERVICES
800 Theaters and motion pictures (78,792)801 Bowling alleys, billiard and pool parlors (793)802 Miscellaneous entertainment and recreation services (791,794,799)
PROFESSIONAL AND RELATED SERVICES
812 Offices of physicians (801,803)820 Offices of dentists (802)821 Offices of chiropractors (8041)822 Offices of optometrists (8042)830 Offices of health practitioners, N.E.C. (8049)831 Hospitals (806)832 Nursing and personal care facilities (805)840 Health services, N.E.C. (807,808,809)841 Legal services (81)842 Elementary and secondary schools (821)850 Colleges and universities (822)
494

G-8 1990-91 SASS Data File Users' Manual
851 Business, trade, and vocational schools (824)852 Libraries (823)860 Educational services, N.E.C. (829)861 Job training and vocational rehabilitation services (833)862 Child day care services (835)870 Residential care facilities, without nursing (836)871 Social services, N.E.C. (832,839)872 Museums, art galleries, and zoos (84)880 Religious organizations (866)881 Membership organizations (861-865,869)882 Engineering, architectural, and surveying services (891)890 Accounting, auditing, and bookkeeping services (893)891 Noncommercial educational and scientific research (892)892 Miscellaneous professional and related services (899)
PUBLIC ADMINISTRATION
900 Executive and legislative offices (911-913)901 General government, N.E.C. (919)910 Justice, public order, and safety (92)921 Public finance, taxation, and monetary policy (93)922 Administration of human resources programs (94)930 Administration of environmental quality and housing programs (95)931 Administration of economic programs (96)932 National security and international affairs (97)990 Industry not reported
MANAGERIAL AND PROFESSIONAL SPECIALTY OCCUPATIONS
EXECUTIVE, ADMINISTRATIVE, AND MANAGERIAL OCCUPATIONS
003 Legislators (112)004 Chief executives and general administrators, public administration (111)005 Administrators and officials, public administration (pt 113 and 119, except 1136)006 Administrators, protective services (pt 113)007 Financial managers (122)008 Personnel and labor relations managers (123)009 Purchasing managers (124)013 Managers, marketing, advertising, and public relations (125)014 Administrators, education and related fields (128)015 Managers, medicine and health (131)016 Managers, properties and real estate (1353)017 Postmasters and mail superintendents (1344)018 Funeral directors (Pt 1359)019 Managers and administrators, N.E.C. (1136,121,126,127, 132-139, Except
1344,1353,Pt 1359)
4 :35

Appendix G G-9
MANAGEMENT RELATED OCCUPATIONS
023 Accountants and auditors (1412)024 Underwriters (Pt 1419)025 Other financial officers (Pt 1419)026 Management analysts (142)027 Personnel, training, and labor relations specialists (143)028 Purchasing agents and buyers, farm products (Pt 144)029 Buyers, wholesale and retail trade, except farm products (432)033 Purchasing agents and buyers, N.E.C. (Pt 144)034 Business and promotion agents (145)035 Construction inspectors (1171, 618)036 Inspectors and compliance officers, Exc. construction (1172,147)037 Management related occupation, N.E.C. (149)
PROFESSIONAL SPECIALTY OCCUPATIONS
043 Architects (15)
ENGINEERS, SURVEYORS AND MAPPING SCIENTISTS
044 Aerospace engineers (1622)045 Metallurgical and materials engineers (1623)046 Mining engineers (1624)047 Petroleum engineers (1625)048 Chemical engineers (1626)049 Nuclear engineers (1627)053 Civil engineers (1628)054 Agricultural engineers (1632)055 Electrical and electronic engineers (1633,1636)056 Industrial engineers (1634)057 Mechanical engineers (1635)058 Marine engineers and naval architects (1637)059 Engineers, N.E.C. (1639)063 Surveyors and mapping scientists (1642)
MATHEMATICAL AND COMPUTER SCIENTISTS
064 Computer systems analysts and scientists (171)065 Operations and systems researchers and analysts (172)066 Actuaries (1732)067 Statisticians (1733)068 Mathematical scientists, N.E.C. (1739)
496

G-10 1990-91 SASS Data File Users' Manual
NATURAL SCIENTISTS
069 Physicists and astronomers (1842,1843)073 Chemists, except biochemists (1845)074 Atmospheric and space scientists (1846)075 Geologists and geodesists (1847)076 Physical scientists, N.E.C. (1849)077 Agricultural and food scientists (1853)078 Biological and life scientists (1854,1859)079 Forestry and conservation scientists (1852)083 Medical scientists (1855)
HEALTH DIAGNOSING OCCUPATIONS
084 Physicians (261)085 Dentists (262)086 Veterinarians (27)087 Optometrists (281)088 Podiatrists (283)089 Health diagnosing practitioners, N.E.C. (289)
HEALTH ASSESSMENT AND TREATING OCCUPATIONS
095 Registered nurses (29)096 Pharmacists (301)097 Dietitians (302)
THERAPISTS
098 Inhalation therapists (Pt 303)099 Occupational therapists (Pt 303)103 Physical therapists (Pt 303)104 Speech therapists (Pt 303)105 Therapists, N.E.C. (Pt 303)106 Physicians' assistants (304)
TEACHERS, POSTSECONDARY
113 Earth, environmental, and marine science teachers (2212)114 Biological science teachers (2213)115 Chemistry teachers (2214)116 Physics teachers (2215)117 Natural science teachers, N.E.C. (2216)118 Psychology teachers (2217)119 Economics teachers (2218)123 History teachers (2222)124 Political science teachers (2223)
497
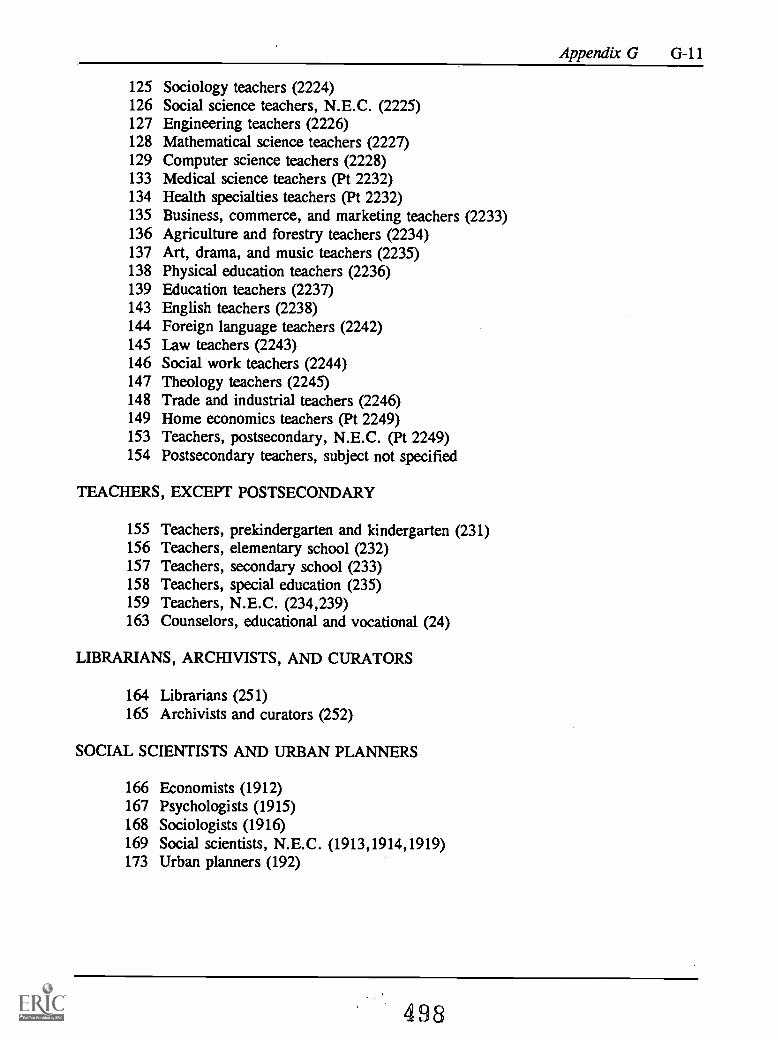
Appendix G G-11
125 Sociology teachers (2224)126 Social science teachers, N.E.C. (2225)127 Engineering teachers (2226)128 Mathematical science teachers (2227)129 Computer science teachers (2228)133 Medical science teachers (Pt 2232)134 Health specialties teachers (Pt 2232)135 Business, commerce, and marketing teachers (2233)136 Agriculture and forestry teachers (2234)137 Art, drama, and music teachers (2235)138 Physical education teachers (2236)139 Education teachers (2237)143 English teachers (2238)144 Foreign language teachers (2242)145 Law teachers (2243)146 Social work teachers (2244)147 Theology teachers (2245)148 Trade and industrial teachers (2246)149 Home economics teachers (Pt 2249)153 Teachers, postsecondary, N.E.C. (Pt 2249)154 Postsecondary teachers, subject not specified
TEACHERS, EXCEPT POSTSECONDARY
155 Teachers, prekindergarten and kindergarten (231)156 Teachers, elementary school (232)157 Teachers, secondary school (233)158 Teachers, special education (235)159 Teachers, N.E.C. (234,239)163 Counselors, educational and vocational (24)
LIBRARIANS, ARCHIVISTS, AND CURATORS
164 Librarians (251)165 Archivists and curators (252)
SOCIAL SCIENTISTS AND URBAN PLANNERS
166 Economists (1912)167 Psychologists (1915)168 Sociologists (1916)169 Social scientists, N.E.C. (1913,1914,1919)173 Urban planners (192)
488

G-12 1990-91 SASS Data File Users' Manual
SOCIAL, RECREATION, AND RELIGIOUS WORKERS
174 Social workers (2032)175 Recreation workers (2033)176 Clergy (2042)177 Religious workers, N.E.C. (2049)
LAWYERS AND JUDGES
178 Lawyers (211)179 Judges (212)
WRITERS, ARTISTS, ENTERTAINERS, AND ATHLETES
183 Authors (Pt 321)184 Technical writers (Pt 321)185 Designers (322)186 Musicians and composers (323)187 Actors and directors (324)188 Painters, sculptors, craft-artists, and artist printmakers (325, Pt 7263)189 Photographers (326)193 Dancers (327)194 Artists, performers, and related workers, N.E.C. (328, 329)195 Editors and reporters (331)197 Public relations specialists (332)198 Announcers (333)199 Athletes (34)
TECHNICAL, SALES, AND ADMINISTRATIVE SUPPORT OCCUPATIONS
TECHNICIANS AND RELATED SUPPORT OCCUPATIONS
HEALTH TECHNOLOGISTS AND TECHNICIANS
203 Clinical laboratory technologists and technicians (362)204 Dental hygienists (363)205 Health record technologists and technicians (364)206 Radio logic technicians (365)207 Licensed practical nurses (366)208 Health technologists and technicians, N.E.C. (369)
TECHNOLOGISTS AND TECHNICIANS, EXCEPT HEALTH
ENGINEERING AND RELATED TECHNOLOGISTS AND TECHNICIANS
213 Electrical and electronic technicians (3711)214 Industrial engineering technicians (3712)
499

Appendix G G-13
215 Mechanical engineering technicians (3713)216 Engineering technicians, N.E.C. (3719)217 Drafting occupations (3721)218 Surveying and mapping technicians (3722)
SCIENCE TECHNICIANS
223 Biological technicians (382)224 Chemical technicians (3831)225 Science technicians, N.E.C. (3832,3833,384,389)
TECHNICIANS, EXCEPT HEALTH, ENGINEERING, AND SCIENCE
226 Airplane pilots and navigators (645)227 Air traffic controllers (391)228 Broadcast equipment operators (392)229 Computer programmers (3931,3932)233 Tool programmers, numerical control (3934)234 Legal assistants (396)235 Technicians, N.E.C. (399)
SALES OCCUPATIONS
243 Supervisors and proprietors, sales occupations (40, Pt 4518)
SALES OCCUPATIONS, BUSINESS GOODS AND SERVICES
253 Insurance sales occupations (4222)254 Real estate sales occupations (4223)255 Securities and financial services sales occupations (4224)256 Advertising and related sales occupations (4253)257 Sales occupations, other business services (4252)258 Sales engineers (pt 16)259 Sales representatives, mining, manufacturing, and wholesale (412, 143)
SALES OCCUPATIONS, PERSONAL GOODS AND SERVICES
263 Sales workers, motor vehicles and boats (4142,4144)264 Sales workers, apparel (Pt 4146)265 Sales workers, shoes (Pt 4146)266 Sales workers, furniture and home furnishings (4148)267 Sales workers, radio, television, hi-fi, and appliances (4143, 4152)268 Sales workers, hardware and building supplies (4153)269 Sales workers, parts (4167)274 Sales workers, other commodities (4145,4147,4154,4156,4159,
Pt 4162,4169,4259,4665)275 Sales counter clerks (Pt 4162)
500

G-14 1990-91 SASS Data File Users' Manual
276 Cashiers (4683)277 Street and door-to-door sales workers (4163)
278 News vendors (4165)
SALES RELATED OCCUPATIONS
283 Demonstrators, promoters and models, sales (435)284 Auctioneers (Pt 439)285 Sales support occupations, N.E.C.(434,436,Pt439)
ADMINISTRATIVE SUPPORT OCCUPATIONS, INCLUDING CLERICAL
SUPERVISORS, ADMINISTRATIVE SUPPORT OCCUPATIONS
303 Supervisors, general office (4511-4514,4516,Pt 4518,4519,4529,4537)304 Supervisors, computer equipment operators (4535)305 Supervisors, financial records processing (4521,4536)306 Chief communications operators (4515)307 Supervisors, distribution, scheduling, and adjusting clerks (4522-4528)
COMPUTER EQUIPMENT OPERATORS
308 Computer operators (4852)309 Peripheral equipment operators (4853)
SECRETARIES, STENOGRAPHERS, AND TYPISTS
313 Secretaries (4612)314 Stenographers (4613)315 Typists (4622)
INFORMATION CLERKS
316 Interviewers (4642)317 Hotel clerks (4643)318 Transportation ticket and reservation agents (4644)
319 Receptionists (4645)323 Information clerks, N.E.C. (4649)
RECORDS PROCESSING OCCUPATIONS, EXCEPT FINANCIAL
325 Classified-ad clerks (4662)326 Correspondence clerks (4663)327 Order clerks (4664)328 Personnel clerks, except payroll and timekeeping (4692)
329 Library clerks (4694)
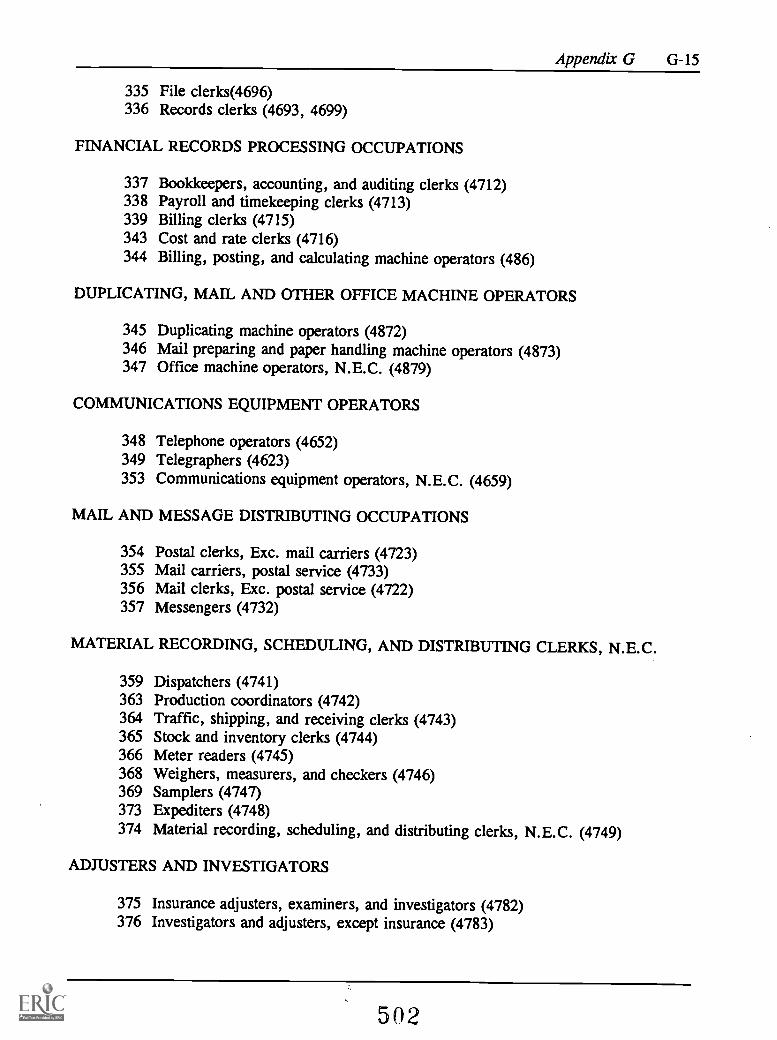
Appendix G G-15
335 File clerks(4696)336 Records clerks (4693, 4699)
FINANCIAL RECORDS PROCESSING OCCUPATIONS
337 Bookkeepers, accounting, and auditing clerks (4712)338 Payroll and timekeeping clerks (4713)339 Billing clerks (4715)343 Cost and rate clerks (4716)344 Billing, posting, and calculating machine operators (486)
DUPLICATING, MAIL AND OTHER OFFICE MACHINE OPERATORS
345 Duplicating machine operators (4872)346 Mail preparing and paper handling machine operators (4873)347 Office machine operators, N.E.C. (4879)
COMMUNICATIONS EQUIPMENT OPERATORS
348 Telephone operators (4652)349 Telegraphers (4623)353 Communications equipment operators, N.E.C. (4659)
MAIL AND MESSAGE DISTRIBUTING OCCUPATIONS
354 Postal clerks, Exc. mail carriers (4723)355 Mail carriers, postal service (4733)356 Mail clerks, Exc. postal service (4722)357 Messengers (4732)
MATERIAL RECORDING, SCHEDULING, AND DISTRIBUTING CLERKS, N.E.C.
359 Dispatchers (4741)363 Production coordinators (4742)364 Traffic, shipping, and receiving clerks (4743)365 Stock and inventory clerks (4744)366 Meter readers (4745)368 Weighers, measurers, and checkers (4746)369 Samplers (4747)373 Expediters (4748)374 Material recording, scheduling, and distributing clerks, N.E.C. (4749)
ADJUSTERS AND INVESTIGATORS
375 Insurance adjusters, examiners, and investigators (4782)376 Investigators and adjusters, except insurance (4783)
502

G-16 1990-91 SASS Data File Users' Manual
377 Eligibility clerks, social welfare (4784)378 Bill and account collectors (4786)
MISCELLANEOUS ADMINISTRATIVE SUPPORT OCCUPATIONS
379 General office clerks (4632)383 Bank tellers (4682)384 Proofreaders (4792)385 Data-entry keyers (4624)386 Statistical clerks (4717)387 Teachers' aides (4695)389 Administrative support occupations, N.E.C. (4787,4799)
SERVICE OCCUPATIONS
PRIVATE HOUSEHOLD OCCUPATIONS
403 Launderers and ironers (533)404 Cooks, private household (534)405 Housekeepers and butlers (535)406 Child care workers, private household (536)407 Private household cleaners and servants (532,537,539)
PROTECTIVE SERVICE OCCUPATIONS
SUPERVISORS, PROTECTIVE SERVICE OCCUPATIONS
413 Supervisors, firefighting and fire prevention occupations (5011)414 Supervisors, police and detectives (5012)415 Supervisors, guards (5013)
FIREFIGHTING AND FIRE PREVENTION OCCUPATIONS
416 Fire inspection and fire prevention occupations (5112)417 Firefighting occupations (4113)
POLICE AND DETECTIVES
418 Police and detectives, public service (5122)423 Sheriffs, bailiffs, and other law enforcement officers (5124)424 Correctional institution officers (5133)425 Crossing guards (4132)426 Guards and police, Exc. public service (5134)427 Protective service occupation, N.E.C. (5139)
503

Appendix G G-17
SERVICE OCCUPATIONS, EXCEPT PROTECTIVE AND PRIVATE HOUSEHOLD
FOOD PREPARATION AND SERVICE OCCUPATIONS
433 Supervisors, food preparation and service occupations (5021)434 Bartenders (5212)435 Waiters and waitresses (5213)436 Cooks, except short order (5214)437 Short-order cooks (5215)438 Good counter, fountain and related occupations (5216)439 Kitchen workers, food preparation (5217)443 Waiters Waitresses' assistants (5218)444 Miscellaneous food preparation occupations (5219)
HEALTH SERVICE OCCUPATIONS
445 Dental assistants (5232)446 Health aides, except nursing (5233)447 Nursing aides, orderlies, and attendants (5236)
CLEANING AND BUILDING SERVICE OCCUPATIONS, EXCEPT PRIVATE HOUSE-HOLD
448 Supervisors, cleaning and, building service workers (5024)449 Maids and housemen (5242, 5249)453 Janitors and cleaners (5244)454 Elevator operators (5245)455 Pest control occupations (5246)
PERSONAL SERVICE OCCUPATIONS
456 Supervisors, personal service occupations (5025)457 Barbers (5251)458 Hairdressers and cosmetologists (5252)459 Attendants, amusement and recreation facilities (5253)463 Guides (5254)464 Ushers (5255)465 Public transportation attendants (5256)466 Baggage porters and bellhops (5258)467 Welfare service aides (5262)468 Child care workers, except private household (5263)469 Personal service occupations, N.E.C. (5257, 5269)
504
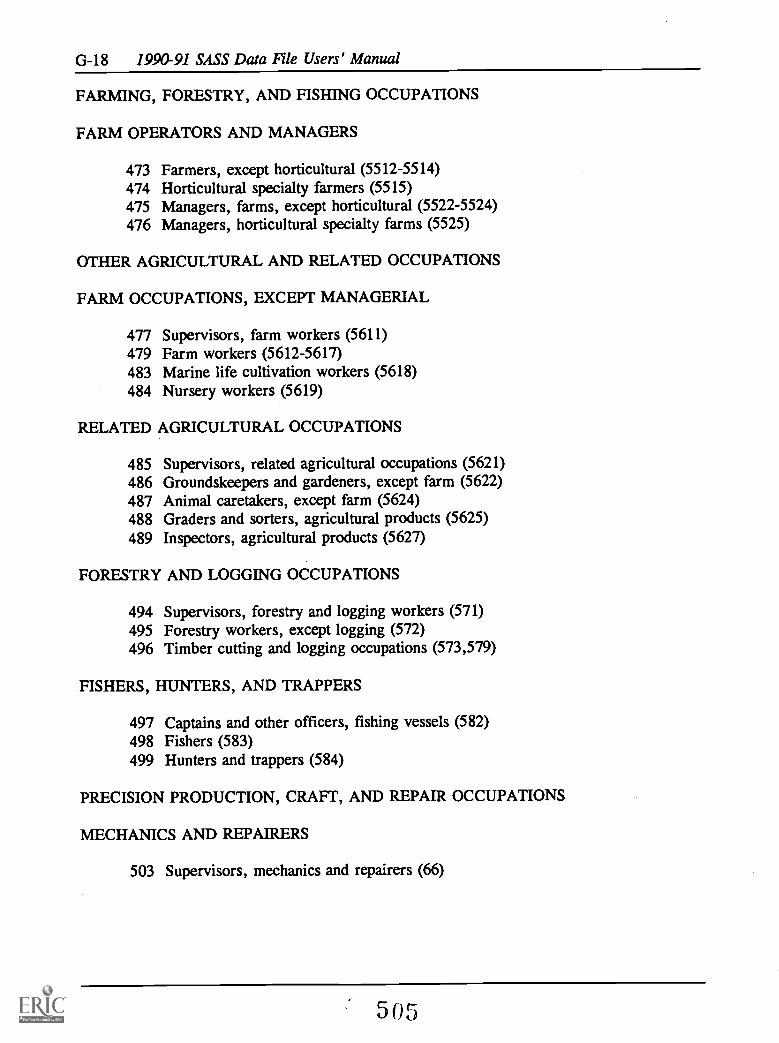
G-18 1990-91 SASS Data File Users' Manual
FARMING, FORESTRY, AND FISHING OCCUPATIONS
FARM OPERATORS AND MANAGERS
473 Farmers, except horticultural (5512-5514)474 Horticultural specialty farmers (5515)475 Managers, farms, except horticultural (5522-5524)476 Managers, horticultural specialty farms (5525)
OTHER AGRICULTURAL AND RELATED OCCUPATIONS
FARM OCCUPATIONS, EXCEPT MANAGERIAL
477 Supervisors, farm workers (5611)479 Farm workers (5612-5617)483 Marine life cultivation workers (5618)484 Nursery workers (5619)
RELATED AGRICULTURAL OCCUPATIONS
485 Supervisors, related agricultural occupations (5621)486 Groundskeepers and gardeners, except farm (5622)487 Animal caretakers, except farm (5624)488 Graders and sorters, agricultural products (5625)489 Inspectors, agricultural products (5627)
FORESTRY AND LOGGING OCCUPATIONS
494 Supervisors, forestry and logging workers (571)495 Forestry workers, except logging (572)496 Timber cutting and logging occupations (573,579)
FISHERS, HUNTERS, AND TRAPPERS
497 Captains and other officers, fishing vessels (582)498 Fishers (583)499 Hunters and trappers (584)
PRECISION PRODUCTION, CRAFT, AND REPAIR OCCUPATIONS
MECHANICS AND REPAIRERS
503 Supervisors, mechanics and repairers (66)
505

Appendix G G-19
MECHANICS AND REPAIRERS, EXCEPT SUPERVISORS
VEHICLE AND MOBILE EQUIPMENT MECHANICS AND REPAIRERS
505 Automobile mechanics (6711)506 Automobile mechanic apprentices (pt 6711)507 Bus, truck, and stationary engine mechanics (6712)508 Aircraft engine mechanics (6713)509 Small engine repairers (6714)514 Automobile body and related repairers (6715)515 Aircraft mechanics, Exc. engine (6716)516 Heavy equipment mechanics (6717)517 Farm equipment mechanics (6718)518 Industrial machinery repairers (673)519 Machinery maintenance occupations (674)
ELECTRICAL AND ELECTRONIC EQUIPMENT REPAIRERS
523 Electronic repairers, communications and industrial equipment (6751,6753,6755)525 Data processing equipment repairers (6754)526 Household appliance and power tool repairers (6756)527 Telephone line installers and repairers (6757)529 Telephone installers and repairers (6758)533 Miscellaneous electrical and electronic equipment repairers (6752,6759)534 Heating, air conditioning, and refrigeration mechanics (676)
MISCELLANEOUS MECHANICS AND REPAIRERS
535 Camera, watch, and musical instrument repairers (6771,6772)536 Locksmiths and safe repairers (6773)538 Office machine repairers (6774)539 Mechanical controls and valve repairers (6775)543 Elevator installers and repairers (6776)544 Millwrights (6778)547 Specified mechanics and repairers, N.E.C. (6777,6779)549 Not specified mechanics and repairers
CONSTRUCTION TRADES
SUPERVISORS, CONSTRUCTION OCCUPATIONS
553554555556557558
SupervisorsSupervisors,Supervisors,Supervisors,Supervisors,Supervisors,
brickmasons, stonemasons, and tile setters (6012)carpenters and related workers (6013)electricians and power transmission installers (6014)painters, paperhangers, and plasterers (6015)plumbers, pipefitters, and steamfitters (6016)N.E.C. (6011,6018)
506
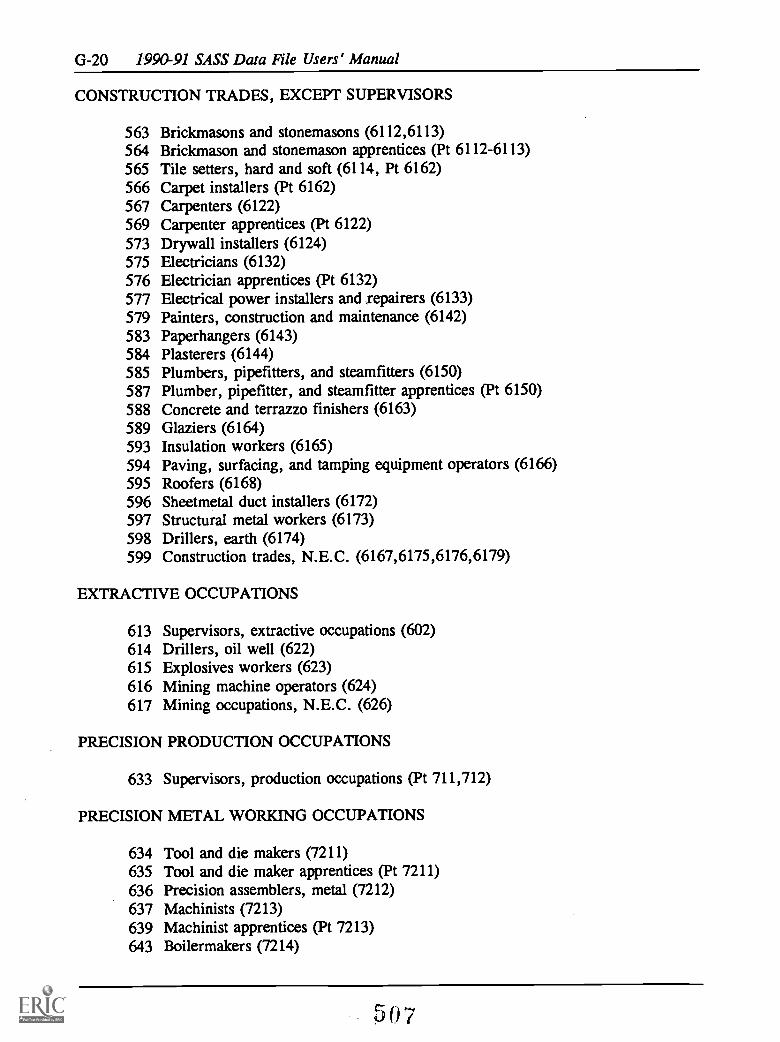
G-20 1990-91 SASS Data File Users' Manual
CONSTRUCTION TRADES, EXCEPT SUPERVISORS
563 Brickmasons and stonemasons (6112,6113)564 Brickmason and stonemason apprentices (Pt 6112-6113)565 Tile setters, hard and soft (6114, Pt 6162)566 Carpet installers (Pt 6162)567 Carpenters (6122)569 Carpenter apprentices (Pt 6122)573 Drywall installers (6124)575 Electricians (6132)576 Electrician apprentices (Pt 6132)577 Electrical power installers and ,repairers (6133)579 Painters, construction and maintenance (6142)583 Paperhangers (6143)584 Plasterers (6144)585 Plumbers, pipefitters, and steamfitters (6150)587 Plumber, pipefitter, and steamfitter apprentices (Pt 6150)588 Concrete and terrazzo finishers (6163)589 Glaziers (6164)593 Insulation workers (6165)594 Paving, surfacing, and tamping equipment operators (6166)595 Roofers (6168)596 Sheetmetal duct installers (6172)597 Structural metal workers (6173)598 Drillers, earth (6174)599 Construction trades, N.E.C. (6167,6175,6176,6179)
EXTRACTIVE OCCUPATIONS
613 Supervisors, extractive occupations (602)614 Drillers, oil well (622)615 Explosives workers (623)616 Mining machine operators (624)617 Mining occupations, N.E.C. (626)
PRECISION PRODUCTION OCCUPATIONS
633 Supervisors, production occupations (Pt 711,712)
PRECISION METAL WORKING OCCUPATIONS
634 Tool and die makers (7211)635 Tool and die maker apprentices (Pt 7211)636 Precision assemblers, metal (7212)637 Machinists (7213)639 Machinist apprentices (Pt 7213)643 Boilermakers (7214)
5 0 7

Appendix G G -2.1
644 Precision grinders, fitters, and tool sharpeners645 Patternmakers and model makers, metal (7217)646 Lay-out workers (7221)647 Precious stones and metals workers (jewelers) (7222,7266)649 Engravers, metal (7223)653 Sheet metal workers (7224)654 Sheet metal worker apprentices (Pt 7224)655 Miscellaneous precision metal workers (7229)
PRECISION WOODWORKING OCCUPATIONS
656 Patternmakers and model makers, wood (7231)657 Cabinet makers and bench carpenters (7232)658 Furniture and wood finishers (Pt 7234, Pt 7756)659 Miscellaneous precision woodworkers (Pt 7234, 7239)
PRECISION TEXTILE, APPAREL, AND FURNISHINGS MACHINE WORKERS
666 Dressmakers (7251, Pt 7752)667 Tailors (7252)668 Upholsterers (7253)669 Shoe repairers (7254)673 Apparel and fabric patternmakers (Pt 7259)674 Miscellaneous precision apparel and fabric workers (Pt 7259, Pt 7752)
PRECISION WORKERS, ASSORTED MATERIALS
675 Hand molders and shapers, except jewelers (7261)676 Patternmakers, lay-out workers, and cutters (7262)677 Optical goods workers (7264, Pt 7677)678 Dental laboratory and medical appliance technicians (7265)679 Bookbinders (Pt 7249, Pt 7449)683 Electrical and electronic equipment assemblers (7267)684 Miscellaneous precision workers, N.E.C. (7269)
PRECISION FOOD PRODUCTION OCCUPATIONS
686 Butchers and meat cutters (7271)687 Bakers (7272)688 Food batchmakers (7273,7279)
PRECISION INSPECTORS, TESTERS, AND RELATED WORKERS
689 Inspectors, testers, and graders (7281)693 Adjusters and calibrators (7282)
508

G-22 1990-91 SASS Data File Users' Manual
PLANT AND SYSTEM OPERATORS
694 Water and sewage treatment plant operators (791)695 Power plant operators (Pt 793)696 Stationary engineers (Pt 793,7668)699 Miscellaneous plant and system operators (792,794,795,796)
OPERATORS, FABRICATORS, AND LABORERS
MACHINE OPERATORS, ASSEMBLERS, AND INSPECTORS
MACHINE OPERATORS AND TENDERS, EXCEPT PRECISION
METALWORKING AND PLASTIC WORKING MACHINE OPERATORS
703 Lathe and turning machine set-up operators (7312)704 Lathe and turning machine operators (7512)705 Milling and planing machine operators (7313,7513)706 Punching and stamping press machine operators (7314,7317,7514,7517)707 Rolling machine operators (7316,7516)708 Drilling and boring machine operators (7318,7518)709 Grinding, abrading, buffing, and polishing machine operators (7322,7324,7522)713 Forging machine operators (7319,7519)714 Numerical control machine operators (7326)715 Miscellaneous metal, plastic, stone, and glass working machine operators
(7329,7529)717 Fabricating machine operators, N.E.C. (7339,7539)
METAL AND PLASTIC PROCESSING MACHINE OPERATORS
719 Molding and casting machine operators (7315,7342,7515,7542)723 Metal plating machine operators (7343,7543)724 Heat treating equipment operators (7344,7544)725 Miscellaneous metal and plastic processing machine operators (7349,7549)
WOODWORKING MACHINE OPERATORS
726 Wood lathe, routing, and planing machine operators (7431,7432,7631,7632)727 Sawing machine operators (7433,7633)728 Shaping and joining machine operators (7435,7635)729 Nailing and tacking machine operators (7636)733 Miscellaneous woodworking machine operators (7434, 7439,7634,7639)
PRINTING MACHINE OPERATORS
734 Printing machine operators (7443,7643)735 Photoengravers and lithographers (7242,7444,7644)
519
Appendix G G-23
736 Typesetters and compositors (7241,7442,7642)737 Miscellaneous printing machine operators (Pt 7249, Pt7449,7649)
TEXTILE, APPAREL, AND FURNISHINGS MACHINE OPERATORS
738 Winding and twisting machine operators (7451,7651)739 Knitting, looping, taping, and weaving machine operators (7452,7652)743 Textile cutting machine operators (7654)744 Textile sewing machine operators (7655, Pt 7656)745 Shoe machine operators (Pt 7656, Pt 7659)747 Pressing machine operators (7657)748 Laundering and dry cleaning machine operators (7255,7658)749 Miscellaneous textile machine operators (7453,7653, Pt 7659)
MACHINE OPERATORS, ASSORTED MATERIALS
753 Cementing and gluing machine operators (7661)754 Packaging and filling machine operators (7462, 7662)755 Extruding and forming machine operators (7463,7663)756 Mixing and blending machine operators (7664)757 Separating, filtering, and clarifying machine operators (7476,7666,7676)758 Compressing and compacting machine operators (7467,7667)759 Painting and paint spraying machine operators (7669)763 Roasting and baking machine operators, food (7472,7672)764 Washing, cleaning, and pickling machine operators (7673)765 Folding machine operators (7474,7674)766 Furnace, kiln, and oven operators, Exc. food (7668,7671,7675)768 Crushing and grinding machine operators (7477, Pt 7677)769 Slicing and cutting machine operators (7478,7678)773 Motion picture projectionists (Pt 7679)774 Photographic process machine operators (Pt 7263, Pt 7679)777 Miscellaneous machine operators N.E.C. (7479, 7665, Pt 7679)779 Machine operators, not specified
FABRICATORS, ASSEMBLERS, AND HAND WORKING OCCUPATIONS
783 Welders and cutters (7332,7532,7714)784 Solderers and brazers (7333,7533,7717)785 Assemblers (772,774)786 Handcutting and trimming occupations (7753)787 Hand molding, casting, and forming occupations (7754,7755)789 Hand painting, coating, and decorating occupations (Pt 7756)793 Hand engraving and printing occupations (7757)794 Hand grinding and polishing occupations (7758)795 Miscellaneous hand working occupations (7759)
5

G-24 1990-91 SASS Data File Users' Manual
PRODUCTION INSPECTORS, TESTERS, SAMPLERS, AND WEIGHERS
796 Production inspectors, checkers, and examiners (782,786,787)797 Production testers (783)798 Production samplers and weighers (784)799 Graders and sorters, except agricultural (785)
TRANSPORTATION AND MATERIAL MOVING OCCUPATIONS
MOTOR VEHICLE OPERATORS
803 Supervisors, motor vehicle operators (6311)804 Truck drivers, heavy (6412,6413)805 Truck drivers, light (6414)806 Driver-sales workers (433)808 Bus drivers (6415)809 Taxi cab drivers and chauffeurs (6416)813 Parking lot attendants (6417)814 Motor transportation occupations N.E.C. (6419)
TRANSPORTATION OCCUPATIONS, EXCEPT MOTOR VEHICLES
RAIL TRANSPORTATION OCCUPATIONS
823 Railroad conductors and yardmasters (6313)824 Locomotive operating occupations (6432)825 Railroad brake, signal, and switch operators (6433)826 Rail vehicle operators, N.E.C. (6439)
WATER TRANSPORTATION OCCUPATIONS
828 Ship captains and mates, except fishing boats (6441,6442)829 Sailors and deckhands (6443)833 Marine engineers (6444)834 Bridge, lock, and lighthouse tenders (6445)
MATERIAL MOVING EQUIPMENT OPERATORS
843 Supervisors, material moving equipment operators (632)844 Operating engineers (6512)845 Longshore equipment operators (6513)848 Hoist and winch operators (6514)849 Crane and tower operators (6515)853 Excavating and loading machine operators (6516)855 Grader, dozer, and scraper operators (6517)856 Industrial truck and tractor equipment operators (6519, Pt659)859 Miscellaneous material moving equipment operators(6519,Pt659)
5.11

Appendix G G-25
HANDLERS, EQUIPMENT CLEANERS, HELPERS, AND LABORERS N.E.C. (PT 711)
863 Supervisors, handlers, equip. cleaners and laborers, N.E.C.(Pt711)864 Helpers, mechanics and repairers (679)
HELPERS, CONSTRUCTION AND EXTRACTIVE OCCUPATIONS
865 Helpers, construction trades (6191-6195,6198)866 Helpers, surveyor (6196)867 Helpers, extractive occupations (629)869 Construction laborers (81)873 Production helpers (769, 779)
FREIGHT, STOCK, AND MATERIAL MOVERS
875 Garbage collectors (822)876 Stevedores (823)877 Stock handlers and baggers (824)878 Machine feeders and offbearers (825)883 Freight, stock, and material movers, hand, N.E.C. (649,826)885 Garage and service station related occupations (672)887 Vehicle washers and equipment cleaners (83)888 Hand packers and packagers (841)889 Laborers, except construction (842,846, Pt 659)
999 Occupation not reported
5.12

United StatesDepartment of Education
Washington, DC 20208-5651
Official BusinessPenalty for Private Use, $300
513

U.S. Department of EducationOffice of Educational Research and Improvement (OERI)
National Library of Education (NLE)Educational Resources Information Center (ERIC)
NOTICE
REPRODUCTION BASIS
ERICTM030365
This document is covered by a signed "Reproduction Release(Blanket) form (on file within the ERIC system), encompassing allor classes of documents from its source organization and, therefore,does not require a "Specific Document" Release form.
This document is Federally-funded, or carries its own permission toreproduce, or is otherwise in the public domain and, therefore, maybe reproduced by ERIC without a signed Reproduction Release form(either "Specific Document" or "Blanket").
EFF-089 (9/97)