reproductions supplied by edrs are the best that can be ... · highlights. this report presents...
TRANSCRIPT

DOCUMENT RESUME
ED 449 694 HE 033 693
AUTHOR Sanderson, Allen R.; Dugoni, Bernard L.; Hoffer, Thomas B.;Myers, Sharon L.
TITLE Doctorate Recipients from United States Universities:Summary Report, 1999.
INSTITUTION National Opinion Research Center, Chicago, IL.SPONS AGENCY National Science Foundation, Arlington, VA.; National
Institutes of Health (DHHS), Bethesda, MD.; Department ofEducation, Washington, DC.; National Endowment for theHumanities (NFAH), Washington, DC.; Department ofAgriculture, Washington, DC.; National Aeronautics and SpaceAdministration, Washington, DC.
PUB DATE 2000-00-00NOTE 163p.; For previous summary reports, see ED 432 211, ED 418
679, ED 404 911, ED 390 360, and ED 390 306.CONTRACT SRS-9712655AVAILABLE FROM Doctorate Data Project, National Opinion Research Center,
1155 East 60th St., Chicago, IL 60637. Tel: 773-753-7500;Fax: 773-753-7886. Email: 4800- sed ©norcmail.uchicago.edu;Web site: http://www.norc.uchicago.edu/studies/.sed/sed1999.htm>.
PUB TYPE Numerical/Quantitative Data (110) Reports Descriptive(141)
EDRS PRICE MF01/PC07 Plus Postage.DESCRIPTORS Demography; *Doctoral Degrees; Higher Education; Relocation;
*Trend AnalysisIDENTIFIERS *Survey of Earned Doctorates; United States
ABSTRACTThis is the thirty-third in a series of reports on research
doctorates awarded by colleges and universities in the United States. Thedata presented in this report are from the annual Survey of EarnedDoctorates, a census of research doctoral recipients who earned their degreesbetween July 1, 1998, and June 30, 1999. This survey, conducted since 1958,is sponsored by six federal agencies: the National Science Foundation, theNational Institutes of Health, the U.S. Department of Education, the NationalEndowment for the Humanities, the U.S. Department of Agriculture, and theNational Aeronautics and Space Administration. All survey responses becomepart of the Doctorate Records File, a virtually complete database on researchdoctorate recipients from 1920 to 1999. The overall response rate for the1999 survey was 91.7 percent. The report begins by reviewing overall trendsin research doctorates awarded by U.S. universities and continues bydiscussing trends in the seven broad fields in which research doctoraterecipients earn their degrees. Trends in doctorate awards by sex,race/ethnicity, citizenship, parental education, and time to degree aredescribed next, and the report concludes with discussion of the sources offinancial support during graduate school and the postgraduation status andplans of doctorate recipients. A special section is devoted to the interstatemigration of U.S. doctorate recipients from birth to initial postgraduationlocation. The report includes numerous figures and tables. Appendices includeadditional statistics, technical notes, and the survey instrument. (EV)
Reproductions supplied by EDRS are the best that can be madefrom the original document.

NATIONAL ENDOWMENT FOR THE
Doctorate Recipients from
United States Universities:
Summary Report 1999
U.S. DEPARTMENT OF EDUCATIONOffice of Educational Research and Improvement
EDUCATIONAL RESOURCES INFORMATIONCENTER (ERIC)
This document has been reproduced asreceived from the person or organizationoriginating it.
Minor changes have been made toimprove reproduction quality.
Points of view or opinions stated in thisdocument do not necessarily representofficial OERI position or policy.
Survey of Earned Doctorates
SPONSORED BY THE NATIONAL SCIENCE FOUNDATION, THE NATIONAL INSTITUTES OF
HEALTH, THE U.S. DEPARTMENT OF EDUCATION, THE NATIONAL ENDOWMENT FOR THE
HUMANITIES, THE U.S. DEPARTMENT OF AGRICULTURE, AND THE NATIONAL AERONAU
TICS AND SPACE ADMINISTRATION
EST C:PY c!

HIGHLIGHTS
This report presents data on recipients of research doctorates awarded by U.S. universities from July 1, 1998,through June 30, 1999. This information is taken from the 1999 Survey of Earned Doctorates (SED), an annualcensus of new doctorate recipients.
The 392 universities in the United States that conferred research doctorates awarded 41,140doctorates during the 1998-1999 academic year (the eligibility period for the 1999 SED). Thiscompares to 42,683 doctorates awarded in 1998 (a decline of 3.6 percent in one year), and marks thefirst annual decline in fourteen years.
The number of doctorates awarded by broad field in 1999 was greatest in life sciences, whichconferred 8,126 Ph.D.s. The numbers for 1999 conferred in the other broad areas were 7,036 in socialsciences; 6,324 in the physical sciences and mathematics (combined); 6,557 in education; 5,468 in thehumanities; 5,337 in engineering; and 2,292 in business and other professional fields. The declinesfrom 1998 were 5 percent in life sciences, 6 percent in physical sciences and mathematics,.and 10percent in engineering. The numbers of doctorate recipients in the other broad fields were virtually thesame in the 1997-98 and 1998-99 academic years.
Women received 17,493 doctorates, or 42.5 percent of all doctorates granted in 1999. This is thehighest percentage ever for women, continuing a 30-year upward trend. Women earned 44.7 percentof the doctorates granted in life sciences, 54.5 percent in social sciences, 48.9 percent in humanities,64.2 percent in education, and 41.0 percent in business/other professional fields. In the physicalsciences and engineering, they constituted 23.4 percent and 14.9 percent, respectively.
Nearly 16 percent of all doctorates awarded to U.S. citizens in 1999 were earned by U.S. racial/ethnicminority groups. This is the largest percentage ever, and continues a steady upward trend. Among the27,177 doctorates earned in 1999 by U.S. citizens who identified their race/ethnicity (98.4 percent of allU.S. citizen doctorates), 1,596 dOctorates were earned by blacks, 1,109 were earned by Hispanics,1,324 were earned by Asians, and 219 were earned by American Indians. The broad fields with thelargest percentages of minorities were education, in which blacks were the predominant minoritygroup, and engineering, in which Asians were predominant.
U.S. citizens received 70.8 percent of all doctorates earned in 1999 by individuals who identified theircitizenship status (94.8 percent of all doctorate recipients identified their citizenship). The People'sRepublic of China was the country of origin for the largest number of non-U.S. doctorates in 1999, with2,400, followed by India with 1,077, Korea with 1,017, Taiwan with 981, and Canada with 473. Thepercentage of doctorates earned by U.S. citizens ranged from lows of 48.8 percent in engineering and57.2 percent in the physical sciences, to highs of 88.6 percent in education and 81.8 percent in thehumanities.
Median time to degree since receipt of the baccalaureate was 10.4 years in 1999, virtually unchangedfrom 1998 and 1997 (10.4 and 10.5 years, respectively). Median time to degree since first enrollmentin any graduate program was 7.3 years in 1999, also unchanged from 1998 and 1997 (7.3 years inboth).
Most of the 1999 doctorate recipients (60.9 percent) received the majority of their financial support forgraduate education from such program- or institution-based sources as university fellowships orteaching and research assistantships. Half (49.9 percent) of the 1999 doctorate recipients reported noeducational indebtedness at completion of the Ph.D.; 13.3 percent reported cumulative education debtlevels of $30,000 or more.
About 70 percent of the new Ph.D.s had definite postgraduation commitments for employment orcontinued study when they completed the SED survey. Of those, 69.8 percent will work and 30.2percent will continue their studies as postdoctorates. For U.S. citizens, 51.7 percent of those with firmemployMent commitments noted higher education as their intended work sector. About one-fifth (21.9percent) indicated industry or self-employment; 8.7 percent said some level of government; theremaining 17.6 percent indicated "other."
3

Doctorate Recipients fromUnited States Universities:Summary Report 1999
The Survey of Earned Doctorates is funded byand conducted under the direction of the followingagencies of the U.S. government:
National Science FoundationNational Institutes of HealthU.S. Department of EducationNational Endowment for the HumanitiesU.S. Department of AgricultureNational Aeronautics and Space Administration
Allen R. SandersonBernard L. DugoniThomas B. HofferSharon L. Myers
National Opinion Research Center
NATIONAL ENDOWMENT FOR THE
HUMANITIESUSD A
National Opinion Research Center at the University of ChicagoChicago, Illinois2000
NOTICE
This report is based on data collected in the Survey of Earned Doctorates (SED) conducted for the National ScienceFoundation (NSF), the National Institutes of Health (NIH), the U.S. Department of Education (USED), the NationalEndowment for the Humanities (NEH), the U.S. Department of Agriculture (USDA), and the National Aeronautics andSpace Administration (NASA), by the National Opinion Research Center (NORC) under NSF Contract No. SRS-97I2655.Findings in this publication represent analyses developed by NORC, which have been reviewed, but not necessarilyverified, by the participating Federal agencies and do not necessarily reflect the views of the sponsoring agencies.
NSF publications from the Survey of Earned Doctorates and the Doctorate Records File are available free on request (seeinside back cover). Standardized tables on baccalaureate origins of Ph.D.s by major field of doctorate and trend tables oncitizenship, race/ethnicity, and sex of Ph.D.s by fine field of doctorate are available for a fee. Customized tables can alsobe prepared at cost. For more information, please contact:
Doctorate Data ProjectNational Opinion Research Center1155 East 60th StreetChicago, IL 60637
Phone: (773) 753-7500Fax: (773) 753-7886E-mail: [email protected]
Material in this publication is in the public domain and, with appropriate credit, may be reproduced without pemlission.Recommended citation:
Sanderson, A., B. Dugoni, T. Hoffer, and S. Myers. 2000. Doctorate Recipients from United States Universities:Summary Report 1999. Chicago: National Opinion Research Center. (The report gives the results of data collected in theSurvey of Earned Doctorates, conducted for six Federal agencies, NSF, NIH, USED, NEH, USDA, and NASA by NORC.)
This report is available on the NORC web-site: http://www.norc.uchicago.edu/studies/sed/sed1999.htm. Reports onscience and engineering doctorates can be found on the National Science Foundation's web-site:http://www.nslgov/sbe/srs/sengdr/start.htin.
ACKNOWLEDGMENTS
Academic officers at the nation's doctorate-granting universities distribute, collect, and forward SEDquestionnaires to NORC. The project gratefully acknowledges the support and assistance of graduate deans and their staff,registrars, dissertation secretaries, and other administrators who participate in the SED effort and contribute to its success.The sponsoring Federal agencies and NORC also extend their heartfelt thanks to the more than 40,000 new researchdoctorate recipients who took the time to complete and return their copy of the survey.
The conduct of the SED, the maintenance of the resulting data file, and.the publication of this report are fundedjointly by the National Science Foundation (NSF), the National Institutes of Health (NIH), the U.S. Department ofEducation (USED), the National Endowment for the Humanities (NEH), the U.S. Department of Agriculture (USDA), andthe National Aeronautics and Space Administration (NASA). Susan Hill (NSF) serves as the project officer for the sixparticipating agencies. The survey's relevance to national policy issues has increased, thanks to the involvement andconstructive reviews of the design and analysis of the survey by representatives from the six agencies: Paul Seder (NIH),Nancy Borkow (USED), Frank Shaw (NEH), K. Jane Coulter (USDA), Malcom Phelps (NASA), and Mary Golladay(NSF). Susan Hill (NSF), Director of the Doctorate Data project, provided guidance and direction during the preparationof this report. Comments from reviewers Peter Syverson of the Council of Graduate Schools and George E. Walker ofIndiana University were invaluable and greatly appreciated.
The authors gratefully acknowledge the contributions of their NORC colleagues who provided valuable counsel,direction, and assistance with various survey responsibilities: Pearl Zinner, Special Assistant to the President of NORC;Lance Selfa, Research Analyst; Syed Ahsan and Sharnia Bullock, Coordinators for the Data Preparation Center: RebeccaHanson, Data Quality Analyst; Lori Harmon, Survey Specialist; Parvati Krishnamurty, Survey Economist; WhitneyMoore, Survey Methodologist; Scott Sederstrom and William B. Witherspoon, Research Assistants; Jamie Friedman,Director of Institutional Contacting; Isabel Guzman-Barron and Donna Jameison, Administrative Assistants; CrystalWilliams, Data Preparation Supervisor, and the Production Center Staff; Lisa Lee, Survey Methodologist; and members ofthe Communications Department, Imelda Perez, Marcus Shumpert, and Ellen Hathaway.
Printed in the United States of America
BEST COPY AVAILABLE
5

CONTENTS
Page
HIGHLIGHTS inside front cover
LIST OF FIGURES iv
LIST OF TABLES iv
IMPORTANT NOTICE vii
INTRODUCTION 1
Organization 1
TRENDS IN DOCTORATE RECIPIENTS 3
Overall Trends and Rates of Change 3
Doctorate-granting Institutions, Doctorates Recipients per Institution, and Geographical Distribution 5
Doctorates by Broad Field 7
Doctorates by Sex 10
Doctorates by Race/Ethnicity 12
Doctorates by Citizenship 16
Doctorates by Parental Education Background 17
Time to Degree 19
FINANCIAL RESOURCES IN SUPPORT OF DOCTORATE RECIPIENTS, INCLUDING INDEBTEDNESS 23
POSTGRADUATE PLANS, EMPLOYMENT, AND LOCATION 27
Definite versus Indefinite Plans 27
Career Employment versus Postdoctorates 28
Postdoctoral Location of Non-U.S. Citizens 28
Employment Sectors in the United States 29
SPECIAL SECTION: INTERSTATE MIGRATION PATTERNS OF DOCTORATE RECIPIENTS 30
Introduction and Overview 30
The Data Set 31
From Birth to College 31
From College to Doctoral Study and Employment 32
Migration and Sex 32
Migration and Race/Ethnicity 32
Migration and Marital Status 33
Migration and Family Background 33
Migration and Employment 34
Migration and Academic Fields of Study 34
Summary and Conclusions 35
DATA TABLES 37
APPENDICES 67
A The Seven Basic Tables, 1999 69
B Trend Tables, 1989-1999 98
C Technical Notes 107
D Survey of Earned Doctorates Questionnaire, Academic Year 1999 117
E Field Classification and Research Degree Titles 131
NSF PUBLICATIONS FROM THE DOCTORATE DATA PROJECT inside back cover
iii

LIST OF FIGURESPage
Figure 1 Doctorates awarded by U.S. colleges and universities, 1957-1999 4
Figure 2 Annual growth or decline in doctorates awarded by U.S. collegesand universities, 1957-1999 4
Figure 3 Top 20 doctorate granting states, 1999 6
Figure 4 Science and engineering doctorates awarded by broad field, 1969-1999 8
Figure 5 Humanities, education, and professional/other fields doctorates awardedby broad field, 1969-1999 9
Figure 6 Distribution of doctorate recipients by broad field, 1969 and 1999 compared 9
Figure 7 Doctorate recipients by sex, 1989-1999 10
Figure 8 Percent of female doctorate recipients by broad field, 1969, 1979, 1989, 1999 11
Figure 9 Doctorates awarded to minority U.S. citizens, by race/ethnicity, 1979-1999 14
Figure 10 Percentage of doctorates earned by minority U.S. citizens, 1979 and 1999 15
Figure 11 Percentage of doctorates earned by minority U.S. citizens, by sex, 1999 15
Figure 12 Percentage of doctorates earned by minority U.S. citizens, by broad field, 1999 16
Figure 13 Median number of years to doctorate from baccalaureate award and age atdoctorate, 1974-1999 20
Figure 14 Age distribution at doctorate by broad field of study, 1999 22
Figure 15 Primary sources of financial support for doctorate recipients, 1999 25
LIST OF TABLESPage
Table 1 Number of doctorates awarded and annual percentage change in doctorates awarded byU.S. colleges and universities, 1957-1999 39
Table 2 Number of doctorates awarded by U.S. colleges and universities and average doctorate perrecipients institution, 1961-1999 39
Table 3 Top 20 doctorate-granting institutions by broad field of doctorate, 1999 40.
Table 4 Number of doctorate recipients by state, including the District of Columbia and Puerto Rico,1999 42
Table 5 Major field of doctorate recipients for selected years, 1969-1999 43
Table 6 Doctorate recipients and percent earned by females, by selected subfield, 1989 and 1999 44
Table 7 Number and percent of doctorate recipients, by sex within broad field for selectedyears, 1959-1999 45
iv

LIST OF TABLES (Continued)Page
Table 8 Number of U.S. citizen doctorate recipients by race/ethnicity within broad field for selectedyears, 1979-1999 46
Table 9 Major field of U.S. citizen doctorate recipients, by race/ethnicity, 1999 47
Table 10 Leading doctorate-granting institutions of U.S.-minority doctorate recipients, 1995-1999 48
Table 11 Citizenship status of doctorate recipients by broad field for selected years, 1969-1999 49
Table 12 Top 30 countries of origin of non-U.S. citizens earning doctorates atU.S. colleges and universities, 1999 (ranked by number of earned doctorates) 50
Table 13 Leading doctorate-granting institutions of non-U.S. citizen doctorate recipients, 1999(ranked by number of earned doctorates) 51
Table 14 Leading doctorate-granting institutions of non-U.S. citizen doctorate recipients, 1999(ranked by percentage of earned doctorates) 51
Table 15 Parental educational attainment of 1999 doctorate recipients 52
Table 16 Median number of years from baccalaureate to doctorate award by broad fieldfor selected years, 1974-1999 53
Table 17 Median number of years from baccalaureate to doctorate award by demographicgroup and broad field, 1999 54
Table 18 Distribution of 1999 doctorate recipients by age at doctorate 55
Table 19 Primary sources of financial support for doctorate recipients by broad fieldand demographic group, 1999 56
Table 20 Cumulative debt related to education of doctorate recipients, by broad field, 1999 57
Table 21 Cumulative debt related to education of doctorate recipients, by demographic group, 1999 57
Table 22 Postgraduation status of doctorate recipients by broad field for selected years,1979-1999 58
Table 23 Postgraduation status of doctorate recipients by demographic group for selected years,1979-1999 59
Table 24 Postgraduation commitments of doctorate recipients by type of plans and broad fieldfor selected years, 1979-1999 60
Table 25 Postgraduation commitments of doctorate recipients by type of plans and demographic groupfor selected years, 1979-1999 61
Table 26 Postdoctoral location of non-U.S. citizen doctorate recipients with postgraduationcommitments by major field and visa status, 1999 62
Table 27 Postdoctoral location of non-U.S. citizen doctorate recipients with postgraduationcommitments by visa status for selected years, 1979-1999 63
Table 28 Employment sector of doctorate recipients with postgraduation commitments inthe United States by demographic group for selected years, 1979-1999 64

TABLES FOR SPECIAL SECTION: Interstate Migration Patterns of Doctorate Recipients
Table 2-1 Percentages of U.S. citizen doctorate recipients in 1999 who remained in the same state inwhich they were born, by demographic background and employment sector 65
Table 2-2 Percentages of U.S. citizen doctorate recipients who migrated interstate at differenttransition points, by demographic background and employment sector 65
Table 2-3 Percentages of U.S. citizen doctorate recipients in 1999 who remained in thesame state at various time points prior to employment, by demographic backgroundand employment sector 66
Table 2-4 Percentages of U.S. citizen doctorate recipients in 1999 who migrated interstate atdifferent transition points, by field of study 66
APPENDIX TABLES
Table A-1 Number of doctorate recipients, by sex and subfield, 1999 74
Table A-2 Number of doctorate recipients, by citizenship, race/ethnicity, and subfield, 1999 76
Table A-3 Statistical profile of doctorate recipients, by major field, 1999 80
Table A-4 Statistical profile of doctorate recipients, by race/ethnicity and citizenship, 1999 86
Table A-5 Doctorate recipients' financial resources in support of doctoral programs, by broad fieldand sex, 1999 88
Table A-6 State of doctoral institution of doctorate recipients, by broad field and sex, 1999 89
Table A-7 Institutions granting research doctorates, by major field, 1999 90
Table B-1 Number of doctorate recipients, by subfield, 1989-1999 100
Table B-2 Number of doctorate recipients, by sex, race/ethnicity, and citizenship, 1979, 1984,and 1989-1999 104
vi
9

' IMPORTANT NOTICE ***
The estimates reported for the Survey of Earned Doctorates (SED) are simpletabulations of all available information, with no adjustment for nonresponse. Therefore,differences in response rates from year to year can produce numerical fluctuations that maynot be related to real trends.
Although response to the SED has been as high as 95 to 98 percent over time, itdeclined to 92 percent during the 1980s. In an effort to improve the response rate, the surveymethodology was modified in the years after 1989. Response rose, stabilizing around95 percent from 1991 to 1995. However, the response rates were 92.8 percent for 1996 and91.5 percent for both 1997 and 1998. This year, the response rate rose slightly to 91.7percent. (Note: These percentages represent self-report rates, that is, the proportion ofquestionnaires completed by research doctorate recipients. While survey forms containingpartial information filled in by either the doctoral institution or the survey contractor are notincluded in these rates, tables in this report incorporate the available data from these sources.)The self-report rate for 1999 may increase slightly in the next year if additionalquestionnaires are received from research doctorate recipients. See appendix C for atable giving survey response rates from 1967 to 1999.
Item response rates have shown a pattern of improvement since 1990a naturalconsequence of the increase in the overall self-report rate, as well as a result of formatrevisions to the questionnaire and follow-ups for missing information. In 1990, newfollow-up procedures were implemented to increase coverage of several variables: birth year,sex, race/ethnicity, citizenship status, country of citizenship, baccalaureate year andinstitution, and postgraduation plans. Response rates for these variables have sinceimprovedespecially for citizenship and race/ethnicity, resulting in an increase in thereported numbers of minority Ph.D.s. Whether or not individuals completed the surveyquestionnaire, the following four data items are available for most all recipients: sex, Ph.D.institution, field, and year.
The data for a given year are updated the following year with any responses receivedafter survey closure. Postsurvey adjustment was most significant for 1990 and 1991 Ph.D.s,with the largest impact on the number of blacks. For both of these years, the total number ofblack Ph.D.s increased by about 7.5 percent in the year after survey closure. The survey cyclewas then extended to allow receipt of more follow-up information before closure, resulting inmuch smaller postsurvey adjustments for the 1992 through 1995 data (a 1.4 percent increasein black Ph.D.s for 1992, a 0.2 percent increase for 1993, a 0.5 percent increase for 1994, anda 1.5 percent increase for 1995).
Adjustments to data are presented in reports subsequent to the initial report for asurvey. For example, updates for 1994 appeared in Summary Report 1995. Updates to 1999data will be presented in next year's report.

DOCTORATE RECIPIENTS FROM UNITED STATESUNIVERSITIES: SUMMARY REPORT 1999
Introduction
Doctorate Recipients from United States Universities: Summary Report 1999 is the
thirty-third in a series of reports on research doctorates awarded by colleges and universities in
the United States.' The data presented in this report are from the annual Survey of Earned
Doctorates (SED), a census of research doctoral recipients who earned their degrees between
July 1, 1998, and June 30, 1999. This survey, conducted since 1958, is sponsored by six Federal
agencies: the National Science Foundation, the National Institutes of Health, the U.S.
Department of Education, the National Endowment for the Humanities, the U.S. Department of
Agriculture, and the National Aeronautics and Space Administration. All survey responses
become part of the Doctorate Records File (DRF), a virtually complete database on research
doctorate recipients from 1920 to 1999. The overall response rate for the 1999 survey was 91.7
percent.2
Organization
Summary Report 1999 begins by reviewing overall trends in research doctorates awarded
by U.S. universities and continues by discussing trends in the seven broad fields in which
research doctorate recipients earn their degrees. Trends in doctorate awards by sex,
race/ethnicity, citizenship, parental education, and time to degree are described next, and the
report concludes with discussion of the sources of financial support during graduate school, and
the postgraduation status and plans of doctorate recipients.
A special section, which follows the discussions of trends, financial support and
indebtedness, and postgraduate plans of recipients in the main report, is devoted to the interstate
migration of U.S. doctorate recipients from birth to initial postgraduation location. This section
The Survey of Earned Doctorates collects information on research doctorates only. This survey differsfrom the U.S. Department of Education's collection of the number of doctorate degrees awarded perinstitution for all fields. For an evaluation of the differences, see National Science Foundation, 1993,Science and Engineering Doctorates 1960-1991, NSF 93-301, Detailed Statistical Tables, pp. 2-6,Washington, DC.2 See appendix C for information on response rates for the SED.
1

presents analyses of geographic mobility with regard to sex, marital status, race /ethnicity, family
background, field of study, and postgraduate employment.
Figures displaying selected trend data accompany the brief narratives of key survey
findings. The numbers and percentages from which the figures are drawn are contained in a set
of tables following the main text. A reference at the bottom of each figure indicates the
corresponding table number. Basic tables of statistics for 1999 research doctorate recipients are
shown in appendix A, and trend tabulations for the previous ten-year period (1989 to 1999) are
presented in appendix B. Appendix C provides technical notes, including response rates, and
other information related to tables and figures in the report. Appendix D is the SED
questionnaire for the 1999 academic year. Appendix E lists field of study classifications and
research degree titles employed in the SED.

Trends In Doctorate Recipients
Overall Trends and Rates of Change
After thirteen consecutive years of annual increases in the number of research doctorates
received, a 3.6 percent decrease from the previous year occurred in the 1999 academic year. For
the twelve-month period ending June 30, 1999, U.S. universities awarded 41,140 research
doctorate degrees,3 compared with 42,683 for the previous year (see table 1). Only between
1976 and 1977 has there been an annual percentage drop 3.7 percent larger than this one. For
the last 40 years, the increase in the number of doctorates awarded by U.S. universities has
averaged 3.8 percent per year.
Between 1961 - when the number of annual doctorates awarded exceeded 10,000 for the
first time and 1967, the annual growth rate was almost 12 percent, and the number of doctorates
awarded virtually doubled (20,403). Four years later, in 1971, the annual total topped 30,000
(31,867) for the first time. The decades of the 1970s and 1980s saw periods of more modest
increases, and in 7 of those 20 years annual totals even declined. The total figure did not exceed
40,000 until 1994 (41,034), 23 years after it had reached the 30,000 plateau; not until 1989 did
the annual total 34,327 exceed the previous high-water mark of 33,755 set in 1973. Over the
past few years, the annual rates of increase have become smaller than they were in the first half
of the decade of the 1990s, including gains of only 0.3 percent per year for both 1997 and 1998;
thus the 1999 total number of doctorates is approximately the same as it was five years ago
(41,140 versus 41,034). (See figures 1 and 2.)
Overall in 1999, 57 percent of the doctorate recipients were male, about two-thirds were
U.S. citizens, approximately 64 percent were white, and about 6 in 10 recipients were currently
married or living in a marriage-like relationship. The typical recipient was slightly under 34
years of age at the time the degree was awarded. (Detailed statistics are provided in the tables
and discussed later in this report.)
3 Doctorates are reported by academic year (from July 1 of one year through June 30 of the followingyear) and include research and applied research doctorates in all fields. Doctoral degrees such as thePh.D., D.Sc., and Ed.D. are covered by this survey; professional degrees (e.g., M.D., D.D.S., J.D., Psy.D.)are not. A full list of included degrees can be found in appendix E. For convenience throughout thisreport, the terms "Ph.D." or "doctorate" are used to represent any of the research doctoral degrees coveredby the survey. Please note that if an individual earned a second research doctorate, the second doctorateis not included in the SED.
3
13

45,000
40,000
35.000
30,000
25,000
20,000
15,000
10,000
5,000
Figure 1: Doctorates awarded by U.S. colleges and universities, 1957-1999
r-1957 1963 1969 1975 1981
Year
See Table 1.
SOURCE: NSF/NIH/USED/NEH/USDA/NASA, Survey of Earned Doctorates
1987 1993 1999
Figure 2: Annual growth or decline in doctorates awarded by U.S. colleges and universities,1957-1999
20
15'
10
5
0
.Annual percentage changeIaLong-term average (3.8%)
1957 1960 1963 1966 1969 1972
-5
Year
1981 1984 1987 1990 1993 1996 999
See Table 1.SOURCE: NSF/NIH/USED/NEH/USDA/NASA, Survey of Earned Doctorates

Doctorate-granting Institutions, Doctorate Recipients per Institution,and Geographical Distribution
During the 1999 academic year, 392 universities in the United States and Puerto Rico
awarded at least one research doctorate. This number has remained relatively level for the past
few years, following a steady increase from the early 1960s (174 in 1961) until 1996 (392).
The mean number of doctorates awarded per institution in 1999 was 105; the median was
43. (See table 2 for the mean number of doctorates awarded per institution from 1961 to 1999.)
As the substantial difference between the mean and the median suggests, a relatively small
number of institutions grant a disproportionately large number of doctorates. Just 47 institutions
granted 50 percent of all doctoral degrees in 1999. Eighteen institutions accounted for 25
percent of all doctorate degrees granted; the second quartile contained 29 institutions, the third
quartile included 55 universities; and the remaining 290 institutions together accounted for the
final 25 percent of doctorates.4
The University of Texas-Austin granted the largest number of doctorates, 752, or 1.8
percent of all doctorates awarded, followed by the University of California-Berkeley (717) and
the University of Wisconsin-Madison (685). These three institutions granted the most doctorates
in 1998 and 1997 as well, although Berkeley and Wisconsin changed positions within the top
three. For 1999, 10 institutions granted 15.6 percent of all doctorates; the corresponding figure
for 1998 was 16.2 percent.
With respect to broad field, the University of California-Berkeley awarded the most
doctorates (172) in the physical sciences. The Massachusetts Institute of Technology (MIT)
granted the most engineering doctorates (194), while the University of Wisconsin-Madison led
all universities in the life sciences (178) and the University of Texas-Austin topped the list for
social science doctorates (113). Harvard granted the largest number of doctorates in the
humanities (146); Nova Southeastern University had the highest total in education (428), and
Texas-Austin granted the most doctorates in the heterogeneous "professional/other" category
(51). See table 3 for the top 20 ranked institutions for each of the seven broad fields.
The numbers of doctorates awarded by broad field are also concentrated in a relatively
small number of institutions. While the top 10 degree-granting universities awarded 15.6 percent
of all doctorates in 1999, the concentration was higher in six of the seven broad fields: 19.5
4 Calculations derived from appendix table A-7.
BET COPY AVALABLE
15

percent in the physical sciences, 28.1 percent in engineering, 18.7 percent in the life sciences,
22.9 percent in the humanities, 21.7 percent in education, and 17.0 percent in the
professional/other category. Only in the social sciences was the concentration lower than the
overall average (14.8 percent). See table 3.
As shown in figure 3 and table 4, California universities led the nation by awarding 4,724
doctorates, or 11.5 percent of all doctorates in 1999. New York institutions granted the next
highest number of doctorates (3,511), followed by institutions in Texas (2,697), Illinois (2,20I ),
Massachusetts (2,132), Pennsylvania (2,115), Florida (1,944), and Ohio (1,638). These eight
states accounted for more than half 51.0 percent of all doctorates awarded in 1999.
5000
4500
4000
3500
3000
2500
2000
1500
1000
500
Figure 3. Top 20 doctorate granting states in 1999
CA NY TX IL MA PA FL OH MI NC IN VA MO GA WI NJ MN AZ
State
See Table 4.SOURCE: NSF/NIH/USED/NEH/USDA/NASA, Survey of Earned Doctorates

Doctorates by Broad Field
The Survey of Earned Doctorates (SED) classifies research doctorate degrees into
approximately 290 fields of specialization (these are listed on pages 8 and 9 of the questionnaire
included in appendix D). For presentation purposes here, these are grouped into seven broad
fields: physical sciences,5 engineering, life sciences,6 social sciences (including psychology),
humanities, education, and a heterogeneous group of professional and other fields (including
business, communications, social work and theological programs). Information about the levels
and trends in these broad fields is of particular interest to Federal sponsors of doctoral research,
academic administrators, and professional associations, among others. These groups rely on
these data to make informed decisions that influence graduate education and the nation's labor
force.
The overall decrease of 3.6 percent in doctorates awarded between the 1998 and 1999
academic years occurred across the board: all seven broad field categories experienced declines
in the absolute number of degrees, with engineering and the physical sciences registering the
largest percentage drops, 9.8 percent and 6.2 percent, respectively. The social sciences,
humanities, and education showed the smallest decreases. The life sciences, with 8,126
doctorates, remained the largest single broad field, as it has since 1988.
Compared with five years ago (1994), when the total number of doctorates awarded was
approximately the same as it was in 1999, engineering and the physical sciences showed large
decreases: 8.3 percent and 7.3 percent lower in 1999 than in 1994, respectively.' Humanities
registered the largest percentage increase from 1994 to 1999, with 15.3 percent more degrees
awarded in 1999 than five years earlier. The life sciences (+5.0 percent) and social sciences
(+6.4 percent) were also higher in 1999; education was 2.2 percent lower. (See table 5.)
The four broad fields that together constitute "science and engineering" (S&E)
physical, life, and social sciences plus engineeringrepresented 65.2 percent of all doctorates
awarded in 1999. Ten years ago (1989) they accounted for approximately the same percentage
of all doctorates (65.0 percent), but compared with 25 years ago (1974), the S&E fields represent
5 The physical sciences include mathematics and computer sciences, as well as the traditional physicalscience disciplines.6 The life sciences encompass biological, agricultural, and medical sciences.7 The smaller, heterogeneous "professional/other" category registered the largest percentage decreasebetween 1994 and 1999, 11.4 percent.
71r°'

a larger percentage of total degrees in 1999 than in 1974 (57.4 percent). (See table 5.) However,
these combined S&E fields showed a 5.1 percent decrease between 1998 and 1999 and a 0.6
percent smaller total in 1999 than in 1994.
Of the 26 subfields included in table 5, 19 experienced declines in number of doctorates
awarded between 1998 and 1999. Within the S&E category, only two subfields -- both in the
social sciences -- had gains; the other 13 S&E subfields showed declines between these two
academic years. Comparing 1994 with 1999, 12 of the 26 subfields had larger absolute numbers
of doctorates in 1999, and 14 had smaller numbers; within S&E fields in these same two years, 6
subfields had larger totals in 1999 than in 1994, and 9 had smaller ones. For both the one-year
and five-year comparisons within S&E, the physics and astronomy subfields displayed the
largest declines and anthropology the biggest gains.
Comparing a slightly different set of subfields see table 6 over a 10-year interval
between 1989 and 1999, the three disciplines with the largest percentage increases were
neuroscience (141.4 percent), cell biology (114.3 percent), and history (87.9 percent). Only one
subfield agricultural sciences showed a decline over this period (-10.9 percent).
0
000
E
Figure 4: Science and engineering doctorates awarded by broad field, 1969-1999
9000
8000
7000
6000
5000
4000
3000
2000
1000
0
1969
4Physical Sci /Math
0EngineeringSciences
0Social Sciences
1974 1979 1984 1989 1994 1999
Year
See Table 5.SOURCE: NSF/NIH/USED/NEH/USDA/NASA, Survey of Earned Doctorates
8 18

Figure 5: Humanities, education, and professional/other doctoratesawarded by broad field, 1969-1999
--------
2000 II
H urn an dies
CIEducation
Prof. /Other Fields
Year
See Table 5.SOURCE: NSF/NIH/USED/NEH/USDA/NASA, Survey of Earned Doctorates
25.00%
20.00%
15.00%
10.00%
5.00%
0.00%Physical Engineering Life SciencesSci/M ath
Figure 6: Distribution of doctorate recipients by broad field: 1969 and 1999 compared
19.4% 19 8%
18.1%17.1%
16 3%33. 15 9%
15 4% 15 5%'?, 14.7%
fv. 1 ,, °'
. 13.3%12.7% 13.0%
_
5 6%
3.3%
SocialSciences
Humanities Education
See Table 5.SOURCE: NSF/NIH/USED/NEH/USDA/NASA, Survey of Earned Doctorates
Prof/OtherFields
101969101999 1
Doctorates by Sex
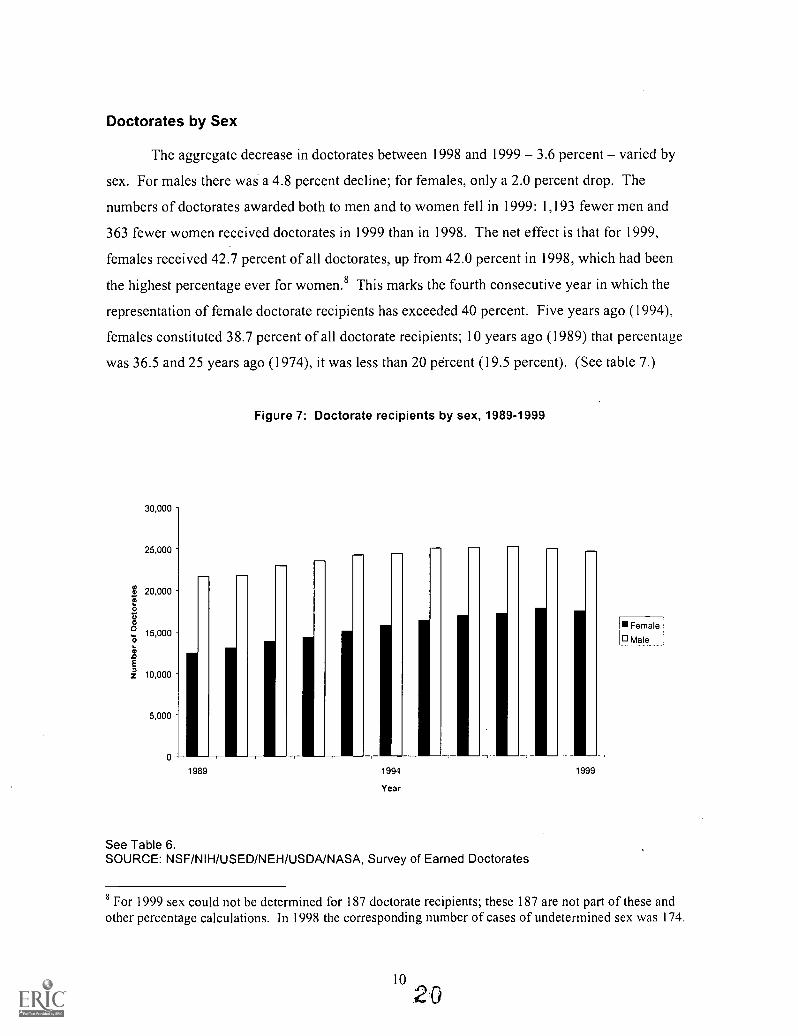
The aggregate decrease in doctorates between 1998 and 1999 3.6 percent varied by
sex. For males there was a 4.8 percent decline; for females, only a 2.0 percent drop. The
numbers of doctorates awarded both to men and to women fell in 1999: 1,193 fewer men and
363 fewer women received doctorates in 1999 than in 1998. The net effect is that for 1999,
females received 42.7 percent of all doctorates, up from 42.0 percent in 1998, which had been
the highest percentage ever for women.8 This marks the fourth consecutive year in which the
representation of female doctorate recipients has exceeded 40 percent. Five years ago (1994),
females constituted 38.7 percent of all doctorate recipients; 10 years ago (1989) that percentage
was 36.5 and 25 years ago (1974), it was less than 20 percent (19.5 percent). (See table 7.)
1989
Figure 7: Doctorate recipients by sex, 1989-1999
ffi1994 1999
Year
See Table 6.SOURCE: NSF/NIH/USED/NEH/USDA/NASA, Survey of Earned Doctorates
Female
[0 Male
8 For 1999 sex could not be determined for 187 doctorate recipients; these 187 are not part of these andother percentage calculations. In 1998 the corresponding number of cases of undetermined sex was 174.

With respect to the distribution by sex of doctorates across broad fields of study, for 1999
women constituted 64.2 percent of all education doctorates, the majority in the social sciences
(54.5 percent), and almost half in the humanities (48.9 percent). By contrast, the representation
of females among doctorate recipients in the physical sciences and engineering for 1999 was
only 23.4 percent and 14.9 percent, respectively (figure 8). However, even these still-low
percentages have shown remarkable change over time: 25 years ago, when females were only
19.5 percent of all doctorate recipients, they constituted 7.7 percent and 1.0 percent in the
physical sciences and engineering, respectively. Similar long-term trends are discernible in other
broad fields as well: in the life sciences from 18.3 percent in 1974 to 44.7 percent in 1999; 23.5
percent to 54.5 percent in the social sciences over that same period; and from 30.5 percent in the
humanities in 1974 to the current 48.9 percent. (See table 7.)
In all seven of the broad fields, the number of doctorates awarded to men was lower in
1999 than in 1998. Females experienced declines in five of the seven broad fields; only in
engineering and education were the numbers of doctorates granted to women in 1999 higher than
in 1998.
70%
60%
50%
40%
30%
20%
10%
0%
Figure 8: Percent of female doctorate recipients by broad field, 1969, 1979, 1989, 1999
All Fields PhysicalSciences
Engineering Life Sciences SocialSciences
Humanities Education
See Table 7.SOURCE: NSF/NIH/USED/NEH/USDA/NASA, Survey of Earned Doctorates
11 21
Prof/Other
19690 1979
1989 1
10 1999

In 1999 females represented 36.4 percent of S&E doctorate recipients and 48.2 percent of
degrees in non-S&E fields. With respect to finer field distinctions, of the 25 selected subfields
listed in table 6, women were the majority of doctorate recipients in 7 fields and constituted at
least 40 percent of the doctorate population in 7 more areas. And in 11 of the 25 fields, the rate
of increase in female doctorate recipients between 1989 and 1999 was over 40 percent.
While in the aggregate women constituted 42.7 percent of the doctorate recipient
population in 1999, that proportion varies not only by field but also by race/ethnicity and
citizenship. Among U.S. citizens, of doctorates earned by whites, 47.1 percent were awarded to
women; for blacks, various Hispanic groups, and American Indians, women were in the
majority, earning between 55 percent and 62 percent of doctorates received by persons of those
races or ethnicities. Among Asian Americans, women were only 41.7 percent of the total. (See
figure 11 and appendix table A-4.)
For U.S. citizens as a whole, 47.9 percent of all doctorates awarded in 1999 went to
women, up from 47.7 percent in 1998 and continuing a long-term trend of U.S. women
approaching parity with their male counterparts. For example, in 1979, among U.S. citizens,
women earned only 31.0 percent of all doctorates. In fact, the number of male U.S. citizens
earning doctorates was more than 3,000 higher in 1979 than it was in 1999, and in the 1990s
while the number of doctorates going to U.S. males is relatively level, the number earned by U.S.
women has increased every year except 1999. (See appendix tables A-4 and B-2.)
Among permanent residents earning doctorates in 1999, only 40.2 percent were female,
and among those doctorate recipients holding temporary visas, only 26.8 percent were female
(appendix table A-4). Women holding temporary visas are more concentrated in the S&E fields
of study than women who are U.S. citizens. While women with temporary visas represented 13.9
percent of all female doctorates in 1999, they earned 28.4 percent of the doctorates earned by
females in the physical sciences, 32.7 percent of the female-earned doctorates in engineering,
and 20.9 percent of the doctorates earned by females in the life sciences (appendix table A-3c).
Doctorates by Race/Ethnicity
While the total number of doctorates fell between 1998 and 1999, for U.S. citizens the
aggregate number of minority doctorate recipients increased by 5.1 percent. Within race/ethnic
categories, Asians and American Indians showed the largest percentage gains, 12.8 percent and

15.9 percent, respectively; the corresponding figure for blacks was 7.6 percent. Hispanics were
the only minority group to register a decrease in the number of doctorates in 1999, falling by 7.4
percent. By comparison, the number of white doctorate recipients fell by 1.8 percent. (See
appendix table B-22.)
A total of 4,248 doctorates were awarded to members of U.S. racial/ethnic groupings in
1999. This figure is, as noted above, 5.1 percent higher than one year earlier; it is also 38.0
percent higher than the total five years earlier (1994) and nearly double (99.3 percent higher) the
number for 1989.
With regard to broad field of study, U.S. minorities received more doctorates in 1999
than in 1998 in five of the seven groupings; in only one area education did the number fall;
for engineering the 1998 and 1999 totals were identical (see table 8 and Summary Report 1998
table 8). If 1994 is compared with 1999, two years in which the total numbers of doctorates
awarded were virtually the same, minorities registered sizable gains in all seven broad fields,
ranging from a 22.6 percent increase in the physical sciences to a 56.4 percent increase in the
social sciences. Over that same period, the number of doctorates awarded to whites fell by 3.7
percent. (See table 8.)
Within racial/ethnic grouping, Asians and blacks showed increases in every one of the
seven broad fields between 1998 and 1999 (see Summary Report 1998, tables 8 and 9, for the
1998 numbers drawn upon here). Hispanics and American Indians registered gains in some
fields but declines in others (see table 8). With regard to the 24 subfields listed in table 9, Asians
showed absolute increases in 16 of those disciplines, declines in 3, and no change in 5. Blacks
showed absolute increases in 15, declines in 7, and no change in 2. By contrast, Hispanics
experienced increases in only 10 and decreases in 13, and American Indians gained in 12,
declined in 10, and were stable in 2. The number of white graduates declined in 18 of the 24
subfields and increased in only 6.
For a breakdown of minority representation by sex, see the previous section.
Table 10 lists the universities that awarded the largest number of doctorates to each of the
four minority groupings over the last five years, 1995 through 1999, and the absolute number
granted. Over that interval, three California institutions Berkeley, UCLA, and Stanford and
two in Boston Harvard and MIT awarded more than 1,000 doctorates (1,091) to Asian
Americans, or 18.1 percent of all doctorates awarded by U.S. universities in that racial category.
13 23

Nova Southeastern University and Howard University awarded by far the most doctorates to
blacks (290 and 239, respectively), 7.5 percent of the U.S. total. In general, the leading
institutions awarding doctorates to Hispanics lie in the Southwest, including California, and in
Puerto Rico, and the top 10 account for 22.9 percent of all Hispanic doctorates. Oklahoma State
University and the University of Oklahoma grant the largest number of doctorates to American
Indians.
The concentration of U.S. minority doctorate recipients among institutions is
considerably greater than for the doctoral population as a whole. In 1999, for example, the
leading 10 universities granted 15.6 percent of all doctorates. But over the 1995-99 period, the 10
universities awarding the most degrees to minority students in each of the four groupings
accounted for more than 20 percent of those totals. The top 10 institutions that awarded
doctorates to Asians in table 10 granted 28.1 percent of all Asian doctorates between 1995 and
1999; for blacks the corresponding figure is 20.7 percent; for Hispanics it was 22.9 percent, and
for American Indians it was 20.1 percent.
1800
1600
1400
1200
01000
Figure 9: Doctorates awarded to minority U.S. citizens, by race/ethnicity, 1979-1999
800
600
400
200
00
1979
-43 BlackAHispanic0American Indian
1984 1989
Year
See Table 8.SOURCE: NSF/NIH/USED/NEH/USDA/NASA, Survey of Earned Doctorates
14 24
1994 1999

7.00%
6.00%
5.00%
4.00%
3.00%
2.00%
1.00%
0.00%
Figure 10: Percentage of doctorates earned by minority U.S. citizens, 1979 and 1999
4 4%
5.9%
2 0%
4.1%
Black Hispanic Asian
See Table 8.
SOURCE: NSF/NIH/USED/NEH/USDA/NASA, Survey of Earned Doctorates
70.0%
60.0%
50.0%
40.0%
30.0%
20.0%
10.0%
0.0%
0.8%
0.3% Mr,"
American Indian
Figure 11: Percentage of doctorates earned by minority U.S. citizens, by sex, 1999
62.2%
43.8%
56.2%
Black Hispanic
58.3%
Asian
See Appendix Tables B-2b and B-2c.SOURCE: NSF/NIH/USED/NEH/USDA/NASA, Survey of Earned Doctorates
15
25
American Indian
0 1979
10 19991
[0 Male
;111 Female

Figure 12: Percentage of doctorates earned by minority U.S. citizens, by broad field, 1999
25.0%
20.0% 19.3%
17.9% 17.7%
15.6% 15.9%15.1%
15.0%
12.4%11.8%
10.0%
5.0%
0.0%
All Fields Physical Sciences Engineering Life Sciences Social Sciences Humanities Education Prof./Other
See Table 9.SOURCE: NSF/NIH/USED/NEH/USDA/NASA, Survey of Earned Doctorates
Doctorates by Citizenship
The SED collects information on the citizenship status and country of citizenship of the
new doctorate recipients each year. Of the 1999 doctorate recipients with known citizenship
status (94.8 percent of the total), 70.8 percent were U.S. citizens, 5.9 percent were permanent
residents of the United States, and 23.3 percent were in the U.S. on temporary visas.9 See table
11.
9 Citizenship status (U.S. versus non-U.S.) and country of citizenship are variables with somewhat higherthan average non-response in the SED, and the figures presented in this section thus have moreuncertainty than others in the report. The numbers of cases with missing data on these variables has alsofluctuated more year to year than other SED variables, and the over-time comparisons are thus alsosubject to some uncertainty. For example, in 1994 citizenship status was unknown for only 734 recipients,but this number rose to 2,651 in 1989 and 1,482 in 1974.

With regard to broad field of study, of the doctoral population with known citizenship
status, U.S. citizens earned more than 80 percent of the doctorates awarded in the social sciences,
humanities, and education (81.3 percent, 81.8 percent, and 88.6 percent, respectively) in 1999.
Permanent residents and those holding temporary visas accounted for the largest proportions in
the physical sciences, engineering, and life sciences. (See table 11.) In absolute numbers, U.S.
citizens earned more doctorates in education than in any of the other broad fields; permanent
residents had their highest total in the life sciences, and for those in the United States on
temporary visas, engineering was the most popular field. U.S. citizens showed less field
concentration than did non-citizens: three of the seven fields (life sciences, social sciences, and
education) accounted for only 57.6 percent of doctorates awarded to U.S. citizens; physical
sciences, engineering, and the life sciences accounted for 62.3 percent of doctorates earned by
permanent residents, and 71.1 percent of degrees awarded to temporary visa holders.
Citizens of the People's Republic of China (PRC) earned 2,400 doctorates in 1999, or 5.8
percent of the total 41,140 degrees awarded.1° (See table 12 for a listing of the top 30 countries
of origin of all doctorate recipients.) The top 15 countries in terms of the number of doctorates
awarded to its citizens in 1998 remained the same for 1999, although Korea moved from fourth
to third on the list, changing places with Taiwan (Republic of China), and a few other nations
changed modestly in the rankings as well. The leading five countries accounted for 14.5 percent
of all doctorates awarded by U.S. universities in 1999. Only 4.8 percent of the total doctoral
population are citizens of next 10 nations listed in table 12, and only 2.9 percent are citizens of
the next 15 nations. Doctoral students who are citizens of one of the 30 nations shown in the
table thus account for 22 percent of the 41,140 doctorates awarded in 1999.
Table 13 lists the institutions awarding the largest numbers of doctorates to non-U.S.
citizens in 1999; table 14 provides a complementary ranking those institutions awarding the
largest percentage of doctorates relative to the total number of Ph.D.s they granted.
Doctorates by Parental Education Background
Since 1963 the SED has asked new doctorate recipients to report their fathers' and
mothers' levels of educational attainment. For purposes here, the responses are grouped into
I° Hong Kong, with 67 doctorate recipients, is not included in the PRC totals.

three categories: high school diploma or less; some college, including earning the baccalaureate;
and advanced degree, including the master's, doctorate, or a professional degree. While only the
data for 1999 are described here, analysis of the historical record would be a useful subject for
further research on the social origins of the doctorate population.
The 1999 data (see table 15) show that 31.0 percent of recipients' fathers had earned a
high school diploma or less; the corresponding figure for their mothers was 40.4 percent.
Slightly over one-third (34.5 percent) of doctorate recipients had a father who had gone to
college (but may not have earned a baccalaureate degree); 39.4 percent of the mothers of
doctorate recipients in 1999 had some college background. Finally, for 34.5 percent of the
doctorate recipients, the father held an advanced degree, compared with 20.2 percent whose
mothers had an advanced degree.
Although similar in general, parental education backgrounds of male and female 1999
doctorate recipients differed with respect to mothers' education. Female doctorate recipients
were more likely than their male counterparts to have a mother who attended college or who
earned an advanced degree.
There is considerable variation in parental education attainment by race/ethnicity,
citizenship status, and broad field of study. Compared with other racial/ethnic categories, Asian
American doctorate recipients were more likely to come from families in which both the father
and mother had advanced degrees; black, Hispanic and American Indian recipients' parents were
the least likely to have gone beyond high school. U.S. citizen doctorate recipients were more
likely than those with either permanent residency status or holding temporary visas to have
parents with advanced degrees (and less likely than these two groups to have parents whose
formal education did not extend beyond the high school level).
The distributions of parental education by the broad fields in table 15 reflect in part the
different sex, race/ethnic, and citizenship compositions of the fields. Doctorate recipients in the
humanities displayed the highest percentages of both fathers (43.2 percent) and mothers (25.4
percent) with advanced degrees. Education doctorate recipients had the lowest incidence of
advanced degrees by fathers or mothers, 21.1 percent and 11.7 percent, respectively. These two
broad fields are also the least and most represented, respectively, with regard to the fraction of
parents whose formal education stopped at high school or before.

Time to Degree
The amount of time needed to complete a doctorate is a key concern not only for those
pursuing the degree but also for the faculties and administrations of the degree-granting
institutions, as well as national public agencies and private organizations that support doctoral
study. Time to degree is likely to be affected by individual preferences and economic constraints,
as well as by the labor markets and cultures of the academic disciplines and institution-specific
program characteristics.
The SED indexes time to degree in three ways: (1) the total time elapsed from completion
of the baccalaureate to completion of the doctorate, (2) the total time elapsed while actually
registered in graduate school to completion of the doctorate, and (3) the simple age of the
doctorate recipients. In this section, the 1999 data and the historical trends for each of these
measures is reviewed for the whole population of doctorate recipients and separately by broad
field and the background variables of sex, race/ethnicity, and citizenship.
The median total time span from baccalaureate to doctorate for the 1999 doctorate
recipients was 10.4 years (table 16), the same as in 1998. The total time span was shortest in the
broad area of physical sciences and mathematics (8.0 years) and longest in education (19.9 years)
and professional/other fields (14.0 years). These latter two broad fields include large numbers of
individuals who have worked full time before starting their graduate degree programs and even
continue to work full time while earning their doctorates.
The historical data in table 16 show that the 1999 median total time to degree was about 5
months shorter than in 1994. The longer term trend has been one of increases in length from
1974 to 1994 (see figure 13 and table 16). The broad fields of engineering; physical, life, and
social sciences; and humanities follow this overall pattern toward shorter times, but median time
to degree for education and the professional/other fields increased from 1994 to 1999.
The median duration of being registered in graduate school was 7.3 years for the 1999
doctorates (table 16), also identical to the number for 1998. Registered time to degree was
shortest in engineering (6.6 years) and the physical sciences and mathematics (6.8 years), and
longest in the humanities (8.9 years) (table 16). The trend for time registered is one of small but
steady increases over the 25-year span from 1974 to 1999 (see figure 13 and table 16) for all
seven broad fields, with some flattening in the past five years in all broad fields except the
professional/other fields category.

Figure 13: Median number of years to doctorate from baccalaureate awardand age at doctorate, 1974-1999
40
35
30
25
fo 20
15
10
0
31.4
33.133.9 34.1 33.8 i
31.9
10.410.0
8.69.1
!Age at doctorate
0- -Time to degreeRegistered time to degree
10.6 10.80at
7.36.9 7.0 7.26.0 6.2
1974 1979 1984 1989 1994 1999
Year
See table 16.SOURCE: NSF/NIH/USED/NEH/USDA/NASA, Survey of Earned Doctorates
The median time to degree indices vary somewhat by sex, citizenship, and race/ethnicity,
but these differences are mainly reflections of the broad field differences reviewed above (table
17). Across the whole population of new doctorate recipients, females had longer total and
registered times to degree than did males, but the sex differences disappear or reverse when
males and females are compared within humanities and the physical, life, social sciences. Similar
patterns hold for comparisons of U.S. and non-U.S. citizens, and of the U.S. racial/ethnic groups
(see table 17).
The third measure of time to degree compiled in the SED is age at doctorate. The median
ages of the 1999 doctorate recipients are tabulated in appendix tables A-3 by major field of
degree and A-4 by citizenship and race/ethnicity. Overall, the median age at receipt of the
doctorate in 1999 was 33.8 years old. Again, age at degree varies with field of study. Doctorate
recipients in engineering and the sciences typically earn their degrees in their early 30s; the
median for all 1999 doctorate recipients in those broad fields was 31.8 years old. Age at
doctorate was 35.1 years in the humanities, 44.3 years in education, and 37.5 years in the

professional/other fields category. The modal age spans evident in figure 14 and table 18 reflect
this ordering.

Figure 14: Age distribution at doctorate by broad field of study, 1999
All Fields
23.6%32.5%
43.8%
TTD = 10.4 years RTD = 7.3 years
Engineering
6.9%
47.6%
TTD = 8.7 years
Social Sciences
20.5%
45.6%
45.4%
Physical Sciences6.8%
,
40.4% 52.8%
TTD = 8.0 years RTD = 6.8 years
Life Sciences
14.0 %.
45 4%
40.6%
RTD = 6.6 years TTD = 9.09 years RTD = 7.0 years
33.9%
Humanities
25.5%
53.5%
21.0%
TTD = 9.9 years RTD = 7.5 years TTD = 11.7 years RTD = 8.9 years
Education Prof/Other
7.1%ar
30.8%
62.1%
TTD = 19.9 years RTD = 8.2 years
21-30
IN 31-40
El 41 &older
14.7%
48.5%
TTD = 14.0 years RTD = 8.0 years
See Table 18.SOURCE: NSF/N1H/USED/NEH/USDAJNASA, Survey of Earned Doctorates
22
32

Financial Resources in Support of Doctorate Recipients,Including Indebtedness
The SED asks two questions that, taken together, provide information on the financial
sources of support utilized by the new doctorate recipients (for the exact formats and wordings,
see the copy of the questionnaire in Appendix D). The first question is a checklist of 13 different
potential sources of support, such as fellowships and scholarships, dissertation grants, teaching
and research assistantships, and various personal arrangements. The second question asks which
of the checked sources was the primary source of support and which was the second most
important. For purposes here, respondents are grouped in terms of their primary sources of
support. The 13 sources are combined into the seven categories that form the rows in table 19.
Well over half-60.9 percent of the 1999 doctorate recipients received the majority of
their support for doctoral study from program- or institution-based sources, such as teaching
assistantships, research assistantships/traineeships, and fellowships/dissertation grants.'' Just
under a third (32.6 percent) of all 1999 doctorate recipients reported that their own resources
(which include funds from loans, one's spouse, savings, and non-academic employment) were
the primary sources they used to finance their doctoral studies. Foreign government, employer
contributions, and "other" sources accounted for the remaining 6.5 percent of the cases. (See
table 19.)
Overall, women were more dependent upon personal resources than were men (41.2
percent versus 26.1 percent). The same was true for U.S. citizens (40.6 percent) compared to
foreign citizens on permanent or temporary visas (22.1 percent and 10.2 percent, respectively).
However, sources of support vary considerably by field of study. For example, within
engineering, a much higher than average percentage of new doctorate recipients reported
program- or institution-based programs as primary sources of support (76.4 percent) and a
greater percentage of men than women (13.2 percent versus 9.2 percent) reported their own
resources as the primary source of support.
In the physical sciences, 85.6 percent of research doctorate recipients in 1999 listed
teaching/research assistantships or fellowships as their principal form of support, as did 76.6
percent of those in the life sciences. By contrast, only 57.5 percent of doctorate recipients in the
11 The Federal government and other governments can be the original source of these funds.
23
33

humanities, 52.0 percent of those in the social sciences, and 20.9 percent of those in education
reported these categories as the primary sources of financial support for their doctoral program.
In light of these different patterns in the broad fields of study, aggregate comparisons of graduate
sources of financial support among demographic groups should be interpreted cautiously.
Non-U.S. citizens tend to be more concentrated in fields where the majority of doctoral
students receive institution- and/or program-based support. Reflecting this concentration, non-
U.S. citizens reported lower percentages of reliance on their own resources than did U.S.
citizens. This pattern was consistent across all of the broad fields of study.
With regard to race/ethnicity, black doctorate recipients indicated the greatest reliance on
their own resources to finance their doctoral program (48.6 percent), followed by American
Indians (44.4 percent), whites (41.0 percent), Hispanics (40.7 percent), and Asians (22.7
percent). Within most of the broad fields of study, the race/ethnicity differences in reliance on
own resources diminish. Some large race/ethnic differences within fields are found, however, in
terms of use of the different types of program- and institution-based supports. In the physical
sciences and engineering, Asians and whites were more likely than blacks and Hispanics to rely
on teaching and research assistantships and less likely to have fellowships or dissertation grants
as their primary source of support.
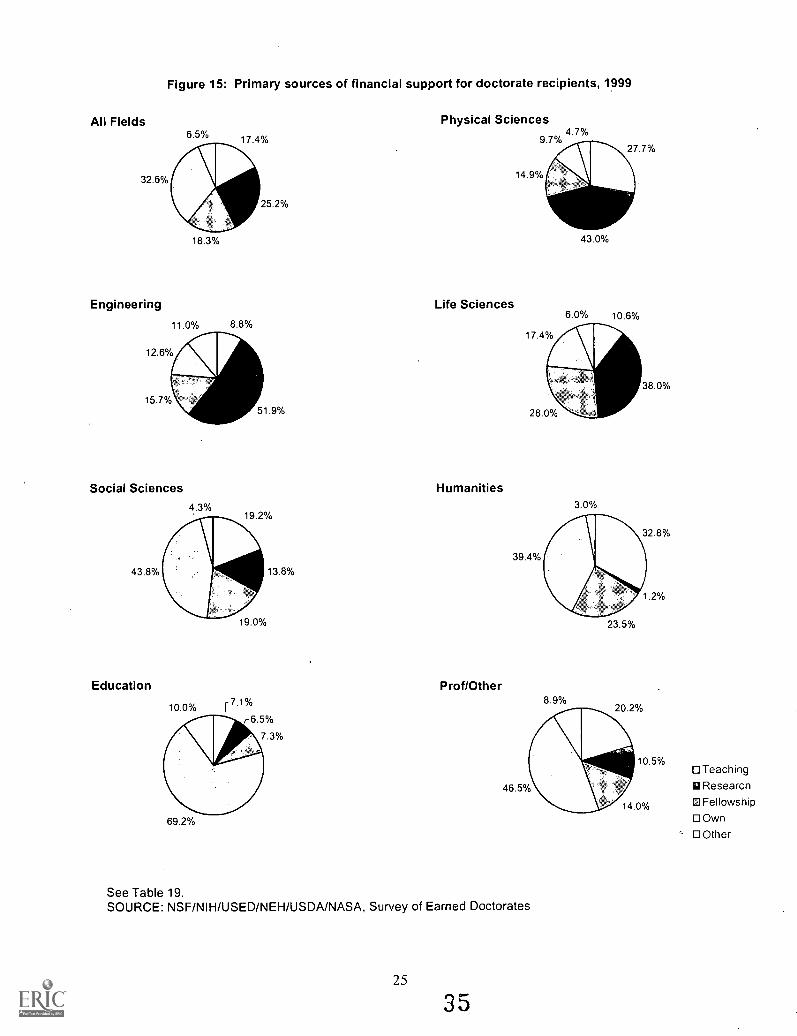
Figure 15: Primary sources of financial support for doctorate recipients, 1999
All Fields Physical Sciences6.5%
32.6%
18.3%
Engineering
11.0%
12.6%
8.8%
15.7%
Social Sciences
43.8%
51.9%
19.0%
Life Sciences
Humanities
Education Prof/Other
10.0% [7.1%
r 6.5%
7.3%
69.2%
43.0%
6.0% 10.6%
39.4%
3.0%
32.8%
2%
38.0%
23.5%
See Table 19.SOURCE: NSF/NIH/USED/NEH/USDA/NASA, Survey of Earned Doctorates
25
35
TeachingU Research
O Fellowship
Own
Other

The SED also asks the new doctorate recipients to indicate the amount of money they
owe that is directly tied to their undergraduate or graduate education. This is defined as debt
related to tuition and fees, living expenses and supplies, and transportation to and from school.
The response categories begin with "none" and proceed upward in $5,000 increments, with
"$30,001 or more" at the top. A total of 37,188 (90.4 percent) 1999 graduates responded to the
question.
Half (49.9 percent) of the 1999 respondents reported having no education-related debt,
and another 24.0 percent reported cumulative debt of $15,000 or less (table 20). However, a
distinct bulge at the high end of the debt distribution is also evident, with 13.3 percent of all new
doctorate recipients reporting debt over $30,000.
Looking at the debt distributions within each of the seven broad fields, graduates in the
physical sciences, engineering, education, and the life sciences are most likely to complete the
doctorate with no education-related debt (table 20). Social scientists and humanities graduates
are much less likely to have' no debt. Debt levels in excess of $30,000 or more are most common
among social scientists (24.3 percent), graduates in the professional/other fields areas ( I 7.6
percent), and the humanities (15.5 percent).
The pattern of debt levels for the main demographic groups are shown in table 21.
Particularly noteworthy in these tabulations is the much higher probability of blacks, Hispanics,
and American Indians to incur high leVels of education-related debt. Over a quarter (26.5
percent) of black doctorate recipients, 23.8 percent of American Indians, and 20.4 percent of
Hispanics owed more than $30,000; these figures compare to 12.0 percent of Asians and 14.9
percent of whites owing that much. At the other extreme, Asians and whites are much more
likely than the other groups to have no education-related debt upon completion of the doctorate.

Postgraduate Plans, Employment,' and Location
The SED questionnaire includes a number of questions about the graduates' immediate
plans for work or further study.I2 The responses provide a useful overview of the numbers
planning to enter academic positions, government and industry, and postdoctoral programs of
research and further study. Information is also collected on the main types of work activities
research, teaching, administration, and professional services to individuals -- that the graduates
anticipate in their new positions.
Three aspects of postgraduation plans are examined in this report. The first is whether the
new doctorate recipient has a definite or indefinite commitment for employment or a
postdoctoral position. These data are examined by broad field of study, sex, citizenship, and
race/ethnicity (tables 22 and 23). The second aspect is the distribution of graduates with definite
commitments for career employment versus for postdoctorate research and study programs. This
distribution is also examined separately by broad field of study, sex, citizenship, and
race/ethnicity (tables 24 and 25), as well as by visa status and anticipated location (foreign versus
U.S.) for non-U.S. citizens (tables 26 and 27). The third aspect is the distribution of graduates
across employment sectors, broken down by sex, race/ethnicity, and citizenship status (table 28).
Definite versus Indefinite Plans
Over two-thirds (69.9 percent) of all doctorate recipients in 1999 reported having definite
commitments for employment or postdoctoral study or research. This rate is consistent with
those for recent years, but somewhat lower than the rates in the 1980s and 1970s (table 22). With
the notable exception of the humanities, the percentages with definite commitments in 1999 vary
little by broad field. In the humanities, only 60.6 percent have a definite commitment.
The percentages with definite commitments also differed little among demographic
groups (table 23). About 2 percent fewer women than men (68.5 versus 71.0 percent) had
12 The items in the postgraduation plans section of the questionnaire are not classified as critical itemswhich become the focus of missing data follow-ups. Thus, the response rates to the postgraduation plansitems mirror the returns of the actual questionnaire, minus a low rate of item nonresponse. For the I 998-
99 cycle, the overall response rate for the first item, asking whether the respondent has definite plans foreither career employment or study, was 90.3 percent.

definite plans. U.S. citizens were more likely to have definite commitments (71.4 percent) than
individuals with permanent or temporary visas (66.5 percent). Among U.S. citizens and
permanent residents, whites were most likely to have definite plans (72.0 percent), while
American Indians, blacks, Asians, and Hispanics were less likely.
Career Employment versus Postdoctorates
Among the doctoral recipients reporting definite plans, the majority (69.8 percent)
indicated that they plan to enter career employment as opposed to pursuing further study within a
postdoctoral research or teaching program (table 24). Postdoctorate study was more common
among graduates in the life sciences (63.8 percent) and the physical sciences (46.5 percent) than
in the other broad fields. The percentages of new doctorate recipients entering postdoctorate
study programs has increased in all of the broad fields since 1979 (table 24).
Differences among demographic subgroups are evident in table 25. Men were slightly
more likely than women to have definite plans for a postdoctorate (32.0 versus 27.5 percent).
Students with temporary or permanent visas were much more likely than U.S. citizens to pursue
postdoctorate studies (39.3 versus 26.9 percent). Among U.S. citizens and permanent residents,
Asian new doctorate recipients were more likely than other race/ethnicity subgroups to plan
postdoctorates. Black and American Indian doctorate recipients were least likely to report
postdoctorates. These differences among citizenship and race/ethnicity subgroups are reflections
of the greater number of postdoctorates in the physical and life sciences, and the greater
concentrations of non-U.S. citizens and Asian-American students in those fields.
Postdoctoral Location of Non-U.S. Citizens
As the number of international students earning research doctorates in the United States
has steadily increased over the past two decades, so has the tendency for those students to remain
in the United States following graduation. Table 26 shows that 91.9 percent of all new doctorate
recipients holding permanent visas and 69.4 percent of temporary visa holders indicated that they
will remain in the United States following graduation. The fields with the highest concentrations
of new doctorate recipients with temporary visas staying in the United States were chemistry
(92.3 percent), biology (85.8 percent), physics (76.9 percent), and computer science (76.9
percent) (see table 26).
28
38

The trend shown in table 27 is one of increasing percentages of new doctorate recipients
with temporary visas planning to stay in the United States after receiving the doctorate. In 1974,
38.2 percent of those on temporary visas had firm commitments to positions in the United States.
Twenty-five years later, that number had grown to 67.3 percent.
Employment Sectors in the United States
Higher education remains the most common destination of the 1999 doctorates with
definite commitments within the United States, identified by 49.2 percent of the 1999 respondent
subpopulation (see table 28). The next largest group, 27.8 percent, had commitments to industry
or some form of self-employment, and 7.5 percent planned to work for Federal, state, or local
government. The historical trends show reductions in academic and in government employment,
coupled with an increase in the industry/self-employment sector.
Among the U.S. racial and ethnic groups, Asians were less likely than others to go
immediately into higher education and were more likely than all others to go into industry or
self-employment. Industry was also the main destination of non-U.S. citizens with definite plans
to remain in the United States after graduation.

Special Section: Interstate Migration Patterns of DoctorateRecipients
Introduction and Overview
Mobility is a vital element in any population and labor force. How willingly families will
migrate from one location to another, and how easily workers are able to respond to market
signals and make the transition from one opportunity to another or to turn a disappointment in
one area into a new challenge in another -- for advancement and/or to seek additional training,
constitute important indicators and predictors of economic growth and development. From the
very beginning of this nation, Americans have exhibited a willingness to move from
settlements and industrial cities in the East to sparsely populated regions, and then from
agriculture back to urban areas
On the international front, immigration, including "brain drain" and "brain gain"
concerns, cohort sizes and composition (such as changes in the age, educational or labor force
attachments of the new arrivals) are of paramount importance. Domestically, "brain drain"
issues are also of particular current interest to individual states across the country, which has
implications for allocations for higher education and other public expenditures, as well as other
legislative initiatives. Governors, state legislators and others express concern over the loss of
their well-educated citizens to other states, or whether they are providing substantial subventions
to out-of-state students who then return home or move elsewhere after they complete their
undergraduate or graduate/professional studies. Support for higher education is occasionally
couched in such terms and calculations.
This special section focuses on the extent and pattern of interstate migration of doctorate
recipients from United States universities from birth through initial postgraduate employment.' 3
This is arguably one of the highest skilled segments of the American labor force, and one for
which personal and professional decisions to migrate is of great importance.
13 For a recent comprehensive discussion and overview of many international aspects of migration, seeGraduate Education Reform in Europe, Asia and The Americas and International Mobility of Scientistsand Engineers: Proceedings of an NSF Workshop, National Science Foundation, April 2000.
BEST COPY AVAILABLE40

The Data Set
The Survey of Earned Doctorates (SED) questionnaire (see Appendix D) asks for state of
residence information at five points in a respondent's personal event history: (I) state of birth;
(2) state in which they received their high school diploma; (3) state where they first enrolled in
college; (4) state where they earned their doctorate; and (5) state in which they accepted their
initial postdoctorate employment. The data drawn on here are from the 1999 SED.14
From the universe of 41,140 doctorate recipients in 1999, we confined our investigation
to native-born U.S. citizens who also provided information on where they were born, where they
completed high school, where they started college, and where they planned to work after receipt
of the doctorate. This yielded a subset of 23,153 individuals, or 89.6 percent of the 25,843
known native-born U.S. citizens earning doctorates in 1999. We used this data set to examine
the general pattern and overall level of migration among the new doctorate population, and the
extent to which mobility varies by sex, race/ethnicity, marital status, parental education,
employment sector, and academic discipline.
From Birth to College
Overall, 13.4 percent of doctorate recipients in our study were born, graduated from high
school, entered college, received a doctorate, and planned to work all in the same state. By
contrast, 8.7 percent of that same population noted an entirely different state for each of these
five chronological markers. (See table 2-1, which also includes these patterns by sex and other
characteristics.)
About a third (34.0 percent) of these doctorate recipients were graduated from high
school in a state other than the one in which they were born15 (see table 2-2). Almost the same
proportion (36.1 percent) of new recipients first entered college in a state other than the one in
which they earned a high school diploma, a figure that is higher than the percentage for college
freshmen as a whole.16 Thus, at the, initial undergraduate level, in terms of educational horizons,
these doctorate recipients did not resemble their age cohorts (see table 2-2).
14 A complementary data set to the SED, the Survey of Doctorate Recipients (SDR), includes informationon longitudinal characteristics of doctoral cohorts, including occupational history.15 This percentage is a lower bound on migration because it does not capture intrastate moves norinstances in which a family could have moved from one state to another and then back again in thisperiod.16 See the Digest of Education Statistics 1990, Tables 187, 188, and 189, for data on residence and

From College to Doctoral Study and Employment
More than two-thirds (68.8 percent) of the U.S. citizens receiving doctorates in 1999
received their doctorate from an institution located in a state other than the one in which they
first entered college. About half of them 44.8 percent intended to remain and work, at least
initially, in the state in which they earned their doctorate; 55.2 percent intended to move to
another state. (See table 2-2.) With regard to returning to prior "roots," 28.3 percent were
returning to (or remaining in) the state in which they went to college, 29.2 percent to the state in
which they went to high school, and 24 percent to their birth state (see table 2 -3).' These
percentages imply that there is no single time period in which "brain drain" or "brain gain"
occurs, but rather that migration appears to be more of a continuous process.
Migration and Sex
With respect to demographic characteristics, male and female doctorate recipients
exhibited similar migration patterns between birth and graduation from high school, as one
would expect (that is, family decision-making with regard to moving should be largely
independent of the sex of their child). The same pattern is observed for in-state versus out-of-
state college matriculations by sex: 36.5 percent of males and 35.6 percent of females went to
college in a state other than the one in which they received their high school diploma. Larger
differences by sex begin to appear between college and doctorate institution choices and between
doctorate institution location and initial employment: 50.9 percent of females but 59.2 percent of
males intended to work in a state different from the one in which they earned the doctorate. (See
table 2-2.) Overall, male doctorate recipients were less likely than females to return to the
state(s) in which they were born, attended high school, or first matriculated in college. (See table
2-3.)
Migration and Race/Ethnicity
Between birth and high school graduation, Asian American doctorate recipients were
more likely to have moved across state lines than other American race/ethnicity groups; 4 I .9
migration of all freshmen students in fall 1988. The 1988 class of freshmen is the closest available to themodal year of college entry for the 1999 doctorate recipients (1983).17 A 1967 report, Doctorate Recipients from United States Universities 1958-66 (Publication 1489,National Academy of Sciences, Washington, D.C.), showed that 38.9 percent of doctorate recipients from1964-66 earned their doctorate in the same state in which they received their high school diploma.

percent of Asians received a diploma in a state other than the one in which they were born
compared with 28.2 percent of blacks, 27.1 percent of Hispanics, 34.4 percent of whites, and
33.5 percent of American Indians. Asians, blacks, and whites show more migration between
high school and college than do Hispanics and American Indians. Whites are the most likely to
move across states between college and doctoral program. (See table 2-2.)
With respect to geographical location for initial postgraduate employment, the
similarities are more striking than the differences. However, Hispanics are the most likely of all
the racial/ethnic groups to return after the doctorate to the state in they were born, were
graduated from high school, or enrolled in college. (See table 2-3.)
Migration and Marital Status
More than three in five (63.9 percent) of doctorate recipients in our subset were married
or living in a marriage-like relationship at the time they received the degree; another 7.9 percent
were either separated, widowed, or divorced; 28.2 percent had never been married. The "never
married" group exhibited a greater tendency to enroll in an out-of-state college (39.7 percent
versus 35.0 percent for the married/marriage-like group, and 31.5 percent for the
separated/widowed/divorced category), 71.6 percent earned a doctorate in a state other than the
one in which they went as an undergraduate (versus 68.0 percent and 64.4 percent, respectively,
for other two groups), and 64.3 percent intended to work in a state different from the one in
which they earned their terminal degree (versus 51.8 percent and 50.1 percent). (See table 2-2.)
Overall, those who had never been married exhibited the lowest tendencies to stay in the state of
birth or in which they had gone to high school or college. These differences may reflect a
tendency for those without spouses to be less constrained by personal obligations that could
affect their willingness to migrate (that is, an employed spouse, children, or other aspects of joint
decision-making within the family could lead to more geographic stability); the data are
consistent with this hypothesis (see table 2-3).
Migration and Family Background
The SED provides information on the level of educational attainment of doctorate
recipients' parents. For present purposes, we segmented recipients into two groups: those from
families in which neither parent had received a baccalaureate degree (that is, the highest level of

educational attainment in the family included those with less than a high school diploma, a high
school diploma, or some college) and those whose parents had earned a bachelor's degree or
higher (36.2 percent and 63.8 percent, respectively). The percentage of doctorate recipients from
families with the higher educational backgrounds who graduated from high school in a state
other than the one in which they were born than was almost twice the percentage for recipients
whose parents' educational attainments were more modest (41.0 percent versus 21.8 percent,
respectively). This pattern occurs at the other educational markers in these doctorate recipients'
lives: students from more highly educated family backgrounds were more likely to have attended
an out-of-state college (42.9 percent versus 24.1 percent), enrolled in college and earned
doctorate degrees in different states (72.6 percent versus 62.0 percent), and planned to work in a
state other than the one in which they earned the doctorate (58.6 percent versus 49.1 percent).
(See table 2-2.) With regard to being employed in a state in which they had earlier roots birth,
high school, or college doctorate recipients from families with higher levels of formal
education exhibited far lower tendencies to return "home." (See table 2-3.)
Migration and Employment
The SED also solicits information on the intended employment sector academic,
government, private industry or "other"I8 of each new doctorate recipient. There is little
difference with respect to interstate migration between birth and high school, from high school to
college, or college to doctoral program, or for employment by employment sector, except in the
more heterogeneous "other" category, which consistently exhibits less interstate migration than
the other three more well-defined employment groupings. (See tables 2-2 and 2-3.)
Migration and Academic Fields of Study
A breakdown of migration across broad academic fields of study by engineering, the
nine science fields, the humanities, and a residual "other" category -- is given in table 2-4. As in
table 2-2, the columns contain the percentages of doctorate recipients moving between the two
time points described in each column heading. Among the S&E doctorate recipients, students
who earned doctorates in the agricultural sciences and chemistry were the least likely to leave
their state of birth by high school and college matriculation (29.9 percent and 30.2 percent,
18 "Other" occupations include working for a non-profit organization, teaching in an elementary orsecondary school, or employed by the United Nations or another international agency.

respectively). A similar percentage (28.5 percent) of the doctorate recipients in the
heterogeneous "other" field category, two-thirds of which represents doctorate recipients in
education,I9 left their state of birth by high school and college matriculation. Those in the "other"
fields also were the most likely to enter college and graduate school within the same state.
The third column of numbers in table 2-4 shows the percentages of the 1999 doctorate
recipients who earned their doctorates in different states than where they first entered college.
These percentages are generally much higher than the rates of out-migration between high school
and college entry. The graduates from physics/astronomy and the humanities were the most
likely to change states between where they entered college and where they completed the
doctorate (77.5 percent and 76.1 percent, respectively). The "other" category, dominated by
education doctorate recipients, showed the lowest migration levels between these two points
(60.6 percent moved), followed by engineering students (67.2 percent), and psychology (68.7
percent).
With respect to interstate moves between earning the doctorate and place of employment
after graduate school, the last column in table 2-4 shows that students whose degrees were in
chemistry, physics/astronomy, and social science were the most likely to migrate. In contrast,
those in the "other" category were the least likely to find employment in a different state than
where they received the doctorate.2°
Summary and Conclusions
The labor force of doctorate recipients in the United States, as represented by the 1999
cohort, is a highly mobile one. Before they reached their mid-thirties (as noted in an earlier
section, the median age at time-to-degree for this cohort was slightly less than 34 years), many of
these scholars had moved across state boundaries to attend college, select the doctoral program
of their choice, and accept employment. Earlier in life, a third of them graduated from high
school in a state other than the one in which they had been born, and more than a third went out
19 Sixty-eight (67.8) percent of the 6,578 students in the "other" field grouping are in education; 12.7percent are in the health sciences, and 19.5 percent in professional fields such as business,communications, and theology.20 For a state-by-state and broad field breakdown of doctorate recipients in 1998 who were planning towork in the same state from which they were graduated from high school, see Table 28, page 61, inSanderson, A., B. Dugoni, T. Hoffer and L. Selfa. 1999. Doctorate Recipients from United StatesUniversities: Summary Report 1998. Chicago: National Opinion Research Center.
35
45

of their home state for undergraduate studies. Fewer than one in seven doctorate recipients lived,
was educated, and planned to be employed professionally in the same state. Upon completion of
their doctorate, fewer than one-third planned to return to a state in which they had been born,
went to high school, or attended college. Marital status and the educational attainment of these
recipients' parents appear to influence migration significantly. The analyses of migration
presented in this special section are consistent with those of earlier doctoral cohorts by other
researchers and suggest that migration among the doctorate population is both extensive and
stable.21
21 A 1991 report, Migration of U.S. Citizen S/E Doctorate-holders Among States And Regions (Susan Hill,National Science Foundation), reported that among science and engineering doctorate recipients from1986-88, 65 percent earned a bachelor's degree in the same state as the state in which they received a highschool diploma; 30 percent went to high school and completed their doctoral program in the same state;and 22 percent intended to return to the state where they last attended high school after completion of thedoctorate; and 38 percent were going to work or continue postgraduate study in the same state as theirdoctoral institution. For the 1999 cohort, those S&E percentages were 62.6 percent, 25.8 percent, 25.8percent, and 40.6 percent, respectively.
BE COPY AVAILABLE
40

DATA TABLES
1999 SURVEY OF EARNED DOCTORATES

Table 1. Number of doctorates awarded and annual percentage change indoctorates awarded by U.S. colleges and universities, 1957-1999
YearNumber of
Ph.D.sPercent
Change*Year
Number ofPh.D.s
PercentChange*
1957 8,611 1.1 1979 31,239 1.2
1958 8,773 1.9 1980 31,020 -0.7
1959 9,213 5.0 1981 31,356 1.1
1960 9,733 5.6 1982 31,111 -0.8
1961 10,413 7.0 1983 31,281 0.5
1962 11,500 10.4 1984 31,337 0.2
1963 12,728 10.7 1985 31,297' -0.1
1964 14,325 12.5 1986 31,902 1.9
1965 16,340 14.1 1987 32,370 1.5
1966 17,949 9.8 1988 33,500 3.5
1967 20,403 13.7 1989 34,327 2.5
1968 22,937 12.4 1990 36,067 5.1
1969 25,743 12.2 1991 37,534 4.1
1970 29,498 14.6 1992 38,890 3.6
1971 31,867 8.0 1993 39,801 2.3
1972 33,041 3.7 1994 41,034 3.1
1973 33,755 2.2 1995 41,743 1.7
1974 33,047 -2.1 1996 42,415 1.6
1975 32,952 -0.3 1997 42,555 0.3
1976 32,946 0.0 1998 42,683 0.3
1977 31,716 -3.7 1999 41,140 -3.6
1978 30,875 -2.7
*From previous year.
Source: NSF/NIH/USED/NEH/USDA/NASA, Survey of Earned Doctorates
Table 2. Number of doctorates awarded by U.S. colleges and universities and average doctorate recipients perinstitution, 1961-1999
YearNumber of
Ph.D.sNumber ofInstitutions
Ph.D.s perInstitution
YearNumber of
Ph.D.sNumber ofInstitutions
Ph.D.s perInstitution
1961 10,413 174 60 1981 31,356 328 96
1962 11,500 175 66 1982 31,111 333 93
1963 12,728 186 68 1983 31,281 337 93
1964 14,325 196 73 1984 31,337 336' 93
1965 16,340 206 79 1985 31,297 342 92
1966 17,949 216 83 1986 31,902 345 92
1967 20,403 220 93 1987 32,370 353 92
1968 22,937 230 100 1988 33,500 355 94
1969 25,743 232 111 1989 34,327 360 95
1970 29,498 242 122 1990 36,067 358 101
1971 31,867 264 121 1991 37,534 367 102.
1972 33,041 271 122 1992 38,890 370 105
1973 33,755 290 116 1993 39,801 375 106
1974 33,047 297 111 1994 41,034 377 109
1975 32,952 297 111 1995 41,743 384 109
1976 32,946 299 110 1996 42,415 392 108
1977 31,716 309 103 1997 42,555 382 111
1978 30,875 316 98 1998 42,683 387 110
1979 31,239 316 99 1999 41,140 392 105
1980 31,020 325 95
Source: NSF/NIH/USED/NEH/USDA/NASA, Survey of Earned Doctorates
39 BESTCOPYAVAILABLE
48

Table 3. Top 20 doctorate-granting institutions by broad field of doctorate, 1999
InstitutionNumber of
Ph.D.s InstitutionNumber of
Ph.D.s
All Fields Physical Sciences *The University of Texas at Austin 752 University of California-Berkeley 172
University of California-Berkeley 717 Massachusetts Institute of Technology 156
University of Wisconsin-Madison 685 University of Wisconsin-Madison 124
University of Minnesota-Twin Cities 656 The University of Texas at Austin 121
University of Michigan-Ann Arbor 655 University of Illinois at Urbana 118
University of Illinois at Urbana 643 Stanford University 116
University of California-Los Angeles 588 University of Michigan-Ann Arbor .115
Pennsylvania State University-Main Campus 580 University of Maryland-College Park 106
Nova Southeastern University 573 University of Washington 103
Harvard University 564 Texas A & M University 102
Stanford University 551 University of Arizona 102
Ohio State University-Main Campus 549 Cornell University-Endowed Colleges 101
University of Washington 521 University of California-Los Angeles 97
University of Maryland-College Park 504 Purdue University-Main Campus 88
Texas A & M University 501 University of Minnesota-Twin Cities 85
Massachusetts Institute of Technology 487 University of California-San Diego 84
Cornell University-Endowed Colleges 485 Princeton University 83
Purdue University-Main Campus 468 University of Colorado at Boulder 83
University of Southern California 465 Pennsylvania State University-Main Campus 82
University of Florida 447 Harvard University 77
Engineering Life SciencesMassachusetts Institute of Technology 194 University of Wisconsin-Madison 178
Stanford University 168 Johns Hopkins University 175
Georgia Institute of Technology-Main Campus 162 University of Minnesota-Twin Cities 175
The University of Texas at Austin 162 Cornell University-Endowed Colleges 159
University of California-Berkeley 149 Harvard University 156
University of Michigan-Ann Arbor 145 University of Washington 143
Pennsylvania State University-Main Campus 142 University of California-Davis 141
Purdue University-Main Campus 136 University of Florida 139
University of Illinois at Urbana 130 University of California-Berkeley 128
North Carolina State University at Raleigh 112 Ohio State University-Main Campus 127
University of Southern California 104 Texas A & M University 124
Texas A & M University 104 University of Illinois at Urbana 121
University of Florida 89 University of North Carolina at Chapel Hill 121
University of Wisconsin-Madison 83 University of Michigan-Ann Arbor 111
University of Maryland-College Park 81 Purdue University-Main Campus 110
University of Colorado at Boulder 80 University of California-Los Angeles 109
Northwestern University 79 University of Arizona 99
University of Minnesota-Twin Cities 79 North Carolina State University at Raleigh 99
Virginia Polytechnic Institute and State Univ 77 University of Georgia 96
Carnegie Mellon University 76 Pennsylvania State University-Main Campus 92

Table 3. Top 20 doctorate-granting institutions by broad field of doctorate, 1999
InstitutionNumber of
Ph.D.s InstitutionNumber of
Ph.D.sSocial Sciences HumanitiesThe University of Texas at Austin 113 Harvard University 146
Harvard University 111 New York University 143
University of Michigan-Ann Arbor 111 University of Chicago 133
University of Chicago 110 Yale University 128
University of Wisconsin-Madison 106 Indiana University-Bloomington 124
University of California-Berkeley 102 University of California-Los Angeles 120
University of Maryland-College Park 100 University of Michigan-Ann Arbor 118
University of California-Los Angeles 99 University of California-Berkeley 115
Columbia University in The City of New York 96 Columbia University in The City of New York 114
University of Illinois at Urbana 91 The University of Texas at Austin 113
Michigan State University 81 University of Minnesota-Twin Cities 107
University of Minnesota-Twin Cities 79 University of Wisconsin-Madison 98
CUNY Graduate School and Univ Center 77 University of Illinois at Urbana 83
University of Georgia 75 University of Washington 78
University of Washington 74 Boston University 77
Ohio State University-Main Campus 73 University of Southern California 75
California School of Prof Psych-San Diego 67 University of Maryland-College Park 74
Cornell University-Endowed Colleges 67 Ohio State University-Main Campus 74
New York University 67 CUNY Graduate School and Univ Center 72
Pennsylvania State University-Main Campus 67 Florida State University 69
Education Professional/Other FieldsNova Southeastern University 428 The University of Texas at Austin 51
Teachers College at Columbia University 182 Nova Southeastern University 47
Loyola University of Chicago 119 Virginia Polytechnic Institute and State Univ 39
The University of Texas at Austin 116 University of Southern California 38
Pennsylvania State University-Main Campus 113 New York University 38
Ohio State University-Main Campus 101 Pennsylvania State University-Main Campus 38
Virginia Polytechnic Institute and State Univ 99 Indiana University-Bloomington 35
University of Minnesota-Twin Cities 97 Ohio State University-Main Campus 35
University of Georgia 85 University of Pennsylvania 35
Oklahoma State University-Main Campus 84 Michigan State University 34
Texas A & M University 79 University of Minnesota-Twin Cities 34
University of San Francisco 78 Florida State University 32
University of Southern California 77 Stanford University 32
Arizona State University-Main Campus 73 University of Georgia 30
University of Illinois at Urbana 73 University of Wisconsin-Madison 30
University of California-Los Angeles 72 University of Florida 29
University of Sarasota 70 University of South Carolina at Columbia 28
University of Pittsburgh-Main Campus 70 Walden University 27
University of South Carolina at Columbia 70 University of Illinois at Urbana 27
University of Wisconsin-Madison 66 Massachusetts Institute of Technology 27
University of Pittsburgh-Main Campus 27
* Includes mathematics and computer sciences.
Source: NSF/NIH/USED/NEH/USDA/NASA, Survey of Earned Doctorates
41 50
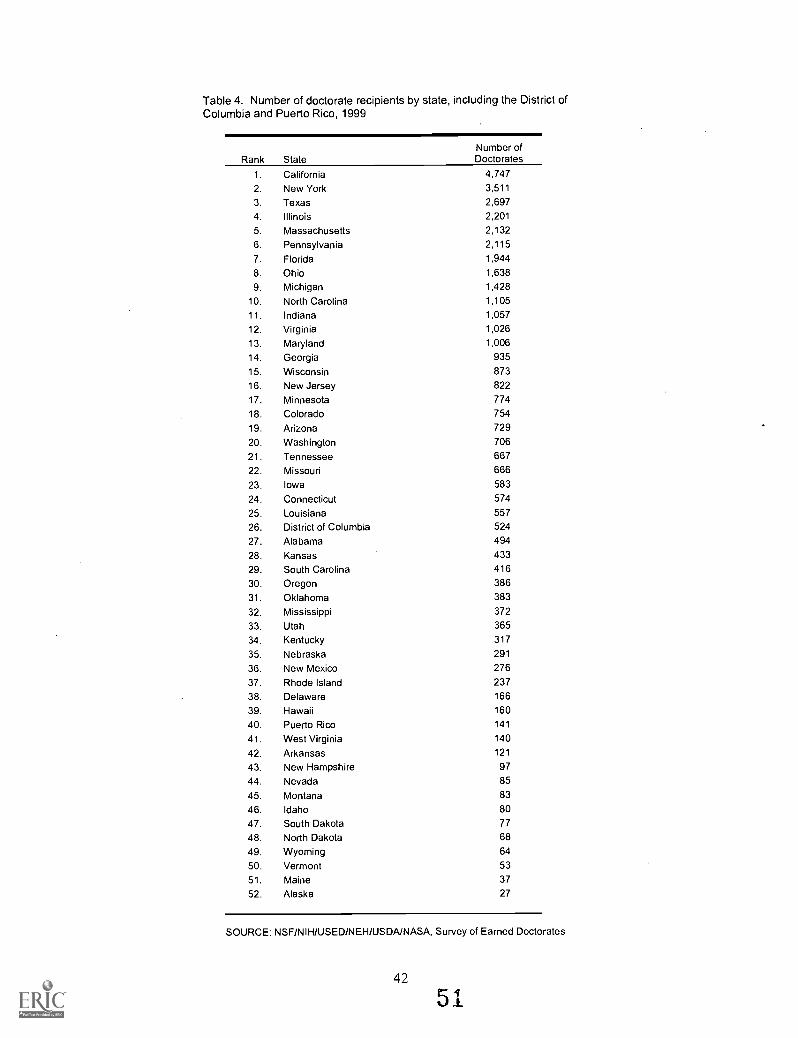
Table 4. Number of doctorate recipients by state, including the District ofColumbia and Puerto Rico, 1999
Rank StateNumber ofDoctorates
1. California 4,747
2. New York 3,511
3. Texas 2,697
4. Illinois 2,201
5. Massachusetts 2,132
6. Pennsylvania 2,115
7. Florida 1,944
8. Ohio 1,638
9. Michigan 1,428
10. North Carolina 1,105
11. Indiana 1,057
12. Virginia 1,026
13. Maryland 1,006
14. Georgia 935
15. Wisconsin 873
16. New Jersey 822
17. Minnesota 774
18. Colorado 754
19. Arizona 729
20. Washington 706
21. Tennessee 667
22. Missouri 666
23. Iowa 583
24. Connecticut 574
25. Louisiana 557
26. District of Columbia 524
27. Alabama 494
28. Kansas 433
29. South Carolina 416
30. Oregon 386
31. Oklahoma 383
32. Mississippi 372
33. Utah 365
34. Kentucky 317
35. Nebraska 291
36. New Mexico 276
37. Rhode Island 237
38. Delaware 166
39. Hawaii 160
40. Puerto Rico 141
41. West Virginia 140
42. Arkansas 121
43. New Hampshire 97
44. Nevada 85
45. Montana 83
46. Idaho 80
47. South Dakota 77
48. North Dakota 68
49. Wyoming 64
50. Vermont 53
51. Maine 37
52. Alaska 27
SOURCE: NSF/NIH/USED/NEH/USDAJNASA, Survey of Earned Doctorates

Table 5. Major field of doctorate recipients for selected years, 1969-1999
Field 1969 1974 1979 1984 1989 1994 1999
All Fields 25,743 33,047 31,239 31,337 34,327 41,034 41,140
Physical Sciences* 5,005 4,976 4,299 4,452 5,455 6,822 6,324
Engineering 3,265 3,147 2,490 2,913 4,543 5,822 5,337
Life Sciences 4,204 4,964 5,223 5,758 6,342 7.739 8,126
Social Sciences 3,984 5,882 5,961 5,929 5,961 6.613 7,036
Humanities 3,788 5,170 4,141 3,536 3,552 4,744 5,468
Education 4,659 7,241 7,385 6,808 6,281 6,708 6,557
Professional/Other Fields 838 1,667 1,740 1,941 2,193 2,586 2,292
Physical SciencesPhysics & Astronomy 1,461 1,339 1,108 1,080 1,274 1,692 1,431
Chemistry 1,967 1,797 1,566 1,765 1,970 2,257 2,134
Earth, Atmos., & Marine Science 507 629 646 614 740 852 824
Mathematics 1,070 1,211 769 698 859 1,118 1,085
Computer Sciencest -- -- 210 295 612 903 850
Engineering 3,265 3,147 2,490 2,913 4,543 5,822 5,337
Life SciencesBiological Sciences 3,092 3,484 3,646 3,880 4,116 5,203 5,600
Health Sciences 297 476 568 722 974 1,296 1.410
Agricultural Sciences 815 1,004 1,009 1,156 1,252 1,240 1,116
Social SciencesPsychology 1,766 2,598 3,091 3,257 3,208 3,250 3,667
Anthropology 181 379 383 335 325 384 461
Economics 708 851 802 793 898 939 927
Political ScilInternational Rel. 558 909 603 514 524 701 773
Sociology 413 645 632 515 436 525 543
Other Social Sciences 358 500 450 515 570 814 665
HumanitiesHistory 886 1,186 829 617 538 801 1,011
English Language & Literature 1,029 1,369 909 733 720 943 1,024
Foreign Language & Literature 584 887 646 492 432 594 628
Other Humanities 1,289 1,728 1,757 1,694 1,862 2,406 2,805
EducationTeacher Education 393 658 492 431 451 401 292
Teaching Fields 1,100 1,479 1,411 1,170 970 960 891
Other Education 3,166 5,104 5,482 5,207 4,860 5,347 5,374
Professional/OtherBusiness & Management 516 796 715 869 1,067 1,283 1,104
Communications 38 311 285 255 306 371 379
Other Professional Fields 189 474 717 802 766 891 781
Other Fields 95 86 23 15 54 41 28
* Includes mathematics and computer sciences.tComputer sciences first appeared on the survey form in 1978.
Source: NSF/NIH/USED/NEH/USDA/NASA, Survey of Earned Doctorates
43
52
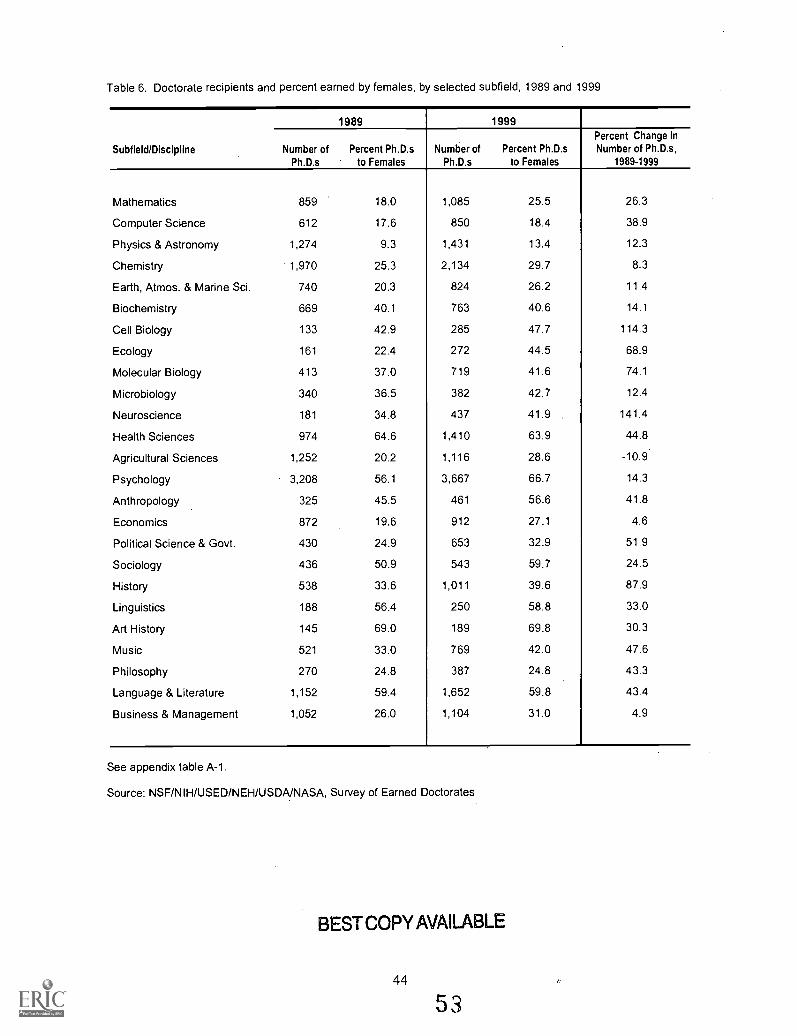
Table 6. Doctorate recipients and percent earned by females, by selected subfield, 1989 and 1999
Subfield/Discipline
1989 1999
Number ofPh.D.s
Percent Ph.D.sto Females
Number ofPh.D.s
Percent Ph.D.sto Females
Percent Change inNumber of Ph.D.s,
1989-1999
Mathematics 859 18.0 1,085 25.5 26.3
Computer Science 612 17.6 850 18.4 38.9
Physics & Astronomy 1,274 9.3 1,431 13.4 12.3
Chemistry 1,970 25.3 2,134 29.7 8.3
Earth, Atmos. & Marine Sci. 740 20.3 824 26.2 11.4
Biochemistry 669 40.1 763 40.6 14.1
Cell Biology 133 42.9 285 47.7 114.3
Ecology 161 22.4 272 44.5 68.9
Molecular Biology 413 37.0 719 41.6 74.1
Microbiology 340 36.5 382 42.7 12.4
Neuroscience 181 34.8 437 41.9 141.4
Health Sciences 974 64.6 1,410 63.9 44.8
Agricultural Sciences 1,252 20.2 1,116 28.6 -10.9
Psychology 3,208 56.1 3,667 66.7 14.3
Anthropology 325 45.5 461 56.6 41.8
Economics 872 19.6 912 27.1 4.6
Political Science & Govt. 430 24.9 653 32.9 51.9
Sociology 436 50.9 543 59.7 24.5
History 538 33.6 1,011 39.6 87.9
Linguistics 188 56.4 250 58.8 33.0
Art History 145 69.0 189 69.8 30.3
Music 521 33.0 769 42.0 47.6
Philosophy 270 24.8 387 24.8 43.3
Language & Literature 1,152 59.4 1,652 59.8 43.4
Business & Management 1,052 26.0 1,104 31.0 4.9
See appendix table A-1.
Source: NSF/NIH/USED/NEH/USDA/NASA, Survey of Earned Doctorates
BEST COPY AVAILABLE

Tab
le 7
. Num
ber
and
perc
ent o
f doc
tora
te r
ecip
ient
s, b
y se
x w
ithin
bro
ad fi
eld
for
sele
cted
yea
rs, 1
969-
1999
Fie
lds
1969
1974
1979
1984
1989
1994
%
1999
N
All
Fie
lds
Gro
up T
otal
25,7
4310
0.0
33,0
4710
0.0
31,2
3910
0.0
31,3
3710
0.0
34,3
2710
0.0
41,0
34t
100.
041
,140
$10
0.0
Mal
e22
,355
86.8
26,5
9480
.522
,302
71.4
20,6
3865
.921
,814
63.5
25,0
5961
.123
,460
57.0
Fem
ale
3,38
813
.26,
453
19.5
8,93
728
.610
,699
34.1
12,5
1336
.515
,820
38.6
17,4
9342
.5
Phy
sica
l Sci
ence
s§G
roup
Tot
al5,
005
100.
04,
976
'10
0.0
4,29
910
0.0
4,45
210
0.0
5,45
510
0.0
6,78
810
0.0
6,29
510
0.0
Mal
e4,
743
94.8
4,59
292
.33,
803
88.5
3,79
585
.24,
425
81.1
5,40
479
.64,
821
76.6
Fem
ale
262
5.2
384
7.7
496
11.5
657
14.8
1,03
018
.91,
384
20.4
1,47
423
.4
Eng
inee
ring
Gro
up T
otal
3,26
510
0.0
3,14
710
0.0
2,49
010
0.0
2,91
310
0.0
4,54
310
0.0
5,78
510
0.0
5,29
410
0.0
Mal
e3,
255
99.7
3,11
499
.02,
428
97.5
2,76
294
.84,
168
91.7
5,15
089
.04,
503
85.1
Fem
ale
100.
333
1.0
622.
515
15.
237
58.
363
511
.079
114
.9
Life
Sci
ence
sG
roup
Tot
al4,
204
100.
04,
964
100.
05,
223
100.
05,
758
100.
06,
342
100.
07,
710
100.
08,
093
100.
0M
ale
3,62
286
.24,
058
81.7
3,95
275
.73,
965
68.9
3,91
861
.84,
489
58.2
4,47
355
.3F
emal
e58
213
.890
618
.31,
271
24.3
1,79
331
.12,
424
38.2
3,22
141
.83,
620
44.7
Soc
ial S
cien
ces
Gro
up T
otal
3,98
410
0.0
5,88
210
0.0
5,96
110
0.0
5,92
910
0.0
5,96
110
0.0
6,58
510
0.0
7,01
310
0.0
Mal
e3,
317
83.3
4,50
176
.53,
969
66.6
3,50
359
.13,
265
54.8
3,31
750
.43,
194
45.5
Fem
ale
.66
716
.71,
381
23.5
1,99
233
.42,
426
40.9
2,69
645
.23,
268
49.6
3,81
954
.5
Hum
aniti
esG
roup
Tot
al3,
788
100.
05,
170
100.
04,
141
100.
03,
536
100.
03,
552
100.
04,
733
100.
05,
435
100.
0M
ale
2,93
777
.53,
594
69.5
2,54
961
.61,
947
55.1
1,93
954
.62,
470
52.2
2,77
751
.1F
emal
e85
122
.51,
576
30.5
1,59
238
.41,
589
44.9
1,61
345
.42,
263
47.8
2,65
848
.9
Edu
catio
nG
roup
Tot
al4,
659
100.
07,
241
100.
07,
385
100.
06,
808
100.
06,
281
100.
06,
699
100.
06,
540
100.
0M
ale
3,75
380
.65,
302
73.2
4,27
757
.93,
337
49.0
2,67
142
.52,
610
39.0
2,34
435
.8F
emal
e90
619
.41,
939
26.8
3,10
842
.13,
471
51.0
3,61
057
.54,
089
61.0
4,19
664
.2
Pro
fess
iona
l/Oth
erG
roup
Tot
al83
810
0.0
1,66
710
0.0
1,74
010
0.0
1,94
110
0.0
2,19
310
0.0
2,57
910
0.0
2,28
310
0.0
Mal
e72
886
.91,
433
86.0
1,32
476
.11,
329
68.5
1,42
865
.11,
619
62.8
1,34
859
.0F
emal
e11
013
.123
414
.041
623
.961
231
.576
534
.996
037
.293
541
.0
tGro
up to
tal f
or 1
994
incl
udes
155
indi
vidu
als
of u
nkno
wn
sex.
tGro
up to
tal f
or 1
999
incl
udes
187
indi
vidu
als
of u
nkno
wn
sex.
§ In
clud
es m
athe
mat
ics
and
com
pute
r sc
ienc
es.
Sou
rce:
NS
F/N
IH/U
SE
D/N
EH
/US
DA
/NA
SA
, Sur
vey
of E
arne
d D
octo
rate
s
BE
ST
CO
PY
AV
AIL
AB
LE
54JJr
r

Table 8. Number of U.S. citizen doctorate recipients, by race/ethnicity within broad field for selected years,1979-1999
Field Race/Ethnicity 1979 1984 1989 1994 1999
All Fields Group Total 25,474 24,046 23,402 27,147 27,622Known Race/Ethnicity 23,961 23,457 23,026 26,894 27,177Asian* 428 513 633 950 1,324Black 1,058 956 822 1,101 1,596Hispanic 470 534 582 884 1,109American Indiant 81 74 94 143 219White 21,924 21,380 20,895 23,816 22,929
Physical Sciences$ Group Total 3,287 3,131 3,233 3,635 3,443Known Race/Ethnicity 3,042 3,026 3,149 3,601 3,371Asian* 77 106 118 180 216Black 48 35 35 52 91
Hispanic 37 53 70 99 93American Indiant 4 7 18 10 18
White 2,876 2,825 2,908 3,260 2,953
Engineering Group Total 1,293 1,240 1,864 2,215 2,474Known Race/Ethnicity 1,189 1,195 1,821 2,187 2,415Asian* 69 95 174 202 266Black 17 12 24 44 84Hispanic 15 22 33 49 71
American Indiant 3 3 7 6 12
White 1,085 1,063 1,583 1,886 1,982
Life Sciences Group Total 4,199 4,569 4,534 4,954 5,121Known Race/Ethnicity 3,946 4,449 4,453 4,905 5,047Asian* 105 133 140 246 361
Black 62 75 77 120 178Hispanic 43 54 82 147 195American Indiant 3 12 12 24 28White 3,733 4,175 4,142 4,368 4,285
Social Sciences Group Total 5,076 4,787 4,307 4,991 5,352Known Race/Ethnicity 4,787 4,686 4,250 4,939 5,278Asian* 64 67 71 132 188
Black 189 195 170 200 311
Hispanic 88 127 130 176 278American Indiant 17 10 18 27 60White 4,429 4,287 3,861 4,404 4,441
Humanities Group Total 3,653 2,965 2,724 3,716 4,267Known Race/Ethnicity 3,437 2,886 2,668 3,682 4,188Asian* 45 28 42 68 126Black 118 95 72 102 172Hispanic 109 98 84 138 170American Indiant 10 5 7 23 25White 3,155 2,660 2,463 3,351 3,695
Education Group Total 6,572 5,917 5,246 5,864 5,429Known Race/Ethnicity 6,250 5,822 5,206 5,819 5,360Asian* 54 61 57 81 103Black 560 487 390 486 621
Hispanic 165 146 158 226 252American Indiant 40 33 25 37 60White 5,431 5,095 4,576 4,989 4,324
Professional/Other Group Total 1,394 1,437 1,494 1,772 1,536Known Race/Ethnicity 1,310 1,393 1,479 1,761 1,518Asian* 14 23 31 41 64Black 64 57 54 97 139Hispanic 13 34 25 49 50American Indiant 4 4 7 16 16White 1,215 1,275 1,362 1,558 1,249
includes Pacific Islander.tlncludes Alaskan Native.tlncludes mathematics and computer sciences.
Source: NSF/NIH/USED/NEH/USDA/NASA, Survey of Earned Doctorates
BEST COPY AVAILABLE
56

Table 9. Major field of U.S. citizen doctorate recipients by race/ethnicity, 1999
Field
TotalU.S. Citizen
Ph.D.s
Numberwith U.S. Citizens and Permanent Residents
KnownRace/
Ethnicity Asian* Black HispanicAmericanIndiant White
All Fields 27,622 27,177 1,324 1,596 1,109 219 22,929
Physical Sciences* 3,443 3,371 216 91 93 18 2,953Physics & Astronomy 761 742 36 8 13 5 680Chemistry 1,251 1,233 92 46 38 5 1,052Earth, Atmos., & Marine Science 481 468 15 11 18 6 418Mathematics 538 528 31 10 12 1 474Computer Sciences 412 400 42 16 12 1 329
Engineering 2,474 2,415 266 84 71 12 1.982
Life Sciences 5,121 5,047 361 178 195 28 4,285Biological Sciences 3,654 3,599 297 109 145 20 3,028Health Sciences 966 954 43 51 39 6 815Agricultural Sciences 501 494 21 18 11 2 442
Social Sciences 5,352 5,278 188 311 278 60 4,441Psychology 3,161 3,136 107 169 192 36 2,632Economics 400 392 19 21 17 1 334Anthropology & Sociology 766 750 26 55 33 12 624Poli. ScilInt'l Relations 573 555 17 32 21 6 479Other Social Sciences 452 445 19 34 15 5 372
Humanities 4,267 4,188 126 172 170 25 3,695History 850 825 27 28 23 4 743Amer. & Eng. Lang. & Literature 884 874 19 37 33 2 783Foreign Lang. & Lit 406 396 17 16 53 3 307Other Humanities 2,127 2,093 63 91 61 16 1,862
Education 5,429 5,360 103 621 252 60 4,324Teacher Education 244 240 5 30 8 2 195Teaching Fields 701 691 14 52 26 9 590Other Education 4,484 4,429 84 539 218 49 3,539
Professional/Other 1,536 1,518 64 139 50 16 1,249Business & Management 696 689 32 54 13 5 585Other Professional Fields 833 823 32 84 36 11 660Other Fields 7 6 1 1 4
NOTE: See technical notes in appendix C for the rate of nonresponse to the survey question on race/ethnicity.
*Asian includes Pacific Islander.tAmerican Indian includes Alaskah Native.Includes mathematics and computer sciences.
Source: NSF/NIH/USED/NEH/USDA/NASA, Survey of Earned Doctorates

Table 10. Leading doctorate-granting institutions of U.S. minority doctorate recipients, 1995-1999
InstitutionNumber of
Ph.D.sInstitution
Number ofPh.D.s
Asian* BlackUniversity of California-Berkeley 317 Nova Southeastern University 290
University of California-Los Angeles 285 Howard University 239
Stanford University 203 University of Michigan-Ann Arbor 143
Massachusetts Institute of Technology 145 Ohio State University-Main Campus 131
Harvard University 141 University of Maryland-College Park 122
University of Michigan-Ann Arbor 132 Virginia Polytechnic Institute and State Univ 122
University of Illinois at Urbana 123 Wayne State University 114
University of California-Davis 120 Teachers College at Columbia University 101
Columbia University in The City of New York 117 Florida State University 100
University of Southern California 111 Temple University 96
University of Washington 94 North Carolina State University at Raleigh 95
Purdue University-Main Campus 92 Clark Atlanta University 92
University of California-Irvine 81 University of Illinois at Urbana 92
Northwestern University 81 University of North Carolina at Chapel Hill 85
University of Pennsylvania 81 Michigan State University 83
University of Maryland-College Park 79 The University of Texas at Austin 78
New York University 79 Walden University 77
University of Wisconsin-Madison 79 University of Pennsylvania 77
The University of Texas at Austin 77 University of California-Los Angeles 76
University of California-San Diego 74 University of South Carolina at Columbia 76
Top 20 Institutions 2,511 Top 20 Institutions 2,289
Total Institutions Reported (318) 6,039 Total Institutions Reported (314) 7,048
Hispanic American IndiantThe University of Texas at Austin 189 Oklahoma State University-Main Campus 29
University of Puerto Rico-Rio Piedras Campus 162 University of Oklahoma Norman Campus 26
University of California-Berkeley 152 University of California-Los Angeles 18
Carlos Albizu University-San Juan Campus 143 Pennsylvania State University-Main Campus 18
University of California-Los Angeles 118 University of Washington 18
Texas A & M University 105 University of Arkansas at Fayetteville 17
Arizona State University-Main Campus 84 University of Michigan-Ann Arbor 15
Harvard University 84 Stanford University 15
University of Michigan-Ann Arbor 79 University of Arizona 14
Stanford University 79 University of Minnesota-Twin Cities 13
University of New Mexico-Main Campus 77 North Carolina State University at Raleigh 13
University of Arizona 76 The University of Texas at Austin 13
University of Southern California 72 University of Georgia 12
University of Miami 72 Nova Southeastern University 11
Pennsylvania State University-Main Campus 70 University of Maryland-College Park 11
University of Wisconsin-Madison 67 University of New Mexico-Main Campus 11
University of California-Davis 66 University of North Dakota-Main Campus 11
Nova Southeastern University 63 University of Wisconsin-Madison 11
New York University 62 Arizona State University-Main Campus 10
University of California-Santa Barbara 58 University of California-Berkeley 10
University of Florida 58 University of California-Santa Barbara' 10
Michigan State University 10
Ohio State University 10
Purdue University 10
Top 20 Institutions 1,936 Top 20 Institutions 909
Total Institutions Reported (310) 5,218 Total Institutions Reported (225) 336
*Includes Pacific Islander.tlncludes Alaskan Native.
SOURCE: NSF/NIH/USED/NEH/USDA/NASA, Survey of Earned Doctorates
48 rJ8BEST COPY AVAILABLE

Table 11. Citizenship status of doctorate recipients by broad field for selected years, 1969-1999
Field/Citizenship 1969 1974 1979 1984 1989 1994 1999
Total 25,743 33,047 31,239 31,337 34,327 41,034 41,140
All FieldsU.S. Citizen 21,542 26,380 25,474 24,046 23,402 27,147 27,622
Non-U.S., Permanent Visa 1,235 1,826 1,320 1,224 1,626 3,747 2,300
Non-U.S., Temporary Visa 2,334 3,359 3,587 4,832 6,648 9,406 9,068
Unknown 632 1,482 858 1,235 2,651 734 2,150
Physical Sciences*U.S. Citizen 4,115 3,676 3,287 3,131 3,233 3,635 3,443
Non-U.S., Permanent Visa 252 375 262 197 269 967 429
Non-U.S., Temporary Visa 527 738 667 991 1,536 2,095 2,146
Unknown 111 187 83 133 417 125 306
EngineeringU.S. Citizen 2,387 1,757 1,293 1,240 1,864 2,215 2,474
Non-U.S., Permanent Visa 349 515 322 274 365 838 399
Non-U.S:, Temporary Visa 460 704 815 1,269 1,940 2,653 2,193
Unknown 69 171 60 130 374 116 271
Life SciencesU.S. Citizen 3,334 3,693 4,199 4,569 4,534 4,954 5,121
Non-U.S., Permanent Visa 200 320 208 193 264 871 605
Non-U.S., Temporary Visa 617 727 683 821 1,152 1,832 2,109
Unknown 53 224 133 175 392 82 291
Social SciencesU.S. Citizen 3,400 4,869 5,076 4,787 4,307 4,991 5,352
Non-U.S., Permanent Visa 159 213 181 194 227 392 258
Non-U.S., Temporary Visa 327 520 506 635 824 1,046 969
Unknown 98 280 198 313 603 184 457
HumanitiesU.S. Citizen 3,373 4,524 3,653 2,965 2,724 3,716 4,267
Non-U.S., Permanent Visa 167 224 157 145 210 316 309
Non-U.S., Temporary Visa 140 216 200 252 346 630 640
Unknown 108 206 131 174 272 82 252
EducationU.S. Citizen 4,266 6,568 6,572 5,917 5,246 5,864 5,429
Non-U.S., Permanent Visa 70 102 117 130 164 199 180
Non-U.S., Temporary Visa 191 302 481 540 452 537 519
Unknown 132 269 215 221 419 108 429
Professional/OtherU.S. Citizen 667 1,293 1,394 1,437 1,494 1,772 1.536
Non-U.S., Permanent Visa 38 77 73 91 127 164 120
Non-U.S., Temporary Visa 72 152 235 324 398 613 492
Unknown 61 145 38 89 174 37 144
*Includes mathematics and computer sciences.
Source: NSF/NIH/USED/NEH/USDA/NASA, Survey of Earned Doctorates
49
59

Table 12. Top 30 countries of origin of non-U.S. citizens earning doctorates at U.S. colleges and universities, 1999(ranked by number of earned doctorates)
CountryNumber
of Ph.D.s CountryNumber of
Ph.D.s
1. China, Peoples Republic of 2,400 16. Iran 103
2. India 1,077 17. Italy 102
3. Korea 1,017 18. Romania 101
4. China, Republic of (Taiwan) 981 19. Spain 100
5. Canada 473 20. Jordan 84
6. Germany 266 21. Venezuela 80
7. Japan 238 22. Australia 75
8. Russia 231 23. Egypt 73
9. Turkey 224 24.. Saudi Arabia 71
10. Great Britain, UK 215 25. Yugoslavia 67
11. Brazil 205 25. Hong Kong 67
12. Mexico 191 25. Pakistan 67
13. Thailand 181 28. Indonesia 64
14. Greece 117 28. Argentina 64
15. France 110 30. Malaysia 63
Top 30 9,107Non-U.S. Citizens Earning Ph.D.s 11,368
SOURCE: NSF/NIH/USED/NEH/USDA/NASA, Survey of Earned Doctorates
50
GO

Table 13. Leading doctorate-granting institutions of non-U.S. citizen doctorate recipients, 1999 (ranked by number of earneddoctorates)
InstitutionNumber of
Ph.D.s InstitutionNumber
of Ph.D.s
University of Illinois at Urbana 243 University of Southern California 179
Ohio State University-Main Campus 237 University of Florida 175
The University of Texas at Austin 230 University of Maryland-College Park 173
Purdue University-Main Campus 221 Stanford University 169
University of Wisconsin-Madison 212 University of California-Berkeley 157
University of Minnesota-Twin Cities 204 Columbia University in The City of New York 155
Texas A & M University 199 Michigan State University 151
University of Michigan-Ann Arbor 192 Rutgers University-New Brunswick 149
Cornell University-Endowed Colleges 188 University of California-Los Angeles 142
Pennsylvania State Univ-Main Campus 182 Harvard University 130
Top 20 institutions 3,688
Total Institutions Reported (392) 11,368
SOURCE: NSF/NIH/USED/NEH/USDA/NASA, Survey of Earned Doctorates
Table 14. Leading doctorate-granting institutions of non-U.S. citizen doctorate recipients, 1999 (ranked by percentage of earneddoctorates*)
Institution Percent ofPh.D.st Institution
Percent ofPh.D.st
New Jersey Institute of Technology 79.5 SUNY At Buffalo 48.0
Stevens Institute of Technology 72.2 Iowa State University 47.9
Clarkson University 68.4 Purdue University-Main Campus 47.2
Rockefeller University 61.1 Carnegie Mellon University 46.9
Illinois Institute of Technology 60.9 Oregon State University 46.3
Polytechnic University 60.7 Northeastern University 46.3
Michigan Technological University 58.3 North Dakota State University Main Campus 46.2
University of Missouri-Rolla 56.8 University of Maryland-Baltimore County 45.6
Rutgers University-Newark 54.3 Mississippi State University 45.5
University of Massachusetts-Lowell 50.0 University of Akron Main Campus 45.4
*The ranking excludes institutions with fewer than 10 non-U.S. citizen doctorate recipients.tThe percent column is based on the number of non-U.S. citizens as a percentage of the total doctorates awarded by thatinstitution.
Source: NSF/NIH/USED/NEH/USDA/NASA, Survey of Earned Doctorates
51
61

Table 15. Parental educational attainment of 1999 doctorate recipients
Percent HighSchool or Less
PercentCollege
PercentAdvanced
DegreeTotal
PercentTotal
NumberTotal
Father's Education 31.0 34.5 34.5 100.0 37,133Mother's Education 40.4 39.4 20.2 100.0 37,251
SexMale
Father's Education 31.4 34.5 34.1 100.0 21.313Mother's Education 42.2 38.4 19.4 100.0 21,375
FemaleFather's Education 30.5 34.6 34.9 100.0 15,818Mother's Education 37.8 40.9 21.3 100.0 15,874
Race/Ethnicity (U.S. citizens only)Asian*
Father's Education 23.1 31.8 45.0 100.0 1,270Mother's Education 35.6 38.4 26.0 100.0 1,274
BlackFather's Education 54.6 27.2 18.2 100.0 1,476Mother's Education 49.2 32.2 18.6 100.0 1,507
HispanicFather's Education 45.8 27.3 26.9 100.0 1,012Mother's Education 53.0 31.9 15.1 100.0 1,021
American IndiantFather's Education 54.1 26.0 19.9 100.0 196
Mother's Education 53.8 32.2 14.1 100.0 199White
Father's Education 26.6 34.4 39.0 100.0 22,125Mother's Education 33.0 43.8 23.1 100.0 22,180
CitizenshipU.S. Citizen
Father's Education 28.9 33.5 37.6 100.0 26,419Mother's Education 35.0 42.4 22.7 100.0 26,523
Non-U.S., Permanent VisaFather's Education 35.9 35.3 28.8 100.0 2,197Mother's Education 49.8 33.7 16.6 100.0 2,199
Non-U.S., Temporary VisaFather's Education 36.5 37.3 26.2 100.0 8,471Mother's Education 54.8 31.8 13.4 100.0 8,483
Broad Field of StudyPhysical Sciences*
Father's Education 25.6 35.6 38.8 100.0 5,758Mother's Education 35.6 40.8 23.6 100.0 5,779
EngineeringFather's Education 26.6 40.1 33.3 100.0 4,843Mother's Education 41.8 39.6 18.6 100.0 4,849
Life SciencesFather's Education 29.1 35.6 35.3 100.0 7,515Mother's Education 38.7 40.9 20.3 100.0 7.529
Social SciencesFather's Education 28.0 34.0 38.0 100.0 6,228Mother's Education 35.6 41.0 23.4 100.0 6,239
HumanitiesFather's Education 25.4 31.4 43.2 100.0 4,962Mother's Education 32.8 41.8 25.4 100.0 4,992
EducationFather's Education 49.0 30.0 21.1 100.0 5,827Mother's Education 55.2 33.1 11.7 100.0 5,857
Professional/Other FieldsFather's Education 35.8 36.2 28.1 100.0 2,000Mother's Education 46.9 37.4 15.8 100.0 2,006
*Includes Pacific Islander.1-Includes Alaskan Native.*Includes mathematics and computer sciences.
Source: NSF/NIH/USED/NEH/USDA/NASA, Survey of Earned Doctorates
52

Table 16. Median number of years from baccalaureate to doctorate award by broad field for selectedyears, 1974-1999
Field 1974 1979 1984 1989 1994 1999
All FieldsTotal 8.6 9.1 10.0 10.6 10.8 10.4
Registered 6.0 6.2 6.9 7.0 7.2 7.3
Physical Sciences*Total 6.9 6.9 7.3 7.5 8.5 8.0
Registered 5.7 5.9 6.0 6.2 6.7 6.8
EngineeringTotal 7.7 7.6 8.0 8.2 9.0 8.7
Registered 5.7 5.7 5.9 6.1 6.4 6.6
Life SciencesTotal 7.3 7.4 8.3 9.2 9.5 9.0
Registered 5.6 5.9 6.3 6.7 7.0 7.0
Social SciencesTotal 7.9 8.5 9.8 10.5 10.4 9.9
Registered 5.9 6.3 7.1 7.5 7.5 7.5
HumanitiesTotal 9.4 10.3 11.6 12.6 12.0 11.7
Registered 6.7 7.6 8.3 8.5 8.5 8.9
EducationTotal 12.5 12.9 14.8 17.3 19.7 19.9
Registered 6.3 6.7 7.7 8.2 8.1 8.2
Professional/OtherTotal 10.0 10.9 12.3 13.3 13.5 14.0
Registered 6.0 6.3 7.2 7.6 7.5 8.0
"'Includes mathematics and computer sciences.
Source: NSF/NIH/USED/NEH/USDA/NASA, Survey of Earned Doctorates

Table 17. Median number of years from baccalaureate to doctorate award, by demographic group and broad field, 1999
All PhysicalFields Sciences*
Elapsed Time from Baccalaureate (years)
EngineeringLife
SciencesSocial
Sciences Humanities EducationProf./Other
All Ph.D.s 10.4 8.0 8.7 9.0 9.9 11.7 19.9 14.0
SexMale 10.0 8.0 8.9 9.0 10.0 11.8 18.3 13.6
Female 11.3 7.9 8.0 9.0 9.8 11.6 20.5 14.8
CitizenshipU.S. Citizen 10.7 7.2 8.0 8.5 9.7 11.8 20.9 15.4
Non-U.S., Permanent Visa 11.4 10.1 10.6 11.0 11.8 12.2 15.0 13.0
Non-U.S., Temporary Visa 9.8 8.9 9.1 9.9 10.0 11.0 13.0 11.0
Race/Ethnicity (U.S. citizens only)Asiant 8.5 7.6 7.6 7.9 9.0 11.0 15.0 12.8
Black 13.7 7.9 9.3 10.0 9.9 12.2 21.6 16.0
Hispanic 11.2 8.0 7.9 8.9 9.7 11.7 18.8 14.5
American Indian$ 13.0 9.6 10.7 10.0 10.0 14.9 20.5 19.3
White 10.6 7.0 , 8.0 8.5 9.7 11.7 21.0 15.5
Registered Time from Baccalaureate (years)
All Ph.D.s 7.3 6.8 6.6 7.0 7.5 8.9 8.2 8.0
SexMale 7.3 6.8 6.7 7.0 7.6 8.9 8.1 8.0
Female 7.6 6.6 6.3 7.0 7.5 8.9 8.2 8.0
CitizenshipU.S. Citizen 7.5 6.6 6.5 7.0 7.5 9.0 8.4 8.1
Non-U.S., Permanent Visa 8.0 7.5 7.5 7.8 8.2 9.4 8.0 8.8
Non-U.S., Temporary Visa 7.0 7.0 6.6 7.0 7.5 8.1 6.9 7.5
Race/Ethnicity (U.S. citizens only)Asiant 7.0 7.0 6.7 6.6 7.2 9.0 7.6 8.0
Black 7.9 6.8 7.0 7.6 7.4 8.9 8.0 7.6
Hispanic 7.9 7.3 6.7 7.3 7.6 8.5 9.0 8.1
American Indian$ 8.2 6.8 8.9 8.0 8.0 10.0 9.0 8.9
White 7.5 6.5 6.5 6.9 7.5 9.0 8.4 8.2
*Includes mathematics and computer sciences.tIncludes Pacific Islander.tIncludes Alaskan Native.
Source: NSF /NIH /USED /N EH /USDA/NASA, Survey of Earned Doctorates

Table 18. Distribution of 1999 doctorate recipients by age at doctorate
Medianage
Field of Study Doctorate
Age Grouping
at21-25 26-30 31-35 36-40 41-45 Over 45
All Fields 33.8 241 12,466 11,214 5,906 3,731 5,489
Broad FieldPhysical Sciences* 30.7 88 3,074 1,761 654 265 143
Engineering 31.4 68 2,211 1,649 739 216 132
Life Sciences 32.1 36 3,140 2,470 1,079 579 512
Social Sciences 33.2 27 2,216 2,026 988 610 747
Humanities 35.1 7 1,084 1,751 1,035 589 738Education 44.3 8 436 963 976 1,145 2,762Prof/Other Fields 37.5 7 305 594 435 327 455
SexMale 33.2 166 7,559 7,026 3,579 1,955 2,092Female 34.7 75 4,905 4,187 2,327 1,776 3,397
CitizenshipU.S. Citizen 34.2 137 8,858 6,697 3,854 2,900 4,936Permanent Visa 34.6 11 492 885 510 233 147
Temporary Visa 32.7 86 3,034 3,557 1,476 545 250Unknown 40.0 7 82 75 66 53 156
Race/Ethnicity (U.S. citizens only)Asiant 31.1 15 619 347 160 73 90Black 38.6 8 341 308 234 220 468Hispanic 35.1 2 312 277 179 144 183
American Indiant 39.7 0 36 49 36 34 61
White 34.1 108 7,444 5,628 3,192 2,385 4,062
*Includes mathematics and computer sciences.tlncludes Pacific Islander.tIncludes Alaskan Native.
Source: NSF/NIN/USED/NEH/USDA/NASA, Survey of Earned Doctorates

Table 19. Primary sources of financial support for doctorate recipients by broad field and demographic group, 1999 (includes onlydoctorate recipients who reported primary source of support)
Primary Source of Support Total
Sex
Male FemaleU.S.
Citizen
CitizenshipPermanent
VisaTemporary
Visa Asian*
U.S Citizens and Permanent ResidentsAmerican
Black Hispanic Indiant While
All Fields N 36,934 21,241 15,690 26,322 2,157 8,391 1,253 1,486 1,003 198 22,020
Teaching Assistantships % 17.4 18.1 16.5 16.0 21.3 20.7 14.0 7.5 12.3 9.6 17.0
Research Assistantships/Traineeships % 25.2 30.2 18.4 19.6 33.7 40.6 31.8 7.9 12.4 16.2 20.1
Fellowships/Dissertation Grants % 18.3 17.9 18.8 18.8 17.2 17.0 27.1 29.9 30.1 24.7 16.9
Own Resources % 32.6 26.1 41.2 40.6 22.1 10.2 22.7 48.6 40.7 44.4 41.0
Foreign Government % 2.7 3.5 1.6 0.2 3.2 10.3 1.1 0.3 0.6 1.5 0.1
Employer % 3.3 3.6 3.0 4.1 2.3 1.1 2.7 4.8 3.9 2.5 4.2
Other % 0.5 0.6 0.5 0.7 0.3 0.1 0.6 1.0 0.1 1.0 0.7
Physical Sciences* N 5,769 4,405 1,363 3,323 409 2,019 206 85 90 14 2,866
Teaching Assistantships % 27.7 27.9 27.1 24.4 33.0 32.1 22.8 12.9 16.7 21.4 25.2
Research Assistantships/Traineeships % 43.0 44.3 38.7 40.5 43.8 46.8 47.6 25.9 24.4 57.1 40.8
Fellowships/Dissertation Grants % 14.9 13.5 19.4 18.0 11.0 10.6 18.0 41.2 38.9 7.1 16.7
Own Resources % 9.7 9.1 11.4 13.8 8.3 3.3 6.8 15.3 14.4 14.3 14.1
Foreign Government % 2.5 2.7 2.0 0.1 1.5 6.6 0.5 0.0 1.1 0.0 0.1
Employer % 2.0 2.2 1.4 3.0 2.4 0.4 4.4 4.7 4.4 0.0 2.8
Other % 0.2 0.2 0.0 0.2 0.0 0.1 0.0 0.0 0.0 0.0 0.3
Engineering N 4,833 4,112 720 2,382 382 2,061 252 80 65 12 1,919
Teaching Assistantships % 8.8 8.9 8.2 7.1 11.0 10.6 9.5 5.0 7.7 0.0 6.9
Research Assistantships/Traineeships % 51.9 51.9 51.8 44.1 55.5 60.2 53.6 18.8 29.2 25.0 44.7
Fellowships/Dissertation Grants % 15.7 14.2 24.6 22.6 9.9 8.7 19.0 56.3 36.9 25.0 21.0
Own Resources % 12.6 13.2 9.2 16.9 13.4 7.5 11.5 15.0 20.0 25.0 17.7
Foreign Government % 5.4 5.8 3.1 0.2 5.8 11.2 0.8 0.0 0.0 8.3 0.1
Employer % 5.2 5.5 3.2 8.3 4.5 1.8 5.2 , 5.0 6.2 16.7 8.8
Other % 0.4 0.5 0.0 0.8 0.0 0.1 0.4 0.0 0.0 0.0 0.7
Life Sciences N 7,459 4,111 3,348 4,926 574 1,947 345 167 183 28 4,145
Teaching Assistantships % 10.6 11.8 9.1 10.2 12.4 11.1 5.8 7.8 7.7 0.0 10.8
Research Assistantships/Traineeships % 38.0 40.2 35.2 32.8 46.2 48.4 34.5 16.8 23.0 32.1 34.1
Fellowships/Dissertation Grants % 28.0 26.8 29.5 30.7 24.4 22.7 44.1 47.9 48.1 35.7 27.9
Own Resources % 17.4 14.7 20.7 22.2 13.9 5.9 11.6 23.4 17.5 28.6 23.2
Foreign Government % 3.2 3.7 2.4 0.3 1.0 10.8 1.2 0.0 1.1 3.6 0.2
Employer % 2.3 2.2 2.5 3.0 1.2 0.8 1.4 2.4 2.2 0.0 3.3
Other % 0.5 0.6 0.5 0.6 0.9 0.2 1.4 1.8 0.5 0.0 0.5
Social Sciences N 6,180 2,827 3,353 5,036 240 896 178 294 232 53 4,218
Teaching Assistantships % 19.2 21.0 17.6 17.3 22.9 28.9 18.5 9.2 12.5 9.4 18.1
Research Assistantships/Traineeships % 13.8 13.4 14.1 13.8 14.6 13.3 12.9 8.8 10.8 9.4 14.5
Fellowships/Dissertation Grants % 19.0 20.6 17.7 17.5 22.1 26.4 21.9 36.1 29.3 32.1 15.3
Own Resources % 43.8 39.1 47.7 49.0 36.3 15.8 44.9 42.5 45.3 45.3 49.9
Foreign Government % 2.4 3.6 1.3 0.2 3.8 14.5 0.6 0.0 0.9 1.9 0.1
Employer % 1.4 1.9 0.9 1.5 0.4 1.1 1.1 3.1 1.3 0.0 1.4
Other % 0.5 0.4 0.6 0.6 0.0 0.0 0.0 0.3 0.0 1.9 0.7
Humanities N 4,942 2,532 2,410 4,065 286 583 119 159 157 22 3,550
Teaching Assistantships % 32.8 30.5 35.2 31.7 38.5 37.5 28.6 13.2 31.8 40.9 32.7
Research Assistantships/Traineeships % 1.2 1.3 1.2 1.2 0.7 2.0 1.7 1.3 0.6 0.0 1.2
Fellowships/Dissertation Grants % 23.5 24.2 22.8 22.6 21.7 30.9 29.4 46.5 23.6 27.3 21.2
Own Resources % 39.4 40.2 38.6 42.5 33.2 21.1 37.0 33.3 40.8 31.8 43.0
Foreign Government % 1.3 1.7 0.9 0.2 4.2 7.4 3.4 0.6 0.6 0.0 0.1
Employer % 1.3 1.6 1.0 1.4 1.7 0.5 0.0 3.1 2.5 0.0 1.4
Other % 0.4 0.6 0.2 0.4 0.0 0.5 0.0 1.9 0.0 0.0 0.4
Education N 5,753 2,069 3,683 5,140 158 449 93 573 227 53 4,139
Teaching Assistantships % 7.1 7.4 6.9 6.2 12.7 15.5 3.2 3.5 3.5 3.8 6.7
Research Assistantships/Traineeships % 6.5 7.1 6.2 5.3 12.0 18.1 14.0 3.5 4.8 11.3 5.3
Fellowships/Dissertation Grants % 7.3 6.9 7.5 6.5 11.4 15.7 19.4 11.9 15.0 15.1 4.8
Own Resources % 69.2 66.3 70.8 72.7 55.1 33.1 57.0. 72.1 69.2 64.2 73.5
Foreign Government % 1.3 2.0 1.0 0.1 3.8 14.8 2.2 0.3 0.0 0.0 0.0
Employer % 7.7 8.9 7.0 8.2 4.4 2.9 4.3 7.3 7.5 3.8 8.6
Other % 1.0 1.4 0.7 1.1 0.6 0.0 0.0 1.4 0.0 1.9 1.1
Prof/Other Fields N 1,998 1,185 813 1,450 108 436 60 128 49 16 1,183
Teaching Assistantships % 20.2 20.1 20.3 18.0 24.1 26.8 23.3 11.7 4.1 0.0 19.3
Research Assistantships/Traineeships % 10.5 11.0 9.7 9.0 13.0 14.6 13.3 3.9 8.2 6.3 9.4
Fellowships/Dissertation Grants % 14.0 15.5 11.8 11.2 14.8 22.8 18.3 28.1 32.7 25.0 7.8
Own Resources % 46.5 43.0 51.7 54.6 38.9 21.4 41.7 52.3 49.0 62.5 55.6
Foreign Government % 3.1 3.9 2.0 0.2 6.5 12.2 0.0 0.8 0.0 0.0 0.2
Employer % 4.9 5.6 3.8 6.0 1.9 1.9 1.7 3.1 6.1 6.3 6.6
Other % 0.9 0.9 0.7 1.0 0.9 0.2 1.7 0.0 0.0 0.0 1.2
*Includes Pacific Islander.*Includes Alaskan Native.*Includes mathematics and computer sciences
SOURCE: NSF/NIH/USED/NEH/USDA/NASA, Survey of Earned Doctorates
BEST COPY AVM
56
66
, BCE

Tab
le 2
0. C
umul
ativ
e de
bt r
elat
ed to
edu
catio
n of
doc
tora
te r
ecip
ient
s, b
y br
oad
field
, 199
9
Cum
ulat
ive
Deb
t
Gro
up T
otal
N%
Phy
sica
lS
cien
ces*
N%
Eng
inee
ring
N%
Life
Sci
ence
s
N%
Soc
ial S
cien
ces
N%
Hum
aniti
es
N%
Edu
catio
n
N%
Pro
fess
iona
l/O
ther
N
Tot
al37
,188
100.
05,
770
100.
04,
845
100.
07,
524
100.
06,
223
100.
04,
990
100.
05,
833
100.
02,
003
100.
0
$5,0
00 o
r le
ss3,
561
9.6
626
10.8
497
10.3
801
10.6
484
7.8
462
9.3
533
9.1
158
7.9
$5,0
01-$
10,0
002,
946
7.9
482
8.4
332
6.9
637
8.5
471
7.6
462
9.3
400
6.9
162
8.1
$10,
001-
$15,
000
2,40
26.
536
76.
426
75.
553
27.
143
26.
938
57.
731
75.
410
25.
1
$15,
001-
$20,
000
1,94
55.
223
24.
017
33.
639
25.
243
06.
933
26.
726
74.
611
95.
9
$20,
001-
$25,
000
1,53
44.
117
13.
014
63.
028
03.
734
35.
527
85.
623
34.
083
4.1
$25,
001-
$30,
000
1,30
93.
514
02.
491
1.9
230
3.1
338
5.4
238
4.8
189
3.2
834.
1
$30,
000+
4,94
613
.335
76.
238
17.
976
710
.21,
515
24.3
774
15.5
799
13.7
353
17.6
No
Deb
t18
,545
49.9
3,39
558
.82,
958
61.1
3,88
551
.62,
210
35.5
2,05
941
.33,
095
53.1
943
47.1
*Inc
lude
s m
athe
mat
ics
and
com
pute
r sc
ienc
es
SO
UR
CE
: NS
F/N
IH/U
SE
D/N
EH
/US
DA
/NA
SA
, Sur
vey
of E
arne
d D
octo
rate
s
Tab
le 2
1. C
umul
ativ
e de
bt r
elat
ed to
edu
catio
n of
doc
tora
te r
ecip
ient
s, b
y de
mog
raph
ic g
roup
, 199
9
Mal
eF
emal
eU
.S. C
itize
n
Citi
zens
hip
Per
m. R
esid
ent
Tem
p. R
esid
ent
Asi
an*
Bla
ckU.S
. Citi
zens
and
Per
man
ent R
esid
ents
Am
eric
an.
His
pani
cIn
dian
tW
hite
Cum
ulat
ive
Deb
tN
OA
N%
N%
N%
N%
N%
N%
N%
N%
N
$5,0
00 O
R L
ES
S2,
128
10.0
1,43
39.
12,
504
9.4
212
9.7
837
10.0
116
9.2
168
11.1
112
11.0
2110
.42;
046
9.2
$5,0
01-$
10,0
001,
688
7.9
1,25
87.
92,
292
8.6
147
6.7
503
6.0
125
9.9
117
7.7
828.
017
8.4
1,91
38.
6
$10,
001-
$15,
000
1,36
66.
41,
036
6.5
1,98
87.
510
34.
730
63.
611
08.
711
17.
381
7.9
136.
41,
638
7.4
515,
001-
520,
000
1,11
35.
283
25.
31,
663
6.3
803.
719
82.
465
5.1
108
7.1
727.
110
5.0
1,39
46.
3
$20,
001-
$25,
000
853
4.0
681
4.3
1,32
55.
063
2.9
144
1.7
574.
510
97.
255
5.4
136.
41,
079
4.9
$25,
001-
530,
000
726
3.4
583
3.7
1,14
34.
348
2.2
116
1.4
463.
688
5.8
525.
112
5.9
931
4.2
530,
000+
2,59
012
.12,
356
14.9
4,16
015
.717
58.
060
67.
215
212
.040
126
.520
820
.448
23.8
3,30
114
.9
No
Deb
t10
,889
51.0
7,65
348
.311
,457
43.2
1,36
062
.25,
694
67.8
594
47.0
412
27.2
359
35.2
6833
.79,
867
44.5
'Incl
udes
Pac
ific
Isla
nder
s.t I
nclu
des
Ala
skan
Nat
ive.
SO
UR
CE
: NS
F/N
IH/U
SE
D/N
EH
/US
DA
/NA
SA
, Sur
vey
of E
arne
d D
octo
rate
s
5768

Table 22. Postgraduation status of doctorate recipients by broad field for selected years, 1979-1999
AllFields
PhysicalSciences*
Engi-neering
LifeSciences
SocialSciences
Human-ities
Education
Prof./Other
Total1979 N 31,239 4,299 2,490 5,223 5,961 4,141 7,385 1,7401984 N 31,337 4,452 2,913 5,758 5,929 3,536 6,808 1,941
1989 N 34,327 5,455 4,543 6,342 5,961 3,552 6,281 2.1931994 N 41,034 6,822 5,822 7,739 6,613 4,744 6,708 2,5861999 N 41,140 6,324 5,337 8,126 7,036 5,468 6,557 2,292
Total Responses to Postgraduation Status1979 N 29,039 4,066 2,316 4,894 5,517 3,778 6,833 1,6351984 N 28,408 4,082 2,553 5,205 5,314 3,178 6,334 1,7421989 N 30,766 4,889 3,956 5,803 5,235 3,215 5,715 1,9531994 N 37,640 6,312 5,288 7,144 6,017 *4,430 6,075 2,3741999 N 37,138 5,766 4,846 7,512 6,230 4,973 5,801 2,010
Definite Commitments for Employment or Study1979 % 73.7 78.6 78.4 77.8 72.5 60.3 72.2 84.41984 % 73.2 77.1 71.8 75.7 69.4 62.7 74.9 82.71989 % 74.2 76.8 67.6 78.2 72.0 67.7 75.7 80.61994 % 66.3 64.6 55.9 71.7 66.5 58.3 73.3 73.71999 % 69.9 72.7 67.6 72.6 67.7 60.6 74.1 75.6
Seeking Employment or Study1979 % 26.3 21.4 21.6 22.2 27.5 39.7 27.8 15.6
1984 % 26.8 22.9 28.2 24.3 30.6 37.3 25.1 17.3
1989 % 25.8 23.2 32.4 21.8 28.0 32.3 24.3 19.4
1994 % 33.7 35.4 44.1 28.3 33.5 41.7 26.7 26.31999 % 30.1 27.3 32.4 27.4 32.3 39.4 25.9 24.4
NOTE: Percentages are based on the number of doctorate recipients who reported their postgraduation status (definiteor seeking), regardless of plans (employment or study). See technical notes in appendix C for rates of nonresponse tothe applicable questions and for further explanation of postgraduation plans.
*Includes mathematics and computer sciences.
SOURCE: NSF/NIH/USED/NEH/USDA/NASA, Survey of Earned Doctorates

Tab
le 2
3. P
ostg
radu
atio
n st
atus
of d
octo
rate
rec
ipie
nts
by d
emog
raph
ic g
roup
for
sele
cted
yea
rs, 1
979-
1999
Tot
al
Sex
Men
Wom
enU
.S.
Citi
zens
Citi
zens
hip
Per
m V
isa
Tem
p V
isa
Asi
an*
U.S
. Citi
zens
and
Per
man
ent R
esid
ents
Am
eric
anB
lack
His
pani
cIn
dian
**W
hite
Tot
al 1979
N31
,239
22,3
028,
937
25,4
741,
320
3,58
71,
102
1,11
654
781
22,4
0019
84N
31,3
3720
,638
10,6
9924
,046
1,22
44,
832
1,02
31,
058
605
7421
,894
1989
N34
,327
21,8
1412
,513
23,4
021,
626
6,64
81,
268
963
694
9421
,571
1994
N41
,034
25,0
5915
,820
27,1
473,
747
9,40
63,
546
1,27
91,
030
143
24,5
9519
99N
41,1
4023
,460
17,4
9327
,622
2,30
08,
726
2,51
81,
729
1,24
621
923
,725
Tot
al R
espo
nses
to P
ostg
radu
atio
n S
tatu
s19
79N
29,0
3920
,759
8,28
024
,458
1,22
43,
318
1,04
71,
045
512
7921
,832
1984
N28
,408
18,6
149,
794
22,9
121,
143
4,31
294
699
757
967
21,0
8519
89N
30,7
6619
,383
11,3
8322
,936
1,52
96,
251
1,19
092
466
991
21,2
0119
94N
37,6
4023
,069
14,5
6425
,644
3,40
58,
569
3,22
41,
171
963
134
23,3
7719
99N
37,1
3821
,350
15,7
8526
,482
2,17
68,
095
2,39
71,
623
1,14
920
022
,887
Def
inite
Com
mitm
ents
for
Em
ploy
men
t or
Stu
dy19
79%
73.7
76.1
67.9
74.2
67.0
73.0
68.7
66.5
68.0
67.1
74.6
1984
%73
.275
.169
.574
.660
.069
.165
.468
.367
.265
.774
.819
89%
74.2
74.7
73.2
76.8
62.0
67.6
68.0
70.3
73.7
73.6
76.7
1994
%66
.365
.068
.370
.753
.258
.255
.768
.369
.570
.970
.519
99%
69.9
71.0
68.5
71.4
64.9
66.9
66.5
66.8
68.8
64.0
72.0
See
king
Em
ploy
men
t or
Stu
dy19
79%
26.3
23.9
32.1
25.8
33.0
27.0
31.3
33.5
32.0
32.9
25.4
1984
%26
.824
.930
.525
.440
.030
.934
.631
.732
.834
.325
.219
89%
25.8
25.3
26.8
23.2
38.0
32.4
32.0
29.7
26.3
26.4
23.3
1994
%33
.735
.031
.729
.346
.841
.844
.331
.730
.529
.129
.519
99%
30.1
29.0
31.5
28.6
35.1
33.1
33.5
33.2
31.2
36.0
28.0
NO
TE
: Per
cent
ages
are
bas
ed o
n th
e nu
mbe
r of
doc
tora
te r
ecip
ient
s w
ho r
epor
ted
thei
r po
stgr
adua
tion
stat
us (
defin
ite o
r se
ekin
g), r
egar
dles
s of
pla
ns(e
mpl
oym
ent o
r st
udy)
.S
ee te
chni
cal n
otes
in a
ppen
dix
C fo
r ra
tes
of n
onre
spon
se to
the
appl
icab
le q
uest
ions
and
for
furt
her
expl
anat
ion
of p
ostg
radu
atio
n pl
ans.
tlncl
udes
Pac
ific
Isla
nder
.tIn
clud
es A
lask
an N
ativ
e.
SO
UR
CE
: NS
F/N
IH/U
SE
D/N
EH
/US
DA
/NA
SA
, Sur
vey
of E
arne
d D
octo
rate
s
7059
71

Table 24. Postgraduation commitments of doctorate recipients by type of plans and broad field for selected years, 1979-1999
Physical
All Fields Sciences* Engineering
Life
Sciences
Social
Sciences Humanities EducationProf./Other
All Definite Commitments
1979 N 21,411 3,196 1,815 3,807 3,999 2,279 4,935 1,380
1984 N 20,789 3,148 1,833 3,939 3,689 1,994 4,746 1,440
1989 N 22,815 3,756 2,675 4,537 3,768 2,176 4,329 1,574
1994 N 24,945 4,079 2,957 5,120 4,001 2,583 4,455 1,750
1999 N 25,975 4,190 3,277 5,456 4,217 3,015 4,301 1,519
Definite Commitments with Responses to Type of Plans
1979 N 21,228 3,185 1,809 3,782 3,958 2,250 4,880 1,364
1984 N 20,736 3,139 1,825 3,932 3,681 1,984 4,735 1,440
1989 N 22,699 3,743 2,667 4,525 3,753 2,151 4,296 1,564
1994 N 24,780 4,072 2,946 5,100 3,968 2,549 4,409 1,736
1999 N 25,744 4,170 3,261 5,416 4,187 2,974 4,231 1,505
Employment
1979 % 80.0 62.8 87.6 45.7 87.7 94.3 97.3 97.4
1984 % 78.2 59.5 84.9 42.6 86.5 95.5 97.7 98.3
1989 % 74.1 52.5 80.0 41.4 84.0 94.3 96.6 97.2
1994 cy. 70.6 48.5 75.8 36.0 80.0 92.9 96.3 96.3
1999 % 69.8 53.5 77.5 36.2 74.0 91.4 94.9 95.3
Study
1979 % 20.0 37.2 12.4 54.3 12.3 5.7 2.7 2.6
1984 % 21.8 40.5 15.1 57.4 13.5 4.5 2.3 1.7
1989 % 25.9 47.5 20.0 58.6 16.0 5.7 3.4 2.8
1994 % 29.4 51.5 24.2 64.0 20.0 7.1 3.7 3.7
1999 % 30.2 46.5 22.5 63.8 26.0 8.6 5.1 4.7
NOTE: Only doctorate recipients with definite commitments are included. "All Definite Commitments" includes doctoraterecipients who reported definite commitments but not type of plans (employment or study). Percentages are based on thenumber of doctorate recipients who reported a definite commitment and a type of plan. See technical notes in appendix C forrates of nonresponse to the applicable survey questions and for further explanation of postgraduation plans.
*Includes mathematics and computer sciences.
SOURCE: NSF/NIH/USED/NEH/USDA/NASA, Survey of Earned Doctorates

Tab
le 2
5. P
ostg
radu
atio
n co
mm
itmen
ts o
f doc
tora
te r
ecip
ient
s by
type
of p
lans
and
dem
ogra
phic
gro
up fo
r se
lect
ed y
ears
, 197
9-19
99
Tot
alM
ale
Fem
ale
U.S
.
Citi
zen
Per
man
ent
Vis
a
U.S
. Citi
zens
and
Per
man
ent R
esid
ents
Tem
pora
ryV
isa
Asi
ant
Bla
ckH
ispa
nic
Am
eric
anIn
dian
$W
hite
All
Def
inite
Com
mitm
ents
1979
N21
,411
15,7
895,
622
18,1
4282
02,
422
719
695
348
5316
,282
1984
N20
,789
13,9
806,
809
17,0
9868
62,
979
619
681
389
4415
,776
1989
N22
,815
14,4
828,
333
17,6
1194
84,
223
809
650
493
6716
,254
1994
N24
,945
15,0
019,
941
18,1
381,
811
4,98
41,
795
800
669
9516
,484
1999
N25
,975
15,1
6110
,812
18,9
151,
413
5,41
71,
593
1,08
479
112
816
,476
Def
inite
Com
mitm
ents
with
Res
pons
es to
Typ
e of
Pla
ns
1979
N21
,228
15,6
555,
573
18,0
1581
12,
376
713
680
345
5316
,180
1984
N20
,736
13,9
386,
798
17,0
6968
32,
958
619
676
388
4315
,751
1989
N22
,699
14,4
148,
285
17,5
3294
04,
195
807
640
487
6716
,191
1994
N24
,780
14,9
129,
865
18,0
251,
800
4,94
31,
787
791
659
9416
,388
1999
N25
,744
15,0
5010
,693
18,7
551,
400
5,36
91,
581
1,07
278
312
716
,340
Em
ploy
men
t19
79%
80.0
79.1
82.5
80.6
77.3
76.3
73.2
93.8
86.7
86.8
80.1
1984
%78
.276
.382
.078
.778
.875
.272
.592
.984
.890
.778
.2
1989
%74
.171
.778
.276
.672
.764
.066
.788
.874
.580
.676
.5
1994
%70
.668
.274
.474
.354
.963
.051
.182
.273
.674
.574
.5
1999
%69
.868
.072
.573
.163
.260
.059
.581
.273
.675
.673
.0
Stu
dy19
79%
20.0
20.9
17.5
19.4
22.7
23.7
26.8
6.2
13.3
13.2
19.9
1984
%21
.823
.718
.021
.321
.224
.827
.57.
115
.29.
321
.8
1989
ok25
.928
.321
.823
.427
.336
.033
.311
.325
.519
.423
.5
1994
%29
.431
.825
.625
.745
.137
.048
.917
.826
.425
.525
.5
1999
%30
.232
.027
.526
.936
.840
.040
.518
.826
.424
.427
.0
NO
TE
: Onl
y do
ctor
ate
reci
pien
ts w
ith d
efin
ite c
omm
itmen
ts a
re in
clud
ed. A
ll D
efin
ite C
omm
itmen
ts"
incl
udes
rec
ipie
nts
who
rep
orte
d de
finite
com
mitm
ents
but
not
type
of p
lans
(em
ploy
men
t or
stud
y). P
erce
ntag
es a
re b
ased
on
the
num
ber
of d
octo
rate
rec
ipie
nts
who
rep
orte
d a
defin
ite c
omm
itmen
t and
a ty
pe o
f pla
n. S
ee te
chni
cal n
otes
in a
ppen
dix
C fo
rra
tes
of n
onre
spon
se to
the
appl
icab
le s
urve
y qu
estio
ns a
nd fo
r fu
rthe
r ex
plan
atio
n of
pos
tgra
duat
ion
plan
s.
tlncl
udes
Pac
ific
Isla
nder
.In
clud
es A
lask
an N
ativ
e
SO
UR
CE
: NS
F/N
IH/U
SE
D/N
EH
/US
DA
/NA
SA
, Sur
vey
of E
arne
d D
octo
rate
s
6113
EST
CO
PYA
VA
ILA
BL
E
74
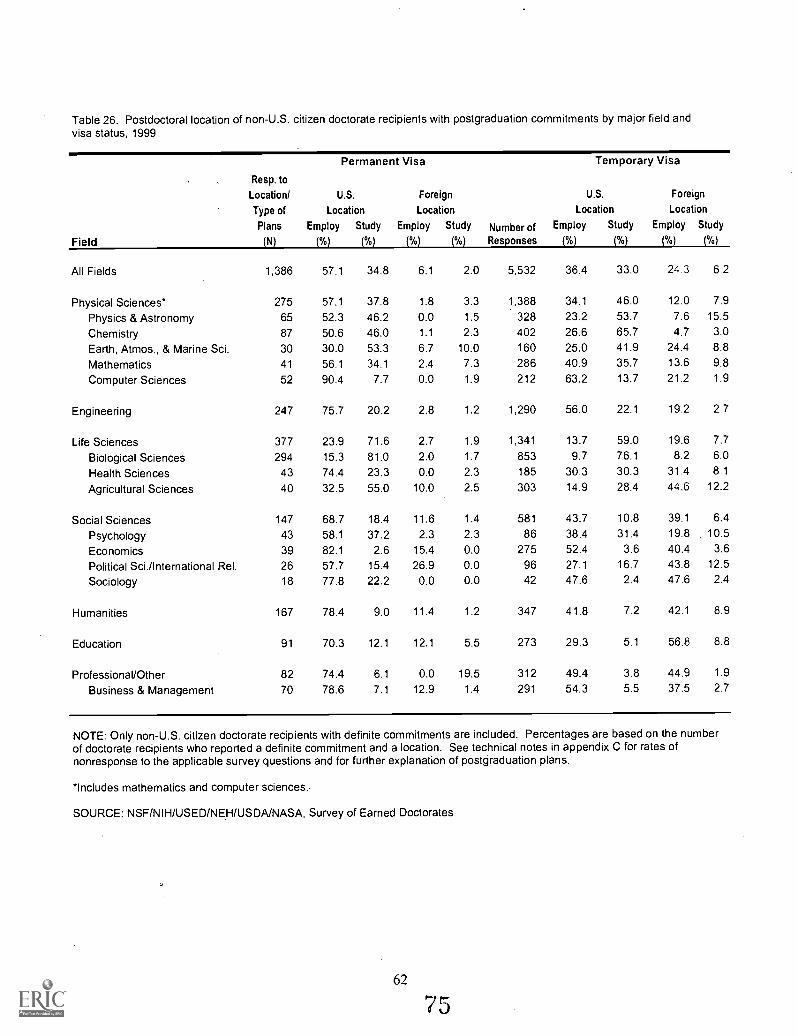
Table 26. Postdoctoral location of non-U.S. citizen doctorate recipients with postgraduation commitments by major field andvisa status, 1999
Field
Resp. to
Location/
Type of
Plans
(N)
Permanent Visa
U.S. Foreign
Location Location
Employ Study Employ Study
(%) (%) (%) (%)
Number ofResponses
Temporary Visa
U.S. Foreign
Location Location
Employ Study Employ Study
(%) (%) (%) (%)
All Fields 1,386 57.1 34.8 6.1 2.0 5,532 36.4 33.0 24.3 6.2
Physical Sciences* 275 57.1 37.8 1.8 3.3 1,388 34.1 46.0 12.0 7.9
Physics & Astronomy 65 52.3 46.2 0.0 1.5 328 23.2 53.7 7.6 15.5
Chemistry 87 50.6 46.0 1.1 2.3 402 26.6 65.7 4.7 3.0
Earth, Atmos., & Marine Sci. 30 30.0 53.3 6.7 10.0 160 25.0 41.9 24.4 8.8
Mathematics 41 56.1 34.1 2.4 7.3 286 40.9 35.7 13.6 9.8
Computer Sciences 52 90.4 7.7 0.0 1.9 212 63.2 13.7 21.2 1.9
Engineering 247 75.7 20.2 2.8 1.2 1,290 56.0 22.1 19.2 2.7
Life Sciences 377 23.9 71.6 2.7 1.9 1,341 13.7 59.0 19.6 7.7
Biological Sciences 294 15.3 81.0 2.0 1.7 853 9.7 76.1 8.2 6.0
Health Sciences 43 74.4 23.3 0.0 2.3 185 30.3 30.3 31.4 8.1
Agricultural Sciences 40 32.5 55.0 10.0 2.5 303 14.9 28.4 44.6 12.2
Social Sciences 147 68.7 18.4 11.6 1.4 581 43.7 10.8 39.1 6.4
Psychology 43 58.1 37.2 2.3 2.3 86 38.4 31.4 19.8 10.5
Economics 39 82.1 2.6 15.4 0.0 275 52.4 3.6 40.4 3.6
Political Sci. /International Rel. 26 57.7 15.4 26.9 0.0 96 27.1 16.7 43.8 12.5
Sociology 18 77.8 22.2 0.0 0.0 42 47.6 2.4 47.6 2.4
Humanities 167 78.4 9.0 11.4 1.2 347 41.8 7.2 42.1 8.9
Education 91 70.3 12.1 12.1 5.5 273 29.3 5.1 56.8 8.8
Professional/Other 82 74.4 6.1 0.0 19.5 312 49.4 3.8 44.9 1.9
Business & Management 70 78.6 7.1 12.9 1.4 291 54.3 5.5 37.5 2.7
NOTE: Only non-U.S. citizen doctorate recipients with definite commitments are included. Percentages are based on the numberof doctorate recipients who reported a definite commitment and a location. See technical notes in appendix C for rates ofnonresponse to the applicable survey questions and for further explanation of postgraduation plans.
*Includes mathematics and computer sciences.
SOURCE: NSF/NIH/USED/NEH/USDA/NASA, Survey of Earned Doctorates
62
75

Table 27. Postdoctoral location of non-U.S. citizen doctorate recipients with postgraduationcommitments by visa status for selected years, 1979-1999
AllNon-U.S.Citizens
PermanentVisa
TemporaryVisa
All Definite Commitments1979 N 3,242 820 2,422
1984 N 3,665 686 2,979
1989 N 5,171 948 4,223
1994 N 6,795 1,811 4,984
1999 N 7,033 1,413 5,620
Definite Commitments with Responses to Location1979 N 3,061 767 2,294
1984 N 3,375 624 2,751
1989 N 4,657 854 3,803
1994 N 6,740 1,798 4,942
1999 N 6,998 1,404 5,594
U.S. Location1979 51.8 92.6 38.2
1984 53.3 93.4 44.2
1989 62.8 85.8 57.6
1994 61.9 89.6 51.9
1999 0/0 72.1 91.4 67.3
Foreign Location1979 % 48.2 7.4 61.8
1984 % 46.7 6.6 55.8
1989 % 37.2 14.2 42.4
1994 % 38.1 10.4 48.1
1999 % 27.9 8.6 32.7
NOTE: Only non-U.S. citizen doctorate recipients with definite commitments are included."All Definite Commitments" includes recipients who reported definite commitments but notlocation (U.S. or foreign). Percentages are based on the number of doctorate recipients whoreported a definite commitment and a location.
SOURCE: NSF/NIH/USED/NEH/USDA/NASA, Survey of Earned Doctorates
63
76

TABLE 28. Employment sector of doctorate recipients with postgraduation commitments in the United States by demographicgroup for selected years, 1979-1999
Total Male FemaleU.S.
CitizenPerm.Visa
U.S. Citizens and Permanent Residents
Temp.Visa Asiant Black
Hispanic
Amer.Indiant White
All Employment Commitments
1979 N 14,771 10,597 4,174 13,746 539 470 472 588 275 44 12,298
1984 N 13,363 8,613 4,750 12,245 452 648 394 528 290 35 11,292
1989 N 13,893 8,282 5,611 12,336 513 1,033 459 479 312 51 11,385
1994 N 15,117 8,328 6,787 13,069 840 1,205 818 639 464 70 11,865
1999 N 16,170 8,975 7,195 13,389 795 1,925 875 851 550 91 11,643
Employment Commitments with Responses to Sector
1979 N 14,740 10,575 4,165 13,718 537 469 471 586 275 44 12.275
1984 N 13,346 8,603 4,743 12,230 452 646 391 527 290 35 11,281
1989 N 13,872 8,270 5,602 12,318 512 1,031 458 479 311 51 11,3691994 N 14,871 8,211 6,658 12,864 824 1,180 804 627 451 69 11,685
1999 N 16,003 8,897 7,106 13,254 786 1,903 864 836 541 90 11,540
Academe
1979 % 55.2 51.9 63.5 55.7 42.8 54.6 31.4 59.6 70.5 59.1 55.5
1984 % 50.7 47.4 56.7 49.9 53.1 63.9 37.6 53.1 58.6 51.4 50.1
1989 % 52.8 49.1 58.2 51.6 59.8 62.9 39.7 57.8 55.6 37.3 52.1
1994 % 52.1 46.4 59.1 52.8 45.9 49.2 38.4 55.3 59.4 68.1 52.8
1999 % 49.2 43.6 56.2 51.7 44.0 34.7 36.0 57.1 59.0 53.3 51.6
Industry /Self- Employed
1979 % 16.9 20.6 7.5 15.2 46.4 33.5 52.4 7.7 8.0 6.8 15.5
1984 % 19.2 23.2 11.9 18.0 34.7 30.7 44.2 7.8 12.1 8.6 18.4
1989 % 20.6 26.2 12.3 19.2 32.0 31.2 45.6 7.7 17.0 29.4 19.1
1994 % 21.4 28.7 12.5 18.0 44.2 42.9 49.0 7.5 12.0 14.5 18.5
1999 % 27.8 36.3 17.1 21.9 44.5 60.4 50.1 12.2 17.6 13.3 22.2
Government
1979 % 12.7 13.3 11.1 13.3 4.7 3.6 10.2 15.9 13.5 11.4 13.0
1984 % 11.7 12.6 9.9 12.5 4.4 1.2 11.5 14.2 15.5 14.3 12.0
1989 % 10.2 10.7 9.5 11.2 2.0 2.2 7.0 13.8 10.9 13.7 10.9
1994 % 8.7 9.9 7.3 9.6 4.6 1.7 6.2 9.6 8.9 10.1 9.5
1999 % 7.5 8.3 6.5 8.7 2.8 0.9 5.8 7.4 8.3 8.9 8.7
Other
1979 % 15.2 14.1 18.0 15.8 6.1 8.3 5.9 16.9 8.0 22.7 16.0
1984 % 18.5 16.8 21.5 19.6 7.7 4.2 6.6 24.9 13.8 25.7 19.5
1989 % 16.4 14.1 20.0 17.9 6.3 3.6 7.6 20.7 16.4 19.6 17.8
1994 % 17.7 15.0 21.1 19.6 5.3 6.2 6.3 27.6 19.7 7.2 19.2
1999 % 15.5 11.8 20.2 17.6 8.7 3.9 8.1 23.3 15.2 24.4 17.5
(includes Pacific Islander.$1ncludes Alaskan Native.
SOURCE: NSF/NIH/USED/NEH/USDA/NASA, Survey of Earned Doctorates

Table 2-1. Percentages of U.S. citizen doctorate recipients in 1999 who remained in thesame state in which they were born, by demographic background and employment sector
Number
Same Birth, HighSchool, College,Doctorate, and
Employment StateNo Two
the Same
Total 23,153 13.4 8.7
By SexMale 11,940 11.4 9.0Female 11,213 15.6 8.4
By Race/EthnicityAmerican Indian* 173 18.5 8.1Asian+ 494 15.0 9.7Black 1,275 18.3 6.8Hispanic 712 22.9 4.8White 20,216 12.7 8.9
By Marital StatusMarried/marriage-like 14,679 14.6 8.0Separated/Widowed/Divorced 1,824 15.6 7.3Never married 6,481 10.3 10.7
By Parents' EducationSome college or less 8,326 19.9 3.2Bachelors or higher 14,669 9.8 11.8
By Employment Sector#Academe 8,441 12.6 8.7Government 1,278 13.9 9.1Private Sector 3,756 12.4 8.7Other 2,735 27.1 5.1
Includes Alaskan Native. +Includes Pacific Islander.#The Ns for employment sector do not sum to the total N because many respondents did not have or did not report aspecific job commitment at the time they completed the SED questionnaire.
SOURCE: NSF/NIH/USED/NEH/USDA/NASA, Survey of Earned Doctorates
Table 2-2. Percentages of U.S. citizen doctorate recipients in 1999 who migrated interstate at different transitionpoints, by demographic background and employment sector
NumberBirth &
High SchoolHigh School
& CollegeCollege &Doctorate
Doctorate &Employment
Total 23,153 34.0 36.1 68.8 55.2
By SexMale 11,940 34.6 36.5 70.4 59.2Female 11,213 33.4 35.6 67.0 50.9
By Race/EthnicityAmerican Indian* 173 33.5 30.1 62.4 57.8Asian+ 494 41.9 38.7 64.2 53.6Black 1,275 28.2 36.8 64.5 52.2Hispanic 712 27.1 23.9 60.1 51.1
White 20,216 34.4 36.4 69.5 55.5By Marital Status
Married/Marriage-like 14,679 34.0 35.0 68.0 51.8Separated/Widowed/Divorced 1,824 32.6 31.5 64.4 50.1Never married 6,481 34.4 39.7 71.6 64.3
By Parents' EducationSome college or less 8,326 21.8 24.1 62.0 49.1Bachelor's or higher 14,669 41.0 42.9 72.6 58.6
By Employment Sector#Academe 8,441 33.0 35.5 70.0 58.6Government 1,278 36.6 35.4 68.8 52.5Private Sector 3,756 35.4 36.7 67.9 54.7Other 2,735 28.5 30.1 56.7 35.3
`Includes Alaskan Native. +Includes Pacific Islander.#The Ns for employment sector do not sum to the total N because many respondents did not have or did not report a specific jobcommitment at the time they completed the SED questionnaire.
SOURCE: NSF/NIH/USED/NEH/USDA/NASA, Survey of Earned Doctorates
65
78

Table 2-3. Percentages of U.S. citizen doctorate recipients in 1999 who remained in the same state at varioustime points prior to employment, by demographic background and employment sector
NumberSame Birth
& EmploymentSame HS
& EmploymentSame College& Employment
Total 23,153 24.0 29.2 28.3
By SexMale 11,940 21.7 26.1 25.6Female 11,213 26.4 32.5 31.1
By Race/EthnicityAmerican Indian` 173 34.1 38.2 36.4Asian+ 494 25.9 32.4 33.6Black 1,275 30.9 35.3 33.6Hispanic 712 38.3 44.2 43.4White 20,216 23.0 28.2 27.2
By Marital StatusMarried/marriage-like 14,679 25.1 30.8 30.1Separated/Widowed/Divorced 1,824 26.4 32.7 32.1Never married 6,481 21.0 24.9 23.2
By Parents' EducationSome college or less 8,326 31.5 36.0 35.9Bachelor's or higher 14,669 19.8 25.4 23.9
By Employment Sector#Academe 8,441 23.0 28.0 27.9Government 1,278 24.1 31.3 29.2Private Sector 3,756 23.5 28.8 27.7Other 2,735 40.8 48.6 46.4
*Includes Alaskan Native. +Includes Pacific Islander.#The Ns for employment sector do not sum to the total N because many respondents did not have or did not report a specific jobcommitment at the time they completed the SED questionnaire.
SOURCE: NSF/NIH/USED/NEH/USDA/NASA, Survey of Earned Doctorates
Table 2-4. Percentages of U.S. citizen doctorate recipients in 1999 who migrated interstate at different transitionpoints, by field of study
NumberBirth &
High SchoolHigh School
& CollegeCollege &Doctorate
Doctorate &Employment
Total 23,153 34.0 36.1 68.8 55.2
Science & Engineering 12,763 35.3 37.4 71.0 59.4Engineering 1,950 37.2 37.4 67.2 56.7Physics/Astronomy 641 36.3 41.8 77.5 67.2Chemistry 1,071 29.4 30.2 74.1 70.5Earth, Atmosphere, Ocean 399 41.4 44.1 74.7 58.6Mathematics 444 35.1 42.3 71.6 65.8Computer Science 303 40.9 44.9 70.3 56.4Biological Science 3,044 36.5 36.5 70.4 56.5Agricultural Science 421 31.1 29.9 73.4 63.2Psychology 2,673 34.2 36.6 68.7 55.2Social Science 1,817 36.5 43.6 74.7 65.6
Non-Science & Engineering 10,390 32.1 34.2 65.6 49.4Humanities 3,552 37.9 44.4 76.1 61.5Other 6,838 29.0 28.5 60.6 43.2
SOURCE: NSF/NIH/USED/NEH/USDA/NASA, Survey of Earned Doctorates

APPENDICES
67
80

Tab
le 2
0. C
umul
ativ
e de
bt r
elat
ed to
edu
catio
n of
doc
tora
te r
ecip
ient
s, b
y br
oad
field
, 199
9
Cum
ulat
ive
Deb
t
Gro
up T
otal
N%
Phy
sica
lS
cien
ces*
N%
Eng
inee
ring
N%
Life
Sci
ence
s
N%
Soc
ial S
cien
ces
N%
Hum
aniti
es
N%
Edu
catio
n
N%
Pro
fess
iona
l/O
ther
N
Tot
al37
,188
100.
05,
770
100.
04,
845
100.
07,
524
100.
06,
223
100.
04,
990
100.
05,
833
100.
02,
003
100.
0
$5,0
00 o
r le
ss3,
561
9.6
626
10.8
497
10.3
801
10.6
484
7.8
462
9.3
533
9.1
158
7.9
$5,0
01-$
10,0
002,
946
7.9
482
8.4
332
6.9
637
8.5
471
7.6
462
9.3
400
6.9
162
8.1
$10,
001-
$15,
000
2,40
26.
536
76.
426
75.
553
27.
143
26.
938
57.
731
75.
410
25.
1
$15,
001-
$20,
000
1,94
55.
223
24.
017
33.
639
25.
243
06.
933
26.
726
74.
611
95.
9$2
0,00
1-$2
5,00
01,
534
4.1
171
3.0
146
3.0
280
3.7
343
5.5
278
5.6
233
4.0
834.
1$2
5,00
1-$3
0,00
01,
309
3.5
140
2.4
911.
923
03.
133
85.
423
84.
818
93.
283
4.1
$30,
000+
4,94
613
.335
76.
238
17.
976
710
.21,
515
24.3
774
15.5
799
13.7
353
17.6
No
Deb
t18
,545
49.9
3,39
558
.82,
958
61.1
3,88
551
.62,
210
35.5
2,05
941
.33,
095
53.1
943
47.1
*Inc
lude
s m
athe
mat
ics
and
com
pute
r sc
ienc
es.
SO
UR
CE
: NS
F/N
IH/U
SE
D/N
EH
/US
DA
/NA
SA
, Sur
vey
of E
arne
d D
octo
rate
s
Tab
le 2
1. C
umul
ativ
e de
bt r
elat
ed to
edu
catio
n of
doc
tora
te r
ecip
ient
s, b
y de
mog
raph
ic g
roup
, 199
9
Mal
eF
emal
eU
.S. C
itize
n
Citi
zens
hip
Per
m. R
esid
ent
Tem
p. R
esid
ent
Asi
an'
Bla
ck
U.S
. Citi
zens
and
Per
man
ent R
esid
ents
Am
eric
anH
ispa
nic
Indi
ant
Whi
te
Cum
ulat
ive
Deb
tN
N%
N%
N%
N%
N%
N%
N%
N%
N
$5,0
00 O
R L
ES
S2,
128
10.0
1,43
39.
12,
504
9.4
212
9.7
837
10.0
116
9.2
168
11.1
112
11.0
2110
.42,
046
9.2
$5,0
01-$
10,0
001,
688
7.9
1,25
87.
92,
292
8.6
147
6.7
503
6.0
125
9.9
117
7.7
828.
017
8.4
1,91
38.
6
$10,
001-
$15,
000
1,36
66.
41,
036
6.5
1,98
87.
510
34.
730
63.
611
08.
711
17.
381
7.9
136.
41,
638
7.4
$15,
001-
$20,
000
1,11
35.
283
25.
31,
663
6.3
803.
719
82.
465
5.1
108
7.1
727.
110
5.0
1,39
46.
3
$20,
001-
$25,
000
853
4.0
681
4.3
1,32
55.
063
2.9
144
1.7
574.
510
97.
255
5.4
136.
41,
079
4.9
$25,
001-
$30,
000
726
3.4
583
3.7
1,14
34.
348
2.2
116
1.4
463.
688
5.8
525.
112
5.9
931
4.2
$30,
000+
2,59
012
.12,
356
14.9
4,16
015
.717
58.
060
67.
215
212
.040
126
.520
820
.448
23.8
3,30
114
.9
No
Deb
t10
,889
51.0
7,65
348
.311
,457
43.2
1,36
062
.25,
694
67.8
594
47.0
412
27.2
359
35.2
6833
.79,
867
44.5
'Incl
udes
Pac
ific
Isla
nder
s.t I
nclu
des
Ala
skan
Nat
ive.
SO
UR
CE
: NS
F/N
IH/U
SE
D/N
EH
/US
DA
/NA
SA
, Sur
vey
of E
arne
d D
octo
rate
s
8
BE
ST C
OPY
AV
AIL
A3L
E
82

Table 22. Postgraduation status of doctorate recipients by broad field for selected years, 1979-1999
AllFields
PhysicalSciences*
Engineering
LifeSciences
SocialSciences
Human-ities
Educa-tion
Prof./Other
Total1979 N 31,239 4,299 2,490 5,223 5,961 4,141 7,385 1,7401984 N 31,337 4,452 2,913 5,758 5,929 3,536 6,808 1,9411989 N 34,327 5,455 4,543 6,342 5,961 3,552 6,281 2,1931994 N 41,034 6,822 5,822 7,739 6,613 4,744 6,708 2,5861999 N 41,140 6,324 5,337 8,126 7,036 5,468 6,557 2,292
Total Responses to Postgraduation Status1979 N 29,039 4,066 2.316 4.894 5,517 3.778 6 833 1 6351984 N 28,408 4,082 2,553 5,205 5,314 3,178 6,334 1,7421989 N 30,766 4,889 3,956 5,803 5,235 3,215 5,715 1,9531994 N 37,640 6,312 5,288 7,144 6,017 4,430 6,075 2,3741999 N 37,138 5,766 4,846 7,512 6,230 4,973 5,801 2,010
Definite Commitments for Employment or Study1979 % 73.7 78.6 78.4 77.8 72.5 60.3 72.2 84.41984 % 73.2 77.1 71.8 75.7 69.4 62.7 74.9 82.71989 % 74.2 76.8 67.6 78.2 72.0 67.7 75.7 80.61994 % 66.3 64.6 55.9 71.7 66.5 58.3 73.3 73.71999 % 69.9 72.7 67.6 72.6 67.7 60.6 74.1 75.6
Seeking Employment or Study1979 % 26.3 21.4 21.6 22.2 27.5 39.7 27.8 15.61984 % 26.8 22.9 28.2 24.3 30.6 37.3 25.1 17.31989 % 25.8 23.2 32.4 21.8 28.0 32.3 24.3 19.41994 % 33.7 35.4 44.1 28.3 33.5 41.7 26.7 26.31999 % 30.1 27.3 32.4 27.4 32.3 39.4 25.9 24.4
NOTE: Percentages are based on the number of doctorate recipients who reported their postgraduation status (definiteor seeking), regardless of plans (employment or study). See technical notes in appendix C for rates of nonresponse tothe applicable questions and for further explanation of postgraduation plans.
*Includes mathematics and computer sciences.
SOURCE: NSF/NIH/USED/NEH/USDA/NASA, Survey of Earned Doctorates
58 83

Tab
le 2
3. P
ostg
radu
atio
n st
atus
of d
octo
rate
rec
ipie
nts
by d
emog
raph
ic g
roup
for
sele
cted
yea
rs, 1
979-
1999
Tot
al
Sex
Men
Wom
enU
.S.
Citi
zens
Citi
zens
hip
Per
m V
isa
Tem
p V
isa
Asi
an*
U.S
. Citi
zens
and
Per
man
ent R
esid
ents
Am
eric
anB
lack
His
pani
cIn
dian
**W
hite
Tot
al 1979
N31
,239
22,3
028,
937
25,4
741,
320
3,58
71,
102
1.11
654
781
22,4
0019
84N
31,3
3720
,638
10,6
9924
,046
1,22
44,
832
1,02
31,
058
605
7421
,894
1989
N34
,327
21,8
1412
,513
23,4
021,
626
6,64
81,
268
963
694
9421
,571
1994
N41
,034
25,0
5915
,820
27,1
473,
747
9,40
63,
546
1,27
91,
030
143
24,5
9519
99N
41,1
4023
,460
17,4
9327
,622
2,30
08,
726
2,51
81,
729
1,24
621
923
,725
Tot
al R
espo
nses
to P
ostg
radu
atio
n S
tatu
s19
79N
29,0
3920
,759
8,28
024
,458
1,22
43,
318
1,04
71,
045
512
7921
,832
1984
N28
,408
18,6
149,
794
22,9
121,
143
4,31
294
699
757
967
21,0
8519
89N
30,7
6619
,383
11,3
8322
,936
1,52
96,
251
1,19
092
466
991
21,2
0119
94N
37,6
4023
,069
14,5
6425
,644
3,40
58,
569
3,22
41,
171
963
134
23,3
7719
99N
37,1
3821
,350
15,7
8526
,482
2,17
68,
095
2,39
71,
623
1,14
920
022
,887
Def
inite
Com
mitm
ents
for
Em
ploy
men
t or
Stu
dy19
79%
73.7
76.1
67.9
74.2
67.0
73.0
68.7
66.5
68.0
67.1
74.6
1984
%73
.275
.169
.574
.660
.069
.165
.468
.367
.265
.774
.819
89%
74.2
74.7
73.2
76.8
62.0
67.6
68.0
70.3
73.7
73.6
76.7
1994
%66
.365
.068
.370
.753
.258
.255
.768
.369
.570
.970
.519
99%
69.9
71.0
68.5
71.4
64.9
66.9
66.5
66.8
68.8
64.0
72.0
See
king
Em
ploy
men
t or
Stu
dy19
79%
26.3
23.9
32.1
25.8
33.0
27.0
31.3
33.5
32.0
32.9
25.4
1984
%26
.824
.930
.525
.440
.030
.934
.631
.732
.834
.325
.219
89%
25.8
25.3
26.8
23.2
38.0
32.4
32.0
29.7
26.3
26.4
23.3
1994
%33
.735
.031
.729
.346
.8.
41.8
44.3
31.7
30.5
29.1
29.5
1999
%30
.129
.031
.528
.635
.133
.133
.533
.231
.236
.028
.0
NO
TE
: Per
cent
ages
are
bas
ed o
n th
e nu
mbe
r of
doc
tora
te r
ecip
ient
s w
ho r
epor
ted
thei
r po
stgr
adua
tion
stat
us (
defin
ite o
r se
ekin
g), r
egar
dles
s of
pla
ns(e
mpl
oym
ent o
r st
udy)
.S
ee te
chni
cal n
otes
in a
ppen
dix
C fo
r ra
tes
of n
onre
spon
se to
the
appl
icab
le q
uest
ions
and
for
furt
her
expl
anat
ion
of p
ostg
radu
atio
n pl
ans.
-I-I
nclu
des
Pac
ific
Isla
nder
.tIn
clud
es A
lask
an N
ativ
e.
SO
UR
CE
: NS
F/N
IH/U
SE
D/N
EH
/US
DA
/NA
SA
, Sur
vey
of E
arne
d D
octo
rate
s
84
59
85

Table 24. Postgraduation commitments of doctorate recipients by type of plans and broad field for selected years, 1979-1999
Physical
All Fields Sciences* Engineering
Life
Sciences
Social
Sciences Humanities EducationProf./Other
All Definite Commitments
1979 N 21,411 3,196 1,815 3,807 3,999 2,279 4,935 1,380
1984 N 20,789 3,148 1,833 3,939 3,689 1,994 4,746 1,440
1989 N 22,815 3,756 2,675 4,537 3,768 2,176 4,329 1,574
1994 N 24,945 4,079 2,957 5,120 4,001 2.583 4,455 1,750
1999 N 25,975 4,190 3,277 5,456 4,217 3,015 4,301 1,519
Definite Commitments with Responses to Type of Plans
1979 N 21,228 3,185 1,809 3,782 3,958 2,250 4,880 1,364
1984 N 20,736 3,139 1,825 3,932 3,681 1,984 4,735 1,440
1989 N 22,699 3,743 2,667 4,525 3,753 2,151 4,296 1,564
1994 N 24,780 4,072 2,946 5,100 3,968 2,549 4,409 1,736
1999 N 25,744 4,170 3,261 5,416 4,187 2,974 4,231 1,505
Employment
1979 % 80.0 62.8 87.6 45.7 87.7 94.3 97.3 97.4
1984 % 78.2 59.5 84.9 42.6 86.5 95.5 97.7 98.3
1989 % 74.1 52.5 80.0 41.4 84.0 94.3 96.6 97.2
1994 % 70.6 48.5 75.8 36.0 80.0 92.9 96.3 96.3
1999 % 69.8 53.5 77.5 36.2 74.0 91.4 94.9 95.3
Study
1979 % 20.0 37.2 12.4 54.3 12.3 5.7 2.7 2.6
1984 % 21.8 40.5 15.1 57.4 13.5 4.5 2.3 1.7
1989 % 25.9 47.5 20.0 58.6 16.0 5.7 3.4 2.8
1994 ok 29.4 51.5 24.2 64.0 20.0 7.1 3.7 3.7
1999 % 30.2 46.5 22.5 63.8 26.0 8.6 5.1 4.7
NOTE: Only doctorate recipients with definite commitments are included. "All Definite Commitments" includes doctoraterecipients who reported definite commitments but not type of plans (employment or study). Percentages are based on thenumber of doctorate recipients who reported a definite commitment and a type of plan. See technical notes in appendix C forrates of nonresponse to the applicable survey questions and for further explanation of postgraduation plans.
*Includes mathematics and computer sciences.
SOURCE: NSF/NIH/USED/NEH/USDA/NASA, Survey of Earned Doctorates

Tab
le 2
5. P
ostg
radu
atio
n co
mm
itmen
ts o
f doc
tora
te r
ecip
ient
s by
type
of p
lans
and
dem
ogra
phic
gro
up fo
r se
lect
ed y
ears
, 197
9-19
99
Tot
alM
ale
Fem
ale
U.S
.
Citi
zen
Per
man
ent
Vis
a
U.S
. Citi
zens
and
Per
man
ent R
esid
ents
Tem
pora
ryV
isa
Asi
ant
Bla
ckH
ispa
nic
Am
eric
an
Indi
an$
Whi
teA
ll D
efin
ite C
omm
itmen
ts19
79N
21.4
1115
,789
5,62
218
,142
820
2,42
271
969
534
853
16,2
82
1984
N20
,789
13,9
806,
809
17,0
9868
62,
979
619
681
389
4415
,776
1989
N22
,815
14,4
828,
333
17,6
1194
84,
223
809
650
493
6716
,254
1994
N24
,945
15,0
019,
941
18,1
381,
811
4,98
41,
795
800
669
9516
,484
1999
N25
,975
15,1
6110
,812
18,9
151,
413
5,41
71,
593
1,08
479
112
816
,476
Def
inite
Com
mitm
ents
with
Res
pons
es to
Typ
e of
Pla
ns19
79N
21,2
2815
,655
5,57
318
,015
811
2,37
671
368
034
553
16,1
80
1984
N20
,736
13,9
386,
798
17,0
6968
32,
958
619
676
388
4315
,751
1989
N22
,699
14,4
148,
285
17,5
3294
04,
195
807
640
487
6716
,191
1994
N24
,780
14,9
129,
865
18,0
251,
800
4,94
31,
787
791
659
9416
,388
1999
N25
,744
15,0
5010
,693
18,7
551,
400
5,36
91,
581
1,07
278
312
716
,340
Em
ploy
men
t19
79%
80.0
79.1
82.5
80.6
77.3
76.3
73.2
93.8
86.7
86.8
80.1
1984
%78
.276
.382
.078
.778
.875
.272
.592
.984
.890
.778
.2
1989
%74
.171
.778
.276
.672
.764
.066
.788
.874
.580
.676
.519
94%
70.6
68.2
74.4
74.3
54.9
63.0
51.1
82.2
73.6
74.5
74.5
1999
%69
.868
.072
.573
.163
.260
.059
.581
.273
.675
.673
.0
Stu
dy
1979
%20
.020
.917
.519
.422
.723
.726
.86.
213
.313
.219
.9
1984
%21
.823
.718
.021
.321
.224
.827
.57.
115
.29.
321
.8
1989
%25
.928
.321
.823
.427
.336
.033
.311
.325
.519
.423
.519
94%
29.4
31.8
25.6
25.7
45.1
37.0
48.9
17.8
26.4
25.5
25.5
1999
%30
.232
.027
.526
.936
.840
.040
.518
.826
.424
.427
.0
NO
TE
: Onl
y do
ctor
ate
reci
pien
ts w
ith d
efin
ite c
omm
itmen
ts a
re in
clud
ed. "
All
Def
inite
Com
mitm
ents
" in
clud
es r
ecip
ient
s w
ho r
epor
ted
defin
ite c
omm
itmen
ts b
ut n
ot ty
pe o
f pla
ns(e
mpl
oym
ent o
r st
udy)
. Per
cent
ages
are
bas
ed o
n th
e nu
mbe
r of
doc
tora
te r
ecip
ient
s w
ho r
epor
ted
a de
finite
com
mitm
ent a
nd a
type
of p
lan.
See
tech
nica
l not
esin
app
endi
x C
for
rate
s of
non
resp
onse
to th
e ap
plic
able
sur
vey
ques
tions
and
for
furt
her
expl
anat
ion
of p
ostg
radu
atio
n pl
ans.
tIncl
udes
Pac
ific
Isla
nder
. tIn
clud
es A
lask
an N
ativ
e.
SO
UR
CE
: NS
F/N
1H/U
SE
D/N
EH
/US
DA
/NA
SA
, Sur
vey
of E
arne
d D
octo
rate
s
87B
EST
CO
PY A
VA
ILA
BL
E88
61

Table 26. Postdoctoral location of non-U.S. citizen doctorate recipients with postgraduation commitments by major field andvisa status, 1999
Field
Resp. to
Location/
Type of
Plans
(N)
Permanent Visa
U.S. Foreign
Location Location
Employ Study Employ Study
(%) (%) (%) (%)
Number ofResponses
Temporary Visa
U.S. Foreign
Location Location
Employ Study Employ Study
(%) (%) ( %) (%)
All Fields 1,386 57.1 34.8 6.1 2.0 5,532 36.4 33.0 24.3 6.2
Physical Sciences* 275 57.1 37.8 1.8 3.3 1,388 34.1 46.0 12.0 7.9
Physics & Astronomy 65 52.3 46.2 0.0 1.5 328 23.2 53.7 7.6 15.5
Chemistry 87 50.6 46.0 1.1 2.3 402 26.6 65.7 4.7 3.0Earth, Atmos., & Marine Sci. 30 30.0 53.3 6.7 10.0 160 25.0 41.9 24.4 8.8
Mathematics 41 56.1 34.1 2.4 7.3 286 40.9 35.7 13.6 9.8
Computer Sciences 52 90.4 7.7 0.0 1.9 212 63.2 13.7 21.2 1.9
Engineering 247 75.7 20.2 2.8 1.2 1,290 56.0 22.1 19.2 2.7
Life Sciences 377 23.9 71.6 2.7 1.9 1,341 13.7 59.0 19.6 7.7
Biological Sciences 294 15.3 81.0 2.0 1.7 853 9.7 76.1 8.2 6.0
Health Sciences 43 74.4 23.3 0.0 2.3 185 30.3 30.3 31.4 8.1
Agricultural Sciences 40 32.5 55.0 10.0 2.5 303 14.9 28.4 44.6 12.2
Social Sciences 147 68.7 18.4 11.6 1.4 581 43.7 10.8 39.1 6.4
Psychology 43 58.1 37.2 2.3 2.3 86 38.4 31.4 19.8 10.5
Economics 39 82.1 2.6 15.4 0.0 275 52.4 3.6 40.4 3.6
Political Sci./International Rel. 26 57.7 15.4 26.9 0.0 96 27.1 16.7 43.8 12.5
Sociology 18 77.8 22.2 0.0 0.0 42 47.6 2.4 47.6 2.4
Humanities 167 78.4 9.0 11.4 1.2 347 41.8 7.2 42.1 8.9
Education 91 70.3 12.1 12.1 5.5 273 29.3 5.1 56.8 8.8
Professional/Other 82 74.4 6.1 0.0 19.5 312 49.4 3.8 44.9 1.9
Business & Management 70 78.6 7.1 12.9 1.4 291 54.3 5.5 37.5 2.7
NOTE: Only non-U.S. citizen doctorate recipients with definite commitments are included. Percentages are based on the numberof doctorate recipients who reported a definite commitment and a location. See technical notes in appendix C for rates ofnonresponse to the applicable survey questions and for further explanation of postgraduation plans.
*Includes mathematics and computer sciences.
SOURCE: NSF/NIH/USED/NEH/USDA/NASA, Survey of Earned Doctorates
62 8 9

Table 27. Postdoctoral location of non-U.S. citizen doctorate recipients with postgraduationcommitments by visa status for selected years, 1979-1999
AllNon-U.S.Citizens
PermanentVisa
TemporaryVisa
All Definite Commitments1979 N 3,242 820 2,422
1984 N 3,665 686 2,979
1989 N 5,171 948 4,223
1994 N 6,795 1,811 4,984
1999 N 7,033 1,413 5,620
Definite Commitments with Responses to Location1979 N 3,061 767 2,294
1984 N 3,375 624 2,751
1989 N 4,657 854 3,803
1994 N 6,740 1,798 4,942
1999 N 6,998 1,404 5,594
U.S. Location1979 51.8 92.6 38.2
1984 53.3 93.4 44.2
1989 62.8 85.8 57.6'
1994 61.9 89.6 51.9
1999 72.1 91.4 67.3
Foreign Location1979 % 48.2 7.4 61.8
1984 % 46.7 6.6 55.8
1989 ok 37.2 14.2 42.4
1994 ok 38.1 10.4 48.1
1999 % 27.9 8.6 32.7
NOTE: Only non-U.S. citizen doctorate recipients with definite commitments are included.All Definite Commitments" includes recipients who reported definite commitments but notlocation (U.S. or foreign). Percentages are based on the number of doctorate recipients whoreported a definite commitment and a location.
SOURCE: NSF/NIH/USED/NEH/USDA/NASA, Survey of Earned Doctorates
63 SO

TABLE 28. Employment sector of doctorate recipients with postgraduation commitments in the United States by demographicgroup for selected years, 1979-1999
Total Male FemaleU.S.
CitizenPerm.Visa
U.S. Citizens and Permanent Residents
Temp.Visa Aslant Black
Hisp-anic
Amer.Indiant White
All Employment Commitments
1979 N 14,771 10,597 4,174 13,746 539 470 472 588 275 44 12,2981984 N 13,363 8,613 4,750 12,245 452 648 394 528 290 35 11,2921989 N 13,893 8,282 5,611 12,336 513 1,033 459 479 312 51 11,3851994 N 15,117 8,328 6,787 13,069 840 1,205 818 639 464 70 11,8651999 N 16,170 8,975 7,195 13,389 795 1,925 875 851 550 91 11,643
Employment Commitments with Responses to Sector
1979 N 14,740 10,575 4,165 13,718 537 469 471 586 275 44 12,275
1984 N 13,346 8,603 4,743 12,230 452 646 391 527 290 35 11,281
1989 N 13,872 8,270 5,602 12,318 512 1,031 458 479 311 51 11,3691994 N 14,871 8,211 6,658 12,864 824 1,180 804 627 451 69 11,6851999 N 16,003 8,897 7,106 13,254 786 1,903 864 836 541 90 11,540
Academe
1979 % 55.2 51.9 63.5 55.7 42.8 54.6 31.4 59.6 70.5 59.1 55.51984 % 50.7 47.4 56.7 49.9 53.1 63.9 37.6 53.1 58.6 51.4 50.1
1989 % 52.8 49.1 58.2 51.6 59.8 62.9 39.7 57.8 55.6 37.3 52.1
1994 % 52.1 46.4 59.1 52.8 45.9 49.2 38.4 55.3 59.4 68.1 52.8
1999 % 49.2 43.6 56.2 51.7 44.0 34.7 36.0 57.1 59.0 53.3 51.6
Industry/Self-Employed
1979 % 16.9 20.6 7.5 15.2 46.4 33.5 52.4 7.7 8.0 6.8 15.51984 % 19.2 23.2 11.9 18.0 34.7 30.7 44.2 7.8 12.1 8.6 18.4
1989 % 20.6 26.2 12.3 19.2 32.0 31.2 45.6 7.7 17.0 29.4 19.1
1994 % 21.4 28.7 12.5 18.0 44.2 42.9 49.0 7.5 12.0 14.5 18.51999 % 27.8 36.3 17.1 21.9 44.5 60.4 50.1 12.2 17.6 13.3 22.2
Government
1979 % 12.7 13.3 11.1 13.3 4.7 3.6 10.2 15.9 13.5 11.4 13.0
1984 % 11.7 12.6 9.9 12.5 4.4 1.2 11.5 14.2 15.5 14.3 12.0
1989 % 10.2 10.7 9.5 11.2 2.0 2.2 7.0 13.8 10.9 13.7 10.9
1994 % 8.7 9.9 7.3 9.6 4.6 1.7 6.2 9.6 8.9 10.1 9.5
1999 % 7.5 8.3 6.5 8.7 2.8 0.9 5.8 7.4 8.3 8.9 8.7
Other
1979 % 15.2 14.1 18.0 15.8 6.1 8.3 5.9 16.9 8.0 22.7 16.01984 % 18.5 16.8 21.5 19.6 7.7 4.2 6.6 24.9 13.8 25.7 19.5
1989 % 16.4 14.1 20.0 17.9 6.3 3.6 7.6 20.7 16.4 19.6 17.8
1994 % 17.7 15.0 21.1 19.6 5.3 6.2 6.3 27.6 19.7 7.2 19.2
1999 % 15.5 11.8 20.2 17.6 8.7 3.9 8.1 23.3 15.2 24.4 17.5
1-Includes Pacific Islander.Includes Alaskan Native.
SOURCE: NSF/NIH/USED/NEH/USDA/NASA, Survey of Earned Doctorates
64

Table 2-1. Percentages of U.S. citizen doctorate recipients in 1999 who remained in thesame state in which they were born, by demographic background and employment sector
Number
Same Birth, HighSchool, College,Doctorate, and
Employment StateNo Two
the Same
Total 23,153 13.4 8.7
By SexMale 11,940 11.4 9.0Female 11,213 15.6 8.4
By Race/EthnicityAmerican Indian* 173 18.5 8.1Asian+ 494 15.0 9.7Black 1,275 18.3 6.8Hispanic 712 22.9 4.8White 20,216 12.7 8.9
By Marital StatusMarried/marriage-like 14,679 14.6 8.0Separated/Widowed /Divorced 1,824 15.6 7.3Never married 6,481 10.3 10.7
By Parents' EducationSome college or less 8,326 19.9 3.2Bachelor's or higher 14,669 9.8 11.8
By Employment Sector#Academe 8,441 12.6 8.7Government 1,278 13.9 9.1Private Sector 3,756 12.4 8.7Other 2,735 27.1 5.1
`Includes Alaskan Native. +Includes Pacific Islander.#The Ns for employment sector do not sum to the total N because many respondents did not have or did not report aspecific job commitment at the time they completed the SED questionnaire.
SOURCE: NSF/NIH/USED/NEH/USDA/NASA, Survey of Earned Doctorates
Table 2-2. Percentages of U.S. citizen doctorate recipients in 1999 who migrated interstate at different transitionpoints, by demographic background and employment sector
NumberBirth &
High SchoolHigh School& College
College &Doctorate
Doctorate &Employment
Total 23,153 34.0 36.1 68.8 55.2
By SexMale 11,940 34.6 36.5 70.4 59.2Female 11,213 33.4 35.6 67.0 50.9
By Race/EthnicityAmerican Indian* 173 33.5 30.1 62.4 57.8Asian+ 494 41.9 38.7 64.2 53.6Black 1,275 28.2 36.8 64.5 52.2Hispanic 712 27.1 23.9 60.1 51.1White 20,216 34.4 36.4 69.5 55.5
By Marital StatusMarried/Marriage-like 14,679 34.0 35.0 68.0 51.8Separated/Widowed /Divorced 1,824 32.6 31.5 64.4 50.1Never married 6,481 34.4 39.7 71.6 64.3
By Parents' EducationSome college or less 8,326 21.8 24.1 62.0 49.1Bachelor's or higher 14,669 41.0 42.9 72.6 58.6
By Employment Sector#Academe 8,441 33.0 35.5 70.0 58.6Government 1,278 36.6 35.4 68.8 52.5Private Sector 3,756 35.4 36.7 67.9 54.7Other 2,735 28.5 30.1 56.7 35.3
*Includes Alaskan Native. +Includes Pacific Islander.#The Ns for employment sector do not sum to the total N because many respondents did not have or did not report a specific jobcommitment at the time they completed the SED questionnaire.
SOURCE: NSF/NIH/USED/NEH/USDA/NASA, Survey of Earned Doctorates
65
82 BEST COPY AVAILABLE
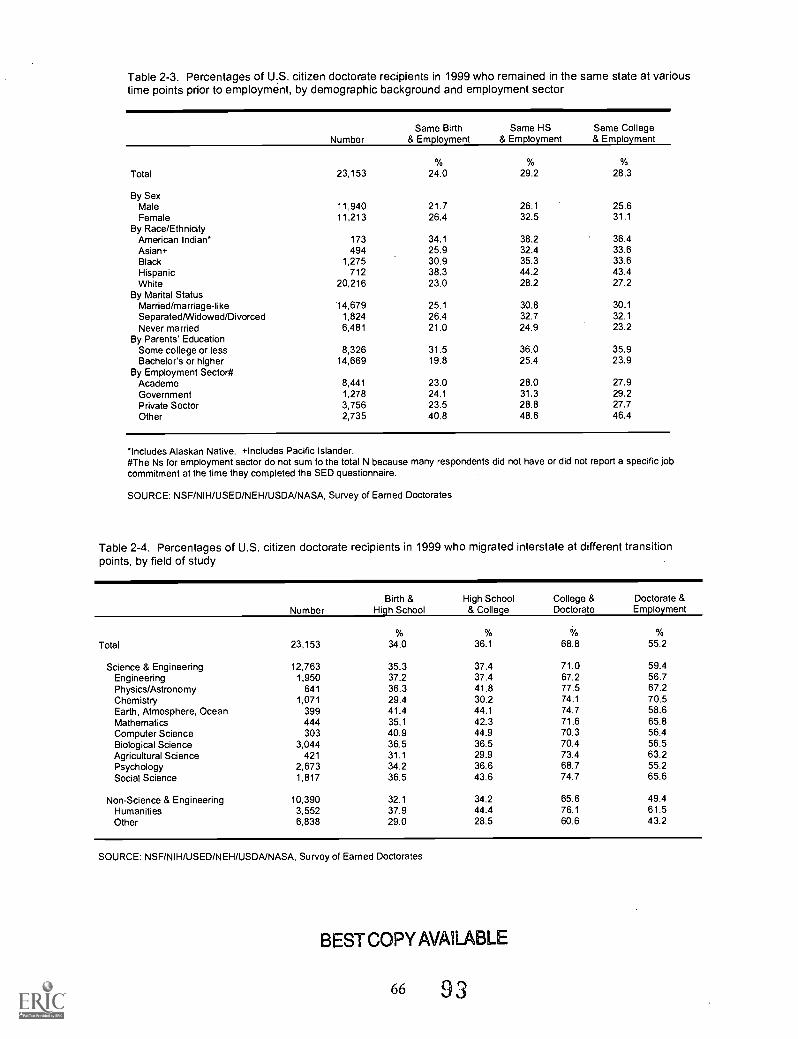
Table 2-3. Percentages of U.S. citizen doctorate recipients in 1999 who remained in the same state at varioustime points prior to employment, by demographic background and employment sector
NumberSame Birth
& EmploymentSame HS
& EmploymentSame College& Employment
Total 23,153 24.0 29.2 28.3
By SexMale 11,940 21.7 26.1 25.6Female 11,213 26.4 32.5 31.1
By Race/EthnicityAmerican Indian* 173 34.1 38.2 36.4Asian+ 494 25.9 32.4 33.6Black 1,275 30.9 35.3 33.6Hispanic 712 38.3 44.2 43.4White 20,216 23.0 28.2 27.2
By Marital StatusMarried/marriage-like '14,679 25.1 30.8 30.1
Separated/Widowed/Divorced 1,824 26.4 32.7 32.1
Never married 6,481 21.0 24.9 23.2By Parents' Education
Some college or less 8,326 31.5 36.0 35.9Bachelor's or higher 14,669 19.8 25.4 23.9
By Employment Sector#Academe 8,441 23.0 28.0 27.9Government 1,278 24.1 31.3 29.2Private Sector 3,756 23.5 28.8 27.7Other 2,735 40.8 48.6 46.4
*Includes Alaskan Native. +Includes Pacific Islander.#The Ns for employment sector do not sum to the total N because many respondents did not have or did not report a specific jobcommitment at the time they completed the SED questionnaire.
SOURCE: NSF/NIH/USED/NEH/USDA/NASA, Survey of Earned Doctorates
Table 2-4. Percentages of U.S. citizen doctorate recipients in 1999 who migrated interstate at different transitionpoints, by field of study
NumberBirth &
High SchoolHigh School
& CollegeCollege &Doctorate
Doctorate &Employment
Total 23,153 34.0 36.1 68.8 55.2
Science & Engineering 12,763 35.3 37.4 71.0 59.4Engineering 1,950 37.2 37.4 67.2 56.7Physics/Astronomy 641 36.3 41.8 77.5 67.2Chemistry 1,071 29.4 30.2 74.1 70.5Earth, Atmosphere, Ocean 399 41.4 44.1 74.7 58.6Mathematics 444 35.1 42.3 71.6 65.8Computer Science 303 40.9 44.9 70.3 56.4Biological Science 3,044 36.5 36.5 70.4 56.5Agricultural Science 421 31.1 29.9 73.4 63.2Psychology 2,673 34.2 36.6 68.7 55.2Social Science 1,817 36.5 43.6 74.7 65.6
Non-Science & Engineering 10,390 32.1 34.2 65.6 49.4Humanities 3,552 37.9 44.4 76.1 61.5Other 6,838 29.0 28.5 60.6 43.2
SOURCE: NSF/NIH/USED/NEH/USDA/NASA, Survey of Earned Doctorates
BEST COPY AVAILABLE
66 93

APPENDICES
67 94

APPENDIX A: The Seven Basic Tables, 1999
Appendix A includes the following seven tables:
A-1 Number of Doctorate Recipients, by Sex and Subfield, 1999
A-2 Number of Doctorate Recipients, by Citizenship, Race/Ethnicity, and Subfield,1999
A-3 Statistical Profile of Doctorate Recipients, by Major Field, 1999
A-4 Statistical Profile of Doctorate Recipients, by Race/Ethnicity and Citizenship,1999
A-5 Doctorate Recipients' Financial Resources in Support of Doctoral Programs, byBroad Field and Sex, 1999
A-6 State of Doctoral Institution of Doctorate Recipients, by Broad Field and Sex,1999
A-7 Institutions Granting Research Doctorates, by Major Field, 1999
TABLE A-1 and TABLE A-2: Tables A-1 and A-2 display data for the most recent year by
subfield of doctorate. Field groupings may differ from those in reports published by Federal
sponsors of the Survey of Earned Doctorates (SED). The "general" field categoriese.g.,
"chemistry, general"include individuals who either received the doctorate in the general
subject area or did not indicate a particular specialty field. The "other" field categoriese.g.,
"chemistry, other"include individuals whose specified doctoral discipline was not among the
specialty fields listed.
Table A-1 presents data by doctoral specialty and sex. Table A-2 displays doctoral
specialty by citizenship and race/ethnicity. For a detailed description of the racial/ethnic variable,
see the explanatory note for Table A-4.
TABLE A-3: Table A-3 is composed of three 2-page tables. The first table (A-3a) includes data
on all research doctorate recipients from the most recent year; the other two tables (A-3b and
A-3c) present the same data by sex. Field groupings may differ from those in reports published
by Federal sponsors of the SED. Terms requiring definition are as follows:
69

Percentage with Master's: The percentage of doctorate recipients in a field who received a
master's degree in any field before earning the doctorate.
Median Age at Doctorate: One-half received the doctorate at or before this age. A recipient's
age is obtained by subtracting the month/year of birth from the month/year of doctorate (see note
on next page).
Median Time Lapse: "Total Time" refers to the total calendar time elapsed between the
month/year of baccalaureate and the month/year of doctorate. "Registered Time refers to the
actual time in attendance at colleges and universities between receipt of the baccalaureate and the
doctorate.
Postgraduation Plans: Each year's doctorate recipients provide information on post-
graduation employment or study plans in response to items Bl through B9 on the survey form.
Since the questionnaire is filled out around the time the doctorate is awarded, a recipient's plans
are subject to change. However, comparisons with the longitudinal Survey of Doctorate
Recipients (SDR) have shown SED data to be a reasonable indicator of actual employment status
in the year following the doctorate, although results vary by sector. (The SDR is a follow-up
employment survey of a sample of doctorate recipients in science, engineering, and, until 1995,
humanities fields.)
In Table A-3 the postgraduation plans of doctorate recipients are grouped as follows:
"Postdoctoral Study Plans" (fellowship, research internship, traineeship, other), "Planned
Employment after Doctorate" (educational institution, industry, etc.), and "Postdoctoral Plans
Unknown." These categories include recipients who were still negotiating or seeking positions at
the time of survey completion, as well as those whose plans were definite. The sum of these lines
equals 100 percent for each column, with allowance for rounding: for example, 28.0 percent of
all psychology doctorate recipients had postdoctoral study plans, 54.2 percent planned to be
employed, and 17.8 percent did not report their post-graduation plans, totaling 100 percent. The
postdoctoral study row is further subdivided by type of study or appointment (fellowships,
research associateships, traineeships, and other study). The percentages in these subdivisions
sum to the percent of respondents in the given column who reported plans for postdoctoral study.
The employment row is similarly subdivided by type of employer. The percentages for these
rows add to percentage of respondents in the given column who planned employment. The

category for educational institutions includes elementary and secondary schools as well as
colleges and universities, and the category for government includes military service.
The four lines of data beginning with "Definite Postdoctoral Study" distinguish between
individuals who had definite postgraduation plans at the time of survey completion (item Bl:
"Am returning to, or continuing in, predoctoral employment" or "Have signed contract or made
definite commitment") and those who were still seeking employment or postdoctoral study
(item B 1: "Am negotiating with one or more specific organizations," "Am seeking position but
have no specific prospects," or "Other"). These four lines, when added to the prior line,
"Postdoctoral Plans Unknown," total 100 percent with allowance for rounding. The two lines
"Definite Postdoctoral Study" and "Seeking Postdoctoral Study" add to give the percentage for
"Postdoctoral Study Plans"; the two lines "Definite Employment" and "Seeking Employment"
add to give the percentage for "Planned Employment After Doctorate."
Percentages showing the distribution of doctorate recipients by postdoctoral work activity
and region of employment are based only on the number of recipients who had definite
employment commitments at the time they completed the questionnaire. These percentages
exclude recipients who planned postdoctoral study (as described above) and recipients who were
still seeking employment at the time they completed the questionnaire. (Note that the rows on
specific postdoctoral study and employment plans discussed earlier include individuals whose
plans were not definite.)
The U.S. regions of employment shown in Table A-3 include the following states and
territories:
New England: Connecticut, Maine, Massachusetts, New Hampshire,Rhode Island, Vermont
Middle Atlantic: New Jersey, New York, Pennsylvania
East North Central: Illinois, Indiana, Michigan, Ohio, Wisconsin
West North Central: Iowa, Kansas, Minnesota, Missouri, Nebraska, NorthDakota, South Dakota
South Atlantic: Delaware, District of Columbia, Florida, Georgia,Maryland, North Carolina, South Carolina, Virginia, WestVirginia
East South Central: Alabama, Kentucky, Mississippi, Tennessee
71 97

West. South Central.. Arkansas, Louisiana, Oklahoma, Texas
Mountain:
Pacific & Insular:
Arizona, Colorado, Idaho, Montana, Nevada, New Mexico,Utah, Wyoming
Alaska, California, Hawaii, Oregon, Washington, AmericanSamoa, Guam, Puerto Rico, Trust Territory, Virgin Islands
TABLE A-4: Table A-4 contains data by race/ethnicity and citizenship for selected variables
included in Tables A-3 and A-5. Field groupings may differ from those in reports published by
Federal sponsors of the SED.
The racial/ethnic question has undergone several revisions over the years. In 1977 it was
modified to correspond to a standard question format recommended by the Federal Interagency
Committee on Education and adopted by the Office of Management and Budget (OMB) for use
in Federally sponsored surveys; an explanation of the effect of these changes is detailed on
page 13 of Summary Report 1977. (Note: Changes in the OMB guidelines prompted the
reclassification of persons having origins in the Indian subcontinent from the white category to
the Asian category.) In 1980 the item was further revised in two ways: (1) the Hispanic category
was subdivided into Puerto Rican, Mexican American, and other Hispanic to provide more detail
for users of the racial/ethnic data; and (2) respondents were asked to check only one racial
category. (Before 1980, doctorate recipients could check more than one category to indicate their
race.)
The item was modified again in 1982 to separate the questions on race and ethnicity.
Since then respondents have been asked to first indicate whether or not they are Hispanic, and
then check one of the four racial group categories (American Indian, Asian, black, or white). In
Table A-4, doctorate recipients who reported Hispanic heritage, regardless of racial designation,
are included in one of three Hispanic groups: Puerto Rican, Mexican American, or other
Hispanic. The remaining survey respondents are then counted in the respective racial groups.
(Note: Doctorate recipients who checked the category "American Indian or Alaskan Native" are
identified as American Indian in this report.)
In the section of "Doctoral Program Support" a recipient counts in more than one
category if support was received from multiple sources. Because a student counts more than once
72

for sources of support, the vertical percentages sum to more than 100 percent. See the
explanatory note on Appendix Table A-5 for further detail. (Data on the primary source of
support for doctorate recipients are presented in the body of the report.)
The other sections in Table A-4 correspond to many of those in Appendix Table A-3. The
reader is referred to the explanatory note on Table A-3 for additional information.
TABLE A-5: Table A-5 displays data reported in item All on financial resources used in
support of the respondent's doctoral program, by broad field and sex of recipient. Field
groupings may differ from those in reports published by Federal sponsors of the SED.
A recipient counts in more than one category in Table A-5 if more than one financial
resource was reported. Because a student counts once for each of his/her financial resources, the
vertical percentages sum to more than 100 percent. (Data on the primary financial resources for
doctorate recipients are presented in the body of the report.) Please consult Appendix C:
Technical Notes for additional information on changes in the coding of Sources of
Support/Financial Resources.
TABLE A-6: Table A-6 shows, by broad field and sex, the number of persons receiving a
research doctorate in the most recent year from institutions in each of the 50 states, the District of
Columbia, and Puerto Rico. Field groupings may differ from those in reports published by
Federal sponsors of the SED. See Appendix E of the Summary Report for a description of field
groupings as reported in this table; see the questionnaire's Specialties List in Appendix D of the
Summary Report for the names and codes of the subfields included.
TABLE A-7: Table A-7 displays data by doctorate-granting institution and major field. It
includes all institutions in the United States (the 50 states, the District of Columbia, and Puerto
Rico) that awarded research doctoral degrees in the most recent year, except Arkansas State
University which did not participate. Field groupings may differ from those in reports published
by Federal sponsors of the SED and from departmental designations at institutions.

APPENDIX TABLE A-1. Number of doctorate recipients, by sex and subfield, 1999
Number of Doctorates Number of DoctoratesSubfield of Doctorate Total Men Women Subfield of Doctorate Total Men Women
TOTAL ALL FIELDS* 41.140 23,460 17.493 Engineering Science 51 46 4Environmental Health Engineering 78 65 13
PHYSICAL SCIENCES 6 324 4 821 1474 Industgal/Manufacturing 209 166 43Materials Science 394 316 75
MATHEMATICS 1,085 805 277 Mechanical 785 693 84Metallurgical 43 37 4
Applied Mathematics 252 193 59 Mining & Mineral 18 16 2
Algebra 84 58 25 Nuclear 77 69 8
Analysis & Functional Analysis 87 68 19 Ocean 16 15 1
Geometry 65 49 16 Operations Research 67 51 16Logic 23 18 5 Petroleum 45 40 5
Number Theory 50 38 12 Polymer/Plastics 53 36 17
Mathematical Statistics 174 128 46 Systems 42 34 7Topology 65 50 15 Engineering, General 39 32 4Computing Theory & Practice 14 11 3 Engineering, Other 216 151 58Operations Research 21 12 9Mathematics, General 117 93 22 LIFE SCIENCES 8 126 4.473 3 620Mathematics, Other 133 87 46
BIOLOGICAL SCIENCES 5,600 3,181 2,400COMPUTER SCIENCE 850 687 156
Biochemistry 763 451 310Computer Science 735 609 119 Biomedical Sciences 177 101 72Information Sciences & Systems 115 78 37 Biophysics 173 124 49
Biotechnology Research 19 17 2
PHYSICS & ASTRONOMY 1,431 1,231 192 Bacteriology 13 7 6Plant Genetics 31 22 9
Astronomy 60 43 17 Plant Pathology 36 24 12
Astrophysics 100 85 15 Plant Physiology 54 31 23Acoustics 16 15 1 Botany, Other 68 42 26Chemical & Atomic/Molecular 99 85 14 Anatomy 33 17 16
Elementary Particles 169 152 17 Biometrics and Biostatistics 76 39 36Fluids 23 19 2 Cell Biology 285 148 136Nuclear 76 67 9 Ecology 272 150 121
Optics 97 84 12 Developmental Biology/Embryology 108 54 54Plasma & High-Temperature 49 47 2 Endocrinology 19 10 9
Polymer 28 21 7 Entomology 113 77 36Solid State & Low-Temperature 308 266 42 Biological Immunology 223 123 100Physics, General 205 177 23 Molecular Biology 719 419 299Physics, Other 201 170 31 Microbiology 382 218 163
Neuroscience 437 253 183CHEMISTRY 2,134 1,494 633 Nutritional Sciences 104 34 69
Parasitology 13 7 6Analytical 333 225 108 Toxicology 115 62 53Inorganic 279 189 90 Human & Animal Genetics 217 110 106Nuclear 10 9 1 Human & Animal Pathology 120 65 54Organic 564 399 163 Human & Animal Pharmacology 254 141 113Medicinal/Pharmaceutical 132 81 51 Human & Animal Physiology 243 134 108Physical 310 235 75 Zoology, Other 126 79 47Polymer 95 64 31 Biological Sciences, General 182 104 75Theoretical 56 47 9 Biological Sciences, Other 225 118 107Chemistry, General 196 139 52Chemistry, Other 159 106 53 HEALTH SCIENCES 1,410 499 901
EARTH, ATMOS., & MARINE SCI. 824 604 216 Speech-Lang. Pathology & Audiology 86 31 55Environmental Health 69 39 28
Atmospheric Physics & Chemistry 43 32 11 Health Systems/Services Admin. 62 22 38Atmospheric Dynamics 16 12 4 Public Health 171 57 112Meteorology 22 21 1 Epidemiology 180 67 112Atmos. Sci./Meteorology, General 33 29 3 Exercise Physiology/Sci., Kinesiology 104 70 34Atmos. Sci./Meteorology, Other 10 7 3 Nursing 358 15 340Geology 158 117 41 Pharmacy 137 82 55Geochemistry 55 34 21 Rehabilitation/Therapeutic Services 26 6 20Geophysics & Seismology 100 84 15 Veterinary Medicine 49 27 22Paleontology 15 11 4 Health Sciences, General 32 13 19Mineralogy, Petrology 14 11 3 Health Sciences, Other 136 70 66Stratigraphy, Sedimentation 17 14 3
Geomorphology & Glacial Geology 18 9 9 AGRICULTURAL SCIENCES 1,116 793 319Geological & Related Sci., General 9 7 1
Geological & Related Sci., Other 35 25 10 Agricultural Economics 149 110 39Environmental Science 100 68 31 Agricultural Business & Management 2 2 0
Hydrology & Water Resources 32 27 5 Animal Breeding & Genetics 21 14 7
Oceanography 100 64 36 Animal Nutrition 46 34 12Marine Sciences 30 21 9 Dairy Science 12 7 5
Misc. Physical Sciences, Other 17 11 6 Poultry Science 8 4 2
Fisheries Science & Management 38 31 7
ENGINEERING 5.337 4.503 791 Animal Sciences, Other 71 48 23Agronomy & Crop Science 106 90 16
Aerospace, Aeronautic., Astronautic. 207 189 17 Plant Breeding & Genetics 44 31 13Agricultural 59 47 12 Plant Pathology 66 39 27Bioengineering & Biomedical 245 181 63 Plant Sciences, Other 38 26 12Ceramic Sciences 33 24 9 Food Engineering 7 5 2
Chemical 580 477 102 Food Sciences, Other 137 70 67Civil 507 430 76 Soil Chemistry/Microbiology 29 21 8
Communications 38 32 6 Soil Sciences, Other 67 55 11
Computer 206 171 33 Horticulture Science 66 50 16Electrical, Electronics 1,233 1,105 117 Forest Biology 14 10 4
Engineering Mechanics 68 56 11 Forest Engineering 1 1 0Engineering Physics 28 24 4 Forest Management 17 14 3
SOURCE: NSF/NIH/USED/NEH/USDA/NASA, Survey of Earned Doctorates
74
100 BEST COPYAVAILABLE

APPENDIX TABLE A-1. Number of doctorate recipients, by sex and subfield, 1999
Subfield of DoctorateNumber of Doctorates
Total Men Women Subfield of DoctorateNumber of Doctorates
Total Men Women
Wood Sci. & Pulp/Paper Tech. 21 15 6 Humanities, General 24 10 14
Conservation/Renewable Nat. Res. 25 16 9 Humanities, Other 131 51 79Forestry & Related Sci., Other 49 32 16Wildlife/Range Management 44 36 8 EDUCATION 6,557 2 344 4.196Agricultural Sciences, General 8 8 0Agricultural Sciences, Other 30 24 6 Curriculum & Instruction 996 280 712
Educational Admin. & Supervision 897 361 536SOCIAL SCIENCES (INCL. PSYCH.' 7 036 3 194 3 819 Educational Leadership 1,150 456 693
Educ./Instruct. Media Design 123 69 54Anthropology 461 200 261 Educ. Stat./Research Methods 57 23 33Area Studies 11 8 3 Educ. Assess., Test., & Meas. 39 20 19
Criminology 51 31 20 Educational Psychology 298 80 218Demography/Population Studies 28 10 17 School Psychology 109 19 90Economics 912 661 247 Social/Phil. Found. Of Educ. 125 60 65Econometrics 15 10 5 Special Education 263 58 204Geography 144 95 49 Counseling Educ./Couns. & Guidance 261 97 164
International Relations/Affairs 120 81 38 Higher Educ./Evaluation & Research 464 182 281Political Science and Government 653 435 215 Pre-elementary/Early Childhood 49 4 45Public Policy Analysis 124 68 55 Elementary Education 59 12 47
Sociology 543 218 324 Secondary Education 31 12 19
Statistics 72 49 21 Adult & Continuing Education 153 62 90Urban Affairs/Studies 57 40 17
Social Sciences, General 25 11 14 TEACHING FIELDS 891 359 529Social Sciences, Other 153 67 86
Agricultural Education 38 24 14
PSYCHOLOGY 3,667 1,210 2,447 Art Education 47 16 31
Business Education 45 14 30
Clinical 1,449 408 1,040 English Education 64 13 51
Cognitive & Psycho linguistics 143 73 70 Foreign Languages Education 62 17 45
Comparative 11 4 7 Health Education 58 18 40
Counseling 461 165 296 Home Economics Education 10 2 8
Developmental and Child 193 44 149 Technical/Industrial Arts Education 21 15 6
Human /Indv. & Family Development 130 23 107 Mathematics Education 101 38 62
Experimental 137 73 64 Music Education 79 37 41
Educational 66 20 45 Nursing Education 22 3 19
Family & Marriage Counseling 55 17 38 Physical Education and Coaching 114 63 51
Industrial & Organizational 158 59 99 Reading Education 68 9 59
Personality 16 5 11 Science Education 58 30 28
Physiological/Psychobiology 87 37 50 Social Science Education 9 7 2
Psychometrics 15 13 2 Technical Education 27 21 6
Quantitative 14 7 7 Trade & Industrial Education 14 11 3
School 120 32 88 Teacher Ed./Spec. Acad. & Voc., Other 54 21 33
Social 175 60 114Psychology, General 229 97 125 Education, General 199 57 137
Psychology, Other 208 73 135 Education, Other 393 133 260
HUMANITIES 5 468 2 777 2 658 PROFESSIONAUOTHER FIELDS 2 292 1 348 935
History, American 418 253 165 BUSINESS AND MANAGEMENT 1,104 756 342History, Asian 68 45 23History, European 235 144 91 Accounting 153 92 60
History/Philosophy of Sci. & Tech. 49 31 18 Banking/Financial Support Services 75 62 13
History, General 76 50 26 Business Admin. & Management 311 228 80
History, Other 165 88 77 Business/Managerial Economics 42 32 10
Classics 77 46 31 International Business 34 26 8
Comparative Literature 166 67 98 Mgmt. Info. Sys./Bus. Data Proc. 83 59 24
Linguistics 250 99 147 Marketing Management & Research 127 89 38
Speech & Rhetorical Studies 150 65 85 Operations Research 52 45 7
Letters, General 19 6 13 Organizational Behavior 100 42 58
Letters, Other 83 30 53 Bus. Mgmt./Admin. Serv., General 50 31 17
American Studies 98 40 56 Bus. Mgmt./Admin. Sem., Other 77 50 27
Archeology 26 14 12
Art History/Criticism/Conservation 189 56 132 COMMUNICATIONS 379 181 197
Music 769 426 323Philosophy 387 290 96 Communications Research 50 28 22
Religion 337 255 82 Mass Communications 153 78 74
Drama/Theater Arts 99 50 49 Communications Theory 47 20 27
Communications, General 69 28 41
LANGUAGE & LITERATURE 1,652 661 988 Communications, Other 60 27 33
American 372 147 225 OTHER PROFESSIONAL FIELDS 781 396 384
English 652 271 379French 149 44 105 Architectural Environmental Design 65 45 20
German 90 32 58 Home Economics 23 6 17
Italian 20 7 13 Law 37 26 10
Spanish 201 81 120 Library Science 39 10 29
Russian 26 9 17 Parks/Recreation/Leisure/Fitness 29 17 12
Slavic 17 10 7 Public Administration 119 71 48
Chinese 27 10 17 Social Work 229 58 171
Japanese 10 6 4 Theology/Religious Education 168 130 38Hebrew 4 2 2 Professional Fields, General 9 2 7
Arabic 12 7 5 Professional Fields, Other 63 31 32
Other Language & Literature 72 35 36OTHER/UNKNOWN FIELDS 28 15 12
NOTE: Field groupings may differ from those in reports published by federal sponsors of the Survey of Eamed Doctorates.*Grand totals include 187 doctorate recipients whose gender was unknown and 28 doctorate recipients whose doctoral field was unknown.
SOURCE: NSF/NIH/USED/NEH/USDA/NASA, Survey of Earned Doctorates
75
1 01 BEST COPY AVAILABLE

APPENDIX TABLE A-2. Number of doctorate recipients by citizenship, race/ethnicity, and subfield, 1999
Subfield of DoctorateTotal
Doctorates*
Non-U.S.CitizensTemp.Visas
U.S. Citizens and Permanent Residents
TotalAmericanIndianf Aslant Black White
PuertoRican
MexicanAmer.
OtherHispanic
Unkn.Race
TOTAL ALL FIELDS 41.140 9 068 29.922 219 2 518 1 729 23.725 292 344 610 485
PHYSICAL SCIENCES 6324 2,146 3.872 18 ,JAJ, 110 3115 31 29 46 $.2
MATHEMATICS 1,085 444 605 1 59 12 506 2 7 6 12
Applied Mathematics 252 108 140 0 20 6 109 1 1 1 2Algebra 84 29 55 1 3 1 47 1 1 0 1
Analysis & Functional Analysis 87 35 52 0 4 1 46 0 0 0 1
Geometry 65 25 40 0 5 0 32 0 1 1 1
Logic 23 12 11 0 0 0 10 0 0 1 0Number Theory 50 18 32 0 4 2 22 0 1 2 1
Mathematical Statistics 174 84 89 0 10 1 75 0 1 0 2Topology 65 26 39 0 4 0 32 0 2 0 1
Computing Theory & Practice 14 3 11 0 1 0 10 0 0 0 0Operations Research 21 8 13 0 1 0 12 0 0 0 0Mathematics, General 117 44 44 0 3 1 37 0 0 0 3Mathematics, Other 133 52 79 0 4 0 74 0 0 1 0
COMPUTER SCIENCE 850 330 483 1 86 18 348 6 1 7 16
Computer Science 735 308 401 1 74 10 288 5 1 7 15Information Sciences & Systems 115 22 82 0 12 8 60 1 0 0 1
PHYSICS 8 ASTRONOMY 1,431 501 851 5 70 10 732 3 7 5 19
Astronomy 60 14 42 0 0 2 39 0 0 0 1
Astrophysics 100 25 74 2 3 0 69 0 0 0 0Acoustics 16 1 14 0 0 0 11 1 0 0 2Chemical & Atomic/Molecular 99 33 64 0 2 0 58 0 1 0 3Elementary Particle 169 65 102 1 10 0 87 1 1 0 2Fluids 23 7 13 0 0 0 12 0 0 0 1
Nuclear 76 33 43 0 2 0 41 0 0 0 0Optics 97 32 60 0 4 2 51 0 0 1 2Plasma & High-Temperature 49 16 32 0 4 0 26 0 1 0 1
Polymer 28 13 15 0 1 0 14 0 0 0 0Solid State & Low-Temperature 308 141 165 0 18 2 138 1 2 2 2Physics, General 205 55 97 2 11 1 79 0 1 1 2Physics, Other 201 66 130 0 15 3 107 0 1 1 3
CHEMISTRY 2,134 624 1,400 5 187 56 1,088 15 9 18 22
Analytical 333 78 252 1 28 10 204 4 2 3 0Inorganic 279 62 214 0 20 12 174 1 3 3 1
Nuclear 10 2 8 0 0 1 6 0 0 1 0Organic 564 178 374 1 59 17 279 3 3 3 9Medicinal /Pharmaceutical 132 46 80 0 23 2 51 1 0 1 2Physical 310 92 207 0 21 5 171 2 0 4 4Polymer 95 38 57 0 6 4 47 0 0 0 0Theoretical 56 19 37 0 6 1 30 0 0 0 0Chemistry, General 196 51 77 1 12 2 55 1 0 2 4
Chemistry, Other 159 58 94 2 12 2 71 3 1 1 2
EARTH, ATMOS., & MARINE SCIENCE 824 247 533 6 39 14 441 5 5 10 13
Atmospheric Physics & Chem. 43 18 23 0 2 2 18 0 0 1 0
Atmospheric Dynamics 16 8 8 0 0 0 7 1 0 0 0
Meteorology 22 5 16 0 3 0 13 0 0 0 0Atmos.Sci./Meteorology, General 33 11 19 0 2 0 16 0 0 1 0Atmos.Sci./Meteorology, Other 10 0 10 0 2 0 8 0 0 0 0Geology 158 48 102 3 6 2 84 0 3 2 2
Geochemistry 55 22 33 0 4 1 26 0 0 0 2Geophysics & Seismology 100 34 62 0 5 1 53 0 1 1 1
Paleontology 15 1 14 0 2 0 10 0 1 0 1
Mineralogy, Petrology 14 7 7 0 0 0 6 0 0 0 1
Stratigraphy, Sedimentation 17 5 12 0 0 0 12 0 0 0 0Geomorphology & Glacial Geol. 18 3 15 1 0 0 13 0 0 0 1
Geological & Related Sci., General 9 2 5 1 0 0 3 0 0 1 0Geological & Related Sci., Other 35 11 23 0 1 0 18 1 0 1 2
Environmental Science 100 27 64 0 4 3 56 0 0 0 1
Hydrology & Water Resources 32 9 21 1 2 2 16 0 0 0 0Oceanography 100 27 63 0 5 2 51 1 0 3 1
Marine Sciences 30 4 24 0 1 1 20 2 0 0 0Misc. Physical Sciences, Other 17 5 12 0 0 0 11 0 0 0 1
gNGINEERING 5.337 2.193 2,873 12 515 96 2 101 21 12 46 fizAerospace, Aeronautic., Astronautic. 207 83 111 0 13 1 96 0 0 0 1
Agricultural 59 35 24 0 4 1 19 0 0 0 0Bioengineering & Biomedical 245 62 168 1 31 8 122 0 1 3 2Ceramic Science 33 16 16 0 1 2 12 0 0 0 1
Chemical 580 224 338 2 51 10 263 2 0 5 5Civil 507 225 267 2 38 5 208 2 2 7 3
Communications 38 20 18 0 4 1 11 0 0 0 2
Computer 206 93 98 0 31 5 56 0 0 2 4
Electrical & Electronics 1,233 523 646 1 137 23 441 11 4 12 17
Engineering Mechanics 68 30 35 0 4 1 30 0 0 0 0Engineering Physics 28 6 21 0 4 0 16 0 0 1 0Engineering Science 51 21 27 1 3 1 19 0 1 1 1
Environmental Health Engineering 78 28 43 0 8 1 32 0 1 0 1
Industrial/Manufacturing 209 108 99 0 7 7 80 1 1 2 1
Materials Science 394 159 220 2 49 3 153 3 1 4 5
76
102

APPENDIX TABLE A-2. Number of doctorate recipients by citizenship, race/ethnicity, and subfield, 1999
Subfield of DoctorateTotal
Doctorates*
Non-U.S.CitizensTemp.Visas
U.S. Citizens and Permanent Residents
TotalAmericanIndiant Asians Black White
PuertoRican
MexicanAmer.
OtherHispanic
Unkn.
Race
Mechanical 785 323 425 2 85 11 304 2 1 6 14
Metallurgical 43 20 21 0 2 1 18 0 0 0 0Mining & Mineral 18 12 6 0 1 0 5 0 0 0 0Nuclear 77 26 49 0 9 3 36 0 0 0 1
Ocean 16 4 11 0 2 0 9 0 0 0 0Operations Research 67 29 38 1 7 0 28 1 0 0 1
Petroleum 45 36 8 0 3 0 5 0 0 0 0Polymer/Plastics 53 24 28 0 6 1 19 0 0 0 2
Systems 42 17 18 0 1 4 13 0 0 0 0Engineering, General 39 7 15 0 1 0 12 0 0 0 2
Engineering, Other 216 62 123 0 13 7 94 1 1 3 4
LIFE SCIENCES 8 126 2 109 5 726 28 755 203 4 433 51 60 115 81
BIOLOGICAL SCIENCES 5,600 1,286 4,118 20 619 116 3,139 39 41 84 60
Biochemistry 763 214 524 1 88 10 403 3 4 9 6
Biomedical Sciences 177 36 124 0 24 3 87 1 0 2 7
Biophysics 173 51 120 1 29 3 80 0 0 3 4
Biotechnology Research 19 6 13 0 5 1 7 0 0 0 0
Bacteriology 13 1 12 0 1 0 11 0 0 0 0
Plant Genetics 31 14 17 0 2 0 14 0 0 1 0
Plant Pathology 36 14 19 0 3 0 14 1 1 0 0Plant Physiology 54 17 36 1 2 0 26 0 1 5 1
Botany, Other 68 13 53 0 2 1 46 0 2 1 1
Anatomy 33 9 21 0 2 0 17 1 0 1 0
Biometrics and Biostatistics 76 24 43 0 8 6 29 0 0 0 0
Cell Biology 285 60 218 0 43 9 159 3 0 2 2
Ecology 272 37 228 1 4 3 212 3 1 2 2
Developmental Biology/Embryology 108 28 78 0 15 1 55 2 3 2 0
Endocrinology 19 5 14 0 2 0 12 0 0 0 0
Entomology 113 34 79 0 6 0 63 2 0 6 2
Biological Immunology 223 45 177 1 30 4 135 2 0 4 1
Molecular Biology 719 190 518 2 120 20 352 4 2 11 7
Microbiology 382 74 293 1 51 12 221 2 2 3 1
Neuroscience 437 76 350 2 47 4 264 6 8 11 8
Nutritional Sciences 104 33 65 1 5 5 48 1 1 3 1
Parasitology 13 2 11 0 1 1 8 0 0 0 1
Toxicology 115 22 92 2 12 1 75 1 0 1 0Human 8 Animal Genetics 217 49 157 3 17 3 127 1 1 3 2
Human & Animal Pathology 120 26 89 1 16 3 68 0 0 0 1
Human 8 Animal Pharmacology 254 57 190 1 22 11 149 0 3 3 1
Human & Animal Physiology 243 52 182 1 27 7 137 1 3 3 3
Zoology, Other 126 16 106 0 5 1 92 1 2 4 1
Biological Sciences, General 182 35 113 0 16 2 86 0 5 3 1
Biological Sciences, Other 225 46 176 1 14 5 142 4 2 1 7
HEALTH SCIENCES 1,410 287 1,043 6 85 57 836 11 16 19 13
Speech-Lang. Pathology & Audiology 86 17 64 0 1 3 55 1 1 1 2
Environmental Health 69 16 44 0 7 2 33 0 1 1 0
Health Systems/Services Admin. 62 13 42 0 5 4 31 1 1 0 0
Public Health 171 24 135 0 11 5 107 1 4 5 2
Epidemiology 180 29 142 0 14 7 110 1 5 4 1
Exercise Physiology/Sci., Kinesiology 104 18 83 0 7 2 71 2 1 0 0
Nursing 358 39 306 6 8 20 262 3 3 2 2
Pharmacy 137 63 64 0 14 5 42 0 0 1 2
Rehabilitation/Therapeutic Services 26 5 21 0 2 2 17 0 0 0 0Veterinary Medicine 49 28 21 0 1 1 15 1 0 2 1
Health Sciences, General 32 3 29 0 5 2 21 1 0 0 0
Health Sciences, Other 136 32 92 0 10 4 72 0 0 3 3
AGRICULTURAL SCIENCES 1,116 536 565 2 51 30 458 1 3 12 8
Agricultural Economics 149 75 74 0 6 6 60 0 0 1 1
Agricultural Business & Management 2 2 0 0 0 0 0 0 0 0 0
Animal Breeding & Genetics 21 10 11 0 3 0 8 0 0 0 0Animal Nutrition 46 19 27 0 1 2 23 0 1 0 0
Dairy Science 12 5 7 0 1 0 5 0 1 0 0
Poultry Science 8 4 2 0 0 0 2 0 0 0 0
Animal Sciences, Other 71 25 44 0 3 0 38 1 0 1 1
Agronomy & Crop Science 106 60 45 0 4 4 37 0 0 0 0
Plant Breeding 8 Genetics 44 25 18 0 1 1 14 0 0 2 0
Plant Pathology 66 40 25 0 4 1 17 0 0 2 0
Plant Sciences, Other 38 24 14 0 1 2 11 0 0 0 0
Food Engineering 7 4 3 0 1 0 2 0 0 0 0
Food Sciences, Other 137 79 58 1 10 3 40 0 0 4 0
Soil Chemistry/Microbiology 29 11 18 0 1 1 15 0 0 0 1
Soil Sciences, Other 67 30 36 1 2 5 27 0 0 0 1
Horticulture Science 66 40 25 0 5 0 19 0 0 0 1
Fisheries Science 8 Management 38 12 25 0 2 1 20 0 0 2 0
Forest Biology 14 7 7 0 0 0 7 0 0 0 0
Forest Engineering 1 1 0 0 0 0 0 0 0 0 0
Forest Management 17 4 13 0 0 0 13 0 0 0 0
Wood Sci. & Pulp/Paper Tech. 21 10 9 0 1 2 6 0 0 0 0Conservation/Renewable Nat. Res. 25 7 18 0 0 0 17 0 0 0 1
Forestry 8 Related Sci., Other 49 20 26 0 0 0 26 0 0 0 0
Wildlife/Range Management 44 9 35 0 2 0 32 0 1 0 0Agricultural Sciences, General 8 2 6 0 0 1 4 0 0 0 1
Agricultural Sciences, Other 30 11 19 0 3 1 15 0 0 0 0
77
10 3 BEST COPY AVAILABLE

APPENDIX TABLE A-2. Number of doctorate recipients by citizenship, race/ethnicity, and subfield, 1999
Subfield of DoctorateTotal
Doctorates*
Non-U.S.CitizensTemp.Visas
U.S. Citizens and Permanent Residents
TotalAmericanIndiant Aslant Black White
PuertoRican
MexicanAmer.
OtherHispanic
Unkn.Race
SOCIAL SCIENCES (INCL., PSYCH.). 7.036 9.69 5.610 ¢Q 229. )r) 4 538 65 70 165 79
Anthropology 461 56 380 8 19 16 312 3 3 6 13Area Studies 11 3 8 0 1 0 6 0 0 0 1
Criminology 51 3 48 0 2 4 38 1 0 1 2Demography/Population Studies 28 5 18 0 2 0 15 0 0 1 0Economics 912 410 459 1 57 23 351 2 4 12 9Econometrics 15 7 8 0 2 0 4 0 2 0 0Geography 144 25 115 1 3 4 99 1 1 1 5International Relations/Affairs 120 30 82 0 5 4 69 0 1 1 2
Political Science and Government 653 93 530 6 26 34 424 3 9 10 18Public Policy Analysis 124 21 91 0 9 8 73 0 1 0 0Sociology 543 72 438 4 28 47 331 4 5 16 3Statistics 72 47 16 0 2 0 13 . 0 0 1 0Urban Affairs/Studies 57 11 44 3 3 7 27 1 0 2 1
Social Sciences, General 25 9 16 0 0 2 14 0 0 0 0Social Sciences, Other 153 23 127 1 11 12 97 1 0 5 0
PSYCHOLOGY 3,667 154 3,230 36 129 173 2,665 49 44 109 25
Clinical 1,449 23 1,288 15 62 61 1,025 26 19 72 8
Cognitive & Psycho linguistics 143 22 119 2 2 3 106 0 3 2 1
Comparative 11 0 11 0 0 0 10 1 0 0 0Counseling 461 10 445 5 13 38 366 4 7 8 4Developmental and Child 193 15 175 0 16 13 140 2 2 1 1
Human/Indv. & Family Development 130 16 112 2 2 4 98 0 2 1 3Experimental 137 8 127 0 7 6 112 0 0 2 0Educational 66 3 59 0 2 8 48 0 0 1 0Family & Marriage Counseling 55 5 48 1 0 1 45 0 1 0 0Industrial & Organizational 158 6 143 1 5 3 123 4 2 5 0Personality 16 2 14 0 1 2 11 0 0 0 0Physiological/Psychobiology 87 5 81 1 4 2 67 0 2 4 1
Psychometrics 15 3 11 0 0 0 10 0 0 0 1
Quantitative 14 1 13 0 1 0 11 1 0 0 0School 120 4 116 3 2 3 104 1 0 3 0
Social 175 12 160 0 7 15 135 2 0 1 0Psychology, General 229 6 124 1 3 1 102 5 2 6 4
Psychology, Other 208 13 184 5 2 1 13 152 3 4 3 2
HUMANITIES 5 468 640 4 576 25 216 188 3 856 34 52 123 82
History, American 418 19 395 3 14 16 344 1 8 2 7
History, Asian 68 18 49 0 15 0 34 0 0 0 0
History, European 235 15 220 0 3 0 205 0 1 5 6
History/Philosophy of Sci, & Tech. 49 4 41 0 3 1 35 0 0 0 2
History, General 76 6 43 0 2 2 33 1 0 0 5History, Other 165 17 147 1 4 12 115 2 1 7 5
Classics 77 9 68 2 1 1 63 0 1 0 0Comparative Literature 166 29 128 0 5 7 97 2 1 10 6
Linguistics 250 85 154 1 13 4 121 4 5 4 2
Speech & Rhetorical Studies 150 4 144 1 2 5 130 0 1 1 4
Letters, General 19 0 19 0 0 0 18 0 0 0 1
Letters, Other 83 5 78 1 1 6 67 1 0 2 0
American Studies 98 5 86 3 3 14 63 0 1 2 0
Archaeology 26 6 18 0 1 0 16 0 0 0 1
Art History/Criticism/Conservation 189 17 167 1 10 3 149 0 1 2 1
Music 769 112 594 2 36 24 515 1 3 8 5
Philosophy 387 58 311 4 11 2 281 0 1 6 6
Religion 337 24 301 1 25 12 254 0 3 2 4
Drama/Theater Arts 99 12 83 0 2 7 72 1 0 1 0
LANGUAGE & LITERATURE 1,652 185 1,405 5 59 60 1,148 20 23 69 21
American 372 18 351 1 12 29 294 1 8 4 2
English Literature 518 38 480 1 17 11 434 1 6 7 3
English Language 134 12 88 0 2 2 73 0 1 5 5
French 149 18 129 0 7 7 108 3 0 2 2
German 90 14 73 0 2 1 69 0 0 0 1
Italian 20 4 16 0 0 0 16 0 0 0 0
Spanish 201 49 145 1 2 3 68 15 7 46 3
Russian 26 3 23 0 2 1 20 0 0 0 0
Slavic 17 2 14 0 1 0 13 0 0 0 0
Chinese 27 8 18 0 8 0 9 0 0 0 1
Japanese 10 1 9 0 1 1 6 0 0 0 1
Hebrew 4 0 4 0 0 0 4 0 0 0 0Arabic 12 5 7 0 0 0 7 0 0 0 0
Other Language & Literature 72 13 48 2 5 5 27 0 1 5 3
HUmanities, General 24 0 22 0 0 1 17 1 0 1 2
Humanities, Other 131 10 103 0 6 11 79 0 2 1 4
EDUCATION 6 557 519 5 609 60 170 650 4 392 70 101 95 71
Curriculum & Instruction 996 96 861 10 14 91 682 21 19 17 7Educational Admin. & Supervision 897 33 826 4 15 125 635 11 11 12 13Educational Leadership 1,150 35 1,001 13 24 143 760 7 25 19 10
Educilnstruct. Media Design 123 20 100 2 8 2 86 0 0, 2 0Educ. Stat./Research Methods 57 10 46 0 5 3 36 1 0 1 0
Educ. Assess., Test., & Meas. 39 12 26 0 1 3 22 0 0 0 0
78
104

APPENDIX TABLE A-2. Number of doctorate recipients by citizenship, race/ethnicity, and subfield, 1999
Subfield of DoctorateTotal
Doctorates*
Non-U.S.CitizensTemp.Visas
U.S. Citizens and Permanent Residents
TotalAmericanlndiant Asians Black White
PuertoRican
MexicanAmer.
OtherHispanic
Unkn.Race
Educational Psychology 298 32 247 1 13 12 206 2 3 4 6School Psychology 109 6 99 0 2 5 87 1 0 3 1
Social/Phil. Found. Of Educ. 125 16 107 1 9 25 68 0 2 0 2
Special Education 263 18 230 1 7 24 183 4 2 6 3
Counseling Educ./Couns. & Guidance 261 9 240 5 1 22 198 6 0 5 3
Higher Educ./Evaluation & Research 464 28 409 6 13 62 302 3 12 5 6
Pre-elementary/Early Childhood 49 5 38 0 2 8 22 1 1 2 2
Elementary Education 59 8 51 1 1 5 42 0 1 0 1
Secondary Education 31 2 27 1 2 2 20 0 1 1 0Adult & Continuing Education 153 11 134 0 2 17 113 0 0 1 1
TEACHING FIELDS 891 125 737 9 26 56 609 6 13 7 11
Agricultural Education 38 4 34 2 0 3 27 0 2 0 0Art Education 47 12 35 0 2 1 30 0 0 1 1
Business Education 45 2 37 0 1 5 27 0 1 1 2English Education 64 9 55 1 0 B 44 1 1 0 0Foreign Languages Education 62 23 38 0 6 2 27 0 3 0 0Health Education 58 3 51 1 1 6 41 0 1 1 0Home Economics Education 10 5 5 0 0 0 3 0 1 0 1
Technical/Industrial Arts Education 21 2 19 0 0 4 15 0 0 0 0
Mathematics Education 101 13 85 2 7 3 70 0 0 1 2
Music Education 79 10 68 0 1 3 62 0 0 0 2Nursing Education 22 1 20 1 0 1 18 0 0 0 0Physical Education and Coaching 114 14 94 1 1 3 85 0 2 1 1
Reading Education 68 5 62 0 2 6 51 1 1 1 0Science Education 58 7 50 1 1 4 41 2 1 0 0Social Science Education 9 0 9 0 0 1 8 0 0 0 0Technical Education 27 5 20 0 1 2 16 0 0 0 1
Trade & Industrial Education 14 6 7 0 1 1 5 0 0 0 0Teacher Ed./Spec. Acad. & Vac., Other 54 4 48 0 2 3 39 2 0 1 1
Education, General 199 14 90 3 7 7 69 1 1 1 1
Education, Other 393 39 340 3 18 38 252 6 10 9 4
PROFESSIONAL/OTHER FIELDS 2 292 492 1 656 16 122 148 1 290 18 19 20 23
BUSINESS AND MANAGEMENT 1,104 289 761 5 63 58 611 5 6 5 8
Accounting 153 29 121 0 13 11 94 1 1 1 0Banking/Financial Support Services 75 30 45 1 4 3 36 1 0 0 0Business Admin. & Management 311 71 218 1 16 22 174 1 1 1 2
Business/Managerial Economics 42 13 27 0 2 1 24 0 0 0 0International Business 34 10 22 1 2 1 17 0 0 0 1
Mgmt. Info. Sys./Bus. Data Proc. 83 23 59 1 6 2 47 0 2 0 1
Marketing Management & Research 127 44 82 0 8 0 72 0 0 1 1
Operations Research 52 25 26 0 5 0 20 0 0 0 1
Organizational Behavior 100 9 89 0 3 10 71 2 1 1 1
Bus. Mgmt./Admin. Serv., General 50 11 21 0 0 3 17 0 0 1 0Bus. Mgmt./Admin. Serv., Other 77 24 51 1 4 5 39 0 1 0 1
COMMUNICATIONS 379 66 297 3 17 28 235 3 2 4 5
Communications Research 50 8 42 0 2 6 34 0 0 0 0
Mass Communications 153 38 113 2 8 11 87 1 1 2 1
Communications Theory 47 2 45 0 3 2 40 0 0 0 0Communications, General 69 8 47 1 1 3 38 0 1 1 2
Communications, Other 60 10 50 0 3 6 36 2 0 1 2
OTHER PROFESSIONAL FIELDS 781 135 588 8 41 61 438 10 10 11 9
Architectural Environmental Design 65 21 36 0 3 0 28 1 0 2 2
Home Economics 23 6 16 1 0 2 12 0 1 0 0
Law 37 14 17 1 2 3 9 0 0 0 2
Library Science 39 7 31 1 4 3 22 0 0 1 0
Parks/Recreation/Leisure/Fitness 29 10 18 0 1 0 16 0 0 0 1
Public Administration 119 13 91 1 6 10 70 1 1 2 0Social Work 229 17 198 3 7 24 149 6 4 4 1
Theology/Religious Education 168 30 137 0 17 13 98 2 2 2 3
Professional Fields, General 9 1 8 1 0 1 6 0 0 0 0
Professional Fields, Other 63 16 36 0 1 5 28 0 2 0 0
OTHER/UNKNOWN FIELDS 28 2 10 0 1 1 6 0 1 0 1
NOTE: Field groupings may differ from those in reports published by federal sponsors of the Survey of Earned Doctorates. See inside the back cover for a description of fields asreported in this table.Refer also to the explanatory note about this table in front of Appendix A.'Includes 2,150 individuals who did not report their citizenship at time of doctorate. See the "Important Notice" for discussion of item response rate issues.Tincludes Pacific Islander.1-Includes Alaskan Native.
SOURCE: NSF/NIH/USED/NEH/USDA/NASA, Survey of Earned Doctorates
BEST COPY AVAILABLE79
105

APPENDIX TABLE A-3a. Statistical profile of doctorate recipients by major field, 1999
Total all doctorates
1999Total
1:3 '1'53c s..5 E t E sin o
.1" :ri'il g
...b .itit isW
.c is .c ro cro0. 4 (..)
ac
0U)
aN
g Liu Li0 Ca x
Number In Field 41.140 1,431 2,134 824 1,085 850 6 324 5 337 763 4,837 1,410 1,116 8 126
Men % 57.0 86.0 70.0 73.3 74.2 80.8 76.2 84.4 59.1 56.4 35.4 71.0 55.0Women 42.5 13.4 29.7 26.2 25.5 18.4 23.3 14.8 40.6 43.2 63.9 28.6 44.6Unknown* 0.5 0.6 0.3 0.5 0.3 0.8 0.5 0.8 0.3 0.4 0.7 0.4 0.4
U.S. Citizenship % 67.1 53.2 58.6 58.4 49.6 48.5 54.4 46.4 61.5 65.8 68.5 44.9 63.0Non-U.S., Permanent Visa 5.6 6.3 7.0 6.3 6.2 8.4 6.8 7.5 7.2 8.5 5.5 5.7 7.4Non-U.S., Temporary Visa 22.0 35.0 29.2 30.0 40.9 38.8 33.9 41.1 28.0 22.2 20.4 48.0 26.0Unknown 5.2 5.5 5.2 5.3 3.3 4.4 4.8 5.1 3.3 3.5 5.7 1.3 3.6
Never Married % 26.2 37.8 36.2 26.6 35.8 30.9 34.5 32.6 29.4 30.3 22.2 22.5 27.8Married 53.2 44.2 47.8 54.6 49.0 53.3 48.8 53.7 54.9 53.2 55.0 61.9 54.8Separated, Divorced 5.7 3.2 2.8 3.6 2.7 3.1 3.0 1.9 3.5 4.1 7.0 4.2 4.6Marriage-like Relationship 5.1 5.2 4.5 6.9 5.3 3.9 5.0 3.0 5.8 5.6 4.5 3.4 5.1
Widowed 0.4 0.1 0.0 0.0 0.1 0.4 0.1 0.1 0.1 0.3 0.9 0.2 0.4Unknown 9.4 9.4 8.7 8.3 7.1 8.5 8.5 8.7 6.3 6.6 10.4 7.8 7.4
Median Age at Doct. Yrs 33.8 30.2 29.6 33.9 30.6 31.6 30.7 31.4 30.1 31.2 37.3 34.7 32.1
Percent with Bacc. InSame Field as Doctorate 51.4 69.2 72.5 46.7 68.1 35.4 62.7 71.2 25.2 52.1 40.6 48.3 47.0
Percent with Masters 72.9 62.8 38.1 70.6 71.9 81.4 59.6 80.6 31.6 42.4 78.4 85.0 53.5
Median Time Lapsefrom Bacc. To Doct.
Total Time Yrs 10.4 7.7 6.8 10.5 8.0 10.0 8.0 8.7 7.5 8.3 14.0 11.0 9.0Registered Time 7.3 7.0 6.0 7.6 6.9 7.6 6.8 6.6 6.6 6.9 7.8 6.9 7.0
Postdoctoral Study Plans % 25.9 50.8 47.6 44.3 31.6 10.2 40.1 21.1 75.6 68.4 21.1 33.5 56.1Fellowship 13.2 20.7 22.8 18.8 15.2 3.5 17.9 6.6 43.4 39.8 10.8 11.4 31.2Research Assoc. 9.3 28.3 22.4 23.1 13.5 5.6 20.1 12.7 24.4 18.5 6.1 .19.6 17.1
Traineeship 0.8 0.3 0.6 0.5 0.4 0.6 0.5 0.8 0.9 1.4 1.3 0.7 1.2
Other Study 2.7 1.5 1.7 1.9 2.5 0.5 1.7 1.0 6.9 8.7 3.0 1.8 6.6Planned EmploymentAfter Doctorate % 63.2 38.4 42.7 45.8 59.4 80.6 50.1 69.2 16.3 24.0 67.7 57.6 35.5
Educ. Institution** 34.7 7.9 7.8 14.8 33.0 28.7 15.9 11.7 3.9 9.9 37.2 23.5 15.9
Industry/Business 17.5 24.7 30.7 17.8 19.8 44.4 27.6 48.6 10.6 8.4 12.8 16.8 10.5
Government 4.6 3.5 2.1 10.3 2.3 4.8 3.9 6.1 0.8 2.8 6.9 11.8 4.6Nonprofit 3.2 0.5 0.8 1.0 0.9 1.2 0.8 1.0 0.4 1.4 6.7 2.2 2.3Other & Unknown 3.1 1.8 1.3 1.8 3.3 1.5 1.9 1.9 0.5 1.5 4.2 3.3 2.1
Postdoc. Plans Unknown % 10.9 10.8 9.7 10.0 9.0 9.2 9.8 9.7 8.1 7.6 11.1 8.9 8.4
Definite Postdoc. Study 18.9 40.3 37.3 29.9 23.9 7.3 30.7 13.8 59.5 52.7 15.1 21.2 42.5Seeking Postdoc. Study 7.1 10.6 10.2 14.4 7.7 2.9 9.4 7.4 16.1 15.7 6.0 12.3 13.6Definite Employment 43.7 25.5 29.2 33.1 42.6 59.6 35.3 47.3 10.5 15.3 48.7 40.7 24.1Seeking Employment 19.5 12.9 13.5 12.6 16.8 20.9 14.8 21.8 5.8 8.7 19.1 16.9 11.3
Employment CommitmentsAfter Doctorate 17 982 365 623 273 462 507 2.230 2.527 80 741 686 454 1 61
Primary Activity+R & D % 31.3 58.4 70.0 49.8 38.1 60.9 57.0 70.4 57.5 43.6 36.4 56.6 44.7Teaching 37.9 14.2 17.3 19.8 47.6 25.6 25.3 10.6 21.3 26.3 37.0 22.7 29.0Administration 12.3 2.5 2.2 3.3 0.9 3.4 2.4 2.3 2.5 4.3 9.6 4.0 6.0Prof. Services 13.0 14.0 5.3 16.1 6.9 5.9 8.5 10.5 12.5 18.1 12.4 9.7 13.9Other 3.2 8.5 3.7 5.9 2.2 2.8 4.2 4.3 2.5 3.8 2.3 4.8 3.5
Secondary ActivityR & D % 32.8 22.7 17.8 30.8 46.1 27.6 28.3 17.5 20.0 29.8 35.6 25.6 30.4Teaching 18.6 6.6 5.8 14.7 14.9 20.3 12.2 13.9 16.3 15.4 19.8 25.8 19.4Administration 14.4 15.3 26.2 13.6 9.5 14.0 16.6 20.0 16.3 17.9 15.7 15.6 16.6Prof. Services 11.9 12.3 13.3 14.3 10.0 10.8 12.0 15.8 8.8 11.6 14.7 14.8 13.3Other 2.2 2.2 2.4 2.2 1.1 1.8 1.9 3.4 2.5 1.6 0.9 2.0 1.5No Secondary Activity 17.7 38.4 33.1 19.4 14.1 24.1 26.3 27.4 32.5 19.7 11.4 14.3 16.1
Activity(ies) Unknown % 2.4 2.5 1.4 5.1 4.3 1.4 2.6 1.9 3.8 3.9 1.9 2.0 2.8
Region of EmploymentAfter Doctorate+
New England % 6.4 9.1 12.0 4.8 5.4 5.2 7.7 6.6 11.3 8.1 8.2 3.1 7.1
Middle Atlantic 14.2 15.4 19.4 5.1 17.6 20.0 16.8 15.0 15.0 11.0 11.7 4.2 9.8East No. Central 13.9 9.1 16.0 8.4 15.4 9.9 12.4 13.0 12.5 11.8 11.7 8.2 11.0West No. Central 6.7 4.1 4.8 4.0 7.0 3.4 4.7 4.1 5.0 7.2 6.3 13.1 8.1
South Atlantic 16.8 13.2 15.5 10.6 13.7 15.1 14.1 12.4 17.5 16.8 22.5 13.6 18.1
East So. Central 4.7 2.5 3.1 4.4 3.0 2.8 3.1 2.9 1.3 3.5 5.0 4.9 4.3West So. Central 8.8 7.4 6.6 20.9 9.3 6.7 9.1 9.3 7.5 7.6 7.3 6.2 7.2Mountain 5.2 9.6 2.4 7.0 5.7 4.8 5.4 5.5 5.0 3.9 5.0 5.6 4.7Pacific & Insular 13.6 21.5 15.7 17.9 12.8 22.6 17.9 20.5 16.3 17.8 12.3 8.7 13.7U.S., Region Unknown 0.0 0.0 0.0 0.0 0.0 0.0 0.0 0.0 0.0 0.0 0.0 0.0 0.0Foreign 9.4 7.4 4.2 16.5 9.8 9.5 8.6 10.5 6.3 12.1 10.0 32.2 15.7
Region Unknown 0.3 0.6 0.3 0.4 0.2 0.0 0.3 0.3 2.5 0.3 0.0 0.2 0.3NOTE: Field groupings may differ from those in reports published by federal sponsors of the Survey of Earned Doctorates.#Physical Sciences includes Mathematics and Computer Sciences, as well as Physics/Astronomy, Chemistry, and Earth/Atmospheric/Marine Sciences.
80
10 6 BEST COPY AVAILABLE

APPENDIX TABLE A-3a. Statistical profile of doctorate recipients, by major field, 1999
Total all doctorates
00
EOC3
771
N0 0O
'a 275Om I- N LU
Ofc
Ol
3 l L 3 O x
3,667 927 1,004 773 665 736 26 82 1,011 1,024 628 2,805 568 665_57 1,104 1,160 28 222_92 14 31
33.0 72.4 41.6 66.8 57.0 45.4 63.3 60.4 40.8 38.7 53.7 50.8 35,7 68.5 49.7 53.6 58.8 78.566.7 27.2 58.3 32.7 42.4 54.3 36.2 39.6 59.0 61.1 45.3 48.6 64.0 31.0 50.1 42.9 40.8 4.30.3 0.4 0.1 0.5 0.6 0.3 0.5 0.0 0.2 0.2 1.1 0.6 0.3 0.5 0.2 3.6 0.4 11.5
5.886.2 43.1 76.3 74.1 68.0 76.1 61.1 84.1 86.3 64.6 75.8 78.0 82.8 63.0 71.8 25.0 67.0 78.41.9 7.2 5.2 5.0 4.7 3.7 6.3 4.5 3.4 12.7 5.3 5.7 2.7 5.9 4.5 10.7 5.2 4.34.2 45.0 12.7 15.9 22.1 13.8 27.7 7.8 6.6 18.6 13.4 11.7 7.9 26.2 17.3 7.1 21.5 11.07.7 4.6 5.8 4.9 5.3 6.5 4.9 3.7 3.6 4.0 5.5 4.6 6.5 4.9 6.4 57.1 6.3 6.3
26.2 33.3 23.0 25.4 21.8 26.2 29.9 24.7 25.4 27.7 25.6 25.6 13.8 19.3 20.9 17.9 20.1 19.346.4 51.1 50.6 51.2 56.4 49.1 51.7 53.7 48.7 48.2 49.4 49.9 60.8 61.0 53.5 10.7 56.6 56.0
7.3 2.7 9.2 5.2 7.2 6.7 4.2 6.4 6.9 7.3 7.0 6.9 10.1 5.5 7.5 0.0 6.5 8.36.5 4.5 8.6 6.5 5.6 6.5 5.0 6.6 10.2 8.8 7.7 8.1 3.2 2.9 5.6 0.0 4.2 5.30.2 0.2 0.2 0.6 0.3 0.3 0.2 0.7 0.6 0.2 0.3 0.4 1.1 0.8 0.3 0.0 0.6 0.8
13.3 8.1 8.5 11.1 8.7 11.3 8.9 7.8 8.2 7.8 9.9 9.0 10.9 10.5 12.2 71.4 12.1 10.3
32.3 31.7 35.3 33.9 43.6 33.2 31.8 34.8 34.3 34.9 35.7 35.1 44.3 36.1 39.1 33.2 37.5 39.2
58.4 55.8 73.4 51.7 19.8 55.8 57.8 55.9 61.9 0.0 51.2 48:2 34.8 34.1 29.4 0.0 31.3 39.4
74.6 72.8 82.5 77.9 86.3 77.0 66.5 84.6 85.5 85.7 81.2 83.1 87.4 80.3 87.0 17.9 82.9 85.1
9.0 8.9 11.6 10.9 12.2 9.9 8.9 11.3 11.0 11.3 12.0 11.7 19.9 12.9 15.0 9.3 14.0 14.97.2 7.0 8.8 8.3 8.0 7.5 7.0 9.0 8.5 8.6 9.0 8.9 8.2 7.8 8.4 6.0 8.0 8.5
30.1 7.2 17.1 10.7 12.2 21.4 36.3 10.4 7.2 8.6 7.7 8.2 5.8 3.4 6.5 10.7 5.1 6.622.2 3.8 9.9 6.3 4.4 14.6 18.8 6.4 4.4 3.2 3.7 4.3 1.6 0.9 2.8 7.1 2.0 2.74.1 2.2 5.1 2.7 5.4 4.0 13.5 1.5 0.6 1.6 1.2 1.2 1.7 1.1 1.5 0.0 1.3 1.41.6 0.5 0.1 0.5 0.3 1.0 0.9 0.2 0.4 1.6 0.6 0.6 0.5 0.5 0.3 0.0 0.4 0.52.1 0.8 2.1 1.2 2.1 1.8 3.1 2.3 1.9 2.2 2.2 2.1 1.9 1.0 1.8 3.6 1.4 1.9
54.9 84.1 72.3 76.3 77.1 65.7 53.6 78.6 83.7 80.6 80.2 80.6 81.5 85.1 79.6 17.9 81.5 81.222.4 43.0 49.1 50.6 43.5 34.0 19.8 57.7 68.6 70.1 60.5 62.6 64.5 65.7 49.7 14.3 57.0 62.614.6 20.5 7.8 6.9 13.1 13.4 22.9 6.9 8.1 4.5 8.1 7.5 6.0 13.9 10.6 0.0 12.0 7.55.9 11.9 4.8 8.7 9.2 7.1 5.4 3.6 0.7 0.6 1.2 1.5 4.1 2.2 5.0 0.0 3.6 3.08.0 3.2 5.1 4.9 6.6 6.5 2.8 3.3 1.3 1.0 6.0 4.0 3.5 1.4 10.0 0.0 5.7 4.1
4.0 5.5 5.6 5.3 4.8 4.6 2.7 7.2 5.1 4.5 4.3 5.0 3.4 2.1 4.2 3.6 3.2 4.015.0 8.6 10.6 12.9 10.7 12.9 10.2 11.0 9.1 10.8 12.1 11.2 12.7 11.4 14.0 71.4 13.4 12.2
22.4 5.2 11.4 7.4 7.7 15.5 26.9 6.4 4.1 4.0 4.5 4.7 3.3 1.8 4.1 7.1 3.1 3.87.7 2.0 5.8 3.4 4.5 5.9 9.4 4.0 3.1 4.6 3.2 3.5 2.5 1.6 2.3 3.6 2.0 2.8
35.8 64.0 44.0 50.6 53.7 44.0 36.6 44.9 52.7 54.3 49.3 49.7 61.2 69.7 57.2 10.7 62.6 57.019.1 20.2 28.3 25.7 23.5 21.7 17.0 33.7 31.0 26.3 30.9 30.9 20.3 15.5 22.4 7.1 18.9 24.1
1,314 593 442 391 357 3.097 9.815 454 540 341 1,382 2.717 4.015 769 663 3 1 435 8 167
17.7 51.3 33.0 30.2 29.4 29.3 49.2 9.0 5.4 5.9 7.7 7.2 6.6 31.9 13.0 33.3 23.1 9.720.9 25.3 50.7 49.6 42.6 32.1 24.4 72.2 80.4 83.6 72.4 75.3 40.2 51.0 53.7 66.7 52.3 54.06.2 3.7 5.7 9.0 10.9 6.5 4.4 7.0 5.2 3.5 5.3 5.3 37.9 5.6 10.9 0.0 8.0 21.8
50.9 12.8 6.6 5.6 12.9 27.2 16.0 6.2 3.1 3.8 8.0 6.2 10.7 7.4 16.0 0.0 11.4 9.32.6 5.4 2.3 3.3 2.8 3.2 3.8 2.0 3.1 0.6 4.3 3.2 1.7 2.5 3.6 0.0 3.0 2.5
28.4 32.9 47.1 45.0 43.7 35.8 28.3 57.7 55.2 65.4 44.5 51.5 26.4 47.3 45.4 33.3 46.4 38.220.2 27.5 21.5 22.0 20.4 22.0 17.2 10.6 9.8 7.9 14.1 11.9 23.1 34.2 20.4 33.3 27.8 20.217.4 14.0 12.0 9.7 10.6 14.2 16.7 10.1 11.7 7.9 13.5 11.9 12.5 5.5 12.5 33.3 8.8 11.610.1 7.4 7.2 7.2 10.9 8.9 12.3 3.7 4.8 6.2 8.8 6.8 16.3 6.0 8.4 0.0 7.1 11.5
1.4 2.7 1.4 1.0 1.4 1.6 2.1 2.6 3.3 1.2 5.8 4.2 1.5 0.3 2.0 0.0 1.0 2.320.8 14.0 9.0 12.8 11.5 15.7 21.2 11.9 12.6 9.1 11.1 11.3 17.4 5.1 8.4 0.0 6.6 13.5
1.8 1.5 1.8 2.3 1.4 1.7 2.2 3.3 2.6 2.3 2.2 2.5 2.8 1.7 2.9 0.0 2.2 2.6
5.5 8.6 7.0 7.9 9.6 7.1 7.1 7.9 7.8 12.6 7.0 8.0 4.1 6.3 4.4 0.0 5.4 5.619.9 12.2 13.8 13.0 12.7 15.8 14.6 16.1 16.9 13.8 13.2 14.5 13.2 14.3 12.9 0.0 13.6 13.713.7 8.1 17.0 14.1 14.1 13.2 12.5 13.7 17.3 15.6 16.4 16.0 15.8 15.0 13.5 33.3 14.3 15.6-8.6 2.9 5.7 3.3 6.2 6.1 5.7 6.2 8.4 9.7 7.9 7.9 8.7 4.7 6.5 0.0 5.5 7.915.9 26.6 15.4 25.1 20.0 19.5 16.1 15.5 15.6 10.0 14.2 14.2 19.5 17.8 18.9 0.0 18.3 17.5
5.1 2.0 3.4 1.8 4.5 3.8 3.5 5.3 8.2 7.1 4.5 5.7 6.5 6.8 6.1 0.0 6.4 6.29.3 5.4 5.0 7.2 5.4 7.2 8.2 8.8 7.6 6.8 9.4 8.6 9.9 11.3 8.6 0.0 10.1 9.56.1 3.2 5.9 5.6 4.2 5.2 5.2 5.1 2.6 3.2 5.4 4.5 6.2 3.6 4.8 0.0 4.2 5.3
13.8 8.0 16.8 9.7 9.0 12.0 15.9 12.6 10.6 12.4 11.5 11.6 10.7 7.7 11.4 0.0 9.4 10.80.0 0.0 0.0 0.0 0.0 0.0 0.0 0.0 0.0 0.0 0.0 0.0 0.0 0.0 0.0 0.0 0.0 0.02.1 22.8 10.0 12.3 14.4 9.9 10.9 8.6 4.8 8.2 10.2 8.6 5.2 12.0 12.6 66.7 12.4 7.60.2 0.2 0.0 0.0 0.0 0.1 0.2 0.2 0.0 0.6 0.2 0.2 0.3 0.5 0.3 0.0 0.4 0.3
*Includes 187 respondents not reporting gender. "Includes 2-year, 4-year, and foreign colleges and##Includes 28 respondents whose doctoral field was unknown. +Includes only recipients with definiteSOURCE: NSF/NIH/USED/NEH/USDA/NASA, Survey of Earned Doctorates
universities, medical schools, and elementary/secondary schools.employment plans.
81
10 7 BEST COPY AVAILABLE
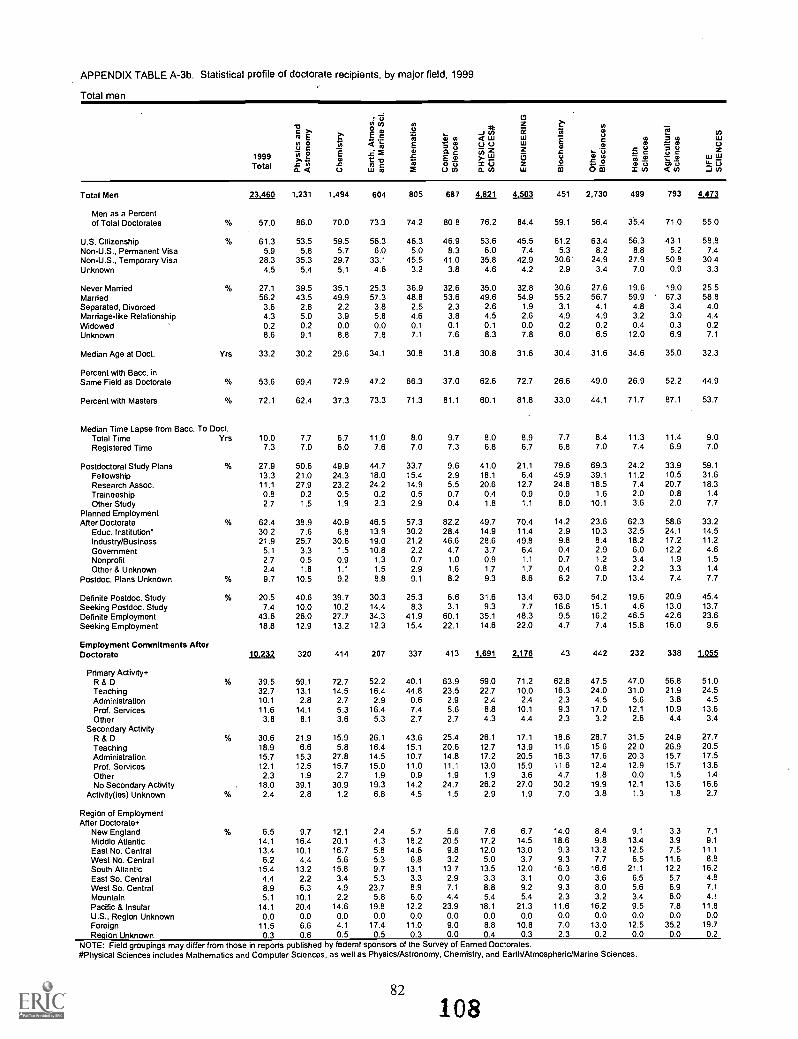
APPENDIX TABLE A-3b. Statistical profile of doctorate recipients, by major field, 1999
Total men
1999Total
-6O
m E 2
2t.Dm c
o. v,
CoW2
W W._ (30 0
Total Men 23.460 1,231 1,494 604 805 687 4 821 4 503 451 2,730 499 793 4 473
Men as a Percentof Total Doctorates 57.0 86.0 70.0 73.3 74.2 80.8 76.2 84.4 59.1 56.4 35.4 71.0 55.0
U.S. Citizenship 61.3 53.5 59.5 56.3 46.3 46.9 53.6 45.5 61.2 63.4 56.3 43.1 58.8Non-U.S., Permanent Visa 5.9 5.8 5.7 6.0 5.0 8.3 6.0 7.4 5.3 8.2 8.8 5.2 7.4Non-U.S., Temporary Visa 28.3 35.3 29.7 33.1 45.5 41.0 35.8 42.9 30.6' 24.9 27.9 50.8 30.4
Unknown 4.5 5.4 5.1 4.6 3.2 3.8 4.6 4.2 2.9 3.4 7.0 0.9 3.3
Never Married % 27.1 39.5 35.1 25.3 36.9 32.6 35.0 32.8 30.6 27.6 19.6 19.0 25.5Married 56.2 43.5 49.9 57.3 48.8 53.6 49.6 54.9 55.2 56.7 59.9 67.3 58.8Separated, Divorced 3.6 2.8 2.2 3.8 2.5 2.3 2.6 1.9 3.1 4.1 4.8 3.4 4.0Marriage-like Relationship 4.3 5.0 3.9 5.8 4.6 3.8 4.5 2.6 4.9 4.9 3.2 3.0 4.4Widowed 0.2 0.2 0.0 0.0 0.1 0.1 0.1 0.0 0.2 0.2 0.4 0.3 0.2Unknown 8.6 9.1 8.8 7.8 7.1 7.6 8.3 7.8 6.0 6.5 12.0 6.9 7.1
Median Age at Doct. Yrs 33.2 30.2 29.6 34.1 30.8 31.8 30.8 31.6 30.4 31.6 34.6 35.0 32.3
Percent with Bacc. inSame Field as Doctorate 53.6 69.4 72.9 47.2 66.3 37.0 62.6 72.7 26.6 49.0 26.9 52.2 44.9
Percent with Masters 72.1 62.4 37.3 73.3 71.3 81.1 60.1 81.8 33.0 44.1 71.7 87.1 53.7
Median Time Lapse from Bacc. To Doct.Total Time Yrs 10.0 7.7 6.7 11.0 8.0 9.7 8.0 8.9 7.7 8.4 11.3 11.4 9.0Registered Time 7.3 7.0 6.0 7.6 7.0 7.3 6.8 6.7 6.8 7.0 7.4 6.9 7.0
Postdoctoral Study Plans OA 27.9 50.6 49.9 44.7 33.7 9.6 41.0 21.1 79.6 69.3 24.2 33.9 59.1Fellowship 13.3 21.0 24.3 18.0 15.4 2.9 18.1 6.4 45.9 39.1 11.2 10.5 31.6Research Assoc. 11.1 27.9 23.2 24.2 14.9 5.5 20.6 12.7 24.8 18.5 7.4 20.7 18.3Traineeship 0.8 0.2 0.5 0.2 0.5 0.7 0.4 0.9 0.9 1.6 2.0 0.8 1.4
Other Study 2.7 1.5 1.9 2.3 2.9 0.4 1.8 1.1 8.0 10.1 3.6 2.0 7.7Planned EmploymentAfter Doctorate % 62.4 38.9 40.9 46.5 57.3 82.2 49.7 70.4 14.2 23.6 62.3 58.6 33.2
Educ. Institution' 30.2 7.6 6.8 13.9 30.2 28.4 14.9 11.4 2.9 10.3 32.5 24.1 14.5
Industry/Business 21.9 25.7 30.6 19.0 21.2 46.6 28.6 49.8 9.8 8.4 18.2 17.2 11.2Government 5.1 3.3 1.5 10.8 2.2 4.7 3.7 6.4 0.4 2.9 6.0 12.2 4.6Nonprofit 2.7 0.5 0.9 1.3 0.7 1.0 0.9 1.1 0.7 1.2 3.4 1.9 1.5
Other & Unknown 2.4 1.8 1.1 1.5 2.9 1.6 1.7 1.7 0.4 0.8 2.2 3.3 1.4
Postdoc. Plans Unknown % 9.7 10.5 9.2 8.8 9.1 8.2 9.3 8.6 6.2 7.0 13.4 7.4 7.7
Definite Postdoc. Study % 20.5 40.6 39.7 30.3 25.3 6.6 31.6 13.4 63.0 54.2 19.6 20.9 45.4Seeking Postdoc. Study 7.4 10.0 10.2 14.4 8.3 3.1 9.3 7.7 16.6 15.1 4.6 13.0 13.7
Definite Employment 43.6 26.0 27.7 34.3 41.9 60.1 35.1 48.3 9.5 16.2 46.5 42.6 23.6Seeking Employment 18.8 12.9 13.2 12.3 15.4 22.1 14.6 22.0 4.7 7.4 15.8 16.0 9.6
Employment Commitments AfterDoctorate 10,232 320 414 207 337 413 1 691 2 176 43 442 232 338 1 055
Primary Activity+R & D % 39.5 59.1 72.7 52.2 40.1 63.9 59.0 71.2 62.8 47.5 47.0 56.8 51.0Teaching 32.7 13.1 14.5 16.4 44.8 23.5 22.7 10.0 16.3 24.0 31.0 21.9 24.5Administration 10.1 2.8 2.7 2.9 0.6 2.9 2.4 2.4 2.3 4.5 5.6 3.8 4.5Prof. Services 11.6 14.1 5.3 16.4 7.4 5.6 8.8 10.1 9.3 17.0 12.1 10.9 13.6Other 3.8 8.1 3.6 5.3 2.7 2.7 4.3 4.4 2.3 3.2 2.6 4.4 3.4
Secondary ActivityR & D % 30.6 21.9 15.9 26.1 43.6 25.4 26.1 17.1 18.6 28.7 31.5 24.9 27.7Teaching 18.9 6.6 5.8 16.4 15.1 20.6 12.7 13.9 11.6 15.6 22.0 26.9 20.5Administration 15.7 15.3 27.8 14.5 10.7 14.8 17.2 20.5 16.3 17.6 20.3 15.7 17.5
Prof. Services 12.1 12.5 15.7 15.0 11.0 11.1 13.0 15.9 11.6 12.4 12.9 15.7 13.6
Other 2.3 1.9 2.7 1.9 0.9 1.9 1.9 3.6 4.7 1.8 0.0 1.5 1.4
No Secondary Activity 18.0 39.1 30.9 19.3 14.2 24.7 26.2 27.0 30.2 19.9 12.1 13.6 16.6Activity(ies) Unknown % 2.4 2.8 1.2 6.8 4.5 1.5 2.9 1.9 7.0 3.8 1.3 1.8 2.7
Region of EmploymentAfter Doctorate+
New England % 6.5 9.7 12.1 2.4 5.7 5.6 7.6 6.7 14.0 8.4 9.1 3.3 7.1
Middle Atlantic 14.1 16.4 20.1 4.3 18.2 20.5 17.2 14.5 18.6 9.8 13.4 3.9 9.1
East No. Central 13.4 10.1 16.7 5.8 14.6 9.8 12.0 13.0 9.3 13.2 12.5 7.5 11.1
West No. Central 6.2 4.4 5.6 5.3 6.8 3.2 5.0 3.7 9.3 7.7 6.5 11.6 8.8South Atlantic 15.4 112 15.8 9.7 13.1 13.7 13.5 12.0 16.3 16.6 21.1 12.2 16.2East So. Central 4.4 2.2 3.4 5.3 3.3 2.9 3.3 3.1 0.0 3.6 6.5 5.7 4.8West So. Central 8.9 6.3 4.9 23.7 8.9 7.1 8.8 9.2 9.3 8.0 5.6 6.9 7.1
Mountain 5.1 10.1 2.2 5.8 6.0 4.4 5.4 5.4 2.3 3.2 3.4 6.0 4.1
Pacific & Insular 14.1 20.4 14.6 19.8 12.2 23.9 18.1 21.3 11.6 16.2 9.5 7.8 11.8
U.S., Region Unknown 0.0 0.0 0.0 0.0 0.0 0.0 0.0 0.0 0.0 0.0 0.0 0.0 0.0Foreign 11.5 6.6 4.1 17.4 11.0 9.0 8.8 10.8 7.0 13.0 12.5 35.2 19.7
Region Unknown 0.3 0.6 0.5 0.5 0.3 0.0 0.4 0.3 2.3 0.2 0.0 0.0 0.2NOTE: Field groupings may differ from those in reports published by federal sponsors of the Survey of Earned Doctorates.#Physical Sciences includes Mathematics and Computer Sciences, as well as Physics/Astronomy, Chemistry, and Earth/Atmospheric/Marine Sciences.
82
108

APPENDIX TABLE A-3b. Statistical profile of doctorate recipients, by major field, 1999
Total men
O.c
a
E
O
>. 0>. co "" - 73ea Z
C.) 0 u) 22 :45 iZ .2 zo a ca -tn im amta. la 3 0 t, -, ia. 0 0-I ZO a V. E t, E
ao j < z9.2 o
t' 13. .74 Ti; E. t o 0 o 0 Z<111 11 E Z Om m? 1- (i) W ox
d O7
m 2
C
C
6
4z0rnacnw W InU. X 00 I-ce 11.1
LT_
rn1.1J
zw-I 3N00z
1,210 1,030 418 516 379 394 16,_99 611 418 243 1,505 2-77 244 756 577 15 148 6 469
33.0 56.7 41.6 66.8 57.0 45.4 63.3 60.4 40.8 38.7 53.7 50.8 35.7 68.5 49.7 53.6 58.8 45.2
85.3 53.9 73.4 73.3 62.8 70.1 55.9 84.1 81.8 66.7 76.8 78.3 80.5 57.7 66.4 26.7 61.1 75.51.7 5.3 4.5 4.7 4.7 3.8 6.4 5.2 4.1 7.8 5.6 5.5 2.9 6.1 4.7 6.7 5.5 4.65.8 36.7 17.0 17.2 27.7 20.4 33.4 7.7 9.6 21.8 13.8 12.5 10.5 32.1 22.2 6.7 27.6 14.97.2 4.1 5.0 4.8 4.7 5.7 4.3 2.9 4.5 3.7 3.9 3.7 6.1 4.1 6.8 60.0 5.9 5.1
26.4 27.2 20.8 23.4 21.4 25.9 30.2 24.5 22.7 30.9 24.8 25.0 12.1 19.6 17.9 26.7 18.9 19.048.8 57.0 58.6 55.4 62.0 53.4 54.1 56.1 55.7 47.3 55.5 55.0 69.6 64.9 59.3 6.7 61.9 61.75.2 3.6 7.2 4.5 4.0 4.7 3.2 5.2 2.6 3.7 5.0 4.6 5.1 4.2 5.2 0.0 4.6 4.86.4 4.2 6.0 5.4 3.2 5.4 4.1 5.7 9.1 10.3 6.4 7.0 2.8 2.2 4.3 0.0 3.1 4.70.1 0.3 0.2 0.2 0.3 0.2 0.1 0.5 0.5 0.0 0.3 0.3 0.3 0.5 0.2 0.0 0.4 0.3
13.1 7.8 7.2 11.0 9.2 10.5 8.3 7.9 9.3 7.8 7.9 8.1 10.2 8.5 13.2 66.7 11.1 9.5
32.8 31.8 35.2 34.3 ' 42.1 33.7 31.8 35.0 34.4 35.0 35.9 35.3 43.2 35.9 38.8 30.3 37.2 38.0
58.1 48.2 73.9 51.9 21.9 54.1 59.0 58.9 62.2 0.0 53.9 51.5 29.9 34.3 28.9 0.0 31.6 39.5
73.8 78.3 84.9 77.3 85.2 77.0 67.3 86.3 84.7 84.4 81.6 83.3 87.5 81.6 85.8 13.3 82.6 84.7
9.0 9.0 11.3 10.9 11.9 10.0 8.8 11.3 10.9 11.3 12.0 11.8 18.3 12.9 15.0 9.1 13.6 13.97.3 6.9 8.7 8.3 8.0 7.6 7.0 9.0 8.3 8.5 8.9 8.9 8.1 7.8 8.5 9.0 8.0 8.4
28.5 6.6 16.0 10.5 11.1 17.3 36.0 9.5 7.9 9.5 7.7 8.3 5.8 3.3 6.9 20.0 5.0 6.720.2 3.3 10.3 5.8 3.7 11.1 17.2 5.6 4.8 3.7 3.5 4.1 1.7 1.1 3.1 13.3 2.1 2.8
5.1 1.9 4.1 2.5 5.3 3.9 14.8 1.3 0.5 2.5 1.3 1.3 2.2 0.9 1.2 0.0 1.0 1.61.3 0.7 0.0 0.6 0.5 0.8 0.9 0.2 0.5 2.1 0.7 0.6 0.4 . 0.4 0.3 0.0 0.4 0.51.9 0.7 1.7 1.6 1.6 1.5 3.1 2.5 2.2 1.2 2.3 2.2 1.5 0.9 2.3 6.7 1.6 1.8
57.5 84.4 74.6 77.1 78.4 71.1 54.9 80.2 82.1 80.7 82.1 81.6 82.7 86.5 78.7 13.3 82.3 82.124.4 51.7 50.0 51.0 42.7 38.3 18.3 57.3 68.2 68.3 62.1 62.5 64.0 66.1 44.7 13.3 56.4 61.717.1 16.7 7.2 7.4 16.4 15.0 27.1 8.3 8.4 5.8 7.6 7.7 6.9 14.9 10.4 0.0 12.8 8.57.4 9.4 7.9 8.9 10.8 9.1 5.7 3.9 0.7 1.2 1.3 1.8 5.4 2.5 5.9 0.0 3.9 3.56.4 2.9 4.1 4.7 3.4 4.7 1.8 3.4 1.4 1.2 7.3 5.0 3.7 1.2 13.9 0.0 6.6 4.92.3 3.6 5.5 5.2 5.0 4.0 2.0 7.2 3.3 4.1 3.9 4.5 2.8 1.7 3.8 0.0 2.6 3.5
14.0 9.0 9.3 12.4 10.6 11.6 9.1 10.3 10.0 9.9 10.2 10.2 11.4 10.2 14.4 66.7 12.6 11.1
22.1 4.6 10.5 7.4 7.7 12.8 26.9 5.7 5.3 3.7 4.5 4.8 3.3 1.9 4.3 13.3 3.0 3.96.4 2.0 5.5 3.1 3.4 4.4 9.1 3.8 2.6 5.8 3.2 3.5 2.6 1.5 2.6 6.7 2.0 2.8
39.9 63.7 45.0 51.0 54.6 49.4 38.3 43.7 52.6 51.0 50.3 49.3 63.8 71.0 57.0 13.3 64.4 57.717.6 20.7 29.7 26.2 23.7 21.7 16.6 36.5 29.4 29.6 31.8 32.3 18.9 15.5 21.7 0.0 18.0 24.5
483 656 188 263 207 1.579 6.501 267 220 124 757 1.368 1.495 537 329 2 868 3,731
20.9 37.7 36.2 29.3 27.1 33.5 55.6 10.9 5.0 4.8 6.9 7.2 7.6 33.3 10.6 50.0 24.8 11.420.7 38.1 46.3 47.5 43.0 32.0 21.0 68.5 80.9 82.3 72.3 73.8 35.6 49.5 50.8 50.0 50.0 53.07.5 7.6 5.3 9.9 12.1 7.3 3.9 6.7 5.0 3.2 5.2 5.3 42.8 4.8 11.9 0.0 7.5 20.8
46.6 9.9 8.5 6.5 11.6 21.2 13.0 6.7 2.7 8.1 8.7 7.3 9.2 7.8 17.6 0.0 11.5 9.03.1 5.0 2.1 4.2 4.3 4.3 4.2 2.6 3.2 0.8 4.2 3.4 2.2 3.0 5.8 0.0 4.0 3.1
28.8 35.7 . 42.6 43.7 48.8 36.5 25.9 50.2 56.4 74.2 44.8 50.4 25.4 46.2 41.3 0.0 44.2 38.920.1 23.9 25.0 24.0 18.8 23.7 17.0 12.0 10.9 9.7 13.6 12.5 26.4 35.6 21.9 50.0 30,4 22.218.4 14.5 14.9 9.1 9.2 14.4 17.7 13.9 10.9 5.6 14.7 13.1 13.1 6.5 14.0 50.0 9.4 12.212.2 10.1 7.4 6.5 10.6 9.2 13.1 3.7 4.1 4.0 8.6 6.5 15.6 5.4 9.4 0.0 6.9 10.20.6 2.4 1.1 0.8 1.0 1.3 2.2 1.9 4.1 1.6 5.5 4.2 1.5 0.2 2.1 0.0 0.9 2.4
18.6 11.7 7.4 13.3 9.7 13.2 21.8 14.2 10.9 4.0 10.2 10.5 15.5 4.7 7.9 0.0 5.9 11..45
1.2 1.7 1.6 2.7 1.9 1.7 2.2 4.1 2.7 0.8 2.6 2.8 2.5 1.5 3.3 0.0
5.2 5.8 7.0 8.0 8.3 6.8 7.0 8.3 7.3 8.1 7.3 7.5 3.5 6.5 4.0 0.0 5.6 5.519.8 14.5 16.0 14.8 12.6 15.8 14.6 14.7 17.3 13.0 12.3 13.6 13.2 14.6 11.0 0.0 13.2 13.313.1 10.2 14.4 12.2 13.6 11.8 12.1 14.3 20.0 17.9 17.1 17.1 16.5 14.4 8.9 50.0 12.4 15.810.2 4.1 5.3 3.4 5.3 5.9 5.4 5.6 9.5 9.8 7.3 7.5 8.9 4.7 7.1 0.0 5.6 7.615.0 21.7 15.0 25.9 19.4 20.2 15.0 18.0 13.6 8.1 13.1 13.7 17.7 16.8 18.1 0.0 17.2 16.15.2 3.4 3.7 1.5 4.9 3.6 3.5 4.5 9.1 8.1 5.0 5.9 5.4 6.9 7.4 0.0 7.1 6.09.6 7.5 3.7 7.2 8.7 7.4 8.3 9.4 5.5 5.7 10.2 8.9 10.0 11.0 10.4 0.0 10.8 9.85.8 3.8 4.8 4.6 3.4 4.5 4.9 4.1 2.7 7.3 5.6 5.0 6.7 3.5 4.9 0.0 4.1 5.5
13.5 7.6 13.9 7.6 7.8 10.2 16.3 11.7 8.2 14.6 11.6 11.4 10.3 8.0 10.1 0.0 8.8 10.30.0 0.0 0.0 0.0 0.0 0.0 0.0 0.0 0.0 0.0 0.0 0.0 0.0 0.0 0.0 0.0 0.0 0.02.5 20.9 16.0 14.8 16.0 13.9 12.5 9.4 6.8 6.5 10.3 9.2 7.5 13.4 17.5 50.0 15.0 9.90.0 0.3 0.0 0.0 0.0 0.1 0.2 0.0 0.0 0.8 0.3 0.2 0.3 0.2 0.6 0.0 0.3 0.3
*Includes 2-year, 4-year, and foreign colleges andSOURCE: NSF/NIH/USED/NEH/USDA/NASA, Su
universities, medical schools, and elementary/secondary schools. +Includes only recipients with definite employment plansrvey of Earned Doctorates
BEST COPY AVAILABLE83
109

APPENDIX TABLE A-3c. Statistical profile of doctorate recipients, by major field, 1999
Total women
- '.7;Cu)2 >, ottl E Z^ E c
.ro o
11, :1 -.
1999 1 P.,,E
ziC -0
Total in.0 'n .c .3 c0. 4 c=) .) n
aco
M
C
Om
C
u<
Total Women 17 493 192 633 216 277 156 114_74 791 310 2,090 901 319 320
Women as a Percentof Total Doctorates 42.5 13.4 29.7 26.2 25.5 18.4 23.3 14.8 40.6 43.2 63.9 28.6 44.6
U.S. Citizenship % 75.7 53.1 57.2 65.3 59.6 57.7 58.3 53.9 62.3 69.5 76.0 49.8 68.8Non-U.S., Permanent Visa 5.3 9.4 10.1 7.4 9.7 9.0 9.4 8.1 10.0 8.9 3.7 7.2 7.5Non-U.S., Temporary Visa 13.9 34.9 28.4 21.8 27.8 30.8 28.4 32.7 24.5 18.7 16.4 41.7 20.7Unknown 5.2 2.6 4.3 5.6 2.9 2.6 3.8 5.3 3.2 2.9 3.9 1.3 3.0
Never Married % 25.3 28.6 39.0 30.6 32.5 25.0 33.7 33.1 27.7 34.2 23.9 31.3 30.8Married 49.7 50.5 43.3 48.1 50.2 54.5 47.4 49.6 54.8 48.9 52.9 49.2 50.5Separated, Divorced 8.5 6.3 4.1 3.2 3.2 6.4 4.3 2.3 4.2 4.2 8.3 6.3 5.4Marriage-like Relationship 6.3 6.8 6.0 10.2 7.6 4.5 6.9 5.9 7.1 6.5 5.2 4.4 6.0Widowed 0.7 0.0 0.2 0.0 0.0 1.3 0.2 0.1 0.0 0.3 1.2 0.0 0.5Unknown 9.5 7.8 7.4 7.9 6.5 8.3 7.5 9.0 6.1 5.9 8.4 8.8 6.8
Median Age at Doct. Yrs 34.7 30.2 29.4 33.2 29.8 34.7 30.4 30.5 29.8 30.8 39.9 33.3 31.9
Percent with Bacc. inSame Field as Doctorate 49.0 70.8 72.4 46.3 73.6 30.1 64.1 66.5 23.2 56.5 48.6 39.2 50.1
Percent with Masters 74.6 67.7 40.6 64.4 74.0 86.5 58.8 77.7 29.7 40.4 82.7 79.9 53.5
Median Time Lapse from Bacc. ToTotal Time Yrs 11.3 7.8 6.9 10.0 7.5 12.5 7.9 8.0 7.0 8.1 15.3 10.4 9.0Registered Time 7.6 7.0 6.0 7.6 6.6 8.0 6.6 6.3 6.3 6.8 8.0 6.9 7.0
Postdoctoral Study Plans % 23.5 54.2 42.7 44.0 26.0 13.5 38.1 22.5 70.3 67.8 19.6 32.9 52.9Fellowship 13.3 19.8 19.6 21.3 14.8 6.4 17.6 8.2 40.0 41.1 10.7 13.8 31.0Research Assoc. 6.9 32.3 20.9 20.4 9.7 6.4 18.7 13.0 23.9 18.6 5.4 17.2 15.7Traineeship 0.8 1.0 0.8 1.4 0.0 0.0 0.7 0.5 1.0 1.2 0.9 0.6 1.0Other Study 2.6 1.0 1.4 0.9 1.4 0.6 1.2 0.8 5.5 6.9 2.7 1.3 5.2
Planned EmploymentAfter Doctorate % 64.9 37.0 47.4 44.4 66.1 76.9 52.2 66.4 19.4 24.7 71.5 55.8 38.6
Educ. Institution' 41.0 9.9 10.3 17.6 41.5 31.4 19.4 14.0 5.5 9.5 40.2 22.3 17.9Industry/Business 11.8 19.8 31.3 14.8 15.9 36.5 25.0 44.4 11.9 8.5 10.0 16.0 9.8Government 3.9 4.7 3.5 9.3 2.5 5.8 4.5 4.4 1.3 2.7 7.4 11.0 4.5Nonprofit 4.0 0.5 0.6 0.0 1.4 1.9 0.8 0.5 0.0 1.6 8.5 3.1 3.3Other & Unknown 4.1 2.1 1.7 2.8 4.7 1.3 2.4 3.0 0.6 2.4 5.3 3.4 3.1
Postdoc. Plans Unknown % 11.6 8.9 10.0 11.6 7.9 9.6 9.6 11.1 10.3 7.6 8.9 11.3 8.5
Definite Postdoc. Study % 16.8 39.6 32.2 29.2 19.9 10.9 28.2 16.6 54.8 51.2 12.8 22.3 39.4Seeking Postdoc. Study 6.7 14.6 10.4 14.8 6.1 2.6 10.0 5.9 15.5 16.6 6.9 10.7 13.5Definite Employment 44.3 23.4 33.0 30.6 45.1 60.3 36.6 44.4 11.9 14.3 50.4 36.4 25.0Seeking Employment 20.6 13.5 14.4 13.9 20.9 16.7 15.7 22.0 7.4 10.4 21.1 19.4 13.6
Employment CommitmentsDoctorate 7,750 45 209 66 125 94 539 351 37 299 454 116 906
Primary Activity+R & D % 20.5 53.3 64.6 42.4 32.8 47.9 50.6 65.5 51.4 37.8 31.1 56.0 37.3Teaching 44.7 22.2 23.0 30.3 55.2 35.1 33.4 14.5 27.0 29.8 40.1 25.0 34.2Administration 15.2 0.0 1.4 4.5 1.6 5.3 2.4 1.4 2.7 4.0 11.7 4.3 7.8Prof. Services 14.8 13.3 5.3 15.2 5.6 7.4 7.6 12.8 16.2 19.7 12.6 6.0 14.2Other 2.4 11.1 3.8 7.6 0.8 3.2 4.1 3.4 2.7 4.7 2.2 6.0 3.5
Secondary ActivityR & D % 35.7 28.9 21.5 45.5 52.8 37.2 35.1 19.7 21.6 31.4 37.7 27.6 33.7Teaching 18.1 6.7 5.7 9.1 14.4 19.1 10.6 14.0 21.6 15.1 18.7 22.4 18.1Administration 12.7 15.6 23.0 10.6 6.4 10.6 14.8 16.8 16.2 18.4 13.4 15.5 15.5Prof. Services 11.7 11.1 8.6 12.1 7.2 9.6 9.1 15.1 5.4 10.4 15.6 12.1 13.0Other 2.1 4.4 1.9 3.0 1.6 1.1 2.0 2.3 0.0 1.3 1.3 3.4 1.5No Secondary Activity 17.3 33.3 37.3 19.7 13.6 21.3 26.5 29.9 35.1 19.4 11.0 16.4 15.5
Activity(ies) Unknown % 2.4 0.0 1.9 0.0 4.0 1.1 1.9 2.3 0.0 4.0 2.2 2.6 2.8
Region of EmploymentAfter Doctorate+
New England % 6.4 4.4 11.6 12.1 4.8 3.2 8.0 6.0 8.1 7.7 7.8 2.6 7.1Middle Atlantic 14.3 8.9 17.9 7.6 16.1 18.1 15.5 18.4 10.8 12.7 10.9 5.2 10.8
. East No. Central 14.6 2.2 14.5 16.7 17.7 10.6. 13.8 13.2 16.2 9.7 11.3 10.4 10,9West No. Central 7.3 2.2 3.4 0.0 7.3 4.3 3.9 6.0 0.0 6.4 6.2 17.4 7.4South Atlantic 18.5 13.3 15.0 13.6 15.3 21.3 15.9 14.7 18.9 17.1 23.3 17.4 20.3East So. Central 5.1 4.4 2.4 1.5 2.4 2.1 2.4 1.1 2.7 3.3 4.2 2.6 3.7West So. Central 8.7 15.6 10.1 12.1 10.5 5.3 10.1 10.1 5.4 7.0 8.2 4.3 7.2Mountain 5.4 6.7 2.9 10.6 4.8 6.4 5.2 6.3 8.1 5.0 5.8 4.3 5.4Pacific & Insular '12.8 28.9 17.9 12.1 14.5 17.0 17.2 15.5 21.6 20.1 13.7 11.3 15.9U.S., Region Unknown 0.0 0.0 0.0 0.0 0.0 0.0 0.0 0.0 0.0 0.0 0.0 0.0 0.0Foreign 6.6 13.3 4.3 13.6 6.5 11.7 8.0 8.3 5.4 10.7 8.6 23.5 11.1Region Unknown 0.3 0.0 0.0 0.0 0.0 0.0 0.0 0.3 2.7 0.3 0.0 0.9 0.3
NOTE: Field groupings may differ from those in reports published by federal sponsors of the Survey of Earned Doctorates.#Physical Sciences includes Mathematics and Computer Sciences, as well as Physics/Astronomy, Chemistry, and Earth/Atmospheric/Marine Sciences.
84 116

APPENDIX TABLE A-3c. Statistical profile of doctorate recipients, by major field, 1999
Total women
P 2 7 t -,' g.17)) . 0 ).-
0 uLLI LLIco R <
-0 I' -0_1 .
L Oi a ',71 -ro 7,., ,0 s ..., Q. -, C co C gi ....t.. 2a a s .
g... .. ,,.. . i.--:.E .6.
,.. . 0-, .....2 0 ch 2 7.2 2' 2 §a o-) ouz g 0 tv o m
.R % o. E W 0 cn 0 z 1-- u) ui x 'Li -I u. _i 0 x
ILL 02
o C.)
en Ixto _I
LLI
riu. o < 0o F..
n 0 z
2,447 781 585 253 282 3 819 9 704 400 604 384 1,270 2 658 4 196 342 581 12 935 7 789
66.7 43.0 58.3 32.7 42.4 54.3 36.2 39.6 59.0 61.1 45.3 48.6 64.0 31.0 50.1 42.9 40.8 54.4
87.0 69.9 78.5 77.1 75.9 81.5 71.0 84.0 89.7 63.5 76.5 78.7 84.4 76.0 77.5 25.0 76.3 81.52.0 6.1 5.6 5.9 4.6 3.6 6.3 3.3 3.0 15.9 5.1 5.9 2.6 5.6 4.3 16.7 4.9 4.0
3.4 21.0 9.7 13.4 14.9 8.3 18.0 8.0 4.6 16.7 13.2 11.0 6.5 13.5 12.4 8.3 12.7 8.87.6 2.9 6.2 3.6 4.6 6.6 4.7 4.8 2.6 3.9 5.2 4.4 6.4 5.0 5.9 50.0 6.1 5.7
26.3 25.4 24.6 29.6 22.7 26.6 29.8 25.0 27.3 25.8 27.2 26.7 14.8 19.0 23.9 8.3 21.9 19.7
45.4 53.3 45.0 43.5 49.6 45.7 48.1 50.0 44.0 49.0 43.3 45.3 56.1 53.2 48.0 16.7 49.5 51.6
8.4 8.6 10.6 6.7 11.7 8.5 6.2 8.3 9.9 9.6 9.4 9.4 13.0 8.5 9.8 0.0 9.2 11.3
6.6 5.2 10.4 8.7 8.9 7.4 6.7 8.0 10.9 7.8 9.4 9.3 3.5 4.4 6.9 0.0 5.9 5.8
0.3 1.0 0.2 1.6 0.4 0.4 0.4 1.0 0.7 0.3 0.4 0.5 1.6 1.5 0.5 0.0 0.9 1.2
13.0 6.5 9.2 9.9 6.7 11.4 8.9 7.8 7.1 7.6 10.2 8.8 10.9 13.5 10.8 75.0 12.6 10.4
32.2 31.2 35.5 33.3 36.1 32.8 31.8 34.7 34.3 34.3 35.4 34.8 45.0 36.8 39.6 33.5 38.2 40.6
58.8 45.3 73.0 52.2 17.4 57.6 56.5 51.3 61.9 0.0 49.2 45.3 37.7 34.5 29.9 0.0 31.2 39.5
75.3 84.9 80.9 79.8 87.9 77.3 65.6 82.0 86.4 86.7 82.4 83.9 87.6 78.4 88.3 25.0 83.9 85.9
9.0 8.6 11.8 10.8 12.6 9.8 9.0 11.3 11.0 11.0 12.0 11.6 20.5 13.0 15.5 11.0 13.6 13.8
7.2 7.0 8.8 8.3 8.0 7.5 7.0 9.0 8.7 8.7 9.0 8.9 8.2 7.7 8.3 5.5 8.0 8.4
31.0 7.7 17.9 11.5 13.8 25.0 37.2 11.8 6.8 8.1 7.9 8.2 5.7 3.8 6.0 0.0 5.1 6.5
23.3 3.1 9.6 7.5 5.3 17.6 21.8 7.8 4.1 2.9 4.2 4.5 1.5 0.6 2.6 0.0' 1.8 2.6
3.7 2.0 5.8 3.2 5.7 4.1 11.3 1.8 0.7 1.0 1.0 1.1 1.4 1,5 1.7 0.0 1.6 1.3
1.8 0.3 0.2 0.4 0.0 1.2 1.0 0.3 0.3 1.3 0.6 0.6 0.6 0.6 0.3 0.0 0.4 0.6
2.2 2.3 2.4 0.4 2.8 2.1 3.0 2.0 1.7 2.9 2.1 2.1 2.2 1.2 1.4 0.0 1.3 2.0
53.8 84.3 70.8 75.9 76.6 61.6 52.0 76.3 85.1 80.7 79.8 80.6 81.2 83.6 80.7 25.0 81.1 81.021.6 61.1 48.5 50.6 45.0 30.7 22.8 58.3 69.0 71.4 60.1 63.5 65.1 65.8 54.9 16.7 58.4 63.7
13.4 10.1 8.2 5.9 8.9 12.2 15.9 4.8 7.9 3.6 8.8 7.3 5.5 11.7 10.8 0.0 11.0 6.8
5.2 5.5 2.6 8.3 7.1 5.5 4.9 3.0 0.7 0.3 1.3 1.2 3.5 1.5 4.1 0.0 3.1 2.7
8.8 3.1 5.8 5.5 11.0 8.0 4.5 3.0 1.2 0.8 4.6 3.0 3.4 1.8 6.2 0.0 4.5 3.4
4.8 4.5 5.6 5.5 4.6 5.2 3.8 7.3 6.3 4.7 5.0 5.6 3.8 2.9 4.6 8.3 4.1 4.5
15.2 8.1 11.3 12.6 9.6 13.4 10.8 12.0 8.1 11.2 12.3 11.1 13.0 12.6 13.3 75.0 13.8 12.5
22.6 4.2 12.0 7.5 7.8 17.8 27.3 7.5 3.3 4.2 4.5 4.6 3.3 1.8 4.0 0.0 3.1 3.7
8.4 3.5 6.0 4.0 6.0 7.2 9.9 4.3 3.5 3.9 3.4 3.6 2.4 2.0 2.1 0.0 2.0 2.8
34.0 60.6 43.4 50.6 53.2 39.7 34.2 46.8 53.0 56.5 49.2 50.8 60.1 67.8 57.5 8.3 60.6 57.0
19.9 23.7 27.4 25.3 23.4 21.8 17.8 29.5 32.1 24.2 30.6 29.9 21.2 15.8 23.2 16.7 20.4 24.0
831 473 254 128 150 1.518 3.314 187 320 217 625 1 349 2 520 232 334 1 567 436
15.9 19.7 30.7 32.0 32.7 24.8 36.8 6.4 5.6 6.5 8.6 7.3 6.0 28.4 15.3 0.0 20.6 8.320.9 57.7 53.9 53.9 42.0 32.2 31.1 77.5 80.0 84.3 72.5 76.9 43.0 54.3 56.6 100.0 55.7 54.9
5.4 8.7 5.9 7.0 9.3 5.7 5.3 7.5 5.3 3.7 5.4 5.4 34.9 7.3 9.9 0.0 8.8 22.6
53.4 9.1 5.1 3.9 14.7 33.5 21.8 5.3 3.4 1.4 7.2 5.1 11.6 6.5 14.4 0.0 11.1 9.6
2.3 1.7 2.4 1.6 0.7 2.0 2.9 1.1 3.1 0.5 4.5 3.0 1.5 1.3 1.5 0.0 1.4 1.9
28.2 40.4 50.4 47.7 36.7 35.0 33.0 68.4 54.4 60.4 44.2 52.6 26.9 50.0 49.4 100.0 49.7 37.6
20.2 14.8 18.9 18.0 22.7 20.3 17.4 8.6 9.1 6.9 14.7 11.3 21.2 31.0 18.9 0.0 23.8 18.5
16.7 12.9 9.8 10.9 12.7 14.0 14.8 4.8 12.2 9.2 12.0 10.6 12.2 3.0 11.1 0.0 7.8 11.1
8.9 11.4 7.1 8.6 11.3 8.6 10.6 3.7 5.3 7.4 9.0 7.1 16.7 7.3 7.5 0,0 7.4 12.6
1.9 1.5 1.6 1.6 2.0 2.0 1.9 3.7 2.8 0.9 6.1 4.2 1.5 0.4 1.8 0.0 1.2 2.3
22.0 15.9 10.2 11.7 14.0 18.3 20.1 8.6 13.8 12.0 12.3 12.1 18.6 6.0 9.0 0.0 7.8 15.2
2.0 3.2 2.0 1.6 0.7 1.8 2.1 2.1 2.5 3.2 1.8 1.8 2.9 2.2 2.4 0.0 2.3 2.6
5.7 8.1 7.1 7.8 11.4 7.4 7.3 7.5 8.2 15.2 6.6 8.5 4.5 5.6 4.8 0,0 5.1 5.819.9 15.1 12.2 9.4 12.8 15.9 14.7 18.2 16.7 14.3 14.2 15.4 13.2 13.8 14.7 0.0 14.3 14.0
14.0 13.0 18.9 18.0 14.8 14.7 13.3 12.8 15.5 14.3 15.6 15.0 15.3 16.4 18.0 0.0 17.3 15.5
7.6 4.5 5.9 3.1 7.4 6.3 6.2 7.0 7.6 9.7 8.7 8.4 8.5 4.7 6.0 0.0 5.5 8.1
16.4 22.6 15.7 23.4 20.8 18.8 18.3 11.8 17.0 11.1 15.6 14.7 20.6 20.3 19.8 0.0 19.9 18.7
5.1 5.5 3.1 2.3 4.0 4.0 3.4 6.4 7.6 6.5 3.9 5.5 7.1 6.5 4.8 0.0 5.5 6.4
9.1 6.2 5.9 7.0 0.7 6.9 7.9 8.0 9.1 7.4 8.5 8.4 9.8 12.1 6.9 0.0 9.0 9.3
6.3 5.1 6.7 7.8 5.4 6.1 5.8 6.4 2.5 0.9 5.2 4.0 5.8 3.9 4.8 0.0 4.4 5.1
13.9 9.2 18.9 . 14.1 10.7 13.9 15.1 13.9 12.3 11.1 11.3 11.9 11.0 6.9 12.6 0.0 10.2 11.1
0.0 0.0 0.0 0.0 0.0 0.0 0.0 0.0 0.0 0.0 0.0 0.0 0.0 0.0 0.0 0.0 0.0 0.01.8 10.4 5.5 7.0 12.1 5.8 7.9 7.5 3.5 9.2 10.2 8.1 3.8 8.6 7.8 100.0 8.3 5.7
0.2 0.2 0.0 0.0 0.0 0.1 0.2 0.5 0.0 0.5 0.2 0.2 0.3 1.3 0.0 0.0 0.5 0.3#Physical Sciences includes Mathematics and Computer Sciences, as well as Physics/Astronomy, Chemistry, and Earth/Atmospheric/Marine Sciences.'Includes 2-year, 4-year, and foreign colleges and universities, medical schools, and elementary/secondary schools. +Includes only recipients with definite employment plans.Source: NSF /NIH/USED /NEH /USDA/NASA, Survey of Earned Doctorates
BEST COPY AVAILABLE
85
1 1 1:

APPENDIX TABLE A-4. Statistical profile of doctorate recipients, by race/ethnicity and citizenship, 1999
Total
Non-U.S.AmericanInd lant
Total
Asian$ Black
Total
Non-U.S.
Total
Non-U.S.
U.S. Perm. Temp. U.S. Perm. Temp. U.S. Perm. Temp.
Total Number 41,140 27,622 2,300 9,068 219 8,032 1,324 1,194 5,479 2,071 1,596 133 288
Male % 57.0 52.1 59.8 73.2 44.7 69.0 58.3 59.5 73.7 44.4 37.8 69.2 72.6
Female 42.5 47.9 40.2 26.8 55.3 31.0 41.7 40.5 26.3 55.6 62.2 30.8 27.4
.Doctoral FieldPhysical Sciences++ % 15.4 12.5 18.7 23.7 8.2 21.1 16.3 18.8 22.7 7.2 5.7 14.3 12.8
Engineering 13.0 9.0 17.3 24.2 5.5 25.3 20.1 20.9 27.7 6.3 5.3 9.0 11.8
Life Sciences 19.8 18.5 26.3 23.3 12.8 26.0 27.3 33.0 24.2 14.6 11.2 18.8 33.7
Social Sciences 17.1 19.4 11.2 10.7 27.4 10.3 14.2 9.3 9.4 18.1 19.5 17.3 12.8
Humanities 13.3 15.4 13.4 7.1 11.4 5.8 9.5 7.5 4.6 10.0 10.8 12.0 6.6
Education 15.9 19.7 7.8 5.7 27.4 6.1 7.8 5.6 5.8 35.5 38.9 21.8 15.3
ProfessionaVOther 5.6 5.6 5.2 5.4 7.3 5.4 4.8 4.9 5.7 8.2 8.7 6.8 6.9
Median Age at Doct. Yrs 33.8 34.2 34.6 32.7 39.7 32.8 31.1 34.5 32.8 38.5 38.6 38.3 37.0
Median Time Lapse From Bacc. to Doct.
Total Time Yrs 10.4 10.7 11.4 9.8 13.0 10.2 8.5 12.0 10.2 13.2 13.7 12.7 12.0
Registered Time 7.3 7.5 8.0 7.0 8.2 7.3 7.0 8.3 7.2 7.7 7.9 8.0 6.9
DoctoralTeaching Assistantships % 17.4 16.0 21.3 20.7 9.6 18.0 14.0 19.4 18.6 9.2 7.5 13.6 17.0
Res. 25.2 19,6 33.7 40.6 16.2 43.4 31.8 41.7 46.6 12.2 7.9 26.3 29.3Fellowships/Dissertation 18.3 18.8 17.2 17.0 24.7 16.6 27.1 17.0 13.9 30.4 29.9 23.7 36.3
Own Resources 32.6 40.6 22.1 10.2 44.4 14.8 22.7 17.0 12.4 41.7 48.6 33.1 6.6
Foreign Government 2.7 0.2 3.2 10.3 1.5 5.5 1.1 2.5 7.3 1.5 0.3 0.8 8.9
Employer 3.3 4.1 2.3 1.1 2.5 1.5 2.7 2.2 1.0 4.2 4.8 2.5 1.2
Other % 0.5 0.7 0.3 0.1 1.0 0.2 0.6 0.3 0.1 0.9 1.0 0.0 0.8
Postdoctoral PlansPostdoc study plans 25.9 24.1 33.3 35.7 21.0 36.3 35.4 36.3 36.6 21.7 18.8 30.8 37.2
Postdoc employment plans 63.2 70.3 60.9 56.7 68.9 57.5 59.4 59.1 56.8 68.9 74.6 62.4 52.8
Educ. Institution # % 34.7 41.1 27.7 25.0 41.6 22.1 24.2 21.7 21.7 47.0 52.9 33.8 28.8
Industry/Business 17.5 16.0 25.2 24.1 8.2 28.0 24.7 30.2 28.3 10.1 9.5 15.8 12.2
Government 4.6 5.3 1.9 4.0 7.3 3.6 4.4 1.8 3.8 5.3 5.5 3.8 5.9
Nonprofit 3.2 4.1 3.2 1.5 4.6 1.9 2.9 3.0 1.5 3.4 3.6 5.3 2.1
Other/Unknown 3.1 3.7 2.9 2.1 7.3 2.0 3.2 2.4 1.5 3.1 3.1 3.8 3.8
Postdoc plans unknown % 10.9 5.7 5.8 7.5 10.0 6.2 5.1 4.6 6.6 9.4 6.6 6.8 10.1
Definite Postdoc. Study % 18.9 18.3 22.4 24.2 14.2 24.3 26.3 24.5 23.9 12.7 11.5 14.3 20.8
Seeking Postdoc. Study 7.1 5.8 10.9 11.5 6.8 12.0 9.1 11.7 12.7 9.0 7.3 16.5 16.3
Definite Employment 43.7 49.6 38.5 37.2 43.8 36.1 39.1 35.3 35.7 46.5 51.6 34.6 32.3
Seeking Employment 19.5 20.6 22.4 19.5 25.1 21.4 20.3 23.8 21.1 22.4 22.9 27.8 20.5
Employment LocationAfter Doctorate+ 17,982 13,709 885 3,376 96 2,900 518 422 1,956 963 824 46 93
U.S. % 90.3 97.9 90.0 59.8 94.8 75.6 95.3 91.2 66.9 92.9 98.9 84.4 43.5
Foreign 9.4 1.9 9.7 40.0 4.2 24.1 4.3 8.4 32.8 6.7 0.6 15.6 56.5
Unknown % 0.3 0.2 0.3 0.3 1.0 0.3 0.4 0.5 0.3 0.4 0.5 0.0 0.0
BEST COPY AVAILABLE
86
112

APPENDIX TABLE A-4. Statistical profile of doctorate recipients, by race/ethnicity and citizenship, 1999
White PuertoRicanTotal
Mexican American Other Hispanic Unknown Race
Total* U.S.Non-U.S.
Total U.S.Non-U.S.
Total U.S.Non-U.S.
Total U.S.Non-U.S.
Perm. Temp. Perm. Temp. Perm. Temp. Perm. Temp.
26,450 22,929 796 2,480 292 394 333 11 50 1,156 484 126 511 2,526 445 40 260
54.9 52.9 59.9 72.6 43.8 50.8 45.0 90.9 80.0 55.4 43.0 45.2 71.4 55.8 64.0 70.0 71.5
45.1 47.1 40.1 27.4 56.2 49.2 55.0 9.1 20.0 44.6 57.0 54.8 28.6 36.9 36.0 30.0 27.3
14.6 12.9 20.4 28.9 10.6 9.4 8.1 18.2 16.0 11.3 7.2 8.7 16.4 16.5 16.2 25.0 21.9
9.9 8.6 14.9 19.8 7.9 7.4 3.3 18.2 32.0 11.0 7.6 7.1 15.5 14.8 13.3 20.0 21.5
18.5 18.7 18.6 18.5 17.5 18.5 16.8 36.4 26.0 23.9 18.2 21.4 30.7 16.0 16.6 17.5 22.7
18.5 19.4 12.2 12.2 22.3 19.3 20.1 27.3 12.0 21.6 30.2 15.1 15.3 19.8 16.6 12.5 11.2
15.6 16.1 20.2 10.9 11.6 14.2 15.6 0.0 8.0 16.9 17.4 31.0 13.5 13.7 17.8 7.5 10.0
17.6 18.9 8.5 4.8 24.0 26.1 30.3 0.0 4.0 11.7 16.7 11.1 4.5 12.4 15.5 5.0 5.4
5.4 5.4 5.2 4.9 6.2 5.1 5.7 0.0 2.0 3.6 2.7 5.6 4.1 6.8 4.0 12.5 7.3
33.7 34.1 33.8 31.5 35.9 35.5 34.7 37.1 37.0 35.1 35.0 35.8 34.5 34.0 34.9 34.8 33.2
10.3 10.6 10.0 8.2 12.5 11.0 10.6 12.3 11.0 10.7 11.2 10.7 10.0 10.5 11.1 12.0 10.0
7.3 7.5 7.5 6.6 8.6 7.4 7.5 10.0 7.0 7.0 7.6 8.0 6.5 7.4 7.6 8.0 7.2
18.0 17.0 24.9 26.2 10.9 11.7 10.9 27.3 13.6 16.9 14.3 21.8 17.8 19.4 16.9 29.0 21.5
21.5 20.1 26.5 33.6 10.9 11.2 9.4 9.1 25.0 17.8 15.7 13.4 20.7 22.6 17.4 25.8 31.4
17.2 16.9 14.9 20.0 34.4 33.9 34.4 27.3 31.8 23.1 23.8 26.1 21.8 21.4 22.1 22.6 20.3
37.5 41.0 27.4 6.9 37.0 37.1 42.5 9.1 4.5 23.8 41.8 31.1 6.3 27.2 38.7 6.5 8.1
1.3 0.1 3.5 11.9 0.4 4.0 0.3 27.3 25.0 16.4 1.0 5.0 32.6 5.9 0.8 12.9 15.7
3.9 4.2 2.4 1.3 6.5 2.1 2.5 0.0 0.0 1.9 3.2 1.7 0.8 2.4 2.8 3.2 1.7
0.6 0.7 0.4 0.1 0.0 0.0 0.0 0.0 0.0 0.2 0.2 0.8 0.0 1.2 1.4 0.0 1.2
25.2 23.9 30.0 37.5 20.9 25.1 25.5 45.5 18.0 23.7 22.9 32.5 23.9 6.5 19.8 17.5 25.0
68.7 70.9 63.4 56.3 73.3 70.6 70.9 54.5 72.0 63.7 62.4 61.9 69.3 15.7 59.6 57.5 36.5
39.6 41.4 33.9 29.2 46.9 49.2 52.0 27.3 36.0 37.5 35.3 43.7 40.3 7.5 30.1 12.5 18.8
16.6 16.3 21.6 19.5 12.7 10.9 9.9 27.3 14.0 12.9 13.6 7.1 14.3 4.9 14.6 35.0 13.8
5.0 5.3 1.8 3.4 5.1 5.6 3.9 0.0 18.0 6.5 6.8 2.4 7.6 1.2 5.4 0.0 1.9
3.9 4.2 3.0 1.5 4.8 3.3 3.6 0.0 2.0 2.7 2.5 4.0 2.7 0.5 2.2 5.0 0.0
3.6 3.7 3.1 2.8 3.8 1.5 1.5 0.0 2.0 4.2 4.1 4.8 4.3 1.6 7.2 5.0 1.9
6.1 5.1 6.5 6.2 5.8 4.3 3.6 0.0 10.0 12.6 14.7 5.6 6.8 77.8 20.7 25.0 38.5
19.3 18.5 21.1 27.9 14.4 15.0 15.6 9.1 12.0 17.2 16.7 24.6 17.0 4.4 15.1 7.5 15.0
5.9 5.4 8.9 9.6 6.5 10.2 9.9 36.4 6.0 6.5 6.2 7.9 6.8 2.1 4.7 10.0 10.0
48.8 50.6 42.2 39.4 48.3 50.5 50.2 45.5 54.0 45.2 42,6 45.2 50.3 10.0 36.6 47.5 25.4
19.9 20.3 21.2 16.9 25.0 20.1 20.7 9.1 18.0 18.5 19.8 16.7 19.0 5.7 22.9 10.0 11.2
12,908 11,594 336 977 141 199 167 5 27 522 206 57 257 253 163 19 66
94.6 98.0 90.1 56.5 97.9 88.4 99.4 60.0 25.9 61.7 95.1 89.3 29.2 83.8 96.9 84.2 51.5
5.1 1.8 9.6 43.3 1.4 11.6 0.6 40.0 74.1 38.3 4.9 10.7 70.8 15.4 3,1 15.8 47.0
0.2 0.2 0.3 0.2 0.7 0.0 0.0 0.0 0.0 0.0 0.0 0.0 0.0 0.8 0.0 0.0 1.5
NOTE: Field groupings may differ from those in reports published by federal sponsors of the Survey of Earned Doctorates.
'Includes 187 individuals who did not report their sex and 2,150 individuals who did not report their citizenship at time of doctoratein this table a recipient counts once in each source category from which he or she received support.
Since students indicate multiple sources of support, the vertical percentages sum to more than 100 percen.(Data on the "primary" source of support for doctorate recipients are presented in the Summary Report.)#Includes 2-year, 4-year, and foreign colleges and universities, medical schools, and elementary/secondary schools.+Includes only recipients with definite employment plans.fincludes Alaskan Native.tIncludes Pacific Islander.++ Includes mathematics and computer sciences.
SOURCE: NSF/NIH/USED/NEH/USDA/NASA, Survey of Earned Doctorates
BEST COPYAVAILABLE
87 113

APPENDIX TABLE A-5. Doctorate recipients' financial resources in support of doctoral programs, by broad field and sex, 1999
FinancialResource
TotalMen Women
PhysicalSciences"
Men WomenEngineering
Men WomenLife SciencesMen Women
Social SciencesMen Women
HumanitiesMen Women
EducationMen Women
Prof/OtherFields
Men Women
Loans N 6,995 6,248 985 325 780 135 1,179 958 1,444 1,942 1,285 1,173 843 1,351 479 364(from any V** 32.5% 39.2% 22.1% 23.6% 18.7% 18.6% 28.3% 28.2% 50.4% 57.1% 50.1% 47.9% 40.1% 36.0% 40.0% 44.1%source) Fl** 100.0 100.0% 14.1% 5.2% 11.2% 2.2% 16.9% 15.3% 20.6% 31.1% 18.4% 18.8% 12.1% 21.6% 6.8% 5.8%
Foreign N 2,239 893 371 84 652 59 369 197 337 170 256 214 106 123 148 46(non-U.S.) V 10.4% 5.6% 8.3% 6.1% 15.7% 8.1% 8.9% 5.8% 11.8% 5.0% 10.0% 8.7% 5.0% 3.3% 12.4% 5.6%Support H 100.0 100.0% 16.6% 9.4% 29.1% 6.6% 16.5% 22.1% 15.1% 19.0% 11.4% 24.0% 4.7% 13.8% 6.6% 5.2%
Fellowship, N 11,304 8,669 2,272 796 1,826 422 2,335 2,085 1,734 1,975 1,888 1,723 616 1,228 633 440Scholarship V 52.5% 54.4% 51.1% 57.7% 43.9% 58.2% 56.0% 61.4% 60.5% 58.1% 73.6% 70.3% 29.3% 32.7% 52.8% 53.3%
H 100.0 100.0% 20.1% 9.2% 16.2% 4.9% 20.7% 24.1% 15.3% 22.8% 16.7% 19.9% 5.4% 14.2% 5.6% 5.1%
Dissertation N 2,633 2,846 287 111 170 56 426 521 653 832 766 830 149 338 182 158Grant V 12.2% 17.9% 6.4% 8.0% 4.1% 7.7% 10.2% 15.3% 22.8% 24.5% 29.9% 33.9% 7.1% 9.0% 15.2% 19.2%
H 100.0 100.0% 10.9% 3.9% 6.5% 2.0% 16.2% 18.3% 24.8% 29.2% 29.1% 29.2% 5.7% 11.9% 6.9% 5.6%
Teaching N 12,679 8,650 3,477 1,109 2,097 378 1,811 1,446 2,030 2,229 1,995 2,008 534 983 735 497Assistant V 58.9% 54.3% 78.1% 80.4% 50.4% 52.1% 43.5% 42.6% 70.8% 65.6% 77.7% 81.9% 25.4% 26.2% 61.4% 60.2%
H 100.0 100.0% 27.4% 12.8% 16.5% 4.4% 14.3% 16.7% 16.0% 25.8% 15.7% 23.2% 4.2% 11.4% 5.8% 5.7%
Research N 12,677 7,480 3,477 1,047 3,281 575 2,656 1,982 1,570 1,910 644 703 450 857 599 406Assistant V 58.9% 47.0% 78.1% 75.9% 78.8% 79.3% 63.8% 58.4% 54.8% 56.2% 25.1% 28.7% 21.4% 22.8% 50.0% 49.2%
H 100.0 100.0% 27.4% 14.0% 25.9% 7.7% 21.0% 26.5% 12.4% 25.5% 5.1% 9.4% 3.5% 11.5% 4.7% 5.4%
Traineeship N 928 1,103 102 57 90 26 470 527 193 396 25 24 30 60 18 13V 4.3% 6.9% 2.3% 4.1% 2.2% 3.6% 11.3% 15.5% 6.7% 11.7% 1.0% 1.0% 1.4% 1.6% 1.5% 1.6%H 100.0 100.0% 11.0% 5.2% 9.7% 2.4% 50.6% 47.8% 20.8% 35.9% 2.7% 2.2% 3.2% 5.4% 1.9% 1.2%
Internship or N 1,452 1,655 236 67 314 52 108 86 563 1,135 81 66 110 215 40 34Residency V 6.7% 10.4% 5.3% 4.9% 7.5% 7.2% 2.6% 2.5% 19.6% 33.4% 3.2% 2.7% 5.2% 5.7% 3.3% 4.1%
I-1 100.0 100.0% 16.3% 4.0% 21.6% 3.1% 7.4% 5.2% 38.8% 68.6% 5.6% 4.0% 7.6% 13.0% 2.8% 2 1%
Personal N 11,115 9,025 1,720 551 1,844 303 1,871 1,641 1,783 2,044 1,618 1,418 1,506 2,521 773 547Savings V 51.7% 56.7% 38.7% 39.9% 44.3% 41.8% 44.9% 48.3% 62.2% 60.1% 63.1% 57.9% 71.6% 67.2% 64.5% 66.3%
H 100.0 100.0% 15.5% 6.1% 16.6% 3.4% 16.8% 18.2% 16.0% 22.6% 14.6% 15.7% 13.5% 27.9% 7.0% 6.1%
Other N 8,863 8,452 1,123 362 1,135 167 1,125 1,163 1,644 2,113 1,771 1,665 1,406 2,477 659 505Earnings V 41.2% 53.1% 25.2% 26.2% 27.3% 23.0% 27.0% 34.3% 57.3% 62.2% 69.0% 67.9% 66.8% 66.0% 55.0% 61.2%Graduate H 100.0 100.0% 12.7% 4.3% 12.8% 2.0% 12.7% 13.8% 18.5% 25.0% 20.0% 19.7% 15.9% 29.3% 7.4% 6.0%
Family N 8,513 8,041 1,348 468 1,271 271 1,582 1,510 1,391 2,020 1,426 1,344 931 1,972 564 456Earnings or V 39.6% 50.5% 30.3% 33.9% 30.5% 37.4% 38.0% 44.5% 48.5% 59.4% 55.6% 54.8% 44.2% 52.5% 47.1% 55.3%Savingst H 100.0 100.0% 15.8% 5.8% 14.9% 3.4% 18.6% 18.8% 16.3% 25.1% 16.8% 16.7% 10.9% 24.5% 6.6% 5.7%
Employer N 2,399 1,967 309 82 516 61 277 328 263 268 225 182 609 921 200 125Reimburse. V 11.2% 12.3% 6.9% 5.9% 12.4% 8.4% 6.6% 9.7% 9.2% 7.9% 8.8% 7.4% 28.9% 24.5% 16.7% 15.2%Assistance H 100.0 100.0% 12.9% 4.2% 21.5% 3.1% 11.5% 16.7% 11.0% 13.6% 9.4% 9.3% 25.4% 46.8% 8.3% 6.4%
Other N 239 199 24 5 41 5 27 35 27 51 36 24 57 67 27 12V 1.1% 1.2% 0.5% 0.4% 1.0% 0.7% 0.6% 1.0% 0.9% 1.5% 1.4% 1.0% 2.7% 1.8% 2.3% 1.5%H 100.0 100.0% 10.0% 2.5% 17.2% 2.5% 11.3% 17.6% 11.3% 25.6% 15.1% 12.1% 23.8% 33.7% 11.3% 6.0%
UnduplicatedTotal*** N 21,513 15,928 4,450 1,380 4,162 725 4,166 3,395 2,867 3,399 2,566 2,451 2,104 3,753 1,198 825
NOTE: In this table a recipient counts once in each source category from which he or she received support. Since students indicate multiple sources of support, the vertical percentagessum to more than 100 percent. (Data on the "primary" source of support for doctorate recipients are presented in the body of the Summary Report.) Field groupings may differ from thosein reports published by federal sponsors of the Survey of Earned Doctorates. The table excludes 187 individuals for whom gender was not reported.*Includes mathematics and computer sciences.**V denotes vertical percentage; H denotes horizontal percentage."'The 4.206 Ph.D.s who did not report sources of support are omitted from this total. Percentages are based only on known responsestThis category includes spouses and significant others.
SOURCE: NSF/NIH/USED/NEH/USDA/NASA, Survey of Earned Doctorates
BEST COPY AVAILABLE

APPENDIX TABLE A-6. State of doctoral institution of doctorate recipients, by broad field and sex, 1999
StateTotal**
Men Women
PhysicalSciences***
Men WomenEngineeringMen Women
LifeSciences
Men Women
SocialSciences
Men WomenHumanities
Men WomenEducation
Men Women
Prof./OtherFields
Men Women
U.S. Total* 23,460 17,493 4,821 1,474 4,503 791 4,473 3,620 3,194 3,819 2,777 2,658 2,344 4,196 1,348 935
Alabama 293 195 49 14 59 2 82 52 26 31 12 16 46 68 19 12
Alaska 18 9 7 3 1 0 5 4 1 1 3 0 0 1 1 0
Arizona 424 302 104 27 82 13 67 57 44 54 50 37 54 97 23 17
Arkansas 70 51 8 5 9 1 23 11 2 1 5 3 17 28 6 2
California 2,703 1,996 616 196 626 112 424 389 418 575 331 310 177 328 111 86Colorado 430 243 111 33 120 13 68 . 44 67 62 23 31 27 51 14 9
Connecticut 337 236 72 32 28 6 79 52 54 42 82 74 12 23 10 7
Delaware 107 59 24 5 36 5 12 5 14 17 7 11 13 16 1 0
Dist. of 266 247 40 17 21 2 27 40 68 69 48 54 27 48 35 17
Florida 1,003 939 165 41 155 33 111 100 115 196 73 53 285 448 99 68
Georgia 524 408 85 24 143 22 103 80 75 88 45 50 42 110 31 34
Hawaii 95 62 22 5 2 1 25 18 22 17 20 9 4 12 0 0
Idaho 46 34 7 4 7 1 15 7 2 2 1 1 14 19 0 0
Illinois 1,273 928 250 61 242 31 192 153 190 230 201 159 134 242 64 52
Indiana 636 421 131 43 129 26 120 85 70 80 107 88 43 70 36 29
Iowa 354 227 82 19 66 14 85 60 32 36 35 27 42 61 12 10
Kansas 244 189 37 22 36 4 50 33 37 41 34 25 39 57 11 7
Kentucky 188 129 25 5 22 3 43 24 28 26 27 18 20 43 23 10
Louisiana 327 222 66 13 51 9 76 59 34 34 43 43 26 49 31 15
Maine 19 18 7 1 4 2 3 7 2 1 1 2 1 5 1 0
Maryland 547 458 126 34 119 17 140 165 75 98 58 79 16 52 13 13
Massachusetts 1,205 886 317 92 247 56 212 201 179 203 152 177 41 116 57 41
Michigan 859 564 172 44 210 42 157 107 126 140 88 107 66 98 40 26
Minnesota 420 351 63 22 72 11 111 90 39 60 51 59 46 86 38 23
Mississippi 197 175 27 11 15 2 58 20 16 20 17 13 41 95 23 14
Missouri 370 296 53 16 58 8 89 74 50 56 41 44 50 80 29 18
Montana 48 35 19 1 5 1 14 8 0 10 0 0 10 15 0 0
Nebraska 166 125 26 6 12 2 63 26 20 27 15 16 21 37 9 11
Nevada 49 32 12 3 7 0 5 4 11 11 2 4 12 9 0 1
New Hampshire 54 43 18 7 9 2 16 16 5 6 2 8 4 4 0 0
New Jersey 510 312 156 38 90 22 87 52 57 64 82 83 19 35 19 18
New Mexico 138 136 40 20 25 3 23 20 12 26 14 23 19 41 5 3
New York 1,916 1,581 403 128 268 49 359 307 318 415 317 294 144 305 107 83
North Carolina 591 473 129 40 126 36 142 148 72 84 64 71 47 81 11 13
North Dakota 37 30 13 2 3 0 11 5 5 10 1 1 4 12 0 0
Ohio 937 696 160 57 224 32 165 128 99 137 102 93 133 194 54 55
Oklahoma 215 167 31 12 33 7 41 25 29 29 22 20 47 63 12 11
Oregon 247 139 54 17 39 10 80 44 25 22 20 10 20 28 9 8
Pennsylvania 1,190 915 229 77 279 64 166 183 154 171 140 142 122 221 100 57
Puerto Rico 41 96 11 3 3 0 5 1 10 51 1 5 10 35 1 1
Rhode Island 141 96 45 20 22 2 16 15 25 26 26 29 1 3 6 1
South Carolina 247 169 47 14 48 6' 59 50 26 17 16 11 26 59 25 12
South Dakota 48 28 4 2 2 1 7 3 5 5 1 0 29 17 0 0
Tennessee 364 302 32 13 59 8 80 66 61 61 51 35 49 108 32 11
Texas 1,588 1,097 308 98 337 53 326 227 188 193 172 157 134 308 123 61
Utah 253 104 65 6 49 3 53 28 42 25 5 10 33 22 6 10
Vermont 26 27 2 0 5 1 12 5 0 9 1 2 6 10 0 0
Virginia 610 410 122 35 125 27 94 72 86 91 57 34 79 110 47 41
Washington 398 307 89 26 64 8 100 97 47 58 46 41 27 70 25 7
West Virginia 78 61 8 1 15 1 12 9 21 9 3 4 19 37 0 0
Wisconsin 490 379 106 45 79 15 121 97 75 74 62 75 27 55 20 18
Wyoming 43 21 13 8 9 1 12 5 4 3 0 0 5 3 0 1
NOTE: Field groupings may differ from those in reports published by federal sponsors of the Survey of Earned Doctorates.*Includes the 50 states, District of Columbia, and Puerto Rico. "Excludes 187 individuals for whom gender was not reported. Includes mathematics and computer sciences
SOURCE: NSF/NIH/USED/NEH/USDNNASA, Survey of Earned Doctorates
89115

APPENDIX TABLE A-7. Institutions granting research doctorates, by major field, 1999
State/Institution
TOTAL ALL INSTITUTIONS
..Sg 2 2. _I 5 in
Cbi, v 0 "0
.2 .. 1 2(...)
c. >, E F,72 L!
m Efi. v)
E 1 .c 1M 11 4 a,
N, 2 79 :03
00 :00
g i i1999 "g a f...,.5 t i t i ..T.
Total : viea tri E6 F g o"
.. < 6 ill a (2 .5 i2P 0 co i w 3 w .. 7.0
ALABAMAAlabama A&M UnivAuburn University- Main CampusUnited States Sports AcademyUniv of Alabama-BirminghamUniv of Alabama-HuntsvilleUniv of AlabamaUniv of South Alabama
ALASKAUniv of Alaska- Fairbanks
ARIZONAArizona State Univ-Main CampusNorthern Arizona UnivUniv of Arizona
ARKANSASU of Arkansas-FayettevilleU of Arkansas-Little RockU of Arkansas for Med Sci
CALIFORNIAAzusa Pacific UniversityBiola UniversityCalif Sch Prof Psych-AlamedaCalif Sch Prof Psych-FresnoCalif Sch Prof Psych-LACalif Sch Prof Psych-San DiegoCalifornia Inst of Integral StudiesCalifornia Inst of TechnologyClaremont Graduate UnivClaremont School of TheologyFielding Institute, TheFuller Theological Seminary in CaliforniaGraduate Theological UnionHebrew Union CollegeLa Sierra UnivLoma Linda UnivNaval Postgraduate SchoolPacific Grad School of PsychologyPepperdine UnivRand Grad Schl of Policy StudiesResearch Inst of Scripps ClinicSan Diego State UnivSanta Clara UniversitySaybrook InstituteStanford UniversityUnited States Internal! UnivUniv of California-BerkeleyUniv of California-DavisUniv of California-Irvine
'Univ of California-Los AngelesUniv of California-RiversideUniv of California-San DiegoUniv of California-San FranciscoUniv of California-Santa BarbaraUniv of California-Santa CruzUniv of LavemeUniv of San DiegoUniv of San FranciscoUniv of Southern CaliforniaUniv of the PacificWright Institute, The
COLORADOColorado School of MinesColorado State UnivUniv of Colorado-Boulder
41,140 1,431 2,134 824 1,935 5,337 5,600 1,410 1,116 3,667 3,369 1,011 1,024 3,433 6,557 2,292
494 19 15 4 25 63 82 27 28 40 17 12 10 6 115 31
7 3 0 0 0 0 0 0 4 0 0 0 0 0 0 0178 3 6 0 12 31 10 4 22 19 10 9 6 0 38 8
13 0 0 0 0 0 0 0 0 0 0 0 0 0 13 0
113 1 6 1 2 6 58 19 0 12 1 0 0 0 7 0
31 9 0 1 5 16 0 0 0 0 0 0 0 0 0 0
133 3 3 2 6 10 4 3 0 9 6 3 4 6 51 2319 0 0 0 0 0 10 1 2 0 0 0 0 0 6 0
27 3 1 6 0 1 7 0 2 0 2 2 0 1 1 1
27 3 1 6 0 1 7 0 2 0 2 2 0 1 1 1
729 32 35 38 28 95 86 18 20 34 64 18 13 57 151 40270 2 9 6 14 54 14 4 0 15 23 12 7 23 73 14
45 0 0 0 0 0 7 0 0 0 6 1 0 3 28 0
414 30 26 32 14 41 65 14 20 19 35 5 6 31 50 26
121 4 5 0 4 10 17 4 13 3 0 3 4 1 45 8
93 3 5 0 4 10 6 4 13 3 0 3 4 1 30 7
17 1 0 0 0 0 0 0 0 0 0 0 0 0 15 1
11 0 0 0 0 0 11 0 0 0 0 0 0 0 0 0
4,747 183 258 121 257 745 656 112 51 566 441 127 93 425 515 1974 0 0 0 0 0 0 0 0 0 0 0 0 4 0
15 0 0 0 0 0 0 0 7 1 0 0 1 5 1
60 0 0 0 0 0 0 0 59 0 0 0 0 0 1
51 0 0 0 0 0 0 0 51 0 0 0 0 0 0
6667
00
00
00
00
00
00
00
6367
00
00
00
00
00
3
034 0 0 0 0 0 0 0 13 1 0 0 15 5 0
156 19 30 1 14 53 22 0 0 0 5 0 0 0 0 0
104 0 0 6 0 1 0 0 9 21 3 10 22 24 86 0 0 0 0 0 0 0 0 0 0 0 2 0 4
75 0 0 0 0 1 0 0 36 17 0 0 1 2 18
6520
1
1
0000
0000
0000
0000
0000
0000
0000
23000
7000
3000
0
000
1914
00
001
1
13600
196
2850
7
00000
00000
030o0
03000
120000
40000
00000
30
2800
00006
00000
00000
00000
000
480
00021
19 0 9 0 o 10 0 0 0 0 0 0 0 0 0
302
00
1
000
1
270
4
000
60
1
000
00
00
100
00
18 0 0 0 0 2 2 0 14 0 0 0 0 0 0
551 29 26 2 34 168 65 3 3 12 51 15 11 38 37 3225 0 0 0 0 0 0 0 9 0 0 0 0 8 8
717 38 60 1 59 149 84 25 19 16 86 20 17 78 27 24
312 12 19 12 53 118 5 18 17 13 6 6 12 14 0
199 6 17 17 34 37 1 0 14 25 8 9 12 4 13
588 23 29 11 34 73 82 27 0 28 71 34 10 76 72 18
103 5 5 3 11 0 22 1 10 4 13 3 7 9 10 0
.28280
270
179
190
210
546
6748
013
00
140
294
11
020
190
1
01
0227 9 12 11 9 39 23 1 0 15 29 15 8 40 13 3
97 10 9 7 11 6 14 0 1 3 19 3 4 7 1 2
4319
00
00
00
00
00
00
07
00
00
00
00
00
00
4312
00
85 0 0 0 o 0 0 0 0 4 2 0 0 0 78 1
465 5 15 6 26 104 41 17 0 21 40 6 9 60 77 3820 0 0 0 0 0 0 2 0 0 0 0 0 0 18 0
30 0 0 0 0 0 0 0 0 30 0 0 0 0 0 0
754 26 41 33 50 135 107 17 28 68 63 2 9 44 97 34
49 5 1 5 4 21 0 0 0 0 10 0 0 0 0 3
188 3 17 10 12 32 42 4 28 14 10 0 0 0 14 2
302 18 22 17 26 80 34 2 0 23 28 2 3 24 12 11
BEST COPY AVAILABLE
90 116

APPENDIX TABLE A-7. Institutions granting research doctorates, by major field, 1999
1999Total
State/Institution
a 0E
0,fa 7m
2'w IL 0. 7
COLORADO (continued)Univ of Colorado-Colorado SpringsUniv of Colorado-DenverUniv of Colorado-Health Sci CenterUniv of DenverUniv of Northern Colorado
CONNECTICUTUniv of ConnecticutUniv of New HavenWesleyan UnivYale Univ
DELAWAREUniv of DelawareWilmington College
DISTRICT OF COLUMBIAAmerican UnivCatholic Univ of AmericanGallaudet UnivGeorge Washington UnivGeorgetown UnivHoward Univ
FLORIDABarry UnivCarlos Albizu Univ- Miami CampusFlorida A&M UnivFlorida Atlantic Univ-Boca RatonFlorida Inst of Technology-MelbourneFlorida International UnivFlorida State UnivNova Southeastern UnivUniv of Central FloridaUniv of FloridaUniv of MiamiUniv of SarasotaUniv of South Florida
GEORGIAClark Atlanta UnivEmory UniversityGeorgia Inst of Technology-Main CampusGeorgia Southern UnivGeorgia State UnivInstitute of Paper Sci & TechMedical College of GeorgiaMercer UniversityUniv of Georgia
HAWAIIUniv of Hawaii at Manoa
IDAHOIdaho State UnivUniv of Idaho
ILLINOISDePaul UnivFinch U of Hlth Sci-Chicago Med SchIllinois Inst of TechnologyIllinois State UnivInst for Clinical Social WorkLoyola Univ of ChicagoLutheran School of Theol-ChicagoNorthern Illinois UnivNorthwestern UnivRoosevelt UnivRush UnivSouthern III Univ-CarbondaleSouthern III Univ-Edwardsville
2 0 0 0 0 2 0 0 0 0 0 0 0 0 0 038 0 0 0 5 0 0 2 0 0 2 0 0 0 18 11
39 0 1 0 0 0 29 9 0 0 0 0 0 0 0 0
65 0 0 0 1 0 2 0 0 14 12 0 6 8 15 7
71 0 0 1 2 0 0 0 0 17 1 0 0 12 38 0
574 23 50 13 18 34 111 13 7 30 66 46 17 93 35 18227 5 21 4 8 24 37 8 6 20 18 6 6 15 35 14
1 0 0 0 0 0 0 0 0 0 0 0 0 0 0 1
13 0 4 0 4 0 4 0 0 0 0 0 0 1 0 0
333 18 25 9 6 10 70 5 1 10 48 40 11 77 0 3
166 4 10 5 10 41 13 1 12 19 3 7 8 29 1
144 4 10 5 10 41 13 1 12 19 3 7 8 7 1
22 0 0 0 0 0 0 0 0 0 0 0 0 22 0
524 3 31 2 21 23 54 15 55 86 20 4 82 76 5261 0 7 0 1 0 1 0 11 25 2 0 0 13 1
99 1 2 0 0 6 1 13 10 5 5 2 35 3 167 0 0 0 0 0 0 0 2 0 0 0 0 5 0
174 2 6 1 20 14 15 0 13 21 2 0 6 52 2297 0 8 0 0 0 21 0 2 20 11 0 34 0 1
86 0 8 1 0 3 16 2 17 15 0 2 7 3 12
1,944 39 68 23 76 188 136 37 3 227 85 14 26 86 734 167
19 0 0 0 0 0 0 0 1 0 0 0 0 9 9
55 0 0 0 0 0 0 0 55 0 0 0 0 0 05 0 0 0 0 0 3 1 0 0 0 0 0 0 1
38 0 0 0 1 9 1 0 5 2 0 0 0 13 7
27 1 2 3 3 16 2 0 0 0 0 0 0 0 046 0 0 0 2 3 3 0 6 2 0 0 0 21 9
277 14 15 10 6 8 7 3 22 27 10 7 52 64 32573 0 0 1 28 0 0 0 1 66 0 0 0 2 428 4789 11 0 0 6 30 0 0 0 4 0 0 0 0 38 0
447 9 34 2 19 89 80 24 35 28 36 3 7 13 39 29133 4 9 4 2 12 24 2 2 20 11 1 5 17 17 3
87 0 0 0 0 0 0 0 0 0 0 0 0 0 70 17
148 0 8 3 9 21 16 7 0 20 7 0 7 2 35 13
935 20 61 6 24 166 123 30 30 97 66 16 26 53 152 6532 0 1 0 0 0 1 0 0 1 12 0 2 1 10 4
132 2 13 0 4 0 36 7 0 10 19 13 3 21 3 1
228 10 13 4 14 162 6 0 0 11 0 1 0 2 0 5
8 0 0 0 0 0 0 0 0 0 0 0 0 0 8 0150 4 12 0 0 0 11 9 0 27 8 1 3 4 46 25
6 0 0 0 0 3 0 0 3 0 0 0 0 0 0 013 0 0 0 0 0 10 3 0 0 0 0 0 0 0 0
1 0 0 0 0 0 0 1 0 0 0 0 0 0 0 0365 4 22 2 6 1 59 10 27 48 27 1 18 25 85 30
160 5 3 14 5 3 26 7 10 6 34 6 0 25 16 0160 5 3 14 5 3 26 7 10 6 34 6 0 25 16 0
80 0 5 3 3 8 11 1 10 1 3 1 0 1 33 021 0 1 0 3 1 4 0 0 1 1 0 0 1 9 059 0 4 3 0 7 7 1 10 0 2 1 0 0 24 0
2,201 76 94 20 121 273 229 65 51 194 226 87 59 214 376 11624 0 0 0 2 0 0 0 0 14 0 0 0 8 0 023 1 0 0 0 0 14 0 0 8 0 0 0 0 0 069 3 1 0 17 31 2 0 0 13 0 0 0 0 0 2
45 0 0 0 1 0 3 0 0 5 0 2 2 3 29 0
5 0 0 0 0 0 0 0 0 1 0 0 0 0 0 4
196 0 1 0 0 0 16 5 0 26 6 3 4 9 119 7
9 0 0 0 0 0 0 0 0 0 0 0 0 2 0 7
116 0 4 2 4 0 5 0 0 16 13 7 5 1 59 0
309 7 22 3 12 79 34 2 0 26 40 13 7 41 10 13
19 0 0 0 0 0 0 0 0 0 0 0 0 0 19 013 1 0 0 0 0 3 9 0 0 0 0 0 0 0 0
121 1 6 0 1 3 11 4 0 16 7 3 6 11 33 19
5 0 0 0 0 0 0 0 0 0 0 0 0 0 5 0
BEST COPY AVAILABLE
91 117

APPENDIX TABLE A-7. Institutions granting research doctorates, by major field, 1999
1999Total
State/Institution
E
5 E
o V>,2 8 o
co 3tt 5
17,
0,a a0. O0 I LLI
ILLINOIS (continued)Univ of ChicagoUniv of Illinois-ChicagoUniv of Illinois-Urbana
INDIANABall State UnivIndiana State UnivIndiana Univ-BloomingtonIndiana Univ-Purdue Univ-IndianapolisPurdue Univ-Main CampusUniv of Notre Dame
IOWADrake UnivIowa State UnivMaharishi Univ of ManagementUniv of IowaUniv of Northern Iowa
KANSASKansas State UnivUniv of Kansas-Main CampusWichita State Univ
KENTUCKYSouthern Bapt Theol SeminarySpalding UnivUniv of KentuckyUniv of Louisville
LOUISIANAGrambling State UnivLouisiana St U & A&M & Herbert Laws CtrLouisiana St U Med CtrLouisiana St U -ShreveportLouisiana Tech UnivNew Orleans Bapt Theol SeminarySouthern Univ and A&M CollegeTulane Univ of LouisianaUniv of Louisiana- LafayetteUniv of Lousiana- MonroeUniv of New Orleans
MAINEUniv of Maine
MARYLANDJohns Hopkins UnivLoyola CollegeMorgan State UnivPeabody Ins( of Johns Hopkins UnivUniformed Svcs. Univ of Hlth SciUniv of Maryland-BaltimoreUniv of Maryland-Baltimore CountyUniv of Maryland-College ParkUniv of Maryland-Eastern Shore
MASSACHUSETTSAmerican Intematl CollegeBoston CollegeBoston UnivBrandeis UnivClark UnivHarvard UnivMass Coll Pharm & Allied Health SciMass Inst of TechnologyNew England Consery of MusicNortheastern UnivSimmons CollegeSmith College
384 21 16 4 25 1 38 0 0 15 95 35 21 77 11 25220 6 14 2 16 29 41 37 0 9 19 7 2 8 18 12643 36 30 9 43 130 62 8 51 45 46 17 12 54 73 27
1,057 37 71 20 46 155 133 36 36 69 81 25 35 135 113 6538 0 0 0 0 0 0 1 0 12 0 0 2 7 15 1
17 0 0 1 0 0 2 0 0 4 0 0 0 0 10 0391 12 16 12 16 0 62 6 0 9 40 15 22 87 59 35
8 0 0 0 0 0 0 8 0 0 0 0 0 0 0 0468 11 47 6 24 136 53 21 36 31 19 2 4 24 29 25135 14 8 1 6 19 16 0 0 13 22 8 7 17 0 4
583 21 46 4 30 80 81 30 34 30 38 5 7 50 105 225 0 0 0 0 0 0 0 0 0 0 0 0 0 5 0
257 9 34 4 10 47 39 1 34 10 30 1 1 3 30 4
4 0 0 0 0 0 1 1 0 2 0 0 0 0 0 0310 12 12 0 20 31 41 28 0 18 8 4 6 47 65 18
7 0 0 0 0 2 0 0 0 0 0 0 0 0 5 0
433 15 28 6 10 40 44 9 30 58 20 11 5 43 96 18128 6 7 0 6 9 12 0 29 12 8 2 0 1 35 1
278 9 20 6 3 19 31 8 1 40 12 9 5 42 56 17
27 0 1 0 1 12 1 1 0 6 0 0 0 0 5 0
317 2 9 4 15 25 45 11 11 31 23 7 8 30 63 3319 0 0 0 0 0 0 0 0 0 0 0 0 9 0 1017 0 0 0 0 0 0 0 0 0 0 0 0 0 17 0
203 2 5 4 13 16 29 10 11 20 19 7 8 13 23 2378 0 4 0 2 9 16 1 0 11 4 0 0 8 23 0
557 11 17 14 37 62 75 41 23 33 35 14 23 49 75 4811 0 0 0 0 0 0 0 0 0 0 0 0 0 11 0
253 9 10 13 15 26 17 10 23 20 18 7 8 22 39 1613 0 0 0 0 0 7 6 0 0 0 0 0 0 0 013 0 0 0 0 0 13 0 0 0 0 0 0 0 0 026 0 0 0 1 13 0 0 0 0 0 0 0 0 2 1021 0 0 0 0 0 0 0 0 0 0 0 0 7 1 13
2 0 0 0 0 0 0 0 0 0 0 0 0 0 1 1
140 2 3 0 8 19 30 24 0 8 11 7 8 12 0 8
37 0 0 0 13 3 5 0 0 0 1 0 7 8 0 06 0 0 0 0 0 3 1 0 0 0 0 0 0 2 0
35 0 4 1 0 1 0 0 0 5 5 0 0 0 19 0
37 3 1 4 0 6 4 1 5 3 0 2 0 1 6 1
37 3 1 4 0 6 4 1 5 3 0 2 0 1 6 1
1,006 44 23 21 72 137 184 104 17 62 111 23 17 97 68 26341 12 6 3 11 47 94 81 0 6 41 13 6 21 0 0
3 0 0 0 0 0 0 0 0 3 0 0 0 0 0 06 0 0 0 0 0 0 0 0 0 0 0 0 0 6 0
21 0 0 0 0 0 0 0 0 0 0 0 0 21 0 012 0 0 0 0 0 8 0 0 4 0 0 0 0 0 061 0 3 0 0 0 36 16 0 0 1 0 0 0 1 457 1 3 1 13 9 8 0 0 13 5 0 0 2 0 2
504 31 11 16 48 81 38 7 17 36 64 10 11 53 61 201 0 0 1 0 0 0 0 0 0 0 0 0 0 0 0
2,132 131 146 45 96 312 318 87 15 104 281 74 45 218 158 1024 0 0 0 0 0 0 0 0 0 0 0 0 0 4 0
98 1 12 0 0 0 7 11 0 9 13 8 2 12 16 7
300 16 9 1 10 17 48 17 1 27 29 4 10 63 34 14103 5 13 0 10 0 16 2 0 8 28 8 4 8 0 1
29 2 3 0 0 0 4 0 0 5 12 0 0 2 0 1
564 19 28 7 23 14 112 43 1 9 102 46 14 86 40 202 0 2 0 0 0 0 0 0 0 0 0 0 0 0 0
487 54 34 32 36 194 39 2 0 6 43 5 0 14 1 273 0 0 0 0 0 0 0 0 0 0 0 0 3 0 0
80 9 13 0 0 16 15 1 0 9 13 0 0 1 0 34 0 0 0 0 0 0 0 0 0 0 0 0 0 0 4
13 0 0 0 0 0 0 0 0 0 0 0 0 0 0 13
BEST COPY AVAILABLE

APPENDIX TABLE A-7. Institutions granting research doctorates, by major field, 1999
State/Institution
1.3a
2 >. g2 E, Eo
.'=" T1999 g, Lc
.Total .o .cW
Ea '2' fin
JIrr -o
>, IE f,
cn :( .ct) .0,
-o crc en
T ....r., E, g' 0 .ri g
la U 2 C RIO. 0 CO X 1.11 -I
MASSACHUSETTS (continued)Springfield CollegeTufts UnivUniv of Massachusetts-AmherstUniv of Massachusetts-BostonUniv of Massachusetts-LowellUniv of Massachusetts Med Sch-WorcesterWorcester Polytechnic Inst
MICHIGANAndrews UnivCentral Michigan UnivEastern Michigan UnivMichigan State UnivMichigan Tech UnivOakland UnivUniv of Detroit MercyUniv of Michigan-Ann ArborWayne State UnivWestern Michigan Univ
MINNESOTALuther SeminaryMayo Graduate SchoolUniv of Minnesota-Twin CitiesUniv of St ThomasWalden University
MISSISSIPPIDelta State UnivJackson State UnivMississippi State UnivReformed Theological SeminaryUniv of Mississippi- Main CampusUniv of Mississippi-Med CtrUniv of Southern Mississippi
MISSOURIConcordia SeminarySt. Louis Univ- Main CampusUniv of Missouri-ColumbiaUniv of Missouri-Kansas CityUniv of Missouri-RollaUniv of Missouri-St LouisWashington Univ
MONTANAMontana State Univ-BozemanUniv of Montana-Missoula
NEBRASKACreighton UnivUniv of Nebraska-LincolnUniv of Nebraska-Med CenterUniv of Nebraska-Omaha
NEVADAUniv of Nevada-Las VegasUniv of Nevada-Reno
NEW HAMPSHIREDartmouth CollegeUniv of New Hampshire-Main Campus
NEW JERSEYDrew UnivFairleigh Dickinson Univ- All CampusesNew Jersey Inst of TechnologyPrinceton Theol SeminaryPrinceton UniversityRutgers Univ-New Brunswick
9 0 0 0 0 0 0 2 0 0 0 0 0 0 7 078 4 4 0 0 9 29 0 0 7 13 0 6 6 0 0
269 16 17 3 13 39 35 7 13 21 21 3 9 23 37 1218 0 0 2 0 0 1 0 0 3 7 0 0 0 5 046 4 9 0 4 12 1 2 0 0 0 0 0 0 14 0
8 0 0 0 0 0 8 0 0 0 0 0 0 0 0 017 1 2 0 0 11 3 0 0 0 0 0 0 0 0 0
1,428 48 77 20 72 253 160 59 47 125 142 30 43 122 164 6627 0 0 0 0 0 0 0 0 6 0 0 0 6 11 4
5 0 0 0 1 0 0 0 0 3 0 1 0 0 0 04 0 0 0 0 0 0 0 0 0 0 0 0 0 4 0
388 14 23 1 22 45 48 4 39 36 45 5 11 18 43 3436 1 0 1 0 22 4 0 4 0 0 0 0 4 0 025 1 1 1 0 14 2 1 0 0 0 0 0 0 5 010 0 0 0 0 2 0 0 0 8 0 0 0 0 0 0
655 25 35 16 39 145 65 42 4 40 71 20 20 78 35 20226 5 18 0 9 25 41 12 0 20 15 1 9 15 50 652 2 0 1 1 0 0 0 0 12 11 3 3 1 16 2
774 24 32 6 23 83 98 62 41 55 44 23 16 72 133 621 0 0 0 0 0 0 0 0 0 0 0 0 0 0 1
20 0 0 0 0 4 16 0 0 0 0 0 0 0 0 0656 24 32 6 23 79 82 52 41 37 42 23 16 68 97 3422 0 0 0 0 0 0 0 0 0 0 0 0 0 22 075 0 0 0 0 0 0 10 0 18 2 0 0 4 14 27
372 0 27 6 5 17 35 10 33 29 7 10 11 9 136 377 0 0 0 0 0 0 0 0 0 0 0 0 0 7 0
25 0 0 4 0 0 0 1 0 0 0 0 0 0 15 5112 0 10 0 3 9 10 2 33 2 4 4 0 0 29 6
3 0 0 0 0 0 0 0 0 0 0 0 0 1 0 2
106 0 6 1 1 6 10 5 0 11 3 4 8 6 26 1913 0 0 0 0 0 13 0 0 0 0 0 0 0 0 0
106 0 11 1 1 2 2 2 0 16 0 2 3 2 59 5
666 9 33 5 22 66 122 21 20 54 52 8 20 57 130 472 0 0 0 0 0 0 0 0 0 0 0 0 0 0 2
132 0 0 1 0 0 25 6 0 13 7 0 4 12 49 15230 3 8 0 6 17 34 8 20 22 20 4 8 7 58 1565 2 3 0 2 2 6 3 0 3 2 3 2 18 17 244 1 9 2 2 30 0 0 0 0 0 0 0 0 0 029 0 3 0 0 0 5 2 0 7 7 0 0 0 5 0
164 3 10 2 12 17 52 2 0 9 16 1 6 20 1 13
83 5 11 2 2 6 14 0 8 10 0 0 0 0 25 043 5 6 1 1 6 7 0 4 0 0 0 0 0 13 040 0 5 1 1 0 7 0 4 10 0 0 0 0 12 0
291 9 15 2 6 14 46 8 35 26 21 7 10 14 58 208 0 0 0 0 0 8 0 0 0 0 0 0 0 0 0
251 9 13 2 6 14 19 1 35 26 18 7 10 14 57 2028 0 2 0 0 0 19 7 0 0 0 0 0 0 0 04 0 0 0 0 0 0 0 0 0 3 0 0 0 1 0
85 7 3 5 0 8 10 0 1 18 5 2 4 0 21 1
23 0 0 0 0 1 1 0 1 0 4 0 0 0 15 1
62 7 3 5 0 7 9 0 0 18 1 2 4 0 6 0
97 6 8 3 8 11 30 1 1 6 5 4 5 1 8 049 2 6 1 7 8 22 1 0 2 0 0 0 0 0 048 4 2 2 1 3 8 0 1 4 5 4 5 1 8 0
822 51 54 26 63 112 112 9 18 47 74 39 30 96 54 3726 0 0 0 0 0 0 0 0 0 0 1 12 8 1 414 0 0 0 0 0 0 0 0 14 0 0 0 0 0 039 1 2 3 17 15 0 0 0 0 0 0 0 0 1 018 0 0 0 0 0 0 0 0 0 0 0 0 10 0 8
254 33 21 8 21 36 22 0 0 5 38 16 6 44 0 4
347 12 14 15 24 48 57 8 17 18 30 22 12 34 26 10
BEST COPY AVAILABLE
93 119

APPENDIX TABLE A-7. Institutions granting research doctorates, by major field, 1999
1999Total
State/Institution
NEW JERSEY (continued)Rutgers Univ-NewarkSeton Hall UnivStevens Inst of TechnologyUniv of Med & Dent of NJ
NEW MEXICONew Mexico Ins( of Mining & TechNew Mexico State Univ-Main CampusUniv of New Mexico-Main Campus
NEW YORKAdelphi UnivAlbany Medical CollegeAlfred UnivCity U of NY-Grad Sch/U CtrClarkson UnivColumbia Univ in the City of New YorkCornell Univ Medical CollegeCornell Univ-Endowed CollegesFordham UniversityHebrew Union College-Jewish Inst ofReligionHofstra UnivJewish Theol Sem of AmericaLong Island Univ-Brooklyn CampusNew School for Social ResearchNew York Medical CollegeNew York UnivPace Univ-New YorkPolytechnic UnivRensselaer Polytechnic InstRockefeller UnivSt Johns Univ-New YorkState Univ of NY-AlbanySlate Univ of NY-BinghamtonState Univ of NY-BuffaloState Univ of NY-Stony BrookSUNY College of OptometrySUNY Coll-Environ Sci & ForestrySUNY Upstate Med UnivSUNY-Hlth Sci Ctr-BrooklynSyracuse UnivTeachers College at Columbia UnivThe Juilliard SchoolUnion Theol SeminaryUniv of RochesterYeshiva Univ
NORTH CAROLINADuke UnivEast Carolina UnivNorth Carolina A & T St UnivNorth Carolina St U-RaleighU of N Carolina-Chapel HillU of N Carolina-CharlotteU of N Carolina-GreensboroWake Forest University
NORTH DAKOTANorth Dakota State Univ-Main CampusUniv of North Dakota-Main Campus
OHIOAir Force Inst of TechBowling Green State Univ-Main CampusCase Western Reserve UnivCleveland State UnivHebrew Union Coll-Jewish Inst of ReligionKent State Univ-Main CampusMedical College of OhioMiami Univ-OxfordOhio State Univ-Main CampusOhio Univ-Main Campus
35 1 6 0 0 0 8 1 1 1 6 0 0 0 0 11
46 0 11 0 0 0 0 0 0 9 0 0 0 0 26 018 4 0 0 1 13 0 0 0 0 0 0 0 0 0 025 0 0 0 0 0 25 0 0 0 0 0 0 0 0 0
276 22 13 3 22 28 28 4 12 19 19 8 13 17 60 87 1 1 3 1 1 0 0 0 0 0 0 0 0 0 0
78 11 4 0 6 12 5 0 12 7 0 0 0 2 15 4191 10 8 0 15 15 23 4 0 12 19 8 13 15 45 4
3,511 150 154 46 184 317 527 80 62 411 327 88 128 397 450 19028 0 0 0 1 0 0 4 0 21 0 0 0 0 0 220 0 0 0 0 0 20 0 0 0 0 0 0 0 0 09 0 0 0 0 9 0 0 0 0 0 0 0 0 0 0
275 10 18 5 13 23 37 5 0 45 32 6 16 50 2 1319 2 5 0 0 11 1 0 0 0 0 0 0 0 0 0
416 13 22 10 18 38 51 13 0 42 54 25 19 70 19 2233 0 0 0 0 0 33 0 0 0 0 0 0 0 0 0
485 35 29 4 33 57 89 12 58 12 55 10 14 40 19 1898 0 0 0 0 0 2 0 0 30 7 5 6 7 35 6
4 0 0 0 0 0 0 0 0 1 0 0 0 0 0 3
47 0 0 0 0 0 0 0 0 34 0 0 0 0 13 02 0 0 0 0 0 0 0 0 0 0 0 0 2 0 0
15 0 0 0 0 0 0 0 0 15 0 0 0 0 0 057 0 0 0 0 0 0 0 0 27 21 0 0 7 0 2
12 0 0 0 0 0 11 1 0 0 0 0 0 0 0 0410 9 5 0 34 0 55 21 0 43 24 15 28 100 38 38
1 0 0 0 0 0 0 0 0 0 0 0 0 0 0 1
28 2 4 0 1 21 0 0 0 0 0 0 0 0 0 0115 11 6 4 9 65 4 0 0 0 5 0 0 4 0 7
18 1 0 0 0 0 17 0 0 0 0 0 0 0 0 067 0 2 0 0 0 7 3 0 18 0 5 2 0 30 0
151 10 7 5 17 1 7 1 0 27 26 0 3 7' 24 1676 0 5 1 4 6 1 0 0 11 16 5 10 10 3 4
269 10 16 1 9 34 48 13 0 23 22 1 13 17 40 22219 22 16 14 17 19 39 0 0 24 21 10 7 28 2 0
1 0 0 0 0 0 0 0 0 0 0 0 0 0 0 1
12 0 1 1 0 1 4 0 4 0 0 0 0 0 0 1
5 0 0 0 0 0 4 1 0 0 0 0 0 0 0 014 0 0 0 0 0 14 0 0 0 0 0 0 0 0 , 0
154 3 6 1 17 13 6 0 0 17 25 3 3 11 33 16183 0 0 0 0 0 0 0 0 0 0 0 0 0 182 1
14 0 0 0 0 0 0 0 0 0 0 0 0 13 1 08 0 0 0 0 0 0 0 0 0 0 0 0 0 0 8
186 22 12 0 11 19 42 6 0 10 17 3 7 31 4 260 0 0 0 0 0 35 0 0 11 2 0 0 0 5 7
1,105 27 71 25 59 167 212 58 41 66 90 25 38 72 130 24249 11 14 4 10 34 52 2 2 22 29 12 20 33 0 4
21 0 0 0 0 0 10 0 0 0 0 0 0 0 11 05 0 0 0 0 5 0 0 0 0 0 0 0 0 0 0
354 3 18 13 24 112 60 0 39 15 13 0 0 0 56 1
374 11 31 8 22 11 70 51 0 17 48 13 15 34 24 1910 0 0 0 3 5 0 0 0 0 0 0 0 0 2 061 0 0 0 0 0 0 4 0 12 0 0 3 5 37 031 2 8 0 0 0 20 1 0 0 0 0 0 0 0 0
68 0 11 0 4 3 9 1 6 15 0 1 0 1 17 026 0 9 0 4 3 3 1 6 0 0 0 0 0 0 042 0 2 0 0 0 6 0 0 15 0 1 0 1 17 0
1,638 45 100 23 49 257 204 59 30 160 77 43 38 117 327 10922 3 0 0 2 17 0 0 0 0 0 0 0 0 0 093 0 5 2 0 0 4 0 0 22 2 2 7 24 17 8
164 4 18 0 2 43 41 15 1 9 4 4 2 3 0 1838 0 3 0 0 2 5 0 0 2 2 0 0 0 15 9
4 0 0 0 0 0 0 0 0 0 0 0 0 4 0 0141 5 1 3 6 0 12 3 0 38 7 3 4 3 43 13
14 0 0 0 0 0 13 1 0 0 0 0 0 0 0 049 0 5 1 0 0 9 0 0 10 3 6 1 5 9 0
549 7 21 11 26 74 75 24 28 31 42 16 14 44 101 35131 11 6 0 7 9 6 1 1 10 0 6 3 4 48 19
94 120

APPENDIX TABLE A-7. Institutions granting research doctorates, by major field, 1999
State/Institution
1999Total
g7) 2>.«o.<
OHIO (continued)Univ of Akron-Main Campus 108 10Univ of Cincinnati-Main Campus 227 5
Univ of Dayton 20 0Univ of Toledo 68 0Wright State Univ-Main Campus 8 0Youngstown State Univ 2 0
OKLAHOMA 383 9
Oklahoma State Univ-Main Campus 198 4
Univ of Oklahoma-Norman Campus 171 5Univ of Tulsa 14 0.
OREGON 386 11
Oregon Grad Inst of Sci & Tech 15 0
Oregon Health Sciences Univ 25 0Oregon State Univ 162 5
Portland State Univ 32 0
Univ of Oregon 152 6
PENNSYLVANIA 2,115 66Bryn Mawr College 22 2
Carnegie Mellon Univ 162 6
Drexel Univ 56 2
Duquesne Univ 29 0
Indiana Univ of Pennsylvania 56 0
Lehigh Univ 95 4
MCP Hahnemann University 39 0
Pennsylvania State Univ-Main Campus 580 23Phila Coll of Pharm & Sci 7 0
Temple Univ 251 3
Thomas Jefferson Univ 27 0
Univ of Pennsylvania 384 20Univ of Pittsburgh-Main Campus 360 6Villanova Univ 7 0Westminster Theot Seminary 11 0
Widener Univ-Main Campus 29 0
PUERTO RICO 141 1
Carlos Albizu University-San Juan Campus 40 0
Inter Amer U PR-Metro 27 0Univ of Puerto Rico-Mayaguez 8 0Univ of Puerto Rico-Med Science Campus 4 0Univ of Puerto Rico-Rio Piedras 62 1
RHODE ISLAND 237 13Brown Univ 153 13Salve Regina Univ 5 0Univ of Rhode Island 79 0
SOUTH CAROLINA 416 5Clemson University 112 3
Medical Univ of South Carolina 30 0South Carolina State Univ 5 0Univ of South Carolina-Columbia 269 2
SOUTH DAKOTA 77 0S Dakota Sch of Mines & Tech 3 0South Dakota State Univ 16 0Univ of South Dakota 58 0
TENNESSEE 667 6East Tennessee State Univ 30 0Meharry Medical College 13 0Mid-America Baptist Sem 8 0Middle Tennessee State Univ 12 0Tennessee State Univ 45 0Tennessee Technological Univ 8 0Univ of Memphis 96 0Univ of Tennessee-Knoxville 256 4
Univ of Tennessee-Memphis 17 0
cri
E E
(s' 70,m m.c o 13
LuZ
a,C
C
_I
CI 0>. 3 E F,
0fl
8
E t: T. FTu0 -Z
c,'ci. Om i w -J
41..
0 '0
o O
'0UJ O.
22 0 1 33 2 0 0 15 4 1 0 0 20 0
15 6 2 56 26 14 0 15 13 5 1 29 35 5
0 0 0 9 1 0 0 0 0 0 0 0 10 04 0 2 13 4 1 0 8 0 0 6 1 27 2
0 0 1 1 6 0 0 0 0 0 0 0 0 00 0 0 0 0 0 0 0 0 0 0 0 2 0
12 13 9 40 42 13 11 28 30 7 6 29 111 235 4 6 19 13 2 11 14 15 3 2 6 84 10
7 9 3 17 28 11 0 7 15 4 2 23 27 13
0 0 0 4 1 0 0 7 0 0 2 0 0 0
15 21 24 49 71 15 38 24 23 2 12 16 48 17
0 2 1 9 3 0 0 0 0 0 0 0 0 00 0 0 0 21 3 0 1 0 0 0 0 0 07 8 12 35 24 9 38 4 3 1 0 0 16 01 3 0 4 1 1 0 2 5 0 0 0 7 8
7 8 11 1 22 2 0 17 15 1 12 16 25 9
107 22 111 348 249 81 20 178 148 38 61 185 343 158
0 0 0 0 1 0 0 3 1 0 0 9 0 65 0 34 76 8 0 0 6 12 1 0 3 0 11
3 1 4 25 6 0 0 9 0 0 0 0 0 6
0 0 0 0 0 0 0 16 0 0 6 5 0 2
0 0 0 0 0 0 0 7 2 0 21 9 17 0
5 0 6 35 5 0 0 8 3 2 4 0 19 4
0 0 0 0 16 5 0 18 0 0 0 0 0 036 13 10 142 61 11 20 35 32 6 7 33 113 38
1 0 0 0 0 6 0 0 0 0 0 0 0 07 0 9 2 19 9 0 42 18 10 12 36 61 23
0 0 0 0 27 0 0 0 0 0 0 0 0 0
18 4 26 38 64 14 0 13 49 13 5 46 39 3528 4 22 30 42 31 0 21 31 6 6 36 70 27
4 0 0 0 0 0 0 0 0 0 0 3 0 0
0 0 0 0 0 0 0 0 0 0 0 5 0 6
0 0 0 0 0 5 0 0 0 0 0 0 24 0
9 4 0 3 9 0 1 61 0 2 0 4 45 2
0 0 0 0 0 0 0 40 0 0 .0 0 0 0
0 0 0 0 0 0 0 0 0 0 0 0 27 0
0 4 0 3 0 0 1 0 0 0 0 0 0 0
0 0 0 0 4 0 0 0 0 0 0 0 0 0
9 0 0 0 5 0 0 21 0 2 0 4 18 2
11 15 26 24 24 5 2 25 26 8 11 36 4 7
6 6 20 13 17 0 0 7 24 6 6 34 1 0
0 0 0 0 0 0 0 0 0 2 0 2 0 1
5 9 6 11 7 5 2 18 2 0 5 0 3 6
29 10 17 54 71 29 9 16 27 6 11 10 85 3711 1 7 37 17 0 9 1 7 0 0 0 10 9
0 0 0 0 29 1 0 0 0 0 0 0 0 0
0 0 0 0 0 0 0 0 0 0 0 0 5 0
18 9 10 17 25 28 0 15 20 6 11 10 70 28
6 0 0 3 6 0 5 7 3 0 0 1 46 0
0 0 0 3 0 0 0 0 0 0 0 0 0 0
6 0 0 0 2 0 5 0 3 0 0 0 0 0
0 0 0 0 4 0 0 7 0 0 0 1 46 0
23 1 16 67 109 23 14 82 40 18 20 48 157 43
0 0 0 0 4 0 0 0 0 0 0 0 26 0
0 0 0 0 13 0 0 0 0 0 0 0 0 0
0 0 0 0 0 0 0 0 0 0 0 4 0 4
2 0 0 0 1 0 0 0 2 1 1 0 5 0
0 0 0 0 0 0 0 9 0 0 0 0 34 2
0 0 0 8 0 0 0 0 0 0 0 0 0 0
2 0 7 7 1 2 0 26 2 4 0 5 28 12
14 1 8 32 34 14 14 29 25 7 13 11 32 18
0 0 0 0 13 4 0 0 0 0 0 0 0 0
BEST COPY AVAILABLE
95 121

APPENDIX TABLE A-7. Institutions granting research doctorates, by major field, 1999
State/Institution
.. . iF,
a it t2 . g 1
.0 .. E
fo.rr.
1999 ra g :4- T, 1: E1.3Ts 2
.1 i .= e 5 ToTotal .c 0o'c W 2 2 '41
... a W
o t)131
w
TENNESSEE (continued)Vanderbilt Univ
TEXASBaylor College of MedicineBaylor UnivDallas Theological SeminaryLamar Univ-BeaumontRice UnivSt. Mary's UnivSam Houston State UnivSouthern Methodist UnivSouthwestern Baptist Theol SemStephen F Austin St UnivTexas A&M UnivTexas A&M Univ-CommerceTexas A&M Univ-KingsvilleTexas Christian UnivTexas Southern UnivTexas Tech UnivTexas Woman's UnivUniv of DallasUniv of Houston-University ParkUniv of North TexasUniv of North Texas-Hlth Sci Ctr at Ft WorthUniv of St. ThomasUniv of Texas-ArlingtonUniv of Texas-AustinUniv of Texas-DallasUniv of Texas-El PasoU Tex-Hlth Sci CtrU Tex-Hlth Sci Ctr-San AntonioU Tex-Med Branch-GalvestonU Tex-Southwestern Med Ctr-Dallas
UTAHBrigham Young UnivUniv of UtahUtah State Univ
VERMONTMiddlebury CollegeUniv of Vermont and State Agr Coll
VIRGINIACollege of William & MaryGeorge Mason UnivHampton UniversityOld Dominion UnivRegent UnivUnion Theol Seminary in VirginiaUniv of Virginia- Main CampusVirginia Commonwealth UnivVirginia Polytech Inst & St Univ
WASHINGTONGonzaga UnivSeattle Pacific UnivSeattle UnivUniv of WashingtonWashington State Univ
WEST VIRGINIAMarshall UniversityWest Virginia Univ
WISCONSINMarquette UnivMedical College of WisconsinUniv of Wisconsin-MadisonUniv of Wisconsin-Milwaukee
WYOMINGUniv of Wyoming
182 2 5 0 1 20 43 3 0
2,697 96 126 71 113 398 402 86 6746 0 0 0 0 0 46 0 043 2 3 1 3 0 3 0 0
7 0 0 0 0 0 0 0 03 0 0 0 0 2 0 0 0
122 11 13 7 8 29 14 1 04 0 0 0 0 0 0 0 07 0 0 0 0 0 0 0 0
40 1 0 2 6 20 3 0 052 0 0 0 0 0 0 0 0
1 0 0 0 0 0 0 0 1
501 12 39 26 25 104 66 7 5144 0 0 0 0 0 0. 0 024 0 0 0 0 0 0 0 1
30 3 5 0 0 0 0 0 025 0 0 2 0 0 3 0 0
189 1 9 1 5 20 16 0 1466 0 0 0 0 0 4 20 05 0 0 0 0 0 0 0 0
200 5 14 3 13 27 13 4 0174 7 0 2 12 1 11 0 0
4 0 0 0 0 0 4 0 01 0 0 0 0 0 0 0 0
80 3 5 1 7 20 5 0 0752 44 33 14 30 162 56 20 0
53 4 5 6 4 4 6 0 015 0 0 6 0 9 0 0 083 0 0 0 0 0 59 22 032 3 0 0 0 0 20 9 037 0 0 0 0 0 30 3 057 0 0 0 0 0 43 0 0
365 11 40 6 16 54 55 10 1793 2 6 0 3 15 8 1 0
194 6 31 5 13 32 32 9 078 3 3 1 0 7 15 0 17
53 0 1 0 1 6 16 0 1
3 0 0 0 0 0 0 0 050 0 1 0 1 6 16 0 1
1,026 42 37 29 50 153 108 31 2962 11 1 9 6 0 8 0 0
114 4 1 2 16 10 11 10 05 5 0 0 0 0 0 0 0
62 2 0 4 7 15 6 2 09 0 0 0 0 0 0 0 08 0 0 0 0 0 0 0 0
333 15 17 9 12 49 38 6 1
99 0 5 0 0 2 27 11 0334 5 13 5 9 77 18 2 28
706 32 27 26 30 72 110 48 3912 0 0 0 0 0 0 0 010 0 0 0 0 0 0 0 018 0 0 0 0 0 0 0 0
521 27 23 26 27 56 82 41 20145 5 4 0 3 16 28 7 19
140 0 2 2 5 17 18 1 23 0 0 0 0 0 3 0 0
137 0 2 2 5 17 15 1 2
873 34 54 20 44 95 151 29 3859 0 5 0 1 7 4 0 019 0 0 0 0 0 19 0 0
685 31 40 19 34 83 119 21 38110 3 9 1 9 5 9 8 0
64 1 8 6 6 10 10 1 664 1 8 6 6 10 10 1 6
18
20900003302
40
197090
3215
02430
006
3740000
14
50251213
909
1000
230500
272421
32000
2012
240
24
5260
3214
66
11 6 6 28 32 7
172 41 70 220 442 1840 0 0 0 0 01 0 5 8 17 00 0 0 3 0 40 0 0 0 1 0
13 4 2 17 0 00 0 0 0 1 07 0 0 0 0 03 0 0 3 0 00 0 0 23 2 230 0 0 0 0 0
35 2 8 5 79 230 0 0 0 37 00 0 0 0 23 00 5 4 4 0 00 0 0 0 20 07 6 13 16 23 263 0 1 6 12 52 0 1 2 0 0
10 3 10 7 57 103 4 14 18 54 180 0 0 0 0 00 0 0 1 0 05 1 2 10 0 15
76 15 9 89 116 514 1 1 5 0 90 0 0 0 0 02 0 0 0 0 00 0 0 0 0 01 0 0 3 0 00 0 0 0 0 0
19 3 4 9 55 162 0 0 2 28 1
13 3 4 7 13 144 0 0 0 14 1
0 0 0 3 16 00 0 0 3 0 00 0 0 0 16 0
79 35 12 44 189 880 10 0 2 15 0
15 0 1 0 16 50 0 0 0 0 06 0 0 0 0 150 0 0 2 0 70 1 0 4 0 3
32 21 11 34 55 611 0 0 2 4 1315 3 0 0 99 39
73 18 21 49 97 320 0 0 0 10 20 0 0 0 10 00 0 0 0 18 0
54 13 19 46 45 2219 5 2 3 14 8
6 4 3 0 56 00 0 0 0 0 06 4 3 0 56 0
98 23 29 85 83 380 3 6 17 7 30 0 0 0 0 0
74 20 14 64 66 3024 0 9 4 10 5
1 0 0 0 8 1
1 0 0 0 8 1
NOTE: Field groupings may differ from those in reports published by federal sponsors of the Survey of Earned Doctorates.
SOURCE: NSF/NIH/USED/NEH/USDA/NASA, Survey of Earned Doctorates
96 122BEST COPY AVAILABLE

APPENDIX TABLE A-7. Top 50 doctorate-granting institutions, 1999
Rank Institution Number Rank Institution Number
1. The University of Texas at Austin 752 26. University of Chicago 384
2. University of California-Berkeley 717 { 26. University of Pennsylvania 384
3. University of Wisconsin-Madison 685 28. University of North Carolina at Chapel Hill 374
4. University of Minnesota-Twin Cities 656 29. University of Georgia 365
5. University of Michigan-Ann Arbor 655 30. University of Pittsburgh-Main Campus 360
6. University of Illinois at Urbana 643 31. North Carolina State University at Raleigh 354
7. University of California-Los Angeles. 588 32. Rutgers University-New Brunswick 347
8. Pennsylvania State University-Main Campus 580 33. Johns Hopkins University 341
9. Nova Southeastern University 573 34. Virginia Polytechnic Institute & State Univ 334
10. Harvard University 564 35. Yale University 333
11. Stanford University 551 { 35. University of Virginia-Main Campus 333
12. Ohio State University-Main Campus 549 37. University of California-Davis 312
13. University of Washington 521 38. University of Iowa 310
14. University of Maryland-College Park 504 39. Northwestern University 309
15. Texas A & M University 501 40. University of Colorado at Boulder 302
16. Massachusetts Institute of Technology 487 41. Boston University 300
17. Cornell University-Endowed Colleges 485 42. University of California-San Diego 282
18. Purdue University-Main Campus 468 43. University of Kansas Main Campus 278
19. University of Southern California 465 44. Florida State University 277
20. University of Florida 447 45. CUNY Graduate School & University Center 275
21. Columbia University in the City of New York 416 46. Arizona State University-Main Campus 270
22. University of Arizona 414 47. University of Massachusetts-Amherst 269
23. New York University 410{
47. SUNY At Buffalo 269
24. Indiana University-Bloomington 391 47. University of South Carolina at Columbia 269
25. Michigan State University 388 50. Iowa State University 257
SOURCE: NSF/NIH/USED/NEH/USDA/NASA, Survey of Earned Doctorates
97123

APPENDIX B: Trend Tables, 1989-1999
Appendix B includes the following two tables:
B-1: Number of Doctorate Recipients, by Subfield, 1989-1999
B-2: Number of Doctorate Recipients, by Sex, Race/Ethnicity, and Citizenship, 1979,1984, and 1989-1999
TABLE B-1: Table B-1 presents data for the most recent decade by subfield of doctorate. In
general, the subfields correspond to the fields on the questionnaire's Specialties List located in
the questionnaire at the back of the Summary Report; some subfields, however, do not appear on
the current Specialties List because they are no longer included in the survey taxonomy. A dash
() in a column indicates that the field was not on the Specialties List for that year.
Field groupings in this table may differ from those in reports published by Federal
sponsors of the Survey of Earned Doctorates (SED); see inside the back cover of the Summary
Report for a description of field groupings as reported in these tables. The. "general" field
categoriesfor example, "chemistry, general"include individuals who either received the
doctorate in the general subject area or did not indicate a particular specialty field. The "other"
field categoriesfor example, "chemistry, other"include individuals whose specified doctoral
discipline was not among the specialty fields.
The seven tables in Appendix A present additional information on the most recent cohort
of research doctorate recipients by field of doctorate.
TABLE B-2: Table B-2 displays, by sex and citizenship, data on the race/ethnicity of doctorate
recipients for 1979, 1984, and the past decade. Table B-2 contains three panels, each displayed
on a separate page. The first panel includes all doctorates; the others disaggregate the data by
sex.
The racial/ethnic question has undergone several revisions over the years. In 1977 it was
modified to correspond to a standard question format recommended by the Federal Interagency
Committee on Education and adopted by the Office of Management and Budget (OMB) for use
98 124

in Federally sponsored surveys; an explanation of the effect of these changes is detailed on
page 13 of Summary Report 1977. (Note: Changes in the OMB guidelines prompted the
reclassification of persons having origins in the Indian subcontinent from the white category to
the Asian category.) In 1980, the item was further revised in two ways: (1) the Hispanic
category was subdivided into Puerto Rican, Mexican, and other Hispanic to provide more detail
for users of the racial/ethnic data; and (2) respondents were asked to check only one racial
category. (Before 1980, doctorate recipients could check more than one category to indicate their
race.) The item was modified again 1982 to separate the questions on race and ethnicity. Since
then respondents have been asked to first indicate whether or not they are Hispanic, and then
check one of four racial group categories (American Indian, Asian, black, or white). In Table
B-2, doctorate recipients who reported Hispanic heritage, regardless of racial designation, are
counted as Hispanic. The remaining survey respondents are then counted in their respective
racial groups. (Note: Doctorate recipients who checked the category "American Indian or
Alaskan Native" are identified as American Indian in this report.)
Tables A-2 and A-4 in Appendix A present additional information on the most recent
cohort of doctorate recipients by race/ethnicity.
99 125

APPENDIX TABLE B-1. Number of doctorate recipients, by subfield, 1989-1999
Year of DoctorateSubfleld 1989 1990 1991 1992 1993 1994 1995 1996 1997 1998 1999
TOTAL ALL FIELDS 34,327 36,067 37,534 38,890 39,801 41,034 41,743 42,414 42,555* 42,683- 41,140-
PHYSICAL SCIENCES# 5,455 5,859 6,280 6,502 6,496 6,822 6,808 6,674 6,681 6,745 6,324
MATHEMATICS 859 892 1,039 1,058 1,146 1,118 1,190 1,122 1,125 1,177 1,085
Applied Mathematics 158 185 193 213 188 206 211 230 242 265 252Algebra 50 39 72 69 84 78 82 78 78 75 84Analysis and Functional Analysis 103 90 132 105 105 107 99 100 103 130 87
Geometry 47 42 66 45 44 35 45 72 70 54 65Logic 12 19 23 28 19 29 35 16 23 16 23Number Theory 23 26 30 25 42 37 35 42 46 46 50Mathematical Statistics 167 157 206 217 228 205 205 178 181 204 174
Topology 37 50 57 58 54 38 51 55 62 65 65Computing Theory and Practice 12 12 19 12 18 16 14 18 14 18 14
Operations Research 22 29 16 22 37 26 36 21 20 17 21
Mathematics, General 177 191 180 209 276 269 305 233 155 163 117
Mathematics, Other 51 52 45 55 51 72 72 79 131 124 133
COMPUTER SCIENCE 612 705 800 869 880 903 997 921 910 925 850
Computer Science 519 612 720 791 825 833 913 837 829 819 735Information Sciences and Systems 93 93 80 78 55 70 84 84 81 106 115
PHYSICS AND ASTRONOMY 1,274 1,393 1,411 1,537 1,544 1,692 1,652 1,676 1,599 1,586 1,431
Astronomy 49 52 50 55 76 66 89 84 71 91 60Astrophysics 64 76 75 79 69 78 84 108 127 117 100Acoustics 15 21 13 18 27 20 18 19 19 18 16
Chemical. and Atomic/Molecular 74 87 76 85 95 140 110 129 106 100 99
Electron 4 2 1 - - - - - -
Elementary Particles 135 163 182 153 170 176 183 175 170 173 169
Fluids 14 17 14 17 19 12 18 21 24 26 23Nuclear 81 73 66 86 82 90 91 87 106 92 76Optics 78 76 85 94 96 104 98 129 123 104 97
Plasma and High-Temperature 61 42 58 65 62 79 46 48 39 55 '49Polymer 7 11 17 17 29 29 23 33 19 24 28Solid State and Low-Temperature 296 306 372 408 336 388 371 364 328 313 308Physics, General 269 323 247 .297 340 343 355 323 255 191 205Physics, Other 127 144 155 163 143 167 166 156 212 282 201
CHEMISTRY 1,970 2,100 2,194 2,214 2,137 2,257 2,162 2,148 2,147 2,219 2,134
Analytical 289 293 304 304 286 334 317 346 350 384 333Inorganic 256 242 260 268 237 262 258 249 279 287 279Nuclear 6 13 14 7 8 10 5 5 8 6 10
Organic 511 452 538 512 518 544 483 506 566 597 564
Medicinal/Pharmaceutical 64 48 83' 69 99 102 96 96 105 115 132Physical 310 325 364 398 336 334 338 300 334 279 310Polymer 78 81 111 83 107 117 116 121 110 123 95Theoretical 46 55 45 59 53 52 40 57 48 41 56Chemistry, General 312 524 400 449 431 447 458 396 261 286 196
Chemistry, Other 98 67 75 65 62 55 51 72 86 101 159
EARTH, ATMOS., & MARINE SCI. 740 769 836 824 789 852 807 807 900 838 824
Atmospheric Physics and Chem. 15 18 20 36 13 27 27 22 45 38 43Atmospheric Dynamics 16 20 21 23 23 27 16 21 25 24 16
Meteorology 27 20 31 28 34 32 25 35 28 25 22
Atmos. Sci./Meteorology, General 14 23 26 27 22 37 44 33 36 22 33
Atmos.Sci./Meteorology, Other 15 2 10 6 7 6 18 14 15 16 10
Geology 165 166 192 166 197 194 186 162 165 171 158Geochemistry 39 56 64 62 50 59 42 49 49 58 55
Geophysics and Seismology 87 91 117 108 101 106 93 101 108 106 100Paleontology 17 21 24 25 21 17 20 14 23 23 15
Mineralogy, Petrology 36 26 36 29 9 21 19 23 19 14 14
Stratigraphy, Sedimentation 24 25 29 23 28 27 16 12 23 24 17
Geomorphology and Glacial Geology 10 14 18 12 16 13 11 11 26 20 18
Applied Geology 6 6 1 0 0 0 0 0 0 0 0
Geological & Related Sci., General 19 31 30 18 15 18 21 27 16 13 9
Geological & Related Sci., Other 28 28 33 31 17 24 22 22 17 40 35Environmental Science 68 50 35 57 68 61 81 83 96 73 100Hydrology and Water Resources 24 13 16 29 25 30 24 31 43 35 32
Oceanography 87 89 85 82 98 91 83 107 114 94 100Marine Sciences 26 39 27 32 27 34 32 27 30 18 30Misc. Physical Sciences, Other 17 31 21 30 18 28 27 13 22 24 17
ENGINEERING 4,543 4,894 5,214 5,438 5,698 5,822 6,008 6,305 6,114 5,930 5,337
Aerospace, Aeronautic. & Astronautic. 178 192 207 234 228 230 252 287 273 243 207
Agricultural 102 101 83 84 86 89 73 104 79 74 59Bioengineering and Biomedical 115 129 149 147 171 173 189 220 210 207 245Ceramic Sciences 35 43 58 42 42 39 39 41 39 24 33Chemical 625 561 621 607 624 630 602 681 662 668 580Civil 498 505 509 540 563 602 572 599 593 588 507Communications 25 35 21 30 22 33 29 32 33 40 38Computer 117 131 178 175 167 202 189 208 227 210 206Electrical, Electronics 995 1,110 1,206 1,278 1,354 1,438 1,513 1,500 1,461 1,346 1,233Engineering Mechanics 110 111 113 132 128 132 108 105 93 86 68Engineering Physics 16 16 23 25 21 17 17 37 24 15 28Engineering Science 27 37 42 51 55 46 56 52 45 50 51
BEST COPY AVAILABLE 100126

APPENDIX TABLE B-1. Number of doctorate recipients, by subfield, 1989-1999
Year of DoctorateSubfleld 1989 1990 1991 1992 1993 1994 1995 1996 1997 1998 1999
Environmental Health Engineering 40 48 66 54 61 82 84 98 63 63 78
Industrial/Manufacturing 162 151 165 196 236 228 284 258 246 230 209Materials Science 257 307 361 365 416 433 476 470 482 482 394
Mechanical 650 773 762 855 902 883 917 947 928 937 785
Metallurgical 88 90 70 78 77 67 73 61 60 59 43
Mining and Mineral 33 39 38 26 24 23 19 31 33 21 18
Naval Architecture, Marne Eng. 9 8 5 - - - -
Nuclear 86 114 107 120 108 85 105 113 102 97 77
Ocean 20 17 21 21 24 29 21 26 34 29 16
Operations Research 68 46 76 56 56 47 48 74 74 62 67
Petroleum 29 49 28 54 52 42 48 52 51 48 45
Polymer/Plastics 58 48 42 64 61 53 58 65 54 59 53
Systems 30 51 48 37 57 51 47 47 49 68 42Engineering, General 61 75 78 64 47 39 60 60 51 30 39Engineering, Other 109 107 137 103 116 129 129 137 148 194 216
LIFE SCIENCES 6,342 6,605 6,933 7,115 7,395 7,739 7,918 8,255 8,325 8,551 8,126
BIOLOGICAL SCIENCES 4,116 4,328 4,650 4,799 5,092 5,203 5,376 5,723 5,786 5,854 5,600
Biochemistry 669 678 765 715 846 804 824 794 831 798 763
Biomedical Sciences - - - 93 140 158 184 177
Biophysics 87 103 100 125 103 123 155 142 147 166 173
Biotechnology Research - - 8 14 4 6 11 12 19
Bacteriology 11 15 11 13 14 18 13 16 13 13 13
Plant Genetics 18 31 23 33 41 30 35 41 30 40 31
Plant Pathology 22 37 50 32 41 40 32 38 33 18 36
Plant Physiology 47 51 65 68 48 70 55 73 47 61 54
Botany, Other 117 104 105 107 105 117 102 105 91 113 68
Anatomy 80 70 77 75 76 66 64 47 50 35 33
Biometrics and Biostatistics 46 47 59 63 74 72 67 81 84 75 76
Cell Biology 133 145 149 188 231 237 236 233 251 299 285
Ecology 161 166 189 180 177 201 203 245 255 293 272
Developmental Biology/Embryology 10 22 37 48 57 62 64 96 115 127 108
Endocrinology 21 24 33 27 16 26 20 24 17 30 19
Entomology 139 147 138 139 114 123 121 136 124 139 113
Biological Immunology 152 153 177 181 169 161 190 238 214 245 223
Molecular Biology 413 413 481 527 582 598 617 651 772 741 719
Microbiology 340 335 372 377 433 423 426 444 410 384 382
Neuroscience 181 192 238 238 276 284 309 404 437 413 437
Nutritional Sciences 128 118 106 132 134 147 136 142 124 139 104
Parasitology 20 13 20 17 17 22 14 22 17 15 13
Toxicology 111 91 86 105 100 120 126 138 180 156 115
Human and Animal Genetics 112 153 160 142 172 203 202 212 217 197 217
Human and Animal Pathology 105 101 122 114 130 128 109 135 106 91 120
Human and Animal Pharmacology 242 244 266 279 274 259 278 316 300 256 254
Human and Animal Physiology 272 278 272 266 271 289 262 275 227 258 243
Zoology, Other 132 122 125 134 114 117 145 100 97 111 126
Biological Sciences, General 231 333 278 315 305 288 348 291 209 217 182
Biological Sciences, Other 116 142 146 159 164 161 126 138 219 228 225
HEALTH SCIENCES 974 956 1,041 1,112 1,197 1,296 1,330 1,324 1,423 1,503 1,410
Speech-Lang. Pathology & Audiology 91 93 90 82 98 95 106 94 88 95 86
Environmental Health 35 38 38 44 38 51 51 58 67 54 69
Health Systems/Services Admin. - - - 35 53 62 60 66 63 62Public Health 129 123 132 157 153 142 152 156 139 157 171
Epidemiology 107 102 115 108 120 168 153 149 151 166 180
Exercise Physiology/Sci., Kinesiology - - - 87 118 105 105 129 104
Nursing 308 261 325 338 373 336 354 354 420 399 358
Pharmacy 111 116 115 160 146 148 144 145 142 156 137
Rehabilitation/Therapeutic Services - 17 25 36 43 20 26 34 35 26
Veterinary Medicine 48 70 56 63 61 56 55 65 47 49 49
Health Sciences, General 19 36 28 30 38 41 35 22 45 17 32
Health Sciences, Other 126 117 125 105 99 76 80 90 119 183 136
AGRICULTURAL SCIENCES 1,252 1,321 1,242 1,204 1,106 1,240 1,212 1,208 1,116 1,194 1,116
Agricultural Economics 164 145 168 141 137 162 173 169 133 155 149
Agricultural Business and Management 2 2 1 0 1 0 3 2 1 2 2
Animal Breeding & Genetics 23 22 18 23 18 17 19 12 24 18 21
Animal Nutrition 67 54 57 41 52 58 50 54 55 45 46
Dairy Science 16 20 19 14 11 11 14 9 14 10 12
Poultry Science 11 17 13 22 16 21 11 12 9 11 8
Fisheries Science & Management 34 42 39 26 38 48 49 46 45 30 38
Animal Sciences, Other 95 90 92 97 74 86 85 90 62 60 71
Agronomy & Crop Science 140 143 117 123 104 143 114 110 77 97 106
Plant Breeding & Genetics 64 87 69 82 68 81 72 63 67 69 44
Plant Pathology 63 64 90 63 58 55 52 90 65 66 66
Plant Protection-Pest Management 6 4 2 - - - - -
Plant Sciences, Other 15 23 17 29 28 24 30 21 20 37 38
Food Sciences 1 - - - - - - - -
Food Distribution 0 0 0 0 0 1 - - ..
Food Engineering 11 10 12 14 9 16 7 7 11 13 7
Food Sciences, Other 147 141 137 151 141 152 135 142 175 153 137
Soil Chemistry/Microbiology 28 27 24 24 26 21 27 29 32 27 29
Soil Sciences, Other 75 91 78 63 59 69 72 78 56 74 67
Horticulture Science 75 101 78 65 62 65 67 73 44 60 66
Forest Biology 22 27 17 29 18 20 24 19 22 20 14
Forest Engineering 1 2 2 2 3 0 4 0 13 2 1
BEST COPY AVAILABLE
101 127

APPENDIX TABLE B-1. Number of doctorate recipients, by subfield, 1989-1999
Year of DoctorateSubfleld 1989 1990 1991 1992 1993 1994 1995 1996 1997 1998 1999
Forest Management 21 14 22 16 17 17 20 22 21 27 17
Wood Sci. & Putp/Paper Tech. 16 16 16 21 20 26 26 18 25 25 21
Conserv. /Renewable Nat. Res. 12 16 19 9 13 21 24 13 17 25 25Forestry & Related Sci., Other 57 62 45 62 55 59 71 56 50 69 49Wildlife/Range Mgt 52 58 59 55 54 52 50 64 50 56 44Agricultural Sciences, General . 7 5 3 9 10 4 6 5 10 8 8Agricultural Sciences, Other 27 38 28 23 14 11 7 4 18 35 30
SOCIAL SCIENCES (INCL. PSYCH.) 5,961 6,093 6,152 6,216 6,545 6,613 6,635 6,814 7,055 7,086 7,036
Anthropology 325 324 341 320 342 384 375 396 434 425 461Area Studies 17 22 24 33 36 34 27 28 10 14 11
Criminology 32 42 35 37 39 41 44 60 49 55 51
Demography/Population Studies 22 20 28 17 22 23 15 11 24 31 28Economics 872 836 861 885 906 913 952 979 999 975 912Econometrics 26 26 24 25 24 26 27 29 31 25 15Geography 105 131 108 111 137 146 150 165 149 154 144International Relations/Affairs 94 97 88 76 102 112 73 99 88 97 120Political Science and Government 430 462 434 513 507 589 600 621 665 663 653Public Policy Analysis 79 87 111 107 98 94 93 104 126 97 124Sociology 436 428 465 495 513 525 540 516 577 550 543Statistics 69 69 31 29 48 46 48 48 56 61 72Urban Affairs/Studies 62 67 90 86 123 132 103 106 93 77 57Social Sciences, General 26 23 36 33 32 21 35 26 26 30 25Social Sciences, Other 158 178 226 186 196 148 124 135 157 147 153
PSYCHOLOGY 3,208 3,281 3,250 3,263 3,420 3,379 3,429 3,491 3,571 3,685 3,667
Clinical 1,259 1,337 1,305 1,309 1,373 1,285 1,291 1,325 1,268 1,350 1,449Cognitive and Psychofinguistics 79 76 94 101 104 129 104 128 166 113 143Comparative 8 8 7 2 5 8 4 3 6 6 11
Counseling 501 466 497 507 488 497 470 464 487 448 461Developmental and Child 148 159 155 170 202 179 152 188 215 267 193Human/Individual & Family Develop. 129 150 151 126 ' 118 130Experimental 146 143 142 154 143 139 151 128 145 149 137Educational 105 98 110 91 91 69 74 92 61 61 66Family and Marriage Counseling - 57 52 64 51 55Industrial and Organizational 104 126 142 138 159 137 155 162 187 189 158Personality 28 20 13 17 22 19 16 24 26 25 16PhysiologicaUPsychobiology 62 46 45 55 85 93 92 80 77 92 87Psychometrics 6 8 9 5 9 5 10 11 11 9 15Quantitative 11 15 7 10 16 17 13 19 17 15 14
School 107 82 82 88 95 84 91 82 84 106 120Social 128 145 147 139 125 153 155 170 181 186 175Psychology, General 364 371 324 295 306 280 306 279 321 304 229Psychology, Other 152 181 171 182 197 156 138 133 129 196 208
HUMANITIES 3,552 3,822 4,099 4,444 4,482 4,744 5,061 5,116 5,436 5,511 5,468
History, American 206 211 251 277 269 310 344 355 372 408 418History, Asian - - 43 54 54 70 68History, European 107 151 127 176 162 180 185 187 245 230 235History/Philosophy of Sci. & Tech. 20 26 27 28 37 27 41 37 36 43 49History, General 85 111 121 102 116 140 148 101 82 86 76History, Other 120 113 137 141 142 144 128 123 176 152 165Classics 51 58 55 58 61 84 62 72 53 85 77Comparative Literature 103 97 150 163 153 163 191 164 181 163 166Linguistics 188 167 227 266 214 221 201 230 244 220 250Speech and Rhetorical Studies 35 38 86 98 111 142 139 155 138 169 150Letters, General 13 19 17 18 18 22 43 28 23 22 19Letters, Other 60 52 44 38 37 25 34 61 60 82 83American Studies 76 72 92 81 101 88 94 115 84 100 98Archeology 26 22 33 33 38 34 35 21 35 34 26Art History/Criticism/Conservation 145 135 125 154 158 182 181 176 188 221 189Music 521 572 587 641 613 685 713 699 727 694 769Philosophy 270 243 285 279 274 302 298 369 447 410 387Religion 215 219 187 231 257 252 248 317 303 327 337Drama/Theater Arts 79 106 91 95 91 102 80 103 116 92 99
LANGUAGE AND LITERATURE 1,152 1,308 1,350 1,465 1,524 1,537 1,718 1,618 1,747 1,720 1,652
American 192 229 253 291 293 296 327 314 408 389 372English 528 567 599 612 655 647 752 699 686 688 652French 106 123 100 124 137 129 151 142 150 137 149German 73 78 71 96 105 67 93 88 82 106 90Italian 20 25 32 20 19 32 35 24 23 33 20Spanish 134 173 173 179 179 212 209 196 250 207 201Russian 13 19 25 28 28 38 28 37 39 43 26Slavic 7 7 14 15 13 10 16 11 9 15 17Chinese 9 16 19 20 21 25 20 29 23 19 27Japanese 13 9 7 12 11 12 7 10 19 11 10Hebrew 10 14 11 20 15 10 11 12 7 8 4Arabic 6 7 4 12 10 4 8 6 4 9 12Other Language and Literature 41 41 42 36 38 55 61 50 47 55 72
Humanities, General 19 28 29 21 30 32 25 39 25 23 24Humanities, Other 61 74 78 79 76 72 110 92 100 160 131
102 128

APPENDIX TABLE B-1. Number of doctorate recipients, by subfield, 1989-1999
Year of DoctorateSubfield 1989 1990 1991 1992 1993 1994 1995 1998 1997 1998 1999
EDUCATION 6,281 6,510 6,454 6,677 6,689 6,708 6,649 6,772 6,573 6,575 6,557
Curriculum and Instruction 841 839 807 900 856 819 896 896 916 885 996Educational Admin. and Supervision 1,633 1,663 1,428 1,290 1,340 1,207 1,086 1,170 1,018 950 897Educational Leadership 0 1 485 694 783 792 889 . 989 1,033 1,114 1,150Educlinstruct. Media Design 76 55 73 62 96 111 121 107 92 91 123Educ. Stat./Research Methods 59 59 80 61 64 68 63 76 58 56 57Educ.Assess., Test., & Meas. 42 40 32 45 23 28 19 32 30 35 39Educational Psychology 301 323 323 346 290 311 297 309 360 328 298School Psychology 85 87 90 88 86 97 71 114 116 112 109Social/Phil. Found. of Educ. 110 86 109 101 109 140 130 125 138 129 125Special Education 259 225 226 260 277 241 254 278 269 248 263Counseling Educ./Couns. & Guidance 264 301 270 259 288 284 268 277 207 270 261Higher Educ./ Evaluation & Research 373 424 344 381 357 428 457 481 505 432 464Pre-elementary/Early Childhood 63 42 85 98 97 91 70 81 42 54 49Elementary Education 99 110 73 73 65 71 61 46 56 62 59Secondary Education 53 56 40 28 33 24 24 34 26 55 31Adult and Continuing Education 236 211 210 208 233 215 235 210 164 172 153
TEACHING FIELDS 970 922 973 1,008 943 960 924 863 919 956 891
Agricultural Education 35 38 49 43 54 52 35 32 38 25 38Art Education 39 44 28 46 38 33 39 41 30 46 47Business Education 40 34 32 16 27 25 21 20 26 31 45English Education 51 52 58 61 53 56 60 57 62 53 64Foreign Languages Education 33 31 46 50 48 54 60 44 47 73 62Health Education 100 95 78 98 83 97 99 60 58 70 58Home Economics Education 19 10 21 12 14 11 15 13 13 8 10
Technical/Industrial Arts Education 17 17 13 11 16 20 15 11 19 30 21
Mathematics Education 69 65 73 62 69 74 92 100 93 115 101
Music Education 97 78 96 96 80 89 96 91 100 94 79Nursing Education 29 24 18 29 19 24 18 23 22 14 22Physical Education and Coaching 176 191 185 167 161 139 104 101 109 109 114Reading Education 95 82 102 121 95 97 85 66 70 77 68Science Education 48 72 72 73 73 85 73 96 77 109 58Social Science Education 13 11 19 19 9 10 14 12 26 15 9Speech Education 1 5 1
Technical Education 28 15 25 35 21 30 20 24 32 18 27Trade and Industrial Education 47 18 17 11 24 24 13 12 16 14 14
Teacher Ed./Spec. Acad. & Voc., Other 33 40 40 58 59 40 65 30 81 55 54
Education, General 414 535 428 443 411 484 429 353 338 235 199Education, Other 403 531 378 332 338 337 355 331 286 391 393
PROFESSIONAL/OTHER FIELDS 2,193 2,284 2,402 2,498 2,496 2,586 2,664 2,478 2,365 2,278 2,292
BUSINESS AND MANAGEMENT 1,067 1,036 1,163 1,248 1,281 1,283 1,327 1,276 1,242 1,172 1,104
Accounting 186 172 172 180 183 179 168 156 150 154 153Banking/Financial Support Services 151 134 172 172 170 134 163 114 69 83 75Business Admin. and Management 245 277 204 241 324 319 340 393 425 348 311Business/Managerial Economics 27 21 19 21 33 40 37 38 48 57 42International Business - - - - - 22 23 36 39 33 34Mgmt. Info. Sys./Business Data Proc. - - 72 103 102 117 111 94 100 86 83Marketing Management and Research 130 120 134 139 166 167 153 153 153 143 127Business Statistics 15 10 5 - - - -
Operations Research - 52 46 58 67 63 54 59 64 45 57 52Organizational Behavior 95 64 72 81 73 102 100 108 121 103 100Bus. Mgmt./Admin. Serv., General 57 70 123 112 87 87 92 67 28 36 50Bus. Mgmt./Admin. Serv., Other 109 122 132 132 80 62 81 53 64 72 77
COMMUNICATIONS 306 323 332 330 321 371 380 389 332 373 379
Communications Research 85 87 72 45 33 40 40 60 51 52 50Journalism 15 21 7
Mass Communications - 68 85 117 156 121 137 117 142 153Radio and Television 29 17 6 -
Communication Theory - 25 47 41 45 53 37 40 48 47Communications, General 79 86 70 76 69 68 77 81 74 62 69Communications, Other 98 112 84 77 61 62 89 74 50 69 60
OTHER PROFESSIONAL FIELDS 766 858 836 880 867 891 931 774 772 724 781
Architectural Environmental Design 43 41 67 60 54 67 55 61 65 51 65Home Economics 55 74 29 58 57 31 31 28 36 18 23Law 26 34 23 20 29 33 37 26 27 31 37Library Science 60 42 52 51 70 42 47 49 40 34 39Parks/Recreation/Leisure/Fitness - - 44 37 54 29 24 38 29Public Administration 97 88 107 108 117 135 128 104 95 105 119Social Work 206 246 240 248 237 272 303 256 247 236 229Theology/Religious Education 232 271 273 292 243 262 273 213 178 160 168Professional Fields, General 0 3 3 1 1 1 1 2 4 0 9Professional Fields, Other 47 59 42 42 15 11 2 6 56 51 63
OTHER/UNKNOWN 54 67 71 40 27 41 26 39 25 16 28
#Includes mathematics and computer sciences. 'Total includes 17 respondents with missing data for doctoral field. "Includes 20 respondents with missing data for doctoralfield. "'Total includes 28 respondents with missing data for doctoral field.NOTE: Dash (-) indicates that the field was not on the questionnaire's Specialties List that year. Field groupings may differ from those in reports publishedby federal sponsorsof the Survey of Earned Doctorates.
SOURCE: NSF/NIH/USED/NEH/USDNNASA, Survey of Earned Doctorates
103129
BEST COPY AVAILABLE

APPENDIX TABLE B-2a. Number of doctorate recipients, by gender, race/ethnicity, and citizenship, 1979,1984, 1989-1999 (Total all doctorates)
1979 1984 1989 1990 1991
Year of Doctorate
1992 1993 1994 1995 1996 1997 1998 1999
TOTAL MEN AND WOMEN* 31,239 31,337 34,327 36,067 37,534 38,890 39,801 41,034 41,743 42,414 42,555 42,683 41,140
U.S. Citizen 25,474 24,046 23,402 24,905 25,573 26,010 26,449 27,147 27,740 27,751 28,154 28,462 27,622
Permanent Visa 1,320 1,224 1,626 1,698 1,857 1,980 2,259 3,747 4,318. 3,767 2,930 2,704 2,300
Temporary Visa 3,587 4,832 6,648 8,093 9,311 9,953 9,932 9,406 8,811 9,614 9,180 9,498 9,068
Unknown Citizenship 858 1,235 2,651 1,371 793 947 1,161 734 874 1,282 2,291 2,019 2,150
Total Known Race/Ethnicity 28,719 29,308 30,962 33,883 35,783 37,200 38,291 39,840 40,328 40,658 38,881 39,393 38,614
U.S. Citizen 23,961 23,457 23,026 24,531 25,087 25,658 26,217 26,894 27,433 27,403 27,056 27,537 27,177
Permanent Visa 1,285 1,197 1,564 1,637 1,796 1,906 2,225 3,699 4,274 3,734 2,867 2,616 2,260
Temporary Visa 3,397 4,515 6,297 7,558 8,789 9,536 9,675 9,115 8,546 9,371 8,838 9,091 8,808
Unknown Citizenship 76 139 75 157 111 100 174 132 75 150 120 149 369
American Indiant 84 74 94 98 132 152 121 146 148 190 166 190 219
U.S. Citizen 81 74 94 97 130 149 120 143 148 187 166 189 219
Permanent Visa# 0 0 0 0 2 0 0 0 0 1 0 0 0
Temporary Visa# 3 0 0 1 0 2 1 3 0 2 0 0 0
Unknown Citizenship 0 0 0 0 0 1 0 0 0 0 0 1 0
Asian* 2,602 3,403 5,195 6,293 7,528 8,291 8,674 9,369 9,709 9,830 9,011 8,592 8,032
U.S. Citizen 428 513 633 641 789 848 891 950 1,141 1,090 1,310 1,174 1,324
Permanent Visa 674 510 635 665 742 916 1,126 2,596 3,168 2,609 1,812 1,555 1,194
Temporary Visa 1,463 2,300 3,907 4,931 5,949 6,506 6,604 5,800 5,379 6,097 5,857 5,833 5,479
Unknown Citizenship 37 80 20 56 48 21 53 23 21 34 32 30 35
Black 1,443 1,496 1,247 1,354 1,466 1,434 1,615 1,683 1,823 1,836 1,774 1,914 2,071
U.S. Citizen 1,058 956 822 901 1,010 971 1,111 1,101 1,307 1,313 1,349 1,483 1,596
Permanent Visa 58 102 141 149 156 145 169 178 168 143 139 120 133
Temporary Visa 320 420 273 291 293 311 322 389 337 364 276 299 288
Unknown Citizenship 7 18 11 13 7 7 13 15 11 16 10 12 54
Hispanic 908 916 1,063 1,228 1,320 1,402 1,431 1,534 1,534 1,621 1,685 1,869 1,842
U.S. Citizen 470 534 582 721 732 778 834 884 912 947 1,053 1,197 1,109
Permanent Visa 77 71 112 116 136 131 139 146 142 156 136 122 137
Temporary Visa 348 300 363 386 446 482 454 502 472 512 483 541 561
Unknown Citizenship 13 11 6 5 6 11 4 2 8 6 13 9 35
White 23,682 23,419 23,363 24,910 25,337 25,921 26,450 27,108 27,114 27,181 26,245 26,828 26,450
U.S. Citizen 21,924 21,380 20,895 22,171 22,426 22,912 23,261 23,816 23,925 23,866 23,178 23,494 22,929
Permanent Visa 476 514 676 707 760 714 791 779 796 825 780 819 796
Temporary Visa 1,263 1,495 1,754 1,949 2,101 2,235 2,294 2,421 2,358 2,396 2,222 2,418 2,480
Unknown Citizenship 19 30 38 83 50 60 104 92 35 94 65 97 245
Unknown Race/Ethnicity 2,520 2,029 3,365 2,184 1,751 1,690 1,510 1,194 1,415 1,756 3,674 3,290 2,526
U.S. Citizen 1,513 589 376 374 486 352 232 253 307 348 1,098 925 445
Permanent Visa 35 27 62 61 61 74 34 48 44 33 . 63 88 40
Temporary Visa 190 317 351 535 522 417 257 291 265 243 342 407 260
Unknown Citizenship 782 1,096 2,576 1,214 682 847 987 602 799 1,132 2,171 1,870 1,781
'Total includes individuals who did not report sex.:f Includes Alaskan Native.#In most cases, non-U.S. American Indians are citizens of Canada or of a Latin American country.tIncludes Pacific Islander.
Source: NSF/NIH/USED/NEH/USDA/NASA, Survey of Earned Doctorates
130104
BEST COPY AVAILABLE

APPENDIX TABLE B-2b. Doctorates: MEN
Year of Doctorate
1979 1984 1989 1990 1991 1992 1993 1994 1995 1996 1997 1998 1999
TOTAL MEN 22,302 20,638 21,814 22,960 23,525 24,235 24,384 25,059 25,159 25,274 24,944 24,659 23,460
U.S. Citizen 17,585 14,741 13,396 14,165 14,385 14,518 14,512 14,732 14,964 14,708 15,045 14,880 14,383
Permanent Visa 1,014 892 1,139 1,189 1,223 1,290 1,468 2,636 2,908 2,485 1,834 1,666 1,375
Temporary Visa 3,092 4,134 5,444 6,632 7,506 7,946 7,835 7,306 6,842 7,389 6,962 7,010 6,636
Unknown Citizenship 611 871 1,835 974 411 481 569 385 445 692 1,103 1,103 1,066
Total Known Race/Ethnicity 20,456 19,150 19,411 21,342 22,356 23,168 23,534 24,324 24,297 24,248 22,998 22,735 22,051
U.S. Citizen 16,494 14,320 13,117 13,899 14,032 14,262 14,343 14,564 14,749 14,477 14,430 14,334 14,098
Permanent Visa 987 870 1,094 1,149 1,177 1,236 1,444 2,602 2,882 2,463 1,795 1,606 1,347
Temporary Visa 2,922 3,850 5,143 6,175 7,073 7,606 7,641 7,093 6,630 7,208 6,705 6,717 6,450
Unknown Citizenship 53 110 57 119 74 64 106 65 36 100 68 78 156
American Indianf 59 54 49 52 74 82 61 74 80 104 78 104 98
U.S. Citizen 56 54 49 52 74 82 60 71 80 103 78 104 98
Permanent Visa# 0 0 0 0 0 0 0 0 0 0 0 0 0
Temporary Visa# 3 0 0 0 0 0 1 3 0 1 0 0 0
Unknown Citizenship 0 0 0 0 0 0 0 0 0 0 0 0 0
Asian* 2,158 2,789 4,166 5,030 5,872 6,418 6,605 7,061 7,103 7,209 6,423 6,040 5,543
U.S. Citizen 311 339 446 427 482 531 552 590 667 615 748 648 772
Permanent Visa 564 392 459 481 489 604 732 1,877 2,198 1,787 1,142 987 711
Temporary Visa 1,253 1,987 3,245 4,077 4,865 5,265 5,282 4,576 4,223 4,782 4,514 4,389 4,036
Unknown Citizenship 30 71 16 45 36 18 39 18 15 25 19 16 24
Black 898 904 685 733 788 771 840 889 881 933 863 824 919
U.S. Citizen 552 429 328 351 421 396 441 411 490 534 533 526 604
Permanent Visa 52 81 125 128 131 123 138 142 125 107 108 87 92
Temporary Visa 288 383 222 243 232 246 251 329 261 286 213 204 209
Unknown Citizenship 6 11 10 11 4 6 10 7 5 6 9 7 14
Hispanic 681 620 662 760 807 860 874 866 909 927 978 1,055 968
U.S. Citizen 311 313 307 380 371 410 423 438 458 473 540 607 486
Permanent Visa 52 47 69 69 88 72 94 80 79 87 82 71 67
Temporary Visa 310 252 283 309 344 371 356 346 369 363 349 374 405
Unknown Citizenship 8 8 3 2 4 7 1 2 3 4 7 , 3 10
White 16,660 14,783 13,849 14,767 14,815 15,037 15,154 15,434 15,324 15,075 14,656 14,712 14,523
U.S. Citizen 15,264 13,185 11,987 12,689 12,684' 12,843 12,867 13,054 13,054 12,752 12,531 12,449 12,138
Permanent Visa 319 350 441 471 469 437 480 503 480 482 463 461 477
Temporary Visa 1,068 1,228 1,393 1,546 1,632 1,724 1,751 1,839 1,777 1,776 1,629 1,750 1,800
Unknown Citizenship 9 20 28 61 30 33 56 38 13 65 33 52 108
Unknown Race/Ethnicity 1,846 1,488 2,403 1,618 1,169 1,067 850 735 862 1,026 1,946 1,924 1,409
U.S. Citizen 1,091 421 279 266 353 256 169 168 215 231 615 546 285
Permanent Visa 27 22 45 40 46 54 24 34 26 22 39 60 28
Temporary Visa 170 284 301 457 433 340 194 213 212 181 257 293 186
Unknown Citizenship 558 761 1,778 855 337 417 463 320 409 592 1,035 1,025 910
fIncludes Alaskan Native.#In most cases, non-U.S. American Indians are citizens of Canada or of a Latin American country.*Includes Pacific Islander.
SOURCE: NSF/NIH/USED/NEH/USDA/NASA, Survey of Earned Doctorates
131105

APPENDIX TABLE B-2c. Doctorates: WOMEN
1979 1984 1989 1990 1991
Year of Doctorate
1992 1993 1994 1995 1996 1997 1998 1999
TOTAL WOMEN 8,937 10,699 12,513 13,106 13,873 14,436 15,122 15,820 16,414 16,944 17,251 17,858 17,493
U.S. Citizen 7,889 9,305 10,006 10,740 11,185 11,491 11,932 12,412 12,774 13,043 13,075 13,568 13,239
Permanent Visa 306 332 487 508 633 687 788 1,110 1,409 1,282 1,095 1,022 925
Temporary Visa 495 698 1,204 1,461 1,794 1,990 2,069 2,077 1,952 2,214 2,203 2,468 2,428
Unknown Citizenship 247 364 816 397 261 268 333 221 279 405 878 800 901
Total Known Race/Ethnicity 8,263 10,158 11,551 12,540 13,417 14,019 14,738 15,501 16,023 16,405 15,870 16,633 16,562
U.S. Citizen 7,467 9,137 9,909 10,632 11,053 11,396 11,872 12,327 12,684 12,926 12,623 13,200 13,079
Permanent Visa 298 327 470 487 619 669 779 1,096 1,391 1,271 1,071 1,002 913
Temporary Visa 475 665 1,154 1,383 1,708 1,920 2,021 2,014 1,910 2,159 2,124 2,361 2,357
Unknown Citizenship 23 29 18 38 37 34 66 64 38 49 52 70 213
American Indlant 25 20 45 46 58 70 60 72 68 86 88 86 121
U.S. Citizen 25 20 45 45 56 67 60 72 68 84 88 85 121
Permanent Visa# 0 0 0 0 2 0 0 0 0 1 0 0 0
Temporary Visa# 0 0 0 1 0 2 0 0 0 1 0 0 0
Unknown Citizenship 0 0 0 0 0 1 0 0 0 0 0 1 0
Aslant 444 614 1,029 1,262 1,648 1,862 2,055 2,298 2,599 2,616 2,581 2,536 2,488
U.S. Citizen 117 174 187 214 306 317 338 359 474 475 561 525 552
Permanent Visa 110 118 176 183 253 311 392 718 969 822 670 561 483
Temporary Visa 210 313 662 854 1,077 1,231 1,312 1,218 1,150 1,311 1,337 1,437 1,442
Unknown Citizenship 7 9 4 11 12 3 13 3 6 8 13 13 11
Black 545 592 562 621 678 663 773 792 942 903 911 1,088 1,152
U.S. Citizen 506 527 494 550 589 575 670 690 817 779 816 957 992
Permanent Visa 6 21 16 21 25 22 31 36 43 36 31 32 41
Temporary Visa 32 37 51 48 61 65 70 59 76 78 63 94 79
Unknown Citizenship 1 7 1 2 3 1 2 7 6 10 1 5 40
Hispanic 227 296 401 468 513 542 556 668 625 694 707 812 874
U.S. Citizen 159 221 275 341 361 368 411 446 454 474 513 589 623
Permanent Visa 25 24 43 47 48 59 45 66 63 69 54 51 70
Temporary Visa 38 48 80 77 102 111 97 156 103 149 134 166 156
Unknown Citizenship 5 3 3 3 2 4 3 0 5 2 6 6 25
White 7,022 8,636 9,514 10,143 10,520 10,882 11,294 11,671 11,789 12,106 11,583 12,111 11,927
U.S. Citizen 6,660 8,195 8,908 9,482 9,741 10,069 10,393 10,760 10,871 11,114 10,645 11,044 10,791
Permanent Visa 157 164 235 236 291 277 311 276 316 343 316 358 319
Temporary Visa 195 267 361 403 468 511 542 581 581 620 590 664 680
Unknown Citizenship 10 10 10 22 20 25 48 54 21 29 32 45 137
Unknown Race/Ethnicity 674 541 962 566 456 417 384 319 391 539 1,381 1,225 931
U.S. Citizen 422 168 97 108 132 95 60 85 90 117 452 368 160
Permanent Visa 8 5 17 21 14 18 9 14 18 11 24 20 12
Temporary Visa 20 33 50 78 86 70 48 63 42 55 79 107 71
Unknown Citizenship 224 335 798 359 224 234 267 157 241 356 826 730 688
tIncludes Alaskan Native.#In most cases, non-U.S. American Indians are citizens of Canada or of a Latin American country.tIncludes Pacific Islander.
SOURCE: NSF/NIH/USED/NEH/USDA/NASA, Survey of Earned Doctorates
BEST COPY AVAILABLE
106 132
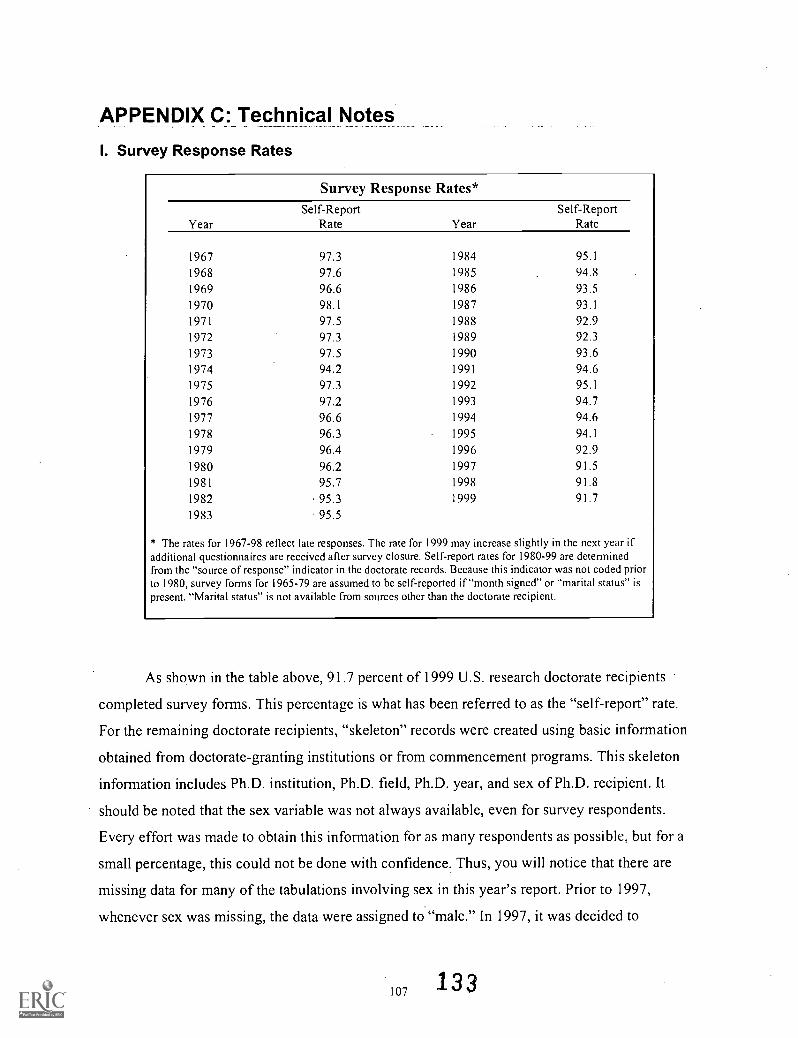
APPENDIX C: Technical Notes
I. Survey Response Rates
Survey Response Rates*
YearSelf-Report
Rate YearSelf-Report
Rate
1967 97.3 1984 95.1
1968 97.6 1985 94.81969 96.6 1986 93.5
1970 98.1 1987 93.1
1971 97.5 1988 92.91972 97.3 1989 92.31973 97.5 1990 93.61974 94.2 1991 94.61975 97.3 1992 95.1
1976 97.2 1993 94.71977 96.6 1994 94.61978 96.3 1995 94.1
1979 96.4 1996 92.91980 96.2 1997 91.5
1981 95.7 1998 91.8
1982 . 95.3 1999 91.71983 95.5
* The rates for 1967-98 reflect late responses. The rate for 1999 may increase slightly in the next year ifadditional questionnaires are received after survey closure. Self-report rates for 1980-99 are determinedfrom the "source of response" indicator in the doctorate records. Because this indicator was not coded priorto 1980, survey forms for 1965-79 are assumed to be self-reported if "month signed" or "marital status" ispresent. "Marital status" is not available from sources other than the doctorate recipient.
As shown in the table above, 91.7 percent of 1999 U.S. research doctorate recipients
completed survey forms. This percentage is what has been referred to as the "self-report" rate.
For the remaining doctorate recipients, "skeleton" records were created using basic information
obtained from doctorate-granting institutions or from commencement programs. This skeleton
information includes Ph.D. institution, Ph.D. field, Ph.D. year, and sex of Ph.D. recipient. It
should be noted that the sex variable was not always available, even for survey respondents.
Every effort was made to obtain this information for as many respondents as possible, but for a
small percentage, this could not be done with confidence. Thus, you will notice that there are
missing data for many of the tabulations involving sex in this year's report. Prior to 1997,
whenever sex was missing, the data were assigned to "male." In 1997, it was decided to
107 133

discontinue this practice. The tabulations involving sex for 1997 through 1999 exclude missing
cases except where noted otherwise.
Wherever possible this report includes data from all Ph.D. records whether complete or
skeletal; thus the reported total number of Ph.D. recipients for 1999 (41,140) includes both
respondents and non-respondents. It should also be noted that, in keeping with the practice of
earlier data collection cycles, counts for previous years were corrected by the addition of data
from surveys received after the close of data collection for a given year.
II. Item Response Rates
The table on the following pages shows the response rates for each item in the Survey of
Earned Doctorates for 1989 through 1999. The numbers'and percentages shown in the tables and
figures in the body of the summary report are based only on the number of research doctorate
recipients who responded to the applicable survey items. For cross-tabulations, the response rate
for a given tabulation will be no greater than the lowest response rate for the items involved in
the tabulation.
For additional technical information on the Survey of Earned Doctorates, please contact
The Doctorate Data ProjectNational Opinion Research Center at the University of Chicago1155 East 60th StreetChicago, IL 60637
Phone: (312) 759-4031Email: 4800-sednorcmail.uchicago.edu
134108

II. IT
EM
RE
SP
ON
SE
RA
TE
S, 1
989-
1999
Var
iabl
e
Nam
eF
ield
1989
1990
1991
1992
1993
1994
1995
1996
1997
1998
1998
1999
(Pre
lim)
(Adj
uste
d)(P
relim
)
PH
DF
ICE
Ph.
D. F
ICE
Cod
e10
0.0
100.
010
0.0
100.
010
0.0
100.
010
0.0
100.
0N
AN
AN
AN
A
RA
CE
°R
ace/
Eth
nic
Gro
up (
Rec
oded
)90
.293
.995
.395
.696
.297
.697
.196
.493
.093
.393
.694
.8
PH
DE
NT
RY
Firs
t Gra
d. Y
ear
in P
h.D
. lns
tn.
NA
NA
NA
NA
86.9
86.7
86.5
85.5
79.0
83.3
83.6
85.7
SR
CE
1ED
bP
rimar
y S
ourc
e of
Sup
port
(E
dite
d)82
.578
.177
.669
.766
.272
.474
.987
.987
.888
.188
.589
.8
PD
WK
1ED
`P
rimar
y W
ork
Act
ivity
(E
dite
d)61
.456
.255
.955
.754
.756
.356
.660
.860
.360
.861
.160
.0
(92.
4)(8
3.8)
(83.
8)(8
3.5)
(83.
3)(8
6.1)
(86.
8)(9
3.3)
(92.
8)(9
3.0)
(93.
0)(9
4.9)
PD
WK
2Eff
Sec
onda
ry W
ork
Act
ivity
(E
dite
d)39
.239
.539
.537
.436
.738
.238
.448
.551
.752
.052
.249
.8
(58.
9)(5
8.9)
(59.
3)(5
6.0)
(55.
8)(5
8.4)
(58.
8)(7
4.4)
(79.
6)(7
9.7)
(79.
7)(7
8.8)
ED
FA
TH
ER
Fat
her's
Edu
catio
n88
.390
.892
.393
.192
.792
.792
.391
.489
.489
.489
.890
.3
ED
MO
TH
ER
Mot
her's
Edu
catio
n87
.590
.592
.293
.092
.692
.592
.191
.689
.689
.689
.990
.5
BIR
TH
YR
Yea
r of
Birt
h92
.496
.698
.297
.797
.398
.297
.596
.892
.892
.592
.794
.9
BIR
TH
PL
Pla
ce o
f Birt
h91
.892
.194
.195
.194
.994
.994
.593
.090
.590
.590
.891
.0
SE
XS
ex10
0.0
100.
099
.699
.499
.299
.699
.699
.599
.299
.699
.699
.5
MA
RIT
AL
Mar
ital S
tatu
s91
.091
.791
.592
.091
.691
.591
.091
.789
.289
.990
.290
.6
DE
PE
ND
SN
umbe
r of
Dep
ende
nts
85.8
90.0
89.5
89.8
89.8
89.7
89.4
89.5
88.2
88.4
88.7
88.9
CIT
IZC
itize
nshi
p92
.396
.297
.997
.697
.198
.297
.997
.094
.692
.795
.394
.8
CN
TR
YC
ITC
ount
ry o
f Citi
zens
hip
21.7
26.4
29.2
30.3
30.2
31.8
31.3
31.3
26.5
26.3
26.9
26.6
(90.
1)(9
7.2)
(98.
0)(9
8.5)
(98.
6)(9
9.3)
(99.
4)(9
8.5)
(95.
6)(9
2.9)
(94.
2)(9
6.1)
NO
TE
: NA
= n
ot a
vaila
ble.
The
per
cent
age
repr
esen
ts th
e ra
ce/e
thni
c gr
oups
sta
ndar
dly
repo
rted
by
the
Doc
tora
te D
ata
Pro
ject
; mul
tiple
and
"ot
her"
rac
es a
re e
xclu
ded.
b A
s of
FY
199
6, th
e pe
rcen
tage
incl
udes
rec
ipie
nts
who
sai
d th
ey h
ad n
o pr
imar
y so
urce
of s
uppo
rt.
The
per
cent
ages
on
the
first
line
are
bas
ed o
n th
e to
tal d
octo
ral c
ohor
t for
a fi
scal
yea
r. T
he p
erce
ntag
es o
n th
e se
cond
line
(en
clos
ed in
pare
nthe
ses)
are
base
d on
the
num
ber
of n
on-U
.S. c
itize
ns in
that
yea
r.
135
BE
ST C
OPY
AV
AIL
AB
LE
109
136

Var
iabl
e
Nam
eF
ield
1989
1990
1991
1992
1993
1994
1995
1996
1997
1998
1998
1999
(Pre
lim)
(Adj
uste
d) (
Pre
lim)
RA
C E
RA
Wa
Rac
e/E
thni
c G
roup
90.2
93.9
95.3
95.6
96.2
97.7
97.2
96.5
93.0
93.3
93.6
94.8
HA
ND
ICA
P"
Han
dica
p In
dic.
(in
cl. "
No"
from
198
9-pr
esen
t)
91.0
92.4
93.4
93.9
93.6
93.7
93.3
91.8
90.0
97.9
90.0
90.2
HS
PLA
CE
Pla
ce o
f Hig
h S
choo
l89
.890
.893
.594
.594
.093
.993
.592
.290
.190
.590
.891
.2
HS
YE
AR
Yea
r of
H.S
. Gra
duat
ion
88.5
90.5
90.9
92.1
92.1
91.7
91.6
90.5
89.0
93.8
94.0
90.3
JRC
OLL
Jr. C
oll.
Indi
c. (
incl
. "N
o")
89.1
90.8
92.0
92.7
92.9
92.5
92.4
90.6
91.4
99.9
91.8
91.6
RE
GN
UR
SE
`R
egis
tere
d N
urse
0.2
0.2
0.2
0.1
0.1
0.1
0.1
0.1
0.1
0.1
0.1
0.1
CE
PLA
CE
Pla
ce o
f Col
lege
Ent
ranc
e90
.390
.891
.892
.792
.892
.392
.190
.682
.590
.190
.490
.4
CE
YE
AR
Yea
r of
Col
lege
Ent
ranc
e89
.390
.191
.392
.291
.791
.591
.389
.182
.688
.488
.788
.9
BA
INS
TB
acca
laur
eate
Inst
itutio
n94
.495
.796
.596
.496
.396
.695
.894
.989
.090
.490
.691
.8
BA
FIE
LDF
ield
of B
acca
laur
eate
90.3
91.0
92.3
92.4
91.9
91.6
90.9
89.3
82.7
83.9
84.2
84.3
BA
YE
AR
Yea
r of
Bac
cala
urea
te93
.295
.095
.596
.095
.796
.295
.594
.788
.189
.990
.1-
91.6
BA
NO
NE
°N
o B
acca
laur
eate
/Mas
ter's
0.6
1.1
1.1
0.9
8.6d
9.1°
9.7d
11.4
°6.
9°8.
1d8.
1 d
8.0°
GE
YE
AR
Yea
r of
Gra
duat
e E
ntra
nce
88.2
86.6
89.4
89.5
88.6
88.2
87.4
85.7
77.3
81.1
81.3
84.6
MA
INS
TM
aste
r's In
stitu
tion
77.5
78.2
78.4
79.0
78.6
78.9
78.0
77.2
72.5
72.8
73.0
72.9
MA
FIE
LDF
ield
of M
aste
r's74
.675
.576
.377
.076
.176
.175
.374
.668
.770
.170
.470
.6
MA
YE
AR
Yea
r of
Mas
ter's
75.9
76.7
77.1
77.7
77.0
77.1
76.3
75.5
71.2
72.5
72.7
71.8
NO
TE
: NA
= n
ot a
vaila
ble.
° T
hepe
rcen
tage
rep
rese
nts
the
race
/eth
nic
grou
ps s
tand
ardl
y re
port
ed b
y th
e D
octo
rate
Dat
a P
roje
ct; m
ultip
le a
nd "
othe
r" r
aces
are
exc
lude
d.b
The
perc
enta
ges
from
198
5-19
88 r
epre
sent
the
num
bers
of P
h.D
.s w
ith h
andi
caps
. Beg
inni
ng in
198
9, th
e re
spon
se r
ates
incl
ude
Ph.
D.s
who
rep
orte
d "n
o"
hand
icap
. Not
e: T
he d
efin
ition
of "
hand
icap
ped"
was
muc
h m
ore
rest
rictiv
e in
199
0 an
d 19
91.
`Bec
ause
this
fiel
d is
not
app
licab
le to
all
doct
orat
e re
cipi
ents
, the
res
pons
e ra
te w
ill a
lway
s be
und
er 1
00%
.
d B
ecau
se th
is fi
eld
isno
t app
licab
le to
all
doct
orat
e re
cipi
ents
, the
res
pons
e ra
te w
ill a
lway
s be
und
er 1
00%
. Not
e; "
No
Bac
cala
urea
te/M
aste
r's"
repr
esen
ts
only
"no
bac
cala
urea
te"
from
198
3 to
199
2. B
egin
ning
in 1
993,
it in
dica
tes
that
the
Ph.
D. h
eld
no b
acca
laur
eate
and
/or
mas
ter's
deg
ree.
137
BE
ST C
OPY
AV
AIL
AB
LE
110
138

Var
iabl
e
Nam
eF
ield
1989
1990
1991
1992
1993
1994
1995
1996
1997
1998
1998
1999
(Pre
lim)
(Adj
uste
d) (
Pre
lim)
PR
OF
DE
Ga
Typ
e P
rofe
ssio
nal D
octo
rate
1.3
1.3
1.6
1.6
1.6
1.7
1.8
1.9
1.9
1.2
1.2
2.0
PR
OF
YE
AR
aY
ear
Pro
fess
iona
l Doc
tora
te1.
31.
31.
61.
51.
61.
71.
81.
91.
82.
82.
82.
8
PH
DIN
ST
Doc
tora
te In
stitu
tion
100.
010
0.0
100.
010
0.0
100.
010
0.0
100.
010
0.0
100.
010
0.0
100.
010
0.0
PH
DF
IELD
Fie
ld o
f Doc
tora
te10
0.0
100.
010
0.0
100.
010
0.0
100.
010
0.0
100.
010
0.0
100.
010
0.0
100.
0
PH
DC
YC
alen
dar
Yea
r of
Doc
tora
te10
0.0
100.
010
0.0
100.
010
0.0
100.
010
0.0
100.
010
0.0
100.
010
0.0
100.
0
PH
DM
ON
TH
Mon
th o
f Doc
tora
te10
0.0
100.
010
0.0
100.
010
0.0
100.
010
0.0
100.
010
0.0
100.
010
0.0
100.
0
PH
DF
YF
isca
l Yea
r of
Doc
tora
te10
0.0
100.
010
0.0
100.
010
0.0
100.
010
0.0
100.
010
0.0
106.
010
0.0
100.
0
PH
DT
YP
E1
Typ
e of
Doc
tora
te10
0.0
100.
010
0.0
100.
010
0.0
100.
010
0.0
100.
010
0.0
100.
010
0.0
100.
0
PH
DT
YP
E2a
App
lied
Res
earc
h D
octo
rate
2.8
2.6
2.3
2.4
2.4
2.7
2.5
2.2
1.0
1.0
1.0
1.4
TO
CE
BA
aT
ime
Out
CE
-BA
88.0
88.5
89.7
90.5
89.7
89.7
88.9
86.8
82.7
82.6
82.9
83.8
TO
BA
GE
aT
ime
Out
BA
-GE
88.3
86.6
89.5
89.6
88.6
88.2
87.4
85.7
77.3
81.1
81.3
84.6
TO
GE
MA
aT
ime
Out
GE
-MA
71.7
72.2
73.3
74.0
73.1
73.1
72.0
70.5
61.7
63.6
63.9
66.2
TO
MA
PH
Da
Tim
e O
ut M
A-P
h.D
.70
.165
.269
.971
.169
.970
.069
.068
.268
.065
.165
.366
.2
TO
GE
PH
DT
ime
Out
GE
-Ph.
D.
84.7
77.4
84.0
84.5
83.1
82.5
81.8
80.2
75.9
74.9
74.9
79.4
TIC
EP
HD
Tim
e In
CE
-Ph.
D.
84.1
76.7
83.4
84.3
83.0
82.9
82.4
80.9
75.7
78.0
78.3
79.6
YE
AR
SF
TF
ull-t
ime
enro
llmen
t69
.383
.173
.975
.775
.775
.274
.577
.182
.689
.489
.790
.2
YE
AR
SP
TP
art-
time
enro
llmen
t69
.3N
AN
AN
AN
AN
AN
AN
AN
AN
AN
AN
A
YE
AR
SO
UT
Not
enr
olle
d69
.3N
AN
AN
AN
AN
AN
AN
AN
AN
AN
AN
A
PH
DD
ISS
bF
ield
of D
isse
rtat
ion
89.8
NA
NA
65.0
b92
.793
.392
.492
.189
.189
.890
.190
.8
SR
CE
PR
IM`
Prim
ary
Sou
rce
of S
uppo
rt71
.775
.877
.769
.766
.172
.474
.987
.9`
87.8
88.2
88.6
89.8
DE
BT
IND
Deb
t Ind
icat
or (
incl
. "N
o")
90.9
92.2
93.1
93.3
92.8
92.8
92.4
91.1
NA
NA
NA
NA
PR
ES
TA
TP
redo
ctor
al S
tatu
s90
.792
.493
.593
.593
.193
.092
.691
.888
.289
.790
.090
.6
PD
OC
ST
AT
Pos
tdoc
tora
l Sta
tus
89.6
90.7
91.6
92.1
91.8
91.7
91.0
91.0
88.9
89.3
89.6
90.3
PD
OC
PLA
NP
ostd
octo
ral P
lans
89.4
91.3
92.1
92.5
92.4
92.4
91.9
91.2
87.0
87.6
87.9
89.1
NO
TE
: NA
= n
ot a
vaila
ble
a B
ecau
se th
is fi
eld
is n
ot a
pplic
able
to a
ll do
ctor
ate
reci
pien
ts, t
he r
espo
nse
rate
will
alw
ays
be u
nder
100
%.
b T
he p
erce
ntag
e w
as lo
w in
199
2 be
caus
e 28
% o
f the
Ph.
D.s
com
plet
ed e
arlie
r su
rvey
form
s th
at d
id n
ot r
eque
st fi
eld
of d
isse
rtat
ion.
`As
of F
Y 1
996,
the
perc
enta
ge in
clud
ed r
ecip
ient
s w
ho s
aid
they
had
no
prim
ary
sour
ce o
f sup
port
.
139
L,E
ST
CO
PY
AV
AIL
AB
LE14
0
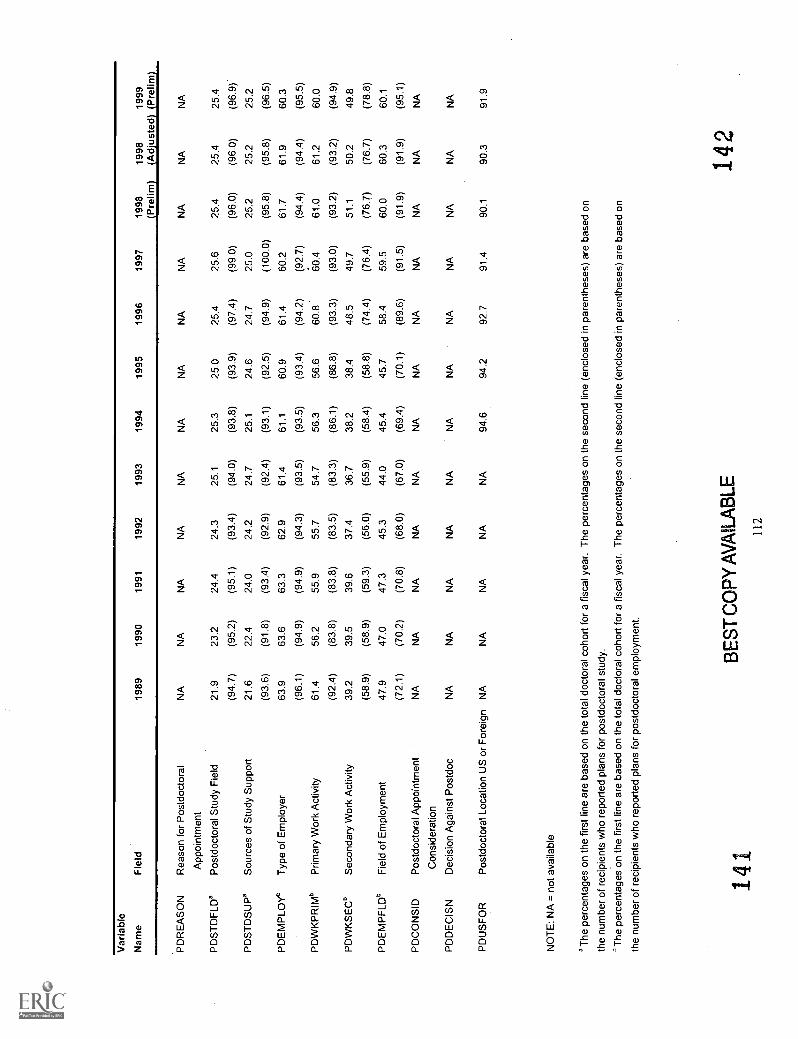
Var
iabl
e
Nam
eF
ield
1989
1990
1991
1992
1993
1994
1995
1996
1997
1998
(Pre
lim)
1998
1999
(Adj
uste
d) (
Pre
lim)
PD
RE
AS
ON
Rea
son
for
Pos
tdoc
tora
lN
AN
AN
AN
AN
AN
AN
AN
AN
AN
AN
AN
A
App
oint
men
t
PD
ST
DF
LIY
Pos
tdoc
tora
l Stu
dy F
ield
21.9
23.2
24.4
24.3
25.1
25.3
25.0
25.4
25.6
25.4
25.4
25.4
(94.
7)(9
5.2)
(95.
1)(9
3.4)
(94.
0)(9
3.8)
(93.
9)(9
7.4)
(99.
0)(9
6.0)
(96.
0)(9
6.9)
.
PD
ST
DS
UP
°S
ourc
es o
f Stu
dy S
uppo
rt21
.622
.424
.024
.224
.725
.124
.624
.725
.025
.225
.225
.2
(93.
6)(9
1.8)
(93.
4)(9
2.9)
(92.
4)(9
3.1)
(92.
5)(9
4.9)
(100
.0)
(95.
8)(9
5.8)
(96.
5)
PD
EM
PLO
Yb
Typ
e of
Em
ploy
er63
.963
.663
.362
.961
.461
.160
.961
.460
.261
.761
.960
.3
(96.
1)(9
4.9)
(94.
9)(9
4.3)
(93.
5)(9
3.5)
(93.
4)(9
4.2)
(92.
7)(9
4.4)
(94.
4)(9
5.5)
PD
WK
PR
IMb
Prim
ary
Wor
k A
ctiv
ity61
.456
.255
.955
.754
.756
.356
.660
.860
.461
.061
.260
.0
(92.
4)(8
3.8)
(83.
8)(8
3.5)
(83.
3)(8
6.1)
(86.
8)(9
3.3)
(93.
0)(9
3.2)
(93.
2)(9
4.9)
PD
WK
SE
Cb
Sec
onda
ry W
ork
Act
ivity
39.2
39.5
39.6
37.4
36.7
38.2
38.4
48.5
49.7
51.1
50.2
49.8
(58.
9)(5
8.9)
(59.
3)(5
6.0)
(55.
9)(5
8.4)
(58.
8)(7
4.4)
(76.
4)(7
6.7)
(76.
7)(7
8.8)
PD
EM
PF
LDb
Fie
ld o
f Em
ploy
men
t47
.947
.047
.345
.344
.045
.445
.758
.459
.560
.060
.360
.1
(72.
1)(7
0.2)
(70.
8)(6
8.0)
(67.
0)(6
9.4)
(70.
1)(8
9.6)
(91.
5)(9
1.9)
(91.
9)(9
5.1)
PD
CO
NS
IDP
ostd
octo
ral A
ppoi
ntm
ent
NA
NA
NA
NA
NA
NA
NA
NA
NA
NA
NA
NA
Con
side
ratio
n
PD
DE
CIS
ND
ecis
ion
Aga
inst
Pos
tdoc
NA
NA
NA
NA
NA
NA
NA
NA
NA
NA
NA
NA
PD
US
FO
RP
ostd
octo
ral L
ocat
ion
US
or
For
eign
NA
NA
NA
NA
NA
94.6
94.2
92.7
91.4
90.1
90.3
91.9
NO
TE
: NA
= n
ot a
vaila
ble
'The
per
cent
ages
on
the
first
line
are
bas
ed o
n th
e to
tal d
octo
ral c
ohor
t for
a fi
scal
yea
r. T
he p
erce
ntag
es o
n th
e se
cond
line
(en
clos
ed in
pare
nthe
ses)
are
bas
ed o
n
the
num
ber
of r
ecip
ient
s w
ho r
epor
ted
plan
s fo
r po
stdo
ctor
al s
tudy
.
'The
per
cent
ages
on
the
first
line
are
bas
ed o
n th
e to
tal d
octo
ral c
ohor
t for
a fi
scal
yea
r. T
he p
erce
ntag
es o
n th
e se
cond
line
(en
clos
ed in
pare
nthe
ses)
are
bas
ed o
n
the
num
ber
of r
ecip
ient
s w
ho r
epor
ted
plan
s fo
r po
stdo
ctor
al e
mpl
oym
ent.
141.
BE
ST
CO
PY
AV
AIL
AB
LE14
211
2

Ill. Derived Variables
The following derived variables deserve further explanation.
Postdoctoral Plans to Stay in the United States
Starting in 1997, the planned postdoctoral location of doctorate recipients was coded in a
new variable called PDLOC using FIPS codes for U.S. states and territories and countries.
Values of PDLOC less than 100 indicate a postdoctoral location in the United States.
Also beginning in 1997, a dichotomous variable, PDUSFOR, was created to index
whether the planned postdoctoral location reported by the respondent was in the United States or
in a foreign location.
For years prior to 1997, this variable is based on PDAFFIL. The first character of
PDAFFIL flags whether the respondent's planned postdoctoral location is in the United States; a
numeric character in this position indicates a United States location. Non-numeric values in the
first position of PDAFFIL (except "W') indicate non-U.S. locations. A value of "R" for
PDAFFIL signifies the respondent's refusal to provide information.
For the interested user, the following SAS code produces "USPLAN" as an index of
plans to stay in the United States following the doctorate using PDAFFILI (a variable created
using the first character of PDAFFIL).
USPLAN=2; /* Outside the U.S. */
if PDAFFILI in ("0"," I ","2""3","4","5""6","7","8","9")then USPLAN=1; /* U.S. */
if PDAFFIL1 eq "R" then USPLAN=.;
if PDAFFILI eq " " then USPLAN=.;
Firm Postdoctoral Plans
Postdoctoral plans are coded using the values of PDOCSTAT, which indicate that the
doctorate recipient's postdoctoral plans were definite at the time the survey was completed. That
is, codes 0, 1, or A on PDOCSTAT indicate that the respondent had definite postdoctoral plans,
"3 14 3

whereas codes 2, 3, and 4 indicate that the respondent was still seeking to determine postdoctoral
placement.
The following is the SAS code used to derive FIRMPLAN from PDOCSTAT :
if PDOCSTAT in ("0","1","A") then FIRMPLAN=1; /* Definite */
if PDOCSTAT in ( "2 ", "3 ", "4 ") FIRMPLAN=2; /* Seeking */
if PDOCSTAT eq " " then FIRMPLAN=.;
Firm Plans to Stay in the United States
This variable is derived from USPLAN and FIRMPLAN. A respondent is coded as
having firm plans to stay in the United States if the reported postdoctoral location was in the
United States and the reported postdoctoral plans were coded "definite."
The following is the SAS code that creates the variable FIRMUS from USPLAN and
FIRMPLAN as described above.
FIRMUS=2;
if (USPLAN eq 1 and FIRMPLAN eq 1) then FIRMUS=1;
if USPLAN eq . or FIRMPLAN eq . then FIRMUS=.;
Time to Doctorate
Total time to degree (TTD): TTD measures the total elapsed time between the
baccalaureate and the doctorate (including time not enrolled in school). TTD can be computed
only for individuals whose baccalaureate year is known. Baccalaureate year is often obtained
from commencement programs or doctorate institutions when not reported by the recipient.
Months are now included in the computation (see note below).
Registered time to degree (RTD): RTD gauges the time in attendance at colleges and
universities between receipt of the baccalaureate and the doctorate. Enrollment may include
years of attendance not related to a recipient's doctoral program. RTD can only be computed for
individuals who provided all years of college attendance after the baccalaureate. Months are now
included in the computation (see note below).
144114

Note about medians: The method of computing medians, beginning with Summary
Report 1994, is as follows. Months (of birth, baccalaureate, and doctorate) are included in the
calculations whenever available; if months are missing, only years are used in the calculations.
(However, medians are not computed for years prior to 1969 because doctorate month is
unavailable for all doctorate recipients.) Medians presented in previous summary reports were
based only on years. Some medians would be the same regardless of the method of computation,
but the new method generally computes slightly different results. While differences are small
(usually one- or two-tenths of a year), readers should consider these differences when comparing
medians presented in the report with those in earlier reports.
IV. Changes to the 1999 SED
Citizenship
In 1999, a new category was added to the variable CITIZ to identify non-U.S. citizens for
whom visa status was unknown. The new code frame for the data is as follows
Code Citizenship Category0 U.S. Native1 U.S. Naturalized Citizen2 Non-U.S. Immigrant (Permanent Resident)3 Non-U.S. Non-immigrant (Temporary Resident)4 Non-U.S., Visa Status UnknownBlank Missing/Citizenship Unknown
In 1999, a logical assignment to code 4 was made if all follow-up attempts for missing
citizenship were unsuccessful. The assignment was made for 1997, 1998, and 1999 records if
three out of four variables BIRTHPL, HSPLACE, EDPLACE, PDUSFOR were non-U.S.
locations. For the purposes of the tabulations in this report, code 4 was combined with code 3.
This is consistent with what was done in previous rounds and seems well justified by an
examination of the data. However, the existence of this new code will allow the data user to
exclude the cases for which visa status is unknown if desired. One should keep in mind that the
number of cases in this group (code 4) is not sufficient to warrant analysis as a separate group
(n=342).
145115

To match the numbers in this report, use the following code before analyzing citizenship:
/*RECODE CITIZ 4 */IF (CITIZ eq '4) THEN CITIZ ='3';
Birthplace, Country of Citizenship, and Postdoctoral Location
This is the first data cycle conducted after the unification of Hong Kong and the People's
Republic of China. However, because previous rounds report values for Birthplace, Country of
Citizenship, and Postdoctoral Location separately for these two locations, and because a number
of respondents still reported their country of citizenship as Hong Kong, it was decided to
continue to analyze these data separately. As a result, for the time being, in the tabulations of
the variables using country locations in this report, figures reported for China do not include
Hong Kong.
146116

APPENDIX D
Survey of Earned Doctorates QuestionnaireAcademic Year 1999
114717

First Name Middle Name Last Name Suffix (e.g., Jr.)
Cross reference: Birth name or former name legally changed
Survey of Earned Doctorates
July 1, 1998 to June 30, 1999
Conducted byThe National Opinion Research Center at the University of ChicagoforThe National Science FoundationThe National Institutes of HealthThe National Endowment for the HumanitiesThe U.S. Department of EducationThe U.S. Department of Agriculture
'fftv@hciirmyg,r;VICMTCLII
Tioli iT:'
Clui (PM.OrilW
Uktini019.D. I
'
1XQ p!t,f akwit,g airaff
e4,_.-OVEM CEO
148 RFRT enpv LIVAII API r
;r1f,

NA1 IONAL SCIENCE. FOUNDATION4201 WILSON BOULEVARD
ARLINGTON, VIRGINIA 22230
To theDoctorate Recipient:
Congratulations on earning a doctoral degree! This is an important accomplishment for you. Youraccomplishment is also significant for both this nation and others, as the new knowledge generated by researchdoctorates enhances the quality of life in this country and throughout the world. Because of the importance ofpersons earning research doctorates, several Federal agencieslisted on the coversponsor this Survey of EarnedDoctorates.
The basic purpose of this survey is to gather objective data about doctoral graduates. These data areimportant in improving graduate education both at your home institution and beyond. Often, decisions made bygovernmental and private agencies to develop new programs, or to support present ones, are based in part on the datadeveloped from this survey.
This form is distributed by the Graduate Deans and is filled out by all persons who have completed therequirements for a research doctoral degree. Please print your name on the cover if you have not already done so, andthen complete this questionnaire and return it to the Graduate Dean. The confidentiality of the information youprovide is carefully protected.
On behalf of the sponsoring Federal agencies, I thank you for your participation in this survey.
Bestwishes,
Jeanne E. GriffithDirector,Division of ScienceResources Studies

INSTRUCTIONS
Thank you for taking the time to complete this importantquestionnaire. Directions are provided for each question. Becausenot all questions will apply to everyone, you may be asked to skipcertain questions.
If you have not already done so, please print your name on thefront cover.
You may use either a pen or pencil.
When answering questions that require marking a box, please usean "X."
If you need to change an answer, please make sure that your oldanswer is either completely erased or clearly crossed out.
On pages 8 and 9 (inside the back cover) is a Specialties List forclassifying your field(s) of specialization in Questions A2, A10,B5, and B9.
Thanks again for your help; we really appreciate it.
150
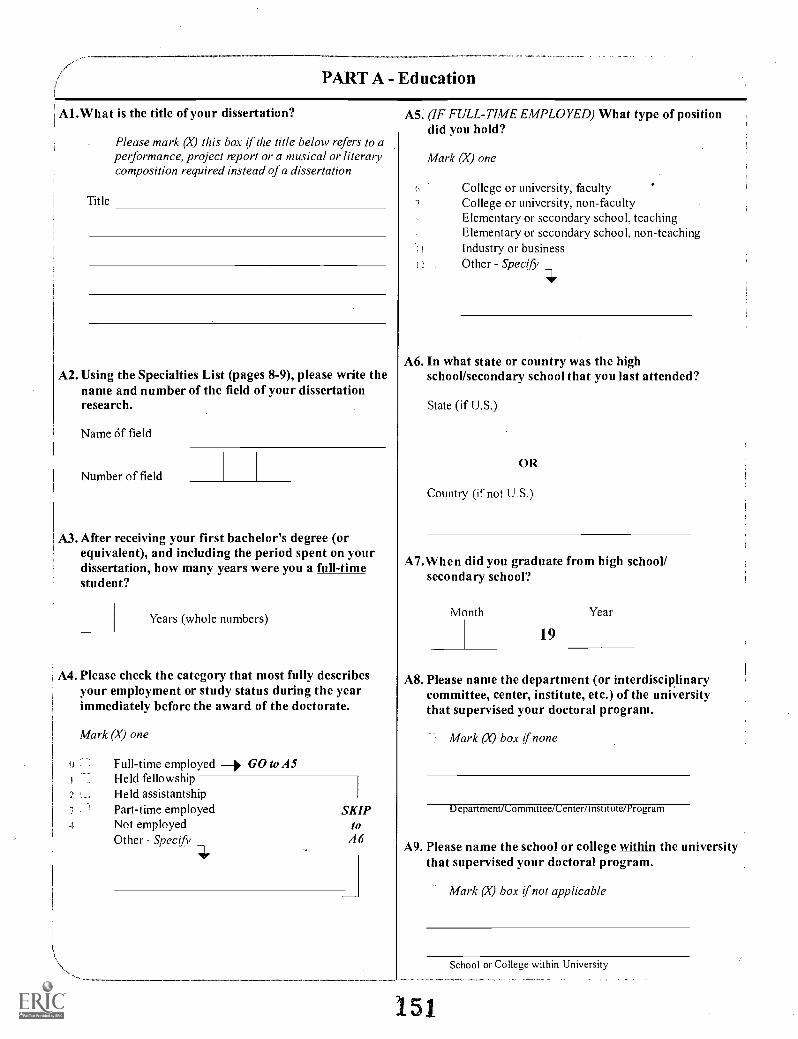
PART A - Education
A1.What is the title of your dissertation?
Title
Please mark M this box if the title below refers to aperformance, project report or a musical or literarycomposition required instead of a dissertation
A2. Using the Specialties List (pages 8-9), please write thename and number of the field of your dissertationresearch.
Name of field
Number of field
A3. After receiving your first bachelor's degree (orequivalent), and including the period spent on yourdissertation, how many years were you a full-timestudent?
Years (whole numbers)
A4. Please check the category that most fully describesyour employment or study status during the yearimmediately before the award of the doctorate.
4
Mark (X) one
Full-time employed 0 GO to A5Held fellowshipHeld assistantshipPart-time employed SKIPNot employed toOther Specift A6
A5. (IF FULL-TIME EMPLOYED) What type of positiondid you hold?
Mark (X) one
College or university, facultyCollege or university, non-facultyElementary or secondary school, teachingElementary or secondary school, non-teachingIndustry or businessOther - Specify
A6. In what state or country was the highschool/secondary school that you last attended?
State (if U.S.)
OR
Country (if not U.S.)
A7.When did you graduate from high school/secondary school?
Month Year
19
A8. Please name the department (or interdisciplinarycommittee, center, institute, etc.) of the universitythat supervised your doctoral program.
Mark (A) box if none
Department/Committee/C,enter/Institute/Program
A9. Please name the school or college within the universitythat supervised your doctoral program.
Mark (X) box if not applicable
School or College within University
151

A10. Please list below, chronologically, all colleges (including 2-year) and graduate institutions you have attendedand each degree earned (if any). Be sure to give the years attended for ALL institutions attended. Includeyour doctoral institution(s) and degree at the end.
Mark (X) box if bachelor's degree (or equivalent) was never received.
Mark (X) box if master's degree (or equivalent) was never received.
EXAMPLE Years Field of Study Degree (if any)Institution and Location Attended Use Specialties List, pages 8-9 Granted
Institution From To Field Name Number Title Mo. Yr. I.
Indian Institute of TechnologyBranch or City State or Province Country (if not U.S.) 88 90 Mechanical 345
EngineeringMadras India
I
Institution From To Field Name Number Title Mo. Yr.
University of CaliforniaMechanical
Branch or City State or Province Country (if not U.S.) 90 92 345 B.S. 6 92E
Berkeley CAEngineering
1
Years Field of Study Degree (if any)Institution and Location Attended Use Specialties List, pages 8-9 Granted
Institution From To Field Name Number Title Mo. Yr.
Branch or City State or Province Country (if not U.S.)
I
Institution From To Field Name Number Title Mo. Yr.
Branch or City State or Province Country (if not U.S.)
Institution From To Field Name Number Title Mo. Yr.
Branch or City State or Province Country (if not U.S.)
1
Institution From To Field Name Number Title Mo. Yr.
!
IBranch or City State or Province Country (if not U.S.)
I
Institution
Branch or City
Institution
Branch or City
State or Province Country (if not U.S.)
State or Province Country (if not U.S.)
From
From
To
To
Field Name
Field Name
Number Title
Number Title
Mo.
o.
Yr.
Yr.
If you have attended more than six institutions of higher education, please continue this list on the back cover.\ Be sure to include your doctoral institution.
1152BEST COPY AVAILABLE

All. Which of the following were sources of money tocover living and/or educational expenses during yourdoctoral programs?
Mark (X) Yes or No for each
a. Loans (from any source)
b. Foreign (non-U.S.) support
c. Fellowship, scholarship
d. Dissertation grant
e. Teaching assistantship
f. Research assistantship
g. Traineeship
h. Internship or residency
I. Personal savings
Other personal earnings during
graduate school
Spouse's, significant other's, or
family earnings or savings
I. Employer reimbursement/assistance
m. Other - Specify -r
k.
Yes No Don tKnow
11.1
II
I
I
I 2
Al2. Which TWO sources listed in All gave you the mostsupport?
Enter letters of primary and secondary sources
1. Primary source of support
Mark (X) if no primary source
2. Secondary source of support
Mark (X) if no secondary source
A13. When you receive your doctoral degree, how muchmoney will you owe that is directly related to yourundergraduate and/or graduate education (tuitionand fees, living expenses and supplies, transportationto and from school)?
u None
0
$5,000 or less
$5,001 -
$10,001
$15,001
$20,001
$25,001
$30,001
$10,000
$15,000
$20,000
$25,000
$30,000
or more
PART B - Postgraduation Plans
Bl. How definite are your immediate postgraduate plans?
Mark (X) one
Am returning to, or continuing in,predoctoral employment
; I Have signed contract or made definitecommitment for other work or study
; Am negotiating with one or morespecific organizations
GO toB2,
page 5
Am seeking position but have no specificprospects
I Other - Specify
SKIPto
B3,page 5
153

B2. Please name the organization and geographic locationwhere you will work or study.
Name
City State Country(if U.S.) (if not U.S.)
SKIPtoB4
B3. In what state or country do you intend to live aftergraduation?
Mark (X) one
o in U.S. --0 State
not in U.S. Country
B4. What best describes your immediate postgraduateplans?
Mark (X) one
o Postdoctoral fellowship.1 Postdoctoral research associateship
TraineeshipOther study - Specify
4 I Employment (other than 0,1,2,3)I Military service
(; I Other - SpecifySKIP
toB7
B5. Please use the Specialties List (pages 8-9) to enter thename and number of your postdoctoral field.
Name of field
Number of field
B6. What will be the main source of financial support foryour postdoctoral study/research?
Mark (X) one
O U.S. GovernmentCollege or universityPrivate foundationNonprofit, other than private foundation
4 Other - Specify
SKIPto
Cl,page 6
. ti EX Unknown
B7. For what type of employer will you be working?
Mark (X) one
EDUCATIONa U.S. 4-year college or university other than medical
schoolU.S. medical schoolU.S. junior or community collegeElementary or secondary schoolForeign institution
GOVERNMENTForeign governmentU.S. federal government
h 1 U.S. state governmentU.S. local government
PRIVATE SECTORI Nonprofit organization
t. .1 Industry or businessSelf-employed
OTHER
)1) 1 Other - Specify "r
B8. From the list below, please indicate what your primaryand secondary work activities will be by entering thenumbers of your selections in the appropriate boxes:
Enter numbers from below:
a. Primary Activity
b. Secondary Activity
0 Research and development1 Teaching2 Administration3 Professional services to individuals5 Other Specify
B9. Please use the Specialties List (pages 8-9) to enter thename and number of the field in which you will beworking.
Name of field
Number of field
154BEST COPY AVAILABLE
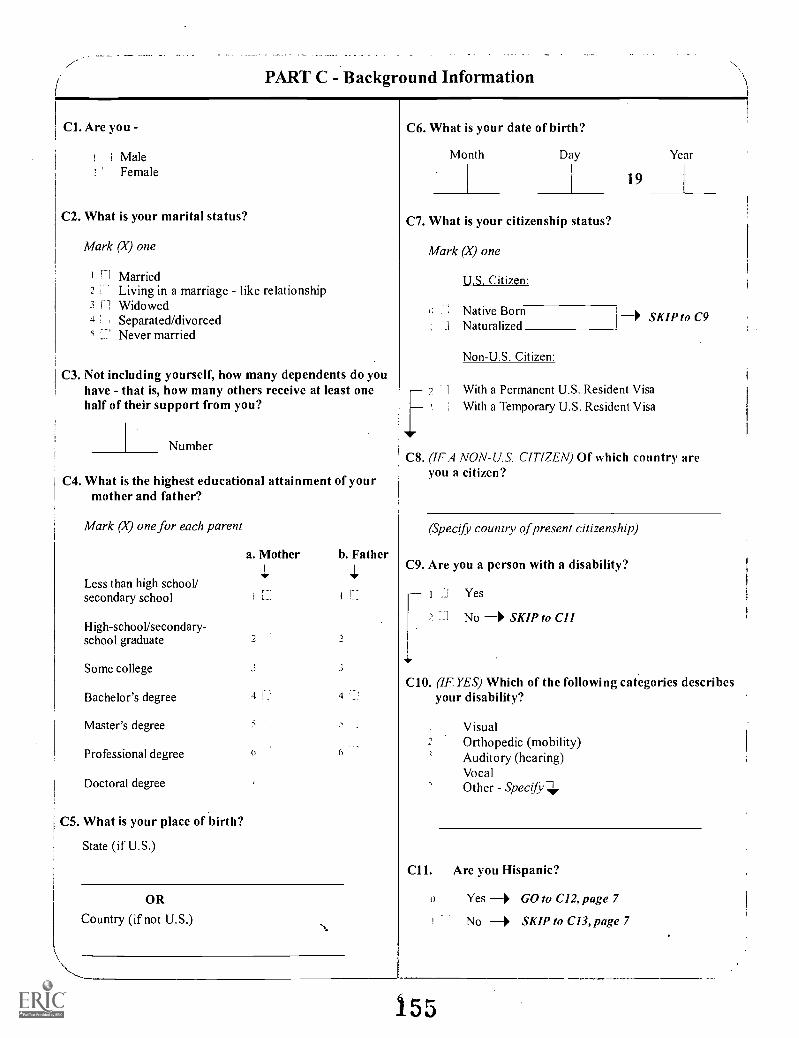
(PART C - Background Information
Cl. Are you -
MaleFemale
C2. What is your marital status?
Mark (X) one
1 1 MarriedLiving in a marriage - like relationship
3 ri Widowed4 Separated/divorced5 Never married
C3. Not including yourself, how many dependents do youhave - that is, how many others receive at least onehalf of their support from you?
Number
C4. What is the highest educational attainment of yourmother and father?
Mark (X) one for each parent
a. Mother b. Father
Less than high schooVsecondary school 1...:
High-school/secondary-school graduate
Some college
Bachelor's degree 4 I
Master's degree
Professional degree
Doctoral degree
CS. What is your place of birth?
State (if U.S.)
OR
Country (if not U.S.)
C6. What is your date of birth?
Month Day1
C7. What is your citizenship status?
Mark M one
U.S. Citizen:
Native Born_1 Naturalized
Non-U.S. Citizen:
19
Year
0 SKIP to C9
- 7, 1 With a Permanent U.S. Resident VisaWith a Temporary U.S. Resident Visa
C8. (IF A NON-U.S. CITIZEN) Of which country areyou a citizen?
(Specify country of present citizenship)
C9. Are you a person with a disability?
1 Yes
2 1 No SKIP to C11
C10. (IFYES) Which of the following categories describesyour disability?
VisualOrthopedic (mobility)Auditory (hearing)VocalOther - Specify4,
Cll. Are you Hispanic?
() Yes GO to C12, page 7
No SKIP to C13, page 7
155

C12. (IF YES TO C11) Which of the following describesyour Hispanic origin or descent?
o
...1
Mexican AmericanPuerto RicanOther Hispanic - Specify
C13. What is your racial background?
Mark (X) one
American Indian or Alaskan NativeAsian or Pacific Islander
2 : BlackWhite
C14. Please fill in your U.S. Social Security Number.
C15. In case we need to clarify some of the informationyou have provided, please list a telephone numberand e-mail address (if available) where you can bereached.
Daytime telephone
Evening telephone
E-mail address
C16. Because we are interested in how education relates to employment over time, we may be recontacting you. Tohelp us, please provide the name, address, and telephone number of one person who is likely to know whereyou can be reached. As with all information provided in this questionnaire, complete confidentiality will beprovided.
Care of (if applicable)
Number and Street
City/Town State or Province Zip Code or Postal Code
Country (if outside U.S.) Phone Number (including area or country code)
C17. Please sign and date.
Signature Date
Mark (X) box if you would like a summary of the results of this survey (available as funding permits).
Results of the Survey of Earned Doctorates can be found on the National Science Foundation's World Wide Webpage at http://www.nsf.gov/sbe/srs/stats.htm
Please use the back cover to make any additional comments you may have about this survey.
Thank you for completing the questionnaire. Please return it to the GRADUATE DEAN for forwarding to Survey ofI, Earned Doctorates, National Opinion Research Center at the University of Chicago, 1525 East 55th Street, Chicago,\IL 60615. Should you need to call us, our toll free number is 1-800-248-8649.
156

SPECIALTIES LIST
INSTRUCTIONS: The following field listing is to be used in responding to items A2, A 10, B5, and B9. If you choose a field marked with anasterisk (*), please write in your field of specialization in the space provided in those items.
AGRICULTURAL SCIENCES000002005010
1 012014055
I 019020025030039043044
1 046049050066068070072074079080098099
Agricultural EconomicsAgricultural Business & Mgmt.Animal Breeding & GeneticsAnimal NutritionDairy SciencePoultry ScienceFisheries Sci. & ManagementAnimal Sciences, Other*Agronomy & Crop SciencePlant B reeding & GeneticsPlant Pathology (See also 120)Plant Sciences, Other*Food EngineeringFood Sciences, Other*Soil Chemistry/MicrobiologySoil Sciences, Other*Horticulture ScienceForest BiologyForest EngineeringForest ManagementWood Sci. & Pulp/Paper Tech.Conserv./Renewable Natural Res.Forestry & Related Sci., Other*Wildlife/Range ManagementAgricultural Sci., GeneralAgricultural Sci., Other*
BIOLOGICAL SCIENCES100 Biochemistry103 Biomedical Sciences105 Biophysics107 Biotechnology Research110 Bacteriology115 PlantGenetics120 Plant.Pathology (See also 030)125 Plant Physiology129 Botany, Other*130 Anatomy133 Biometrics & Biostatistics136 Cell Biology (See also 154)139 Ecology142 Developmental Bio./Embryology145 Endocrinology148 Entomology151 Biological Immunology154 Molecular Biology157 Microbiology160 Neuroscience163 Nutritional Sciences166 Parasitology169 Toxicology170 Genetics, Human & Animal175 Pathology, Human & Animal
(See also 120)Pharmacology, Human & AnimalPhysiology, Human & Animal
180185,
189 Zoology, Other*198 Biological Sciences, General199 Biological Sciences, Other*
HEALTH SCIENCES200 Speech-Lang.
Pathology & Audiology210 Environmental Health212 Health Systems/Service Admin.215 Public Health220 Epidemiology (See also 133)222 Exercise Physiology/
Sci., Kinesiology230 Nursing240 Pharmacy 500245 Rehabilitation/Therapeutic Services 505250 Veterinary Medicine298 Health Sciences, General299 Health Sciences, Other*
435440445450455460465
498499
GeometryLogic (See also 785)Number TheoryMathematical StatisticsTopologyComputing Theory & PracticeOperations Research(See also 363, 930)Mathematics, GeneralMathematics, Other*
PHYSICAL SCIENCES
ENGINEERING300 Aerospace, Aeronaut. & Astronaut.303 Agricultural306 Bioengineering & Biomedical309 Ceramic Sciences312 Chemical315 Civil318 Communications321 Computer324 Electrical & Electronics327 Engineering Mechanics330 Engineering Physics333 Engineering Science336 Environmental Health Engineering339 Industrial & Manufacturing342 Materials Science345 Mechanical348 Metallurgical351 Mining & Mineral357 Nuclear360 Ocean363 Operations Research
(See also 465, 930)366 Petroleum369 Polymer & Plastics372 Systems398 Engineering, General399 Engineering, Other*
COMPUTER AND INFORMATIONSCIENCES
400 Computer Science410 Information Science & Systems*
MATHEMATICS420 Applied Mathematics425 Algebra430 Analysis & Functional Analysis
157
AstronomyAstronomyAstrophysics
Atmospheric Sci. and Meteorology510 Atmospheric Physics & Chemistry ;
512 Atmospheric Dynamics514 Meteorology518 Atmos. Sci./Meteorol., General519 Atmos. Sci./Meteorol., Other*
Chemistry520 Analytical522 Inorganic524 Nuclear526 Organic528 Medicinal/Pharmaceutical530 Physical532 Polymer534 Theoretical538 Chemistry, General539 Chemistry, Other*
(See 100 Biochemistry)
Geological & Related Sciences540 Geology542 Geochemistry544 Geophysics & Seismology546 Paleontology548 Mineralogy & Petrology550 Stratigraphy & Sedimentation552 Geomorphology & Glacial Geology558 Geolog. & Related Sci., General559 Geolog. & Related Sci., Other*
Physics560 Acoustics561 Chemical & Atomic/Molecular564 Elementary Particle566 Fluids568 Nuclear569 Optics570 Plasma & High-Temperature572 Polymer

SPECIALTIES LIST (continued)
574 Solid State & Low.-Temperature578 Physics, General579 Physics, Other*
Miscellaneous Physical Sciences580 Environmental Science585 Hydrology & Water Resources590 Oceanography595 Marine Sciences599 Misc. Physical Sciences, Other*
PSYCHOLOGY600603606609612613615618620621624627630633636639648
1649
ClinicalCognitive & PsycholinguisticsComparativeCounselingDevelopmental & ChildHuman/Indiv. & Family Devlpmt.ExperimentalEducational (See also 822)Family & Marriage CounselingIndust. & Organiz. (See also 935)PersonalityPhysiological/PsychobiologyPsychometricsQuantitativeSchool (See also 825)SocialPsychology, GeneralPsychology, Other*
SOCIAL SCIENCES650 Anthropology652 Area Studies658 Criminology662 Demography/Population Studies666 Economics668 Econometrics670 Geography674 International Relations/Affairs678 Political Sci. & Government682 Public Policy Analysis686 Sociology690 Statistics (See also 450)694 Urban Affairs/Studies698 Social Sciences, General699 Social Sciences, Other*
HUMANITIES
History700 History, American703 History, Asian705 History, European710 History/Philosophy of Sci. & Tech.718 History, General719 History, Other*
Letters720 Classics723 Comparative Literature729 Linguistics732 Literature,American733 Literature, English734 English Language736 Speech & Rhetorical Studies738 Letters, General739 Letters, Other*
Foreign Languages and Literature740 French743 German746 Italian749 Spanish752 Russian755 Slavic (other than Russian)758 Chinese762 Japanese765 Hebrew768 Arabic769 Other Languages & Literature*
Other Humanities770 American Studies773 Archeology776 Art History/Criticism/Conserv.780 Music785 Philosophy (See also 440)790 Religion (See also 984)795 Drama/Theater Arts798 Humanities, General799 Humanities, Other*
EDUCATION800 Curriculum & Instruction805 Educational Admin. & Supervision807 Educational Leadership810 Educ. /Instruct. Media Design815 Educ. Stat./Research Methods820 Educ. Assess./Test./Meas.822 Educ. Psychology (See also 618)825 School Psychology (See also 636)830 Social/Phil. Found. of Education835 Special Education840 Couns. Educ./Couns. & Guid. Serv.845 Higher Education/Eval. & Research
Teacher Education850 Pre-elementary/Early Childhood852 Elementary856 Secondary858 Adult & Continuing
Teaching Fields860 Agricultural Education861 Art Education862 Business Education
158
864 English Education866 Foreign Languages Education868 Health Education870 Home Economics Education872 Tech. & Indust. Arts Education874 Mathematics Education876 Music Education878 Nursing Education880 Physical Education & Coaching882 Reading Education884 Science Education885 Social Science Education887 Technical Education888 Trade & Industrial Education889 Teacher Educ., Specific Acad. &
Voc. Prog., Other*
Other Education898 Education, General899 Education, Other*
PROFESSIONAL FIELDS
Business Management andAdministrative Services
900 Accounting905 Banking/Financial Support Serv.910 Business Admin. & Management915 Business/Managerial Economics916 International Business917 Mgmt. Info. Sys./Bus. Data Proc.920 Marketing Management & Research930 Operations Research
(See also 363, 465)935 Organiz. Behavior (See also 621)938 Bus. Mgmt./Admin. Serv., Gen.939 Bus. Mgmt./Admin. Serv., Other*
Communications940 Communications Research947 Mass Communications957 Communication Theory958 Communications, General959 Communications, Other*
(See also 736)
Other Professional Fields960 Architec. Environ. Design964 Home Economics968 Law972 Library Science974 Parks/Rec./Leisure/Fitness976 Public Administration980 Social Work984 Theol./Religious Education
(See also 790)988 Professional Fields, General989 Professional Fields, Other*
OTHER FIELDS*999 Other

Comments About This Survey
Please return this questionnaire to your GRADUATE DEAN for forwarding toSurvey of Earned Doctorates, National Opinion Research Center at the University of Chicago,1525 East 55th Street, Chicago, IL 60615.Should you need to call us, our toll free number is 1-800-248-8649.
OFFICE USE ONLYCase ID: Instil. Code: Grad Date: Main Disp.:
PROCESSING
Receipt Editing CADE
Initials Date Initials Date Initials Date
Ver. Adjust Retrieval Updates
k Initials Date Initials Date Initials Date
..... _

APPENDIX E
Field Classification and Research Degree Titles
131 160

APPENDIX E: Field Classification and Research Degree Titles
The appendix tables present data according to the following field classifications. Appendix Tables A -1 and A-2 and Appendix Table B -1 display all subfields that
are on the survey Specialties List. Appendix Tables A -4. A-5. and A -6 show data by seven broad fields only. Appendix Tables A -3 and A -7 include the
additional field groupings indicated below.
SCIENCES
Physical Sciences (400-599)
Physics and Astronomy (500 -505, 560-579)
Chemistry (520-539)
Earth, Atmospheric, and Marine Sciences
(510-519, 540-559, 590-599)
Mathematics (420-499)
Computer Sciences (400410)
Engineering (300-399)
Combined in Table A -7
Life Sciences (000-299)
Biological Sciences (100 -199)
Biochemistry (100)
Other Biological Sciences (103 -199)
Health Sciences (200-299)
Agricultural Sciences (000 -099)
Social Sciences (600-699)
Psychology (600-649)
Economics and Econometrics (666, 668)
Anthropology and Sociology (650, 686)
Political Science and International Relations
(674,678)
Other Social Sciences
NONSCIENCES
Humanities (700-799)History (700-7 I 9)
English and American Language
and Literature (732 -734)
Foreign Languages and Literature
(740-769)Other Humanities
(720-729, 736-739. 770-799)
Education (800-899)
Professional and Other Fields (900-999Business and Management (900 -939)
Other Professional Fields (940 -989)
Other Fields (999)
Combined in Table A -7
NOTE: Doctorate recipients indicate their fields of specialty.
Their choices may differ from departmental names.
Combined in Table A -7
(652-662, 670, 672, 682, 690-699)
TITLES OF RESEARCH DEGREES INCLUDED IN THE SURVEY OF EARNED DOCTORATES
DA/DAT Doctor of Arts/Arts in Teaching DMM Doctor of Music Ministry
DArch Doctor of Architecture DMSc Doctor of Medical Science
DAS Doctor of Applied Science 1)NSc Doctor of Nursing Science
DBA Doctor of Business Administration DPA Doctor of Public Administration
DChem Doctor of Chemistry DPE Doctor of Physical Education
DCJ Doctor of Criminal Justice DPH Doctor of Public Health
DCL Doctor of Comparative Law/Civil Law DPS Doctor of Professional Studies
DCrim Doctor of Criminology DrDES Doctor of Design
DED Doctor of Environmental Design DRec/DR Doctor of Recreation
DEng Doctor of Engineering DSc/ScD Doctor of Science
DEnv Doctor of Environment DScD Doctor of Science in Dentistry'
DESc/ScDE Doctor of Engineering Science DScH Doctor of Science and Hygiene
DF Doctor of Forestry DScVM Doctor of Science in Veterinary Medicine
DFA Doctor of Fine Arts DSM Doctor of Sacred Music
DGS Doctor of Geological Science DSSc Doctor of Social Science
DM. Doctor of Hebrew Literature/Letters DSW Doctor of Social \York
DHS Doctor of Health and Safety EdD Doctor of Education
DHS Doctor of Hebrew Studies JCD Doctor of Canon Law
DIT Doctor of Industrial Technology JSD Doctor of Juristic Science
DLS Doctor of Library Science LScD Doctor of Science of Law
DM Doctor of Music PhD Doctor of Philosoph
DMA Doctor of Musical Arts RhD Doctor of Rehabilitation
DME Doctor of Musical Education SJI) Doctor of Juridical Science
DML Doctor of Modern Languages ThD Doctor of Theology
133 161 BEST COPYAVAILABLZ

NSF Publications from the Doctorate Data Project
1DATA BRIEFS ISSUE BRIEFS REPORTS
Healthy Economy Yields EvenLower Unemployment Rate forDoctoral Scientists and Engineers
Ph.D. Unemployment Trends: Causefor Alarm?
Science and Engineering DoctorateAwards: 1999
Doctorate Awards Declining inSome Science and EngineeringFields
What's Happening in the LaborMarket for Recent Science andEngineering Ph.D. Recipients?
Science and EngineeringDoctorates: 1960-91
Despite Increases, Women andMinorities Still Underrepresented inUndergraduate Science andEns ineerin Education .
Is the Gender Gap in UnemploymentDisappearing?
Characteristics of DoctoralScientists and Engineers in theU.S.: 1997
Doctoral Awards Increase in S&E,Overall, But Computer ScienceDeclines for First Time
What is Happening to AcademicEmployment of Scientists andEngineers?
Trend Tables on Doctoral Scientistsand Engineers in the U.S.: 1993-97(Web only)
Employment of Scientists andEngineers Reaches 3.2 Million in1995
International Mobility of Scientistsand Engineers to the United StatesBrain Drain or Brain Circulation
Who is Unemployed? FactorsAffecting Unemployment AmongIndividuals with Doctoral Degrees inScience and Engineering
Number of Doctoral Scientists andEngineers Grows by 6% Between1993 &1995
I What is the Debt Burden of NewScience and Engineering Ph.D.'s?
Science and Engineering StateProfiles: 1998
Data sources andpublications sources:
These publications contain data front1) the annual Survey of EarnedDoctorates(a universe survey on theeducation of research doctorates) or
2) the biennial Survey of DoctorateRecipients (a longitudinal samplesurvey of workforce characteristics).
Complete electronic information onthese surveys and publications may beobtained on the web at:www.nsfgov/sbetstats.htm.
Written reports may be ordered online I
(www.nsfgov/home/orderpub.htm)or by calling 301-947-2722.
For further information pleasecontact Susan T. Hill, Director,Doctorate Data Project,[email protected].
Are Forms of Financial. Support andEmployment Choices of RecentScience and Engineering Ph.D.'sRelated?
Doctoral Scientists and Engineers inthe U.S.:1997 Profile Tables
Does the Educational Debt Burden ofScience and Engineering DoctoratesDiffer by Race/Ethnicity and Sex?
Modes of Financial Support in theGraduate Education of S&EDoctorate Recipients
Degrees and Occupations inEngineering: How Do They Diverge?
Statistical Profiles of ForeignDoctoral Recipients in Science andEngineering: Plans to Stay in theUnited States
Has the Use of Postdocs Changed? .
_
Women, Minorities, and Personswith Disabilities in Science andEngineering: 2000Science and Engineering Degrees:1966-97
How Much Does the U.S. Rely onImmigrant Engineers?
What Follows PostdoctorateExperience? Employment Patterns of1993 Postdocs in 1995
Science and Engineering Degrees,by Race/Ethnicity of Recipients:1989-97
How Large is the Gap in Salaries ofMale and Female Engineers?
SESTAT: A Tool for StudyingScientists and Engineers in theUnited States
162

NORCUNIVERSITY OF CHICAGO
163

o
U.S. Department of EducationOffice of Educational Research and Improvement (OERI)
National Library of Education (NLE)
Educational Resources Information Center (ERIC)
NOTICE
Reproduction Basis
®
IC
This document is covered by a signed "Reproduction Release(Blanket)" form (on file within the ERIC system), encompassing allor classes of documents from its source organization and, therefore,does not require a "Specific Document" Release form.
This document is Federally-funded, or carries its own permission toreproduce, or is otherwise in the public domain and, therefore, maybe reproduced by ERIC without a signed Reproduction Release form(either "Specific Document" or "Blanket").
EFF-089 (3/2000)