reproductions supplied by edrs are the best that can be … o'hare, don crary, megan reynolds,...
TRANSCRIPT
ED 475 647
TITLE
INSTITUTIONSPONS AGENCYPUB DATENOTE
AVAILABLE FROM
PUB TYPE
EDRS PRICEDESCRIPTORS
IDENTIFIERS
ABSTRACT
DOCUMENT RESUME
PS 031 293
The State of Texas Children: 2003. Texas Kids Count.
Texas Univ., Austin. Center for Public Policy Priorities.Annie E. Casey Foundation, Baltimore, MD.2003-00-00104p.
Texas Kids Count, Center for Public Policy Priorities, 900Lydia Street, Austin, TX 78702. Tel: 512-320-0222; Fax: 512-320 -0227; e-mail: [email protected]; Web site:http://www.cppp.org/ kids count.
Numerical/Quantitative Data (110) Reports Descriptive(141)
EDRS Price MF01/PC05 Plus Postage.Birth Weight; Births to Single Women; Child Abuse; *ChildHealth; Child Neglect; Child Safety; Child Welfare;*Children; Counties; Dropout Rate; Early Parenthood;Educational Indicators; Elementary Secondary Education;Family Violence; Hunger; Infant Mortality; Infants; JuvenileJustice; Mortality Rate; Nutrition; One Parent Family;Poverty; *Social Indicators; Special Education; StateSurveys; Statistical Surveys; Substance Abuse; Violence;Welfare Recipients; *Well Being* Indicators; *Texas
This Kids Count report details trends in the well-being ofchildren in Texas. The statistical portrait is based on indicators in theareas of: (1) family and community population; (2) economic resources,security, and opportunity; (3) early care and education; (4) school success;(5) teens at risk; (6) physical, social, and emotional health; (7) hunger andnutrition; and (8) safety and personal security. Each of these core sectionsincludes descriptions of trend data for the state of Texas, as well as point-in-time comparisons among the six largest counties where the majority ofTexans live. County rankings for nine of the indicators are appended. Amongthe findings of the report are the following: (1) an increase in childrenliving in single-parent families, especially with single fathers; (2) anincrease in the number of children in subsidized child care; (3) a decreasein juvenile violent crime; (4) a decrease in teen pregnancy but an increasein births to single teens; (5) improvement in infant mortality but anincrease in low birth weight births; (6) decline in food stamp participationbut an increase in WIC program participation; and (7) an increase in numberof children in family violence shelters. (HTH)
Reproductions supplied by EDRS are the best that can be madefrom the original document.
A
7--
U.S
. DE
PA
RT
ME
NT
OF
ED
UC
AT
ION
--`
Offi
ce o
f Edu
catio
nal R
esea
rch
and
Impr
ovem
ent
ED
UC
AT
ION
AL
RE
SO
UR
CE
S IN
FO
RM
AT
ION
CE
NT
ER
(E
RIC
)T
his
docu
men
t has
bee
n re
prod
uced
as
ecei
ved
from
the
pers
on o
r or
gani
zatio
nor
igin
atin
g it.
Min
or c
hang
es h
ave
been
mad
e to
impr
ove
repr
oduc
tion
qual
ity.
Poi
nts
of v
iew
or
opin
ions
sta
ted
in th
isdo
cum
ent d
o no
t nec
essa
rily
repr
esen
tof
ficia
l OE
RI p
ositi
on o
r po
licy.
1
PE
RM
ISS
ION
TO
RE
PR
OD
UC
E A
ND
DIS
SE
MIN
AT
E T
HIS
MA
TE
RIA
L H
AS
BE
EN
GR
AN
TE
D B
Y
TO
TH
E E
DU
CA
TIO
NA
L R
ES
OU
RC
ES
INF
OR
MA
TIO
N C
EN
TE
R (
ER
IC)

AC
KN
OW
LED
GE
ME
NT
S
KID
S C
OU
NT
, a p
roje
ct o
f the
Ann
ie E
.
Cas
ey F
oLin
datio
n, is
a n
atio
nal a
nd
stat
e-by
-sta
te e
ffort
to tr
ack
the
stat
us
of c
hild
ren
in th
e U
nite
d S
tate
s. B
y pt
lo-
vidi
ng p
olic
ymqk
ers
and
citiz
ens
with
benc
hmar
ks o
f chi
ld W
ell-b
eing
, KID
S
CO
UN
T s
eeks
to e
nric
h lo
cal,
stat
e,
and
natio
nal d
iscu
ssio
ns c
once
rnin
g
way
s to
sec
ure
bette
r fu
ture
s fo
r al
l
child
ren.
The
Ann
ie E
. Cas
ey F
ound
atio
n
Nat
iona
l -K
IDS
CO
UN
T S
taff
NiV
illia
m O
'Har
e, D
on C
rary
,
Meg
an R
eyno
lds,
Cor
y,A
rider
son,
Fra
ncin
e B
row
n
TE
XA
S k
IDS
,CO
UN
T.
In th
e de
cade
sin
ce it
beg
an, T
exas
KID
S C
OU
NT
haS
sec
ured
. a u
niqu
e
and
inva
luab
le r
ole,
sup
port
ing
indi
vid-
uals
and
org
aniz
atio
ns in
thei
r ne
ed fo
r
obje
ctiv
e, r
elia
ble,
rel
evan
t and
tim
ely
data
on
the
circ
umst
ance
. s o
f chi
ldre
n
in c
omm
uniti
es th
roug
hout
the.
sta
te.
TH
E C
EN
TE
R F
OR
PU
BLI
CP
OLI
CY
PR
IOR
ITIE
S
The
Cen
ter
for
Pub
lic P
olic
y P
riorit
ies
is
a 50
1(c)
(3)
non-
pal-t
isan
, non
-pro
fit
polic
y re
sear
ch o
rgan
izat
ion
com
mitt
ed
to im
prov
ing
publ
ic p
olic
ies
and
priv
ate
prac
tices
that
influ
ence
the
econ
omic
and
soci
al p
rosp
ects
and
con
ditio
ns o
f
indi
vidu
als,
fam
ilies
, and
com
mun
ities
.
kis
coun
t

Dea
r R
eade
r,
A w
ise
pers
on o
nce
said
, "T
he s
eed
of a
ctio
n
is th
ough
t."
If th
is is
true
, the
n th
e co
nten
t and
dir
ectio
n of
our
thou
ghts
bec
ome
of s
upre
me
impo
rtan
ce.
We
also
kno
w th
at th
e pr
ecur
sor
of th
ough
ts is
know
ledg
e; w
ithou
t sol
id f
acts
and
cle
ar in
for-
mat
ion,
our
thou
ghts
will
be
jum
bled
, and
our
actio
ns c
haot
ic.
It is
on
this
phi
loso
phic
al
foun
datio
n th
at th
e C
ente
r fo
r Pu
blic
Pol
icy
Prio
ritie
s an
d T
exas
KID
S C
OU
NT
is b
uilt.
We
belie
ve th
at in
ord
er f
or a
bet
ter
wor
ld f
or
child
ren
to b
e re
aliz
ed, t
he h
ighe
st q
ualit
y
know
ledg
e m
ust b
e br
ough
t to
bear
. Sin
ce19
93, T
exas
KID
S C
OU
NT
has
col
lect
ed a
nd
mad
e pu
blic
the
mos
t com
preh
ensi
ve d
atab
ase
420
of in
dica
tors
on
child
wel
l-be
ing
in th
e st
ate.
But
this
info
rmat
ion
is n
ot c
olle
cted
mer
ely
to b
e co
llect
ed. I
t is
actu
ally
the
raw
mat
eria
lfr
om w
hich
sou
nd a
nd s
mar
t pub
lic p
olic
y
is m
ade.
In th
e ab
senc
e of
this
boo
k an
d its
com
pani
on
web
site
(fa
ctbo
ok.c
ppp.
org)
, it w
ould
be
next
to im
poss
ible
for
cou
ntie
s in
Tex
as to
kno
w
how
thei
r ch
ildre
n ar
e fa
ring
fro
m o
ne s
et o
f
year
s to
the
next
acr
oss
36 k
ey in
dica
tors
.It
wou
ld b
e di
ffic
ult t
o kn
ow w
hat t
ypes
of
pro-
gram
s an
d po
licie
s ar
e w
orki
ng, a
nd w
hich
ones
are
not
. And
with
out i
nfor
mat
ion
like
this
, how
can
Tex
as c
raft
pol
icy
that
trul
y
mee
ts th
e ne
eds
of it
s m
ost p
reci
ous
trea
sure
,
its c
hild
ren?
I in
vite
you
to e
xplo
re, e
njoy
, and
em
ploy
this
book
. I th
ink
you
will
fin
d it
an in
disp
ensa
ble
reso
urce
for
you
r w
ork,
a te
xt th
at y
ou r
efer
to
ofte
n fo
r w
ide
arra
y of
pur
pose
s. A
nd if
you
find
that
it is
use
ful,
cons
ider
giv
ing
to T
exas
KID
S C
OU
NT
. In
so d
oing
, you
will
hel
pgu
aran
tee
that
this
impo
rtan
t res
earc
h w
ill
cont
inue
into
the
futu
re.
Tha
nk y
ou f
or y
our
inte
rest
and
sup
port
.
Sinc
erel
y,
11A
F. S
cott
McC
own
Exe
cutiv
e D
irec
tor

FO
RE
WO
RD
In A
pril
1993
the
Cen
ter
for
Publ
ic P
olic
y
Prio
ritie
s an
d th
e C
hild
ren'
s D
efen
se F
und
of
Tex
as u
nvei
led
the
firs
t pro
duct
of
thei
r m
ajor
initi
ativ
e, a
col
labo
ratio
n kn
own
as T
exas
KID
S
CO
UN
T T
he S
tate
of
Tex
as C
hild
ren:
A C
ount
y
by C
ount
y Fa
ct B
ook
gave
pol
icy-
mak
ers,
jour
nal-
ists
, adv
ocat
es, c
omm
unity
lead
ers,
and
ser
vice
prov
ider
s th
e fi
rst-
ever
com
pila
tion
of d
ata
on
the
stat
us o
f ch
ildre
n in
eve
ry c
ount
y in
the
stat
e. W
ith th
e pu
blic
atio
n of
its
firs
t Fac
t Boo
k
ten
year
s ag
o, T
exas
KID
SCOUNT
join
ed a
grow
ing
netw
ork
of s
tate
KID
SCOUNT
proj
ects
spo
nsor
ed b
y th
e A
nnie
E. C
asey
Foun
datio
n. T
oday
the
orga
niza
tiona
l mem
-
bers
of
the
KID
SCOUNT
netw
ork
carr
y on
rese
arch
and
ana
lysi
s on
the
stat
us o
f ch
ildre
n
in e
very
sta
te in
the
natio
n an
d th
e D
istr
ict o
fC
olum
bia.
Ove
r th
e pa
st te
n ye
ars,
in a
dditi
on
to th
e pu
blic
atio
n of
num
erou
s re
port
s an
d
polic
y br
iefs
, the
net
wor
k of
KID
SCOUNT
part
ners
als
o ha
s es
tabl
ishe
d its
pre
senc
e as
a
sign
ific
ant s
ourc
e of
ele
ctro
nic
data
on
child
wel
l-be
ing,
ava
ilabl
e th
roug
h th
e In
tern
et.
With
the
rele
ase
of th
is r
epor
t, T
he S
tate
of
Tex
as C
hild
ren
2003
, Tex
as K
IDSCOUNT
mar
ks it
s te
nth
anni
vers
ary.
Sin
ce th
e pu
blic
a-
tion
of th
e fi
rst T
exas
KID
SCOUNT
Fact
Boo
k
a de
cade
ago
, the
sta
tus
of T
exas
chi
ldre
n ha
s
impr
oved
in m
any
area
s, w
hile
dec
linin
g in
othe
rs. L
ater
in th
is r
epor
t you
'll r
ead
abou
t
thes
e ch
ange
s an
d th
eir
impl
icat
ions
. Yet
, one
circ
umst
ance
that
was
true
in 1
993
rem
ains
so
toda
y. T
oo m
any
Tex
as c
hild
ren
face
sig
nifi
cant
hard
ship
s th
at u
nder
min
e th
eir
phys
ical
and
emot
iona
l hea
lth, t
heir
abi
lity
to le
arn
and
achi
eve,
and
thei
r pr
ospe
cts
of g
row
ing
into
prod
uctiv
e, f
ulfi
lled
adul
ts. A
s th
e m
ost c
om-
preh
ensi
ve p
rovi
der
of lo
ngitu
dina
l dat
a ac
ross
a ra
nge
of to
pics
impo
rtan
t to
the
wel
fare
of
Tex
as c
hild
ren,
Tex
as K
IDSCOUNT
info
rms
plan
ning
, acc
ount
abili
ty, a
nd a
dvoc
acy
to
ensu
re th
e bi
rthr
ight
of
ever
y T
exas
chi
ldeq
ual o
ppor
tuni
ty f
or a
fai
r st
art t
owar
d a
prom
isin
g fu
ture
.
Lon
gtim
e us
ers
of T
exas
KID
SCOUNT will
notic
e so
me
chan
ges
that
we
belie
ve w
ill m
ain-
tain
The
Sta
te o
f T
exas
Chi
ldre
n's
rele
vanc
e w
hile
at th
e sa
me
time
mak
ing
it ea
sier
to u
se a
nd
mor
e tim
ely
than
eve
r be
fore
.
Beg
inni
ng in
200
3, T
he S
tate
of
Tex
as C
hild
ren
will
shi
ft f
rom
bie
nnia
l to
annu
al p
ublic
atio
n.
With
this
cha
nge,
the
mos
t cur
rent
ava
ilabl
e
data
on
child
wel
l-be
ing
in T
exas
will
app
ear
in
prin
t mor
e qu
ickl
y an
d co
rres
pond
mor
e di
rect
-
ly to
the
evol
ving
pol
icy
clim
ate
and
actu
al
even
ts r
elev
ant t
o T
exas
chi
ldre
n an
d fa
mili
es.
With
this
edi
tion,
the
Fact
Boo
k w
ill n
o lo
nger
cont
ain
the
coun
ty-b
y-co
unty
pro
file
pag
es th
at
Tex
as K
IDS
CO
UN
T u
sers
hav
e co
me
to r
ec-
ogni
ze. A
lthou
gh th
e Fa
ct B
ook
will
no
long
er
cont
ain
them
, use
rs w
ho r
ely
upon
KID
S
CO
UN
T c
ount
y pr
ofile
s fo
r an
incl
usiv
e
over
view
of
the
stat
us o
f ch
ildre
n in
eac
h of
Tex
as' 2
54 c
ount
ies
still
will
be
able
to v
iew
and
dow
nloa
d th
ese
thro
ugh
Tex
as K
IDS
CO
UN
T O
nlin
e. T
he n
ew o
nlin
e co
unty
pro
file
s
feat
ure
a re
ader
-fri
endl
y fo
rmat
pre
sent
ing
base
year
, cur
rent
yea
r, c
ount
y ra
nk, a
nd p
erce
ntag
e

CD
chan
ge in
form
atio
n fo
r ea
ch T
exas
KID
S
CO
UN
T in
dica
tor,
alo
ng w
ith g
raph
s co
mpa
r-
ing
the
coun
ty's
pro
gres
s to
sta
tew
ide
figu
res
for
ever
y ite
m in
the
KID
S C
OU
NT
dat
abas
e.
For
seve
ral y
ears
now
, all
Tex
as K
IDS
CO
UN
T
indi
cato
rs h
ave
been
acc
essi
ble
thro
ugh
an
inte
ract
ive
data
base
at t
he T
exas
KID
S C
OU
NT
Onl
ine
page
(ht
tp://
kids
coun
t.cpp
p.or
g/
cfdi
r/ki
dsco
unt.c
fm)
mai
ntai
ned
on th
e C
ente
r
for
Publ
ic P
olic
y Pr
iori
ties
web
site
. In
the
past
year
, we'
ve c
ompl
eted
sig
nifi
cant
impr
ove-
men
ts to
this
con
veni
ent o
nlin
e to
ol. I
ndic
ator
s
have
bee
n up
date
d, n
avig
atio
n ha
s be
en
stre
amlin
ed, a
nd th
e pr
oces
s fo
r re
ques
ting
data
and
obt
aini
ng o
utpu
t has
bee
n re
desi
gned
.
The
inte
ract
ive
data
base
off
ers
Tex
as K
IDS
CO
UN
T u
sers
a s
erie
s of
ver
y pr
actic
al f
ea-
ture
s. B
ecau
se it
ope
rate
s in
tera
ctiv
ely,
the
onlin
e K
IDSCOUNT
data
base
per
mits
use
rs
to r
eque
st a
nd r
etri
eve
cust
omiz
ed d
ata
repo
rts
that
spe
cify
the
exac
t cou
ntie
s, in
dica
tors
, and
year
s of
inte
rest
, alo
ng w
ith c
ompa
rativ
e in
for-
mat
ion
for
the
stat
e of
Tex
as a
s a
who
le if
desi
red.
Sin
ce w
e co
ntin
ually
add
to it
as
new
indi
cato
r da
ta b
ecom
es a
vaila
ble
from
sou
rce
agen
cies
, the
onl
ine
data
base
gua
rant
ees
Tex
as
KID
SCOUNT
user
s th
e m
ost c
urre
nt in
for-
mat
ion
avai
labl
e on
the
rang
e of
topi
cs
addr
esse
d by
Tex
as K
IDSCOUNT.
Ove
r th
epa
st s
ever
al y
ears
, we'
ve h
eard
fro
m r
esid
ents
thro
ugho
ut T
exas
who
acc
ess
KID
S C
OU
NT
data
pri
mar
ily th
roug
h ou
r w
ebsi
te. W
e
enco
urag
e re
ader
s w
ho h
aven
't tr
ied
or r
arel
y
use
Tex
as K
IDSCOUNT's
onlin
e da
taba
se to
expl
ore
its f
eatu
res.
Exp
erie
nced
use
rs p
roba
bly
will
not
ice
our
reor
gani
zatio
n of
Tex
as K
IDSCOUNT
data
into
eig
ht m
ajor
cat
egor
iese
ach
repr
esen
ted
by a
cor
e se
ctio
n in
The
Sta
te o
f T
exas
Chi
ldre
n
2003
that
enc
ompa
ss m
ajor
fac
tors
rel
evan
tto
the
phys
ical
, edu
catio
nal,
soci
al, a
nd e
mo-
tiona
l wel
fare
of
Tex
as c
hild
ren
from
infa
ncy
thro
ugh
adol
esce
nce.
A n
umbe
r of
indi
cato
rs,
such
as
infa
nt m
orta
lity,
chi
ld p
over
ty, a
nd te
en
preg
nanc
y, r
epre
sent
out
com
es a
ctua
lly e
xper
i-
ence
d by
chi
ldre
n an
d th
eir
fam
ilies
in th
e
MK
LIN
UK
U
stat
e. A
noth
er s
erie
s of
KID
SCOUNT
indi
ca-
tors
doc
umen
t the
use
of
soci
al s
ervi
ces,
suc
h as
Med
icai
d an
d th
e C
hild
ren'
s H
ealth
Ins
uran
ce
Prog
ram
(C
HIP
) th
at to
geth
er p
rovi
de a
cri
ti-
cal s
afet
y ne
t for
Tex
as c
hild
ren
and
fam
ilies
in
need
. A th
ird
grou
p of
indi
cato
rs, m
ostly
dem
ogra
phic
info
rmat
ion
such
as
tota
l pop
ula-
tion
and
child
pop
ulat
ion
coun
ts, o
ffer
s in
sigh
t
into
the
cont
extu
al f
acto
rs th
at in
flue
nce
the
circ
umst
ance
s an
d pr
ospe
cts
of o
ur c
hild
ren,
thei
r fa
mili
es, a
nd o
ur c
omm
uniti
es. A
lthou
gh
we
have
reo
rgan
ized
and
ren
amed
cat
egor
ies
of
KID
SCOUNT
data
, use
rs w
ho r
ely
on th
ese
item
s to
doc
umen
t lon
gitu
dina
l tre
nds
shou
ld
know
that
the
KID
SCOUNT
data
base
stil
l
incl
udes
the
sam
e sp
ecif
ic in
dica
tors
that
we
have
trad
ition
ally
rep
orte
d. E
ach
core
sec
tion
of
The
Sta
te o
f T
exas
Chi
ldre
n 20
03 a
lso
intr
oduc
es
read
ers
to a
n em
ergi
ng to
pic
in r
esea
rch
and
anal
ysis
on
child
wel
l-be
ings
uch
as f
amily
stre
ngth
s, c
hild
and
teen
men
tal h
ealth
, and
teen
citi
zens
hipt
hat w
e vi
ew a
s im
port
ant,
but f
or w
hich
no
met
hodo
logi
cally
sou
nd c
oun-
ty-l
evel
dat
a ye
t exi
sts.

"The
re is
no
task
mor
e im
port
ant,
than
bui
ldin
g a
wor
ld in
whi
ch a
ll of
our
chi
ldre
n ca
n gr
ow u
p to
rea
lize
thei
r fu
ll
pote
ntia
l in
heal
th, p
eace
, and
dig
nity
."
U.N
. Sec
reta
ry G
ener
al K
ofi A
nnan
TE
XA
S K
IDS
CO
UN
TD
AV
A C
AV
EG
OR
NE
S
o F
amily
& C
omm
unity
Pop
ulat
ion
o E
cono
mic
Res
ourc
es,
Sec
urity
& O
ppor
tuni
ty
o E
arly
Car
e &
Edu
catio
n
13S
choo
l Suc
cess
a T
eens
At R
isk
o P
hysi
cal,
Soc
ial &
Em
otio
nal H
ealth
o H
unge
r &
Nut
ritio
n
El S
afet
y &
Per
sona
l Sec
urity
The
res
t of
this
rep
ort b
egin
s w
ith a
n E
xecu
tive
Sum
mar
y hi
ghlig
htin
g m
ajor
fin
ding
s re
flec
ted
in th
e m
ost c
urre
nt T
exas
KID
S C
OU
NT
dat
a.
The
eig
ht c
ore
sect
ions
, cor
resp
ondi
ng to
the
eigh
t pri
mar
y T
exas
KID
S C
OU
NT
dat
a ca
te-
gori
es, f
ollo
w. E
ach
of th
ese
core
sec
tions
giv
es
back
grou
nd o
n its
topi
cal s
igni
fica
nce
for
Tex
as
child
ren,
then
hig
hlig
hts
our
anal
ysis
of
KID
S
CO
UN
T d
ata
for
Tex
as a
nd e
ach
of it
s la
rges
t
urba
n co
untie
s. T
he S
tate
of
Tex
as C
hild
ren
2003
conc
lude
s w
ith a
ser
ies
of a
ppen
dice
s th
at o
ffer
coun
ty r
anki
ngs
on a
cor
e se
t of
Tex
as K
IDS
CO
UN
T in
dica
tors
.
Ove
r th
e pa
st d
ecad
e T
exas
has
exp
erie
nced
dram
atic
gro
wth
in b
oth
the
size
and
div
ersi
ty
of it
s po
pula
tion.
Dur
ing
this
tim
e th
e st
ate
witn
esse
d bo
th u
npar
alle
led
pros
peri
ty a
nd th
e
hard
ship
s of
eco
nom
ic b
ust.
Alo
ngsi
de e
vent
s
of th
e m
ost p
rofo
und
hist
oric
al s
igni
fica
nce,
the
ever
yday
life
of
Tex
ans
has
gone
on.
In
1993
,
we
wro
te o
f th
e st
ate
of T
exas
chi
ldre
n:
Man
y {o
f ou
r} c
hild
ren
are
born
with
mul
tiple
stri
kes
agai
nst t
hem
: poo
r he
alth
and
nut
ritio
n as
infa
nts,
few
dev
elop
men
tal s
timul
i, no
pos
itive
and
appr
opri
ate
role
mod
els,
pat
tern
s of
phy
sica
l and
emot
iona
l abu
se, a
nd m
ore.
Man
y of
thes
e ha
ndic
aps
in tu
rn r
esul
t fro
m p
over
ty, a
con
ditio
n w
hich
affl
icts
one
in f
our
Tex
as c
hild
ren.
The
live
s of
thes
e
child
ren
coul
d ha
ve tu
rned
out
dif
fere
ntly
.
Des
pite
som
e im
prov
emen
ts s
ince
we
firs
tpu
blis
hed
thes
e w
ords
, in
2003
ver
y lit
tle
abou
t the
m f
unda
men
tally
has
cha
nged
. Ten
year
s he
nce,
we
hope
that
the
wor
k of
Tex
as
KID
S C
OU
NT
, with
the
effo
rts
of a
ll co
n-
cern
ed T
exan
s, w
ill m
ake
them
obs
olet
e.
Day
na F
inet
, Ph.
D.
Dir
ecto
r, T
exas
KID
S C
OU
NT

EX
EC
UT
IVE
SU
MM
AR
Y
The
Tex
as K
IDS
CO
UN
T d
atab
ase,
cont
ains
eigh
t dat
a ca
tego
ries
, 35
indi
cato
rs a
bout
hal
fw
ith m
ultip
le le
vels
---f
or,te
n ye
ars
and
254
coun
ties.
In
our
anal
ysis
of
this
siz
able
col
lec-
tion
for
,The
Sta
te o
f T
exas
Chi
ldre
n 20
03, w
e
wan
ted
to d
o tw
o th
ings
. Fir
st, w
e w
ante
d to
find
as
man
y di
ffer
ent w
ays
of f
indi
ng m
eani
ng
in th
e da
ta a
s w
e co
uld,
bot
h fo
r th
e st
ate
ofT
exas
and
-for
the
loca
l reg
ions
that
we
ana-
lyze
d. A
nd s
econ
d, w
e w
ante
d to
coh
eren
tly
repo
rt o
n w
hat w
e fo
und,
so
that
rea
ders
of
this
docu
men
t cou
ld r
eadi
ly in
terp
ret o
ur c
oncl
u-
sion
s. I
n ea
ch o
f th
e re
port
's c
ore
sect
ions
,
you'
ll fi
nd o
ur d
escr
iptio
n of
tren
d da
ta f
or th
e
stat
e of
Tex
as a
s a
who
le. W
e al
so p
rese
nt
poin
t-in
-tim
e co
mpa
riso
ns a
mon
g th
e si
x
larg
est c
ount
iesB
exar
, Dal
las,
El P
aso,
Har
ris,
Tar
rant
, and
Tra
visw
here
the
vast
maj
ority
of
Tex
ans
live.
Fin
ally
, we
outli
ne
chan
ges,
for
Tex
as a
nd th
ese
coun
ties,
on
the
arra
y of
Tex
as K
IDS
CO
UN
T in
dica
tors
. Her
e
are
our
conc
lusi
ons
abou
t the
sta
te o
f T
exas
child
ren.
Co
FA
MIL
Y &
CO
MM
UN
ITY
PO
PU
LAT
ION
An
Agi
ng a
nd M
ore
Div
erse
Tex
as
Mor
e C
hild
ren
in S
ingl
e-Pa
rent
Fam
ilies
,E
spec
ially
Sin
gle
Dad
s
Fost
er C
are
Plac
emen
ts R
ise
Sign
ific
antly
EC
ON
OM
IC R
ES
OU
RC
ES
,S
EC
UR
ITY
& O
PP
OR
TU
NIT
YC
hild
Pov
erty
Dec
lines
But
Ineq
uitie
s R
emai
n
Ris
ing
Inco
mes
Not
Ful
ly R
efle
cted
in th
eT
exas
Pov
erty
Rat
e
Une
mpl
oym
ent R
ises
Sin
ce 2
000
Few
Poo
r T
exas
Chi
ldre
n R
ecei
ve P
ublic
Ass
ista
nce
EA
RLY
CA
RE
& E
DU
CA
TIO
NM
ore
Chi
ldre
n on
Sta
te S
ubsi
dize
d C
are
Subs
tant
ial G
row
th in
Pub
licPr
e-K
inde
rgar
ten
SCH
OO
L S
UC
CE
SS
Tex
as D
ropo
ut a
nd E
quiv
alen
cy R
ates
Fal
l
TA
AS
Scor
es I
mpr
ove
Acr
oss
All
Subj
ect A
reas
Mor
e St
uden
ts R
ecei
ving
Spe
cial
Edu
catio
nan
d B
iling
ual S
ervi
ces
TE
EN
S A
T R
ISK
Juve
nile
Vio
lent
Cri
me
Dow
n Fr
omM
id-1
990s
Pea
k
A w.!
Tee
n Pr
egna
ncy
Dow
n Sl
ight
ly B
ut B
irth
s T
oSi
ngle
Tee
ns I
ncre
ase
Subs
tant
ially
Afr
ican
Am
eric
an T
eens
Lea
d D
eclin
e in
Ove
rall
Preg
nanc
y R
ate
Bir
ths
to S
ingl
e W
hite
and
His
pani
c T
eens
Incr
ease
PH
YS
ICA
L, S
OC
IAL
&E
MO
TIO
NA
L H
EA
LTH
Impr
ovem
ent i
n In
fant
Mor
talit
y W
hile
Low
Bir
th W
eigh
t Bir
ths
Get
Wor
se
Inad
equa
te P
rena
tal C
are
Dro
ps O
vera
ll, B
utU
p Sl
ight
ly I
n L
ate
1990
s
Chi
ld M
edic
aid
Enr
ollm
ents
Dec
line
Whi
leC
HIP
Par
ticip
atio
n So
ars
HU
NG
ER
& N
UT
RIT
ION
Dec
line
in F
ood
Stam
p Pa
rtic
ipat
ion
Out
pace
sIm
prov
emen
t in
Pove
rty
Rat
e
WIC
Pro
gram
Usa
ge U
p
Free
and
Red
uced
-Pri
ce L
unch
Pro
gram
Ser
ves
Hal
f of
Tex
as' S
choo
l Stu
dent
s
SAFE
TY
& P
ER
SON
AL
SE
CU
RIT
Y
Chi
ld A
buse
Dec
lines
, The
n R
ises
Aga
in
Dea
th R
ate
Dec
lines
For
Tex
as T
eens
, Les
s Fo
rT
exas
Chi
ldre
n
Rac
ial D
ispa
rity
in C
hild
Dea
ths
Pers
ists
, But
Impr
oves
for
Tee
n V
iole
nt D
eath
s
Ove
rall,
Mor
e C
hild
ren
in F
amily
Vio
lenc
eSh
elte
rs

UA
BL
E O
P C
ON
'EN
L_
Lette
r fr
om th
e E
xecu
tive
S c
tion
3: E
arly
Car
e &
Dire
ctor
For
ewor
d
Exe
cutiv
e S
umm
ary
Sec
tion
1: F
amily
&C
omm
unity
Pop
ulat
ion
ectio
n 2:
Eco
nom
icR
esou
rces
, Sec
urity
& O
ppor
tuni
ty
Edu
catio
n
Se-
Ictio
n 4:
Sch
ool S
ucce
ss
fictio
n 5:
Tee
ns A
t Ris
k
`-S
ectio
n 6:
Phy
sica
l, S
ocia
l &E
mot
iona
l Hea
lth
tion
7: H
unge
r &
Nut
ritio
n
Sec
tion
8: S
afet
y &
Per
sona
l Sec
urity
ata
Doc
umen
tatio
n
4ppe
ndix
lEnd
note
s

2,
I

Sec
tion
1:Fa
miD
y L
Com
mun
ity P
opui
latio
nC
hild
ren'
s liv
es b
egin
with
thei
r en
try
into
the
intr
icat
e hu
man
env
ironm
ents
of f
amily
and
com
mun
ity. F
rom
birt
h fo
rwar
d, o
ther
peo
ple
both
fam
ily a
nd s
tran
gers
affe
ct c
hild
ren'
s
lives
in a
lmos
tev
ery
imag
inab
le w
ay.
2
PO
PU
LAT
ION
CH
AN
GE
IN T
EX
AS
Tex
as c
hild
ren
toda
y ar
e gr
owin
g up
as
mem
-be
rs o
f th
e la
rges
t, m
ost d
iver
se p
opul
atio
n
the
stat
e ha
s ev
er k
now
n. T
exas
has
alw
ays
expe
rien
ced
rela
tivel
y ra
pid
grow
th. I
n ev
ery
deca
de s
ince
Tex
as b
ecam
e a
stat
e an
d co
ntin
-
uing
on
into
the
pres
ent,
the
incr
ease
in th
est
ate'
s po
pula
tion
has
exce
eded
the
rate
of
popu
latio
n gr
owth
for
the
natio
n as
a w
hole
'
the
2000
Cen
sus
reve
aled
a 2
2.8%
gro
wth
rat
e
in T
exas
com
pare
d to
a U
.S. p
opul
atio
n in
crea
se
of 1
3.2%
. The
yea
rs b
etw
een
1990
and
200
0w
itnes
sed
the
stat
e's
larg
est n
umer
ical
pop
ula-
tion
incr
ease
eve
r, a
s th
e T
exas
pop
ulac
e ro
se b
y
alm
ost 3
.9 m
illio
n pe
ople
. With
the
rele
ase
of
resu
lts f
rom
the
2000
Cen
sus,
Tex
as o
ffic
ially
beca
me
the
natio
n's
seco
nd-l
arge
st s
tate
,
follo
win
g C
alif
orni
a.
In th
e la
st d
ecad
e, p
opul
atio
n in
crea
sed
in
ever
y on
e of
the
stat
e's
27 m
etro
polit
an s
tatis
-tic
al a
reas
. The
reg
ion
alon
g th
e T
exas
-Mex
ico
bord
er, t
he c
entr
al T
exas
cor
rido
r be
twee
n
Dal
las-
Fort
Wor
th a
nd S
an A
nton
io, a
nd th
eH
oust
on-G
alve
ston
are
a sa
w th
e hi
ghes
t rat
es
of g
row
th, w
hile
the
Panh
andl
e, W
est T
exas
,
and
the
area
aro
und
Bea
umon
t-Po
rt A
rthu
rgr
ew le
ast.
Des
pite
its
vast
rur
al g
eogr
aphy
,
the
stat
e's
popu
latio
n is
larg
ely
urba
n.
In 2
000,
onl
y 15
.2%
of
Tex
ans
lived
in n
on-m
etro
polit
an
coun
ties
whi
le m
etro
polit
an
coun
ties
clai
med
84.
8% o
f th
e
stat
e's
popu
latio
n. D
urin
g th
e19
90's
the
stat
e's
rura
l-ur
ban
gap
wid
ened
, as
met
ropo
litan
cou
ntie
s re
ceiv
ed
91.2
% o
f T
exas
' ove
rall
popu
latio
n gr
owth
,
com
pare
d to
just
8.8
% f
or n
on-m
etro
polit
anco
untie
s.'
Whi
te
Afr
ican
-Am
eric
an
Oth
er
His
pani
c
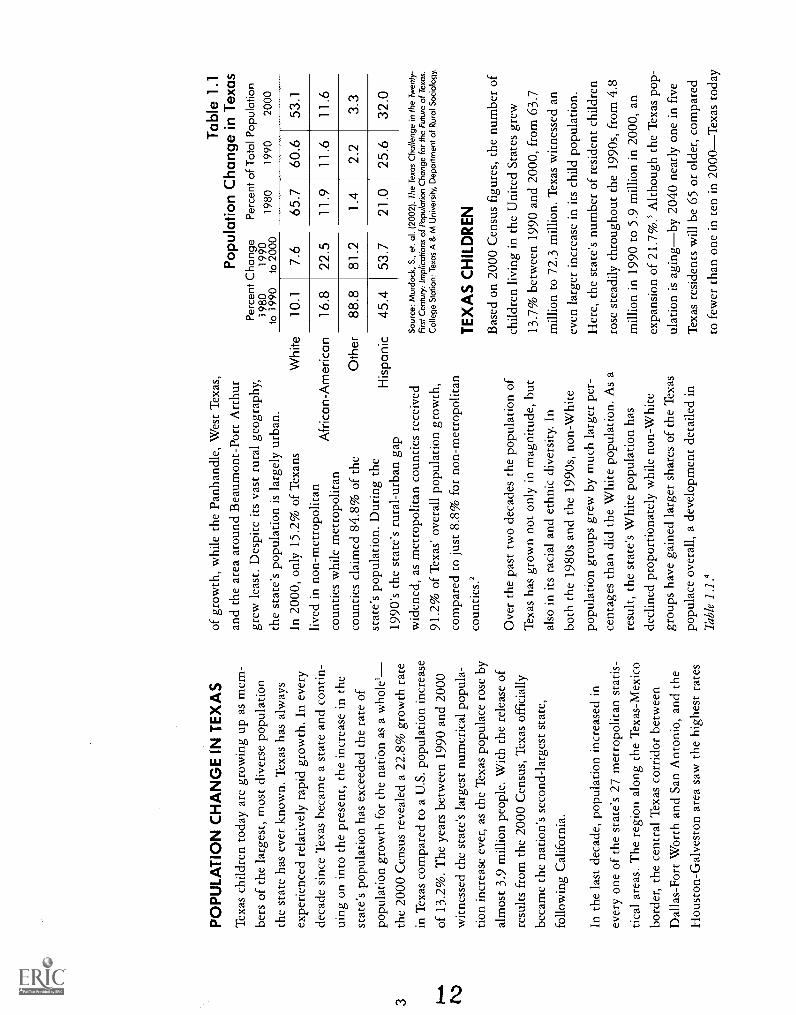
Ove
r th
e pa
st tw
o de
cade
s th
e po
pula
tion
ofT
exas
has
gro
wn
not o
nly
in m
agni
tude
, but
also
in it
s ra
cial
and
eth
nic
dive
rsity
. In
both
the
1980
s an
d th
e 19
90s,
non
-Whi
tepo
pula
tion
grou
ps g
rew
by
muc
h la
rger
per
-
cent
ages
than
did
the
Whi
te p
opul
atio
n. A
s a
resu
lt, th
e st
ate'
s W
hite
pop
ulat
ion
has
decl
ined
pro
port
iona
tely
whi
le n
on-W
hite
grou
ps h
ave
gain
ed la
rger
sha
res
of th
e T
exas
popu
lace
ove
rall,
a d
evel
opm
ent d
etai
led
in
Tab
le 1
.1.4
Tab
le 1
.1P
opul
atio
n C
hang
e in
Tex
asP
erce
nt C
hang
eP
erce
nt o
f Tot
al P
opul
atio
n19
8019
9019
8019
9020
00to
199
0to
200
0
10.1
7.6
65.7
60.6
53.1
16.8
22.5
11.9
11.6
11.6
88.8
81.2
1.4
2.2
3.3
45.4
53.7
21.0
25.6
32.0
Sou
rce:
Mur
dock
, S.,
et. a
l. (2
002)
. The
Tex
as C
halle
nge
in th
e T
wen
ty-
Firs
t Cen
tury
: Im
plic
atio
ns o
f Pop
ulat
ion
Cha
nge
for
the
Fut
ure
of T
exas
.C
olle
ge S
tatio
n: T
exas
A &
M U
nive
rsity
, Dep
artm
ent o
f Rur
al S
ocio
logy
.
TE
XA
S C
HIL
DR
EN
Bas
ed o
n 20
00 C
ensu
s fi
gure
s, th
e nu
mbe
r of
child
ren
livin
g in
the
Uni
ted
Stat
es g
rew
13.7
% b
etw
een
1990
and
200
0, f
rom
63.
7
mill
ion
to 7
2.3
mill
ion.
Tex
as w
itnes
sed
an
even
larg
er in
crea
se in
its
child
pop
ulat
ion.
Her
e, th
e st
ate'
s nu
mbe
r of
res
iden
t chi
ldre
n
rose
ste
adily
thro
ugho
ut th
e 19
90s,
fro
m 4
.8
mill
ion
in 1
990
to 5
.9 m
illio
n in
200
0, a
nex
pans
ion
of 2
1.7%
.5 A
lthou
gh th
e T
exas
pop
-
ulat
ion
is a
ging
-by
2040
nea
rly
one
in f
ive
Tex
as r
esid
ents
will
be
65 o
r ol
der,
com
pare
d
to f
ewer
than
one
in te
n in
200
0-T
exas
toda
y

CA
.)
\V/
rem
ains
you
nger
than
the
natio
n ov
eral
l, w
ith
a m
edia
n ag
e of
32.
3 ye
ars
com
pare
d to
the
natio
nal m
edia
n ag
e of
35.
3 ye
ars.
'
As
the
natio
n's
child
pop
ulat
ion
incr
ease
d in
size
, its
div
ersi
ty a
lso
grew
, fue
led
by th
e dr
a-
mat
ic in
crea
se in
His
pani
c re
side
nts.
Tex
as
even
mor
e pr
ofou
ndly
exp
erie
nced
this
tren
d,
due
to c
ontr
ary
patte
rns
of c
hang
e in
the
stat
e's
Whi
te a
nd H
ispa
nic
child
pop
ulat
ions
.W
hile
the
prop
ortio
n of
Whi
te c
hild
ren
inT
exas
dec
lined
fro
m 5
1% in
199
0 to
43%
in20
00, t
he p
ropo
rtio
n of
His
pani
c ch
ildre
n
grew
fro
m 3
4% to
41%
ove
r th
e sa
me
peri
od.
The
per
cent
age
of A
fric
an-A
mer
ican
chi
ldre
n
decl
ined
slig
htly
, fro
m 1
3% to
12%
, bet
wee
n
1990
and
200
0.' A
s a
resu
lt, il
lust
rate
d in
Tab
le 1
.2, a
lthou
gh W
hite
per
sons
rem
aine
d
the
maj
ority
rac
ial g
roup
am
ong
adul
ts in
Tex
as, W
hite
chi
ldre
n no
long
er c
ount
ed a
s
the
maj
ority
am
ong
Tex
ans
unde
r ag
e 18
.
IFF
riM
OU
ES
ON
TI
NS
OT
EIO
N
Chi
ldre
n ra
ised
in s
ingl
e-pa
rent
fam
ilies
can
and
do s
ucce
ed. A
bsol
ute
diff
eren
ces
betw
een
V
mea
sure
s of
wel
l-be
ing
for
thes
e ch
ildre
n an
d
for
child
ren
from
two-
pare
nt h
ouse
hold
s ar
e
smal
l. Y
et o
ne-p
aren
t fam
ilies
fac
e m
ore
rest
rict
ed e
cono
mic
, soc
ial,
emot
iona
l, an
d
prac
tical
res
ourc
es c
ompa
red
to tw
o-pa
rent
hous
ehol
ds. T
hese
res
ourc
e lim
itatio
ns c
an
leav
e th
e ch
ildre
n of
one
-par
ent f
amili
es a
t a
rela
tive
disa
dvan
tage
, eve
ntua
lly le
adin
g to
acad
emic
and
beh
avio
ral p
robl
ems.
'
Tab
le 1
.2P
erce
ntag
e of
Pop
ulat
ion,
200
0
Chi
ldA
dult
Whi
te42
.656
.3
Afr
ican
-Am
eric
an12
.410
.9
Oth
er4.
44.
2
His
pani
c40
.528
.6
Sou
rce:
U.S
. Bur
eau
of th
e C
ensu
s, 2
000
and
Ann
.e E
. Cas
eyF
ound
atio
n (2
001)
. KID
S C
OU
NT
Dat
a B
ook
2001
: Sta
te P
rofil
es o
fC
hild
Wel
l-Bei
ng. B
altim
ore:
Ann
ie E
. Cas
ey F
ound
atio
n.
The
nat
ion'
s ri
sing
pro
port
ion
of s
ingl
e-pa
rent
fam
ilies
rep
rese
nts
one
of r
ecen
t dec
ades
' mos
t
sign
ific
ant d
emog
raph
ic tr
ends
. In
1950
, onl
y
\V/
{D
/A\
II
I
7.2%
of
all f
amili
es w
ith c
hild
ren
wer
e he
aded
by a
sin
gle
mot
her
or f
athe
r. B
y 20
00, s
ingl
e-
pare
nt f
amili
es h
ad in
crea
sed
alm
ost 3
00%
to
acco
unt f
or 2
8.2%
of
all f
amili
es w
ith c
hild
ren.
The
pro
port
ion
of s
ingl
e-pa
rent
fam
ilies
gre
w
mos
t, by
59%
, dur
ing
the
1970
s. A
lthou
gh
both
the
num
ber
and
shar
e of
sin
gle-
pare
nt
fam
ilies
has
con
tinue
d to
ris
e, th
e ra
te o
f
incr
ease
has
dec
lined
. Bet
wee
n 19
90 a
nd 2
000,
the
prop
ortio
n of
all
fam
ilies
hea
ded
by a
sin
gle
pare
nt g
rew
by
just
17.
9%, t
he s
ame
rate
of
incr
ease
exp
erie
nced
dur
ing
the
1950
s.9
Seve
ral
deca
des
ago
sing
le p
aren
thoo
d m
ost c
omm
only
resu
lted
from
div
orce
. Sin
ce 1
980,
a d
ram
atic
incr
ease
in b
irth
s to
unm
arri
ed w
omen
, rep
re-
sent
ing
abou
t one
-thi
rd o
f al
l bir
ths
in 2
000,
alon
g w
ith a
dro
p in
the
birt
h ra
te f
or m
arri
edw
omen
, pri
mar
ily a
ccou
nts
for
grow
th in
the
prop
ortio
n of
fam
ilies
hea
ded
by a
sin
gle
par-
ent.'
Alth
ough
sin
gle-
mot
her
fam
ilies
stil
l far
outn
umbe
r si
ngle
fat
her
ones
, the
per
cent
age
incr
ease
in s
ingl
e fa
ther
fam
ilies
has
exc
eede
d
the
prop
ortio
nal g
row
th in
sin
gle-
mot
her
fam
i-
lies,
bot
h in
the
1950
-200
0 pe
riod
and
for
the
mos
t rec
ent d
ecad
e be
twee
n 19
90 a
nd 2
000.
"
WH
AT
TE
XA
S K
IDS
CO
UN
TS
AY
S A
BO
UT
FA
MIL
Y &
CO
MM
UN
ITY
PO
PU
LAT
ION
FA
MIL
Y &
CO
MM
UN
ITY
PO
PU
LAT
ION
IND
ICA
TO
RS
Tot
al P
opul
atio
n19
9020
01
Tot
al C
hild
Pop
ulat
ion
1990
2001
Chi
ld P
opul
atio
n B
y A
ge G
roup
1990
2001
Fam
ilies
With
Chi
ldre
n19
90 a
nd 2
000
Chi
ldre
n in
Fos
ter
Car
e19
9020
02
AN
AG
ING
AN
D M
OR
ED
IVE
RS
E T
EX
AS
By
2001
, the
est
imat
ed p
opul
atio
n of
Tex
as
had
grow
n to
ove
r 21
.3 m
illio
n pe
ople
, an
incr
ease
of
25.5
% s
ince
199
0. T
he s
tate
's c
hild
popu
latio
n gr
ew b
y a
som
ewha
t sm
alle
r23
.4%
, num
beri
ng a
n es
timat
ed 5
.9 m
illio
n in
2001
. As
a re
sult,
chi
ldre
n re
pres
ente
d a
smal
ler
prop
ortio
n of
the
popu
latio
n (2
7.9%
)
in 2
001
than
in 1
990
(28.
4%).
Old
er a
gegr
oups
in th
e ch
ild p
opul
atio
n sa
w a
mor
e
sign
ific
ant e
xpan
sion
dur
ing
the
1990
s th
andi
d yo
unge
r ag
e gr
oups
. Whi
le th
e 12
- to
14-y
ear-
old
and
15-
to 1
7-ye
ar-o
ld g
roup
sea
ch in
crea
sed
by c
lose
to 3
1%, t
he n
umbe
r of
child
ren
aged
zer
o to
fiv
e ye
ars
grew
by
18.3
%an
d th
e gr
oup
of c
hild
ren
aged
six
thro
ugh
elev
en in
crea
sed
21.7
%.
The
se tr
ends
tow
ard
an a
ging
Tex
as h
ave
impo
rtan
t im
plic
atio
ns f
or th
e fu
ture
of
the
stat
e. W
ithin
sev
eral
dec
ades
, a s
mal
ler
popu
-
latio
n ba
se o
f yo
ung
and
mid
dle-
aged
wor
king
3.0
2.5
2.0
1.5
1.0
0.5
0.0
adul
ts w
ill n
eed
to p
rovi
de th
e ec
onom
ic
foun
datio
n to
sup
port
a g
row
ing
popu
latio
n of
elde
rly
Tex
ans.
Inv
estm
ents
mad
e no
w in
the
heal
th, e
duca
tion,
eco
nom
ic s
ecur
ity, a
nd p
er-
sona
l saf
ety
of o
ur c
hild
ren
are
cruc
ial i
f th
ey
are
to r
ealiz
e th
eir
pote
ntia
l to
cont
ribu
te f
ully
to th
e ec
onom
ic v
italit
y an
d ov
eral
l qua
lity
of
life
in T
exas
sev
eral
dec
ades
fro
m n
ow.
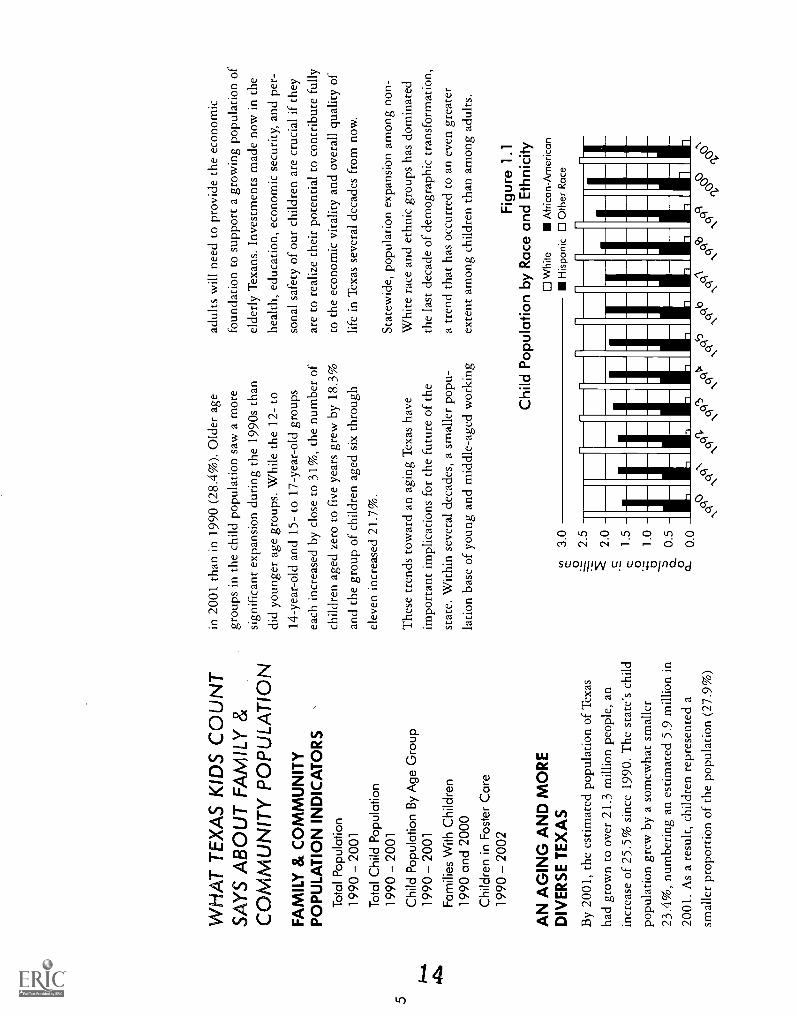
Stat
ewid
e, p
opul
atio
n ex
pans
ion
amon
g no
n-W
hite
rac
e an
d et
hnic
gro
ups
has
dom
inat
edth
e la
st d
ecad
e of
dem
ogra
phic
tran
sfor
mat
ion,
a tr
end
that
has
occ
urre
d to
an
even
gre
ater
exte
nt a
mon
g ch
ildre
n th
an a
mon
g ad
ults
.
Fig
ure
1.1
Chi
ld P
opul
atio
n by
Rac
e an
d E
thni
city
Whi
teA
fric
an-A
mer
ican
His
pani
cO
ther
Rac
e_
__
/A\
\V/
Bot
h in
the
tota
l pop
ulat
ion
and
amon
g ch
il-dr
en, t
he n
umbe
r of
Whi
te T
exan
s gr
ew le
ss
than
any
oth
er r
ace
or e
thni
c gr
oupb
y8.
6% a
nd 3
.7%
, res
pect
ivel
ybet
wee
n 19
90an
d 20
01. T
houg
h th
e ab
solu
te n
umbe
r of
Lead
ing
this
dem
ogra
phic
shi
ft ha
sbe
en s
izea
ble
expa
nsio
n of
Tex
as'
His
pani
c po
pula
tion,
par
ticul
arly
amon
g ch
ildre
n in
the
stat
e.
peop
le c
ount
ed in
Oth
er R
ace
grou
ps r
emai
na
com
para
tivel
y sm
all p
ropo
rtio
n of
the
Tex
as
popu
lace
, inc
reas
es o
f 92
.1%
for
the
tota
l pop
-
ulat
ion
and
66.2
% a
mon
g ch
ildre
n ou
tpac
edpe
rcen
tage
gai
ns f
or a
ny o
ther
rac
e or
eth
nic
grou
p in
the
stat
e si
nce
1990
. Lea
ding
this
dem
ogra
phic
shi
ft h
as b
een
size
able
exp
ansi
on
of T
exas
' His
pani
c po
pula
tion,
par
ticul
arly
amon
g ch
ildre
n in
the
stat
e, a
ste
ady
rise
illus
-
trat
ed in
Fig
ure
1.1.
Sinc
e 19
90, c
hang
es in
the
raci
al a
nd e
thni
c
com
posi
tion
of th
e st
ate'
s m
ost p
opul
ous
coun
-
ties
have
dif
fere
d so
mew
hat f
rom
shi
fts
in th
e
popu
latio
n of
Tex
as a
s a
who
le, a
nd th
e co
un-
VL
k'
ties
also
hav
e ex
peri
ence
d co
mpa
rativ
ely
dive
r-
gent
pat
tern
s of
cha
nge
amon
g th
emse
lves
.T
ravi
s C
ount
y's
over
all p
opul
atio
n gr
owth
of
44.8
% w
as n
earl
y tw
ice
the
stat
e's
25.5
% p
op-
ulat
ion
incr
ease
and
exc
eede
d th
e ri
se in
tota
l
popu
latio
n of
eac
h of
Tex
as' o
ther
fiv
e la
rges
t
coun
ties.
El P
aso,
Bex
ar, D
alla
s, a
nd H
arri
s
Cou
ntie
s ex
peri
ence
d sm
alle
r pe
rcen
tage
pop
u-la
tion
gain
s th
an th
e st
ate
as a
who
le, w
ith E
l
Paso
Cou
nty
grow
ing
leas
t, by
16.
3%.
Cha
nges
in th
e ch
ild p
opul
atio
ns o
f th
e si
x
larg
est T
exas
cou
ntie
s m
irro
red
shif
ts in
thei
r
popu
latio
ns o
vera
ll. T
ravi
s C
ount
y's
child
pop
u-
latio
n gr
ew m
ost,
at 4
2.7%
, com
pare
d to
the
stat
e, w
hich
exp
erie
nced
a 2
3.4%
incr
ease
in it
s
num
ber
of r
esid
ent c
hild
ren.
In
com
pari
son,
the
child
pop
ulat
ion
of E
l Pas
o C
ount
y in
crea
sed
by
only
12.
6% b
etw
een
1990
and
200
1.
Tex
as' s
ix la
rges
t cou
ntie
s al
so w
itnes
sed
diff
er-
ent p
atte
rns
of c
hang
e, c
ompa
red
to T
exas
as
a
who
le, a
mon
g sp
ecif
ic r
ace
and
ethn
ic g
roup
s.T
ravi
s C
ount
y's
tota
l Whi
te p
opul
atio
n
grow
th, a
t 25.
3%, w
as c
lose
to th
ree
times
high
er th
an th
e in
crea
se o
f 8.
6% f
or T
exas
as
a
\V/
[2)
FA
,RU
LY S
UR
EN
ISU
NS
Muc
h of
wha
t we
know
abou
t chi
ldre
n
and
fam
ilies
toda
y dw
ells
on
the
mul
titud
e
of p
robl
ems
and
chal
leng
es th
ey r
outin
ely
conf
ront
. Alth
ough
it r
emai
ns im
port
ant t
o
unde
rsta
nd a
nd a
ddre
ss th
ese
conc
erns
,
rese
arch
on
the
them
e of
fam
ily
stre
ngth
s th
e ki
nds
of r
elat
ions
hips
and
fam
ily p
ract
ices
that
nur
ture
clo
se-k
nit,
supp
ortiv
e, a
nd h
ealth
y fa
mili
esal
sone
eds
to in
form
pol
icym
akin
g an
d ge
ner-
al p
ublic
dis
cuss
ion
abou
t our
chi
ldre
n's
need
s. B
y an
alyz
ing
natio
nal s
urve
y sa
m-
ples
of A
mer
ican
fam
ilies
and
you
th,
rese
arch
ers
have
iden
tifie
d so
me
of th
e
fam
ily s
tren
gths
ass
ocia
ted
with
pos
itive
outc
omes
for
child
ren.
The
se fa
ctor
s
incl
ude
such
cha
ract
eris
tics
as p
aren
tal
posi
tive
men
tal h
ealth
, reg
ular
hou
seho
ld
rout
ines
, sha
red
pare
nt-c
hild
act
iviti
es,
pare
ntal
mon
itorin
g an
d su
perv
isio
n, a
ndpa
rent
-chi
ld w
arm
th a
nd s
uppo
rtiv
enes
s.
Fam
ily S
tren
gths
:O
ften
Ove
rlook
ed, B
ut R
eal
Chi
ld T
rend
s
ww
w.c
hild
tren
ds.o
rg

who
le, a
nd e
xcee
ded
grow
th in
the
Whi
te p
opu-
latio
n fo
r ea
ch o
f th
e ot
her
five
larg
est c
ount
ies.
In th
ree
coun
tiesD
alla
s, E
l Pas
o, a
nd H
arri
sth
e to
tal W
hite
pop
ulat
ion
decl
ined
. The
num
-
ber
of H
ispa
nic
resi
dent
s in
Bex
ar (
up 3
1.9%
)
and
El P
aso
(up
32.0
%)
Cou
ntie
s in
crea
sed
less
dram
atic
ally
than
the
His
pani
c po
pula
tion
stat
ewid
e (6
0.3%
), w
hile
gro
wth
in th
e
His
pani
c po
pula
tions
of
Dal
las,
Har
ris,
Tar
rant
,
and
Tra
vis
Cou
ntie
s su
rpas
sed
stat
ewid
e in
crea
s-
es. T
he p
erce
ntag
e in
crea
se in
Dal
las
Cou
nty'
s
His
pani
c po
pula
tion,
at 1
21.9
%, l
ed th
at o
f th
e
stat
e's
othe
r la
rge
coun
ties.
Onl
y on
e of
the
stat
e's
larg
est c
ount
ies,
El P
aso,
exp
erie
nced
a
drop
in it
s A
fric
an-A
mer
ican
pop
ulat
iond
own
by 3
.4%
, com
pare
d to
a s
tate
wid
e ri
se o
f 24
.7%
in it
s nu
mbe
r of
Afr
ican
-Am
eric
an r
esid
ents
.
The
Afr
ican
-Am
eric
an p
opul
atio
n in
crea
sed
mos
t, by
41.
0%, i
n
Tar
rant
Cou
nty.
Sim
ilar
to th
e po
pula
tion
over
all,
obse
rvab
le d
iffe
r-
ence
s am
ong
the
larg
est
coun
ties'
chi
ld p
opul
atio
n tr
ends
wer
e ev
iden
tin
the
peri
od b
etw
een
1990
and
200
1.
How
ever
, the
pat
tern
of
chan
ge f
orch
ildre
n in
thes
e co
untie
s re
flec
ted
mor
e pr
onou
nced
rac
ial a
nd e
thni
c
dive
rsity
, and
und
ersc
ored
the
impo
r-
tant
infl
uenc
e of
His
pani
c po
pula
-
tion
grow
th a
mon
g re
side
nts
unde
r
18 y
ears
old
. The
pop
ulat
ion
of
Whi
te c
hild
ren
in T
ravi
s C
ount
y ro
se
17.6
%, m
ore
than
any
oth
er o
f th
est
ate'
s la
rge
coun
ties,
and
alm
ost f
ive
times
the
3.7%
incr
ease
in th
e W
hite
child
pop
ulat
ion
for
Tex
as a
s a
who
le.
From
199
0 to
200
1, th
e nu
mbe
r of
Whi
te c
hild
ren
drop
ped
in B
exar
,
Dal
las,
El P
aso,
and
Har
ris
Cou
ntie
s, w
ith E
l
Paso
Cou
nty,
sho
win
g a
decl
ine
of 2
9.8%
,
expe
rien
cing
the
larg
est p
erce
ntag
e ch
ange
amon
g th
e st
ate'
s la
rges
t cou
ntie
s. T
he
Chi
ldre
n70 60 50 40 30 20 10
0
-10
The
pro
port
ion
of c
hild
ren
livin
g in
sin
gle-
pare
ntfa
mili
eshe
aded
by
both
men
and
wom
enin
200
0re
pres
ente
d ne
arly
one
-qua
rter
of a
ll fa
mili
es w
ithch
ildre
n in
the
stat
e.
His
pani
c ch
ild p
opul
atio
ns o
f B
exar
(up
23.4
%)
and
El P
aso
(up
22.8
%)
Cou
ntie
s gr
ew,
Fig
ure
1.2
in M
arrie
d an
d S
ingl
e-P
aren
t Fam
ilies
Chi
ldre
n in
Mar
ried
Cou
ple
Fam
ilies
Chi
ldre
n in
Sin
gle
Mot
her
Fam
ilies
0 C
hild
ren
in S
ingl
e F
athe
r F
amili
es
a tia
co
a73
-O
Qa
Li
0 ti
but a
t a s
mal
ler
perc
enta
ge th
an th
e st
ate'
sH
ispa
nic
child
pop
ulat
ion
incr
ease
of
51.4
%,
whi
le th
e nu
mbe
r of
His
pani
c ch
ildre
n in
Dal
las
and
Tar
rant
Cou
ntie
s, a
t 115
.5%
and
116.
9% r
espe
ctiv
ely,
gre
w a
t mor
e th
an tw
ice
the
rate
of
the
unde
r-18
His
pani
c po
pula
tion
thro
ugho
ut th
e st
ate.
Pat
tern
s of
pop
ulat
ion
chan
ge a
mon
g A
fric
an-A
mer
ican
chi
ldre
n in
the
six
larg
est c
ount
ies
mat
ched
tren
ds f
or th
e
over
all A
fric
an-A
mer
ican
pop
ulat
ion.
The
pop
-
ulat
ion
of A
fric
an-A
mer
ican
chi
ldre
n de
clin
ed
by 2
.6%
in E
l Pas
o C
ount
y, c
ompa
red
to a
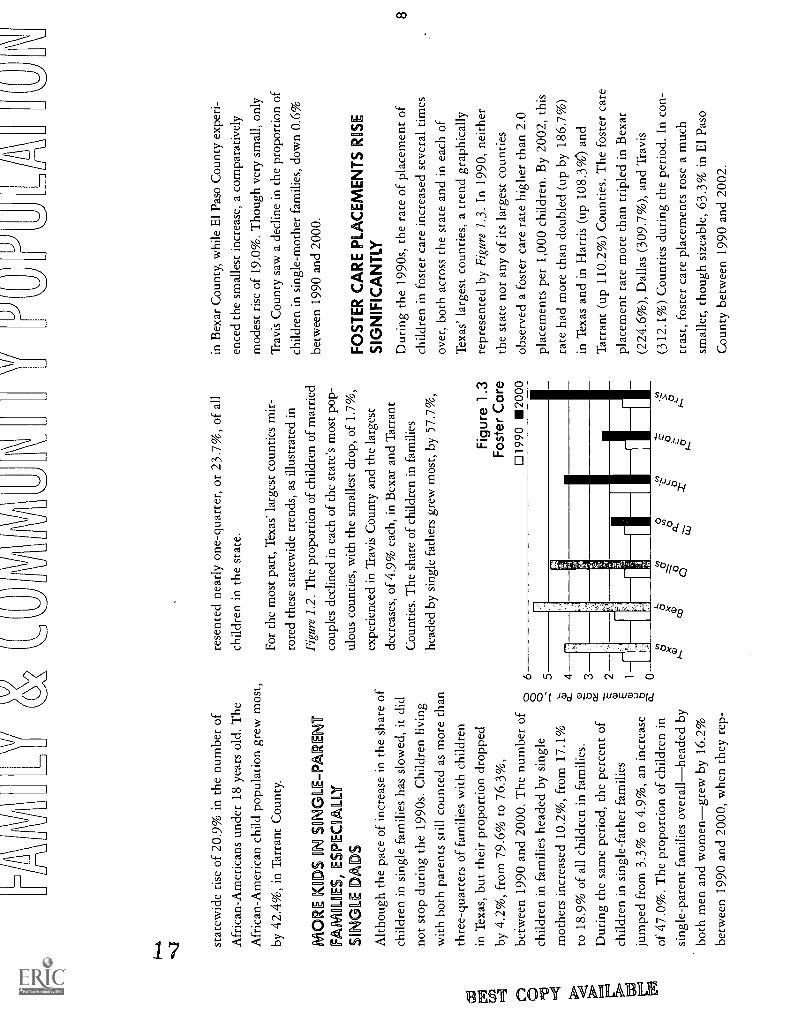
\ V /
stat
ewid
e ri
se o
f 20
.9%
in th
e nu
mbe
r of
Afr
ican
-Am
eric
ans
unde
r 18
yea
rs o
ld. T
he
Afr
ican
-Am
eric
an c
hild
pop
ulat
ion
grew
mos
t,
by 4
2.4%
, in
Tar
rant
Cou
nty.
MO
RE
KID
S IN
SIN
GLE
-0)
RE
NT
ES
PE
CI
LILY
SIN
GLE
D D
S
Alth
ough
the
pace
of
incr
ease
in th
e sh
are
ofch
ildre
n in
sin
gle
fam
ilies
has
slo
wed
, it d
id
not s
top
duri
ng th
e 19
90s.
Chi
ldre
n liv
ing
with
bot
h pa
rent
s st
ill c
ount
ed a
s m
ore
than
thre
e-qu
arte
rs o
f fa
mili
es w
ith c
hild
ren
in T
exas
, but
thei
r pr
opor
tion
drop
ped
by 4
.2%
, fro
m 7
9.6%
to 7
6.3%
,be
twee
n 19
90 a
nd 2
000.
The
num
ber
ofch
ildre
n in
fam
ilies
hea
ded
by s
ingl
e
mot
hers
incr
ease
d 10
.2%
, fro
m 1
7.1%
to 1
8.9%
of
all c
hild
ren
in f
amili
es.
Dur
ing
the
sam
e pe
riod
, the
per
cent
of
child
ren
in s
ingl
e-fa
ther
fam
ilies
jum
ped
from
3.3
% to
4.9
%, a
n in
crea
seof
47.
0%. T
he p
ropo
rtio
n of
chi
ldre
n in
sing
le-p
aren
t fam
ilies
ove
rallh
eade
d by
both
men
and
wom
engr
ew b
y 16
.2%
betw
een
1990
and
200
0, w
hen
they
rep
-
6 5 4 3 2 0
rese
nted
nea
rly
one-
quar
ter,
or
23.7
%, o
f al
l
child
ren
in th
e st
ate.
For
the
mos
t par
t, T
exas
' lar
gest
cou
ntie
s m
ir-
rore
d th
ese
stat
ewid
e tr
ends
, as
illus
trat
ed in
Figu
re 1
.2. T
he p
ropo
rtio
n of
chi
ldre
n of
mar
ried
coup
les
decl
ined
in e
ach
of th
e st
ate'
s m
ost p
op-
ulou
s co
untie
s, w
ith th
e sm
alle
st d
rop,
of
1.7%
,
expe
rien
ced
in T
ravi
s C
ount
y an
d th
e la
rges
t
decr
ease
s, o
f 4.
9% e
ach,
in B
exar
and
Tar
rant
Cou
ntie
s. T
he s
hare
of
child
ren
in f
amili
es
head
ed b
y si
ngle
fat
hers
gre
w m
ost,
by 5
7.7%
,
Fig
ure
1.3
Fos
ter
Car
e19
90 2
000
II
in B
exar
Cou
nty,
whi
le E
l Pas
o C
ount
y ex
peri
-
ence
d th
e sm
alle
st in
crea
se, a
com
para
tivel
y
mod
est r
ise
of 1
9.0%
. Tho
ugh
very
sm
all,
only
Tra
vis
Cou
nty
saw
a d
eclin
e in
the
prop
ortio
n of
child
ren
in s
ingl
e-m
othe
r fa
mili
es, d
own
0.6%
betw
een
1990
and
200
0.
FOST
ER
CA
RE
PL
AC
EM
EN
TS
RO
SES
IGN
IFIC
AN
TLY
Dur
ing
the
1990
s, th
e ra
te o
f pl
acem
ent o
fch
ildre
n in
fos
ter
care
incr
ease
d se
vera
l tim
es
over
, bot
h ac
ross
the
stat
e an
d in
eac
h of
Tex
as' l
arge
st c
ount
ies,
a tr
end
grap
hica
lly
repr
esen
ted
by F
igur
e 1.
3. I
n 19
90, n
eith
er
the
stat
e no
r an
y of
its
larg
est c
ount
ies
obse
rved
a f
oste
r ca
re r
ate
high
er th
an 2
.0
plac
emen
ts p
er 1
,000
chi
ldre
n. B
y 20
02, t
his
rate
had
mor
e th
an d
oubl
ed (
up b
y 18
6.7%
)in
Tex
as a
nd in
Har
ris
(up
108.
3%)
and
Tar
rant
(up
110
.2%
) C
ount
ies.
The
fos
ter
care
plac
emen
t rat
e m
ore
than
trip
led
in B
exar
(224
.6%
), D
alla
s (3
09.7
%),
and
Tra
vis
(312
.1%
) C
ount
ies
duri
ng th
e pe
riod
. In
con-
tras
t, fo
ster
car
e pl
acem
ents
ros
e a
muc
hsm
alle
r, th
ough
siz
eabl
e, 6
3.3%
in E
l Pas
o
Cou
nty
betw
een
1990
and
200
2.

r,
ip
Sect
ion
0
Eco
nom
Dc
Res
ourc
es,
Secu
Hty
& O
ppor
tuni
ltyE
cono
mic
inse
curit
y in
chi
ldho
od c
reat
es a
hos
t of
imm
edia
te a
nd lo
ng-t
erm
pro
blem
s. In
fam
ilies
with
out
adeq
uate
fina
ncia
l res
ourc
es, c
hild
ren
typi
cally
go
with
out b
asic
hum
an n
eeds
suc
h as
hou
sing
, foo
d, a
nd
med
ical
car
e. T
heir
acad
emic
per
form
ance
suf
fers
,
$---
4as
doe
s th
eir
soci
al a
nd e
mot
iona
l hea
lth. T
heC
D
cons
eque
nces
of e
cono
mic
dep
rivat
ion
are
last
ing
as w
ell,
jeop
ardi
zing
chi
ldre
n's
long
-ter
m e
mpl
oym
ent
and
earn
ings
pot
entia
l.
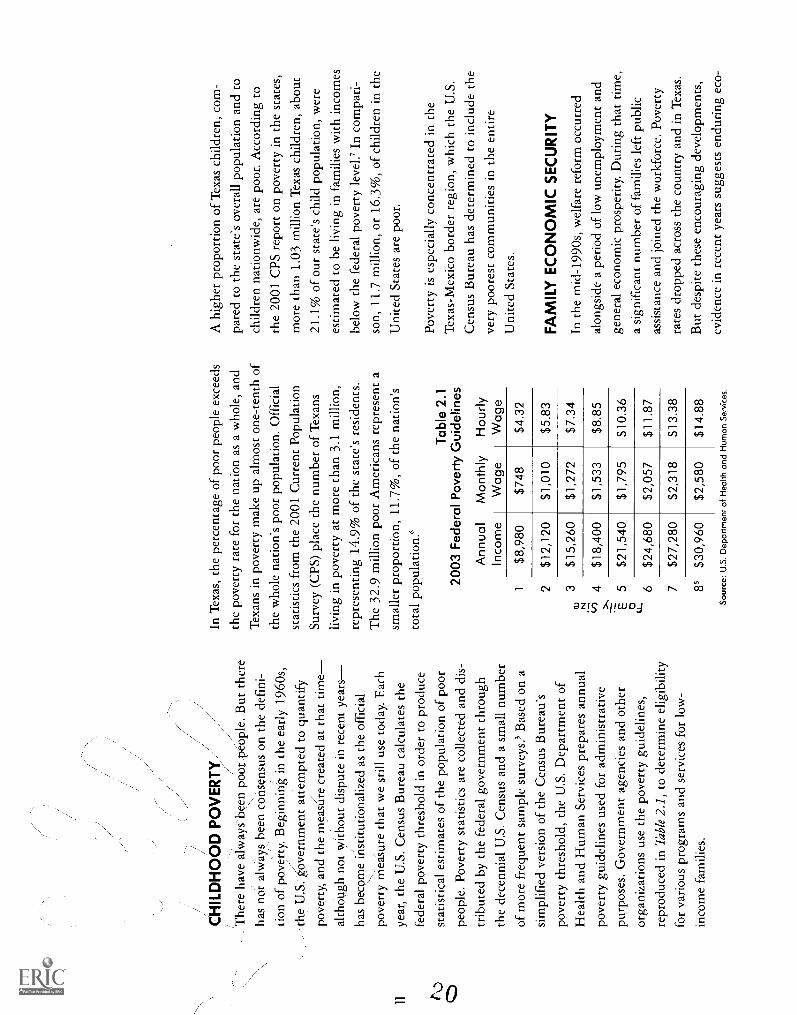
/
CH
ILD
HO
OD
PO
VE
RT
Y/
The
re h
ave
alw
ays-
been
poo
r pe
ople
. But
ther
e
has
not a
lway
s be
en c
onse
nsus
on
the
defi
ni-
tion
of p
over
ty. B
egin
ning
in th
e ea
rly
1960
s,
the
U.S
: ,ov
ernm
ent a
ttem
pted
to q
uant
ify
pove
rty,
and
the
mea
sure
cre
ated
at t
hat t
ime
alth
ough
not
with
out d
ispu
te in
rec
ent y
ears
has
beco
me
inst
itutio
naliz
ed a
s th
e of
fici
al
pove
rty
mea
sure
that
we
still
use
toda
y. E
ach
year
, the
U.S
. Cen
sus
Bur
eau
calc
ulat
es th
e
fede
ral p
over
ty th
resh
old
in o
rder
to p
rodu
ce
stat
istic
al e
stim
ates
of
the
popu
latio
n of
poo
r
peop
le. P
over
ty s
tatis
tics
are
colle
cted
and
dis
-
trib
uted
by
the
fede
ral g
over
nmen
t thr
ough
the
dece
nnia
l U.S
. Cen
sus
and
a sm
all n
umbe
r
of m
ore
freq
uent
sam
ple
surv
eys.
' Bas
ed o
n a
sim
plif
ied
vers
ion
of th
e C
ensu
s B
urea
u's
pove
rty
thre
shol
d, th
e U
.S. D
epar
tmen
t of
Hea
lth a
nd H
uman
Ser
vice
s pr
epar
es a
nnua
l
pove
rty
guid
elin
es u
sed
for
adm
inis
trat
ive
purp
oses
. Gov
ernm
ent a
genc
ies
and
othe
ror
gani
zatio
ns u
se th
e po
vert
y gu
idel
ines
,
repr
oduc
ed in
Tab
le 2
.1, t
o de
term
ine
elig
ibili
ty
for
vari
ous
prog
ram
s an
d se
rvic
es f
or lo
w-
inco
me
fam
ilies
.
In T
exas
, the
per
cent
age
of p
oor
peop
le e
xcee
ds
the
pove
rty
rate
for
the
natio
n as
a w
hole
, and
Tex
ans
in p
over
ty m
ake
up a
lmos
t one
-ten
th o
f
the
who
le n
atio
n's
poor
pop
ulat
ion.
Off
icia
l
stat
istic
s fr
om th
e 20
01 C
urre
nt P
opul
atio
n
Surv
ey (
CPS
) pl
ace
the
num
ber
of T
exan
s
livin
g in
pov
erty
at m
ore
than
3.1
mill
ion,
repr
esen
ting
14.9
% o
f th
e st
ate'
s re
side
nts.
The
32.
9 m
illio
n po
or A
mer
ican
s re
pres
ent a
smal
ler
prop
ortio
n, 1
1.7%
, of
the
natio
n's
tota
l pop
ulat
ion.
6
0
Tab
le 2
.120
03 F
eder
al P
over
ty G
uide
lines
Ann
ual
Inco
me
Mon
thly
Wag
e
1$8
,980
$748
Hou
rly
Wag
e
$4.3
2
2$1
2,12
0
3$1
5,26
0
4$1
8,40
0
5$2
1,54
0
6$2
4,68
0
7$2
7,28
0
$1,0
10$5
.83
$1,2
72$7
.34
$1,5
33$8
.85
$1,7
95$1
0.36
$2,0
57
$2,3
18
8'$3
0,96
0$2
,580
$11.
87
$13.
38
$14.
88
Sou
rce:
U.S
. Dep
artm
ent o
f Hea
lth a
nd H
uman
Ser
vice
s.
A h
ighe
r pr
opor
tion
of T
exas
chi
ldre
n, c
om-
pare
d to
the
stat
e's
over
all p
opul
atio
n an
d to
child
ren
natio
nwid
e, a
re p
oor.
Acc
ordi
ng to
the
2001
CPS
rep
ort o
n po
vert
y in
the
stat
es,
mor
e th
an 1
.03
mill
ion
Tex
as c
hild
ren,
abo
ut
21.1
% o
f ou
r st
ate'
s ch
ild p
opul
atio
n, w
ere
estim
ated
to b
e liv
ing
in f
amili
es w
ith in
com
es
belo
w th
e fe
dera
l pov
erty
leve
l.' I
n co
mpa
ri-
son,
11.
7 m
illio
n, o
r 16
.3%
, of
child
ren
in th
eU
nite
d St
ates
are
poo
r.
Pove
rty
is e
spec
ially
con
cent
rate
d in
the
Tex
as-M
exic
o bo
rder
reg
ion,
whi
ch th
e U
.S.
Cen
sus
Bur
eau
has
dete
rmin
ed to
incl
ude
the
very
poo
rest
com
mun
ities
in th
e en
tire
Uni
ted
Stat
es.
FA
MIL
Y E
CO
NO
MIC
SE
CU
RIT
Y
In th
e m
id-1
990s
, wel
fare
ref
orm
occ
urre
d
alon
gsid
e a
peri
od o
f lo
w u
nem
ploy
men
t and
gene
ral e
cono
mic
pro
sper
ity. D
urin
g th
at ti
me,
a si
gnif
ican
t num
ber
of f
amili
es le
ft p
ublic
assi
stan
ce a
nd jo
ined
the
wor
kfor
ce. P
over
ty
rate
s dr
oppe
d ac
ross
the
coun
try
and
in T
exas
.
But
des
pite
thes
e en
cour
agin
g de
velo
pmen
ts,
evid
ence
in r
ecen
t yea
rs s
ugge
sts
endu
ring
eco
-

n,J
nom
ic h
ards
hip
amon
g m
illio
ns o
f T
exan
s w
ho,
wor
king
ful
l tim
e or
eve
n at
sev
eral
jobs
, ear
n
inco
mes
abo
ve th
e of
fici
al p
over
ty li
ne b
ut s
till
inad
equa
te to
sup
port
thei
r fa
mili
es' b
asic
need
s fo
r ho
usin
g, f
ood,
chi
ld c
are,
med
ical
care
, and
tran
spor
tatio
n to
wor
k an
d sc
hool
.
Whi
le p
over
ty d
ropp
ed a
nd in
com
esro
se, t
he s
tate
's e
cono
mic
gro
wth
did
not m
ove
poor
Tex
ans
out o
fpo
vert
y an
d in
to th
e m
iddl
e cl
ass.
The
per
sist
ent e
cono
mic
inse
curi
ty o
f lo
w-
inco
me
wor
king
fam
ilies
has
cau
sed
polic
ymak
-
ers,
res
earc
hers
, and
adv
ocat
es to
que
stio
n th
e
pres
ent-
day
valid
ity o
f th
e po
vert
y m
easu
re.
Cre
ated
in th
e 19
60s
whe
n fa
mili
es s
pent
abo
ut
one-
thir
d of
thei
r in
com
es o
n fo
od, t
he o
ffic
ial
pove
rty
mea
sure
sim
ply
mul
tiplie
d by
thre
e th
e
cost
of
a sa
mpl
e ba
sket
of
groc
erie
s to
est
imat
e
the
min
imum
am
ount
of
inco
me
that
fam
ilies
of d
iffe
rent
siz
es n
eede
d to
sur
vive
. Sin
ce th
en,
the
stru
ctur
e of
fam
ily b
udge
ts h
as c
hang
ed in
sign
ific
ant w
ays.
For
exa
mpl
e, th
e pr
ices
of
hous
ing
and
med
ical
car
e ha
ve in
crea
sed
disp
ro-
port
iona
tely
com
pare
d to
ove
rall
infl
atio
n, a
nd
child
car
e co
sts
repr
esen
t a n
ew f
inan
cial
burd
en f
or to
day'
s w
orki
ng f
amili
es.
As
an a
ltern
ativ
e to
the
offi
cial
pov
erty
sta
n-
dard
, gov
ernm
ent o
ffic
ials
and
res
earc
hers
on
low
-inc
ome
issu
es h
ave
rece
ntly
pro
pose
d m
ore
real
istic
mea
sure
s of
fam
ily e
cono
mic
nee
d,8
such
as
the
Cen
ter
for
Publ
ic P
olic
y Pr
iori
ties'
Fam
ily S
ecur
ity I
ndex
.9 U
sing
a "
mar
ket-
bas-
ket"
app
roac
h, th
e In
dex
estim
ated
how
muc
h
it re
ally
cos
ts f
or T
exas
fam
ilies
to s
uppo
rt a
n
aust
ere,
yet
saf
e an
d de
cent
life
by
deta
iling
the
actu
al c
ost o
f ba
sic
need
shou
sing
, foo
d,ch
ild c
are,
med
ical
exp
ense
s, a
nd tr
ansp
orta
-
tiont
hrou
ghou
t the
sta
te. I
n ea
ch o
f T
exas
'27
met
ropo
litan
are
as, t
he c
ombi
ned
cost
of
thes
e es
sent
ial i
tem
s ra
nged
bet
wee
n tw
o an
d
thre
e tim
es th
e of
fici
al p
over
ty li
ne. L
ike
sim
i-
lar
mea
sure
s us
ed in
oth
er s
tate
s, th
e Fa
mily
Secu
rity
Ind
ex c
onfi
rms
the
sign
ific
ant l
evel
of
econ
omic
dis
tres
s ex
peri
ence
d ev
en b
y fa
mili
es
who
are
not
off
icia
lly c
onsi
dere
d "p
oor.
"
Com
bine
d w
ith lo
cal l
abor
mar
ket a
nd
empl
oym
ent s
tatis
tics,
the
Fam
ily S
ecur
ity
Inde
x do
cum
ente
d ho
w f
amili
es th
roug
hout
Tex
as c
ontin
ually
str
uggl
e to
man
age
the
cost
\v/
\V/
7A,M
[111
:1F
ASS
EU
SF
amily
eco
nom
ic s
ecur
ity r
equi
res
mor
e
than
just
an
inco
me
abov
e th
e po
vert
y
line.
Ass
ets
also
mat
ter.
Ass
ets
safe
guar
d
hous
ehol
d st
abili
ty a
nd fo
ster
hom
e ow
n-
ersh
ip. T
hey
mak
e it
poss
ible
to p
lan
for
long
-ter
m in
vest
men
ts in
edu
catio
n an
dfo
r re
tirem
ent.
But
mor
e A
mer
ican
s ar
e
asse
t poo
r th
an in
com
e po
or. L
ast y
ear
a
maj
or s
tudy
rep
orte
d th
e st
atus
of f
amily
asse
ts a
cros
s th
e co
untr
y an
d in
eac
h
stat
e. C
ompa
red
to o
ther
sta
tes,
far
few
er T
exas
fam
ilies
hav
e th
e m
eans
to
surv
ive
at th
e po
vert
y le
vel f
or th
ree
mon
ths
wer
e th
ey to
lose
thei
r jo
bs. T
exas
rank
ed 4
3rd
amon
g th
e st
ates
on
the
stud
y's
mea
sure
of a
vera
ge n
et w
orth
,an
d 45
th in
the
shar
e of
hou
seho
lds
with
zero
net
wor
th. T
he s
tate
per
form
ed
muc
h be
tter
on s
ever
al m
easu
res
of a
sset
polic
y, in
clud
ing
early
chi
ldho
od a
nd
adul
t edu
catio
n in
itiat
ives
.
Sta
te A
sset
Dev
elop
men
t Rep
ort C
ard:
Ben
chm
arki
ng A
sset
Dev
elop
men
t
in F
ight
ing
Pov
erty
Cor
pora
tion
for
Ent
erpr
ise
Dev
elop
men
tw
ww
.cfe
d.or
g

of r
ent,
groc
erie
s, c
hild
car
e an
d ot
her
esse
n-
tials
. With
out t
he in
com
e ne
cess
ary
to m
eet
basi
c ex
pens
es, t
hese
fam
ilies
rem
ain
extr
emel
y
vuln
erab
le to
une
xpec
ted
maj
or e
xpen
ses,
suc
h
as m
edic
al e
mer
genc
ies
or c
ostly
car
rep
airs
. For
fam
ilies
that
spe
nd
ever
ythi
ng th
ey e
arn
just
to p
ay th
e bi
lls, o
ppor
tu-
nitie
s to
cre
ate
long
-ter
m
fam
ilies
rou
tinel
y ex
peri
ence
suc
h di
stre
ss.
Am
ong
stat
es a
naly
zed
in th
e st
udy,
Tex
as
repo
rted
the
high
est r
ate
of f
amili
es w
hoen
coun
tere
d "c
ritic
al"
hard
ship
s su
ch a
s
Alth
ough
it c
an r
epre
sent
a c
ritic
al s
uppo
rt fo
rfa
mili
es e
xper
ienc
ing
finan
cial
dis
tres
s, T
AN
Fre
ache
s on
ly a
sm
all f
ract
ion
of c
hild
ren
in p
over
ty.
econ
omic
sec
urity
thro
ugh
savi
ngs
for
educ
atio
n an
d re
tirem
ent,
or th
roug
h th
e ac
quis
ition
of
even
mod
est
asse
ts, r
emai
n ou
t of
reac
h. W
ith n
o fi
nanc
ial
cush
ion
as a
buf
fer,
any
loss
of
inco
mew
hich
thou
sand
s of
low
-inc
ome
Tex
as f
amili
es h
ave
conf
ront
ed s
ince
the
begi
nnin
g of
the
curr
ent
econ
omic
rec
essi
onca
n pr
ove
deva
stat
ing.
Oth
er e
vide
nce
deta
ils th
e le
vel o
f ha
rdsh
ip
Tex
as f
amili
es e
ndur
e ev
en w
hen
pare
nts
wor
k
full
time
and
earn
as
muc
hor
even
up
totw
ice
as m
ucha
s th
e of
fici
al a
mou
nt o
fpo
vert
y-le
vel i
ncom
e. A
200
1 re
port
by
the
Eco
nom
ic P
olic
y In
stitu
te u
sed
natio
nal s
urve
y
data
to d
eter
min
e th
e ki
nds
of h
ards
hips
fac
ed
by w
orki
ng f
amili
es a
nd e
stim
ated
how
man
y
mis
sing
mea
ls, n
ot g
ettin
g ne
cess
ary
med
ical
care
, and
dou
blin
g up
on
hous
ing,
alo
ng w
ith"s
erio
us"
hard
ship
s th
at in
clud
ed w
orry
abo
ut
havi
ng e
noug
h fo
od, l
ack
of h
ealth
insu
ranc
e,in
abili
ty to
mak
e ho
usin
g or
util
ity p
aym
ents
,
and
inad
equa
te c
hild
car
e.'
A "
hist
oric
ally
wid
e' g
ap in
inco
me
betw
een
the
high
est-
earn
ing
hous
ehol
ds a
nd f
amili
es
of lo
w a
nd m
oder
ate
inco
mes
has
con
trib
uted
to th
e ec
onom
ic in
secu
rity
of
so m
any
Tex
as
fam
ilies
. Com
pare
d to
sim
ilar
econ
omic
cyc
les
in th
e la
te 1
970s
and
198
0s, t
he p
rosp
erity
of th
e 19
90s
faile
d to
ben
efit
low
- an
d
mod
erat
e-in
com
e fa
mili
es a
s m
uch
as it
hel
ped
high
-inc
ome
hous
ehol
ds. B
y th
e en
d of
the
last
deca
de, i
nequ
ality
bet
wee
n hi
gh-
and
low
-
inco
me
Tex
as f
amili
es w
as th
ird
high
est,
and
the
gap
betw
een
high
- an
d m
iddl
e-in
com
e
hous
ehol
ds in
Tex
as w
as f
ourt
h hi
ghes
t, am
ong
the
fift
y st
ates
.'2
Solu
tions
to r
outin
e ec
onom
ic h
ards
hip
and
the
pros
peri
ty g
ap in
clud
e w
age
impr
ovem
ents
and
,
for
fam
ilies
in n
eed
of a
ssis
tanc
e, a
saf
ety
net o
f
soci
al s
ervi
ces
to s
uppo
rt th
em in
har
d tim
es
and
to h
elp
them
cre
ate
a du
rabl
e fo
unda
tion
for
long
-ter
m e
cono
mic
sec
urity
. With
the
pas-
sage
of
1996
fed
eral
wel
fare
ref
orm
legi
slat
ion,
publ
ic a
ssis
tanc
e po
licy
and
prog
ram
s ha
ve
emph
asiz
ed w
ork
as th
e an
tidot
e to
pov
erty
.
Yet
, alth
ough
enr
ollm
ent i
n T
exas
' cas
h as
sis-
tanc
e pr
ogra
m h
as d
eclin
ed s
ubst
antia
lly s
ince
1996
, the
re is
sca
rce
evid
ence
that
wel
fare
refo
rm h
as m
oved
our
poo
rest
fam
ilies
out
of
pove
rty.
A c
ompr
ehen
sive
stu
dy o
f fo
rmer
wel
-
fare
rec
ipie
nts,
pub
lishe
d in
200
1 by
the
Tex
as
Dep
artm
ent o
f H
uman
Ser
vice
s, r
epor
ted
that
alth
ough
70%
of
resp
onde
nts
foun
d w
ork
dur-
ing
the
year
aft
er le
avin
g w
elfa
re, t
hey
earn
ed
an a
vera
ge a
nnua
l inc
ome
of $
10,8
00w
ell
belo
w th
e po
vert
y lin
e fo
r a
fam
ily o
f tw
o or
mor
e pe
ople
.13

WH
AT
TE
XA
S\K
IDS
CO
UN
TS
AY
S A
BO
UT
EC
ON
OM
ICR
ES
OU
RC
ES
, SE
CU
RIT
Y 8
,O
PP
OR
TU
NIT
Y
EC
ON
OM
IC R
ES
OU
RC
ES
, SE
CU
RIT
Y&
OP
PO
RT
UN
ITY
IND
ICA
TO
RS
Pov
erty
For
Tot
al P
opul
atio
n
1989
1999
Chi
ld P
over
ty19
8919
99
Med
ian
Hou
seho
ld In
com
e19
8919
99
Une
mpl
oym
ent
1990
2002
Chi
ldre
n R
ecei
ving
TA
NF
And
AF
DC
1993
2001
CH
ILD
PO
VE
RT
Y D
EC
LIN
ES
BU
TIN
EQ
UIT
IES
RE
MA
IN
Alth
ough
mea
sure
s of
fam
ily e
cono
mic
sec
urity
wou
ld p
rodu
ce b
ette
r es
timat
es o
f ge
nuin
e
hard
ship
and
nee
d am
ong
Tex
as c
hild
ren
and
fam
ilies
, the
off
icia
l pov
erty
thre
shol
d re
mai
ns
the
mos
t wid
ely
used
met
hod
of id
entif
ying
and
addr
essi
ng e
cono
mic
dis
tres
s. A
ccor
ding
to
this
sta
ndar
d, th
e liv
ing
cond
ition
s of
Tex
ans,
adul
ts a
nd c
hild
ren
alik
e, h
ave
impr
oved
sin
ce
the
begi
nnin
g of
the
last
dec
ade.
The
ove
rall
pove
rty
rate
for
Tex
as d
eclin
ed b
y 14
.9%
betw
een
1989
and
199
9, a
nd th
e po
vert
y ra
te
for
the
stat
e's
unde
r-18
pop
ulat
ion
drop
ped
by15
.6%
. Alth
ough
the
prop
ortio
n of
Tex
as
child
ren
livin
g in
pov
erty
ros
e 17
.6%
betw
een
1989
and
199
3, th
is r
ate
then
decl
ined
ste
adily
thro
ugho
ut th
e re
st o
f
the
peri
od. E
ven
with
this
impr
ovem
ent,
by 1
999
slig
htly
mor
e th
an o
ne-f
ifth
,
or 2
0.5%
, of
Tex
as c
hild
ren
lived
in
fam
ilies
with
inco
mes
at o
r be
low
pove
rty
leve
l.
Whi
le s
tate
wid
e ch
ild p
over
ty d
eclin
ed
over
the
past
dec
ade,
Tex
as' s
ix la
rges
t
coun
ties
show
ed v
ery
diff
eren
t pat
tern
s
of im
prov
emen
t, as
ref
lect
ed in
Fig
ure
2.1.
In
Tra
vis
Cou
nty,
the
over
all c
hild
pove
rty
rate
dro
pped
by
24.7
%, s
urpa
ssin
g
gain
s fo
r th
e st
ate
as a
who
le a
nd f
or a
ll of
the
othe
r la
rge
coun
ties.
In
cont
rast
, the
pov
erty
rate
for
chi
ldre
n in
Dal
las
and
Tar
rant
Cou
ntie
s
fell
by ju
st 3
.2%
and
3.4
%, r
espe
ctiv
ely,
-50
betw
een
1989
and
199
9. A
lthou
gh B
exar
(dow
n by
19.
8%)
and
El P
aso
(dow
n by
12.2
%)
Cou
ntie
s ex
peri
ence
d co
mpa
rativ
ely
grea
ter
impr
ovem
ent i
n th
eir
child
pov
erty
rate
s, th
ese
coun
ties
cont
inue
d to
dem
onst
rate
the
high
est l
evel
s of
chi
ld p
over
ty a
mon
g th
e
stat
e's
larg
est c
ount
ies.
In
1999
the
perc
enta
ge
Fig
ure
2.1
Chi
ldre
n in
Pov
erty
All
Chi
ldre
n
Chi
ldre
n O
ver
Fiv
e Y
ears
-40
-30
-20
Per
cent
age
Cha
nge
-10
Tex
as
Bex
ar
Dal
las
El P
aso
Har
ris
Tar
rant
Tra
vis
0
of E
l Pas
o C
ount
y ch
ildre
n liv
ing
in f
amili
es a
t
or b
elow
pov
erty
leve
l, 31
.7%
, was
mor
e th
an
twic
e th
e ra
te o
f ch
ild p
over
ty in
Tar
rant
(14.
2%)
and
Tra
vis
(14.
3%)
Cou
ntie
s an
d on
e
and
one-
half
tim
es h
ighe
r th
an th
e ch
ild p
over
-
ty r
ate
for
Tex
as (
20.5
%)
as a
who
le.
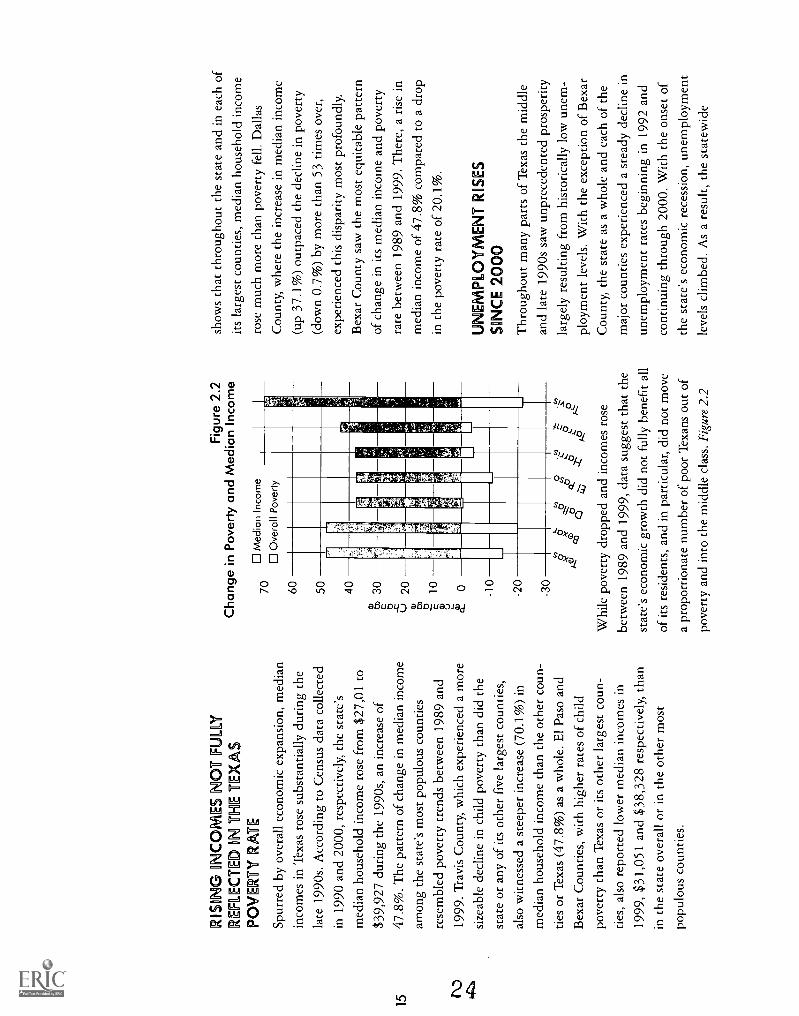
RIS
ING
IN
CO
ME
S N
OT
FU
LL
YR
EFL
EC
TE
D I
N T
HE
TE
XA
SPO
VE
RT
Y R
AT
E
Spur
red
by o
vera
ll ec
onom
ic e
xpan
sion
, med
ian
inco
mes
in T
exas
ros
e su
bsta
ntia
lly d
urin
g th
e
late
199
0s. A
ccor
ding
to C
ensu
s da
ta c
olle
cted
in 1
990
and
2000
, res
pect
ivel
y, th
e st
ate'
s
med
ian
hous
ehol
d in
com
e ro
se f
rom
$27
,01
to
$39,
927
duri
ng th
e 19
90s,
an
incr
ease
of
47.8
%. T
he p
atte
rn o
f ch
ange
in m
edia
n in
com
e
amon
g th
e st
ate'
s m
ost p
opul
ous
coun
ties
rese
mbl
ed p
over
ty tr
ends
bet
wee
n 19
89 a
nd
1999
. Tra
vis
Cou
nty,
whi
ch e
xper
ienc
ed a
mor
e
size
able
dec
line
in c
hild
pov
erty
than
did
the
stat
e or
any
of
its o
ther
fiv
e la
rges
t cou
ntie
s,
also
witn
esse
d a
stee
per
incr
ease
(70
.1%
) in
med
ian
hous
ehol
d in
com
e th
an th
e ot
her
coun
-
ties
or T
exas
(47
.8%
) as
a w
hole
. El P
aso
and
Bex
ar C
ount
ies,
with
hig
her
rate
s of
chi
ld
pove
rty
than
Tex
as o
r its
oth
er la
rges
t cou
n-
ties,
als
o re
port
ed lo
wer
med
ian
inco
mes
in
1999
, $31
,051
and
$38
,328
res
pect
ivel
y, th
an
in th
e st
ate
over
all o
r in
the
othe
r m
ost
popu
lous
cou
ntie
s.
Fig
ure
2.2
Cha
nge
in P
over
ty a
nd M
edia
n In
com
e
70 60 50 40
Med
ian
Inco
me
Ove
rall
Pov
erty
00
00
4:1)
0ct
.
Whi
le p
over
ty d
ropp
ed a
nd in
com
es r
ose
betw
een
1989
and
199
9, d
ata
sugg
est t
hat t
hest
ate'
s ec
onom
ic g
row
th d
id n
ot f
ully
ben
efit
all
of it
s re
side
nts,
and
in p
artic
ular
, did
not
mov
e
a pr
opor
tiona
te n
umbe
r of
poo
r T
exan
s ou
t of
pove
rty
and
into
the
mid
dle
clas
s. F
igur
e 2.
2
show
s th
at th
roug
hout
the
stat
e an
d in
eac
h of
its la
rges
t cou
ntie
s, m
edia
n ho
useh
old
inco
me
rose
muc
h m
ore
than
pov
erty
fel
l. D
alla
s
Cou
nty,
whe
re th
e in
crea
se in
med
ian
inco
me
(up
37.1
%)
outp
aced
the
decl
ine
in p
over
ty
(dow
n 0.
7%)
by m
ore
than
53
times
ove
r,
expe
rien
ced
this
dis
pari
ty m
ost p
rofo
undl
y.
Bex
ar C
ount
y sa
w th
e m
ost e
quita
ble
patte
rn
of c
hang
e in
its
med
ian
inco
me
and
pove
rty
rate
bet
wee
n 19
89 a
nd 1
999.
The
re, a
ris
e in
med
ian
inco
me
of 4
7.8%
com
pare
d to
a d
rop
in th
e po
vert
y ra
te o
f 20
.1%
.
UN
EM
PLO
YM
EN
T R
ISE
SSI
NC
E 2
000
Thr
ough
out m
any
part
s of
Tex
as th
e m
iddl
ean
d la
te 1
990s
saw
unp
rece
dent
ed p
rosp
erity
larg
ely
resu
lting
fro
m h
isto
rica
lly lo
w u
nem
-
ploy
men
t lev
els.
With
the
exce
ptio
n of
Bex
ar
Cou
nty,
the
stat
e as
a w
hole
and
eac
h of
the
maj
or c
ount
ies
expe
rien
ced
a st
eady
dec
line
in
unem
ploy
men
t rat
es b
egin
ning
in 1
992
and
cont
inui
ng th
roug
h 20
00. W
ith th
e on
set o
fth
e st
ate'
s ec
onom
ic r
eces
sion
, une
mpl
oym
ent
leve
ls c
limbe
d. A
s a
resu
lt, th
e st
atew
ide
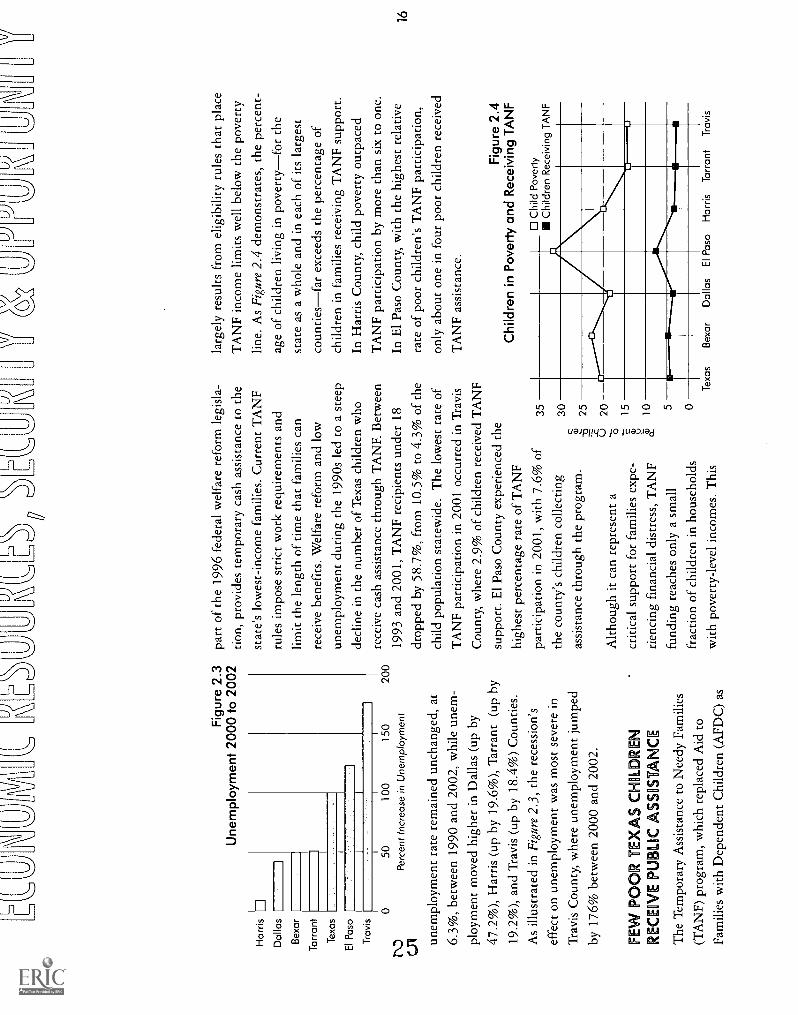
SI
Har
ris
Dal
las
Bex
ar
Tar
rant
Tex
as
El P
aso
Tra
vis
0
Fig
ure
2.3
Une
mpl
oym
ent 2
000
to 2
002
J 5010
015
0
Per
cent
Incr
ease
in U
nem
ploy
men
tC
A unem
ploy
men
t rat
e re
mai
ned
unch
ange
d, a
t
6.3%
, bet
wee
n 19
90 a
nd 2
002,
whi
le u
nem
-
ploy
men
t mov
ed h
ighe
r in
Dal
las
(up
by
47.2
%),
Har
ris
(up
by 1
9.6%
), T
arra
nt (
up b
y19
.2%
), a
nd T
ravi
s (u
p by
18.
4%)
Cou
ntie
s.A
s ill
ustr
ated
in F
igur
e 2.
3, th
e re
cess
ion'
s
effe
ct o
n un
empl
oym
ent w
as m
ost s
ever
e in
Tra
vis
Cou
nty,
whe
re u
nem
ploy
men
t jum
ped
by 1
76%
bet
wee
n 20
00 a
nd 2
002.
200
FEW
PO
OR
TE
XA
S C
HIL
DR
ER
EC
EIV
E P
UB
LIC
SSIS
TA
CE
The
Tem
pora
ry A
ssis
tanc
e to
Nee
dy F
amili
es
(TA
NF)
pro
gram
, whi
ch r
epla
ced
Aid
toFa
mili
es w
ith D
epen
dent
Chi
ldre
n (A
FDC
) as
L
part
of
the
1996
fed
eral
wel
fare
ref
orm
legi
sla-
tion,
pro
vide
s te
mpo
rary
cas
h as
sist
ance
to th
e
stat
e's
low
est-
inco
me
fam
ilies
. Cur
rent
TA
NF
rule
s im
pose
str
ict w
ork
requ
irem
ents
and
limit
the
leng
th o
f tim
e th
at f
amili
es c
an
rece
ive
bene
fits
. Wel
fare
ref
orm
and
low
unem
ploy
men
t dur
ing
the
1990
s le
d to
a s
teep
decl
ine
in th
e nu
mbe
r of
Tex
as c
hild
ren
who
rece
ive
cash
ass
ista
nce
thro
ugh
TA
NF.
Bet
wee
n
1993
and
200
1, T
AN
F re
cipi
ents
und
er 1
8
drop
ped
by 5
8.7%
, fro
m 1
0.5%
to 4
.3%
of
the
child
pop
ulat
ion
stat
ewid
e. T
he lo
wes
t rat
e of
TA
NF
part
icip
atio
n in
200
1 oc
curr
ed in
Tra
vis
Cou
nty,
whe
re 2
.9%
of
child
ren
rece
ived
TA
NF
supp
ort.
El P
aso
Cou
nty
expe
rien
ced
the
high
est p
erce
ntag
e ra
te o
f T
AN
F
part
icip
atio
n in
200
1, w
ith 7
.6%
of
the
coun
ty's
chi
ldre
n co
llect
ing
assi
stan
ce th
roug
h th
e pr
ogra
m.
Alth
ough
it c
an r
epre
sent
a
criti
cal s
uppo
rt f
or f
amili
es e
xpe-
rien
cing
fin
anci
al d
istr
ess,
TA
NF
fund
ing
reac
hes
only
a s
mal
l
frac
tion
of c
hild
ren
in h
ouse
hold
s
with
pov
erty
-lev
el in
com
es. T
his
35 30 25 20 15 10 5 0
larg
ely
resu
lts f
rom
elig
ibili
ty r
ules
that
pla
ceT
AN
F in
com
e lim
its w
ell b
elow
the
pove
rty
line.
As
Figu
re 2
.4 d
emon
stra
tes,
the
perc
ent-
age
of c
hild
ren
livin
g in
pov
erty
for
the
stat
e as
a w
hole
and
in e
ach
of it
s la
rges
tco
untie
sfar
exc
eeds
the
perc
enta
ge o
fch
ildre
n in
fam
ilies
rec
eivi
ng T
AN
F su
ppor
t.
In H
arri
s C
ount
y, c
hild
pov
erty
out
pace
dT
AN
F pa
rtic
ipat
ion
by m
ore
than
six
to o
ne.
In E
l Pas
o C
ount
y, w
ith th
e hi
ghes
t rel
ativ
e
rate
of
poor
chi
ldre
n's
TA
NF
part
icip
atio
n,
only
abo
ut o
ne in
fou
r po
or c
hild
ren
rece
ived
TA
NF
assi
stan
ce.
Fig
ure
2.4
Chi
ldre
n in
Pov
erty
and
Rec
eivi
ng T
AN
F
Chi
ld P
over
tyC
hild
ren
Rec
eivi
ng T
AN
F
11
Tex
asB
exar
Dal
las
El P
aso
Har
risT
arra
ntT
ravi
s
\V/

,
fr,
!,***'* 11.'s
*.
6
4
14;

Sec
tion
3..
Ear
Dy
Car
e &
Edu
catio
nR
esea
rch
on e
arly
chi
ldho
od d
evel
opm
ent c
ontin
ues
to s
uppo
rt th
e cr
itica
l im
port
ance
of e
arly
chi
ldho
od
expe
rienc
es, b
oth
for
thei
r de
velo
pmen
tal o
ppor
tuni
-
ties
and
for
the
pote
ntia
lly h
azar
dous
imm
edia
te a
nd
long
-ter
m c
onse
quen
ces
whe
n yo
ung
child
ren
do n
ot
rece
ive
adeq
uate
nur
turin
g an
d st
imul
atio
n. E
arly
child
hood
ser
vice
s al
so r
epre
sent
an
impo
rtan
t wor
k
supp
ort f
or lo
w-
and
mod
erat
e-in
com
e pa
rent
s w
ho
rely
on
qual
ity p
lace
men
ts fo
r th
eir
child
ren
in o
rder
to
mai
ntai
n st
able
em
ploy
men
t.
TH
E S
IGN
IFIC
AN
CE
OF
EA
RLY
CH
ILD
HO
OD
CA
RE
AN
DE
DU
CA
TIO
N
Ove
r th
e pa
st s
ever
al d
ecad
es a
gro
win
g bo
dy
of in
terd
isC
iplin
ary
rese
arch
has
det
aile
d th
e
com
plex
cog
nitiv
e, e
mot
iona
l, an
d so
cial
proc
esse
s th
at o
ccur
dur
ing
the
earl
iest
yea
rs o
f
life.
Chi
ldre
n's
inbo
rn c
apac
ity a
nd e
nthu
sias
m
for
lear
ning
inte
ract
with
env
iron
men
tal a
nd
cultu
ral i
nflu
ence
s to
cha
rt th
e co
urse
of
a
child
's f
utur
e. D
epen
ding
on
circ
umst
ance
s,
thes
e fi
rst y
ears
can
ste
er th
at c
hild
tow
ard
suc-
cess
in s
choo
l and
late
r lif
e or
els
e to
war
d a
futu
re o
f po
tent
ial l
ong-
term
vul
nera
bilit
y an
d
unre
aliz
ed p
oten
tial.
A 2
000
repo
rt b
y th
e
Nat
iona
l Res
earc
h C
ounc
il ac
know
ledg
ed b
oth
the
oppo
rtun
ities
and
ris
ks o
f ea
rly
child
hood
expe
rien
ces.
"A
fun
dam
enta
l par
adox
exi
sts
and
is u
navo
idab
le: d
evel
opm
ent i
n th
e ea
rly
year
s
is b
oth
high
ly r
obus
t and
hig
hly
vuln
erab
le."
'
At t
he s
ame
time
that
our
kno
wle
dge
of e
arly
child
hood
dev
elop
men
t has
evo
lved
, con
tem
-
pora
ry s
ocia
l, ec
onom
ic, a
nd p
oliti
cal c
ondi
-
tions
hav
e co
mpl
icat
ed th
e re
spon
sibi
lity,
shar
ed b
y fa
mili
es a
nd c
omm
uniti
es, o
f pr
ovid
-
ing
youn
g ch
ildre
n w
ith th
e su
ppor
t and
reso
urce
s th
ey n
eed
duri
ng th
eir
cruc
ial e
arly
year
s. L
arge
ly d
ue to
wid
er e
mpl
oym
ent
amon
g m
othe
rs o
f yo
ung
child
renb
oth
mar
-ri
ed w
omen
in d
ual-
earn
er f
amili
es a
nd f
emal
e
sing
le p
aren
tsth
e pr
opor
tion
of c
hild
ren
unde
r si
x w
ith e
mpl
oyed
mot
hers
, mea
sure
d at
7% in
194
0, is
pro
ject
ed to
ris
e to
83%
by
2005
.2 I
n 20
00, 6
1% o
f m
othe
rs w
ith c
hild
ren
unde
r th
ree
wer
e em
ploy
ed, c
ompa
red
to ju
st34
% in
197
5.3
Tra
nsla
ted,
this
dem
ogra
phic
shif
t sig
nifi
es a
hug
e in
crea
se in
the
dem
and
for
earl
y ch
ildho
od c
are
that
has
not
yet
ful
ly
been
add
ress
ed.
Res
earc
h ev
iden
ce in
dica
tes
that
qua
lity
earl
y
care
and
edu
catio
n pr
ogra
ms
can
enco
urag
e
shor
t-te
rm im
prov
emen
ts in
chi
ldre
n's
IQ,
alon
g w
ith m
ore
last
ing
acad
emic
gai
ns,
incl
udin
g lo
wer
pro
babi
litie
s of
gra
de r
eten
tion
and
bette
r ch
ance
s of
hig
h sc
hool
gra
duat
ion.
4
Eff
ectiv
e pr
ogra
ms
also
app
ear
to p
rom
ote
pos-
itive
long
-ter
m b
ehav
iora
l and
soc
ial o
utco
mes
incl
udin
g gr
eate
r in
depe
nden
ce a
nd s
ocia
l con
-
fide
nce,
red
uced
ris
k of
con
tact
with
the
just
ice
syst
em, l
ower
util
izat
ion
of p
ublic
ly-f
unde
d
soci
al s
ervi
ces,
and
hig
her
med
ian
inco
me.
'
But
the
qual
ity o
f ea
rly
care
and
edu
catio
n in
Tex
as, a
s in
the
natio
n, is
hig
hly
vari
able
.
Stud
ies
of c
hild
car
e qu
ality
con
sist
ently
indi
-
cate
that
the
care
pro
vide
d in
abo
ut o
ne-f
ifth
of
child
car
e se
tting
s fa
ils to
mee
t eve
n m
inim
al
stan
dard
s.6
Too
man
y pr
ogra
ms
pay
wor
kers
poor
ly, p
rovi
de f
ew o
ppor
tuni
ties
for
empl
oyee
trai
ning
and
dev
elop
men
t, an
d ex
peri
ence
exce
ssiv
e tu
rnov
er. N
umer
ous
less
er q
ualit
y
prog
ram
s fa
il to
off
er d
evel
opm
enta
lly a
ppro
-
pria
te c
urri
cula
.
Ava
ilabi
lity
also
pos
es p
robl
ems.
Man
y ea
rly
care
and
edu
catio
n pr
ogra
ms
offe
r on
ly p
artia
l-
day
serv
ices
rat
her
the
all-
day
child
car
e th
at
fullt
ime
wor
king
par
ents
nee
d, a
nd p
rogr
ams
that
pro
vide
car
e du
ring
non
-sta
ndar
d ho
urs
are
rare
. Alth
ough
fed
eral
and
sta
te s
uppo
rt

for
child
car
e su
bsid
ies
grew
sig
nifi
cant
ly d
ur-
ing
the
1990
's, a
t the
end
of
the
deca
de f
und-
ing
reac
hed
only
abo
ut 1
2% o
f th
e es
timat
ed
15 m
illio
n ch
ildre
n w
hose
fam
ilies
qua
lifie
d fo
r
it.' W
aitin
g lis
ts f
or c
hild
care
ass
ista
nce
in T
exas
are
very
long
, and
relia
ble
estim
ates
sug
-
gest
that
onl
y a
smal
l fra
ctio
n of
pot
entia
llyel
igib
le c
hild
ren
in th
e st
ate,
as
in th
e na
tion,
actu
ally
rec
eive
this
sup
port
.' W
hen
the
2003
r\jo
reau
thor
izat
ion
of f
eder
al w
elfa
re r
efor
m le
gisl
a-
tion
take
s ef
fect
, par
enta
l wor
k re
quir
emen
ts
will
ris
e fr
om 3
0 to
40
hour
s pe
r w
eek,
str
aini
ng
even
mor
e th
e av
aila
bilit
y of
aff
orda
ble
child
care
for
low
-inc
ome
wor
king
par
ents
.Thr
ough
ouch
ildre
Low
qua
lity
and
inac
cess
ible
ear
ly c
are
and
educ
atio
n di
spro
port
iona
tely
hur
ts f
amili
es in
pove
rty
and
the
wor
king
poo
r.9'
'' Sa
fe a
nd
relia
ble
child
car
e is
exp
ensi
ve, e
stim
ated
at
near
ly $
6,00
0 pe
r ye
ar f
or a
one
-yea
r-ol
d ch
ild
in a
chi
ld c
are
cent
er o
r lic
ense
d ho
me.
" A
rece
nt r
epor
t fro
m th
e C
hild
ren'
s D
efen
se
\V/
Fund
fou
nd th
at in
all
but o
ne s
tate
(no
tT
exas
), th
e ye
arly
cos
t of
child
car
e ex
ceed
ed
annu
al e
xpen
ses
for
publ
ic c
olle
ge tu
ition
."
In T
exas
, the
mon
thly
cos
t of
care
for
two
t Tex
as, a
rel
ativ
ely
smal
l fra
ctio
n of
n re
ceiv
e st
ate
subs
idiz
ed c
hild
car
e.
child
ren
rang
es f
rom
a lo
w o
f $4
08 in
the
Bro
wnv
ille
met
ropo
litan
are
a to
a h
igh
of
$613
in th
e D
alla
s m
etro
polit
an a
rea.
°D
epen
ding
on
a fa
mily
's n
umbe
r of
wag
e
earn
ers
and
depe
nden
t chi
ldre
n, th
ese
cost
s
can
repr
esen
t bet
wee
n 14
% a
nd 2
2% o
f th
epr
e-ta
x to
tal r
equi
red
to p
ay f
or b
asic
nee
ds.
CH
OW
CA
,RE
, HE
AD
Si R
I, A
ND
KR
UK
PR
E-K
ON
DE
RG
RT
EN
Incr
ease
d w
orkf
orce
par
ticip
atio
n by
the
mot
hers
of
even
ver
y yo
ung
child
ren
has
enco
urag
ed g
reat
er p
ublic
acc
epta
nce
of th
e
criti
cal n
eed
for
acce
ssib
le, a
ffor
dabl
e, q
ualit
y
child
car
e. B
ecau
se th
e hi
gh c
ost o
f ca
re d
is-
prop
ortio
nate
ly b
urde
ns lo
w-i
ncom
e w
orki
ng
fam
ilies
, chi
ld c
are
polic
ies
have
pri
mar
ily
soug
ht to
ass
ist p
oor
fam
ilies
and
thos
e w
ith
inco
mes
just
abo
ve th
e of
fici
al p
over
ty le
vel.
Man
ytho
ugh
by n
o m
eans
the
maj
ority
ofth
e w
orke
rs in
thes
e fa
mili
es a
re m
akin
g th
e
tran
sitio
n fr
om p
ublic
ass
ista
nce
to p
aid
empl
oym
ent.
Wel
fare
ref
orm
act
ions
sin
ce 1
996
have
dra
-m
atic
ally
alte
red
child
car
e po
licy,
and
its
outc
omes
, in
Tex
as. B
oth
fund
ing
for
child
care
and
the
num
ber
of c
hild
ren
rece
ivin
g
child
car
e su
bsid
ies
have
gro
wn.
In
1996
,sp
endi
ng o
n ch
ild c
are
subs
idie
s in
the
stat
e
cam
e to
$17
9.9
mill
ion,
with
sta
te d
olla
rsac
coun
ting
for
12.5
% o
f th
at to
tal.
By
2003
,ch
ild c
are
subs
idie
s in
crea
sed
to $
441.
4 m
il-
lion,
with
sta
te f
unds
rep
rese
ntin
g 17
%. T
henu
mbe
r of
chi
ldre
n se
rved
by
the
stat
e's
child
care
sys
tem
has
incr
ease
d fr
om 6
3,22
1 in
1996
to a
pro
ject
ed 1
07,1
95 b
y 20
03.
Des
pite
this
gro
wth
in s
pend
ing
and
enro
ll-m
ent,
thou
gh, T
exas
' chi
ld c
are
syst
em r
emai
ns

unde
r-fu
nded
and
inad
equa
te to
add
ress
the
true
leve
l of
need
. Tho
ugh
larg
er th
an in
pri
or
year
s, s
tate
chi
ld c
are
appr
opri
atio
ns f
or f
isca
l
year
s 20
02 a
nd 2
003
wer
e to
o lo
w to
qua
lify
the
stat
e fo
r its
ent
ire
allo
tmen
t of
fede
ral c
hild
care
mat
chin
g fu
nds,
leav
ing
Loc
al W
orkf
orce
Dev
elop
men
t Boa
rds
to m
ake
up th
e di
ffer
-
ence
. Usi
ng th
e st
ate'
s m
axim
um a
llow
able
eli-
gibi
lity
stan
dard
of
fam
ily in
com
e at
85%
of
stat
e m
edia
n in
com
e as
a m
easu
re, a
ppro
xi-
mat
ely
1,23
6,80
0 ch
ildre
nalm
ost t
wel
vetim
es th
e nu
mbe
r ex
pect
ed to
be
serv
ed th
is
year
wou
ld q
ualif
y fo
r da
ytim
e ch
ild c
are
oraf
ter-
scho
ol c
are.
Acc
ordi
ng to
the
Tex
as
Wor
kfor
ce C
omm
issi
on, c
urre
ntly
mor
e th
an
34,0
00 c
hild
ren
thro
ugho
ut th
e st
ate
rem
ain
on th
e w
aitin
g lis
t for
chi
ld c
are
assi
stan
ce.
Hea
d St
art b
egan
in 1
965
as a
n ei
ght-
wee
ksu
mm
er p
rogr
am f
or lo
w-i
ncom
e pr
esch
oole
rs.
Tod
ay H
ead
Star
t pro
vide
s co
mpr
ehen
sive
educ
atio
nal a
nd h
ealth
ser
vice
s de
sign
ed to
impr
ove
the
scho
ol r
eadi
ness
of
the
natio
n's
need
iest
chi
ldre
ntho
se li
ving
in f
amili
esw
ith in
com
es a
t or
belo
w th
e po
vert
y lin
e an
dch
ildre
n w
ith d
isab
ilitie
s or
oth
er s
peci
al
need
s. C
hild
ren
rece
ivin
g T
empo
rary
Ass
ista
nce
for
Nee
dy F
amili
es (
TA
NF)
or
Supp
lem
enta
l Sec
urity
Inc
ome
(SSI
) ca
n au
to-
mat
ical
ly e
nrol
l in
Hea
d St
art,
and
10%
of
The
num
ber
of c
hild
ren
rece
ivin
gpr
e-ki
nder
gart
en s
ervi
ces
has
grow
n su
bsta
ntia
lly.
Hea
d St
art s
lots
are
res
erve
d fo
r ch
ildre
n
with
dis
abili
ties.
Hea
d St
art p
rogr
ams
appr
oach
sch
ool r
eadi
ness
hol
istic
ally
,
addr
essi
ng n
ot o
nly
cogn
itive
dev
elop
men
tbu
t als
o su
pply
ing
othe
r es
sent
ial s
ervi
ces,
incl
udin
g he
alth
scr
eeni
ngs,
imm
uniz
atio
ns,
men
tal h
ealth
cou
nsel
ing,
den
tal s
ervi
ces,
nutr
itiou
s m
eals
, and
par
entin
g su
ppor
ts.1
4
Nat
iona
lly, H
ead
Star
t ser
vice
s re
ach
abou
t90
0,00
0 ch
ildre
n, o
nly
abou
t thr
ee o
ut o
f fi
ve
child
ren
who
qua
lify.
"
Lik
e H
ead
Star
t its
elf,
Ear
ly H
ead
Star
t ser
ves
fam
ilies
with
inco
mes
at o
r be
low
the
fede
ral
pove
rty
line
by s
uppo
rtin
g pr
enat
al h
ealth
,th
e de
velo
pmen
tal n
eeds
of
infa
nts
and
tod-
dler
s, a
nd th
e ov
eral
l wel
l-be
ing
of f
amili
es
with
ver
y yo
ung
child
ren.
Cre
ated
by
the
fede
ral r
eaut
hori
zatio
n of
Hea
d St
art i
n 19
94,
Ear
ly H
ead
Star
t has
gro
wn
from
a b
ase
of 6
8
prog
ram
s in
199
5 to
a to
tal o
f 70
8 pr
ogra
ms
in 2
002.
'6 D
espi
te th
is p
rogr
amm
atic
gro
wth
,
Ear
ly H
ead
Star
t enr
olls
onl
y ab
out t
hree
per
-ce
nt o
f th
ose
elig
ible
for
the
prog
ram
."
With
Hea
d St
art a
s a
mod
el, p
ublic
pre
-kin
der-
gart
en p
rogr
ams
bega
n to
em
erge
thro
ugho
utth
e U
nite
d St
ates
in th
e 19
80s,
and
the
num
ber
of s
tate
s of
feri
ng th
em g
rew
rap
idly
dur
ing
the
1990
s. T
he T
exas
Leg
isla
ture
ena
cted
the
stat
e's
publ
ic p
re-k
inde
rgar
ten
prog
ram
in 1
985,
and
the
Tex
as E
duca
tion
Age
ncy,
whi
ch a
dmin
iste
rs
it, b
egan
off
erin
g se
rvic
es in
the
1985
-198
6
scho
ol y
ear.
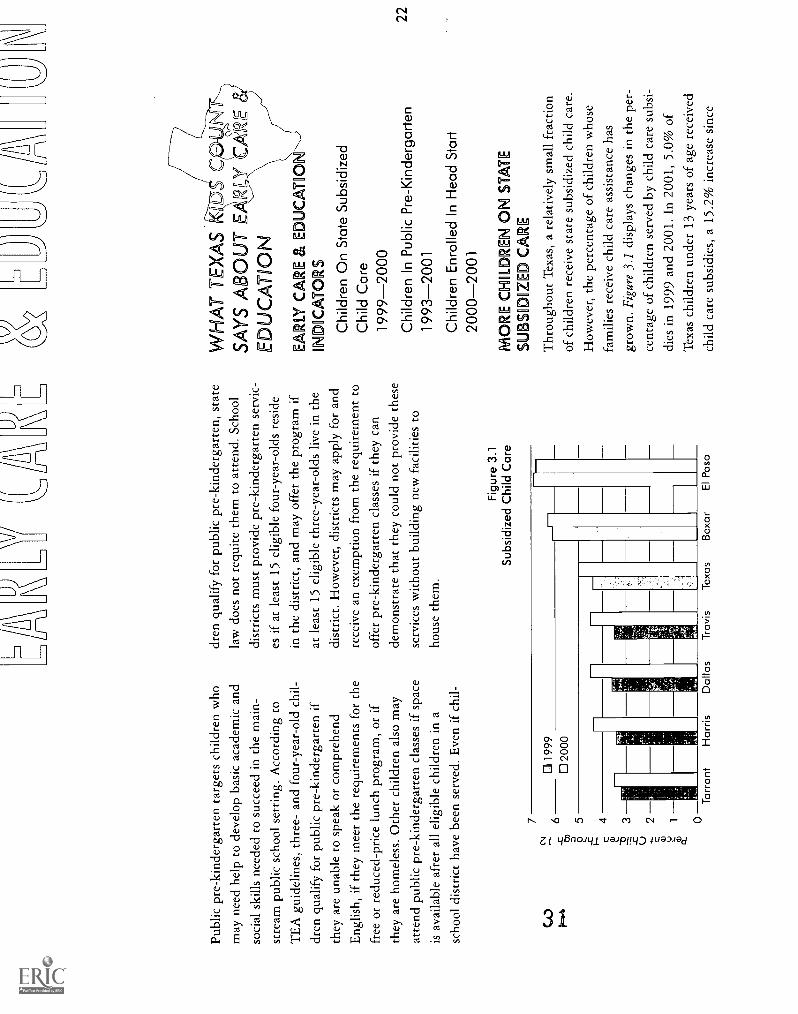
Publ
ic p
re-k
inde
rgar
ten
targ
ets
child
ren
who
may
nee
d he
lp to
dev
elop
bas
ic a
cade
mic
and
soci
al s
kills
nee
ded
to s
ucce
ed in
the
mai
n-
stre
am p
ublic
sch
ool s
ettin
g. A
ccor
ding
toT
EA
gui
delin
es, t
hree
- an
d fo
ur-y
ear-
old
chil-
dren
qua
lify
for
publ
ic p
re-k
inde
rgar
ten
ifth
ey a
re u
nabl
e to
spe
ak o
r co
mpr
ehen
dE
nglis
h, if
they
mee
t the
req
uire
men
ts f
or th
e
free
or
redu
ced-
pric
e lu
nch
prog
ram
, or
ifth
ey a
re h
omel
ess.
Oth
er c
hild
ren
also
may
atte
nd p
ublic
pre
-kin
derg
arte
n cl
asse
s if
spa
ce
is a
vaila
ble
afte
r al
l elig
ible
chi
ldre
n in
a
scho
ol d
istr
ict h
ave
been
ser
ved.
Eve
n if
chi
l-
dren
qua
lify
for
publ
ic p
re-k
inde
rgar
ten,
sta
tela
w d
oes
not r
equi
te th
em to
atte
nd. S
choo
l
dist
rict
s m
ust p
rovi
de p
re-k
inde
rgar
ten
serv
ic-
es if
at l
east
15
elig
ible
fou
r-ye
ar-o
lds
resi
de
in th
e di
stri
ct, a
nd m
ay o
ffer
the
prog
ram
ifat
leas
t 15
elig
ible
thre
e-ye
ar-o
lds
live
in th
edi
stri
ct. H
owev
er, d
istr
icts
may
app
ly f
or a
nd
rece
ive
an e
xem
ptio
n fr
om th
e re
quir
emen
t to
offe
r pr
e-ki
nder
gart
en c
lass
es if
they
can
dem
onst
rate
that
they
cou
ld n
ot p
rovi
de th
ese
serv
ices
with
out b
uild
ing
new
fac
ilitie
s to
hous
e th
em.
Fig
ure
3.1
Sub
sidi
zed
Chi
ld C
are
J}
WH
AT
TE
XA
S Il
lC
OL
(NSA
YS
AB
OU
T E
AR
LY
( CA
RE
ED
UC
AT
ION
EC
A R
E &
MIK
TO
ON
1ND
OC
AT
OR
S
Chi
ldre
n O
n S
tate
Sub
sidi
zed
Chi
ld C
are
1999
-200
0C
hild
ren
In P
ublic
Pre
-Kin
derg
arte
n19
93-2
001
Chi
ldre
n E
nrol
led
In H
ead
Sta
rt20
00-2
001
MO
RE
a-I
DIL
DR
EN
ON
ST
AT
ES
UB
SID
OZ
ED
C R
E
Thr
ough
out T
exas
, a r
elat
ivel
y sm
all f
ract
ion
of c
hild
ren
rece
ive
stat
e su
bsid
ized
chi
ld c
are.
How
ever
, the
per
cent
age
of c
hild
ren
who
sefa
mili
es r
ecei
ve c
hild
car
e as
sist
ance
has
grow
n. F
igur
e 3.
1 di
spla
ys c
hang
es in
the
per-
cent
age
of c
hild
ren
serv
ed b
y ch
ild c
are
subs
i-
dies
in 1
999
and
2001
. In
2001
, 5.0
% o
fT
exas
chi
ldre
n un
der
13 y
ears
of
age
rece
ived
child
car
e su
bsid
ies,
a 1
5.2%
incr
ease
sin
ce
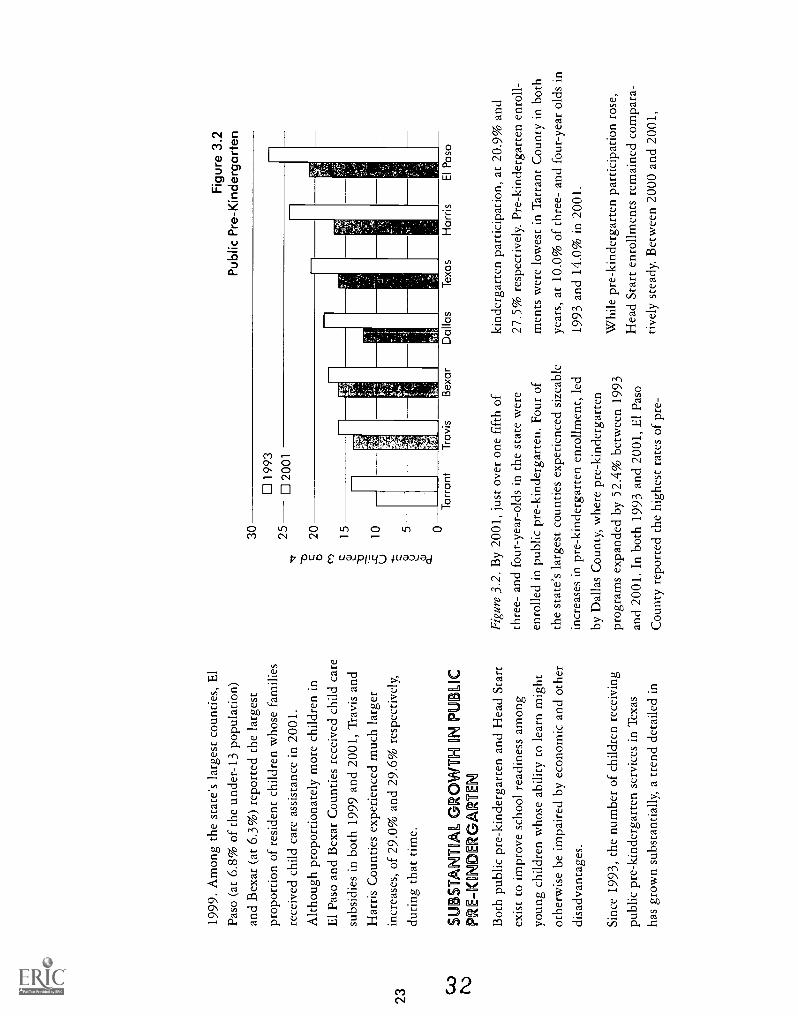
1999
. Am
ong
the
stat
e's
larg
est c
ount
ies,
El
Paso
(at
6.8
% o
f th
e un
der-
13 p
opul
atio
n)an
d B
exar
(at
6.3
%)
repo
rted
the
larg
est
prop
ortio
n of
res
iden
t chi
ldre
n w
hose
fam
ilies
rece
ived
chi
ld c
are
assi
stan
ce in
200
1.
Alth
ough
pro
port
iona
tely
mor
e ch
ildre
n in
El P
aso
and
Bex
ar C
ount
ies
rece
ived
chi
ld c
are
subs
idie
s in
bot
h 19
99 a
nd 2
001,
Tra
vis
and
Har
ris
Cou
ntie
s ex
peri
ence
d m
uch
larg
erin
crea
ses,
of
29.0
% a
nd 2
9.6%
res
pect
ivel
y,du
ring
that
tim
e.
SU
BS
TA
NT
IAL
GR
OW
TH
IN P
UB
LIC
PR
E-K
IND
ER
GA
RT
EN
Bot
h pu
blic
pre
-kin
derg
arte
n an
d H
ead
Sta
rtex
ist t
o im
prov
e sc
hool
rea
dine
ss a
mon
g
youn
g ch
ildre
n w
hose
abi
lity
to le
arn
mig
ht
othe
rwis
e be
impa
ired
by
econ
omic
and
oth
erdi
sadv
anta
ges.
Sinc
e 19
93, t
he n
umbe
r of
chi
ldre
n re
ceiv
ing
publ
ic p
re-k
inde
rgar
ten
serv
ices
in T
exas
has
grow
n su
bsta
ntia
lly, a
tren
d de
taile
d in
30 25 20 15 10 5 0
Fig
ure
3.2
Pub
lic P
re-K
inde
rgar
ten
Tar
rant
Tra
vis
Bex
ar
Figu
re 3
.2. B
y 20
01, j
ust o
ver
one
fift
h of
thre
e- a
nd f
our-
year
-old
s in
the
stat
e w
ere
enro
lled
in p
ublic
pre
-kin
derg
arte
n. F
our
of
the
stat
e's
larg
est c
ount
ies
expe
rien
ced
size
able
incr
ease
s in
pre
-kin
derg
arte
n en
rollm
ent,
led
by D
alla
s C
ount
y, w
here
pre
-kin
derg
arte
n
prog
ram
s ex
pand
ed b
y 52
.4%
bet
wee
n 19
93an
d 20
01. I
n bo
th 1
993
and
2001
, El P
aso
Cou
nty
repo
rted
the
high
est r
ates
of
pre-
Dal
las
Tex
asH
arris
El P
aso
kind
erga
rten
par
ticip
atio
n, a
t 20.
9% a
nd27
.5%
res
pect
ivel
y. P
re-k
inde
rgar
ten
enro
ll-
men
ts w
ere
low
est i
n T
arra
nt C
ount
y in
bot
h
year
s, a
t 10.
0% o
f th
ree-
and
fou
r-ye
ar o
lds
in19
93 a
nd 1
4.0%
in 2
001.
Whi
le p
re-k
inde
rgar
ten
part
icip
atio
n ro
se,
Hea
d St
art e
nrol
lmen
ts r
emai
ned
com
para
-
tivel
y st
eady
. Bet
wee
n 20
00 a
nd 2
001,
part
icip
atio
n in
the
Hea
d St
art p
rogr
am g
rew
by le
ss th
an 1
.0%
in T
exas
(up
by
0.3%
) an
d
in B
exar
(up
by
0.3%
), H
arri
s (u
p 0.
7%),
and
Dal
las
(up
0.8%
) C
ount
ies.
In
Tra
vis
and
Tar
rant
Cou
ntie
s, th
e pr
opor
tion
of c
hild
ren
serv
ed b
y H
ead
Star
t dec
lined
, dow
n 1.
9%
and
1.3%
res
pect
ivel
y. O
nly
El P
aso
Cou
nty
expe
rien
ced
a co
mpa
rativ
ely
perc
eptib
le
incr
ease
in H
ead
Star
t enr
ollm
ent,
grow
ing
5.5%
bet
wee
n 20
00 a
nd 2
001.
In
both
200
0
CA
..)an
d 20
01, E
l Pas
o an
d B
exar
Cou
ntie
s
(.4)
enr
olle
d ab
out t
hree
tim
es a
s m
any
of th
eir
thre
e- a
nd f
our-
year
-old
s in
Hea
d St
art a
s di
d
Tar
rant
, Har
ris,
and
Dal
las
Cou
ntie
s.
Alth
ough
the
prog
ram
s se
rve
popu
latio
ns
with
som
e si
mila
r ch
arac
teri
stic
s an
d ne
eds,
publ
ic p
re-k
inde
rgar
ten
reac
hes
a la
rger
prop
ortio
n of
you
ng c
hild
ren,
in T
exas
and
in
each
of
its la
rges
t cou
ntie
s, th
an H
ead
Star
tdo
es. S
tate
wid
e, m
ore
than
twic
e as
man
y
thre
e- a
nd f
our-
year
-old
s pa
rtic
ipat
e in
pub
lic
pre-
kind
erga
rten
(20
.6%
) as
in H
ead
Star
t(9
.3%
). T
he r
atio
bet
wee
n pr
e-ki
nder
gart
en
\V/
I/
CM
I1{D
,C
n,L
2P
aren
ts in
tuiti
vely
kno
w th
e st
akes
whe
nth
ey p
lace
thei
r ch
ildre
n in
the
care
of
othe
rs w
hile
they
wor
k. T
he jo
b of
car
ing
for
youn
g ch
ildre
n en
tails
eno
rmou
sre
spon
sibi
lity
for
thei
r co
gniti
ve, e
mot
iona
l,an
d so
cial
dev
elop
men
t. In
ess
ence
, chi
ldca
re q
ualit
y de
pend
s pr
imar
ily o
n th
e st
a-bi
lity,
mot
ivat
ion,
and
gen
uine
com
mitm
ent
of c
hild
car
e w
orke
rs. I
roni
cally
, a w
ork-
forc
e th
at fa
ces
such
dau
ntin
g ex
pect
atio
nsis
als
o on
e of
the
wor
st-c
ompe
nsat
ed a
ndle
ast-
supp
orte
d pr
ofes
sion
s in
the
coun
try.
Acc
ordi
ng to
a r
ecen
t rep
ort,
the
estim
ated
1.5
mill
ion
cent
er-b
ased
and
lice
nsed
child
car
e em
ploy
ees,
alo
ng w
ith a
noth
er1
mill
ion
licen
se-e
xem
pt p
aid
child
car
e
I N
7CD
IMX
7C)M
QM
wor
kers
, ear
n ab
out $
6.70
per
hou
r, o
r ha
lfth
e na
tion'
s av
erag
e ho
urly
wag
e. N
ot s
ur-
pris
ingl
y, lo
w p
ay is
the
prim
ary
reas
on th
atch
ild c
are
wor
kers
qui
t the
ir jo
bs, a
nd th
ew
orkf
orce
has
an
estim
ated
turn
over
rat
e of
abou
t 40%
. Ade
quat
e co
mpe
nsat
ion,
alo
ngw
ith r
easo
nabl
e w
orkl
oads
, bet
ter
trai
ning
,an
d m
ore
prom
isin
g ca
reer
pat
hs, c
ould
impr
ove
cond
ition
s fo
r w
orke
rs w
hose
effo
rts
are
inde
ed v
ital t
o ch
ild a
nd fa
mily
wel
lbei
ng.
The
Uns
olve
d C
halle
nge
of S
yste
m R
efor
m: T
he
Con
ditio
n of
the
Fro
ntlin
e H
uman
Ser
vice
s W
orkf
orce
Ann
ie E
. Cas
ey F
ound
atio
nw
ww
.aec
f.org
and
Hea
d St
art e
nrol
lmen
t is
larg
est i
n H
arri
sC
ount
y, w
here
mor
e th
an f
our
times
mor
e
youn
g ch
ildre
n ar
e en
rolle
d in
pre
-kin
derg
arte
n
(24.
1%)
com
pare
d to
Hea
d St
art (
5.5%
).

-I.
,
,Vir;
Sec
tion
4:Sc
hool
l Suc
cess
Nei
ther
a th
rivin
g m
arke
t eco
nom
y no
r a
viab
le
dem
ocra
cy c
an fu
nctio
n fo
r lo
ng w
ithou
t ade
quat
ely
educ
ated
wor
kers
and
citi
zens
. Pub
lic e
lem
enta
ry a
nd
seco
ndar
y sc
hool
s in
Tex
as w
ill a
dd m
illio
ns m
ore
stud
ents
ove
r th
e ne
xt s
ever
al d
ecad
es, a
nd th
e
qual
ity o
f the
se c
hild
ren'
s pr
epar
atio
n to
con
trib
ute
to
the
econ
omy
and
the
soci
ety
repr
esen
ts o
ne o
f the
stat
e's
mos
t piv
otal
cha
lleng
es.
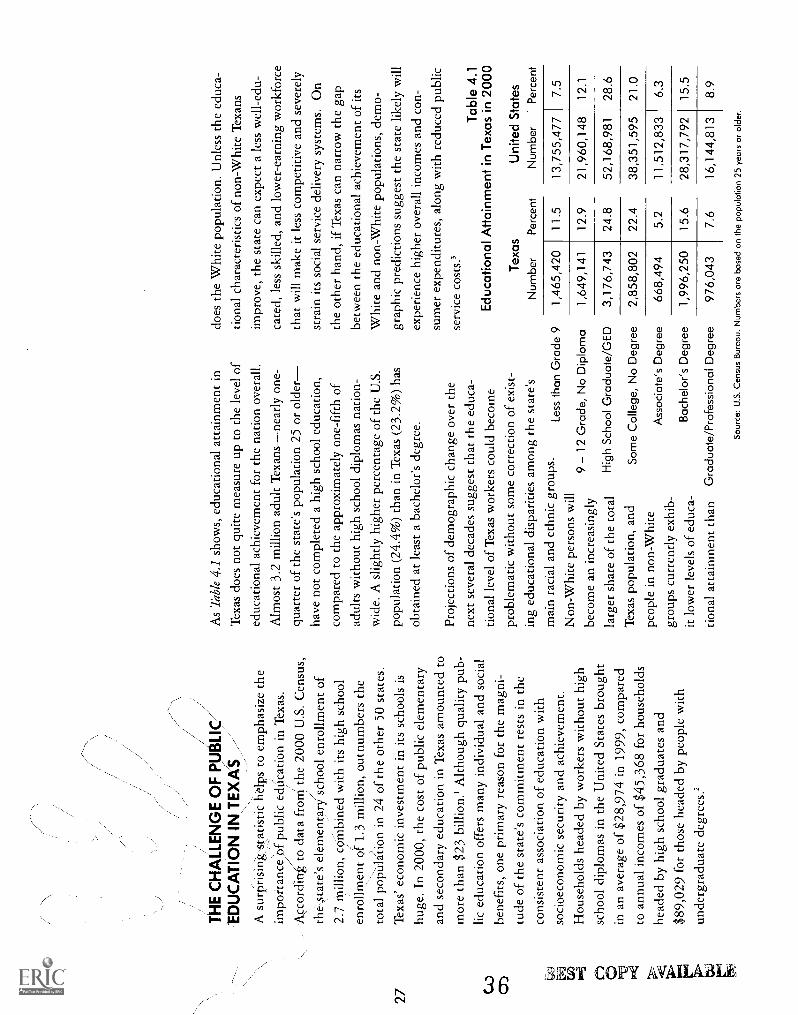
27
TH
E C
HA
LLE
NG
E O
F P
PE
*/E
DU
CA
TIO
N IN
TE
XA
S
A s
urpr
isin
g:st
atis
tic h
elps
to e
mph
asiz
e th
e
impo
rtan
ce o
f pu
blic
edU
catio
n in
Tex
as.
Acc
ordi
ni to
dat
a fr
oiri
the
2000
U.S
. Cen
sus,
the
stat
e's
elem
enta
ry s
choo
l enr
ollm
ent o
f2.
7 m
illio
n, c
ombi
ned
with
its
high
sch
ool
enro
llmen
t of
1.3
mill
ion,
out
num
bers
the
tota
l pop
ulat
ion
in 2
4 of
the
othe
r 50
sta
tes.
Tex
as' e
cono
mic
inve
stm
ent i
n its
sch
ools
is
huge
. In
2000
, the
cos
t of
publ
ic e
lem
enta
ryan
d se
cond
ary
educ
atio
n in
Tex
as a
mou
nted
to
mor
e th
an $
23 b
illio
n.' A
lthou
gh q
ualit
y pu
b-lic
edu
catio
n of
fers
man
y in
divi
dual
and
soc
ial
bene
fits
, one
pri
mar
y re
ason
for
the
mag
ni-
tude
of
the
stat
e's
com
mitm
ent r
ests
in th
eco
nsis
tent
ass
ocia
tion
of e
duca
tion
with
soci
oeco
nom
ic s
ecur
ity a
nd a
chie
vem
ent.
Hou
seho
lds
head
ed b
y w
orke
rs w
ithou
t hig
hsc
hool
dip
lom
as in
the
Uni
ted
Stat
es b
roug
htin
an
aver
age
of $
28,9
74 in
199
9, c
ompa
red
to a
nnua
l inc
omes
of
$45,
368
for
hous
ehol
ds
head
ed b
y hi
gh s
choo
l gra
duat
es a
nd
$89,
029
for
thos
e he
aded
by
peop
le w
ith
unde
rgra
duat
e de
gree
s.2
As
Tab
le 4
.1 s
how
s, e
duca
tiona
l atta
inm
ent i
n
Tex
as d
oes
not q
uite
mea
sure
up
to th
e le
vel o
f
educ
atio
nal a
chie
vem
ent f
or th
e na
tion
over
all.
Alm
ost 3
.2 m
illio
n ad
ult T
exan
snea
rly
one-
quar
ter
of th
e st
ate'
s po
pula
tion
25 o
r ol
der
have
not
com
plet
ed a
hig
h sc
hool
edu
catio
n,
com
pare
d to
the
appr
oxim
atel
y on
e-fi
fth
of
adul
ts w
ithou
t hig
h sc
hool
dip
lom
as n
atio
n-
wid
e. A
slig
htly
hig
her
perc
enta
ge o
f th
e U
.S.
popu
latio
n (2
4.4%
) th
an in
Tex
as (
23.2
%)
has
obta
ined
at l
east
a b
ache
lor's
deg
ree.
Proj
ectio
ns o
f de
mog
raph
ic c
hang
e ov
er th
e
next
sev
eral
dec
ades
sug
gest
that
the
educ
a-
tiona
l lev
el o
f T
exas
wor
kers
cou
ld b
ecom
e
prob
lem
atic
with
out s
ome
corr
ectio
n of
exi
st-
ing
educ
atio
nal d
ispa
ritie
s am
ong
the
mai
n ra
cial
and
eth
nic
grou
ps.
Non
-Whi
te p
erso
ns w
ill
beco
me
an in
crea
sing
ly
larg
er s
hare
of
the
tota
l
Tex
as p
opul
atio
n, a
nd
peop
le in
non
-Whi
te
grou
ps c
urre
ntly
exh
ib-
it lo
wer
leve
ls o
f ed
uca-
tiona
l atta
inm
ent t
han
stat
e's
does
the
Whi
te p
opul
atio
n. U
nles
s th
e ed
uca-
tiona
l cha
ract
eris
tics
of n
on-W
hite
Tex
ans
impr
ove,
the
stat
e ca
n ex
pect
a le
ss w
ell-
edu-
cate
d, le
ss s
kille
d, a
nd lo
wer
-ear
ning
wor
kfor
ce
that
will
mak
e it
less
com
petit
ive
and
seve
rely
stra
in it
s so
cial
ser
vice
del
iver
y sy
stem
s. O
n
the
othe
r ha
nd, i
f T
exas
can
nar
row
the
gap
betw
een
the
educ
atio
nal a
chie
vem
ent o
f its
Whi
te a
nd n
on-W
hite
pop
ulat
ions
, dem
o-gr
aphi
c pr
edic
tions
sug
gest
the
stat
e lik
ely
will
expe
rien
ce h
ighe
r ov
eral
l inc
omes
and
con
-
sum
er e
xpen
ditu
res,
alo
ng w
ith r
educ
ed p
ublic
serv
ice
cost
s.'
Les
sth
an G
rade
9
912
Gra
de, N
o D
iplo
ma
Hig
h S
choo
l Gra
duat
e/G
ED
Som
e C
olle
ge, N
o D
egre
e
Ass
ocia
te's
Deg
ree
Bac
helo
r's D
egre
e
Gra
duat
e/P
rofe
ssio
nal D
egre
e
Edu
catio
nal A
ttain
men
t
Tex
asN
umbe
rP
erce
nt
Tab
le 4
.1in
Tex
as in
200
0
Uni
ted
Sta
tes
Num
ber
Per
cent
1,46
5,42
011
.513
,755
,477
7.5
1,64
9,14
112
.921
,960
,148
12.1
3,17
6,74
324
.852
,168
,981
28.6
2,85
8,80
222
.438
,351
,595
21.0
668,
494
5.2
11,5
12,8
336.
3
1,99
6,25
015
.628
,317
,792
15.5
976,
043
7.6
16,1
44,8
138.
9
Sou
rce:
U.S
. Cen
sus
Bur
eau.
Num
bers
are
bas
ed o
n th
e po
pula
tion
25 y
ears
or
olde
r.
HO
GH
SC
HO
OL
DR
OPO
UT
S
Stud
ents
who
leav
e hi
gh s
choo
l with
out o
btai
n-
ing
a di
plom
a fa
ce v
ery
seve
re e
cono
mic
and
othe
r co
nseq
uenc
es th
at f
ollo
w th
em f
or y
ears
.
Stud
ents
leav
e sc
hool
with
out g
radu
atin
g fo
r
reas
ons
that
ran
ge f
rom
poo
r at
tend
ance
and
low
gra
des
to p
regn
ancy
, mar
riag
e, o
r em
ploy
-
men
t.' W
hate
ver
thei
r re
ason
s, te
ens
who
dro
p
out o
f sc
hool
lack
the
mos
t bas
ic r
equi
rem
ent
need
ed to
acc
ess
furt
her
educ
atio
n or
ent
er th
e
labo
r fo
rce,
res
tric
ting
thei
r op
port
uniti
es f
or
empl
oym
ent a
nd in
com
e. H
igh
scho
ol d
ropo
uts
face
oth
er a
dver
se p
rosp
ects
. The
y ar
e m
ore
likel
y th
an h
igh
scho
ol g
radu
ates
to r
ecei
ve
publ
ic a
ssis
tanc
e an
d to
bec
ome
sing
le te
en
pare
nts.
Dro
pout
s re
pres
ent a
dis
prop
ortio
nate
shar
e of
the
natio
n's
pris
on p
opul
atio
n an
d
inm
ates
on
deat
h ro
w.
Bec
ause
the
resu
lts o
f no
t com
plet
ing
a hi
gh
scho
ol e
duca
tion
are
so b
leak
, per
vasi
ve, a
nd
last
ing,
the
met
hodo
logy
use
d to
mea
sure
hig
h
scho
ol d
ropo
ut a
nd c
ompl
etio
n ra
tes
is im
por-
tant
. It h
as a
lso
beco
me
som
ewha
t con
trov
er-
sial
, as
vari
ous
orga
niza
tions
use
and
adv
ocat
e
alte
rnat
ive
mea
sure
men
t app
roac
hes.
Dif
fere
nt
met
hodo
logi
es, i
n tu
rn, c
an y
ield
wid
ely
vari
ed
estim
ates
of
the
high
sch
ool d
ropo
ut r
ate.
In
1998
, the
Tex
as E
duca
tion
Age
ncy
revi
sed
its
met
hod
for
mea
suri
ng d
ropo
uts
in o
rder
to a
lso
trac
k hi
gh s
choo
l com
plet
ion
rate
s. T
EA
gen
er-
ates
its
stat
istic
s on
hig
h
scho
ol d
ropo
ut a
nd c
om-
plet
ion
rate
s by
trac
king
an e
ntir
e co
hort
of
nint
h-
grad
e st
uden
ts th
roug
h hi
gh s
choo
l, th
enre
cord
ing
each
stu
dent
's s
tatu
s at
the
end
offo
ur y
ears
. Stu
dent
s m
ay f
all i
nto
one
of f
our
cate
gori
es m
onito
red
by th
e T
EA
grad
uate
d,co
mpl
eted
GE
D, c
ontin
ued
in s
choo
l, or
drop
ped
out.
TE
A d
oes
not f
ollo
w s
tude
nts
afte
r th
e en
d of
the
four
-yea
r pe
riod
, so
the
agen
cy c
anno
t det
erm
ine
whe
ther
the
stat
us o
f
stud
ents
in th
e la
st th
ree
of th
ese
cate
gori
es h
as
chan
ged.
Usi
ng it
s re
vise
d dr
opou
t met
hodo
lo-
gy, T
EA
has
rep
orte
d a
stea
dy d
eclin
e in
hig
h
drop
out r
ates
thro
ugho
ut th
e la
te 1
990s
. The
mea
sure
men
t of
high
sch
ool a
ttriti
on r
ates
,
prop
osed
by
som
e ed
ucat
ion
rese
arch
ers
and
advo
cate
s, p
rese
nts
a le
ss p
ositi
ve v
iew
of
drop
out t
rend
s in
Tex
as. T
he a
ttriti
on a
ppro
ach
uses
enr
ollm
ent i
n th
e fi
rst a
nd la
st y
ears
of
LJ
1
high
sch
ool t
o es
timat
e th
e nu
mbe
r of
stu
dent
s
who
leav
e sc
hool
and
can
not b
e ac
coun
ted
for.
Thi
s m
etho
dolo
gy p
rodu
ces
drop
out p
erce
nt-
ages
sev
eral
tim
es h
ighe
r th
an th
e dr
opou
t
rate
s pr
ovid
ed b
y th
e T
EA
.6
Eac
h of
Tex
as' l
arge
st c
ount
ies
saw
dec
lines
in th
epe
rcen
tage
of h
igh
scho
ol d
ropo
uts,
alth
ough
the
size
of
this
gai
n va
ried
siza
bly.
STU
DE
NT
ASS
ESS
ME
NT
Des
pite
met
hodo
logi
cal d
ebat
e an
d co
ncer
n
abou
t the
app
ropr
iate
rol
e of
sta
ndar
dize
d te
st-
ing
in s
tude
nt e
valu
atio
n, s
ome
kind
of
aca-
dem
ic a
sses
smen
t is
need
ed in
ord
er f
or u
s to
know
wha
t stu
dent
s ac
tual
ly le
arn.
Man
y fa
c-
tors
aff
ect s
tude
nt a
chie
vem
ent,
incl
udin
g cl
ass
size
, tea
cher
mot
ivat
ion
and
trai
ning
, par
enta
l
invo
lvem
ent i
n th
eir
child
ren'
s sc
hool
ing,
stu
-
dent
s' s
peci
al n
eeds
, and
eve
n ba
sics
whe
ther
child
ren
rest
eno
ugh
at n
ight
and
eat
bre
akfa
stin
the
mor
ning
.' A
lthou
gh a
chie
vem
ent t
estin
g
at ti
mes
has
bee
n co
ntro
vers
ial,
it cu
rren
tly
enjo
ys b
road
pub
lic a
nd b
ipar
tisan
pol
itica
l
supp
ort.
Scho
ol a
ccou
ntab
ility
anc
hors
the
fed-
eral
No
Chi
ld L
eft B
ehin
d A
ct th
at b
ecam
e la
w
in e
arly
200
2. T
his
legi
slat
ion
requ
ires
sta
tes
to
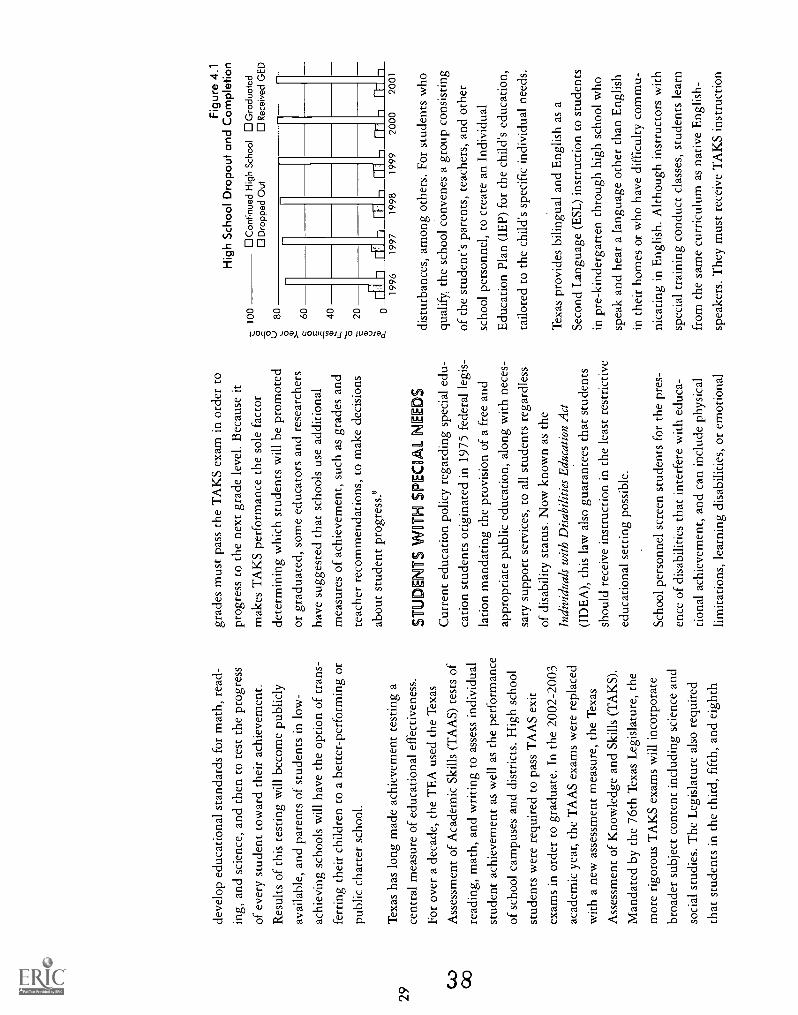
deve
lop
educ
atio
nal s
tand
ards
for
mat
h, r
ead-
ing,
and
sci
ence
, and
then
to te
st th
e pr
ogre
ss
of e
very
stu
dent
tow
ard
thei
r ac
hiev
emen
t.
Res
ults
of
this
test
ing
will
bec
ome
publ
icly
avai
labl
e, a
nd p
aren
ts o
f st
uden
ts in
low
-
achi
evin
g sc
hool
s w
ill h
ave
the
optio
n of
tran
s-
ferr
ing
thei
r ch
ildre
n to
a b
ette
r-pe
rfor
min
g or
publ
ic c
hart
er s
choo
l.
Tex
as h
as lo
ng m
ade
achi
evem
ent t
estin
g a
cent
ral m
easu
re o
f ed
ucat
iona
l eff
ectiv
enes
s.
For
over
a d
ecad
e, th
e T
EA
use
d th
e T
exas
Ass
essm
ent o
f A
cade
mic
Ski
lls (
TA
AS)
test
s of
read
ing,
mat
h, a
nd w
ritin
g to
ass
ess
indi
vidu
al
stud
ent a
chie
vem
ent a
s w
ell a
s th
e pe
rfor
man
ce
of s
choo
l cam
puse
s an
d di
stri
cts.
Hig
h sc
hool
stud
ents
wer
e re
quir
ed to
pas
s T
AA
S ex
it
exam
s in
ord
er to
gra
duat
e. I
n th
e 20
02-2
003
acad
emic
yea
r, th
e T
AA
S ex
ams
wer
e re
plac
ed
with
a n
ew a
sses
smen
t mea
sure
, the
Tex
as
Ass
essm
ent o
f K
now
ledg
e an
d Sk
ills
(TA
KS)
.
Man
date
d by
the
76th
Tex
as L
egis
latu
re, t
he
mor
e ri
goro
us T
AK
S ex
ams
will
inco
rpor
ate
broa
der
subj
ect c
onte
nt in
clud
ing
scie
nce
and
soci
al s
tudi
es. T
he L
egis
latu
re a
lso
requ
ired
that
stu
dent
s in
the
thir
d, f
ifth
, and
eig
hth
grad
es m
ust p
ass
the
TA
KS
exam
in o
rder
to
prog
ress
to th
e ne
xt g
rade
leve
l. B
ecau
se it
mak
es T
AK
S pe
rfor
man
ce th
e so
le f
acto
r
dete
rmin
ing
whi
ch s
tude
nts
will
be
prom
oted
or g
radu
ated
, som
e ed
ucat
ors
and
rese
arch
ers
have
sug
gest
ed th
at s
choo
ls u
se a
dditi
onal
mea
sure
s of
ach
ieve
men
t, su
ch a
s gr
ades
and
teac
her
reco
mm
enda
tions
, to
mak
e de
cisi
ons
abou
t stu
dent
pro
gres
s.'
ST
UD
EN
TS
MT
H S
PE
C]
L N
EE
DS
Cur
rent
edu
catio
n po
licy
rega
rdin
g sp
ecia
l edu
-
catio
n st
uden
ts o
rigi
nate
d in
197
5 fe
dera
l leg
is-
latio
n m
anda
ting
the
prov
isio
n of
a f
ree
and
appr
opri
ate
publ
ic e
duca
tion,
alo
ng w
ith n
eces
-
sary
sup
port
ser
vice
s, to
all
stud
ents
reg
ardl
ess
of d
isab
ility
sta
tus.
Now
kno
wn
as th
e
Indi
vidu
als
with
Dis
abili
ties
Edu
catio
n A
ct
(ID
EA
), th
is la
w a
lso
guar
ante
es th
at s
tude
nts
shou
ld r
ecei
ve in
stru
ctio
n in
the
leas
t res
tric
tive
educ
atio
nal s
ettin
g po
ssib
le.
Scho
ol p
erso
nnel
scr
een
stud
ents
for
the
pres
-
ence
of
disa
bilit
ies
that
inte
rfer
e w
ith e
duca
-
tiona
l ach
ieve
men
t, an
d ca
n in
clud
e ph
ysic
al
limita
tions
, lea
rnin
g di
sabi
litie
s, o
r em
otio
nal
Fig
ure
4.1
Hig
h S
choo
l Dro
pout
and
Com
plet
ion
100
Con
tinue
d H
igh
Sch
ool 0
Gra
duat
edD
ropp
ed O
utR
ecei
ved
GE
D
80 60 40 20
0if
IT'7
rT11
-19
9619
9719
9819
9920
0020
01
dist
urba
nces
, am
ong
othe
rs. F
or s
tude
nts
who
qual
ify,
the
scho
ol c
onve
nes
a gr
oup
cons
istin
g
of th
e st
uden
t's p
aren
ts, t
each
ers,
and
oth
ersc
hool
per
sonn
el, t
o cr
eate
an
Indi
vidu
al
Edu
catio
n Pl
an(I
EP
)fo
r th
e ch
ild's
edu
catio
n,
tailo
red
to th
e ch
ild's
spe
cifi
c in
divi
dual
nee
ds.
Tex
as p
rovi
des
bilin
gual
and
Eng
lish
as a
Seco
nd L
angu
age
(ESL
) in
stru
ctio
n to
stu
dent
s
in p
re-k
inde
rgar
ten
thro
ugh
high
sch
ool w
ho
spea
k an
d he
ar a
lang
uage
oth
er th
an E
nglis
h
in th
eir
hom
es o
r w
ho h
ave
diff
icul
ty c
omm
u-
nica
ting
in E
nglis
h. A
lthou
gh in
stru
ctor
s w
ith
spec
ial t
rain
ing
cond
uct c
lass
es, s
tude
nts
lear
n
from
the
sam
e cu
rric
ulum
as
nativ
e E
nglis
h-
spea
kers
. The
y m
ust r
ecei
ve T
AK
S in
stru
ctio
n
in E
nglis
h, a
nd b
iling
ual a
nd E
SL s
tude
nts
also
part
icip
ate
in th
e sa
me
lang
uage
art
s, r
eadi
ng,
mat
h, s
cien
ce, s
ocia
l stu
dies
, mus
ic, a
rt, a
nd
phys
ical
edu
catio
n ac
tiviti
es m
anda
ted
for
stu-
dent
s w
hose
fir
st la
ngua
ge is
Eng
lish.
WH
AT
TE
XA
S K
IDS
CO
UN
TSA
YS
AB
OU
T S
CH
OO
LSU
CC
ESS
SC
HO
OL
SU
CC
ES
S IN
DIC
AT
OR
S
Hig
h S
choo
l Dro
pout
& C
ompl
etio
n19
9620
01C
A)
CC
)S
tude
nts
Pas
sing
TA
AS
Rea
ding
1994
2002
Stu
dent
s P
assi
ng T
AA
S M
ath
1994
2002
Stu
dent
s P
assi
ng T
AA
S W
ritin
g
1994
2002
Spe
cial
Edu
catio
n S
tude
nts
1993
-200
2
Stu
dent
s In
Bili
ngua
l/ES
L P
rogr
ams
1993
2002
TE
XA
S D
RO
PO
UT
AN
DE
QU
IVA
LEN
CY
RA
TE
S F
ALL
Acc
ordi
ng to
dat
a as
sem
bled
by
the
Tex
as
Edu
catio
n A
genc
y an
d pr
esen
ted
in F
igur
e 4.
1,
high
sch
ool d
ropo
ut r
ates
in th
e st
ate
fell
by
alm
ost h
alf
sinc
e th
e m
id-1
990s
, fro
m 1
2.1%
in 1
996
to 6
.2%
in 2
001.
Dur
ing
that
tim
e,th
e pe
rcen
tage
of
high
sch
ool s
tude
nts
who
com
plet
ed G
ED
cer
tific
ates
als
o de
clin
ed b
y a
little
ove
r on
e-fi
fth,
fro
m 6
.1%
to 4
.8%
. Whi
le
drop
outs
fel
l pro
gres
sive
ly d
urin
g th
e pe
riod
,
the
GE
D c
ompl
etio
n ra
te r
each
ed it
s lo
wes
t
poin
t in
1999
, the
n ro
se a
gain
in 2
000
and
rem
aine
d le
vel i
n 20
01. T
he p
erce
ntag
e of
stu
-
dent
s gr
adua
ting
on ti
me
(up
8.8%
, fro
m
74.5
% to
81.
1%)
and
of s
tude
nts
cont
inui
nghi
gh s
choo
l at t
he e
nd o
f fo
ur y
ears
(up
8.9
%,
from
7.2
% to
7.9
%)
each
ros
e ju
st le
ss th
an
one-
tent
h be
twee
n 19
96 a
nd 2
001.
In
2001
, alit
tle m
ore
than
80%
of
Tex
as h
igh
scho
ol s
tu-
dent
s gr
adua
ted
on ti
me,
com
pare
d to
just
unde
r th
ree-
quar
ters
of
thes
e st
uden
ts in
199
6.
Eac
h of
Tex
as' l
arge
st c
ount
ies
also
saw
decl
ines
in th
e pe
rcen
tage
of
high
sch
ool
drop
outs
, alth
ough
, as
show
n in
Fig
ure
4.2,
the
SCH
OO
L S
AFE
TY
Sta
tistic
ally
, we
know
that
muc
h m
ore
of
the
serio
us v
iole
nt c
rime
invo
lvin
g sc
hool
-
aged
chi
ldre
n an
d yo
uth
occu
rs o
utsi
de
the
scho
ol s
ettin
g th
an w
ithin
it. S
till,
viol
ent c
rimes
at s
choo
l vic
timiz
ed a
bout
700,
000
stud
ents
age
d 12
thro
ugh
18 in
2000
and
aro
und
559,
000
teac
hers
durin
g th
e fiv
e-ye
ar p
erio
d be
twee
n 19
96
and
2000
. In
2001
, 20%
of s
tude
nts
repo
rted
the
pres
ence
of s
tree
t gan
gs a
t
thei
r sc
hool
. App
roxi
mat
ely
12%
of 1
2- to
18-y
ear-
olds
des
crib
ed th
e us
e of
hat
e-
rela
ted
lang
uage
by
anot
her
pers
on,
dire
cted
tow
ard
them
selv
es. A
noth
er 3
6%
saw
der
ogat
ory
hate
-rel
ated
gra
ffiti
at
thei
r sc
hool
. Not
onl
y is
the
safe
ty o
f stu
-
dent
s an
d in
stru
ctor
s at
ris
k. A
clim
ate
of
thre
at a
nd in
timid
atio
n m
akes
it m
uch
hard
er to
teac
h an
d le
arn,
and
for
our
scho
ols
to w
ork.
Indi
cato
rs o
f Sch
ool
Crim
e an
d S
afet
y 20
02
Nat
iona
l Cen
ter
for
Edu
catio
n S
tatis
tics
ww
w.n
ces.
ed.g
ov
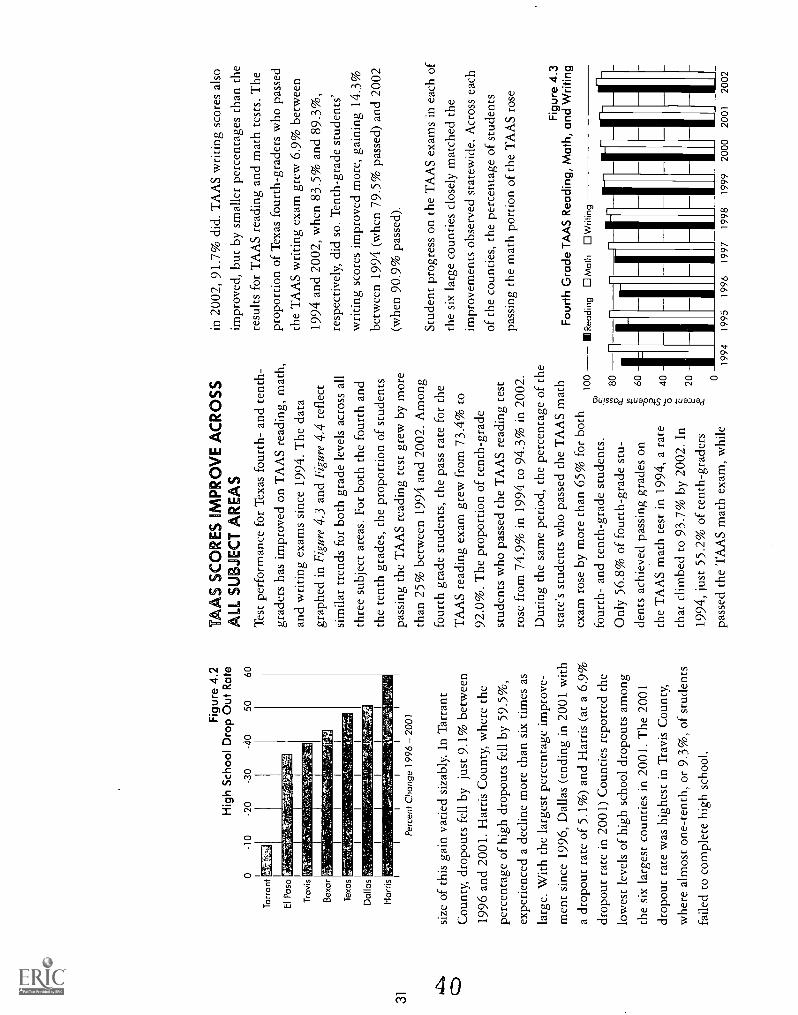
0
Tar
rant
El P
aso
Tra
vis
Bex
ar
Tex
as
Dal
las
Har
ris
-10
Fig
ure
4.2
Hig
h S
choo
l Dro
p O
ut R
ate
-20
-30
-40
-50
-60
Per
cent
Cha
nge
1996
- 2
001
size
of
this
gai
n va
ried
siz
ably
. In
Tar
rant
Cou
nty,
dro
pout
s fe
ll by
just
9.1
% b
etw
een
1996
and
200
1. H
arri
s C
ount
y, w
here
the
perc
enta
ge o
f hi
gh d
ropo
uts
fell
by 5
9.5%
,
expe
rien
ced
a de
clin
e m
ore
than
six
tim
es a
s
larg
e. W
ith th
e la
rges
t per
cent
age
impr
ove-
men
t sin
ce 1
996,
Dal
las
(end
ing
in 2
001
with
a dr
opou
t rat
e of
5.1
%)
and
Har
ris
(at a
6.9
%dr
opou
t rat
e in
200
1) C
ount
ies
repo
rted
the
low
est l
evel
s of
hig
h sc
hool
dro
pout
s am
ong
the
six
larg
est c
ount
ies
in 2
001.
The
200
1dr
opou
t rat
e w
as h
ighe
st in
Tra
vis
Cou
nty,
whe
re a
lmos
t one
-ten
th, o
r 9.
3%, o
f st
uden
ts
faile
d to
com
plet
e hi
gh s
choo
l.
TA
AS
SC
OR
ES
IMP
RO
VE
AC
RO
SS
ALL
SU
BJE
CT
AR
EA
S
Tes
t per
form
ance
for
Tex
as f
ourt
h- a
nd te
nth-
grad
ers
has
impr
oved
on
TA
AS
read
ing,
mat
h,
and
wri
ting
exam
s si
nce
1994
. The
dat
a
grap
hed
in F
igur
e 4.
3 an
d Fi
gure
4.4
ref
lect
sim
ilar
tren
ds f
or b
oth
grad
e le
vels
acr
oss
all
thre
e su
bjec
t are
as. F
or b
oth
the
four
th a
nd
the
tent
h gr
ades
, the
pro
port
ion
of s
tude
nts
pass
ing
the
TA
AS
read
ing
test
gre
w b
y m
ore
than
25%
bet
wee
n 19
94 a
nd 2
002.
Am
ong
four
th g
rade
stu
dent
s, th
e pa
ss r
ate
for
the
TA
AS
read
ing
exam
gre
w f
rom
73.
4% to
92.0
%. T
he p
ropo
rtio
n of
tent
h-gr
ade
stud
ents
who
pas
sed
the
TA
AS
read
ing
test
rose
fro
m 7
4.9%
in 1
994
to 9
4.3%
in 2
002.
Dur
ing
the
sam
e pe
riod
, the
per
cent
age
of th
e
stat
e's
stud
ents
who
pas
sed
the
TA
AS
mat
h
exam
ros
e by
mor
e th
an 6
5% f
or b
oth
100
four
th-
and
tent
h-gr
ade
stud
ents
.
Onl
y 56
.8%
of
four
th-g
rade
stu
-
dent
s ac
hiev
ed p
assi
ng g
rade
s on
the
TA
AS
mat
h te
st in
199
4, a
rat
e
that
clim
bed
to 9
3.7%
by
2002
. In
1994
, jus
t 55.
2% o
f te
nth-
grad
ers
pass
ed th
e T
AA
S m
ath
exam
, whi
le
80 60-a 0 U
, 0
in 2
002,
91.
7% d
id. T
AA
S w
ritin
g sc
ores
als
o
impr
oved
, but
by
smal
ler
perc
enta
ges
than
the
resu
lts f
or T
AA
S re
adin
g an
d m
ath
test
s. T
he
prop
ortio
n of
Tex
as f
ourt
h-gr
ader
s w
ho p
asse
d
the
TA
AS
wri
ting
exam
gre
w 6
.9%
bet
wee
n
1994
and
200
2, w
hen
83.5
% a
nd 8
9.3%
,re
spec
tivel
y, d
id s
o. T
enth
-gra
de s
tude
nts'
wri
ting
scor
es im
prov
ed m
ore,
gai
ning
14.
3%
betw
een
1994
(w
hen
79.5
% p
asse
d) a
nd 2
002
(whe
n 90
.9%
pas
sed)
.
Stud
ent p
rogr
ess
on th
e T
AA
S ex
ams
in e
ach
of
the
six
larg
e co
untie
s cl
osel
y m
atch
ed th
e
impr
ovem
ents
obs
erve
d st
atew
ide.
Acr
oss
each
of th
e co
untie
s, th
e pe
rcen
tage
of
stud
ents
pass
ing
the
mat
h po
rtio
n of
the
TA
AS
rose
Fig
ure
4.3
Fou
rth
Gra
de T
AA
S R
eadi
ng, M
ath,
and
Writ
ing
E R
eadi
ngM
ath
Writ
ing
40
U20
019
9419
9519
9619
9719
9819
9920
0020
0120
02

mos
t, fo
llow
ed in
turn
by
scor
es f
or th
e T
AA
S
read
ing
and
wri
ting
exam
s. C
onsi
sten
tly,
incr
ease
s in
the
pass
rat
e fo
r al
l thr
ee s
ubje
cts
in B
exar
and
El P
aso
Cou
ntie
s ou
tper
form
ed
the
stat
e an
d th
e ot
her
larg
e co
untie
s fo
r bo
thfo
urth
- an
d te
nth-
grad
e st
uden
ts. O
n th
e
TA
AS
read
ing
test
, fou
rth-
grad
e sc
ores
a:a.
impr
oved
mos
t in
Bex
ar C
ount
y (u
p 41
.0%
,I-
4'co
mpa
red
to th
e st
atew
ide
incr
ease
of
25.4
%)
and
the
larg
est t
enth
-gra
de g
ain
occu
rred
in
El P
aso
Cou
nty
(up
42.9
%, c
ompa
red
to a
25.9
% r
ise
in th
e st
atew
ide
pass
rat
e). T
hepe
rcen
tage
incr
ease
in s
tude
nts
pass
ing
the
four
th-g
rade
mat
h ex
am w
as
103.
5% in
Bex
ar C
ount
y, w
hile
Tex
as o
vera
ll sa
w a
n in
crea
se o
fN
80
64.9
% T
he p
ropo
rtio
n of
stu
dent
spa
ssin
g th
e te
nth-
grad
e m
ath
exam
also
dou
bled
in E
l Pas
o C
ount
y, r
is-
ing
by 1
00.3
% c
ompa
red
to a
66.2
% in
crea
se s
tate
wid
e. R
isin
g by
14.3
%, B
exar
Cou
nty
also
led
the
stat
e an
d th
e ot
her
five
larg
est c
ount
ies
in th
e im
prov
emen
t in
pass
rat
es f
or th
e
four
th-g
rade
TA
AS
wri
ting
exam
. In
Tex
as,
the
incr
ease
in f
ourt
h-gr
ade
TA
AS
wri
ting
perf
orm
ance
was
6.9
%. T
enth
-gra
de w
ritin
gsc
ores
gai
ned
by 2
2.1%
in E
l Pas
o C
ount
y,w
hile
they
ros
e 14
.3%
thro
ugho
ut th
e st
ate.
MO
RE
ST
UD
EN
TS
RE
CE
IVO
NG
SPE
C L
ED
UC
TO
ON
AN
DO
EH
LO
NG
U L
SE
RV
OC
ES
Publ
ic s
choo
ls in
Tex
as h
ave
expe
rien
ced
som
e
grow
th in
the
prop
ortio
n of
stu
dent
s se
rved
by
both
spe
cial
edu
catio
n an
d bi
lingu
al o
r E
SL
prog
ram
s. I
n 19
93, 1
0.4%
of
stud
ents
enr
olle
d
Fig
ure
4.4
Ten
th G
rade
TA
AS
Rea
ding
, Mat
h, a
nd W
ritin
g
100
Rea
ding
Mat
hW
ritin
g
60 40 20
019
9419
9519
9619
9719
9819
9920
0020
0120
02
in T
exas
pub
lic s
choo
ls r
ecei
ved
som
e ki
nd o
f
spec
ial e
duca
tion
serv
ices
. By
2002
, tha
tam
ount
had
gro
wn
by 1
4.5%
, to
incl
ude
III
1
11/
11.9
% o
f pu
blic
sch
ool s
tude
nts.
The
per
cent
-
age
of s
tude
nts
part
icip
atin
g in
bili
ngua
l or
ESL
pro
gram
min
g st
atew
ide
incr
ease
d by
mor
e
than
one
-thi
rd, f
rom
9.7
% to
13.
0%, b
etw
een
1993
and
200
2.
Gai
ns in
the
perc
enta
ge o
f st
uden
ts r
ecei
ving
spec
ial e
duca
tion
or b
iling
ual s
ervi
ces
also
occu
rred
in e
ach
of th
e st
ate'
s la
rge
coun
ties,
but t
hese
cha
nges
var
ied,
som
etim
es c
onsi
der-
ably
, acr
oss
coun
ties
and
in c
ompa
riso
n to
Tex
as o
vera
ll. W
ith a
n in
crea
se o
f 31
.8%
, El
Paso
Cou
nty
serv
ed a
lmos
t one
-thi
rd m
ore
spe-
cial
edu
catio
n st
uden
ts in
200
2 co
mpa
red
to
1993
. Yet
the
prop
ortio
n of
stu
dent
s re
ceiv
ing
spec
ial e
duca
tion
supp
ort g
rew
by
only
4.8
% in
Tar
rant
Cou
nty
duri
ng th
e sa
me
time.
Bili
ngua
l ins
truc
tion
in th
e si
x la
rges
t cou
ntie
s
show
ed e
ven
mor
e va
riat
ion.
Bex
ar C
ount
y
repo
rted
a n
earl
y im
perc
eptib
le 0
.2%
ris
e in
the
prop
ortio
n of
its
stud
ents
who
rec
eive
d
bilin
gual
inst
ruct
ion,
whi
le th
is r
ate
mor
e th
an
doub
led
(up
by 1
18.8
%)
in T
ravi
s C
ount
y an
dro
se n
earl
y as
muc
h in
Dal
las
(up
by 8
2.5%
)
and
Tar
rant
(up
by
89.0
%)
Cou
ntie
s.

.
1
-4
*'
Kvt-
-44
ri...A.10V
''
t,

Sec
tion
5:ee
ns a
tU
skA
dole
scen
ce r
epre
sent
s th
e tr
ansi
tion
from
chi
ldho
od
stru
ctur
e to
the
free
dom
s an
d re
spon
sibi
litie
s of
adu
lt-
hood
. With
the
guid
ance
of p
aren
ts, t
each
ers,
and
othe
r ca
ring
com
mun
ity m
embe
rs, t
eens
can
em
erge
from
this
tim
e as
mat
ure
and
heal
thy
youn
g ad
ults
. Yet
adol
esce
nce
also
pre
sent
s ris
ks th
at c
an c
ompr
omis
e
othe
rwis
e pr
omis
ing
futu
res.
In c
ities
and
sm
all t
owns
,
and
amon
g al
l rac
ial,
ethn
ic, a
nd e
cono
mic
gro
ups,
thes
e ch
alle
nges
are
per
vasi
ve.

YO
UT
H V
IOLE
NC
E
For
a de
cade
beg
inni
ng in
the
mid
-198
0s, a
wav
e of
you
th v
iole
nce
alar
med
the
natio
n.'
Arr
ests
of
juve
nile
s fo
r th
e cr
imes
of
mur
der,
forc
ible
rap
e, r
obbe
ry, a
nd a
ggra
vate
d as
saul
t
clim
bed
74%
fro
m a
198
5 lo
w o
f 30
3 ar
rest
s
per
100,
000
teen
s to
a p
eak,
in 1
994,
of
527
arre
sts,
per
100
,000
teen
s. S
ince
then
, tee
n vi
o-
lent
cri
me
arre
sts
have
dro
pped
sub
stan
tially
,
falli
ng e
ach
year
thro
ugh
2000
, whe
n th
e ju
ve-
nile
vio
lent
cri
me
arre
st r
ate
stoo
d at
309
per
100,
000
teen
s.2
Bet
wee
n 19
93 a
nd 2
001,
the
prop
ortio
n of
all
teen
s in
volv
ed in
phy
sica
l
figh
ting
drop
ped
from
42%
to 3
3%.3
Wea
pon
poss
essi
on b
y te
ensp
artic
ular
ly im
port
ant
beca
use
the
pres
ence
of
wea
pons
hei
ghte
ns th
e
risk
that
con
flic
t will
res
ult i
n se
riou
s in
jury
or
deat
hals
o ha
s de
clin
ed. I
n 19
91, 2
6% o
fhi
gh s
choo
l stu
dent
s re
port
ed c
arry
ing
wea
pons
such
as
guns
, kni
ves,
or
club
s w
ithin
the
prev
i-
ous
30 d
ays.
By
1999
, the
pro
port
ion
of te
ens
who
car
ried
wea
pons
had
dro
pped
to 1
7%,
whe
re it
rem
aine
d in
200
1.4
Whi
le th
ese
deve
lopm
ents
tell
us th
at v
iole
nce
with
in th
e to
tal t
een
popu
latio
n ha
s di
min
ishe
d,
spec
ific
teen
sub
grou
ps s
till l
eave
rea
son
for
con-
cern
. Alth
ough
the
rate
of
teen
vio
lent
cri
me
has
decl
ined
ove
rall,
arr
est r
ates
for
fem
ales
hav
e no
t
decr
ease
d pr
opor
tiona
tely
. In
1980
, the
arr
est
rate
for
teen
aged
fem
ales
sto
od a
t 12%
of
the
rate
for
teen
aged
mal
es. B
ut th
e fe
mal
e ar
rest
rate
did
not
fal
l as
shar
ply
as th
e ar
rest
rat
e fo
r
mal
es d
urin
g th
e la
te 1
990s
. As
a re
sult,
by
2000
the
teen
fem
ale
arre
st r
ate
was
24%
of
the
Rat
es o
f sin
gle
teen
pre
gnan
cyre
mai
ned
high
er in
200
1 th
an in
199
0fo
r ea
ch r
ace
and
ethn
ic g
roup
.
rate
for
teen
aged
mal
es.'
For
reas
ons
not c
om-
plet
ely
unde
rsto
od, s
tude
nts
in lo
wer
gra
des
exhi
bit h
ighe
r in
cide
nce
of b
oth
phys
ical
fig
htin
g
and
wea
pon
poss
essi
on th
an d
o ol
der
stud
ents
. In
2001
, 40%
of
nint
h-gr
ade
stud
ents
rep
orte
d
thei
r in
volv
emen
t in
phys
ical
fig
htin
g, c
ompa
red
to 2
7% o
f st
uden
ts in
the
twel
fth
grad
e. T
hat
sam
e ye
ar, 2
0% o
f ni
nth-
grad
ers,
but
15%
of
twel
fth-
grad
e st
uden
ts, s
aid
that
they
had
car
ried
a w
eapo
n w
ithin
the
prio
r 30
day
s.'
Law
enf
orce
men
t per
sonn
el, s
choo
l off
icia
ls,
and
pare
nts
rem
ain
appr
ehen
sive
abo
ut v
io-
lenc
e in
you
th c
ultu
re d
espi
te it
s ap
pare
nt
retr
eat s
ince
the
wor
st y
ears
of
the
1980
s an
d
1990
s. R
espo
ndin
g to
the
1999
sho
otin
g
deat
hs o
f 14
stu
dent
s an
d a
teac
her
at
Col
umbi
ne H
igh
Scho
ol in
Litt
leto
n, C
olor
ado,
the
U.S
. Sur
geon
Gen
eral
com
mis
sion
ed a
maj
or r
epor
t to
addr
ess
the
fact
ors
that
bot
h
unde
rlie
you
th v
iole
nce
and
safe
guar
d ag
ains
t
it.' T
his
repo
rt c
oncl
uded
that
the
decl
ine
in
teen
vio
lent
cri
me
arre
sts
shou
ld n
ot le
ad to
com
plac
ency
. Vio
lenc
e co
mm
itted
by,
and
infl
icte
d up
on, A
mer
ican
teen
s re
mai
ns a
ser
i-
ous,
ong
oing
pro
blem
. Tru
e, ju
veni
le a
rres
t
rate
s dr
oppe
d, p
rim
arily
due
to a
sha
rp d
eclin
e
in le
thal
vio
lent
inci
dent
s am
ong
teen
s. B
ut th
e
self
-rep
orte
d fr
eque
ncy
of y
outh
invo
lvem
ent i
n
othe
r vi
olen
t cri
me,
par
ticul
arly
agg
rava
ted
assa
ult,
had
not i
mpr
oved
sin
ce th
e pe
ak ju
ve-
nile
cri
me
year
s be
twee
n th
e m
id-1
980s
and
the
mid
-199
0s. A
ccor
ding
to th
e Su
rgeo
n
Gen
eral
's s
tudy
, bet
wee
n 30
% a
nd 4
0% o
f
teen
aged
mal
es a
nd b
etw
een
15%
and
30%
of
teen
aged
fem
ales
rep
orte
d ha
ving
com
mitt
ed a
seri
ous
viol
ent o
ffen
se b
efor
e th
ey r
each
ed th
e
age
of 1
7. T
eena
gers
invo
lved
in s
erio
us v
iole
nt
crim
e al
so e
ngag
ed in
mul
tiple
ris
k be
havi
ors,
chal
leng
ing
inte
rven
tion
stra
tegi
es. S
ucce
ssfu
l
tech
niqu
es to
red
uce
or p
reve
nt ju
veni
le v
iole
nt
crim
e m
ost c
omm
only
util
ize
a m
ultim
odal
stra
tegy
to a
ddre
ss b
oth
indi
vidu
al a
nd e
nvi-
ronm
enta
l ris
k fa
ctor
s. T
hese
app
roac
hes
focu
s
on th
e de
velo
pmen
t of
teen
s' in
divi
dual
com
pe-
tenc
ies,
par
enta
l eff
ectiv
enes
s tr
aini
ng, s
choo
l
soci
al c
limat
e, a
nd o
n th
e w
eake
ning
of
olf.
teen
ager
s' ti
es to
gan
gs a
nd o
ther
ant
isoc
ial o
rC
ndel
inqu
ent p
eers
.'
TE
EN
AG
ED
CH
OLD
BIE
GIN
G
Chi
ldbi
rth
duri
ng a
dole
scen
ce s
ets
up b
oth
mot
her
and
baby
for
a s
eque
nce
of a
dver
se c
on-
sequ
ence
s th
at c
an p
ersi
st f
or y
ears
. Bab
ies
born
to te
enag
ed m
othe
rs a
re m
ore
likel
y to
suf
fer
from
low
bir
th-w
eigh
t and
mor
e of
thes
e ch
il-
dren
die
at o
r sh
ortly
aft
er b
irth
.9 T
eena
ged
par-
ents
typi
cally
lack
the
reso
urce
s to
pro
vide
the
nurt
urin
g an
d st
imul
atin
g ho
me
envi
ronm
ent
that
you
ng c
hild
ren
requ
ire
for
thei
r co
gniti
ve
and
emot
iona
l gro
wth
,' an
d te
en m
othe
rs
exhi
bit a
hig
her
inci
denc
e of
neg
lect
ful a
nd a
bu-
sive
trea
tmen
t of
thei
r ch
ildre
n th
an a
ny o
ther
grou
p."
You
ng m
othe
rs w
ho c
anno
t com
plet
e
thei
r ed
ucat
ion
due
to e
arly
fam
ily r
espo
nsib
ili-
ties
endu
re li
mite
d
empl
oym
ent a
nd e
arni
ngs
pote
ntia
l, an
d th
eir
chil-
dren
, in
turn
, exp
erie
nce
the
dam
agin
g he
alth
, edu
catio
nal,
and
soci
al
outc
omes
of
this
eco
nom
ic in
secu
rity
.'2
Bet
wee
n 19
90de
clin
ed
An
enco
urag
ing
decl
ine
in th
e bi
rth
rate
am
ong
teen
s ha
s oc
curr
ed s
tead
ily th
roug
hout
the
past
deca
de. I
n 20
01, t
he b
irth
rate
for
you
ng
wom
en a
ged
15 to
17
stoo
d at
an
hist
oric
low
:3
Thi
s re
duct
ion
in te
enag
ed b
irth
s oc
curr
ed f
or
both
you
nger
and
old
er a
dole
scen
ts, a
cros
s
ever
y ra
ce a
nd e
thni
c gr
oup,
and
in e
very
sta
te
in th
e na
tion.
' Ind
uced
abo
rtio
n ra
tes
amon
g
teen
s ha
ve a
lso
falle
n st
eadi
ly, p
roba
bly
due
to a
com
bina
tion
of d
emog
raph
ic, e
cono
mic
, pol
iti-
cal a
nd c
ultu
ral f
acto
rs:5
Des
pite
the
drop
in a
dole
scen
t bir
ths
over
all,
som
e tr
ends
indi
cate
ong
oing
rea
sons
for
con
-
cern
abo
ut c
hild
bear
ing
amon
g A
mer
ican
teen
s.' T
he n
umbe
r of
rep
eat b
irth
s to
teen
s,
whi
ch in
clud
e ab
out o
ne in
fiv
e te
en b
irth
s,
rem
ains
a c
ause
for
con
cern
. Fur
ther
, alm
ost
and
2001
, birt
hs to
Afr
ican
-Am
eric
an te
ens
subs
tant
ially
mor
e th
an th
e ra
te o
f birt
hs to
teen
aged
Whi
te o
r H
ispa
nic
wom
en.
80%
of
babi
es b
orn
to te
enag
ers
com
e in
to
fam
ilies
with
unm
arri
ed p
aren
ts. A
lthou
gh
ever
y ra
ce a
nd e
thni
c gr
oup
has
expe
rien
ced
a
decl
ine
in te
enag
ed b
irth
s in
rec
ent y
ears
, rac
ial
and
ethn
ic d
ispa
ritie
s in
ado
lesc
ent b
irth
rate
s
still
per
sist
. Fin
ally
, des
pite
rec
ent i
mpr
ovem
ent
in th
e ra
te o
f te
enag
ed c
hild
birt
h, p
regn
ancy
rate
s fo
r A
mer
ican
you
th r
emai
n am
ong
the
high
est i
n th
e in
dust
rial
ized
wor
ld."
'''
Alth
ough
the
perc
enta
ge o
f se
xual
ly a
ctiv
e te
ens
has
decl
ined
am
ong
all r
ace
and
ethn
ic g
roup
s
sinc
e 19
95, i
n 20
01 m
ore
than
one
-thi
rd o
f
nint
h-gr
ade
stud
ents
and
ove
r ha
lf o
f tw
elft
h-

grad
ers
desc
ribe
d th
emse
lves
as
sexu
ally
exp
eri-
ence
d.19
Asi
de f
rom
the
resu
lting
ris
k of
pre
g-
nanc
y, o
ther
pot
entia
lly d
amag
ing
cons
eque
nces
aris
e fr
om e
arly
sex
ual a
ctiv
ity a
mon
g te
ens.
Mor
eove
r, th
e ea
rlie
r te
enag
ers
begi
n se
xual
invo
lvem
ent,
the
mor
e th
eir
risk
of
thes
e ne
ga-
tive
outc
omes
incr
ease
s. T
eens
, esp
ecia
lly
fem
ales
, exh
ibit
high
er r
ates
of
sexu
ally
tran
s-
mitt
ed d
isea
se th
an a
mon
g ot
her
age
grou
ps."
Esp
ecia
lly a
mon
g yo
unge
r ad
oles
cent
wom
en,
initi
al s
exua
l enc
ount
ers
are
freq
uent
ly c
oerc
ive,
resu
lting
in s
omet
imes
dev
asta
ting
heal
th a
nd
emot
iona
l out
com
es.'
Tee
nage
rs r
epor
t les
s co
n-
sist
ent u
se o
f co
ntra
cept
ion
than
do
olde
r
wom
en, p
uttin
g th
ese
youn
g pe
ople
at g
reat
er
risk
for
uni
nten
ded
preg
nanc
y, H
IV, a
nd A
IDS.
"
Res
earc
hers
and
pro
fess
iona
ls w
ho w
ork
with
teen
s kn
ow m
any
of th
e fa
ctor
s as
soci
ated
with
thei
r he
alth
y an
d un
heal
thy
sexu
al p
ract
ices
.
Fem
ales
and
you
nger
teen
s di
spla
y lo
wer
leve
ls
of s
exua
l exp
erie
nce
and
activ
ity th
an d
o m
ales
and
olde
r yo
uth.
Tee
nage
rs w
ho c
ome
from
two-
pare
nt h
ouse
hold
s, a
nd f
amili
es w
here
par
ents
and
child
ren
com
mun
icat
e op
enly
and
oft
en,
tend
to p
ostp
one
sexu
al a
ctiv
ity, w
hile
ado
les-
cent
s liv
ing
with
a m
othe
r w
ho g
ave
birt
h as
a
teen
or
with
sex
ually
act
ive
sibl
ings
sho
w a
hig
h-
er in
cide
nce.
Par
ticip
atio
n in
sch
ool o
r co
mm
uni-
ty a
ctiv
ities
and
invo
lvem
ent w
ith a
chie
vem
ent-
orie
nted
fri
ends
low
ers
the
likel
ihoo
d of
teen
sex
-
ual b
ehav
ior,
but
eng
agem
ent i
n ot
her
risk
beha
vior
s an
d in
volv
emen
t with
oth
er s
exua
lly
activ
e te
ens
incr
ease
s it.
Ado
lesc
ents
fro
m a
fflu
-
ent c
omm
uniti
es a
re le
ss s
exua
lly a
ctiv
e th
an
teen
ager
s liv
ing
in p
oor
neig
hbor
hood
s. A
his
tory
of s
exua
l abu
se p
redi
cts
earl
y se
xual
act
ivity
."
Prog
ram
s to
enc
oura
ge h
ealth
y se
xual
prac
tices
am
ong
teen
s ca
n w
ork.
Cur
ricu
la f
ound
to p
ositi
vely
aff
ect
teen
's s
exua
l beh
avio
r in
clud
e su
ch
elem
ents
as
mul
tiple
com
pone
nts,
a
theo
retic
al f
ound
atio
n, c
lear
and
accu
rate
mes
sage
del
iver
y, e
ngag
ing
curr
icul
um-b
ased
act
iviti
es, o
ppor
tu-
nitie
s to
pra
ctic
e co
mm
unic
atio
n an
d
refu
sal s
kills
, lea
der
trai
ning
, and
atte
ntio
n to
the
age
and
cultu
ral
back
grou
nd o
f pr
ogra
m p
artic
ipan
ts."
500
400
300
200
100
WH
AT
TE
XA
S K
IDS
SAY
S A
BO
UT
TE
E S
A1S
Kll
TE
EN
S A
T O
SK
IND
OC
AT
OI
RS
Juve
nile
Vio
lent
Crim
e A
rres
ts19
9020
01
Tee
n P
regn
ancy
1990
2001
Sin
gle
Tee
n P
regn
ancy
1990
2001
Fig
ure
5.1
Juve
nile
Vio
lent
Crim
e A
rres
ts 2
001
0B
exar
Tra
vis
Har
risT
exas
Tar
rant
Dal
las
El P
aso

JUV
EN
ILE
VIO
LE
NT
CR
IME
DO
WN
FRO
M M
ID-1
990S
PE
AK
Juve
nile
vio
lent
cri
me
arre
sts
have
dro
pped
by
27.7
% in
Tex
as, f
rom
a r
ate
of 3
02.2
arr
ests
per
100,
000
teen
s in
199
0 to
a r
ate
of 2
18.4
arr
ests
in 2
001.
Tre
nd d
ata
show
two
dist
inct
pat
tern
s
duri
ng th
e pe
riod
ove
rall.
In
the
earl
y 19
90s,
juve
nile
vio
lent
cri
me
rose
sha
rply
, inc
reas
ing
40.7
% b
etw
een
1990
and
199
4. A
fter
arr
ests
peak
ed in
199
4, h
owev
er, t
hey
decl
ined
by
an
even
larg
er p
erce
ntag
e, f
allin
g 48
.6%
to th
eir
2001
leve
l.
Am
ong
the
stat
e's
larg
est c
ount
ies,
El P
aso
Cou
nty
expe
rien
ced
the
leas
t am
ount
of
impr
ovem
ent i
n its
juve
nile
vio
lent
cri
me
rate
,
whi
ch d
ropp
ed 2
1.0%
bet
wee
n 19
90 a
nd20
01, a
nd e
nded
the
peri
od w
ith th
e hi
ghes
t
rate
of
teen
vio
lent
cri
me,
at 4
27.5
arr
ests
per
100,
000
teen
s in
200
1. F
igur
e 5.
1 pi
ctur
es th
e
juve
nile
vio
lent
cri
me
arre
st r
ate
for
Tex
as a
nd
each
of
its la
rges
t cou
ntie
s in
200
1. T
een
vio-
lent
cri
me
was
low
est i
n B
exar
Cou
nty
in b
oth
1990
(at
209
.2 a
rres
ts p
er 1
00,0
00 te
ens)
and
120
100
80 60 40 20
Fig
ure
5.2
Cha
nge
in T
otal
and
Sin
gle
Tee
n P
regn
ancy
199
020
01
CI T
otal
Tee
n P
regn
ancy
Sin
gle
Tee
n P
regn
ancy
-20
Tex
asB
exar
Dal
las
2001
(at
124
.2 a
rres
ts p
er 1
00,0
00).
Tra
vis
and
Dal
las
Cou
ntie
s, w
ith th
e hi
ghes
t rat
es o
f ju
ve-
nile
vio
lent
cri
me
in 1
990
(575
.9 a
nd 5
93.1
arre
sts
per
100,
000
teen
s, r
espe
ctiv
ely)
had
impr
oved
mos
t by
2001
. Tra
vis
Cou
nty
led
the
decl
ine
in v
iole
nt c
rim
e am
ong
teen
s, e
xper
i-
enci
ng a
dro
p of
74.
9%, f
ollo
wed
by
Dal
las
Cou
nty,
with
a d
ecre
ase
of 4
5.3%
.
El P
aso
Har
risT
arra
ntT
ravi
s
TE
EN
PR
EG
N N
CY
DO
WN
SLIG
HT
LY
BU
T B
IRT
HS
TO
SIN
GL
ET
EE
NS
INC
RE
ASE
SU
BST
AN
TIA
LL
Y
Ove
rall
rate
s fo
r te
en p
regn
ancy
rem
ain
cons
is-
tent
ly h
ighe
r th
an r
ates
of
sing
le te
en p
regn
an-
cy, f
or th
e po
pula
tion
over
all a
nd a
mon
g th
e
race
and
eth
nic
grou
ps. H
owev
er, t
he g
ap
betw
een
teen
pre
gnan
cy o
vera
ll an
d si
ngle
teen
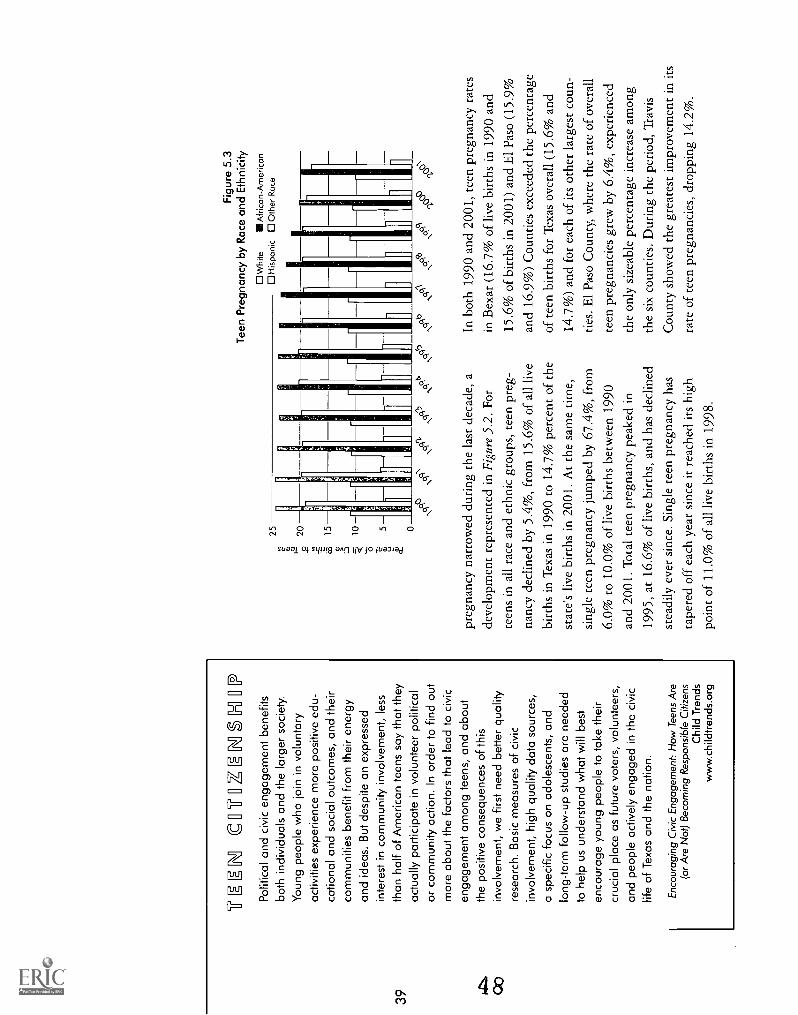
'TE
M C
UIN
ZH
SE.0
1?P
oliti
cal a
nd c
ivic
eng
agem
ent b
enef
itsbo
th in
divi
dual
s an
d th
e la
rger
soc
iety
.Y
oung
peo
ple
who
join
in v
olun
tary
activ
ities
exp
erie
nce
mor
e po
sitiv
e ed
u-ca
tiona
l and
soc
ial o
utco
mes
, and
thei
rco
mm
uniti
es b
enef
it fr
om th
eir
ener
gyan
d id
eas.
But
des
pite
an
expr
esse
din
tere
st in
com
mun
ity in
volv
emen
t, le
ssth
an h
alf o
f Am
eric
an te
ens
say
that
they
actu
ally
par
ticip
ate
in v
olun
teer
pol
itica
lor
com
mun
ity a
ctio
n. In
ord
er to
find
out
mor
e ab
out t
he fa
ctor
s th
at le
ad to
civ
icen
gage
men
t am
ong
teen
s, a
nd a
bout
the
posi
tive
cons
eque
nces
of t
his
invo
lvem
ent,
we
first
nee
d be
tter
qual
ityre
sear
ch. B
asic
mea
sure
s of
civ
icin
volv
emen
t, hi
gh q
ualit
y da
ta s
ourc
es,
a sp
ecifi
c fo
cus
on a
dole
scen
ts, a
ndlo
ng-t
erm
follo
w-u
p st
udie
s ar
e ne
eded
to h
elp
us u
nder
stan
d w
hat w
ill b
est
enco
urag
e yo
ung
peop
le to
take
thei
rcr
ucia
l pla
ce a
s fu
ture
vot
ers,
vol
unte
ers,
and
peop
le a
ctiv
ely
enga
ged
in th
e ci
vic
life
of T
exas
and
the
natio
n.
Enc
oura
ging
Civ
ic E
ngag
emen
t: H
ow T
eens
Are
(or
Are
Not
) B
ecom
ing
Res
pons
ible
Citi
zens
Chi
ld T
rend
sw
ww
.chi
ldtr
ends
.org
25 20 15 10 5 0
Fig
ure
5.3
Tee
n P
regn
ancy
by
Rac
e an
d E
thni
city
Whi
teA
fric
a n-
Am
eric
anH
ispa
nic
Oth
er R
ace
NqC
i\')
\<'3
qb4\
clq
preg
nanc
y na
rrow
ed d
urin
g th
e la
st d
ecad
e, a
deve
lopm
ent r
epre
sent
ed in
Fig
ure
5.2.
For
teen
s in
all
race
and
eth
nic
grou
ps, t
een
preg
-
nanc
y de
clin
ed b
y 5.
4%, f
rom
15.
6% o
f al
l liv
e
birt
hs in
Tex
as in
199
0 to
14.
7% p
erce
nt o
f th
e
stat
e's
live
birt
hs in
200
1. A
t the
sam
e tim
e,
sing
le te
en p
regn
ancy
jum
ped
by 6
7.4%
, fro
m
6.0%
to 1
0.0%
of
live
birt
hs b
etw
een
1990
and
2001
. Tot
al te
en p
regn
ancy
pea
ked
in
1995
, at 1
6.6%
of
live
birt
hs, a
nd h
as d
eclin
ed
stea
dily
eve
r si
nce.
Sin
gle
teen
pre
gnan
cy h
as
tape
red
off
each
yea
r si
nce
it re
ache
d its
hig
h
poin
t of
11.0
% o
f al
l liv
e bi
rths
in 1
998.
In b
oth
1990
and
200
1, te
en p
regn
ancy
rat
es
in B
exar
(16
.7%
of
live
birt
hs in
199
0 an
d
15.6
% o
f bi
rths
in 2
001)
and
El P
aso
(15.
9%
and
16.9
%)
Cou
ntie
s ex
ceed
ed th
e pe
rcen
tage
of te
en b
irth
s fo
r T
exas
ove
rall
(15.
6% a
nd
14.7
%)
and
for
each
of
its o
ther
larg
est c
oun-
ties.
El P
aso
Cou
nty,
whe
re th
e ra
te o
f ov
eral
l
teen
pre
gnan
cies
gre
w b
y 6.
4%, e
xper
ienc
ed
the
only
siz
eabl
e pe
rcen
tage
incr
ease
am
ong
the
six
coun
ties.
Dur
ing
the
peri
od, T
ravi
s
Cou
nty
show
ed th
e gr
eate
st im
prov
emen
t in
its
rate
of
teen
pre
gnan
cies
, dro
ppin
g 14
.2%
.

Bir
ths
to s
ingl
e te
ens
mor
e th
an d
oubl
ed in
Tar
rant
Cou
nty
(up
by 1
04.2
%)
betw
een
1990
and
2001
, a r
ate
of in
crea
se th
at le
d th
e st
ate
and
the
othe
r la
rge
coun
ties.
How
ever
, the
abso
lute
teen
pre
gnan
cy r
ate
in T
arra
nt C
ount
y
rem
aine
d be
low
the
perc
enta
ge o
f bi
rths
to
teen
s fo
r T
exas
as
a w
hole
in 2
001.
El P
aso
Cou
nty,
with
an
incr
ease
in s
ingl
e te
en p
reg-
nanc
y of
90.
0%, a
nd E
l Pas
o C
ount
y, w
here
sing
le te
en p
regn
anci
es r
ose
by 8
9.4%
, als
o
topp
ed th
e ra
te o
f in
crea
se f
or th
e st
ate
and
for
the
othe
r th
ree
mos
t pop
ulou
s co
untie
s.
Am
ong
the
stat
e's
larg
e co
untie
s, o
nly
El P
aso
(at 1
1.1%
of
live
birt
hs)
and
Bex
ar (
at 1
1.4%
)
Cou
ntie
s su
rpas
sed
the
stat
ewid
e ra
te o
f si
ngle
teen
pre
gnan
cy in
200
1.
AFR
ICA
NA
ME
RIC
AN
TE
EN
SL
EA
D D
EC
LIN
E I
N O
VE
R,,,
LL
PRE
GN
AN
CY
RA
TE
You
ng A
fric
an-A
mer
ican
wom
en in
Tex
as s
till
exhi
bit t
he h
ighe
st r
ate
of te
en p
regn
ancy
inco
mpa
riso
n to
oth
er r
ace
and
ethn
ic g
roup
s
(Fig
ure
5.3)
. The
pre
gnan
cy r
ate
for
Afr
ican
-
Am
eric
an te
ens
in 2
001
was
19.
8%, j
ust
slig
htly
mor
e th
an th
e pr
egna
ncy
rate
of
18.1
% f
or H
ispa
nic
teen
s bu
t alm
ost t
wic
e th
e10
.2%
pre
gnan
cy r
ate
for
Whi
te te
ens.
How
ever
, bir
ths
to A
fric
an-A
mer
ican
teen
s
decl
ined
sub
stan
tially
mor
e, d
own
by 1
8.7%
betw
een
1990
and
200
1, th
an d
id th
e ra
te o
fbi
rths
to te
enag
ed H
ispa
nic
(dow
n by
4.8
%)
or W
hite
(do
wn
by 6
.7%
) w
omen
.
BIR
TH
S T
O S
ING
LE
WH
ITE
a, N
DH
ISP
NO
C T
EE
NS
INC
RE
ASE
All
race
and
eth
nic
grou
ps in
Tex
as e
xper
ienc
ed a
spi
ke
in s
ingl
e te
en p
regn
ancy
in 1
994,
and
the
rate
of
teen
bir
ths
rem
aine
d
stab
le f
or e
ach
of th
ese
grou
ps th
roug
hout
the
to
deca
de b
efor
e be
ginn
ing
to d
eclin
e in
the
late
1990
s. S
till,
rate
s of
sing
le te
en p
regn
ancy
rem
aine
d hi
gher
in 2
001
25 20 15 5 0
than
in 1
990
for
each
rac
e an
d et
hnic
gro
up.
Illu
stra
ted
in F
igur
e 5.
4, y
oung
Whi
te w
omen
led
the
rise
in s
ingl
e te
en p
regn
ancy
, as
birt
hs
to s
ingl
e W
hite
teen
ager
s ro
se b
y 13
8.6%
betw
een
1990
and
200
1. T
he r
ate
of s
ingl
ete
en p
regn
ancy
als
o in
crea
sed
subs
tant
ially
, by
90.2
%, a
mon
g yo
ung
His
pani
c w
omen
.
Afr
ican
-Am
eric
an te
ens
disp
laye
d a
very
dif
fer-
ent p
atte
rn, a
s th
e si
ngle
teen
bir
th r
ate
for
this
gro
up g
rew
by
just
3.1
% b
etw
een
1990
and
2001
.
Fig
ure
5.4
Sin
gle
Tee
n P
regn
ancy
by
Rac
e an
d E
thni
city
Whi
teA
fric
an-A
mer
ican
His
pani
cO
ther
Rac
e
Nqc
i"1
40

1,4
ti
04

Sec
tion
6:Ph
ysca
0, S
oda
&E
mot
ionc
d H
eaO
thT
o gr
ow u
p so
und
and
com
plet
e, c
hild
ren
requ
ire
adeq
uate
hea
lth c
are
serv
ices
eve
n be
fore
birt
h an
d
cont
inua
lly th
roug
hout
chi
ldho
od a
nd a
dole
scen
ce.
Incr
easi
ngly
, the
cos
t of h
igh
qual
ity h
ealth
car
e ha
s
chal
leng
ed p
rovi
ders
, em
ploy
ers,
pol
icy-
mak
ers
and
perh
aps
mos
t im
port
antly
, fam
ilies
.
N
MA
TE
RN
AL
& IN
FA
NT
tliA
LTI-
1
Due
larg
ely
to a
dvan
ces
in s
nedi
cal t
echn
olog
y,
the
coun
trys
-inf
ant m
orta
lity
rate
has
dro
pped
a si
gnif
ican
t am
ount
ove
r th
e la
st s
ever
al
deca
des.
' Stil
l, in
fant
mor
talit
y in
the
Uni
ted
Stat
es c
ontin
ues
at o
ne o
f th
e hi
ghes
t lev
els
amon
g in
dust
rial
ized
nat
ions
.' A
bout
two-
thir
ds\o
f in
fant
dea
ths
occu
r in
the
neon
atal
peri
od, b
efor
e a
baby
rea
ches
the
firs
t fou
r
43w
eeks
of
life.
The
oth
er o
ne-t
hird
of
infa
nt
mor
talit
y de
aths
hap
pen
duri
ng th
e po
stna
tal
IND
peri
od, b
etw
een
one
mon
th a
nd o
ne y
ear
of
age.
' Lea
ding
cau
ses
of in
fant
dea
th in
clud
e lo
w
birt
hwei
ght b
irth
s, c
onge
nita
l def
icie
ncie
s, a
nd
Sudd
en I
nfan
t Dea
th S
yndr
ome
(SID
S), a
nd
the
subs
tant
ial d
rop
in S
IDS
deat
hs d
urin
g th
e
late
199
0s w
as a
maj
or f
acto
r in
the
decl
ine
in
infa
nt m
orta
lity
duri
ng th
at ti
me.
' Alth
ough
infa
nt m
orta
lity
rate
s ha
ve im
prov
ed f
or
child
ren
in a
ll ra
ce a
nd e
thni
c ca
tego
ries
, lar
ge
disp
ariti
es in
infa
nt d
eath
s pe
rsis
t acr
oss
thes
e
popu
latio
n gr
oups
, and
the
infa
nt m
orta
lity
rate
for
Afr
ican
-Am
eric
an b
abie
s st
ill c
onsi
s-
tent
ly o
utnu
mbe
rs in
fant
dea
ths
from
oth
erra
ce a
nd e
thni
c gr
oups
.'
CJ1
Sinc
e th
e m
id-1
980s
, the
rat
es o
f bo
th lo
w
birt
hwei
ght a
nd v
ery
low
bir
thw
eigh
t bir
ths
have
clim
bed
stea
dily
.' L
ow b
irth
wei
ght c
hil-
dren
who
wei
gh le
ss th
an 2
500
gram
s (a
bout
five
and
one
-hal
f po
unds
) at
bir
th, a
nd v
ery
low
bir
thw
eigh
t bab
ies
wei
ghin
g 15
00 g
ram
s
or le
ss (
abou
t thr
ee a
nd o
ne-q
uart
er p
ound
s)
face
ele
vate
d ri
sks
of d
evel
opm
enta
l com
plic
a-
tions
and
neo
nata
l or
post
nata
l dea
th th
an
heav
ier
babi
es. B
ecau
se th
e vi
tal s
yste
ms
of lo
w
and
very
low
bir
thw
eigh
t bab
ies
have
not
ful
ly
deve
lope
d, th
ese
child
ren
freq
uent
ly s
uffe
r fr
om
lung
and
oth
er o
rgan
pro
blem
s, b
leed
ing
of th
e
brai
n, a
nd a
com
prom
ised
imm
une
syst
em th
at
mak
es th
em e
spec
ially
vul
nera
ble
to o
ppor
-
tuni
stic
infe
ctio
ns. L
ow b
irth
wei
ght c
hild
ren
acco
unt f
or a
bout
fou
r-
fift
hs o
f al
l inf
ant d
eath
s
with
in th
e fi
rst f
our
wee
ks o
f bi
rth,
and
are
24 ti
mes
mor
e lik
ely
to d
ie w
ithin
thei
r fi
rst
year
of
life
than
nor
mal
-wei
ght b
abie
s. V
ery
low
bir
thw
eigh
t bab
ies
are
96 ti
mes
mor
e lik
e-
ly to
die
bef
ore
thei
r fi
rst b
irth
day,
com
pare
d to
heav
ier
infa
nts.
' Doc
tors
and
res
earc
hers
hav
e
isol
ated
sev
eral
pro
babl
e ca
uses
of
low
and
ver
y
low
bir
thw
eigh
t bir
ths.
An
incr
ease
in m
ultip
le
birt
hs h
as r
esul
ted
in a
gre
ater
pro
port
ion
of
smal
ler
babi
es. V
ery
youn
g an
d ol
der
mot
hers
face
hig
her
chan
ces
of b
eari
ng lo
w a
nd v
ery
low
bir
thw
eigh
t inf
ants
. Sm
okin
g, a
lcoh
ol, a
nd
drug
use
are
ass
ocia
ted
with
the
inci
denc
e of
low
and
ver
y lo
w b
irth
wei
ght b
irth
s.
Nut
ritio
nal d
efic
ienc
ies,
incl
udin
g in
adeq
uate
wei
ght g
ain
by th
e m
othe
r du
ring
pre
gnan
cy,
also
app
ear
to p
lay
a ro
le.'
To
fore
stal
l the
inci
denc
e of
infa
nt d
eath
and
low
bir
thw
eigh
t bir
ths,
atte
ntio
n to
the
heal
thst
atus
of
child
ren
mus
t beg
in d
urin
g m
othe
rs'
preg
nanc
ies.
Ear
ly a
nd c
onsi
sten
t pre
nata
l car
e
and
educ
atio
n al
low
wom
en a
nd th
eir
heal
th
care
pro
vide
rs to
iden
tify
and
trea
t pot
entia
l
In 2
001,
the
deat
h ra
te fo
r A
fric
an-A
mer
ican
bab
ies
stoo
d at
twic
e th
e m
orta
lity
rate
for
Whi
te a
nd H
ispa
nic
infa
nts.
prob
lem
s. F
or b
oth
mot
her
and
child
, ade
quat
e
med
ical
car
e du
ring
pre
gnan
cy is
cru
cial
to
insu
re h
ealth
y bi
rth
outc
omes
. The
num
ber
of
Am
eric
an w
omen
rec
eivi
ng p
rena
tal c
are
dur-
ing
the
firs
t tri
mes
ter
of p
regn
ancy
has
gro
wn
siza
bly
over
the
past
sev
eral
dec
ades
, an

\V/
/I
impr
ovem
ent t
hat o
ccur
red
acro
ss a
ll ra
ce a
ndet
hnic
gro
ups.
9
LTH
ON
SU
RA
NC
IE F
OR
CC
-OO
LDR
IEN
Hea
lth in
sura
nce
acce
ss a
nd c
ost h
ave
beco
me
incr
easi
ngly
trou
bles
ome
econ
omic
and
pub
lic
polic
y is
sues
, with
pra
ctic
al im
plic
atio
ns th
at
conv
erge
on
the
vita
l nee
ds o
f ch
ildre
n an
d
fam
ilies
. Alth
ough
var
ious
sou
rces
giv
e di
ffer
ent
Cju
stim
ates
, it a
ppea
rs th
at a
s m
any
as o
ne-t
hird
CA
-/of
Am
eric
ans
may
go
with
out h
ealth
insu
ranc
e
at s
ome
poin
t dur
ing
a gi
ven
year
.' W
hile
eve
nfa
mili
es c
over
ed b
y em
ploy
er-s
pons
ored
pla
ns
have
exp
erie
nced
ris
ing
heal
th-r
elat
ed c
osts
,
low
- an
d m
iddl
e-in
com
e fa
mili
es w
ho h
ave
no
insu
ranc
e th
roug
h th
eir
jobs
can
not p
ossi
bly
affo
rd th
e pr
emiu
ms
and
out-
of-p
ocke
t cos
ts
that
the
mar
ket d
eman
ds. W
ithou
t pub
lic-
spon
sore
d, s
ubsi
dize
d he
alth
car
e co
vera
ge,
thes
e fa
mili
es h
ave
no r
ealis
tic c
hoic
e bu
t to
go
unin
sure
d an
d ta
ke th
eir
chan
ces.
The
con
se-
quen
ces
jeop
ardi
ze c
hild
ren'
s w
ell-
bein
g an
d in
the
end,
shi
ft th
e co
st o
f he
alth
car
e on
to m
ore
expe
nsiv
e pa
thw
ays
into
the
heal
th c
are
syst
em
whe
n th
ese
child
ren
do g
et h
urt o
r si
ck.
A r
ecen
t ana
lysi
s by
the
Cen
ter
for
Publ
ic
Polic
y Pr
iori
ties
docu
men
ts h
ow T
exas
Med
icai
d an
d th
e st
ate'
s C
hild
ren'
s H
ealth
Insu
ranc
e Pr
ogra
m (
CH
IP)
have
pre
serv
ed
heal
th in
sura
nce
for
a la
rge
num
ber
of lo
w-
inco
me
Tex
as c
hild
ren
duri
ng a
tim
e w
hen
eco-
nom
ic r
eces
sion
and
ris
ing
insu
ranc
e co
sts
have
cut i
nto
empl
oyer
-spo
nsor
ed a
nd p
riva
tely
-pur
-
chas
ed h
ealth
insu
ranc
e co
vera
ge a
mon
g T
exas
adul
ts."
Med
icai
d is
a jo
intly
-fun
ded
fede
ral
and
stat
e pr
ogra
m th
at p
rovi
des
no-c
ost m
ed-
ical
cov
erag
e to
poo
r ch
ildre
n an
d ad
ults
who
mee
t cer
tain
inco
me
and
asse
t req
uire
men
ts. I
n
2001
, the
77t
h T
exas
Leg
isla
ture
app
rove
d
sim
plif
ied
Med
icai
d pr
oced
ures
to r
educ
e
adm
inis
trat
ive
barr
iers
that
can
dis
cour
age
eli-
gibl
e T
exas
chi
ldre
n fr
om p
artic
ipat
ion
in th
e
prog
ram
. CH
IP b
enef
its f
amili
es w
ith in
com
es
too
high
to q
ualif
y fo
r M
edic
aid
but w
ho a
lso
earn
too
little
to a
ffor
d pr
ivat
e-m
arke
t hea
lth
insu
ranc
e. D
epen
ding
on
thei
r in
com
e, f
amili
es
enro
lled
in C
HIP
do
pay
som
e pr
emiu
ms,
as
wel
l as
co-p
aym
ents
for
phy
sici
an v
isits
, em
er-
genc
y ro
om s
ervi
ces,
and
pre
scri
ptio
ns. B
asin
g
its c
alcu
latio
ns o
n in
sura
nce
stat
us d
ata
from
the
U.S
. Cen
sus
Bur
eau,
the
Cen
ter
foun
d th
at
CE
DE
") A
HD
UIE
EN
A M
AIL
NIA
LU
MA
n es
timat
ed 7
.5 m
illio
n A
mer
ican
child
ren
and
teen
s ex
perie
nce
serio
us
beha
viou
ral h
ealth
con
ditio
ns s
uch
asan
xiet
y, d
epre
ssio
n, b
ipol
ar d
isor
der,
and
atte
ntio
n de
ficit
hype
ract
ivity
dis
or-
der.
Abo
ut h
alf o
f the
m e
xper
ienc
e so
me
resu
lting
leve
l of d
isab
ility
. In
a na
tiona
l*fo
cus
grou
p st
udy,
par
ents
of c
hild
ren
with
ser
ious
men
tal h
ealth
dia
gnos
es
repo
rted
mul
tiple
bar
riers
. Wel
l ove
r ha
lfde
scrib
ed a
lack
of m
enta
l hea
lth p
arity
in in
sura
nce.
Les
s th
an o
ne-t
enth
sai
d
scho
ol p
erso
nnel
had
the
back
grou
nd to
appr
opria
tely
edu
cate
thei
r ch
ildre
n.
Mor
e th
an o
ne-t
hird
had
a c
hild
with
inth
e ju
veni
le ju
stic
e sy
stem
afte
r fa
iling
tose
cure
men
tal h
ealth
ser
vice
s in
the
com
mun
ity. A
lmos
t one
-qua
rter
wer
e
advi
sed
to r
elin
quis
h cu
stod
y of
thei
rch
ildre
n in
ord
er to
obt
ain
nece
ssar
ym
enta
l hea
lth c
are.
Fam
ilies
On
the
Brin
k: T
he Im
pact
of I
gnor
ing
Chi
ldre
n W
ith S
erio
us M
enta
l Illn
ess
Nat
iona
l Alli
ance
For
the
Men
tally
III
ww
w.n
ami.o
rg
44
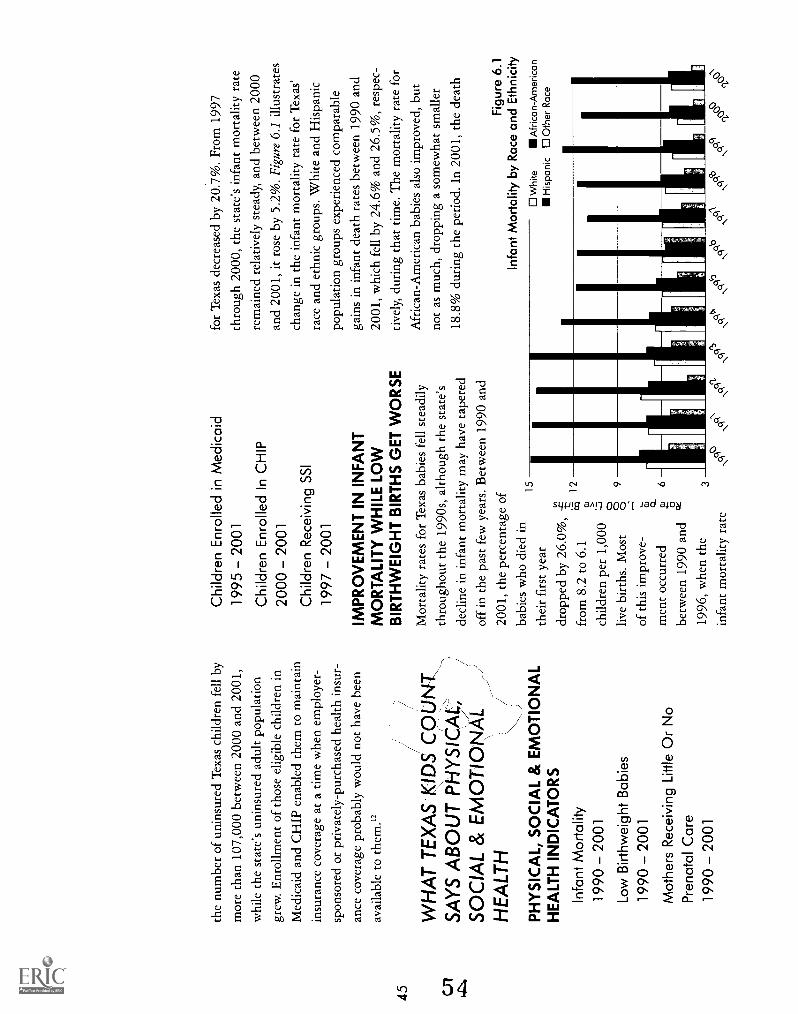
the
num
ber
of u
nins
ured
Tex
as c
hild
ren
fell
by
mor
e th
an 1
07,0
00 b
etw
een
2000
and
200
1,
whi
le th
e st
ate'
s un
insu
red
adul
t pop
ulat
ion
grew
. Enr
ollm
ent o
f th
ose
elig
ible
chi
ldre
n in
Med
icai
d an
d C
HIP
ena
bled
them
to m
aint
ain
insu
ranc
e co
vera
ge a
t a ti
me
whe
n em
ploy
er-
spon
sore
d or
pri
vate
ly-p
urch
ased
hea
lth in
sur-
ance
cov
erag
e pr
obab
ly w
ould
not
hav
e be
en
avai
labl
e to
them
."
WH
AT
TE
XA
S K
IDS
CO
UN
TS
AY
S A
BO
UT
PH
YS
ICA
L,S
OC
IAL
& E
MO
TIO
NA
LH
EA
LTH
2
PH
YS
ICA
L, S
OC
IAL
& E
MO
TIO
NA
LH
EA
LTH
IND
ICA
TO
RS
Infa
nt M
orta
lity
1990
2001
Low
Birt
hwei
ght B
abie
s
1990
2001
Mot
hers
Rec
eivi
ng L
ittle
Or
No
Pre
nata
l Car
e19
9020
01
Chi
ldre
n E
nrol
led
in M
edic
aid
1995
2001
Chi
ldre
n E
nrol
led
In C
HIP
2000
2001
Chi
ldre
n R
ecei
ving
SS
I
1997
2001
IMP
RO
VE
ME
NT
IN IN
FA
NT
MO
RT
ALI
TY
WH
ILE
LO
WB
IRT
HW
EIG
HT
BIR
TH
S G
ET
WO
RS
E
Mor
talit
y ra
tes
for
Tex
as b
abie
s fe
ll st
eadi
ly
thro
ugho
ut th
e 19
90s,
alth
ough
the
stat
e's
decl
ine
in in
fant
mor
talit
y m
ay h
ave
tape
red
off
in th
e pa
st f
ew y
ears
. Bet
wee
n 19
90 a
nd
2001
, the
per
cent
age
ofba
bies
who
die
d in
thei
r fi
rst y
ear
drop
ped
by 2
6.0%
,fr
om 8
.2 to
6.1
child
ren
per
1,00
0liv
e bi
rths
. Mos
t
of th
is im
prov
e-
men
t occ
urre
d
betw
een
1990
and
1996
, whe
n th
e
infa
nt m
orta
lity
rate
15 12
9
for
Tex
as d
ecre
ased
by
20.7
%. F
rom
199
7
thro
ugh
2000
, the
sta
te's
infa
nt m
orta
lity
rate
rem
aine
d re
lativ
ely
stea
dy, a
nd b
etw
een
2000
and
2001
, it r
ose
by 5
.2%
. Fig
ure
6.1
illus
trat
es
chan
ge in
the
infa
nt m
orta
lity
rate
for
Tex
as'
race
and
eth
nic
grou
ps. W
hite
and
His
pani
c
popu
latio
n gr
oups
exp
erie
nced
com
para
ble
gain
s in
infa
nt d
eath
rat
es b
etw
een
1990
and
2001
, whi
ch f
ell b
y 24
.6%
and
26.
5%, r
espe
c-tiv
ely,
dur
ing
that
tim
e. T
he m
orta
lity
rate
for
Afr
ican
-Am
eric
an b
abie
s al
so im
prov
ed, b
ut
not a
s m
uch,
dro
ppin
g a
som
ewha
t sm
alle
r
18.8
% d
urin
g th
e pe
riod
. In
2001
, the
dea
th
Fig
ure
6.1
Infa
nt M
orta
lity
by R
ace
and
Eth
nici
ty
Whi
teA
fric
an-A
mer
ican
His
pani
cO
ther
Rac
e
NC
\
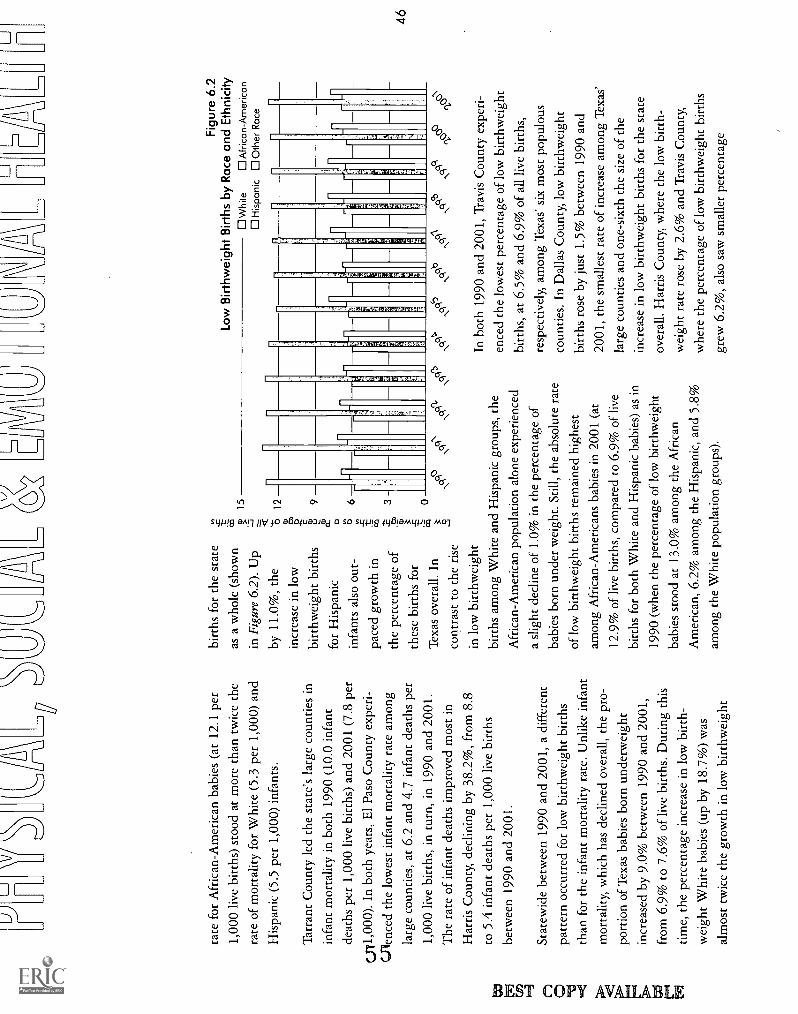
rate
for
Afr
ican
-Am
eric
an b
abie
s (a
t 12.
1 pe
r
1,00
0 liv
e bi
rths
) st
ood
at m
ore
than
twic
e th
e
rate
of
mor
talit
y fo
r W
hite
(5.
3 pe
r 1,
000)
and
His
pani
c (5
.5 p
er 1
,000
) in
fant
s.
Tar
rant
Cou
nty
led
the
stat
e's
larg
e co
untie
s in
infa
nt m
orta
lity
in b
oth
1990
(10
.0 in
fant
deat
hs p
er 1
,000
live
bir
ths)
and
200
1 (7
.8 p
ercA
1,00
0). I
n bo
th y
ears
, El P
aso
Cou
nty
expe
ri-
Cri
ence
d th
e lo
wes
t inf
ant m
orta
lity
rate
am
ong
larg
e co
untie
s, a
t 6.2
and
4.7
infa
nt d
eath
s pe
r1,
000
live
birt
hs, i
n tu
rn, i
n 19
90 a
nd 2
001.
The
rat
e of
infa
nt d
eath
s im
prov
ed m
ost i
n
Har
ris
Cou
nty,
dec
linin
g by
38.
2%, f
rom
8.8
to 5
.4 in
fant
dea
ths
per
1,00
0 liv
e bi
rths
betw
een
1990
and
200
1.
Stat
ewid
e be
twee
n 19
90 a
nd 2
001,
a d
iffe
rent
patte
rn o
ccur
red
for
low
bir
thw
eigh
t bir
ths
than
for
the
infa
nt m
orta
lity
rate
. Unl
ike
infa
nt
mor
talit
y, w
hich
has
dec
lined
ove
rall,
the
pro-
port
ion
of T
exas
bab
ies
born
und
erw
eigh
t
incr
ease
d by
9.0
% b
etw
een
1990
and
200
1,
from
6.9
% to
7.6
% o
f liv
e bi
rths
. Dur
ing
this
time,
the
perc
enta
ge in
crea
se in
low
bir
th-
wei
ght W
hite
bab
ies
(up
by 1
8.7%
) w
as
alm
ost t
wic
e th
e gr
owth
in lo
w b
irth
wei
ght
tn\
birt
hs f
or th
e st
ate
as a
who
le (
show
n
in F
igur
e 6.
2). U
p
by 1
1.0%
, the
incr
ease
in lo
w
birt
hwei
ght b
irth
s
for
His
pani
c
infa
nts
also
out
-
pace
d gr
owth
in
the
perc
enta
ge o
f
thes
e bi
rths
for
Tex
as o
vera
ll. I
n
cont
rast
to th
e ri
se
in lo
w b
irth
wei
ght
birt
hs a
mon
g W
hite
and
His
pani
c gr
oups
, the
Afr
ican
-Am
eric
an p
opul
atio
n al
one
expe
rien
ced
a sl
ight
dec
line
of 1
.0%
in th
e pe
rcen
tage
of
babi
es b
orn
unde
r w
eigh
t. St
ill, t
he a
bsol
ute
rate
of lo
w b
irth
wei
ght b
irth
s re
mai
ned
high
est
amon
g A
fric
an-A
mer
ican
s ba
bies
in 2
001
(at
12.9
% o
f liv
e bi
rths
, com
pare
d to
6.9
% o
f liv
e
birt
hs f
or b
oth
Whi
te a
nd H
ispa
nic
babi
es)
as in
1990
(w
hen
the
perc
enta
ge o
f lo
w b
irth
wei
ght
babi
es s
tood
at 1
3.0%
am
ong
the
Afr
ican
Am
eric
an, 6
.2%
am
ong
the
His
pani
c, a
nd 5
.8%
amon
g th
e W
hite
pop
ulat
ion
grou
ps).
15 12
9 6 3 0
LJ
Fig
ure
6.2
Low
Birt
hwei
ght B
irths
by
Rac
e an
d E
thni
city
Whi
teA
fric
an-A
mer
ican
0 H
ispa
nic
0 O
ther
Rac
e
S4.
3rt
.r5
C\
Sq
SC
1S
CC
NON
In b
oth
1990
and
200
1, T
ravi
s C
ount
y ex
peri
-
ence
d th
e lo
wes
t per
cent
age
of lo
w b
irth
wei
ght
birt
hs, a
t 6.5
% a
nd 6
.9%
of
all l
ive
birt
hs,
resp
ectiv
ely,
am
ong
Tex
as' s
ix m
ost p
opul
ous
coun
ties.
In
Dal
las
Cou
nty,
low
bir
thw
eigh
t
birt
hs r
ose
by ju
st 1
.5%
bet
wee
n 19
90 a
nd
2001
, the
sm
alle
st r
ate
of in
crea
se a
mon
g T
exas
'
larg
e co
untie
s an
d on
e-si
xth
the
size
of
the
incr
ease
in lo
w b
irth
wei
ght b
irth
s fo
r th
e st
ate
over
all.
Har
ris
Cou
nty,
whe
re th
e lo
w b
irth
-
wei
ght r
ate
rose
by
2.6%
and
Tra
vis
Cou
nty,
whe
re th
e pe
rcen
tage
of
low
bir
thw
eigh
t bir
ths
grew
6.2
%, a
lso
saw
sm
alle
r pe
rcen
tage
Li

incr
ease
s th
an T
exas
as
a
who
le. I
n co
ntra
st,
Bex
ar C
ount
y's
low
bir
thw
eigh
t
rate
jum
ped
by
19%
, a h
ighe
r
perc
enta
ge
incr
ease
than
in a
ny o
ther
of
47th
e la
rge
coun
-
ties
in th
e st
ate.
CD
INA
DE
QU
AT
EPR
E A
T I
CA
RE
DR
OPS
OV
ER
AL
L, B
UT
UP
SLIG
HT
LY
IN
LA
TE
199
0S
In T
exas
as
a w
hole
, the
per
cent
age
of b
abie
s
born
to m
othe
rs w
ho r
ecei
ved
little
or
no p
re-
nata
l car
e dr
oppe
d by
abo
ut o
ne-t
hird
(do
wn
31.5
%)
betw
een
1990
and
200
1. W
hite
,A
fric
an-A
mer
ican
, and
His
pani
c ra
ce a
nd e
th-
nic
grou
ps e
xper
ienc
ed c
ompa
rabl
e de
clin
es in
the
prop
ortio
n of
thes
e ba
bies
, fal
ling
in tu
rn
1,1
15 12
9
Fig
ure
6.3
Mot
hers
Rec
eivi
ng L
ate
or N
o P
rena
tal C
are
by R
ace
and
Eth
nici
ty
Whi
teA
fric
an-A
mer
ican
His
pani
cO
ther
Rac
e
('c
by 3
6.2%
, by
33.1
%, a
nd b
y 37
.0%
dur
ing
that
tim
e, tr
ends
that
are
vis
ible
in F
igur
e 6.
3.
Whi
le th
e pe
rcen
tage
of
babi
es b
orn
to m
oth-
ers
who
rec
eive
d in
suff
icie
nt c
are
duri
ng p
reg-
nanc
y st
eadi
ly d
eclin
ed f
rom
199
0 th
orou
gh
1997
, thi
s tr
end
reve
rsed
for
sev
eral
sub
sequ
ent
year
s. A
cros
s ea
ch r
ace
and
ethn
ic g
roup
, the
prop
ortio
n of
bab
ies
who
se m
othe
rs r
ecei
ved
inad
equa
te c
are
duri
ng p
regn
ancy
con
sist
ently
rose
fro
m 1
998
until
200
1, w
hen
it ag
ain
expe
-
rien
ced
a sl
ight
dec
line.
Tar
rant
Cou
nty'
s im
prov
emen
t in
the
perc
ent-
age
of b
abie
s bo
rn to
mot
hers
with
inad
equa
te
pren
atal
car
e, w
hich
fel
l by
45.6
% b
etw
een
1990
and
200
1, o
utpa
ced
gain
s fo
r th
e st
ate
and
each
of
the
othe
r la
rge
coun
ties.
Onl
y
Tra
vis
Cou
nty,
up
by 3
5.9%
, exp
erie
nced
an
incr
ease
in th
e pr
opor
tion
of b
irth
s to
mot
hers
rece
ivin
g lit
tle o
r no
pre
nata
l car
e. T
he p
er-
cent
age
of b
abie
s w
hose
mot
hers
rec
eive
d
insu
ffic
ient
pre
nata
l car
e w
as lo
wes
t in
Bex
ar
Cou
nty
in b
oth
1990
(at
3.5
% o
f liv
e bi
rths
)an
d 20
01 (
3.0%
of
live
birt
hs).
CH
ILD
ME
DIC
AID
EN
RO
LLM
EN
TS
DE
CLI
NE
WH
ILE
CH
IPP
AR
TIC
IPA
TIO
N S
OA
RS
Due
to a
hea
lthy
econ
omy
and
the
tran
sitio
n of
fam
ilies
out
of
the
stat
e's
publ
ic a
ssis
tanc
e sy
s-
tem
, the
per
cent
age
of c
hild
ren
enro
lled
in
Med
icai
d fe
ll by
alm
ost a
fif
th, d
own
18.0
%,

LJ\V
/
betw
een
1995
(w
hen
20.8
% o
f th
e st
ate'
s
unde
r-18
pop
ulat
ion
enro
lled)
and
200
0 (w
ith
an e
nrol
lmen
t rep
rese
ntin
g 16
.0%
of
Tex
asch
ildre
n). M
ost o
f th
is d
eclin
e to
ok p
lace
betw
een
1995
and
199
8, w
hile
the
prop
ortio
nof
chi
ldre
n en
rolle
d in
Med
icai
d re
mai
ned
stea
dy th
roug
h 20
00 a
nd in
crea
sed
to 1
7.0%
in 2
001.
Figu
re 6
.4 p
rese
nts
2001
Med
icai
d an
d C
HIP
CA
nrol
lmen
ts f
or T
exas
and
eac
h of
its
larg
est
'' ount
ies.
In
both
199
5 an
d 20
01, M
edic
aid
enro
llmen
t rat
es f
or th
e st
ate'
s si
x la
rges
t cou
n-
ties
mai
ntai
ned
iden
tical
rel
ativ
e ra
nkin
gs.
Tar
rant
Cou
nty,
with
14.
2% o
f its
chi
ld p
op-
ulat
ion
rece
ivin
g M
edic
aid
in
1995
and
10.
4% o
f its
chi
l-
dren
enr
olle
d in
200
1, e
xpe-
rien
ced
the
low
est r
ates
of
prog
ram
par
ticip
atio
n in
both
yea
rs. M
edic
aid
enro
ll-
men
t in
El P
aso
Cou
nty
surp
asse
d m
embe
rshi
p ra
tes
for
each
of
the
othe
r la
rge
coun
ties
in b
oth
1995
and
/1
2001
, with
29.
5% a
nd 2
9.9%
of
its c
hild
ren,
resp
ectiv
ely,
rec
eivi
ng M
edic
aid
prog
ram
sup
-
port
in th
ose
year
s. A
lthou
gh it
s in
crea
se o
f
1.5%
bet
wee
n 19
95 a
nd 2
001
was
sm
all,
El
Paso
Cou
nty
was
the
only
one
of
Tex
as' m
ost
popu
lous
cou
ntie
s in
whi
ch M
edic
aid
enro
ll-
men
ts r
ose.
In
Har
ris
(dow
n 34
.1%
), D
alla
s
(dow
n 31
.4%
), T
arra
nt (
dow
n 26
.8%
), a
nd
Tra
vis
(dow
n 23
.2%
) C
ount
ies,
the
decl
ine
in
Med
icai
d pa
rtic
ipat
ion
exce
eded
the
drop
in
prog
ram
enr
ollm
ent s
tate
wid
e.
Ref
lect
ing
Tex
as' a
bund
ance
of
low
-wag
e jo
bs
Fig
ure
6.4
Med
icai
d an
d C
HIP
Enr
ollm
ent 2
001
Tex
as
Bex
ar
Dal
las
El P
aso
Har
ris
Tar
rant
Tra
vis
0
Med
icai
d0
CH
IP
1015
20
Per
cent
of C
hild
ren
2530
that
off
er n
o m
edic
al in
sura
nce,
the
rate
of
CH
IP p
artic
ipat
ion
clim
bed
mor
e th
an s
ixfo
ld,
from
1.0
% to
6.3
% o
f T
exas
chi
ldre
n, in
the
prog
ram
's f
irst
yea
r. E
ven
with
this
one
-yea
r
jum
p in
CH
IP m
embe
rshi
p, th
e pe
rcen
tage
of
the
stat
e's
child
ren
enro
lled
in M
edic
aid
in
2001
rem
aine
d at
alm
ost t
hree
tim
es th
e pr
o-
port
ion
of c
hild
ren
part
icip
atin
g in
CH
IP.
El P
aso
Cou
nty
led
the
othe
r fi
ve la
rges
t cou
n-
ties
in C
HIP
enr
ollm
ent i
n bo
th 2
000
(whe
n
1.4%
of
the
coun
ty's
chi
ldre
n re
ceiv
ed C
HIP
bene
fits
) an
d 20
01 (
whe
n 10
.0%
the
child
popu
latio
n pa
rtic
ipat
ed in
the
prog
ram
).
Dal
las
Cou
nty,
whe
re 2
000
CH
IP e
nrol
lmen
t(0
.6%
of
child
ren)
was
low
est a
mon
g th
e
stat
e's
mos
t pop
ulou
s co
untie
s, b
y 20
01 h
ad
expe
rien
ced
the
larg
est p
erce
ntag
e in
crea
se in
prog
ram
par
ticip
atio
n, u
p by
696
.7%
. With
the
low
est p
erce
ntag
e ri
se in
CH
IP e
nrol
lmen
tam
ong
the
larg
e co
untie
s be
twee
n 20
00 a
nd
2001
(up
396
.7%
), T
ravi
s C
ount
y al
so e
nrol
led
the
smal
lest
pro
port
ion
of it
s ch
ild p
opul
atio
n,
4.2%
, in
CH
IP in
200
1.

.te
:
'
A
4
4
e

Sec
tion
7:H
unge
r&
Nut
ritio
nF
or m
any
peop
le, h
unge
r is
em
blem
atic
of e
cono
mic
hard
ship
as s
uch,
we
ofte
n lit
eral
ly d
escr
ibe
bein
g
poor
as
"goi
ng h
ungr
y."
Hun
ger
and
food
inse
curit
y
pers
ist i
n fa
mili
es w
ho s
trug
gle
to s
urvi
ve a
t or
near
the
pove
rty
line,
and
they
als
o ex
tend
into
inco
me
leve
ls th
atm
any
wou
ld c
onsi
der
mid
dle
clas
s. T
his
issu
e
iscr
ucia
lfo
r ch
ildre
n, w
ho c
anno
t mai
ntai
n th
eir
heal
th, g
row
, or
lear
n w
ithou
t the
bas
ic r
esou
rce
of
adeq
uate
and
nut
ritio
nally
sou
nd fo
od.

/z
HU
NG
ER
AN
D F
OO
D IN
SE
CU
RIT
Y
In m
uch
of th
e w
orld
, wid
espr
ea'.d
hun
ger,
mal
-
nour
ishm
ent,'
,a,n
d st
arva
tion
occu
r as
a r
esul
t of
fam
ine,
the
tang
ible
sho
rtag
e of
foo
d. B
ut in
indu
stri
aliz
ed n
atio
ns li
ke th
e U
nite
d St
ates
,
hung
er a
nd f
ood
inse
curi
ty d
o no
t hap
pen
beca
use
food
is u
nava
ilabl
e. R
athe
r, f
ood
hard
-,'
ship
her
e oc
curs
bec
ause
peo
ple
of li
mite
d ec
o-
nom
ic m
eans
lack
suf
fici
ent f
inan
cial
res
ourc
es
to p
urch
ase
food
. The
dis
tinct
ion
is im
port
ant,
and
in r
ecog
nizi
ng it
, res
earc
hers
hav
e de
vel-
oped
the
conc
ept o
f "f
ood
inse
curi
ty"
to
enco
mpa
ss th
e va
ried
deg
rees
of
food
har
dshi
p
that
aff
ect l
ow-i
ncom
e fa
mili
es in
the
U. S
. The
U.S
. Dep
artm
ent o
f A
gric
ultu
re (
USD
A)
defi
nes
hung
er a
s th
e "u
neas
y or
pai
nful
sen
sa-
tion
caus
ed b
y la
ck o
f fo
od d
ue to
lack
of
reso
urce
s to
obt
ain
food
" an
d fo
od in
secu
rity
as
"lim
ited
or u
ncer
tain
ava
ilabi
lity
of n
utri
tiona
l-
ly a
dequ
ate
and
suff
icie
nt f
oods
." O
n th
e ot
her
hand
, fam
ilies
are
con
side
red
food
sec
ure
if th
ey
have
"as
sure
d ac
cess
to e
noug
h fo
od f
or a
n
activ
e he
alth
y lif
e."
The
USD
A u
ses
thes
e de
fi-
nitio
ns to
cla
ssif
y A
mer
ican
hou
seho
lds
as
eith
er "
food
sec
ure,
" "f
ood
inse
cure
with
out
hung
er,"
"fo
od in
secu
re w
ith m
oder
ate
hung
er,"
or
"foo
d in
secu
re w
ith s
ever
e hu
nger
."
Hou
seho
lds
are
cons
ider
ed f
ood
inse
cure
with
"mod
erat
e" o
r "s
ever
e" h
unge
r w
hen
a la
ck o
f
reso
urce
s m
eans
that
the
child
fam
ily m
embe
rs
do n
ot g
et e
noug
h to
eat
.' In
the
earl
y 19
90s,
USD
A a
nd o
ther
nat
iona
l res
earc
hers
dev
el-
oped
the
Food
Sec
urity
Cor
e M
odul
e, a
sur
vey
tool
to m
easu
re a
nd c
olle
ct n
atio
nal d
ata
on
the
prev
alen
ce o
f hu
nger
and
foo
d in
secu
rity
in
the
Uni
ted
Stat
es. T
he C
ensu
s B
urea
u fi
rst
adm
inis
tere
d th
e su
rvey
in 1
995,
and
rel
ease
d
the
mos
t rec
ent d
ata
from
it in
200
2.
Acc
ordi
ng to
thes
e da
ta, T
exas
has
the
seco
nd
high
est r
ate
of f
ood
inse
curi
ty in
the
coun
try,
with
alm
ost 1
4% o
f ho
useh
olds
eith
er h
ungr
y
or a
t ris
k fo
r hu
nger
.2 T
his
mea
ns th
at o
ver
2.8
mill
ion
Tex
ans
cann
ot a
lway
s af
ford
an
ade-
quat
e an
d nu
triti
ous
diet
. One
-qua
rter
of
thes
e
fam
ilies
, ove
r 72
9,00
0 T
exan
s, e
xper
ienc
e ou
t-
righ
t hun
ger.
Food
inse
curi
ty in
Tex
as is
mor
e pr
onou
nced
than
in th
e na
tion
over
all a
s a
resu
lt of
wid
e-
spre
ad p
over
ty a
nd th
e hi
gh p
erce
ntag
e of
fam
-
ilies
am
ong
the
wor
king
poo
r. I
n a
rece
nt
natio
nal r
epor
t on
fam
ily e
cono
mic
har
dshi
ps,
17.5
% o
f re
spon
dent
s in
hou
seho
lds
with
inco
mes
up
to tw
ice
the
fede
ral p
over
ty li
ne
repo
rted
ski
ppin
g m
eals
bec
ause
they
lack
ed
the
mon
ey to
pay
for
foo
d. M
ore
than
40%
of
the
stud
y's
part
icip
ants
sai
d th
ey r
outin
ely
wor
ried
abo
ut h
avin
g en
ough
foo
d.' A
199
9
repo
rt o
n fa
mily
eco
nom
ic s
ecur
ity f
ound
that
over
hal
f (5
6.8%
) of
chi
ldre
n in
Tex
as h
ouse
-
hold
s w
ith in
com
es u
p to
twic
e th
e fe
dera
l
pove
rty
line
lived
in f
amili
es w
here
the
adul
ts
wor
ried
abo
ut o
r ha
d di
ffic
ulty
aff
ordi
ng f
ood.
'
Cha
ract
eris
tics
of h
ouse
hold
s th
at f
ace
food
inse
curi
ty in
clud
e di
ffic
ulty
obt
aini
ng e
noug
h
food
, anx
iety
abo
ut th
e fa
mily
foo
d su
pply
,
skip
ping
mea
ls, a
nd th
e us
e of
em
erge
ncy
food
reso
urce
s.'
PR
OG
R M
S T
O H
ELP
FA
MIL
IES
PR
OV
IDE
FO
OD
Bas
ed o
n an
idea
that
goe
s ba
ck to
the
late
1930
s, F
ood
Stam
ps p
rovi
de a
tem
pora
ry s
afet
y
net t
o lo
w-i
ncom
e in
divi
dual
s an
d fa
mili
es.'
Food
Sta
mps
hel
p fa
mili
es a
void
hun
ger
and
lift l
ow-w
age
wor
kers
out
of
pove
rty.
In
fisc
al
year
200
1, a
vera
ge m
onth
ly p
artic
ipat
ion
in
the
Food
Sta
mp
prog
ram
sto
od a
t mor
e th
an0,
17.3
mill
ion
peop
le. T
he f
eder
al g
over
nmen
t
`'pay
s 10
0% o
f th
e co
st o
f Fo
od S
tam
ps, w
hile
the
stat
e pr
ovid
es h
alf
the
cost
of
prog
ram
adm
inis
trat
ion,
incl
udin
g th
e ex
pens
e of
det
er-
min
ing
elig
ibili
ty.
Food
Sta
mps
hel
p th
e m
ost n
eedy
mem
bers
of
our
com
mun
ities
. App
roxi
mat
ely
89%
of
hous
ehol
ds th
at r
ecei
ve F
ood
Stam
ps h
ave
inco
mes
bel
ow th
e fe
dera
l pov
erty
line
, and
over
one
-thi
rd a
re c
onsi
dere
d ex
trem
ely
poor
,
with
inco
mes
at o
r be
low
50%
of
the
offi
cial
pove
rty
thre
shol
d. H
ouse
hold
s w
ith c
hild
ren
acco
unt f
or 8
7% o
f Fo
od S
tam
ps b
enef
its.
LJ
In T
exas
, rec
ent p
olic
y de
cisi
ons
have
res
ulte
d
in p
rogr
am c
hang
es th
at r
educ
e ad
min
istr
ativ
e
barr
iers
to F
ood
Stam
p pa
rtic
ipat
ion.
One
of
thes
e m
odif
icat
ions
exp
ands
the
use
of te
le-
phon
e in
terv
iew
s to
est
ablis
h el
igib
ility
, ins
tead
of r
equi
ring
Foo
d St
amp
appl
ican
ts to
app
ear
for
a pe
rson
al in
terv
iew
with
an
elig
ibili
ty
wor
ker.
Ano
ther
pol
icy
chan
ge r
educ
es th
e fr
e-
quen
cy o
f re
cert
ific
atio
ns, w
hen
clie
nts
mus
t
prov
e th
at th
ey a
re s
till e
ligib
le f
or F
ood
Stam
p
bene
fits
. New
rul
es a
lso
set u
p m
ore
real
istic
reso
urce
lim
its f
or p
rogr
am p
artic
ipat
ion,
so
that
fam
ilies
stil
l can
qua
lify
for
bene
fits
eve
n if
they
ow
n so
me
savi
ngs
or a
mod
est v
ehic
le.
Cre
ated
in th
e 19
70s,
the
Wom
en's
, Inf
ants
', an
d
Chi
ldre
n's
food
pro
gram
prov
ides
sup
plem
enta
l
food
s an
d ot
her
heal
th r
esou
rces
to p
regn
ant
and
lact
atin
g w
omen
and
chi
ldre
n un
der
age
five
in o
rder
to e
nhan
ce th
eir
nutr
ition
al s
tatu
s.
WIC
pre
scri
bes
a sp
ecif
ic n
utri
tiona
l reg
imen
to
addr
ess
the
indi
vidu
al h
ealth
nee
ds o
f ea
ch
prog
ram
par
ticip
ant.
In f
isca
l yea
r 20
00, W
IC
serv
ed a
ppro
xim
atel
y 7.
2 m
illio
n w
omen
and
child
ren
mon
thly
, and
stu
dies
hav
e do
cum
ente
d
a nu
mbe
r of
pos
itive
hea
lth o
utco
mes
res
ultin
g
from
wom
en's
and
chi
ldre
n's
invo
lvem
ent i
n
the
prog
ram
.
The
Nat
iona
l Sch
ool L
unch
Pro
gram
pro
vide
s
child
ren
acro
ss th
e co
untr
y w
ith a
n op
port
uni-
ty to
obt
ain
at le
ast o
ne c
ompl
ete
mea
l eac
h
scho
ol d
ay. L
unch
es s
erve
d by
the
prog
ram
supp
ly a
t lea
st o
ne-t
hird
of
child
ren'
s
Rec
omm
ende
d D
aily
Allo
wan
ce (
RD
A)
for
key
nutr
ient
s. D
urin
g th
e 20
00-2
001
scho
ol y
ear,
The
dec
line
in F
ood
Sta
mp
part
icip
atio
n fa
r ex
ceed
ed th
em
uch
smal
ler
drop
in T
exas
' chi
ld p
over
ty r
ate.
24.7
mill
ion
child
ren
part
icip
ated
in th
e sc
hool
lunc
h pr
ogra
m a
nd o
n an
y gi
ven
day,
15.
6m
illio
n of
them
rec
eive
d fr
ee o
r re
duce
d-pr
ice
lunc
hes
avai
labl
e to
chi
ldre
n in
low
-inc
ome

UN
OV
E2S
AL
SC
HO
OL
BR
EA
KFA
SU
To
qual
ify fo
r fr
ee o
r re
duce
d-pr
ice
scho
ol
mea
ls, s
tude
nts
mus
t com
e fr
om fa
mili
es th
at
mee
t low
-inco
me
elig
ibili
ty g
uide
lines
.
Uni
vers
al s
choo
l bre
akfa
st p
rogr
ams
offe
r
brea
kfas
t to
all c
hild
ren
rega
rdle
ss o
f inc
ome.
Edu
cato
rs k
now
that
sch
ool b
reak
fast
enha
nces
stu
dent
per
form
ance
, im
prov
es
stud
ent h
ealth
, and
impr
oves
the
beha
vior
al
and
lear
ning
env
ironm
ent a
t sch
ool.
On
thes
e
grou
nds,
pro
posa
ls to
est
ablis
h un
iver
sal
C)
scho
ol b
reak
fast
pro
gram
s id
entif
y se
vera
l of
N.)
thei
r m
ain
adva
ntag
es. B
y ut
ilizi
ng c
erta
in
prov
isio
ns o
f the
Nat
iona
l Sch
ool L
unch
Ad,
scho
bls
can
dela
y bu
rden
som
e el
igib
ility
proc
essi
ng fo
r th
e fir
st th
ree
year
s of
the
brea
kfas
t pro
gram
, per
haps
long
er. S
ince
univ
ersa
l bre
akfa
st p
rogr
ams
serv
e al
l
stud
ents
, the
y ca
n re
duce
som
e of
the
stig
ma
of a
mea
l tar
gete
d to
low
-inco
me
child
ren.
Fin
ally
, fre
e br
eakf
asts
offe
red
to a
ll st
uden
ts
can
be s
erve
d in
cla
ssro
oms,
an
inno
vatio
n
that
has
sur
pris
ed s
ome
scho
ols
with
its
posi
-
tive
beha
vior
al a
nd a
cade
mic
out
com
es.
Sch
ool B
reak
fast
Rep
ort C
ard
2002
Foo
d R
esea
rch
and
Act
ion
Cen
ter
ww
w.fr
ac.o
rg
fam
ilies
. Hou
seho
ld in
com
e de
term
ines
elig
ibili
ty f
or f
ree
and
redu
ced-
pric
e lu
nche
s
thro
ugh
the
prog
ram
. Chi
ldre
n in
fam
ilies
with
inco
mes
bet
wee
n 13
0% a
nd 1
85%
of
the
fede
ral p
over
ty th
resh
old
qual
ify
for
redu
ced-
pric
e m
eals
. Fam
ily in
com
e at
or
belo
w 1
30%
of th
e po
vert
y lin
e m
akes
chi
ldre
n el
igib
le f
or
free
sch
ool l
unch
. In
Tex
as, o
ver
1.7
mill
ion
child
ren
qual
ifie
d fo
r fr
ee o
r re
duce
d pr
ice
lunc
hes
in s
choo
l yea
r 20
0120
02.
In T
exas
, an
exte
nsiv
e em
erge
ncy
feed
ing
net-
wor
k of
pri
vate
, non
-pro
fit,
and
faith
-bas
ed
inst
itutio
ns p
lays
a s
igni
fica
nt r
ole
in f
eedi
ng th
e
hung
ry, e
ven
whe
n th
ey q
ualif
y fo
r an
d m
ay b
e
rece
ivin
g be
nefi
ts th
roug
h th
e Fo
od S
tam
p pr
o-
gram
. The
Tex
as A
ssoc
iatio
n of
Sec
ond
Har
vest
Food
Ban
ks (
TA
SHFB
) re
pres
ents
the
larg
est
netw
ork
of f
ood
bank
s in
the
stat
e. T
hese
19
food
ban
ks d
istr
ibut
e fo
od to
3,7
00 c
hari
tabl
e
agen
cies
that
ser
ve a
ll 25
4 T
exas
cou
ntie
s. I
n
1999
, Tex
as f
ood
bank
s co
llect
ed a
nd d
istr
ib-
uted
125
mill
ion
poun
ds o
f fo
od to
its
netw
ork
of c
hari
ties.
The
se c
hari
ties
serv
ed 3
3 m
illio
n
hot m
eals
to h
ungr
y in
divi
dual
s an
d fa
mili
es in
Tex
as a
nd p
rovi
ded
groc
erie
s to
2.5
mill
ion
hous
ehol
ds, r
epre
sent
ing
appr
oxim
atel
y 7.
5
mill
ion
peop
le.
Eco
nom
ic c
ondi
tions
ove
r th
e la
st s
ever
al y
ears
have
sev
erel
y st
rain
ed th
e re
sour
ces
of c
hari
tabl
e
food
pro
vide
rs th
roug
hout
the
stat
e. A
t the
sam
e tim
e th
at s
trug
glin
g fa
mili
es' d
eman
d fo
r
emer
genc
y fo
od h
as c
limbe
d, th
e ec
onom
ic
vuln
erab
ility
of
food
ban
k do
nors
has
com
pro-
mis
ed th
eir
abili
ty to
pro
vide
as
muc
h fo
od to
the
netw
ork
as it
nee
ds to
ser
ve it
s cl
ient
s.
Nea
rly h
alf t
he s
tude
nts
enro
lled
inT
exas
sch
ools
par
ticip
ate
in th
e fr
eean
d re
duce
d-pr
ice
lunc
h pr
ogra
m.
In 2
001,
the
77th
Tex
as L
egis
latu
re p
asse
d
Sena
te B
ill 3
98, w
hich
pro
vide
s $5
00,0
00 in
stat
e fu
nds
to tr
ansp
ort s
urpl
us f
resh
pro
duce
from
Tex
as f
arm
s to
loca
l foo
d ba
nks
thro
ugho
ut
the
stat
e. T
he le
gisl
atio
n al
so s
ubsi
dize
s th
e fe
es
that
far
mer
s w
ould
oth
erw
ise
pay
to h
arve
st th
is
surp
lus.
Dur
ing
the
firs
t yea
r of
this
pro
ject
,
over
fou
r m
illio
n po
unds
of
fres
h pr
oduc
e w
as
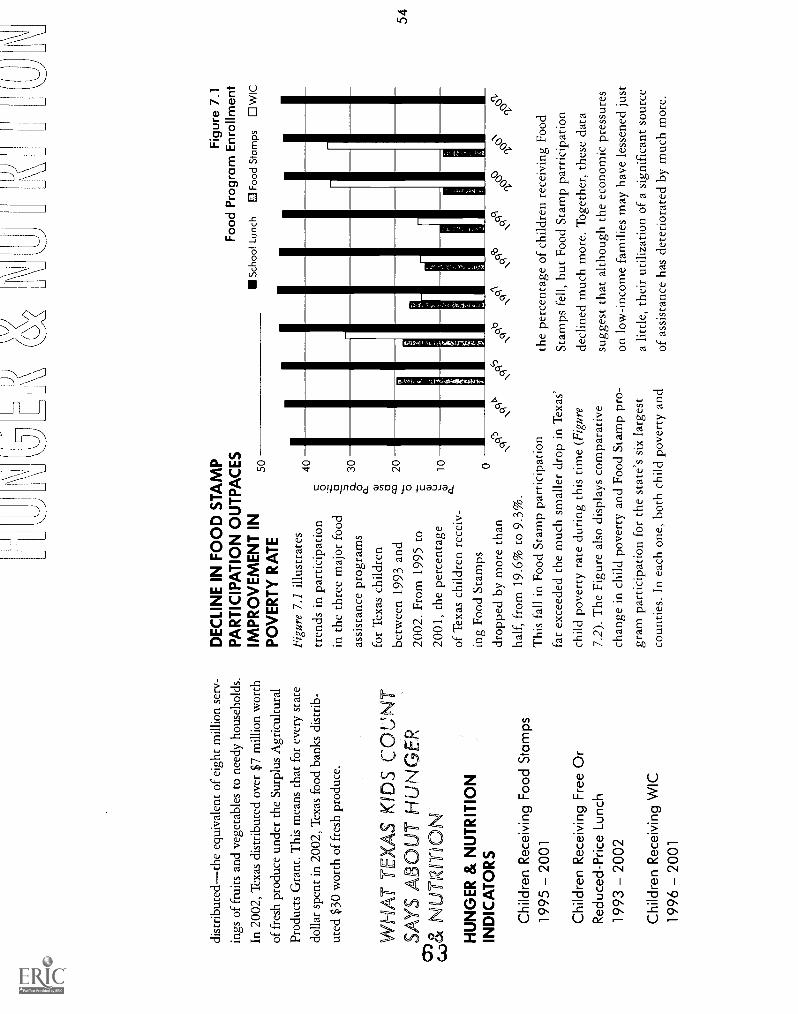
dist
ribu
tedt
he e
quiv
alen
t of
eigh
t mill
ion
serv
-in
gs o
f fr
uits
and
veg
etab
les
to n
eedy
hou
seho
lds.
In 2
002,
Tex
as d
istr
ibut
ed o
ver
$7 m
illio
n w
orth
of f
resh
pro
duce
und
er th
e Su
rplu
s A
gric
ultu
ral
Prod
ucts
Gra
nt. T
his
mea
ns th
at f
or e
very
sta
te
dolla
r sp
ent i
n 20
02, T
exas
foo
d ba
nks
dist
rib-
uted
$30
wor
th o
f fr
esh
prod
uce.
WH
AT
TE
XA
S K
IDS
CO
LN
ITSA
YS
MO
UT
HU
NG
ER
c, c,38
( N
UT
RIM
ON
HU
NG
ER
& N
UT
RIT
ION
IND
ICA
TO
RS
Chi
ldre
n R
ecei
ving
Foo
d S
tam
ps19
9520
01
Chi
ldre
n R
ecei
ving
Fre
e O
rR
educ
ed-P
rice
Lunc
h
1993
2002
Chi
ldre
n R
ecei
ving
WIC
1996
2001
DE
CLI
NE
IN F
OO
D S
TA
MP
PA
RT
ICIP
AT
ION
OU
TP
AC
ES
IMP
RO
VE
ME
NT
INP
OV
ER
TY
RA
TE
Figu
re 7
.1 il
lust
rate
s
tren
ds in
par
ticip
atio
nin
the
thre
e m
ajor
foo
d
assi
stan
ce p
rogr
ams
for
Tex
as c
hild
ren
betw
een
1993
and
2002
. Fro
m 1
995
to
2001
, the
per
cent
age
of T
exas
chi
ldre
n re
ceiv
-
ing
Food
Sta
mps
drop
ped
by m
ore
than
half
, fro
m 1
9.6%
to 9
.3%
.T
his
fall
in F
ood
Stam
p pa
rtic
ipat
ion
far
exce
eded
the
muc
h sm
alle
r dr
op in
Tex
as'
child
pov
erty
rat
e du
ring
this
tim
e (F
igur
e
7.2)
. The
Fig
ure
also
dis
play
s co
mpa
rativ
ech
ange
in c
hild
pov
erty
and
Foo
d St
amp
pro-
gram
par
ticip
atio
n fo
r th
e st
ate'
s si
x la
rges
tco
untie
s. I
n ea
ch o
ne, b
oth
child
pov
erty
and
50
L
Fig
ure
7.1
Foo
d P
rogr
am E
nrol
lmen
t
Sch
ool L
unch
El F
ood
Sta
mps
WIC
the
perc
enta
ge o
f ch
ildre
n re
ceiv
ing
Food
Stam
ps f
ell,
but F
ood
Stam
p pa
rtic
ipat
ion
decl
ined
muc
h m
ore.
Tog
ethe
r, th
ese
data
sugg
est t
hat a
lthou
gh th
e ec
onom
ic p
ress
ures
on lo
w-i
ncom
e fa
mili
es m
ay h
ave
less
ened
just
a lit
tle, t
heir
util
izat
ion
of a
sig
nifi
cant
sou
rce
of a
ssis
tanc
e ha
s de
teri
orat
ed b
y m
uch
mor
e.
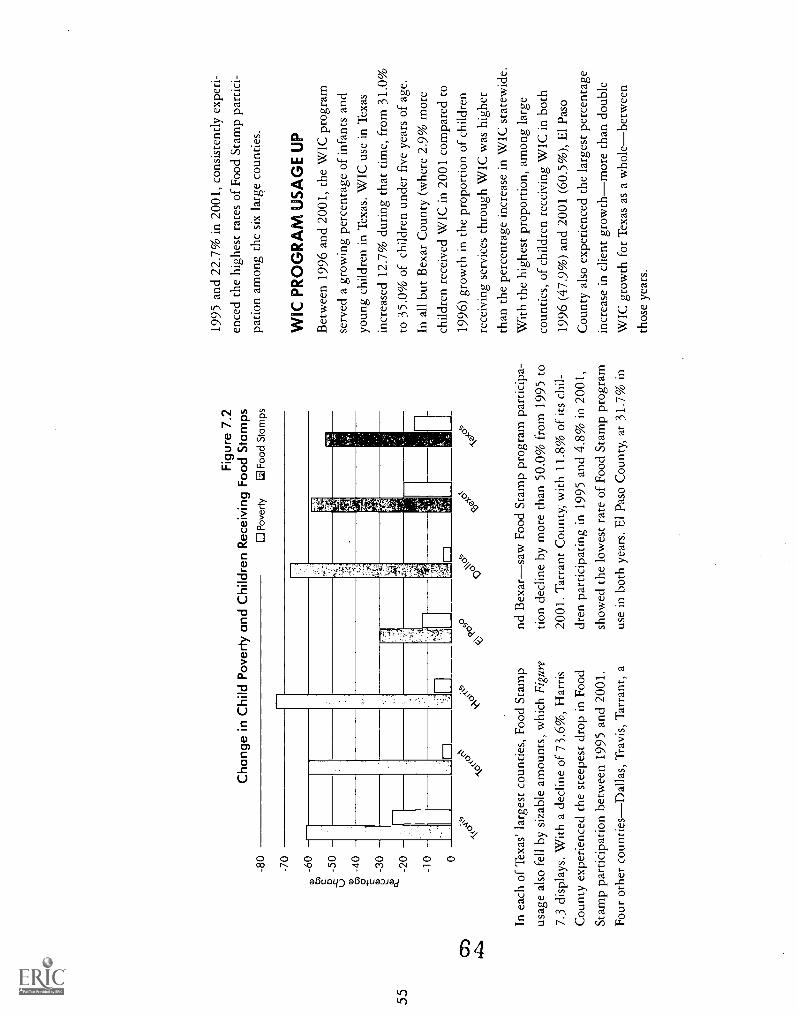
Fig
ure
7.2
Cha
nge
in C
hild
Pov
erty
and
Chi
ldre
n R
ecei
ving
Foo
d S
tam
ps-8
0P
over
tyF
ood
Sta
mps
-70
-60
rn 0 o -5
0L.
) a, -
40a C :k
1.2)
-30
-20
-10 0
In e
ach
of T
exas
' lar
gest
cou
ntie
s, F
ood
Stam
p
usag
e al
so f
ell b
y si
zabl
e am
ount
s, w
hich
Fig
ure
7.3
disp
lays
. With
a d
eclin
e of
73.
6%, H
arri
s
Cou
nty
expe
rien
ced
the
stee
pest
dro
p in
Foo
d
Stam
p pa
rtic
ipat
ion
betw
een
1995
and
200
1.Fo
ur o
ther
cou
ntie
sDal
las,
Tra
vis,
Tar
rant
, a
nd B
exar
saw
Foo
d St
amp
prog
ram
par
ticip
a-tio
n de
clin
e by
mor
e th
an 5
0.0%
fro
m 1
995
to20
01. T
arra
nt C
ount
y, w
ith 1
1.8%
of
its c
hil-
dren
par
ticip
atin
g in
199
5 an
d 4.
8% in
200
1,
show
ed th
e lo
wes
t rat
e of
Foo
d St
amp
prog
ram
use
in b
oth
year
s. E
l Pas
o C
ount
y, a
t 31.
7% in
1995
and
22.
7% in
200
1, c
onsi
sten
tly e
xper
i-
ence
d th
e hi
ghes
t rat
es o
f Fo
od S
tam
p pa
rtic
i-
patio
n am
ong
the
six
larg
e co
untie
s.
WIC
PR
OG
RA
M U
SA
GE
UP
Bet
wee
n 19
96 a
nd 2
001,
the
WIC
pro
gram
serv
ed a
gro
win
g pe
rcen
tage
of
infa
nts
and
youn
g ch
ildre
n in
Tex
as. W
IC u
se in
Tex
as
incr
ease
d 12
.7%
dur
ing
that
tim
e, f
rom
31.
0%to
35.
0% o
f ch
ildre
n un
der
five
yea
rs o
f ag
e.
In a
ll bu
t Bex
ar C
ount
y (w
here
2.9
% m
ore
child
ren
rece
ived
WIC
in 2
001
com
pare
d to
1996
) gr
owth
in th
e pr
opor
tion
of c
hild
ren
rece
ivin
g se
rvic
es th
roug
h W
IC w
as h
ighe
r
than
the
perc
enta
ge in
crea
se in
WIC
sta
tew
ide.
With
the
high
est p
ropo
rtio
n, a
mon
g la
rge
coun
ties,
of
child
ren
rece
ivin
g W
IC in
bot
h
1996
(47
.9%
) an
d 20
01 (
60.5
%),
El P
aso
Cou
nty
also
exp
erie
nced
the
larg
est p
erce
ntag
e
incr
ease
in c
lient
gro
wth
mor
e th
an d
oubl
eW
IC g
row
th f
or T
exas
as
a w
hole
betw
een
thos
e ye
ars.
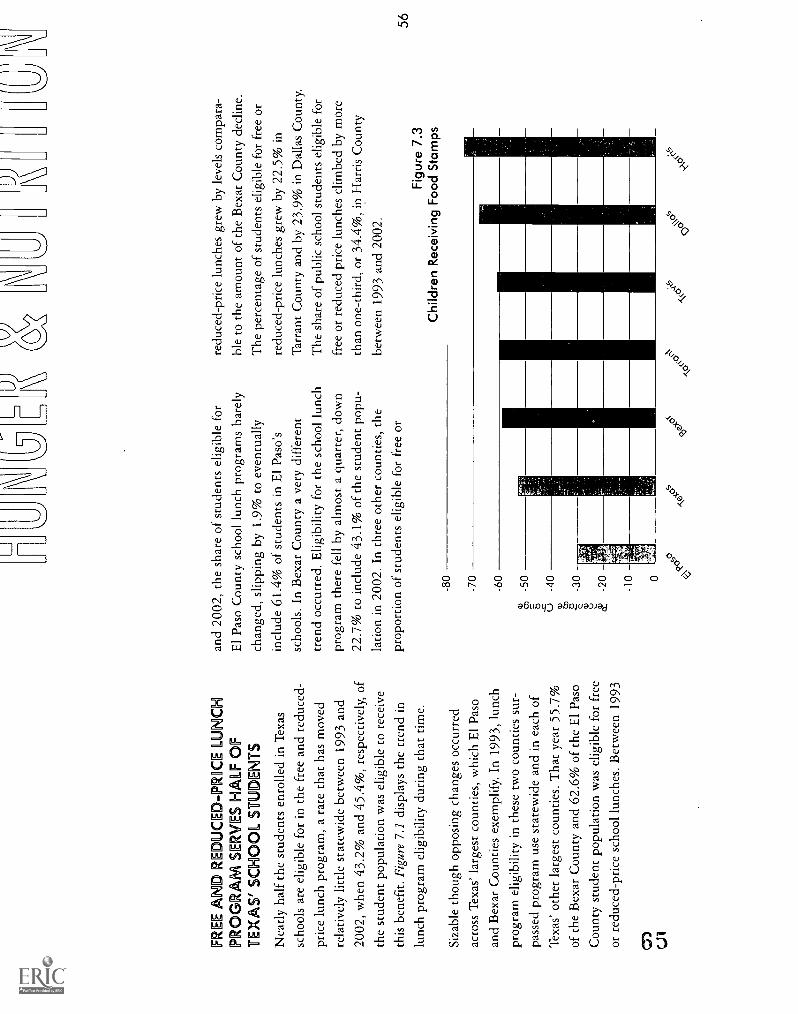
FRE
E A
ND
RE
DU
CE
D-P
RIC
E L
UN
CH
PRO
GR
AM
SE
RV
ES
HA
LF
OF
TE
XA
S' S
CH
OO
L S
TU
DE
NT
S
Nea
rly
half
the
stud
ents
enr
olle
d in
Tex
as
scho
ols
are
elig
ible
for
in th
e fr
ee a
nd r
educ
ed-
pric
e lu
nch
prog
ram
, a r
ate
that
has
mov
edre
lativ
ely
little
sta
tew
ide
betw
een
1993
and
2002
, whe
n 43
.2%
and
45.
4%, r
espe
ctiv
ely,
of
the
stud
ent p
opul
atio
n w
as e
ligib
le to
rec
eive
this
ben
efit.
Fig
ure
7.1
disp
lays
the
tren
d in
lunc
h pr
ogra
m e
ligib
ility
dur
ing
that
tim
e.
Siza
ble
thou
gh o
ppos
ing
chan
ges
occu
rred
acro
ss T
exas
' lar
gest
cou
ntie
s, w
hich
El P
aso
and
Bex
ar C
ount
ies
exem
plif
y. I
n 19
93, l
unch
prog
ram
elig
ibili
ty in
thes
e tw
o co
untie
s su
r-
pass
ed p
rogr
am u
se s
tate
wid
e an
d in
eac
h of
Tex
as' o
ther
larg
est c
ount
ies.
Tha
t yea
r 55
.7%
of th
e B
exar
Cou
nty
and
62.6
% o
f th
e E
l Pas
o
Cou
nty
stud
ent p
opul
atio
n w
as e
ligib
le f
or f
ree
or r
educ
ed-p
rice
sch
ool l
unch
es. B
etw
een
1993
and
2002
, the
sha
re o
f st
uden
ts e
ligib
le f
orE
l Pas
o C
ount
y sc
hool
lunc
h pr
ogra
ms
bare
ly
chan
ged,
slip
ping
by
1.9%
to e
vent
ually
incl
ude
61.4
% o
f st
uden
ts in
El P
aso'
ssc
hool
s. I
n B
exar
Cou
nty
a ve
ry d
iffe
rent
tren
d oc
curr
ed. E
ligib
ility
for
the
scho
ol lu
nch
prog
ram
ther
e fe
ll by
alm
ost a
qua
rter
, dow
n22
.7%
to in
clud
e 43
.1%
of
the
stud
ent p
opu-
latio
n in
200
2. I
n th
ree
othe
r co
untie
s, th
e
prop
ortio
n of
stu
dent
s el
igib
le f
or f
ree
or
-80
-70
-60
-50
-40
-30
-20
-10
redu
ced-
pric
e lu
nche
s gr
ew b
y le
vels
com
para
-bl
e to
the
amou
nt o
f th
e B
exar
Cou
nty
decl
ine.
The
per
cent
age
of s
tude
nts
elig
ible
for
fre
e or
redu
ced-
pric
e lu
nche
s gr
ew b
y 22
.5%
inT
arra
nt C
ount
y an
d by
23.
9% in
Dal
las
Cou
nty.
The
sha
re o
f pu
blic
sch
ool s
tude
nts
elig
ible
for
free
or
redu
ced
pric
e lu
nche
s cl
imbe
d by
mor
e
than
one
-thi
rd, o
r 34
.4%
, in
Har
ris
Cou
nty
betw
een
1993
and
200
2.
Fig
ure
7.3
Chi
ldre
n R
ecei
ving
Foo
d S
tam
ps
0
O

"
Sec
tion
8:Sa
fety
& P
erso
nal]
Sec
uHty
Soc
iety
has
no
grea
ter
oblig
atio
n th
an th
e pr
otec
tion
of it
s m
ost v
ulne
rabl
e m
embe
rs. W
ithou
t the
pow
er o
r
reso
urce
s to
pro
tect
them
selv
es, a
buse
d an
d ne
glec
ted
child
ren
in T
exas
rel
y on
the
vigi
lanc
e of
adu
lts to
resc
ue th
em fr
om p
hysi
cal
inju
ry, s
ever
e ne
glec
t,
sexu
alas
saul
t,an
d em
otio
nal
crue
lty.
Par
ents
,
care
give
rs, s
choo
l per
sonn
el a
nd o
ther
adu
lts a
lso
mus
t int
erve
ne to
pre
vent
chi
ld a
nd te
en in
jurie
s an
d
deat
hs d
ue to
uni
nten
tiona
l cau
ses.

CH
ILD
AB
US
E A
ND
NE
GLE
CT
In 1
961,
the
med
ical
pro
fess
ion
form
ally
rec
og-
nize
d ch
ild a
buse
as
"bat
tere
d ch
ild s
yndr
ome.
"
Sinc
e th
at ti
me,
our
und
erst
andi
ng o
f th
e m
ul-
tiple
dim
ensi
ons
of c
hild
abu
se a
nd n
egle
ct
have
bec
ome
mor
e nu
ance
d an
d co
mpl
ex. T
he
Chi
ld W
elfa
re,L
eagu
e of
Am
eric
a' p
ublis
hes
Stan
dard
s fo
r Se
rvic
es f
or A
buse
d or
Neg
lect
ed
Chi
ldre
n an
d T
heir
Fam
ilies
, whi
ch d
efin
es f
our
prim
ary
form
s of
chi
ld a
buse
and
neg
lect
.
Phys
ical
abu
se in
volv
es a
ctio
ns b
y pa
rent
s or
othe
r ad
ults
that
cau
se p
hysi
cal i
njur
y to
a
child
. Neg
lect
the
mos
t com
mon
for
m o
fch
ild m
altr
eatm
ento
ccur
s th
roug
h th
e fa
il-ur
e of
par
ents
or
othe
r ca
regi
vers
to p
rovi
de a
child
with
nee
ded
and
age-
appr
opri
ate
food
,
clot
hing
, hyg
iene
, med
ical
car
e, e
duca
tion,
prot
ectio
n fr
om h
arm
, and
sup
ervi
sion
. Sex
ual
abus
e re
fers
to s
exua
l act
ivity
with
a c
hild
by
a
pare
nt o
r ot
her
adul
t, in
clud
ing
any
kind
of
coer
ced
sexu
al c
onta
ct o
r an
y ki
nd o
f se
xual
expl
oita
tion
of th
e ch
ild. I
n ca
ses
of e
mot
iona
l
mal
trea
tmen
t, th
e pa
rent
or
othe
r ad
ult
reje
cts,
ber
ates
, ign
ores
, or
isol
ates
a c
hild
, in
way
s th
at a
re li
kely
to c
ause
ser
ious
men
tal,
emot
iona
l, or
soc
ial i
mpa
irm
ent.
In th
e la
test
yea
r (2
001)
for
whi
ch a
vaila
ble
natio
nal d
ata
exis
t, C
hild
Pro
tect
ive
Serv
ices
(CPS
) ag
enci
es in
the
Uni
ted
Stat
es to
ok a
n
aver
age
of 5
0,00
0 ca
lls c
once
rnin
g ch
ild m
al-
trea
tmen
t eac
h w
eek.
Tra
nsla
ted,
this
num
ber
repr
esen
ted
mor
e th
an 7
,100
cal
ls e
very
sin
gle
day.
' CPS
wor
kers
who
scr
eene
d th
ese
calls
clas
sifi
ed a
bout
two-
thir
ds o
f th
em a
s ap
prop
riat
e
for
inve
stig
atio
n, a
nd m
ore
than
one
-qua
rter
of
thos
e re
ferr
als
even
tual
ly e
nded
up
as s
ubst
anti-
ated
cas
es o
f ch
ild a
buse
or
negl
ect.
The
chi
ld
vict
ims
of th
ese
conf
irm
ed m
altr
eatm
ent c
ases
num
bere
d al
mos
t 2,5
00
per
day
and
tota
led
903,
000
per
year
. An
estim
ated
1,3
00 c
hil-
dren
betw
een
thre
e an
dfo
ur c
hild
ren
per
dayd
ied
of m
altr
eatm
ent i
n20
01, 4
0.9%
of
them
infa
nts
unde
r on
e ye
ar
old,
and
84.
5% o
f th
em u
nder
the
age
of s
ix.'
can
occu
r at
the
time
of th
e ab
use
or s
hort
ly
ther
eaft
er. P
oor
scho
ol p
erfo
rman
ce, a
s w
ell a
s
linge
ring
ant
isoc
ial,
aggr
essi
ve, a
nd s
elf-
dest
ruc-
tive
beha
vior
s, a
re d
ocum
ente
d en
duri
ng e
ffec
ts.
The
ser
vice
s of
fere
d by
chi
ld w
elfa
re a
genc
ies
may
impr
ove
the
heal
th, e
mot
iona
l, an
d
beha
vior
al s
tatu
s of
chi
ld a
buse
vic
tims,
and
som
e re
sear
cher
s ha
ve s
ugge
sted
that
mea
sure
s
of c
hild
wel
l-be
ing
shou
ld b
e in
corp
orat
ed in
to
the
ongo
ing
asse
ssm
ent o
f ch
ildre
n in
the
pro-
tect
ive
serv
ices
sys
tem
.'
Gre
ater
impr
ovem
ent f
or A
fric
an-A
mer
ican
chi
ldre
nan
d yo
uth
led
the
decl
ine
in b
oth
child
dea
ths
and
teen
viol
ent d
eath
s.
Abu
se a
nd n
egle
ct a
ffec
t chi
ldre
n im
med
iate
ly
and
in th
e lo
ng te
rm. A
dver
se h
ealth
con
se-
quen
ces
of m
altr
eatm
ent,
incl
udin
g br
ain
inju
ries
, neu
rom
otor
han
dica
ps, m
enta
l hea
lth
diso
rder
s, a
nd s
exua
lly tr
ansm
itted
dis
ease
s,
In 1
991,
the
7"d
Tex
as L
egis
latu
re r
eorg
aniz
ed
the
stat
e's
hum
an s
ervi
ce a
genc
ies
and
crea
ted
the
Dep
artm
ent o
f Pr
otec
tive
and
Reg
ulat
ory
Serv
ices
(D
PRS)
. In
stat
e fi
scal
yea
r 19
92,
whe
n D
PRS
bega
n op
erat
ion
as a
n in
depe
nden
t
entit
y, it
rep
orte
d 10
7,27
6 in
vest
igat
ions
of
child
abu
se. S
ix y
ears
late
r, T
ravi
s C
ount
y St
ate
Dis
tric
t Jud
ge F
. Sco
tt M
cCow
n, w
ho e
vent
ual-
ly h
eard
mor
e th
an 2
,000
chi
ld a
buse
cas
es
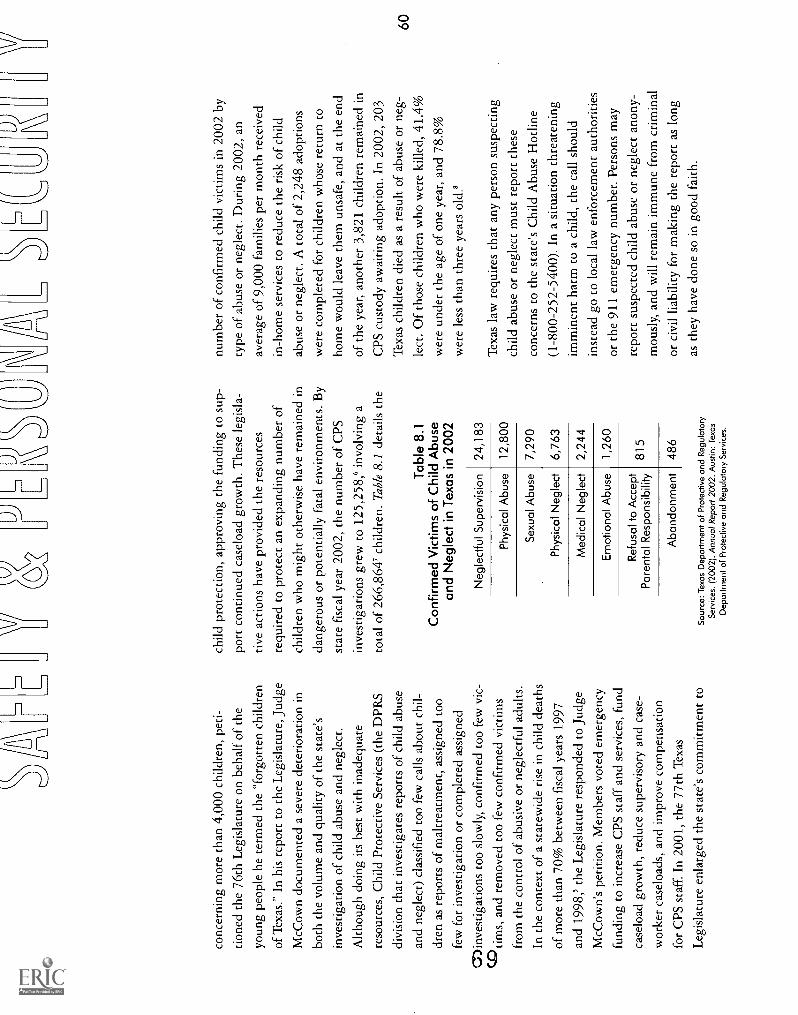
conc
erni
ng m
ore
than
4,0
00 c
hild
ren,
pet
i-
tione
d th
e 76
th L
egis
latu
re o
n be
half
of
the
youn
g pe
ople
he
term
ed th
e "f
orgo
tten
child
ren
of T
exas
." I
n hi
s re
port
to th
e L
egis
latu
re, J
udge
McC
own
docu
men
ted
a se
vere
det
erio
ratio
n in
both
the
volu
me
and
qual
ity o
f th
e st
ate'
s
inve
stig
atio
n of
chi
ld a
buse
and
neg
lect
.
Alth
ough
doi
ng it
s be
st w
ith in
adeq
uate
reso
urce
s, C
hild
Pro
tect
ive
Serv
ices
(th
e D
PRS
divi
sion
that
inve
stig
ates
rep
orts
of
child
abu
se
and
negl
ect)
cla
ssif
ied
too
few
cal
ls a
bout
chi
l-
dren
as
repo
rts
of m
altr
eatm
ent,
assi
gned
too
few
for
inve
stig
atio
n or
com
plet
ed a
ssig
ned
C)i
nves
tigat
ions
too
slow
ly, c
onfi
rmed
too
few
vic
-
tims,
and
rem
oved
too
few
con
firm
ed v
ictim
s
from
the
cont
rol o
f ab
usiv
e or
neg
lect
ful a
dults
.
In th
e co
ntex
t of
a st
atew
ide
rise
in c
hild
dea
ths
of m
ore
than
70%
bet
wee
n fi
scal
yea
rs 1
997
and
1998
,5 th
e L
egis
latu
re r
espo
nded
to J
udge
McC
own'
s pe
titio
n. M
embe
rs v
oted
em
erge
ncy
fund
ing
to in
crea
se C
PS s
taff
and
ser
vice
s, f
und
case
load
gro
wth
, red
uce
supe
rvis
ory
and
case
-
wor
ker
case
load
s, a
nd im
prov
e co
mpe
nsat
ion
for
CPS
sta
ff. I
n 20
01, t
he 7
7th
Tex
as
Leg
isla
ture
enl
arge
d th
e st
ate'
s co
mm
itmen
t to
\V/
[Ji
child
pro
tect
ion,
app
rovi
ng th
e fu
ndin
g to
sup
-
port
con
tinue
d ca
selo
ad g
row
th. T
hese
legi
sla-
tive
actio
ns h
ave
prov
ided
the
reso
urce
s
requ
ired
to p
rote
ct a
n ex
pand
ing
num
ber
of
child
ren
who
mig
ht o
ther
wis
e ha
ve r
emai
ned
in
dang
erou
s or
pot
entia
lly f
atal
env
iron
men
ts. B
y
stat
e fi
scal
yea
r 20
02, t
he n
umbe
r of
CPS
inve
stig
atio
ns g
rew
to 1
25,2
58,6
invo
lvin
g a
tota
l of
266,
864'
chi
ldre
n. T
able
8.1
det
ails
the
Tab
le 8
.1C
onfir
med
Vic
tims
of C
hild
Abu
sean
d N
egle
ct in
Tex
as in
200
2
Neg
lect
ful S
uper
visi
on24
,183
Phys
ical
Abu
se12
,800
Sexu
al A
buse
7,29
0
Phy
sica
l Neg
lect
6,76
3
Med
ical
Neg
lect
2,24
4
Em
otio
nal A
buse
1,26
0
Ref
usal
to A
ccep
tP
aren
tal R
espo
nsib
ility
815
Aba
ndon
men
t48
6
Sou
rce:
Tex
as D
epar
tmen
t of P
rote
ctiv
e an
d R
egul
ator
yS
ervi
ces.
(20
02).
Ann
ual R
epor
t 200
2. A
ustin
: Tex
asD
epar
tmen
t of P
rote
ctiv
e an
d R
egul
ator
y S
ervi
ces.
num
ber
of c
onfi
rmed
chi
ld v
ictim
s in
200
2 by
type
of
abus
e or
neg
lect
. Dur
ing
2002
, an
aver
age
of 9
,000
fam
ilies
per
mon
th r
ecei
ved
in-h
ome
serv
ices
to r
educ
e th
e ri
sk o
f ch
ild
abus
e or
neg
lect
. A to
tal o
f 2,
248
adop
tions
wer
e co
mpl
eted
for
chi
ldre
n w
hose
ret
urn
to
hom
e w
ould
leav
e th
em u
nsaf
e, a
nd a
t the
end
of th
e ye
ar, a
noth
er 3
,821
chi
ldre
n re
mai
ned
in
CPS
cus
tody
aw
aitin
g ad
optio
n. I
n 20
02, 2
03
Tex
as c
hild
ren
died
as
a re
sult
of a
buse
or
neg-
lect
. Of
thos
e ch
ildre
n w
ho w
ere
kille
d, 4
1.4%
wer
e un
der
the
age
of o
ne y
ear,
and
78.
8%
wer
e le
ss th
an th
ree
year
s ol
d.'
Tex
as la
w r
equi
res
that
any
per
son
susp
ectin
g
child
abu
se o
r ne
glec
t mus
t rep
ort t
hese
conc
erns
to th
e st
ate'
s C
hild
Abu
se H
otlin
e(1
-800
-252
-540
0). I
n a
situ
atio
n th
reat
enin
gim
min
ent h
arm
to a
chi
ld, t
he c
all s
houl
d
inst
ead
go to
loca
l law
enf
orce
men
t aut
hori
ties
or th
e 91
1 em
erge
ncy
num
ber.
Per
sons
may
repo
rt s
uspe
cted
chi
ld a
buse
or
negl
ect a
nony
-
mou
sly,
and
will
rem
ain
imm
une
from
cri
min
al
or c
ivil
liabi
lity
for
mak
ing
the
repo
rt a
s lo
ng
as th
ey h
ave
done
so
in g
ood
faith
.
\V/
UN
INT
EN
TIO
NA
L C
HIL
D A
ND
TE
EN
DE
AT
HS
Alth
ough
con
scio
usne
ss o
f ch
ild m
altr
eatm
ent
has
grow
n, th
e in
cide
nce
of u
nint
entio
nal
inju
ries
and
dea
ths
amon
g ch
ildre
n an
d yo
uth
rem
ains
a c
ompa
rativ
ely
unre
cogn
ized
yet
eno
r-
mou
s pu
blic
hea
lth p
robl
em. T
oget
her,
eve
nts
incl
udin
g m
otor
veh
icle
col
lisio
ns, d
row
ning
s,
fire
s, p
oiso
ning
s, a
nd g
un a
ccid
ents
rep
rese
nt
61th
e le
adin
g ca
use
of d
eath
for
Am
eric
ans
betw
een
one
and
19 y
ears
of
age.
9
OB
y 20
02, t
he r
ate
of c
onfir
med
child
abu
se in
Tex
as a
gain
incr
ease
d.
Muc
h of
the
dam
age
resu
lting
fro
m u
nint
entio
n-
al c
ause
s is
pre
vent
able
. Pub
lic h
ealth
cam
paig
ns
have
edu
cate
d pa
rent
s an
d ot
her
adul
ts a
bout
the
bene
fits
of
safe
ty s
trat
egie
s lik
e th
e us
e of
bicy
cle
helm
ets
and
smok
e de
tect
ors.
In
exam
-
ples
suc
h as
the
requ
ired
use
of
car
seat
s fo
r
smal
l chi
ldre
n, le
gisl
atio
n an
d re
gula
tion
have
been
use
d to
pro
tect
chi
ldre
n fr
om u
nint
ende
d
inju
ry o
r de
ath.
Alo
ngsi
de e
nvir
onm
enta
l and
prod
uct m
odif
icat
ions
, suc
h as
nei
ghbo
rhoo
d
traf
fic
calm
ing
and
the
man
ufac
ture
of
flam
e-
reta
rdan
t chi
ldre
n's
clot
hing
, the
se m
easu
res
have
hel
ped
to r
educ
e th
e ch
ild d
eath
rat
e by
mor
e th
an 4
0% b
etw
een
1980
and
200
1.10
1
Eac
h ye
ar f
irea
rm in
cide
nts
inju
re o
r ki
ll m
ore
than
20,
000
child
ren
and
yout
h in
the
Uni
ted
Stat
es.'2
Hom
icid
es a
ccou
nt f
or a
n es
timat
ed
58%
of
fire
arm
dea
ths
amon
g ch
ildre
n an
dyo
uth,
whi
le 3
3% o
f th
ese
deat
hs a
re d
ue to
suic
ide
and
anot
her
7% o
ccur
as
a re
sult
of
unin
tent
iona
l sho
otin
gs.'3
Acc
ordi
ng to
est
imat
es, f
our
fire
arm
-rel
ated
inju
ries
als
o ta
ke p
lace
for
eve
ry g
un d
eath
amon
g pe
ople
und
er 2
0 ye
ars
old.
" T
he n
um-
ber
of g
un d
eath
s am
ong
child
ren
and
yout
h
has
decl
ined
fro
m it
s pe
ak in
the
mid
-199
0s.
How
ever
, the
par
ticul
ar le
thal
ity o
f gu
ns,
alon
g w
ith w
ides
prea
d ac
cess
to th
em, h
as
crea
ted
grea
t con
cern
am
ong
pare
nts,
hea
lth
and
othe
r se
rvic
e pr
ovid
ers,
and
law
enf
orce
-
men
t per
sonn
el. S
trat
egie
s fo
r ad
dres
sing
the
risk
of
gun-
rela
ted
inju
ries
and
dea
ths
amon
gch
ildre
n in
clud
e cl
oser
mon
itori
ng o
f th
eir
acce
ss to
gun
s, im
prov
emen
t in
fire
arm
saf
ety
feat
ures
, and
str
icte
r co
ntro
l ove
r th
e ill
egal
flow
of
guns
to y
outh
."
WH
AT
TE
XA
S K
IDS
CO
IJN
'TSA
YS
AB
OU
T S
AFE
TY
?;
PER
SON
AL
SE
CU
RIT
Y
SA
FE
TY
& P
ER
SO
NA
L S
EC
UR
ITY
IND
ICA
TO
RS
Con
firm
ed V
ictim
s of
Chi
ld A
buse
1990
-200
2
Chi
ld D
eath
s19
90-2
001
Tee
n V
iole
nt D
eath
s
1990
-200
1
Chi
ldre
n in
Fam
ily V
iole
nce
She
lters
2000
-200
1
CH
ILD
AB
US
E D
EC
LIN
ES
,T
HE
N R
ISE
S A
GA
IN
Sinc
e 19
90, c
ases
of
conf
irm
ed c
hild
abu
se in
Tex
as h
ave
drop
ped
by 2
6.0%
. Con
firm
ed
inst
ance
s of
abu
se, i
llust
rate
d in
Fig
ure
8.1,
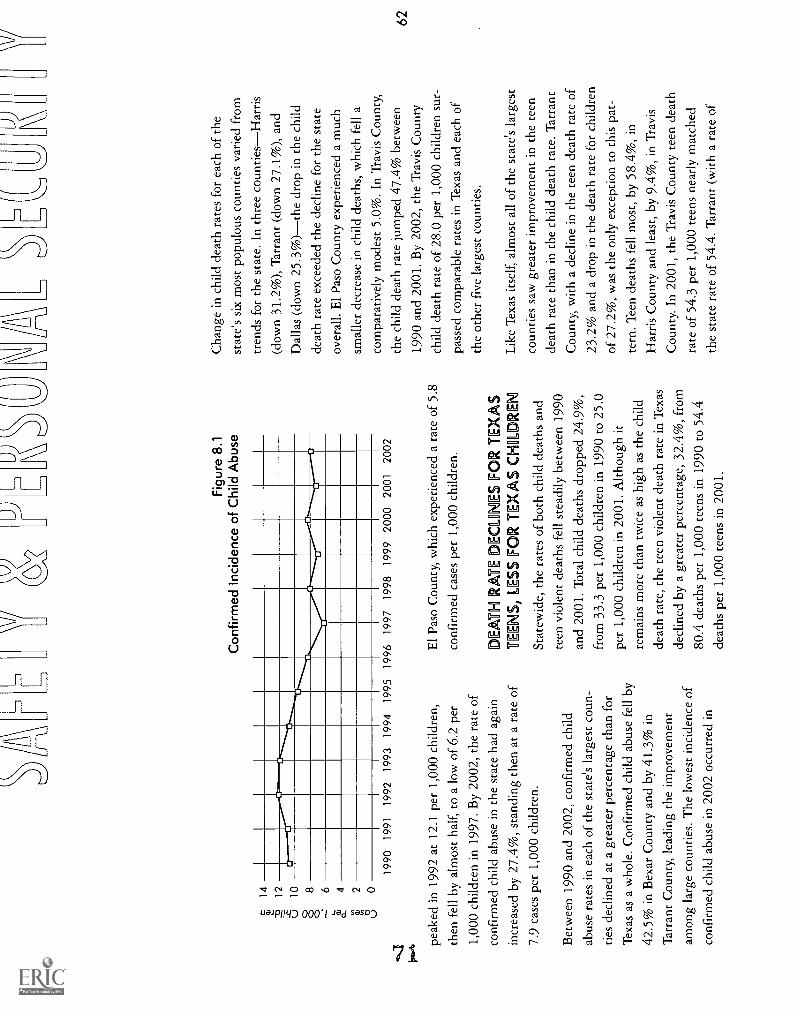
14 12 10 8 6 4 2 0
\V/
J
Fig
ure
8.1
Con
firm
ed In
cide
nce
of C
hild
Abu
se
1990
1991
1992
1993
199
419
95
peak
ed in
199
2 at
12.
1 pe
r 1,
000
child
ren,
then
fel
l by
alm
ost h
alf,
to a
low
of
6.2
per
1,00
0 ch
ildre
n in
199
7. B
y 20
02, t
he r
ate
ofco
nfir
med
chi
ld a
buse
in th
e st
ate
had
agai
n
incr
ease
d by
27.
4%, s
tand
ing
then
at a
rat
e of
7.9
case
s pe
r 1,
000
child
ren.
Bet
wee
n 19
90 a
nd 2
002,
con
firm
ed c
hild
abus
e ra
tes
in e
ach
of th
e st
ate'
s la
rges
t cou
n-
ties
decl
ined
at a
gre
ater
per
cent
age
than
for
Tex
as a
s a
who
le. C
onfi
rmed
chi
ld a
buse
fel
l by
42.5
% in
Bex
ar C
ount
y an
d by
41.
3% in
Tar
rant
Cou
nty,
lead
ing
the
impr
ovem
ent
amon
g la
rge
coun
ties.
The
low
est i
ncid
ence
of
conf
irm
ed c
hild
abu
se in
200
2 oc
curr
ed in
1996
1997
199
8 19
99 2
000
2001
2002
El P
aso
Cou
nty,
whi
ch e
xper
ienc
ed a
rat
e of
5.8
conf
irm
ed c
ases
per
1,0
00 c
hild
ren.
DE
AT
H R
AT
E D
EC
LA
NE
S FO
R T
EX
A S
TE
EN
S, L
ESS
FO
R T
EX
S C
HO
LD
RE
N
Stat
ewid
e, th
e ra
tes
of b
oth
child
dea
ths
and
teen
vio
lent
dea
ths
fell
stea
dily
bet
wee
n 19
90
and
2001
. Tot
al c
hild
dea
ths
drop
ped
24.9
%,
from
33.
3 pe
r 1,
000
child
ren
in 1
990
to 2
5.0
per
1,00
0 ch
ildre
n in
200
1. A
lthou
gh it
rem
ains
mor
e th
an tw
ice
as h
igh
as th
e ch
ild
deat
h ra
te, t
he te
en v
iole
nt d
eath
rat
e in
Tex
as
decl
ined
by
a gr
eate
r pe
rcen
tage
, 32.
4%, f
rom
80.4
dea
ths
per
1,00
0 te
ens
in 1
990
to 5
4.4
deat
hs p
er 1
,000
teen
s in
200
1.
Cha
nge
in c
hild
dea
th r
ates
for
eac
h of
the
stat
e's
six
mos
t pop
ulou
s co
untie
s va
ried
fro
m
tren
ds f
or th
e st
ate.
In
thre
e co
untie
sHar
ris
(dow
n 31
.2%
), T
arra
nt (
dow
n 27
.1%
), a
ndD
alla
s (d
own
25.3
%)t
he d
rop
in th
e ch
ildde
ath
rate
exc
eede
d th
e de
clin
e fo
r th
e st
ate
over
all.
El P
aso
Cou
nty
expe
rien
ced
a m
uch
smal
ler
decr
ease
in c
hild
dea
ths,
whi
ch f
ell a
com
para
tivel
y m
odes
t 5.0
%. I
n T
ravi
s C
ount
y,
the
child
dea
th r
ate
jum
ped
47.4
% b
etw
een
1990
and
200
1. B
y 20
02, t
he T
ravi
s C
ount
ych
ild d
eath
rat
e of
28.
0 pe
r 1,
000
child
ren
sur-
pass
ed c
ompa
rabl
e ra
tes
in T
exas
and
eac
h of
the
othe
r fi
ve la
rges
t cou
ntie
s.
Lik
e T
exas
itse
lf, a
lmos
t all
of th
e st
ate'
s la
rges
t
coun
ties
saw
gre
ater
impr
ovem
ent i
n th
e te
en
deat
h ra
te th
an in
the
child
dea
th r
ate.
Tar
rant
Cou
nty,
with
a d
eclin
e in
the
teen
dea
th r
ate
of
23.2
% a
nd a
dro
p in
the
deat
h ra
te f
or c
hild
ren
of 2
7.2%
, was
the
only
exc
eptio
n to
this
pat
-
tern
. Tee
n de
aths
fel
l mos
t, by
58.
4%, i
n
Har
ris
Cou
nty
and
leas
t, by
9.4
%, i
n T
ravi
s
Cou
nty.
In
2001
, the
Tra
vis
Cou
nty
teen
dea
th
rate
of
54.3
per
1,0
00 te
ens
near
ly m
atch
ed
the
stat
e ra
te o
f 54
.4. T
arra
nt (
with
a r
ate
of
\V/

DO
MM
OC
WO
OLE
NC
IEC
HO
LDR
IEM
Alth
ough
we
curr
ently
hav
e no
exa
ctes
timat
es, a
vaila
ble
data
tells
us
that
thou
sand
s of
chi
ldre
n an
nual
ly s
uffe
r th
ead
vers
e ef
fect
s of
exp
osur
e to
dom
estic
viol
ence
. In
hist
oric
al te
rms,
the
lega
l sys
-te
m h
as b
arel
y be
gun
to a
ddre
ss d
omes
ticvi
olen
ce a
s a
genu
ine
prob
lem
for
wom
en,
muc
h le
ss to
rec
ogni
ze it
s de
stru
ctiv
e co
n-
sequ
ence
s fo
r ch
ildre
n. Y
et th
e sa
fety
of
mot
hers
and
thei
r ch
ildre
n re
mai
n in
tegr
al-
ly li
nked
. Res
earc
hers
bel
ieve
that
as
man
yas
10
mill
ion
child
ren
com
e in
to c
onta
ct
with
dom
estic
vio
lenc
e ea
ch y
ear,
but
onl
ya
smal
l fra
ctio
n of
them
rec
eive
ser
vice
s
tailo
red
to th
eir
spec
ific
need
s. In
30%
to
60%
of f
amili
es e
xper
ienc
ing
eith
er c
hild
mal
trea
tmen
t or
dom
estic
vio
lenc
e, th
eot
her
form
of a
buse
als
o oc
curs
. Bet
ter
inte
grat
ion
of d
omes
tic v
iole
nce
and
child
prot
ectiv
e se
rvic
es p
rogr
ams
coul
d m
ore
adeq
uate
ly s
erve
bot
h m
othe
rs a
nd c
hild
ren
who
crit
ical
ly n
eed
this
sup
port
to o
verc
ome
the
deva
stat
ing
lega
cy o
f int
imat
e ab
use.
The
Fut
ure
of C
hild
ren:
Dom
estic
Vio
lenc
e an
d C
hild
ren
Dav
id a
nd L
ucill
e P
acka
rd F
ound
atio
nw
ww
.futu
reof
child
ren.
org
66.8
per
1,0
00)
and
Dal
las
(at 6
8.6
per
1,00
0)C
ount
ies
both
exc
eede
d th
e ra
te o
f te
en v
iole
nt
deat
h fo
r T
exas
ove
rall.
R C
IAL
DIS
PAR
ITY
IC
HIL
DD
EA
TH
S PE
RSI
STS,
BU
T I
MPR
OV
ES
FOR
TE
EN
VIO
LE
NT
DE
AT
HS
Com
para
tivel
y gr
eate
r im
prov
emen
t for
Afr
ican
-Am
eric
an c
hild
ren
and
yout
h ha
s le
d
the
decl
ine
in b
oth
child
dea
ths
and
teen
vio
-
lent
dea
ths
for
Tex
as a
s a
who
le, n
arro
win
g th
e
gap
betw
een
deat
h ra
tes
for
thes
e ch
ildre
n an
d
the
mem
bers
of
othe
r ra
ce a
nd e
thni
c gr
oups
thro
ugho
ut th
e st
ate.
Tre
nds
in c
hild
dea
th
60 50 40 30 20 10 _
0
rate
s fo
r di
ffer
ent r
ace
and
ethn
ic g
roup
s
appe
ar in
Fig
ure
8.2.
With
the
exce
ptio
n of
incr
ease
s in
199
4, 1
995,
and
199
8, th
e ra
te o
f
Afr
ican
-Am
eric
an c
hild
dea
ths
mov
ed s
tead
ily
dow
nwar
d be
twee
n 19
90 a
nd 2
001,
an
even
tu-
al p
erce
ntag
e de
clin
e of
34.
7%. I
n sp
ite o
f
grea
ter
perc
enta
ge im
prov
emen
t, A
fric
an-
Am
eric
an c
hild
ren
still
exp
erie
nce
a m
uch
high
er d
eath
rat
e th
an c
hild
ren
of o
ther
rac
ean
d et
hnic
gro
ups,
at 4
1.4%
hig
her
than
both
Whi
te a
nd H
ispa
nic
child
ren.
The
dea
th r
ate
for
His
pani
c an
d W
hite
chi
ldre
n al
so d
ropp
ed,
but b
y sm
alle
r pe
rcen
tage
s of
23.
6% a
nd
21.7
%, r
espe
ctiv
ely.
Fig
ure
8.2
Chi
ld D
eath
s B
y R
ace
and
Eth
nici
tyW
hite
6111
Afr
ican
-Am
eric
an
His
pani
c 0t
her
Rac
e 1-1

An
even
gre
ater
rel
ativ
e de
clin
e oc
curr
ed in
the
viol
ent d
eath
rat
e fo
r A
fric
an-A
mer
ican
teen
s. F
igur
e 8.
3 ch
arts
teen
vio
lent
dea
th r
ates
for
vari
ous
race
and
eth
nic
grou
ps b
etw
een
1990
and
200
1. A
dro
p of
57.
9% in
Afr
ican
-
Am
eric
an te
en v
iole
nt d
eath
s al
mos
t dou
bled
the
31.2
% d
eclin
e in
His
pani
c te
en v
iole
nt
deat
hs a
nd w
as n
earl
y th
ree
times
gre
ater
than
the
21.2
% d
ecre
ase
in W
hite
teen
vio
lent
deat
hs. I
n co
ntra
st to
chi
ld d
eath
sta
tistic
s,
data
on
teen
vio
lent
dea
ths
show
that
by
2000
and
2001
, Whi
te te
ensr
athe
r th
an A
fric
an-
Am
eric
an te
enss
urpa
ssed
dea
th r
ates
for
all
,oth
er r
ace
and
ethn
ic g
roup
s.
CO
OV
ER
LL
, MO
RE
CH
ILD
RE
N I
NIF
MO
LY
VIO
LE
NC
E S
HE
LT
ER
S
Mor
e T
exas
chi
ldre
n w
ere
livin
g in
fam
ily v
io-
lenc
e sh
elte
rs in
200
1 th
an in
200
0, b
ut th
is
rate
incr
ease
d by
onl
y 5.
3%, f
rom
2.7
to 2
.8
child
ren
per
1,00
0, b
etw
een
the
two
year
s.
Wid
er v
aria
tion
in th
is r
ate
occu
rred
am
ong
\V/
150
120 90 60 30 0
UA
\
Fig
ure
8.3
Tee
n V
iole
nt D
eath
s by
Rac
e an
d E
thni
city
0 W
hite
MI A
fric
an-A
mer
ican
His
pani
cO
ther
Rac
e
c0c1
Nct
rl"cc
)ct
ctqc
1N
N N
N
Tex
as' l
arge
st c
ount
ies.
In
Bex
ar C
ount
y, th
e
rate
of
child
ren
hous
ed in
fam
ily v
iole
nce
shel
-
ters
dro
pped
7.5
%, f
rom
2.0
to 1
.8 p
er 1
,000
child
ren.
Tw
o ot
her
coun
tiesT
arra
nt (
dow
n3.
3%)
and
Har
ris
(dow
n 2.
2%)a
lso
saw
ade
clin
e in
this
rat
e. D
alla
s C
ount
y ex
peri
ence
d
a m
uch
larg
er p
erce
ntag
e in
crea
se in
the
rate
of
child
ren
livin
g in
she
lters
. The
re, t
he r
ate
grew
21.4
%, f
rom
1.7
to 2
.0 c
hild
ren
per
1,00
0.
The
rat
e of
chi
ldre
n in
she
lters
als
o ro
se, b
y
lo'6
ct0
ciot
cict
c1et
c1t7
A00
18.0
% a
nd 1
9.3%
, res
pect
ivel
y, in
El P
aso
and
Tra
vis
Cou
ntie
s. F
or th
e st
ate
as a
who
le a
nd
in it
s la
rges
t cou
ntie
s, th
e nu
mbe
r of
chi
ldre
n
livin
g in
fam
ily v
iole
nce
shel
ters
rem
ains
ver
y
smal
l. Fo
r th
is r
easo
n, w
hat a
ppea
r as
larg
e
perc
enta
ge c
hang
es m
ay in
fac
t ref
lect
rel
ativ
e-
ly m
inor
abs
olut
e di
ffer
ence
s.
\V/

TA
DO
CU
ME
NT
AT
ION
//
/T
his
sect
ion/
prov
ides
gen
eral
info
rmat
ion
for
user
s of
Tex
aS K
IDS
CO
UN
T d
ata.
Mor
e
deta
iled
tech
nica
l doc
umen
tatio
n ap
pear
s on
the
Tex
as K
IDSCOUNT
web
site
,
litp:
//ww
sV.c
ppp.
org/
kids
coun
t/ind
ex.h
tml.
DA
TA
SE
LEC
TIO
NC
RIT
ER
IA65
Muc
h of
the
valu
e of
Tex
as K
IDSCOUNT
resi
des
in th
e qu
ality
of
the
data
we
asse
mbl
e
and
repo
rt. O
ur c
rite
ria
for
data
sel
ectio
n,
desc
ribe
d he
re, a
ssur
e ou
r us
ers
that
the
info
r-
mat
ion
they
obt
ain
from
Tex
as K
IDSCOUNT
will
con
sist
ently
rem
ain
the
mos
t rel
iabl
e,
obje
ctiv
e, a
nd ti
mel
y av
aila
ble.
Co.
Tex
as K
IDSCOUNT
obta
ins
data
onl
y fr
om
offi
cial
sou
rces
, at n
atio
nal,
stat
e, a
nd c
ount
y
leve
ls. T
o gi
ve u
s th
e gr
eate
st a
mou
nt o
f co
nfi-
data
, we
rely
on
data
fro
m n
on-c
omm
erci
al,
non-
prop
riet
ary
sour
ce a
genc
ies
that
em
ploy
it;tr
aine
d re
sear
cher
s an
d do
cum
ent t
heir
met
hodo
logy
. Off
icia
l dat
a al
so h
as th
e ad
van-
tage
of
publ
ic a
vaila
bilit
y, o
ften
for
no
char
ge.
denc
e in
the
qual
ity o
f T
exas
KID
SCOUNT
6 4i
ecau
se th
e ab
ility
to d
ocum
ent t
rend
s in
chi
ld
/ wel
l -be
ing
over
tim
e is
a c
ore
feat
ure
of T
exas
-KID
SCOUNT,
we
sele
ct b
oth
indi
cato
rs a
nd
data
sou
rces
that
are
upd
ated
reg
ular
ly a
nd
pred
icta
bly.
Ilse
rs o
f T
exas
KID
SCOUNT
tell
us th
at th
eir
-gre
ates
t nee
d fo
r in
form
atio
n in
volv
es lo
cal
:leve
l dat
a. F
or th
is r
easo
n, th
e co
re T
exas
KID
S
COUNT
data
base
con
tain
s on
ly in
dica
tors
avai
labl
e at
the
coun
ty le
vel,
mea
sure
d co
nsis
-
tent
ly f
or e
very
cou
nty
in th
e st
ate.
texa
s K
IDSCOUNT
inte
nds
to c
hara
cter
ize
/the
stat
us o
f ch
ildre
n an
d fa
mili
es in
the
stat
e
as c
ompr
ehen
sive
ly a
s po
ssib
le, s
o in
dica
tors
are
chos
en th
at r
epre
sent
the
mos
t im
port
ant
aspe
cts
of c
hild
and
fam
ily w
ell-
bein
g an
d gi
ve
us in
form
atio
n ab
out c
hild
ren
at e
ach
age.
The
se in
clud
e st
atis
tics
on c
hild
ren'
s fa
mily
and
com
mun
ity s
ettin
g, e
cono
mic
sec
urity
, edu
ca-
tion,
hea
lth, a
nd s
afet
y.
7/ F
inal
ly, i
ndic
ator
s se
lect
ed f
or th
e T
exas
KID
S
OUNT
data
base
mus
t tel
l us
som
ethi
ng s
ub-
--sa
ntia
l abo
ut th
e st
atus
of
our
child
ren.
A
num
ber
of in
dica
tors
do
this
by
desc
ribi
ng
actu
al o
utco
mes
, for
exa
mpl
e, th
e nu
mbe
r an
d
perc
enta
ge o
f T
exas
chi
ldre
n liv
ing
in p
over
ty,
the
infa
nt m
orta
lity
rate
, or
high
sch
ool
drop
out a
nd c
ompl
etio
n da
ta. O
ther
indi
cato
rs,
such
as
Med
icai
d an
d C
HIP
enr
ollm
ent,
or th
e
num
ber
of c
hild
ren
rece
ivin
g ch
ild c
are
assi
s-
tanc
e or
Foo
d St
amps
, pro
vide
pro
gram
mat
icda
ta th
at d
emon
stra
te h
ow T
exas
is a
ddre
ssin
g
the
situ
atio
n of
chi
ldre
n an
d fa
mili
es in
nee
d. A
thir
d ty
pe o
f in
dica
tor,
pri
mar
ily d
emog
raph
icin
form
atio
n su
ch a
s th
e ov
eral
l and
chi
ld p
opu-
latio
n an
d th
e nu
mbe
r an
d pe
rcen
tage
of
sing
le
pare
nt f
amili
es, g
ives
use
ful i
nfor
mat
ion
abou
t
the
soci
al a
nd e
cono
mic
con
text
whi
ch a
ffec
ts
the
pros
pect
s of
chi
ldre
n in
the
stat
e.
DA
TA
LIM
ITA
TIO
NS
Alth
ough
our
cri
teri
a fo
r th
e se
lect
ion
and
use
of T
exas
KID
SCOUNT
data
off
er th
e be
st
guar
ante
e of
its
qual
ity, u
sers
sho
uld
unde
rsta
nd
som
e of
the
chie
f lim
itatio
ns th
at w
e en
coun
ter
whe
n at
tem
ptin
g to
acc
urat
ely
port
ray
the
com
plex
situ
atio
n of
Tex
as c
hild
ren.
or a
larg
e nu
mbe
r of
impo
rtan
t iss
ues
rele
vant
to c
hild
wel
l-be
ing,
ver
y lit
tle s
olid
info
rmat
ion
exis
ts a
t the
cou
nty
leve
l, an
d in
man
y ca
ses,
even
at t
he s
tate
leve
lif s
uch
data
inde
edex
ists
at a
ll. T
he li
st o
f th
ese
topi
cs is
long
,
incl
udin
g, f
or e
xam
ple,
fra
gile
fam
ilies
, hom
e-
less
fam
ilies
, sch
ool s
afet
y, a
bort
ion
amon
g
teen
s, c
hild
hood
ast
hma
and
lead
poi
soni
ng,
child
hood
hun
ger,
and
the
effe
cts
on c
hild
ren
of
bein
g w
itnes
s to
inci
dent
s of
dom
estic
vio
lenc
e.
ere
exis
ts a
lmos
t no
data
bel
ow th
e co
unty
evel
that
cou
ld g
ive
us in
sigh
t int
o th
e co
ndi-
/1t17
n of
chi
ldre
n an
d fa
mili
es in
spe
cifi
c ci
ties,
tow
ns, a
nd e
ven
neig
hbor
hood
s. S
choo
l dis
-
tric
t dat
a re
pres
ents
the
prim
ary
exce
ptio
n to
this
situ
atio
n, b
ut th
e ve
ry la
rge
num
ber
ofV
choo
l dis
tric
ts in
Tex
as m
ake
it in
feas
ible
for
the
Tex
as K
IDS
CO
UN
T p
roje
ct to
pro
duce
asi
ngle
rep
ort t
hat w
ould
incl
ude
data
fro
mev
ery
dist
rict
in th
e st
ate.
ata
for
seve
ral i
mpo
rtan
t ind
icat
ors,
incl
udin
g
ildre
n in
sin
gle
pare
nt f
amili
es, c
omes
fro
m
e de
cenn
ial U
.S. C
ensu
s, a
nd s
o ar
e up
date
d
only
eve
ry te
n ye
ars.
Due
to le
ngth
y pr
oces
sing
time
for
mor
e de
taile
d so
cial
and
eco
nom
ic
indi
cato
rs, t
he C
ensu
s B
urea
u ta
kes
appr
oxi-
mat
ely
two
year
s, p
ost-
colle
ctio
n, to
act
ually
mak
e th
is in
form
atio
n av
aila
ble
to th
e pu
blic
.
\\ JJ
etai
led
race
and
eth
nic
brea
kdow
ns o
f m
any
as K
IDS
CO
UN
T in
dica
tors
cou
ld p
rovi
de
tpo
rtan
t and
use
ful i
nsig
ht in
to d
ispa
ritie
s in
child
wel
l-be
ing
in th
e st
ate.
Unf
ortu
nate
ly,
only
a v
ery
smal
l num
ber
of s
ourc
e ag
enci
es
can
prov
ide
this
info
rmat
ion.
RE
SPO
NSI
BL
E D
AT
A U
SEIn
any
soc
ial s
cien
ce, e
ven
user
s w
ithou
t a
tech
nica
l bac
kgro
und
shou
ld u
nder
stan
dso
met
hing
abo
ut th
e ba
sic
assu
mpt
ions
that
unde
rlie
rep
orte
d da
ta, a
nd w
hich
can
sub
-st
antia
lly in
flue
nce
any
inte
rpre
tatio
ns a
bout
the
mea
ning
of
that
dat
a. F
or th
is r
easo
n,T
exas
KID
S C
OU
NT
pro
vide
s pr
ecis
e, y
et
com
preh
ensi
ble,
doc
umen
tatio
n of
dat
a
sour
ces,
def
initi
ons,
and
oth
er te
chni
cal n
otes
that
we
urge
our
use
rs to
con
sult.
The
Fac
t Boo
k pr
ovid
es b
asic
info
rmat
ion
on
indi
cato
r de
fini
tions
and
dat
a so
urce
s. F
urth
er
docu
men
tatio
n on
the
Tex
as K
IDS
CO
UN
T
web
site
giv
es im
port
ant b
asic
info
rmat
ion
abou
t
each
indi
cato
r in
the
Tex
as K
IDS
CO
UN
T
data
base
. Fir
st, o
ur d
ata
note
s de
scri
be h
ow
sour
ce a
genc
ies
mea
sure
spe
cifi
c in
dica
tors
so
user
s ca
n co
nfid
ently
tell
wha
t the
se in
dica
tors
actu
ally
mea
n. F
or e
xam
ple,
use
rs s
houl
d kn
ow
whe
ther
an
indi
cato
r re
pres
entin
g pr
ogra
m
enro
llmen
t is
base
d on
an
annu
al a
vera
ge o
f
mon
thly
enr
ollm
ent t
otal
s or
on
a po
int-
in-t
ime
mea
sure
whe
re a
giv
en m
onth
ly f
igur
e is
use
d
to d
esig
nate
ann
ual e
nrol
lmen
t. It
is a
lso
impo
r-
tant
to d
istin
guis
h w
heth
er e
nrol
lmen
t fig
ures
are
undu
plic
ated
, mea
ning
that
indi
vidu
als
are
coun
ted
only
onc
e, n
o m
atte
r w
heth
er th
ey
leav
e an
d th
en r
etur
n in
to a
pro
gram
suc
h as
Med
icai
d, o
r w
heth
er th
e in
dica
tor
coun
ts e
ach
enro
llmen
t eve
nt s
o th
at a
giv
en p
erso
n is
coun
ted
each
tim
e he
or
she
join
s th
e pr
ogra
m,
even
if it
hap
pens
mor
e th
an o
nce
with
in a
sin
-
gle
year
. Use
rs s
houl
d be
aw
are
of d
iffe
rent
time
inte
rval
schi
efly
cal
enda
r ye
ars,
sch
ool
year
s, a
nd s
tate
fis
cal y
ears
repr
esen
ted
with
inva
riou
s in
dica
tors
. It i
s al
so im
port
ant t
o m
ake
note
of
the
popu
latio
n ba
se f
or r
epor
ted
rate
s,
gene
rally
giv
en in
term
s of
a p
erce
ntag
ere
flec
ting
a ba
se p
opul
atio
n of
100
or in
term
s of
the
inci
denc
e of
an
even
t per
1,0
00 o
r
100,
000
popu
latio
n. O
ver
time,
the
met
hodo
l-og
y fo
r m
easu
ring
indi
cato
rs c
an c
hang
e. F
or
exam
ple,
the
Cen
sus
Bur
eau
recl
assi
fied
and
expa
nded
its
set o
f ra
ce c
ateg
orie
s be
twee
n
1900
and
200
0. S
imila
rly,
the
Tex
as E
duca
tion
Age
ncy
has
subs
tant
ially
rev
ised
its
met
hodo
lo-
gy, s
ince
the
earl
y 19
90s,
for
est
imat
ing
high
scho
ol d
ropo
ut a
nd c
ompl
etio
n ra
tes.
Use
rs
mus
t con
side
r an
y ch
ange
s in
the
mea
sure
men
t
of K
IDSCOUNT
indi
cato
rs w
hen
atte
mpt
ing
to m
ake
com
pari
sons
bet
wee
n ye
ars
cont
aine
d in
the
data
base
. Fin
ally
, our
dat
a do
cum
enta
tion
67ex
plai
ns a
ny p
artic
ular
bac
kgro
und
info
rmat
ion,
incl
udin
g an
y ca
veat
s to
con
side
r, w
hen
inte
r-
pret
ing
KID
SCOUNT
data
.
1_
Aw
aren
ess
of s
ever
al a
dditi
onal
poi
nts
can
help
our
user
s ta
ke a
dvan
tage
of
KID
SCOUNT
data
res
pons
ibly
.
Whe
n co
unty
pop
ulat
ions
are
ver
y sm
all o
r
even
ts o
ccur
ver
y in
freq
uent
ly, c
alcu
latio
ns o
f
rate
s an
d pe
rcen
tage
s ca
n be
sub
ject
to r
ando
mer
ror
whi
ch c
an m
ake
thes
e da
ta u
nsta
ble
and
perh
aps
even
mis
lead
ing.
Our
pre
sent
atio
n of
coun
ty le
vel d
ata
aler
ts u
sers
to in
stan
ces
whe
n
the
freq
uenc
y of
a r
epor
ted
data
poi
nt f
alls
belo
w 2
0 an
d its
inte
rpre
tatio
n re
quir
es c
autio
n
base
d on
this
sm
all a
mou
nt.
effo
rt`d
ata
Tex
as K
IDSCOUNT
mak
es th
e
to lo
cate
and
pro
vide
the
mos
t rig
orou
sav
aila
ble,
it is
impo
rtan
t to
rem
embe
rth
at d
ata
from
our
sou
rce
agen
cies
oft
en h
as
been
gat
here
d an
d pr
oces
sed
by in
divi
dual
coun
ties
thro
ugho
ut th
e st
ate.
If
thes
e co
untie
s
vary
in th
eir
capa
city
for
acc
urat
e re
port
ing,
it
may
intr
oduc
e po
tent
ial e
rror
into
fin
alre
port
ed f
igur
es.
)he
Tex
as K
IDSCOUNT
data
base
off
ers
port
ant i
nfor
mat
ion
abou
t the
sta
tus
of
Tex
as c
hild
ren
acro
ss a
num
ber
of k
ey is
sue
area
s, a
nd a
s on
e of
its
cent
ral f
eatu
res,
per
mits
us to
obs
erve
tren
ds o
n th
ese
topi
cs o
ver
time.
For
met
hodo
logi
cal r
easo
ns, h
owev
er, t
he d
ata
alon
e do
not
allo
w u
s to
dra
w a
ny c
oncl
usio
ns
abou
t rel
atio
nshi
ps a
mon
g in
dica
tors
or
to
dete
rmin
e w
hat o
utsi
de f
acto
rs m
ay h
ave
caus
ed o
r m
ight
res
ult f
rom
them
. It a
lway
s
will
rem
ain
help
ful f
or u
sers
of
Tex
as K
IDS
COUNT
to e
xam
ine
the
kind
s of
info
rmat
ion
from
add
ition
al s
ourc
es th
at c
an w
ork
alon
g-
side
KID
SCOUNT
data
. Con
side
ratio
n of
othe
r cr
edib
le in
form
atio
n, a
long
with
KID
S
CO
UN
T d
ata,
is li
kely
to p
rovi
de th
e m
ost
com
plet
e an
d be
st in
form
ed a
naly
sis
of c
hild
and
fam
ily c
ircu
mst
ance
s, h
ow th
ese
cam
e
abou
t, an
d w
hat t
hey
sugg
est f
or th
e fu
ture
.
DN
TE
RPR
ET
ON
GK
OD
S C
OU
NT
DA
TA
Tw
o pr
imar
y w
ays
of r
eadi
ng K
IDSCOUNT
data
invo
lve
look
ing
at tr
ends
and
exp
lori
ng
com
pari
sons
.
I*he
ther
for
bette
r or
wor
se, c
hang
e ac
ross
ndic
ator
s in
the
Tex
as K
IDS
CO
UN
T d
atab
ase
refl
ects
impr
ovem
ent o
r, a
ltern
ativ
ely,
det
erio
-
ratio
n in
the
cond
ition
s of
chi
ldre
n th
roug
hout
the
stat
e. W
hile
we
prov
ide
info
rmat
ion
abou
t
the
rate
of
chan
ge b
etw
een
base
and
cur
rent
year
s fo
r ea
ch in
dica
tor,
use
rs th
emse
lves
can
also
exa
min
e tr
ends
bet
wee
n tw
o si
ngle
yea
rs
in a
dat
a se
ries
or
trac
k an
nual
cha
nge
for
the
entir
e se
ries
. Use
rs s
houl
d co
nsid
er th
at a
n
abse
nce
of c
hang
e al
so m
ay s
igni
fy im
port
ant
info
rmat
ion
abou
t chi
ld w
ell-
bein
g.
vera
l typ
es o
f co
mpa
riso
ns c
an a
id in
und
er-
tand
ing
the
mea
ning
of
indi
cato
r da
ta f
or a
give
n co
unty
, ide
ntif
ying
rel
ativ
e ar
eas
of
stre
ngth
and
wea
knes
s fo
r a
coun
ty, a
s w
ell a
s
sim
ilar
and
diss
imila
r tr
ajec
tori
es o
f ch
ange
.
Cou
nty
data
com
pare
d to
sta
te d
ata
and
com
-
pari
sons
am
ong
indi
vidu
al c
ount
ies
are
basi
c
way
s of
iden
tifyi
ng m
eani
ngfu
l pat
tern
s in
the
KID
S C
OU
NT
dat
a. I
t als
o ca
n he
lp to
look
at
data
fro
m c
ount
ies
sim
ilar
on a
sal
ient
cha
rac-
teri
stic
. For
exa
mpl
e, u
rban
, sub
urba
n, a
nd
rura
l cou
ntie
s m
ay m
erit
com
pari
son
with
othe
r lik
e co
untie
s el
sew
here
in th
e st
ate.
Com
pari
son
with
cou
ntie
s in
oth
er r
egio
ns o
f
the
stat
e al
so c
an r
evea
l im
port
ant i
nfor
mat
ion.
liND
ER
STA
ND
fiN
GR
AT
fi0S
,PE
RC
EN
TA
GE
S,R
AT
ES,
AN
D R
AN
KS
CA
LC
UL
AT
ING
R T
IOS,
PER
CE
NT
AG
ES,
AN
D R
AT
ES
Com
putin
g a
ratio
mak
es it
pos
sibl
e to
com
-
pare
the
rela
tive
size
of
two
num
bers
.
Obt
aini
ng a
rat
io is
eas
ysim
ply
divi
de o
nenu
mbe
r by
the
othe
r. T
he r
esul
t will
rep
rese
nt
a ra
tio e
xpre
ssed
in d
ecim
al te
rms.
A r
epor
ter
wan
ts to
kno
w h
ow m
uch
Tex
as C
HIP
enro
llmen
t has
gro
wn
sinc
e th
e pr
ogra
m's
fir
st y
ear.
In 2
000,
the
firs
t yea
r of
CH
IP in
Tex
as, 5
9,92
6
child
ren
enro
lled.
In
2001
, the
last
ful
l yea
r fo
r
whi
ch d
ata
is a
vaila
ble,
the
prog
ram
enr
olle
d
400,
456
child
ren.
Div
idin
g th
e cu
rren
t yea
r en
roll-
men
t of
400,
456
by th
e fi
rst y
ear
enro
llmen
t of
59,9
26 p
rodu
ces
a re
sult
of 6
.68,
whi
ch m
eans
that
CH
IP p
rogr
am p
artic
ipat
ion
was
alm
ost s
even
tim
es
larg
er in
200
1 th
an it
was
in 2
000.
To
tran
slat
e a
ratio
into
a p
erce
ntag
e, m
ultip
ly it
by 1
00.
A g
rant
wri
ter
wan
ts to
kno
w th
e st
ate'
s pe
rcen
tage
of c
hild
ren
livin
g in
sin
gle
pare
nt f
amili
es. T
o an
swer
this
que
stio
n, f
irst
div
ide
the
num
ber
of c
hild
ren
liv-
ing
in f
amili
es h
eade
d by
a s
ingl
e m
othe
r or
fat
her-
1,22
7,19
2by
the
tota
l chi
ld p
opul
atio
n liv
ing
in
fam
ilies
-5,1
69,2
00 (
not i
dent
ical
to, a
nd s
ome-
wha
t sm
alle
r th
an, t
he to
tal c
hild
pop
ulat
ion)
. Thi
s
calc
ulat
ion
will
pro
duce
a r
atio
of
.237
. Mul
tiply
ing
the
ratio
by
100
will
pro
duce
a p
erce
ntag
e of
23.
7.
For
rela
tivel
y in
freq
uent
eve
nts,
the
num
ber
of
obse
rvat
ions
may
be
rela
tivel
y sm
all.
In th
ese
case
s, a
mul
tiplie
r of
1,0
00 o
r 10
0,00
0 re
sults
in a
rat
e th
at m
ay b
e ea
sier
to u
nder
stan
d th
an
the
sam
e ra
tio tr
ansf
orm
ed in
to a
per
cent
age.
CI
_J
A c
asew
orke
r ne
eds
to id
entif
y th
e in
fant
mor
talit
y
rate
for
Tex
as. T
o fi
nd th
is o
ut, b
egin
by
divi
ding
the
num
ber
of in
fant
dea
ths,
2,2
29, b
y th
e to
tal n
umbe
r
live
birt
hs, 3
66,0
33. T
he r
atio
of
infa
nt d
eath
s to
live
birt
hs is
.006
08, a
num
ber
diff
icul
t to
inte
rpre
t
eith
er a
lone
or
as a
per
cent
age.
But
mul
tiply
ing
the
ratio
by
1,00
0 pr
oduc
es a
mor
e ea
sily
und
erst
ood
rate
of
6.1
infa
nt d
eath
s pe
r 1,
000
live
birt
hs.
Tur
ning
raw
fre
quen
cy c
ount
s in
to th
e st
an-
dard
ized
for
m o
f pe
rcen
tage
s an
d ra
tes
faci
li-
tate
s co
mpa
riso
n am
ong
popu
latio
ns th
at m
ayva
ry b
y si
ze, b
y tim
e pe
riod
, and
by
loca
tion.
Com
pari
sons
of
this
type
are
esp
ecia
lly u
sefu
l
whe
n ex
amin
ing
diff
eren
ces
betw
een
diff
eren
t
grou
ps d
urin
g th
e sa
me
year
and
bet
wee
n di
f-
fere
nt y
ears
for
the
sam
e gr
oup.
CA
LC
UL
AT
ING
PER
CE
NT
AG
E C
H N
GE
To
disc
over
the
degr
ee o
f im
prov
emen
t or
decl
ine
in a
KID
S C
OU
NT
indi
cato
r ov
er
time,
cal
cula
te th
e pe
rcen
tage
cha
nge
betw
een
two
year
s th
at a
re b
eing
com
pare
d. T
o do
this
,
subt
ract
the
earl
ier
year
fig
ure
from
the
mor
e
rece
nt y
ear
figu
re (
both
of
whi
ch m
ay b
e
expr
esse
d as
an
actu
al v
alue
, a p
erce
ntag
e, o
r a
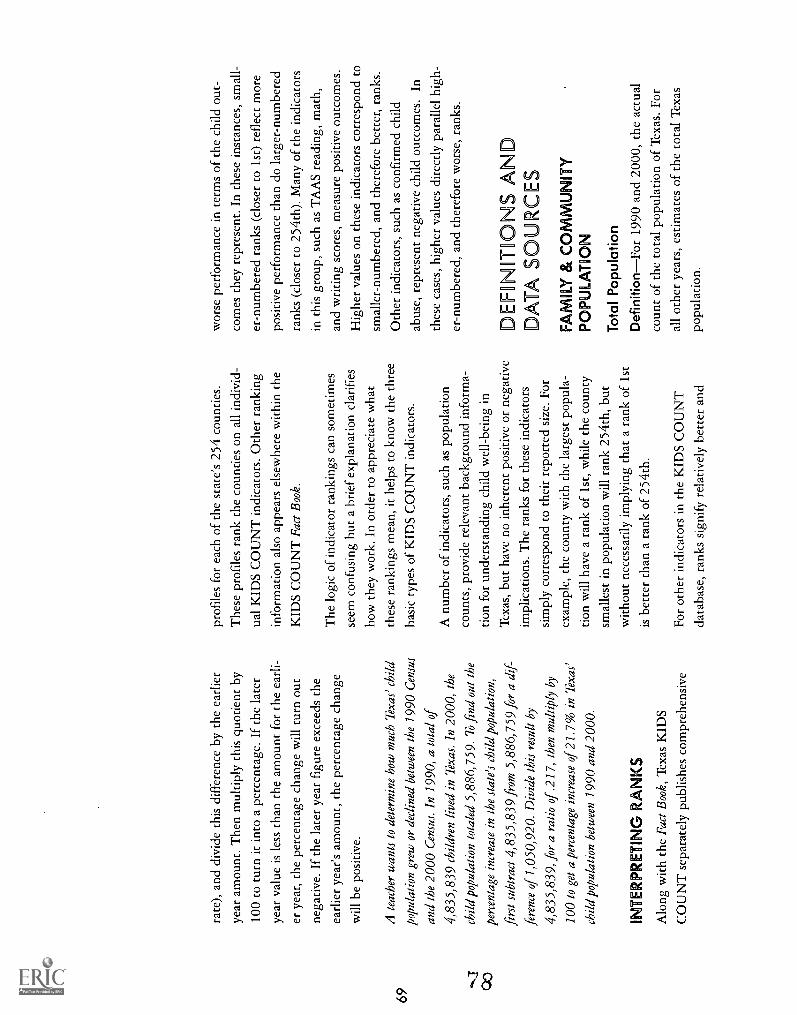
rate
), a
nd d
ivid
e th
is d
iffe
renc
e by
the
earl
ier
year
am
ount
. The
n m
ultip
ly th
is q
uotie
nt b
y
100
to tu
rn it
into
a p
erce
ntag
e. I
f th
e la
ter
year
val
ue is
less
than
the
amou
nt f
or th
e ea
rli-
er y
ear,
the
perc
enta
ge c
hang
e w
ill tu
rn o
ut
nega
tive.
If
the
late
r ye
ar f
igur
e ex
ceed
s th
e
earl
ier
year
's a
mou
nt, t
he p
erce
ntag
e ch
ange
will
be
posi
tive.
A te
ache
r w
ants
to d
eter
min
e ho
w m
uch
Tex
as' c
hild
popu
latio
n gr
ew o
r de
clin
ed b
etw
een
the
1990
Cen
sus
and
the
2000
Cen
sus.
In
1990
, a to
tal o
f
4,83
5,83
9 ch
ildre
n liv
ed in
Tex
as. I
n 20
00, t
he
child
pop
ulat
ion
tota
led
5,88
6,75
9. T
o fi
nd o
ut th
e
perc
enta
ge in
crea
se in
the
stat
e's
child
pop
ulat
ion,
firs
t sub
trac
t 4,8
35,8
39 f
rom
5,8
86,7
59 f
or a
dif
-
fere
nce
of 1
,050
,920
. Div
ide
this
res
ult b
y
4,83
5,83
9, f
or a
rat
io o
f .2
17, t
hen
mul
tiply
by
100
to g
et a
per
cent
age
incr
ease
of
21.7
% in
Tex
as'
child
pop
ulat
ion
betw
een
1990
and
200
0.
INT
ER
PRE
TIN
G R
AN
KS
Alo
ng w
ith th
e Fa
ct B
ook,
Tex
as K
IDS
CO
UN
T s
epar
atel
y pu
blis
hes
com
preh
ensi
ve
prof
iles
for
each
of
the
stat
e's
254
coun
ties.
The
se p
rofi
les
rank
the
coun
ties
on a
ll in
divi
d-
ual K
IDS
CO
UN
T in
dica
tors
. Oth
er r
anki
ng
info
rmat
ion
also
app
ears
els
ewhe
re w
ithin
the
KID
S C
OU
NT
Fac
t Boo
k.
The
logi
c of
indi
cato
r ra
nkin
gs c
an s
omet
imes
seem
con
fusi
ng b
ut a
bri
ef e
xpla
natio
n cl
arif
ies
how
they
wor
k. I
n or
der
to a
ppre
ciat
e w
hat
thes
e ra
nkin
gs m
ean,
it h
elps
to k
now
the
thre
e
basi
c ty
pes
of K
IDS
CO
UN
T in
dica
tors
.
A n
umbe
r of
indi
cato
rs, s
uch
as p
opul
atio
n
coun
ts, p
rovi
de r
elev
ant b
ackg
roun
d in
form
a-
tion
for
unde
rsta
ndin
g ch
ild w
ell-
bein
g in
Tex
as, b
ut h
ave
no in
here
nt p
ositi
ve o
r ne
gativ
e
impl
icat
ions
. The
ran
ks f
or th
ese
indi
cato
rs
sim
ply
corr
espo
nd to
thei
r re
port
ed s
ize.
For
exam
ple,
the
coun
ty w
ith th
e la
rges
t pop
ula-
tion
will
hav
e a
rank
of
1st,
whi
le th
e co
unty
smal
lest
in p
opul
atio
n w
ill r
ank
254t
h, b
ut
with
out n
eces
sari
ly im
plyi
ng th
at a
ran
k of
1st
is b
ette
r th
an a
ran
k of
254
th.
For
othe
r in
dica
tors
in th
e K
IDS
CO
UN
T
data
base
, ran
ks s
igni
fy r
elat
ivel
y be
tter
and
wor
se p
erfo
rman
ce in
term
s of
the
child
out
-
com
es th
ey r
epre
sent
. In
thes
e in
stan
ces,
sm
all-
er-n
umbe
red
rank
s (c
lose
r to
1st
) re
flec
t mor
e
posi
tive
perf
orm
ance
than
do
larg
er-n
umbe
red
rank
s (c
lose
r to
254
th).
Man
y of
the
indi
cato
rs
in th
is g
roup
, suc
h as
TA
AS
read
ing,
mat
h,
and
wri
ting
scor
es, m
easu
re p
ositi
ve o
utco
mes
.
Hig
her
valu
es o
n th
ese
indi
cato
rs c
orre
spon
d to
smal
ler-
num
bere
d, a
nd th
eref
ore
bette
r, r
anks
.
Oth
er in
dica
tors
, suc
h as
con
firm
ed c
hild
abus
e, r
epre
sent
neg
ativ
e ch
ild o
utco
mes
. In
thes
e ca
ses,
hig
her
valu
es d
irec
tly p
aral
lel h
igh-
er-n
umbe
red,
and
ther
efor
e w
orse
, ran
ks.
DE
FON
DT
DO
NS
AN
DD
AT
A S
OU
RC
ES
FAM
ILY
& C
OM
MU
NIT
YPO
PUL
AT
ION
Tot
al P
opul
atio
n
Def
initi
onF
or19
90 a
nd 2
000,
the
actu
alco
unt o
f th
e to
tal p
opul
atio
n of
Tex
as. F
or
all o
ther
yea
rs, e
stim
ates
of
the
tota
l Tex
as
popu
latio
n.

Dat
a So
urce
U.S
. Cen
sus
Bur
eau
(199
0,20
00).
Tex
as S
tate
Dat
a C
ente
r, S
tate
Popu
latio
n E
stim
ates
Pro
gram
, Tex
as A
&M
Uni
vers
ity (
inte
rcen
sal y
ears
).
Tot
al C
hild
Pop
ulat
ion
Def
initi
onF
or19
90 a
nd 2
000,
the
actu
alco
unt o
f th
e T
exas
pop
ulat
ion
unde
r 18
yea
rs o
f
age.
For
all
othe
r ye
ars,
est
imat
es o
f th
e st
ate
popu
latio
n un
der
18.
Dat
a So
urce
U.S
. Cen
sus
Bur
eau
(199
0,20
00).
Tex
as S
tate
Dat
a C
ente
r, S
tate
CO
Pop
ulat
ion
Est
imat
es P
rogr
am, T
exas
A &
M
Uni
vers
ity (
inte
rcen
sal y
ears
).
Chi
ld P
opul
atio
n B
y A
ge G
roup
Def
initi
onF
or19
90 a
nd 2
000,
act
ual c
ount
s
of th
e nu
mbe
r of
chi
ldre
n w
ithin
eac
h ag
e
grou
p. F
or a
ll ot
her
year
s, e
stim
ates
of
the
num
ber
of c
hild
ren
with
in e
ach
rang
e of
age
s.
Dat
a So
urce
U.S
. Cen
sus
Bur
eau
(199
0,20
00).
Tex
as S
tate
Dat
a C
ente
r, S
tate
Popu
latio
n E
stim
ates
Pro
gram
, Tex
as A
& M
Uni
vers
ity (
inte
rcen
sal y
ears
).
\ \ J.)
JJ
Fam
ilies
With
Chi
ldre
nD
efin
ition
Num
ber
and
perc
enta
ge o
f all
child
ren
livin
g in
fam
ilies
with
bot
h pa
rent
s
pres
ent i
n th
e ho
me,
and
num
ber
and
perc
ent-
age
of a
ll ch
ildre
n liv
ing
in f
amili
es h
eade
d by
a pa
rent
with
out a
spo
use
pres
ent i
n th
e ho
me.
Dat
a So
urce
U.S
. Cen
sus
Bur
eau.
Chi
ldre
n In
Fos
ter
Car
eD
efin
ition
Act
ual n
umbe
r, a
nd r
ate
per
1,00
0 ch
ildre
n, o
f ch
ildre
n in
fos
ter
care
.
Dat
a So
urce
Tex
as D
epar
tmen
t of
Prot
ectiv
ean
d R
egul
ator
y Se
rvic
es, a
nnua
l Leg
isla
tive
Dat
a B
ook.
EC
ON
OM
DC
RE
SO
UR
CE
S,
SF
CU
RO
TY
& O
PP
OR
TU
ND
IT
Pov
erty
For
Tot
al P
opul
atio
n
Def
initi
onFo
r 19
89 a
nd 1
999,
act
ual c
ount
and
perc
enta
ge o
f th
e to
tal T
exas
pop
ulat
ion
in h
ouse
hold
s w
ith in
com
es b
elow
the
offi
cial
fede
ral p
over
ty th
resh
old.
For
all
othe
r ye
ars,
estim
ates
of
the
num
ber
and
perc
enta
ge o
fth
e to
tal T
exas
pop
ulat
ion
livin
g in
hou
se-
hold
s w
ith in
com
es b
elow
the
offi
cial
fed
eral
pove
rty
'thre
shol
d.
Dat
a So
urce
U.S
. Cen
sus
Bur
eau
(198
9,19
99).
U.S
. Cen
sus
Bur
eau,
Sm
all A
rea
Inco
me
and
Pove
rty
Est
imat
es P
rogr
am (
all
othe
r ye
ars)
.
Chi
ld P
over
ty
Def
initi
onFo
r 19
89 a
nd 1
999,
act
ual c
ount
and
perc
enta
ge o
f re
late
d ch
ildre
n un
der
the
age
of 1
8 liv
ing
in f
amili
es w
ith in
com
es b
elow
the
offi
cial
fed
eral
pov
erty
thre
shol
d. F
or a
ll
othe
r ye
ars,
est
imat
es o
f th
e nu
mbe
r an
d pe
r-
cent
age
of c
hild
ren
livin
g in
fam
ilies
with
inco
mes
bel
ow th
e of
fici
al f
eder
al p
over
ty
thre
shol
d.
Dat
a So
urce
U.S
. Cen
sus
Bur
eau
(198
9,19
99).
U.S
. Cen
sus
Bur
eau,
Sm
all A
rea
Inco
me
and
Pove
rty
Est
imat
es P
rogr
am (
all o
ther
yea
rs).
Med
ian
Hou
seho
ld In
com
eD
efin
ition
The
poi
nt a
t whi
ch o
ne-h
alf
of a
llho
useh
olds
hav
e hi
gher
inco
mes
and
one
-hal
f of
all h
ouse
hold
s ha
ve lo
wer
inco
mes
.

Dat
a So
urce
U.S
. Cen
sus
Bur
eau
(198
9,19
99).
U.S
. Cen
sus
Bur
eau,
Sm
all A
rea
Inco
me
and
Pove
rty
Est
imat
es P
rogr
am (
all o
ther
yea
rs).
Une
mpl
oym
ent
Def
initi
onPe
rcen
tage
of
the
civi
lian
labo
rfo
rce
eith
er n
ot w
orki
ng, o
r lo
okin
g fo
r w
ork,
or a
vaila
ble
to a
ccep
t a jo
b.
Dat
a So
urce
Tex
as W
orkf
orce
Com
mis
sion
.
Chi
ldre
n R
ecei
ving
TA
NF
And
AFD
C
Def
initi
onN
umbe
r an
d pe
rcen
tage
of
child
ren
unde
r 18
yea
rs o
f ag
e re
ceiv
ing
cash
assi
stan
ce th
roug
h th
e T
empo
rary
Ass
ista
nce
to N
eedy
Fam
ilies
pro
gram
(19
97 a
nd a
fter
)
and
the
Aid
to F
amili
es w
ith D
epen
dent
Chi
ldre
n pr
ogra
m (
prio
r to
199
7).
Dat
a So
urce
Tex
as D
epar
tmen
t of
Hum
anSe
rvic
es.
EA
RLY
CA
RE
& E
DU
CA
TIO
N
Chi
ldre
n O
n S
tate
Sub
sidi
zed
Chi
ld C
are
Def
initi
onN
umbe
r of
chi
ldre
n re
ceiv
ing
child
car
e su
bsid
y as
a p
erce
ntag
e of
the
popu
latio
n of
chi
ldre
n un
der
14 y
ears
of
age.
Dat
a So
urce
Tex
as W
orkf
orce
Com
mis
sion
.
Chi
ldre
n In
Pub
lic P
re-K
inde
rgar
ten
Def
initi
onN
umbe
ran
d pe
rcen
tage
of
chil-
dren
age
s th
ree
and
four
enr
olle
d in
pub
lic
scho
ol p
re-k
inde
rgar
ten
prog
ram
s.
Dat
a So
urce
Tex
as E
duca
tion
Age
ncy.
Chi
ldre
n In
Hea
d S
tart
Pro
gram
Def
initi
onN
umbe
r an
d pe
rcen
tage
of
the
child
ren
ages
thre
e an
d fo
ur e
nrol
led
in th
e
Hea
d St
art p
rogr
am.
Dat
a So
urce
U.S
. Dep
artm
ent o
f H
ealth
and
Hum
an S
ervi
ces,
Adm
inis
trat
ion
for
Chi
ldre
n
and
Fam
ilies
.
SC
HO
OL
SU
CC
ES
S
Hig
h S
choo
l Dro
pout
& C
ompl
etio
nD
efin
ition
Gra
duat
ion
stat
us f
or e
ntir
e
coho
rt o
f ni
nth
grad
e st
uden
ts a
t the
tim
e th
ecl
ass
grad
uate
s.
Dat
a So
urce
Tex
as E
duca
tion
Age
ncy.
Stu
dent
s P
assi
ng T
AA
S R
eadi
ng
Def
initi
onN
umbe
r an
d pe
rcen
tage
of
four
than
d te
nth
grad
e st
uden
ts p
assi
ng th
e re
adin
g
com
pone
nt o
f th
e T
exas
Ass
essm
ent o
f
Aca
dem
ic S
kills
exa
min
atio
n.
Dat
a So
urce
Tex
as E
duca
tion
Age
ncy.
Stu
dent
s P
assi
ng T
AA
S M
ath
Def
initi
onN
umbe
r an
d pe
rcen
tage
of
four
than
d te
nth
grad
e st
uden
ts p
assi
ng th
e m
athe
-
mat
ics
com
pone
nt o
f th
e T
exas
Ass
essm
ent o
f
Aca
dem
ic S
kills
exa
min
atio
n.
Dat
a So
urce
Tex
as E
duca
tion
Age
ncy.
Stu
dent
s P
assi
ng T
AA
S W
ritin
g
Def
initi
onN
umbe
r an
d pe
rcen
tage
of
four
than
d te
nth
grad
e st
uden
ts p
assi
ng th
e w
ritin
g
com
pone
nt o
f th
e T
exas
Ass
essm
ent o
f
Aca
dem
ic S
kills
exa
min
atio
n.
Dat
a So
urce
Tex
as E
duca
tion
Age
ncy.
Spe
cial
Edu
catio
n S
tude
nts
Def
initi
onN
umbe
r an
d pe
rcen
tage
of
stu-
dent
s in
all
grad
es r
ecei
ving
spe
cial
edu
catio
n
serv
ices
.
Dat
a So
urce
Tex
as E
duca
tion
Age
ncy.

Stu
dent
s In
Bili
ngua
l/ES
L P
rogr
ams
Def
initi
onN
umbe
r an
d pe
rcen
tage
of
stu-
dent
s in
all
grad
es r
ecei
ving
bili
ngua
l or
Eng
lish
as S
econ
d L
angu
age
inst
ruct
ion.
Dat
a So
urce
Tex
as E
duca
tion
Age
ncy.
TE
EN
S A
T R
ISK
Juve
nile
Vio
lent
Crim
e A
rres
tsD
efin
ition
Num
ber
of a
rres
ts, a
nd r
ate
per
100,
000
child
ren
aged
10
to 1
7, f
or th
e of
fens
-
00es
of
mur
der,
man
slau
ghte
r, f
orci
ble
rape
, rob
-
l'r'4
31D
ery,
and
agg
rava
ted
assa
ult.
Dat
a So
urce
Tex
as D
epar
tmen
t of
Publ
ic S
afet
y.
Tee
n P
regn
ancy
Def
initi
onN
umbe
r of
bir
ths,
and
per
cent
age
of a
ll liv
e bi
rths
, to
fem
ales
age
d 13
thro
ugh
19, b
y ra
ce a
nd e
thni
c gr
oup,
reg
ardl
ess
ofm
arita
l sta
tus.
Dat
a So
urce
Tex
as D
epar
tmen
t of
Hea
lth,
Bur
eau
of V
ital S
tatis
tics.
Sin
gle
Tee
n P
regn
ancy
Def
initi
onN
umbe
r of
bir
ths,
and
perc
enta
geof
all
live
birt
hs, t
o un
mar
ried
fem
ales
age
d 13
thro
ugh
19, b
y ra
ce a
nd e
thni
c gr
oup.
Dat
a So
urce
Tex
as D
epar
tmen
t of
Hea
lth,
Bur
eau
of V
ital S
tatis
tics.
PHY
SIC
L, S
OC
I L
&E
MO
TIO
NA
L H
E L
TH
Infa
nt M
orta
lity
Def
initi
onN
umbe
r of
dea
ths,
and
rat
e pe
r1,
000
live
birt
hs, o
f ch
ildre
n un
der
one
year
of
age,
by
race
and
eth
nic
grou
p.
Dat
a So
urce
Tex
as D
epar
tmen
t of
Hea
lth,
Bur
eau
of V
ital S
tatis
tics.
Low
Birt
hwei
ght B
abie
s
Def
initi
onN
umbe
r an
d pe
rcen
tage
of
live
birt
hs o
f in
fant
s w
eigh
ing
unde
r 5.
5 po
unds
, or
2,50
0 gr
ams,
by
race
and
eth
nic
grou
p.
Dat
a So
urce
Tex
as D
epar
tmen
t of
Hea
lth,
Bur
eau
of V
ital S
tatis
tics.
I I
\
Mot
hers
Rec
eivi
ng L
ittle
Or
No
Pre
nata
l Car
e
Def
initi
onN
umbe
r an
d pe
rcen
tage
of
live
birt
h m
othe
rs w
ho b
egan
pre
nata
l car
e in
the
thir
d tr
imes
ter
of p
regn
ancy
or
rece
ived
no
pre-
nata
l car
e, b
y ra
ce a
nd e
thni
c gr
oup.
Dat
a So
urce
Tex
as D
epar
tmen
t of
Hea
lth,
Bur
eau
of V
ital S
tatis
tics.
Chi
ldre
n E
nrol
led
In M
edic
aid
Def
initi
onN
umbe
r an
d pe
rcen
tage
of
chil-
dren
thro
ugh
age
18 e
nrol
led
in th
e T
exas
Med
icai
d pr
ogra
m.
Dat
a So
urce
Tex
as H
ealth
and
Hum
anSe
rvic
es C
omm
issi
on.
CH
ILD
RE
N E
NR
OL
LE
D O
N C
HIP
Def
initi
onN
umbe
r an
d pe
rcen
tage
of
chil-
dren
thro
ugh
age
18 e
nrol
led
in th
e T
exas
Chi
ldre
n's
Hea
lth I
nsur
ance
Pro
gram
.
Dat
a So
urce
Tex
as H
ealth
and
Hum
anSe
rvic
es C
omm
issi
on.
))
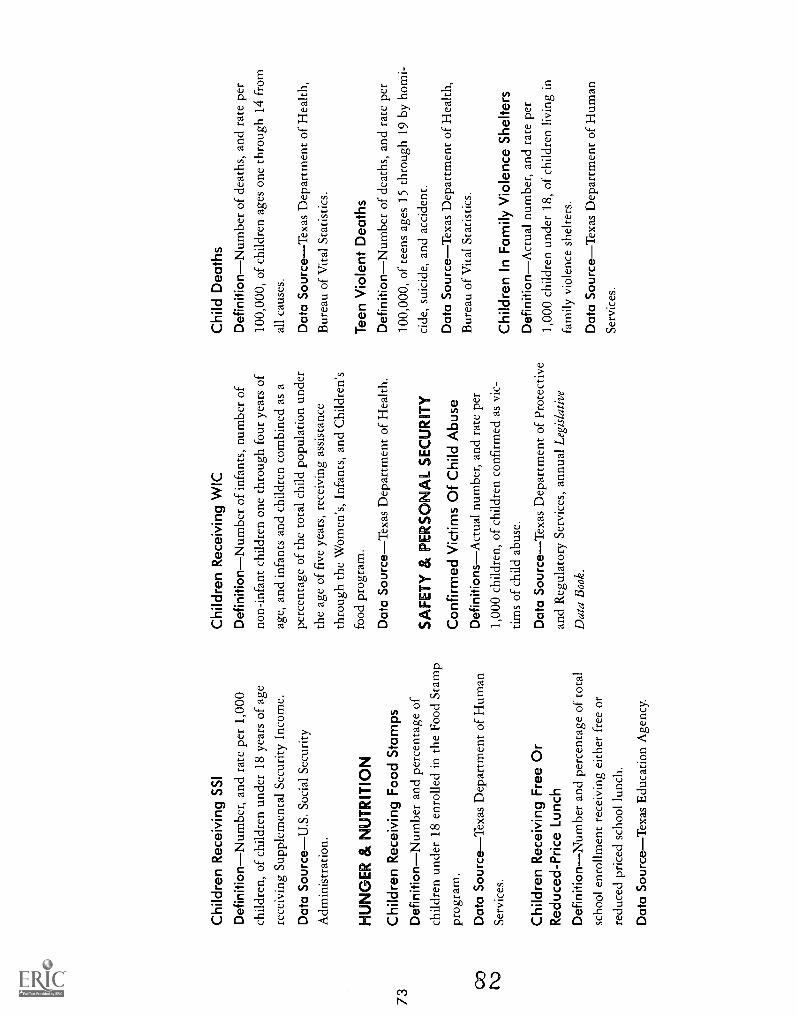
Chi
ldre
n R
ecei
ving
SS
I
Def
initi
onN
umbe
r,an
d ra
te p
er 1
,000
child
ren,
of
child
ren
unde
r 18
yea
rs o
f ag
e
rece
ivin
g Su
pple
men
tal S
ecur
ity I
ncom
e.
Dat
a So
urce
U.S
. Soc
ial S
ecur
ityA
dmin
istr
atio
n.
HU
NG
ER
& N
UT
RIT
ION
Chi
ldre
n R
ecei
ving
Foo
d S
tam
ps
Def
initi
onN
umbe
r an
d pe
rcen
tage
of
child
ren
unde
r 18
enr
olle
d in
the
Food
Sta
mp
prog
ram
.
Dat
a So
urce
Tex
as D
epar
tmen
t of
Hum
anSe
rvic
es.
Chi
ldre
n R
ecei
ving
Fre
e O
rR
educ
ed-P
rice
Lunc
h
Def
initi
onN
umbe
r an
d pe
rcen
tage
of
tota
lsc
hool
enr
ollm
ent r
ecei
ving
eith
er f
ree
or
redu
ced
pric
ed s
choo
l lun
ch.
Dat
a So
urce
Tex
as E
duca
tion
Age
ncy.
Chi
ldre
n R
ecei
ving
WIC
Def
initi
onN
umbe
rof
infa
nts,
num
ber
of
non-
infa
nt c
hild
ren
one
thro
ugh
four
yea
rs o
f
age,
and
infa
nts
and
child
ren
com
bine
d as
a
perc
enta
ge o
f th
e to
tal c
hild
pop
ulat
ion
unde
r
the
age
of f
ive
year
s, r
ecei
ving
ass
ista
nce
thro
ugh
the
Wom
en's
, Inf
ants
, and
Chi
ldre
n's
food
pro
gram
.
Dat
a So
urce
Tex
as D
epar
tmen
t of
Hea
lth.
SA
FE
TY
& P
ER
SO
NA
L S
EC
UR
ITY
Con
firm
ed V
ictim
s O
f Chi
ld A
buse
Def
initi
onsA
ctua
l num
ber,
and
rat
e pe
r1,
000
child
ren,
of
child
ren
conf
irm
ed a
s vi
c-
tims
of c
hild
abu
se.
Dat
a So
urce
Tex
as D
epar
tmen
t of
Prot
ectiv
ean
d R
egul
ator
y Se
rvic
es, a
nnua
l Leg
isla
tive
Dat
a B
ook.
Chi
ld D
eath
sD
efin
ition
Num
ber
of d
eath
s, a
nd r
ate
per
100,
000,
of
child
ren
ages
one
thro
ugh
14 f
rom
all c
ause
s.
Dat
a So
urce
Tex
as D
epar
tmen
t of
Hea
lth,
Bur
eau
of V
ital S
tatis
tics.
Tee
n V
iole
nt D
eath
s
Def
initi
onN
umbe
r of
dea
ths,
and
rat
e pe
r10
0,00
0, o
f te
ens
ages
15
thro
ugh
19 b
y ho
mi-
cide
, sui
cide
, and
acc
iden
t.
Dat
a So
urce
Tex
as D
epar
tmen
t of
Hea
lth,
Bur
eau
of V
ital S
tatis
tics.
Chi
ldre
n In
Fam
ily V
iole
nce
She
lters
Def
initi
onA
ctua
l num
ber,
and
rat
e pe
r1,
000
child
ren
unde
r 18
, of
child
ren
livin
g in
fam
ily v
iole
nce
shel
ters
.
Dat
a So
urce
Tex
as D
epar
tmen
t of
Hum
anSe
rvic
es.
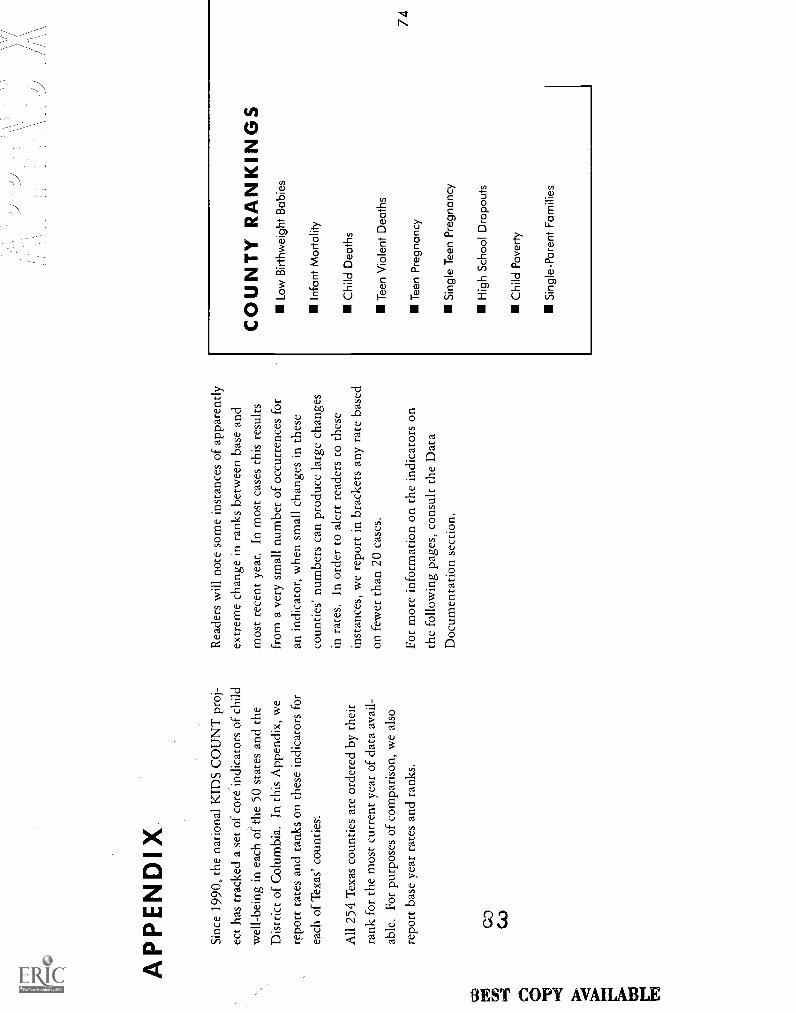
AP
PE
ND
IX
Sinc
e 19
90, t
he n
atio
nal K
IDS
CO
UN
T p
roj-
ect h
as tr
acke
d a
set o
f co
re in
dica
tors
of
child
wel
l-be
ing
in e
ach
of th
e 50
sta
tes
and
the
Dis
tric
t of
Col
umbi
a. I
n th
is A
ppen
dix,
we
repo
rt r
ates
and
ran
ks o
n th
ese
indi
cato
rs f
orea
ch o
f T
exas
' cou
ntie
s.
All
254
Tex
as c
ount
ies
are
orde
red
by th
eir
rank
for
the
mos
t cur
rent
yea
r of
dat
a av
ail-
able
. For
pur
pose
s of
com
pari
son,
we
also
repo
rt b
ase
year
rat
es a
nd r
anks
.
CO
CO
Rea
ders
will
not
e so
me
inst
ance
s of
app
aren
tly
extr
eme
chan
ge in
ran
ks b
etw
een
base
and
mos
t rec
ent y
ear.
In
mos
t cas
es th
is r
esul
ts
from
a v
ery
smal
l num
ber
of o
ccur
renc
es f
or
an in
dica
tor,
whe
n sm
all c
hang
es in
thes
e
coun
ties'
num
bers
can
pro
duce
larg
e ch
ange
sin
rat
es. I
n or
der
to a
lert
rea
ders
to th
ese
inst
ance
s, w
e re
port
in b
rack
ets
any
rate
bas
ed
on f
ewer
than
20
case
s.
For
mor
e in
form
atio
n on
the
indi
cato
rs o
n
the
follo
win
g pa
ges,
con
sult
the
Dat
aD
ocum
enta
tion
sect
ion.
CO
UN
TY
RA
NK
ING
SLo
w B
irthw
eigh
t Bab
ies
Infa
nt M
orta
lity
Chi
ld D
eath
s
Tee
n V
iole
nt D
eath
s
Tee
n P
regn
ancy
Sin
gle
Tee
n P
regn
ancy
Hig
h S
choo
l Dro
pout
s
Chi
ld P
over
ty
Sin
gle-
Par
ent F
amili
es

Low
Birt
hwei
ght B
abie
s20
0119
90R
ank
Rat
eC
ount
yR
ank
Rat
e1
0.0%
Cra
ne25
[3.8
%]
Low
Birt
hwei
ght B
abie
s20
0119
90R
ank
Rat
eC
ount
yR
ank
Rat
e50
5.6%
Ker
r10
66.
6%
Low
Birt
hwei
ght B
abie
s20
0119
90R
ank
Rat
eC
ount
yR
ank
Rat
e99
7.1%
Cal
dwel
l78
5.9%
10.
0%E
dwar
ds13
[2.9
%1
51[5
.6 %
]M
artin
148
[7.2
%)
100
7.1%
Dea
f Sm
ith13
87.
0%1
0.0%
Jeff
Dav
isK
ened
y24
91
[15.
8%1
0.0%
52[5
.7%
1B
lanc
o62
[5.5
%]
101
[7.1
%]
Foar
d24
8[1
5.0%
)1
0.0%
53[5
.7 %
]C
ochr
an24
6[1
3.7
%]
102
7.2%
How
ard
108
6.7%
10.
0%K
ent
241
[11.
1 %
]53
[5.7
%)
Ref
ugio
Col
orad
o11
160
[6.7
%)
[5.5
%]
103
7.2%
Wal
ler
207
8.6%
10.
0%K
ing_
244
112.
5 %
]55
[5.7
%)
104
[7.3
%]
Del
ta13
9[7
.0%
11
0.0%
Lov
ing
10.
0%56
5.8%
Star
r39
4.7%
104
7.3%
Pano
la46
[4.9
%)
10.
0%R
ober
ts1
0.0%
57[5
.9%
)L
imes
tone
196
8.1%
106
7.3%
Fort
Ben
d11
56.
8%1
0.0%
Ston
ewal
l18
8(8
.0%
)57
[5.9
%]
Old
ham
41[4
.8 %
]10
77.
3%C
ollin
675.
6%1
0.0%
Ter
rell
221
[9.1
%)
57[5
.9%
1St
erlin
g27
[4.0
%]
108
7.3%
McL
enna
n14
07.
1%1
0.0%
Upt
on30
[4.2
%]
575.
9%W
ilson
171
7.7%
109
[7.3
%)
Dim
mit
127
[6.9
%)
12[1
.3%
)H
aske
ll41
[4.8
%1
615.
9%C
omal
976.
3%11
0[7
.4 %
]So
mer
vell
84[6
.0%
)13
[2.0
%)
Zav
ala
240
10.8
%62
6.0%
Will
acy
156
7.3%
111
7.4%
John
son
152
253
7.3%
[18.
8 %
]14
[2.6
%)
Gill
espi
e13
4[7
.0 %
]63
6.1%
Roc
kwal
l8
[1.9
%1
112
[7.4
%)
Dic
kens
15[2
.7 %
]L
ynn
66 22[5
.6 %
][3
.7%
164
6.1%
Cam
eron
826.
0%11
37.
4%M
oore
186
8.0%
16[2
.9 %
]M
ason
656.
2%H
ays
725.
7%11
47.
4%B
astr
op15
77.
4%17
[3.0
%]
Eas
tland
149
[7.2
%1
666.
2%H
idal
go55
5.1%
115
7.4%
Ata
scos
a13
36.
9%18
[3.2
%1
Och
iltre
e41
[4.8
%)
67[6
.2%
)L
avac
a29
[4.2
%)
116
7.5%
Wal
ker
225
9.3%
19[3
.6 %
]G
olia
d23
7[1
0.5%
)68
6.3%
Wis
e89
6.1%
117
7.5%
Mat
agor
da17
67.
8%20
[3.7
%1
Cal
laha
n21
4[8
.8 %
]69
6.4%
Wha
rton
195
8.1%
118
7.5%
Har
ris
153
7.3%
21[3
.7%
]Ji
m H
ogg
12 1
[2.8
%)
0.0%
70(6
.4 %
)Sc
hlei
cher
35[4
.5 %
]11
97.
5%W
ebb
745.
8%21
[3.7
%)
Men
ard
71[6
.4%
1Z
apat
a17
3(7
.7 %
]12
07.
5%M
idla
nd12
66.
9%23
[3.8
%]
Hoo
d85
6.1%
726.
4%H
ock
ley
204
8.4%
121
[7.6
%]
Free
ston
e23
2[9
.8 %
]24
[3.8
%)
Win
kler
124
[6.9
%1
73[6
.5%
1C
oke
244
[12.
5%1
122
7.6%
Polk
40[4
.8%
125
[4.0
%)
Jack
son
230
[9.7
%1
736.
5%G
uada
lupe
876.
1%12
37.
6%C
ham
bers
159
[7.5
%]
26[4
.0%
1C
olem
an20
5[8
.4%
175
6.5%
Smith
160
7.5%
124
7.6%
Titu
s11
96.
8%27
[4.1
%)
Cam
p21
5[8
.8%
176
6.6%
Elli
s98
6.3%
125
[7.6
%]
Hal
l19
4[8
.1%
128
[4.2
%)
Ham
ilton
23[3
.8 %
]77
6.6%
Mon
tgom
ery
886.
1%12
6[7
.6 %
]B
osqu
e21
[3.5
%]
29[4
.3%
)H
arde
man
235
235
[1[0
6..0
3%]]
786.
6%A
nder
son
364.
6%12
7[7
.6%
)Pe
cos
199
8.2%
29[4
.3 %
]R
eal
9579
[6.7
%)
Mot
ley
Will
iam
son
252
58[1
7.6%
)12
87.
6%N
avar
ro11
46.
8%29
[4.3
%]
San
Saba
229
[9.7
%)
806.
7%5.
3%12
97.
6%Sa
n Ja
cint
o12
793
[6.9
%)
6.2%
32[4
.4%
1Y
oung
520.
1%1
816.
7%V
an Z
andt
217
8.8%
130
7.7%
Tay
lor
33[4
.5%
1L
lano
180
[7.8
%)
82[6
.7%
1G
aine
s37
[4.6
%]
131
7.7%
Med
ina
595.
3%34
[4.6
%)
War
d47
[4.9
%)
836.
7%E
rath
251
17.1
%13
27.
7%G
regg
178
7.8%
35[4
.7 %
]Pr
esid
io13
[2.9
%]
84[6
.7%
1C
rosb
y12
3[6
.9 %
]13
37.
7%B
razo
ria
122
6.9%
36[4
.7 %
]St
ephe
ns13
2[6
.9%
185
6.7%
Palo
Pin
to83
6.0%
134
7.7%
Hop
kins
Ree
ves
20 188
[3.5
%]
8.0%
37[4
.8%
)C
ulbe
rson
51[5
.0%
186
[6.7
%]
McC
ullo
ch23
4[9
.9 %
]13
5[7
.7%
)38
[4.9
%)
Mill
s21
1[8
.7%
187
[6.8
%)
Fran
klin
24[3
.8 %
]13
67.
7%T
arra
nt11
66.
8%39
[5.0
%]
Fann
in68
[5.6
%]
886.
8%B
row
n16
47.
6%13
77.
7%D
alla
s16
87.
6%40
[5.0
%)
Hem
phill
218
[8.9
%]
896.
8%D
ento
n71
5.7%
138
7.8%
Mav
eric
k10
96.
7%40
[5.0
%)
Sher
man
41[4
.8%
190
6.8%
Park
er10
26.
5%13
97.
8%G
rim
es16
77.
6%42
5.0%
Hill
191
8.0%
916.
9%A
ustin
70[5
.7%
)14
07.
8%G
rays
on73
5.7%
435.
2%Ja
sper
183
1
7.9%
0.0%
92[6
.9%
)L
ampa
sas
Bra
zos
27 76[4
.0%
15.
9%14
17.
8%E
l Pas
o12
96.
9%44
[5.3
%1
Gla
ssco
ck93
6.9%
142
7.9%
Nac
ogdo
ches
219
9.0%
44[5
.3%
1K
inne
y14
4[7
.1 %
]94
6.9%
Cog
e 1
112
56.
9%14
37.
9%B
ell
165
7.6%
44[5
.3%
)T
hroc
kmor
ton
241
[11.
1%)
95[6
.9%
1H
ansf
ord
48[5
.0%
114
47.
9%R
anda
ll14
27.
1%47
[5.5
%]
Gon
zale
s69
[5.7
%]
966.
9%T
ravi
s10
46.
5%14
5[7
.9 %
]Pa
rmer
33[4
.4%
148
[5.6
%)
Bor
den
10.
0%97
[7.0
%1
Faye
tte19
3[8
.1%
114
68.
0%K
aufm
an16
17.
5%48
[5.6
%)
Con
cho
11[2
.4%
)98
[7.0
%]
Bur
leso
n56
[5.2
%1
147
[8.0
%)
Rai
ns23
9[1
0.8
%]
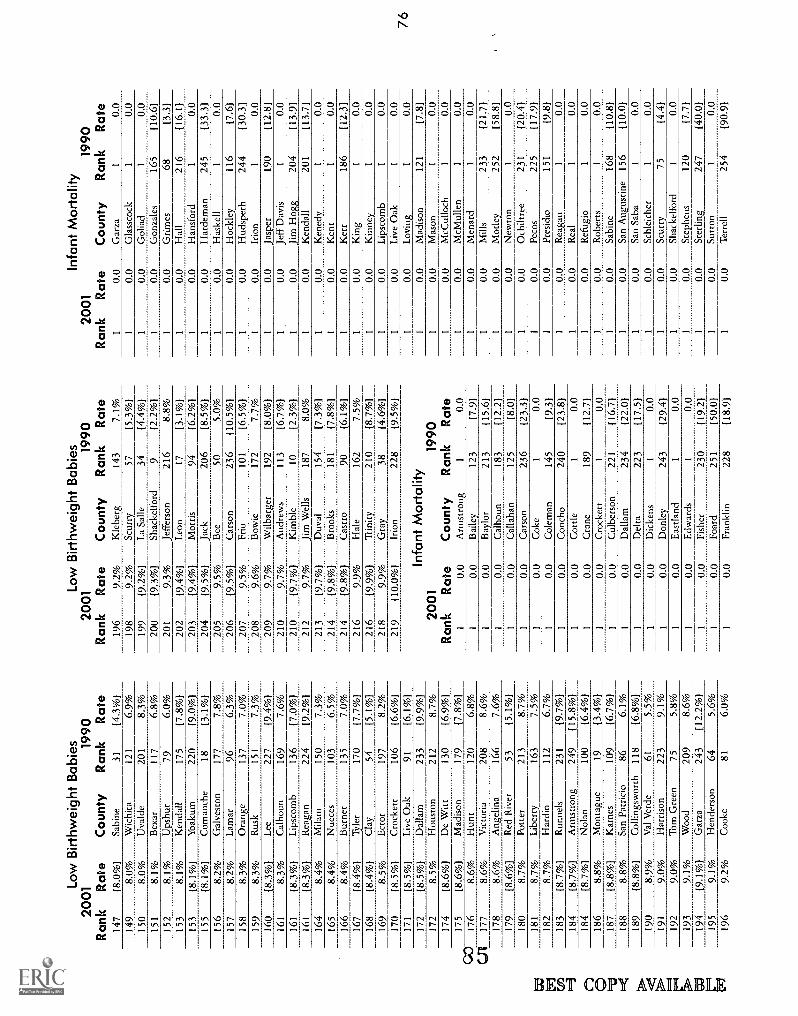
Low
Birt
hwei
ght B
abie
s20
011990
Rank
Rate
County
Rank
Rate
Low
Birt
hwei
ght B
abie
s20
011990
Rank
Rate
County
Rank
Rate
Infa
nt M
orta
lity
2001
1990
Rank
Rate
County
Rank
Rate
147
[8.0
%]
Sabi
ne31
[4.3
%1
196
9.2%
Kle
berg
143
7.1%
10.
0G
arza
10.
014
98.
0%W
ichi
ta12
16.
9%19
89.
2%Sc
urry
57[5
.3 %
]1
0.0
Gla
ssco
ck1
0.0
150
8.0%
Uva
lde
201
8.3%
199
[9.2
%]
La
Salle
34[4
.4 %
]1
0.0
Gol
iad
10.
015
18.
1%B
exar
117
6.8%
200
[9.3
%]
Shac
kelf
ord
9[2
.2 %
]1
0.0
Gon
zale
s16
5(1
0.6]
152
8.1%
Ups
hur
796.
0%20
19.
3%Je
ffer
son
216
8.8%
10.
0G
rim
es68
[3.3
115
38.
1%K
enda
ll17
517
.8%
120
2[9
.4 %
]L
eon
17[3
.1 %
]1
0.()
Hal
l21
6[1
6.1]
153
[8.1
%)
Yoa
kum
220
[9.0
%7
203
(9.4
%1
Mor
ris
94[6
.2 %
]1
0.0
Han
sfor
d1
0.0
155
(8.1
%)
Com
anch
e18
[3.1
%]
204
[9.5
%1
Jack
206
(8.5
%)
10.
0H
arde
man
245
[33.
3]15
68.
2%G
alve
ston
177
7.8%
205
9.5%
Bee
505.
0%1
0.0
Has
kell
10.
015
78.
2%L
amar
966.
3%20
6[9
.5%
7C
arso
n23
6[1
0.5%
)1
0.0
Hoc
kley
116
[7.6
)15
88.
3%O
rang
e13
77.
0%20
79.
5%Fr
io10
1[6
.5%
]1
0.0
Hud
spet
h24
4[3
0.3]
159
8.3%
Rus
k15
17.
3%20
89.
6%B
owie
172
7.7%
10.
0Ir
ion
10.
016
0[8
.3 %
]L
ee22
7[9
.4 %
]20
99.
7%W
ilbar
gsr
192
[8.0
%]
10.
0Ja
sper
190
[12.
8116
18.
3%C
alho
un16
97.
6%21
09.
7%A
ndre
ws
113
[6.7
%1
10.
0Je
ff D
avis
10.
016
1[8
.3%
)L
ipsc
omb
136
[7.0
%]
210
[9.7
%]
Kim
ble
10[2
.3%
71
0.0
Jim
Hog
g20
4[1
3.9]
161
[8.3
%]
Rea
gan
224
[9.2
%)
212
9.7%
Jim
Wel
ls18
78.
0%1
0.0
Ken
dall
201
(13.
7116
48.
4%M
ilam
150
7.3%
213
[9.7
%1
Duv
al15
4[7
.3%
71
0.0
Ken
edy
10.
016
58.
4%N
uece
s10
36.
5%21
4(9
.8%
]B
rook
s18
1[7
.8%
)1
0.0
Ken
t1
0.0
166
8.4%
Bur
net
135
7.0%
214
[9.8
%]
Cas
tro
90[6
.1%
)1
0.0
Ker
r18
6[1
2.3]
167
(8.4
%)
Tyl
er17
0[7
.7%
121
69.
9%H
ale
162
7.5%
10.
0K
ing
10.
016
8[8
.4%
7C
lay
54[5
.1 %
]21
6[9
.9 %
]T
rini
ty21
0[8
.7 %
]1
0.0
Kin
ney
10.
016
98.
5%E
ctor
197
8.2%
218
9.9%
Gra
y38
[4.6
%1
10.
0L
ipsc
omb
10.
017
0[8
.5%
]C
rock
ett
106
(6.6
%7
219
[10.
0 %
]Ir
ion
228
[9.5
%1
10.
0L
ive
Oak
10.
017
1[8
.5%
]L
ive
Oak
91[6
.1 %
]1
0.0
Lov
ing
10.
017
2[8
.5%
1D
alla
m23
3[9
.9%
)In
fant
Mor
talit
y1
0.0
Mad
ison
121
[7.8
117
28.
5%H
oust
on21
28.
7%20
011990
10.
0M
ason
10.
017
4[8
.6 %
]D
e W
itt13
0(6
.9 %
)Rank
Rate
County
Rank
Rate
10.
0M
cCul
loch
10.
017
5(8
.6%
1M
adis
on17
9[7
.8 %
]1
0.0
Arm
stro
ng1
0.0
10.
0M
cMul
len
10.
0G
O17
68.
6%H
unt
120
6.8%
10.
0B
aile
y12
3[7
.91
10.
0M
enar
d1
0.0
CA
177
8.6%
Vic
tori
a20
88.
6%1
0.0
Bay
lor
213
[15.
6]1
0.0
Mill
s23
3(2
1.71
178
8.6%
Ang
elin
a16
67.
6%1
0.0
Cal
houn
183
[12.
2]1
0.0
Mot
ley
252
[58.
8117
9(8
.6%
)R
ed R
iver
53[5
.1 %
]1
0.0
Cal
laha
n12
5[8
.0]
10.
0N
ewto
n1
0.0
180
8.7%
Potte
r21
38.
7%1
0.0
Car
son
236
[23.
3]1
0.0
Och
iltre
e23
1[2
0.4]
181
8.7%
Lib
erty
163
7.5%
10.
0C
oke
10.
01
0.0
Peco
s22
5[1
7.9]
182
8.7%
Har
din
112
6.7%
10.
0C
olem
an14
5[9
.31
10.
0Pr
esid
io15
1[9
.8]
183
[8.7
%]
Run
nels
231
[9.7
%)
10.
0C
onch
o24
0[2
3.81
10.
0R
eaga
n1
0.0
184
(8.7
%1
Arm
stro
ng24
9[1
5.8%
]1
0.0
Cot
tle1
0.0
10.
0R
eal
10.
018
4[8
.7%
)N
olan
100
(6.4
%)
10.
0C
rane
189
[12.
7]1
0.0
Ref
ugio
10.
018
68.
8%M
onta
gue
19[3
.4%
)1
0.0
Cro
cket
t1
0.0
10.
0R
ober
ts1
0.0
187
[8.8
%]
Kar
nes
109
(6.7
%)
10.
0C
ulbe
rson
221
[16.
7]1
0.0
Sabi
ne16
8[1
0.8)
188
8.8%
San
Patr
icio
866.
1%1
0.0
Dal
lam
234
[22.
011
0.0
San
Aug
ustin
e15
6[1
0.0]
189
[8.8
%7
Col
lings
wor
th11
8(6
.8%
)1
0.0
Del
ta22
3[1
7.57
10.
0Sa
n Sa
ba1
0.0
190
8.9%
Val
Ver
de61
5.5%
10.
0D
icke
ns1
0.0
10
0 LSc
hlei
cher
10.
019
19.
0%H
arri
son
223
9.1%
10.
0D
onle
y24
3[2
9.4]
__ _
10.
0Sc
urry
75[4
.4)
192
9.0%
Tom
Gre
en75
5.8%
10.
0E
astla
nd1
0.0
10.
0Sh
acke
lfor
d1
0.0
193
9.1%
Woo
d20
98.
6%1
0.0
Edw
ards
10.
01
0.0
Step
hens
120
[7.7
)19
4[9
.1%
)G
arza
243
[12.
2%1
10.
0Fi
sher
230
[19.
2]1
0.0
Ster
ling
247
[40.
0]19
59.
I %
Hen
ders
on64
5.6%
10.
0Fo
ard
251
[50.
0]1
0.0
Sutto
n1
0.0
196
9.2%
Coo
ke81
6.0%
10.
0Fr
ankl
in22
8[1
8.91
10.
0T
erre
ll25
4[9
0.91

GO
CY
)
Infa
nt M
orta
lity
2001
1990
Rank
Rate
County
Rank
Rate
10.
0T
erry
10.
0
Infa
nt M
orta
lity
2001
1990
Rank
Rate
County
Rank
Rate
121
15.1
1D
awso
n73
[3.9
1
Infa
nt M
orta
lity
2001
1990
Rank
Rate
County
Rank
Rate
170
(7.6
1Sa
n Pa
tric
io71
[3.8
11
0.0
Thr
ockm
orto
n24
6[3
7.0]
122
[5.2
)M
edin
a76
[4.4
117
1[7
.6]
Col
orad
o12
1[7
.81
10.
0W
alle
r64
[3.1
112
312
415
.41
5.4
Hen
ders
onH
arri
s60
[2.6
]8.
817
1[7
.6]
Frio
70[3
.8]
10.
0W
ard
209
[14.
8]13
717
3[7
.6]
Cal
dwel
l19
1[1
2.9]
10.
0W
heel
er21
1[1
5.4]
125
5.5
Tra
vis
101
6.4
174
7.8
Tar
rant
155
10.0
10.
0W
inkl
er97
[6.3
]12
65.
5Fo
rt B
end
895.
717
5[7
.8]
Lav
aca
188
[12.
611
0.0
Yoa
kum
235
[22.
4112
7[5
.51
Che
roke
e15
4[1
0.0]
176
17.8
]A
ngel
ina
176
[11.
3]79
[1.0
]B
astr
op10
6[6
.7]
128
[5.5
1E
llis
184
[12.
3]17
77.
8L
ubbo
ck13
88.
880
[1.8
]M
atag
orda
Wils
on17
01
(10.
91 0.0
129
[5.5
]L
eon
10.
017
8[7
.8]
Uva
lde
164
[10.
6]81
[2.3
113
0[5
.6]
Mila
m19
7[1
3.2]
179
[7.8
]G
uada
lupe
131
[8.4
182
[2.5
]B
ee10
3[6
.5]
131
5.6
Mon
tgom
ery
107
6.8
180
[7.9
]U
152
[10.
0183
[2.5
1W
illac
y80
[5.2
]13
2[5
.7]
Dea
f Sm
ith17
9[1
1.7]
181
[8.1
]Pa
plos
h Pint
o61
[2.6
184
[2.7
]M
aver
ick
156
[10.
0]13
3[5
.7]
Vic
tori
a18
7[1
2.51
182
(8.1
]Pa
rker
65[3
.1]
85[3
.2]
Bro
wn
77[4
.6]
134
[5.8
]C
amp
208
[14.
7]18
38.
4M
cLen
nan
111
7.2
86[3
.2]
Lam
ar15
0[9
.71
135
[5.8
]A
tasc
osa
219
[16.
3118
48.
5Je
ffer
son
Tom
Gre
en14
69.
5'87
[3.3
]L
imes
tone
10.
013
6[5
.8]
Wis
e17
3[1
1.2]
185
[8.5
]83
[5.4
]88
[3.3
]Ji
m W
ells
92[5
.9]
137
[5.8
]K
lebe
rg14
0[8
.9)
186
(8.5
]M
ario
n1
0.0
89[3
.4)
Van
Zan
dt21
2[1
5.5]
138
[5.9
]Fa
nnin
105
[6.6
)18
7[8
.6]
Gill
espi
e98 20
7[6
.3]
[14.
3190
[3.7
]N
acog
doch
es20
5[1
4.1]
139
[5.9
]B
razo
s78
[4.8
)18
8[8
.8]
Hut
chin
son
913.
8C
ollin
108
6.9
140
141
[5.9
][6
.0]
Tay
lor
Cas
s16
721
010
.7[1
4.9]
189
(8.9
)H
ood
196
[13.
2]92
[3.9
]H
ill84
[5.5
)19
0[8
.9)
You
ng21
3[1
5-61
92[3
.91
Titu
s20
6[1
4.1]
142
[6.0
]A
nder
son
127
[8.1
]19
1[8
.91
Mid
land
133
[8.4
194
[3.9
]H
ays
142
[9.0
)14
3[6
.21
Red
Riv
er88
[5.6
]19
2[9
.0)
Chi
ldre
ss21
6[1
6.1]
95[4
.01
Polk
222
[17.
5]14
3[6
.2]
6.2
Tri
nity
239
[23.
6] 7.5
193
[9.1
)H
ardi
n69
[3.5
]96
(4.0
)L
am a
sas
224
[17.
8)14
5G
alve
ston
114
194
[9.3
1H
ale
110
[7.1
]97
[4.1
]H
oust
on17
1[1
0.9]
146
147
[6.2
1[6
.3]
Ran
dall
Com
anch
e86 1
[5.5
]0.
019
5[9
.3]
Rob
erts
on16
1[1
0.3]
98[4
.2]
Nav
arro
67[3
.31
196
[9.3
1A
ustin
198
[13.
3199
[4.2
]H
opki
ns62
[2.7
]14
86.
3B
exar
109
7.0
197
[9.4
1B
lanc
o20
1[1
3.7)
100
[4.2
]G
aine
s1
0.0
149
(6.3
1H
arri
son
102
[6.4
]19
8[9
.5)
Cha
mbe
rs72
[3.9
)10
1[4
.4]
Mon
tagu
e14
9[9
.71
150
6.3
Dal
las
139
8.8
199
[9.5
]W
ichi
ta13
0[8
.4]
102
[4.5
]B
osqu
e90
[5.8
]15
16.
4W
ebb
956.
220
0[9
.6]
Lib
erty
96[6
.2)
103
[4.5
]C
omal
132
[8.4
]15
2[6
.51
Lla
no13
5[8
.7]
201
[9.7
]N
olan
192
[12.
9)10
44.
6D
ento
n11
87.
615
36.
6N
uece
s13
48.
720
2(9
.7)
Coo
ke16
2[1
0.4]
105
4.6
Hid
algo
875.
615
4[6
.71
Run
nels
226
[18.
2]20
3[9
.91
Roc
kwal
l82
[5.4
]10
6[4
.6]
Bra
zori
a12
47.
915
5[6
.7]
Mor
ris
227
[18.
6]20
4[9
.9]
Zav
ala
10.
010
74.
6W
illia
mso
n93
[5.9
]15
6[6
.7]
Era
th19
4[1
3.0]
205
[10.
0]G
rays
on11
5[7
.6]
108
[4.6
]A
ndre
ws
215
[15.
9]15
7[6
.8]
Woo
d14
4[9
.2]
206
[10.
0]K
aufm
an17
8[1
1.61
108
[4.6
]L
ee24
1[2
5.2]
158
[6.9
]R
usk
169
[10.
8]20
7[1
0.0]
Bur
net
10.
011
0[4
.6]
Val
Ver
de11
2[7
.21
159
[7.0
]H
owar
d21
6[1
6.1]
207
[10.
0]R
ains
199
03.5
111
1[4
.7]
Bur
leso
n23
8[2
3.5]
160
[7.1
]Sm
ith11
9[7
.71
209
[10.
2]Jo
nes
Moo
re14
312
8[9
.1]
[8.2
]11
2[4
.7]
John
son
174
[11.
2]16
1[7
.2]
Hun
t14
1[8
.9]
210
[10.
2]11
34.
7E
l Pas
o94
6.2
162
[7.2
]C
orye
llB
owie
104
166
[6.6
)[1
0.7]
211
[10.
4)Sa
n Ja
cint
o1
0.0
114
[4.8
]R
eeve
s12
5[8
.0]
163
[7.2
]21
2[1
0.5)
Dim
mit
79[4
.91
114
[4.8
1W
ilbar
ger
81[5
.3]
164
[7.4
]Fa
yette
229
[19.
0]21
3[1
0.5)
Falls
242
[28.
9]11
64.
9C
amer
on91
5.9
165
7.5
Bel
l15
310
.021
3[1
0.5]
Ham
ilton
10.
011
7[5
.0]
Wal
ker
180
[11.
8]16
6[7
.5]
Bro
oks
195
[13.
1]21
3[1
0.51
Som
erve
ll1
0.0
118
[5.0
]W
hart
on14
8(9
.71
166
[7.5
1C
astr
o18
5[1
2.3]
216
[10.
9)Pa
nola
175
(11.
3]11
9[5
.0]
Ect
or11
3(7
.51
166
[7.5
]Z
apat
aSt
arr
84 74[5
.5]
[4.3
]21
711
.3G
regg
158
[10.
2112
0[5
.1]
Was
hing
ton
63[3
.0]
169
[7.5
121
8[1
1.51
Jack
son
159
[10.
2]

Infa
nt M
orta
lity
2001
1990
2001
Chi
ld D
eath
s19
9020
01C
hild
Dea
ths
1990
Ran
kR
ate
Cou
nty
Ran
kR
ate
Ran
kR
ate
Cou
nty
Ran
kR
ate
Ran
kR
ate
Cou
nty
Ran
kR
ate
219
[11.
91G
ray
177
[11.
6]1
0.0
Col
lings
wor
th24
0[1
33.3
)1
0.0
Mar
tin1
0.0
220
11.9
Potte
r99
[6.3
]1
0.0
Col
orad
o1
0.0
10.
0M
ason
10.
022
1[1
2.0]
Ban
dera
136
[8.8
]1
0.0
Com
anch
e1
0.0
10.
0M
atag
orda
225
[84.
9)22
2[1
2.0]
Cla
y15
9[1
0.2]
10.
0C
onch
o1
0.0
0.0
Mav
eric
k17
4[4
7.0)
223
[12.
5]Sh
elby
66[3
.21
10.
0C
rane
221
[78.
6)0.
0M
cMul
len
10.
022
4[1
3.2]
Lam
b1
0.0
10.
0C
rosb
y23
3[1
10.4
)0.
0M
edin
a20
6[6
1.9]
225
[13.
2]Pa
rmer
10.
01
0.0
Cul
bers
on1
0.0
0.0
Men
ard
10.
022
6(1
3.3)
Swis
her
10.
01
0.0
De
Witt
181
[49.
7]0.
0M
ilam
94[1
9.51
227
[13.
5]D
e W
itt20
3[1
3.81
10.
0D
eaf
Smith
145
[36.
7]0.
0M
itche
ll23
5[1
15.1
]22
8[1
4.0]
Tyl
er19
9[1
3.51
10.
0D
elta
248
[225
.2]
0.0
Moo
re1
0.0
229
[14.
2]O
rang
e10
0[6
.41
10.
0D
imm
it13
9[3
4.2]
0.0
Mot
ley
10.
023
0[1
4.3]
Coc
hran
10.
01
0.0
Don
ley
10.
00.
0N
ewto
n20
9[6
3.31
231
[14.
5]A
rche
r25
3[8
4.2)
10.
0D
uval
126
[30.
5)1
0.0
Old
ham
10.
023
2[1
5.4]
Duv
al21
9[1
6.3]
10.
0E
astla
nd12
2[2
8.8)
10.
0Pa
nola
98[2
0.51
233
[16.
11K
imbl
e23
6[2
3.3)
10.
0E
dwar
ds1
0.0
10.
0Pa
rmer
10.
023
4[1
6.8]
Bre
wst
er24
8[4
1.3]
10.
0Fa
yette
183
[51.
7]1
0.0
Polk
231
[101
.6)
235
[17.
8]Fr
eest
one
249
[43.
5)1
0.0
Fish
er25
4[4
07.3
)1
0.0
Pres
idio
10.
023
6[1
9.2]
Cro
sby
117
[7.6
]1
0.0
Floy
d17
2[4
6.3]
10.
0R
eaga
n1
0.0
237
[20.
4]L
a Sa
lle17
2[1
1.1]
10.
0Fo
ard
10.
01
0.0
Red
Riv
er14
6[3
7.4)
238
[21.
1]Ja
ck1
0.0
10.
0Fr
ankl
in20
8[6
3.2]
10.
0R
eeve
s23
6[1
19.4
)23
9(2
3.3]
Kno
x1
0.0
10.
0G
aine
s11
0[2
4.2]
10.
0R
efug
io20
0[5
8.6]
240
[24.
1)M
itche
ll12
9[8
.3]
10.
0G
arza
10.
01
0.0
Rob
erts
10.
024
1[2
4.2]
Ara
nsas
193
[12.
9)1
0.0
Gill
espi
e12
9[3
1.1]
10.
0Sa
bine
211
[64.
2]24
2[2
5.0]
Hem
phill
10.
01
0.0
Gla
ssco
ck1
0.0
10.
0Sc
hlei
cher
10.
024
2[2
5.0]
Sher
man
10.
01
0.0
Hal
l1
0.0
10.
0Sc
urry
173
[46.
7]24
2(2
5.01
Upt
on16
3[1
0.5)
10.
0H
ansf
ord
242
[135
.81
10.
0Sh
acke
lfor
d1
0.0
245
[25.
21K
arne
s14
7[9
.5)
10.
0H
arde
man
10.
01
0.0
Sher
man
10.
024
6[2
7.0]
Floy
d18
2[1
2.21
10.
0H
artle
y25
2[2
45.7
)1
0.0
Som
erve
ll1
0.0
247
[28.
2]M
artin
181
[12.
0]1
0.0
Has
kell
10.
01
0.0
Step
hens
230
[100
.6)
248
[28.
6)H
artle
y23
2[2
1.3)
10.
0H
emph
ill1
0.0
10.
0St
erlin
g1
0.0
249
[40.
0)L
ynn
10.
01
0.0
Hud
spet
h25
3[2
69.9
]0.
0St
onew
all
10.
024
9[4
0.0]
Ston
ewal
l1
0.0
10.
0H
utch
inso
n1
0.0
0.0
Sutto
n23
2[1
02.6
]25
1[4
3.5]
Bri
scoe
10.
01
0.0
I ri
on1
0.0
0.0
Ter
rell
10.
025
2[5
5.6]
Bor
den
10.
01
0.0
Jack
241
(133
.5)
0.0
Thr
ockm
orto
n1
0.0
253
[58.
8]C
ollin
gsw
orth
250
(45.
511
0.0
Jeff
Dav
is1
0.0
10.
0W
ashi
ngto
n1
0.0
253
[58.
8]O
ldha
m1
0.0
1__
____
_0.0
Jim
Hog
g__
_24
7[2
23.7
]1
0.0
Whe
eler
10.
01
0.0
Kar
nes
134
[33.
0]1
0.0
Wilb
arge
r24
5[1
94.6
)C
hild
Dea
ths
10.
0K
ened
y1
0.0
10.
0W
inkl
er16
7[4
4.1]
2001
1990
10.
0K
ent
10.
01
0.0
Yoa
kum
10.
0
Ran
kR
ate
Cou
nty
Ran
kR
ate
10.
0K
err
217
[74.
6]98
[6.0
]K
aufm
an18
0[4
9.4)
0.0
Bay
lor
10.
01
0.0
Kim
ble
10.
099
[6.4
]H
unt
124
[29.
8)
0.0
Bor
den
10.
01
0.0
Kin
g1
0.0
100
[7.9
]T
aylo
r93
[19.
1]
0.0
Bre
wst
er1
0.0
10.
0K
lebe
rg19
6[5
7.01
101
{9.5
)R
anda
ll17
1
0.0
Bro
oks
10.
01
0.0
Kno
x22
9[9
5.0]
102
[10.
1]L
amar
190
05.4
)0.
0C
arso
nC
ham
bers
163
[128
.4]_
{42.
4]
10.
0L
a Sa
lle1
0.0
103
[10.
4]A
tasc
osa
111
[24.
8)
0.0
10.
0L
ive
Oak
10.
010
4[1
1.0]
Will
iam
son
105
[23.
1]
0.0
Coc
hran
10.
01
0.0
Lov
ing
10.
010
5[1
1.8]
Hal
e10
1[2
2.5]
0.0
Cok
e1
0.0
0.0
Lyn
n23
7[1
21.7
]10
6[1
3.4]
Wils
on1
0.0
0.0
Col
eman
188
[53.
811
0.0
Mar
ion
10.
010
7[1
3.8)
Col
lin10
4[2
3.1]

U.-
2001
Ran
kR
ate
108
{13.
81
Chi
ld D
eath
s
Cou
nty
Ups
hur
1990
Ran
kR
ate
239
11[3
16%
01
2001
Ran
kR
ate
157
28.0
Chi
ld D
eath
s
Cou
nty
Tra
vis
1990
Ran
kR
ate
9219
.0
2001
Ran
kR
ate
206
[54.
8]
Chi
ld D
eath
s
Cou
nty
Falls
1990
Ran
kR
ate
193
109
{14.
0}C
aldw
ell
158
[28.
1]B
row
n20
7R
usk
161
[41.
7111
0[1
5.51
Park
er17
9{4
8.5]
159
[28.
7]M
onta
gue
1 165
0.0
1[44
22..9
311
208
[155
66.6
1Sw
ishe
r18
2[5
0.31
111
{15.
91H
opki
ns87
[16.
4)16
0[2
8.8]
Ect
or20
9[5
7.6]
Rob
erts
on12
01[
2585
..681
]
112
[16.
2]N
uece
s90
[18.
4]16
1[2
9.4]
Lub
bock
138
[34.
0121
0(5
98 .
]R
ains
Rac
e
216
{74.
5)11
317
.2T
arra
nt10
623
.616
2[2
9.8)
Bur
leso
n25
1[2
36.9
)21
1.0
5)21
4[6
9.5)
114
[17.
61B
ee13
2[3
1.81
163
[29.
9)Y
oung
116
[26.
0)21
2[6
0.3]
ss11
2[2
5.1]
115
[17.
81V
al V
erde
127
[30.
6]16
4[3
0.3)
Mid
land
1321
3[6
1.1]
Jone
s1
0.0
116
[17.
9)C
ass
85[1
5.5)
165
166
[30.
7]{3
1.0)
Bur
net
Che
roke
e21
314
2[6
7.9]
214
{61.
7]M
cCul
loch
10.
011
7{1
8.1)
Nac
ogdo
ches
202
[59.
4][3
5.3]
215
{61.
8]L
amb
119
[27.
4)11
8[1
8.3)
Palo
Pin
to19
7[5
7.4)
167
{31.
2}B
ell
176
47.7
216
[61.
9]Sa
n A
ugus
tine
210
{63.
6111
9{1
8.71
San
Patr
icio
155
[39.
9116
8{3
1.3]
Nol
an11
8[2
7.3]
217
[61.
9]Fr
eest
one
125
{29.
9112
0{1
8.8)
Fort
Ben
d95
{19.
9}16
9(3
1.4}
Zap
ata
243
[156
.61
218
[62.
01H
ill19
1[5
5.61
121
{19.
01D
ento
n96
[20.
3]17
0[3
1.7]
Bra
zos
107
[23.
7)21
9[6
2.1]
Bos
sue
143
{35.
5}12
2[1
9.2]
Shel
by16
8{4
4.4]
171
{31.
8]H
ays
131
[31.
4]22
0[6
2.41
Will
acy
201
{59.
3]12
3{1
9.7}
Wic
hita
141
[35.
1]17
217
3[3
1.9]
[32.
1]V
icto
ria
Potte
r1
186
0.0
[53.
2)22
1[6
2.4]
Nav
arro
82[1
1.81
124
{19.
8}K
enda
ll13
7[3
3.7]
222
[62.
5)B
lanc
o24
4[1
67.4
112
5[1
9.81
Gua
dalu
pe21
2{6
7.9)
174
[32.
2]H
owar
d19
8[5
7.51
223
[64.
2]E
rath
91[1
8.7)
126
[20.
41A
ustin
228
[94.
0)17
5[3
2.4)
Lib
erty
199
[57.
5122
4[6
6.91
Ham
ilton
10.
012
7[2
1.11
Gal
vest
on14
4[3
5.6]
176
177
[33.
2][3
3.7)
Woo
d89
[17.
9122
5[6
7.1]
Bai
ley
234
{114
.0}
128
[21.
1]ry
Mon
tgom
ery
147
[37.
41E
llis
109
{23.
8)22
5[6
7.1]
Dal
lam
219
{75.
9112
9[2
1.41
Cam
eron
113
[25.
4]17
8[3
3.8]
And
rew
s11
4[2
5.4]
227
[73.
8)T
itus
192
[55.
8]13
0[2
1.51
Web
b86
[15.
8)17
9[3
4.2]
Jack
son
140
[34.
3]22
8[7
8.7]
Chi
ldre
ss1
0.0
131
21.6
El P
aso
102
22.7
180
181
[34.
8][3
5.9]
Gre
gg15
311
7{3
9.3]
[27.
0)22
9[8
0.01
Cam
p17
7[4
8.4]
132
21.8
Hid
algo
157
40.3
Hen
ders
on23
0[8
0.7]
And
erso
n17
0[4
4.8)
133
[22.
0)B
razo
ria
156
[39.
9]18
2{3
8.2)
Ter
ry12
1[2
8.61
231
[80.
9]C
alla
han
148
[37.
5)13
4{2
2.4)
Bas
trop
194
{56.
3)18
3{4
1.8}
Hoc
kley
10.
023
2{8
6.1]
Lav
aca
10.
013
5[2
2.5]
Wha
rton
81[1
0.4]
184
[41.
91T
rini
ty17
5[4
7.4]
233
[87.
4]Fa
nnin
164
[42.
6113
6{2
2.81
San
Jaci
nto
10.
018
5[4
2.0]
Jim
Wel
ls12
8[3
1.0]
234
[87.
5]C
alho
un16
9{4
4.6)
137
[23.
2]L
imes
tone
103
{22.
8118
6[4
2.11
Van
Zan
dt18
5[5
2.6]
235
[88.
7]Sa
n Sa
ba1
0.0
138
[23.
6)W
alke
r22
7[9
2.81
187
[42.
11[4
4.0]
Jasp
er16
6[4
3.3]
236
{89.
4)W
ard
203
[59.
8)13
923
.9B
exar
123
29.6
188
Run
nels
159
[40.
8]23
7{9
3.2]
Lla
no1
0.0
140
{24.
0]H
arri
son
151
[38.
2118
9[4
4.1]
Tom
Gre
en79
[9.3
123
8[9
7.3]
Zav
ala
204
[60.
0)14
1[2
4.2]
Jeff
erso
n10
0[2
1.2]
190
[44.
71G
rim
es22
0{7
6.1}
239
{103
.3]
Mill
s1
0.0
142
[24.
5]G
ray
154
[39.
4)19
119
2[4
5.7]
[45.
8]W
alle
r99
{21.
1}24
0[1
05.2
)A
rche
r19
5[5
6.6)
143
24.8
Dal
las
135
33.1
Wis
e11
5[2
5.8]
241
[106
.5]
Daw
son
189
[55.
4]14
4[2
4.9)
Ara
nsas
223
[82.
3]19
3[4
6.7]
Bow
ie20
7[6
3.0]
242
[109
.21
Leo
n1
0.0
145
[25.
3)C
orye
ll83
[14.
6]19
4[4
7.3]
Och
iltre
e22
6[8
7.4)
243
[115
.1]
Cro
cket
t1
0.0
146
[25.
3)M
cLen
nan
97{2
0.4)
195
[47.
6)U
vald
e1 187
0.0
{53.
5)24
4[1
19.5
1B
ande
ra18
4{5
2.0]
147
[25.
3)H
oust
on10
8[2
3.7]
196
{48.
1)M
adis
on24
5[1
48.6
1U
pton
10.
014
8[2
5.4]
Gon
zale
s21
817
5.11
197
[48.
4)C
lay
177
[48.
4)24
6[1
50.0
1G
olia
d1
0.0
149
[26.
3]C
ooke
84{1
4.9)
198
199
{49.
2}{5
0.31
Har
din
Cas
tro
224
1
{83.
51 0.0
247
[168
.6)
Lip
scom
b1
0.0
150
26.3
Har
ris
150
38.2
248
{3.
)R
eal
249
[228
.3]
151
[26.
4)H
ood
136
[33.
6]20
0[5
0.8]
Com
al80
[9.6
124
9[2
03.3
1M
orri
s21
5[6
9.6]
152
[27.
21R
ockw
all
10.
020
1[5
1.21
Ora
nge
78[5
.51
250
1268
.1]
Dic
kens
10.
015
3{2
7.4)
Tyl
er20
5(6
1.7)
202
203
[51.
3)[5
1.8)
Star
r
Ang
elin
a15
815
2[4
0.6]
[38.
2]25
1[2
71.7
1B
risc
oe25
0[2
28.8
]15
4[2
7.5]
John
son
129
[31.
1]25
2[3
08.2
)K
inne
y1
0.0
155
[27.
8]Fr
io22
2[8
1.3]
204
[52.
2]Sm
ith14
9[3
7.5]
253
[314
.5)
Cot
tle24
6[2
17.4
]15
6[2
7.91
Gra
yson
160
{41.
7]20
5[5
3.31
Lam
pasa
s1
0.0
254
[471
.71
Arm
stro
ng1
0.0

Tee
n V
iole
nt D
eath
s20
011990
Rank
Rate
County
Rank
Rate
10.
0A
rans
as16
1[8
8.0)
Tee
n V
iole
nt D
eath
s20
0119
90Rank
Rate
County
Rank
Rate
10.
0K
arne
s1
0.0
Tee
n V
iole
nt D
eath
s20
011990
Rank
Rate
County
Rank
Rate
10.
0T
erre
ll1
0.0
10.
0A
rche
r21
7[1
77.0
11
0.0
Ken
edy
10.
01
0.0
Thr
ockm
orto
n1
0.0
10.
0A
rmst
rong
10.
01
0.0
Ken
t1
0.0
1 1
0.0
0.0
Upt
onU
vald
e1
164
0.0
[90.
811
0.0
Aus
tin23
8[2
92.4
11
0.0
Kim
ble
10.
01
0.0
Bai
ley
244
[355
.9)
10.
0K
ing
10.
01
0.0
Wal
ker
10.
01
0.0
Ban
dera
252
[580
.6)
10.
0K
inne
y24
9[4
69.5
]1
0.0
War
d1
0.0
10.
0B
aylo
r25
0[4
85.4
)1
0.0
Kle
berg
10.
01
0.0
Whe
eler
251
[534
.8]
10.
0B
risc
oe1
0.0
10.
0K
nox
10.
01
0.0
Wilb
arge
r1
0.0
1 1
0.0
0.0
Bro
oks
10.
01
0.0
La
Salle
10.
01
0.0
Will
a1
0.0
Cam
p23
5[2
72.1
]1
0.0
Lam
b16
8[9
5.11
10.
0W
ilson
10.
01
0.0
Chi
ldre
ss25
3[7
16.0
]1
0.0
Lam
pasa
s1
0.0
10.
0W
inkl
er23
9[2
95.0
]1
0.0
Cla
y20
4[1
41.6
]1
0.0
Lip
scom
b1
0.0
110
[5.2
)B
razo
s10
5[6
.8)
10.
0C
ochr
an1
0.0
10.
0L
ive
Oak
208
[154
.1)
111
[19.
5]H
ende
rson
144
[74.
610.
0C
ollin
gsw
orth
246
[427
.4)
10.
0L
lano
10.
011
2[2
5.7]
Roc
kwal
l18
2[1
08.9
11
0.0
Col
orad
o1
0.0
1 1 1
0.0
0.0
0.0
Lov
ing
10.
011
3[2
6.5]
Van
Zan
dt11
1[3
7.1]
10.
0C
oman
che
185
[112
.7)
Lyn
nM
adis
on1 1
0.0
0.0
114
(27.
2)Pa
rker
10.
00.
0C
onch
o1
0.0
115
(27.
81Ji
m W
ells
10.
00.
0C
rane
10.
01
0.0
Mar
ion
10.
011
6[2
7.91
John
son
167
183
[93.
11[M
A)
0.0
Cul
bers
on1
0.0
10.
0M
artin
10.
011
7[2
8.21
Wal
ler
0.0
Dal
lam
10.
01
0.0
Mas
on1
0.0
118
[29.
0]C
hero
kee
211
[164
.2)
0.0
Daw
son
216
(175
.7)
10.
0M
aver
ick
108
[25.
1]11
9[2
9.1]
Cam
eron
120
[52.
7)0.
0D
elta
10.
01 1
0.0
0.0
McM
ulle
nM
edin
a1
218
0.0
(184
.91
120
[29.
9)B
row
n17
5[1
04.9
10.
0D
icke
ns1
0.0
121
[31.
4]B
owie
198
[131
.0]
10.
0D
imm
it1
0.0
10.
0M
enar
d1
0.0
122
[32.
0)K
err
114
(45.
2]1
0.0
Don
ley
10.
01
0.0
Mitc
hell
10.
012
3[3
2.41
Coo
ke15
118
2.6)
10.
0E
astla
nd24
2[3
41.1
)1
0.0
Moo
re20
3[1
40.9
112
4(3
2.51
Nac
ogdo
ches
143
[70.
011
0.0
Edw
ards
10.
01
0.0
Mot
ley
254
[900
.91
125
[34.
91[3
5.11
Gre
gg20
2[1
40.8
11
0.0
Faye
tte23
1(2
45.7
11
0.0
Nol
an14
8[8
0.31
126
Hoo
d12
2[5
6.11
CO
10.
0Fi
sher
10.
01
0.0
Och
iltre
e1
0.0
127
[35.
21N
uece
s10
7[1
7.1]
(.0
10.
0Fl
oyd
209
[163
.11
10.
0O
ldha
m1
0.0
128
[35.
41W
illia
mso
n10
9[2
8.3)
10.
0Fo
ard
10.
01
0.0
Peco
s1
0.0
129
[36.
0]C
orye
ll11
8[5
0.6)
10.
0Fr
ankl
in1
0.0
10.
0Pr
esid
io1
0.0
130
[36.
1]Ja
sper
232
(252
.0)
10.
0G
aine
s1
0.0
10.
0R
ains
223
[208
.8)
131
[36.
21W
ashi
ng to
n1
0.0
10.
0G
arza
10.
01
0.0
Rea
gan
10.
013
213
7.01
Den
ton
142
[69.
811
0.0
Gla
ssco
ck1
0.0
10.
0R
eal
10.
013
3[3
7.81
Ect
or13
8[6
6.6)
1 1
0.0
0.0
Gol
iad
Gri
mes
1 1
0.0
10.
0R
eeve
s1
0.0
134
[37.
91H
arri
son
159
[86.
910.
01
0.0
Rob
erts
10.
013
5[3
8.3)
Woo
d20
7(1
51.8
10.
0H
all
10.
01
0.0
Run
nels
197
(126
.6)
136
[39.
11M
idla
nd13
9[6
8.3]
0.0
Han
sfor
d1
0.0
10.
0Sa
bine
10.
013
7[3
9.41
Tay
lor
176
[105
.3)
0.0
Har
dem
an24
0[2
97.6
11
0.0
San
Aug
ustin
e22
1[1
98.0
]13
839
.9B
exar
132
63.9
0.0
Har
tley
10.
01
0.0
San
Jaci
nto
210
[163
.3)
139
[41.
01H
owar
d15
8[8
6.7)
0.0
Has
kell
10.
01 1 1
0.0
0.0
San
Saba
Schl
eich
er23
61
[277
.0)
0.0
0.0
140
41.8
El P
aso
127
60.7
0.0
Hem
phill
10.
014
141
.8H
arri
s17
010
0.6
0.0
Hoc
kley
201
[136
.41
0.0
Shac
kelf
ord
114
2[4
2.9)
Cas
s20
0[1
33.3
)0.
0H
opki
ns11
5(4
7.81
10.
0Sh
erm
an24
7[4
50.5
)14
3[4
3.5)
Cha
mbe
rs12
6[6
0.5)
0.0
Hou
ston
222
(201
.6)
10.
0So
mer
vell
230
[243
.3]
144
[44.
4)Sm
ith14
1[6
9.71
0.0
Hud
spet
h1
0.0
10.
0St
erlin
gSu
tton
1 1
0.0
0.0
145
44.7
Hid
algo
134
64.9
0.0
Jack
son
173
[104
.4]
10.
014
6[4
6.91
Ran
dall
194
[123
.4]
0.0
Jim
Hog
g1
0.0
10.
0Sw
ishe
r1
0.0
147
[47.
3]L
ubbo
ck11
0[3
1.5]
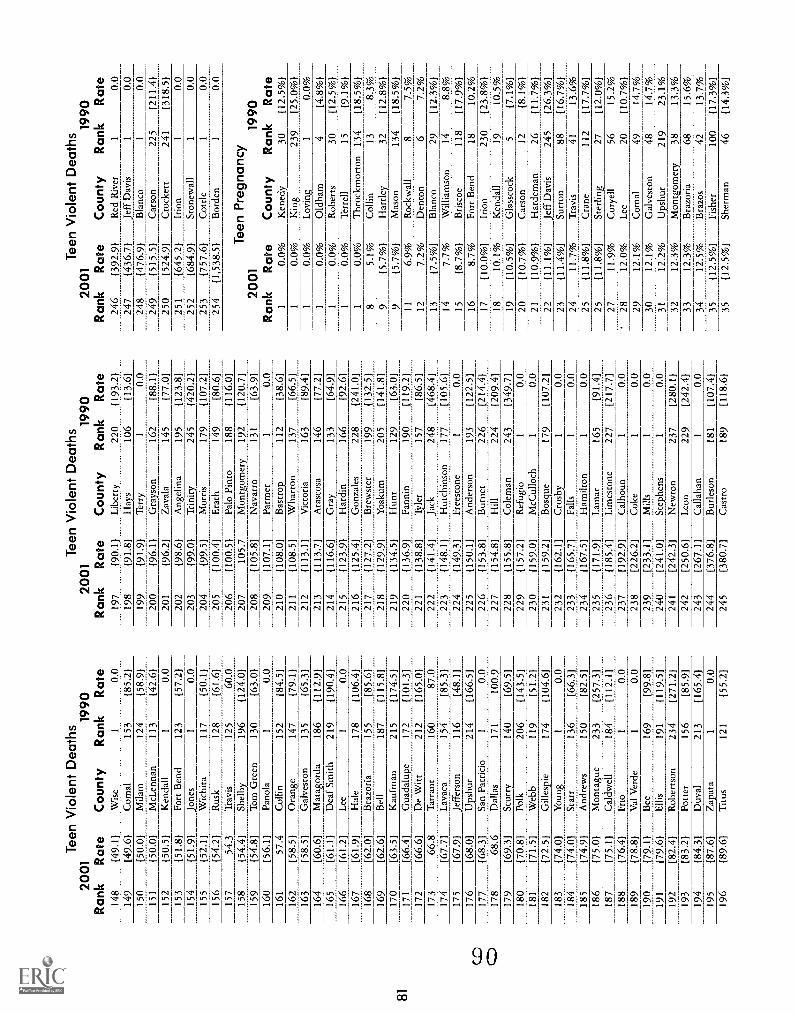
Tee
n V
iole
nt D
eath
s20
0119
90T
een
Vio
lent
Dea
ths
2001
1990
Tee
n V
iole
nt D
eath
s20
0119
90Rank
Rate
County
Rank
Rate
Rank
Rate
County
Rank
Rate
Rank
Rate
County
Rank
Rate
148
{49.
1)W
ise
10.
019
7{9
0.1}
Lib
erty
220
[193
.21
246
[392
.9]
Red
Riv
er1
0.0
149
[49.
6)C
omal
153
[85.
2]19
8{9
1.8}
Hay
s10
6[1
3.61
247
{436
.7)
Jeff
Dav
is1
0.0
150
{50.
0)M
ilam
([45
28..9
611
199
{91.
9}T
erry
10.
024
8{4
76.9
)B
lanc
o1
0.0
151
[50.
0]M
cLen
nan
113
200
[96.
11G
rays
on16
2[8
8.1]
249
{515
.5)
Car
son
225
[211
.41
152
[50.
5]K
enda
ll1
0.0
201
{96.
2}Z
aval
a14
5[7
7.0)
250
{524
.9]
Cro
cket
t24
1[3
18.5
]15
3[5
1.8]
Fort
Ben
d12
3(5
7.2]
202
{98.
6}A
ngel
ina
195
[123
.8)
251
{645
.2)
Irio
n1
0.0
154
{51.
9]Jo
nes
10.
020
3[9
9.01
Tri
nity
245
[420
.2]
252
{684
.91
Ston
ewal
l1
0.0
155
{52.
1}W
ichi
ta11
7[5
0.1]
204
(99.
5]M
orri
s17
9(1
07.2
)25
3{7
57.6
}C
ottle
10.
015
6{5
4.21
Rus
k12
8{6
1.6)
205
{100
.4}
Era
th14
9{8
0.6)
254
[1,5
38.5
]B
orde
n1
0.0
157
54.3
Tra
vis
125
60.0
206
{100
.5}
Palo
Pin
to18
8[1
16.0
)15
8[5
4.41
Shel
by19
6{1
24.0
)20
710
5.7
Mon
tgom
ery
192
{120
.71
Tee
n P
regn
ancy
159
[54.
8]T
om G
reen
130
[63.
0]20
8[1
05.8
)N
avar
ro13
1{6
3.9)
2001
1990
160
[56.
11Pa
nola
10.
020
9{1
07.1
)Pa
rmer
10.
0Rank
Rate
County
Rank
Rate
161
57.4
Col
lin15
2[8
4.5]
210
[108
.0)
Bas
trop
112
{38.
6}1
0.0%
Ken
edy
30[1
2.5
%]
162
[58.
51O
rang
e14
721
1[1
08.5
)W
hart
on13
7[6
6.51
10.
0%K
ing
239
[25.
0%)
163
[58.
51G
alve
ston
135
[65.
3121
2[1
13.1
)V
icto
ria
163
[89.
411
0.0%
Lov
ing
10.
0%16
4[6
0.6]
Mat
agor
da18
6{1
12.9
121
3[1
13.7
)A
tasc
osa
146
[77.
211
0.0%
Old
ham
4[4
.8%
116
5{6
1.1}
Dea
f Sm
ith21
9[1
90.4
]21
4[1
16.6
]G
ray
133
[64.
9]1
0.0%
Rob
erts
30[1
2.5%
116
6{6
1.2]
Lee
10.
021
5[1
23.9
)H
ardi
n16
6[9
2.61
10.
0%T
erre
ll15
[9.1
%1
167
[61.
91H
ale
178
{106
.4}
216
(125
.4)
Gon
zale
s22
8[2
41.0
]1
0.0%
Thr
ockm
orto
n13
4[1
8.5%
116
8[6
2.0]
Bra
zori
a15
5[8
5.61
217
[127
.2)
Bre
wst
er19
9[1
32.5
]8
5.1%
Col
lin13
8.3%
169
{62.
6]B
ell
187
{115
.8}
218
[129
.9]
Yoa
kum
205
[141
.8]
9[5
.7%
)H
artle
y32
[12.
8 %
]17
0[6
3.5)
Kau
fman
215
[174
.51
219
[134
.5)
Hun
t12
9[6
3.0)
9[5
.7%
)M
ason
134
[18.
5%)
171
{66.
4)G
uada
lupe
172
[101
.3]
220
{136
.9}
Fann
in19
0[1
19.2
]11
6.9%
Roc
kwal
l8
7.5%
172
{66.
6)D
e W
itt21
2[1
65.0
122
1{1
38.8
}T
yler
157
[86.
5]12
7.2%
Den
ton
67.
2%17
366
.8T
arra
nt16
087
.022
2{1
41.4
}Ja
ck24
8(4
68.4
113
[7.5
%]
Bla
nco
29[1
2.3
%)
174
[67.
7]L
avac
a15
4[8
5.3)
223
{148
.1}
Hut
chin
son
177
[105
.6]
147.
7%W
illia
mso
n14
8.8%
175
[67.
91Je
ffer
son
116
{48.
1)22
4{1
49.3
}Fr
eest
one
10.
015
{8.7
%}
Bri
scoe
118
[17.
9%]
176
[68.
0]U
pshu
r21
4[1
66.5
)22
5{1
50.1
]A
nder
son
193
{122
.5)
168.
7%Fo
rt B
end
1810
.2%
177
[68.
3]Sa
n Pa
tric
io1
0.0
226
{153
.8}
Bur
net
226
[214
.4]
17(1
0.0%
]Ir
ion
230
[23.
8%]
178
68.6
Dal
las
171
100.
922
7{1
54.8
}H
ill22
4{2
09.4
)18
10.1
%K
enda
ll19
10.5
%17
9[6
9.31
Scur
ry14
0{6
9.5)
228
{155
.8}
Col
eman
243
(349
.7)
19{1
0.5%
)G
lass
cock
5{7
.1%
118
0[7
0.8]
Polk
206
{143
.5)
229
{157
.2}
____
_Ref
ugio
____
____
__1_
0.0
20{1
0.7%
1C
arso
n12
(8.1
%]
181
[71.
5)W
ebb
119
[51.
2]23
0[1
59.0
]M
cCul
loch
I__
0.0
21[1
0.9%
1H
arde
man
26[1
1.7
%]
182
{72.
5)G
illes
pie
174
[104
.6]
231
[159
.21
Bos
que
179
{107
.2]
22[1
1.1%
)Je
ff D
avis
245
[26.
3%]
183
[74.
0]Y
oung
10.
023
2[1
62.1
]C
rosb
y1
0.0
23[1
1.4
%]
Sutto
n88
[16.
7%)
184
{74.
0)St
arr
136
{66.
3)23
3[1
65.7
]Fa
lls1
0.0
2411
.7%
Tra
vis
4113
.6%
185
(74.
9]A
ndre
ws
150
[82.
5)23
4[1
67.5
1H
amilt
on1
0.0
25(1
1.8%
)C
rane
112
{17.
7%}
186
[75.
0]M
onta
gue
233
[257
.3]
235
[171
.91
Lam
ar16
5{9
1.4)
25[1
1.8%
1St
erlin
g27
[12.
0%)
187
[75.
1]C
aldw
ell
184
{112
.1]
236
[185
.4]
Lim
esto
ne22
7[2
17.7
)27
11.9
%C
orye
ll56
15.2
%18
8[7
6.41
Frio
10.
023
7[1
92.9
]C
alho
un1
0.0
2812
.0%
Lee
20[1
0.7%
118
9[7
8.81
Val
Ver
de1
0.0
238
[226
.2]
Cok
e1
0.0
2912
.1%
Com
al49
14.7
%19
0[7
9.1]
Bee
169
{99.
8)23
9[2
33.1
]M
ills
10.
030
12.1
%G
alve
ston
4814
.7%
191
[79.
6]E
llis
191
[119
.51
240
(241
.0)
Step
hens
10.
031
12.2
%U
pshu
r21
923
.1%
192
[82.
41R
ober
tson
234
[271
.21
241
[242
.3]
New
ton
237
[280
.11
3212
.3%
Mon
tgom
ery
3813
.3%
193
[83.
2]Po
tter
156
[85.
9124
2[2
50.6
]L
eon
229
[242
.4]
3312
.3%
Bra
zori
a68
15.6
%19
4[8
4.31
Duv
al21
3[1
65.4
)24
3[2
67.1
]C
alla
han
10.
034
12.5
%B
razo
s42
13.7
%19
5[8
7.6)
Zap
ata
10.
024
4(3
76.8
)B
urle
son
181
[107
.4]
35{1
2.5%
)Fi
sher
100
(17.
3%1
196
[89.
61T
itus
121
[55.
2)24
5[3
80.7
)C
astr
o18
9[1
18.6
]35
{12.
5%)
Sher
man
46{1
4.3%
)
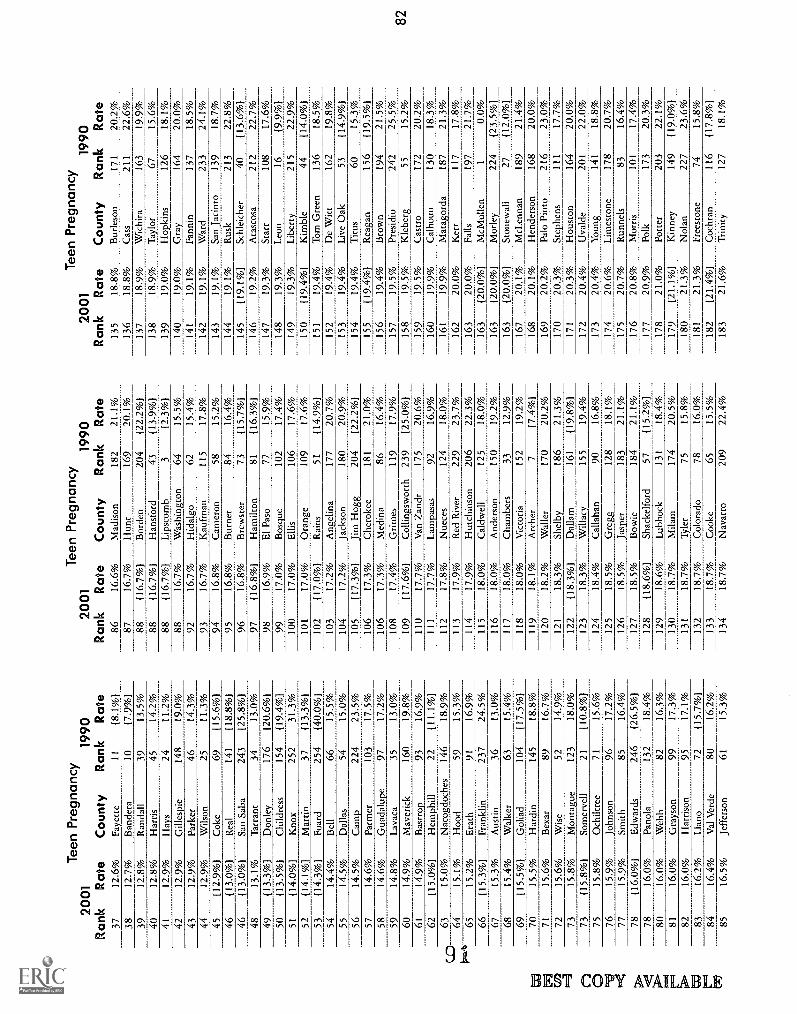
Tee
n Pr
egna
ncy
Tee
n Pr
egna
ncy
Tee
n Pr
egna
ncy
2001
1990
2001
1990
2001
1990
Rank
Rate
County
Rank
Rate
Rank
Rate
County
Rank
Rate
Rank
Rate
County
Rank
Rate
3712
.6%
Faye
tte11
[8.1
%1
8616
.6%
Mad
ison
182
21.1
%13
518
.8%
Bur
leso
n17
120
.2%
3812
.7%
Ban
dera
10[7
.9 %
]87
16.7
%H
unt
169
20.1
%13
618
.8%
Cas
s21
122
.6%
3912
.8%
Ran
dall
3913
.5%
88[1
6.7%
)B
orde
n20
4[2
2.2%
)13
718
.9%
Wic
hita
163
19.9
%40
12.8
%H
arri
s45
14.2
%88
[16.
7 %
]H
ansf
ord
43[1
3.9%
)13
818
.9%
Tay
lor
6715
.6%
4112
.9%
Hay
s24
11.2
%88
[16.
7 %
]L
ipsc
omb
3[2
.3%
)13
919
.0%
Hop
kins
126
18.1
%42
12.9
%G
illes
pie
148
19.0
%88
16.7
%W
ashi
ngto
n64
15.5
%14
019
.0%
Gra
y16
420
.0%
4312
.9%
Park
er46
14.3
%92
16.7
%H
idal
go62
15.4
%14
119
.1%
Fann
in13
718
.5%
4412
.9%
Wils
on25
11.3
%93
16.7
%K
aufm
an11
517
.8%
142
19.1
%W
ard
233
24.1
%45
[12.
9%)
Cok
e69
[15.
6 %
]94
16.8
%C
amer
on58
15.2
%14
319
.1%
San
Jaci
nto
139
18.7
%46
[13.
0 %
]R
eal
141
[18.
8 %
]95
16.8
%B
urne
t84
16.4
%14
419
.1%
Rus
k21
322
.8%
46[1
3.0%
)Sa
n Sa
ba24
3[2
5.8%
196
16.8
%B
rew
ster
73[1
5.7%
)14
5[1
9.1%
)Sc
hlei
cher
40[1
3.6%
)48
13.1
%T
arra
nt34
13.0
%97
(16.
8 %
]H
amilt
on81
(16.
3%)
146
19.2
%A
tasc
osa
212
22.7
%49
[13.
3%)
Don
ley
176
[20.
6%1
9816
.9%
El P
aso
7715
.9%
147
19.3
%St
arr
108
17.6
%50
[13.
5%]
Chi
ldre
ss15
4[1
9.4%
199
17.0
%B
osqu
e10
217
.4%
148
19.3
%L
eon
16[9
.9%
)51
[14.
0 %
]K
nox
252
31.3
%10
017
.0%
Elli
s10
617
.6%
149
19.3
%L
iber
ty21
522
.9%
52[1
4.1
%]
Mar
tin37
[13.
3%)
101
17.0
%O
rang
e10
917
.6%
150
[19.
4 %
]K
imbl
e44
[14.
0 %
]53
[14.
3%)
Foar
d25
4[4
0.0%
)10
2[1
7.0%
)R
ains
51[1
4.9%
115
119
.4%
Tom
Gre
en13
618
.5%
5414
.4%
Bel
l66
15.5
%10
317
.2%
Ang
elin
a17
720
.7%
152
19.4
%D
e W
itt16
219
.8%
5514
.5%
Dal
las
5415
.0%
104
17.2
%Ja
ckso
n18
020
.9%
153
19.4
%L
ive
Oak
53[1
4.9
%]
5614
.5%
Cam
p22
423
.5%
105
[17.
3%)
Jim
Hog
g20
4[2
2.2%
)15
419
.4%
Titu
s60
15.3
%57
14.6
%Pa
rmer
103
17.5
%10
617
.3%
Che
roke
e18
121
.0%
155
[19.
4%]
Rea
gan
156
[19.
5%]
5814
.6%
Gua
dalu
pe97
17.2
%10
617
.3%
Med
ina
8616
.4%
156
19.4
%B
row
n19
421
.5%
5914
.8%
Lav
aca
3513
.0%
108
17.4
%G
rim
es11
917
.9%
157
19.5
%Pr
esid
io24
225
.5%
6014
.9%
Mav
eric
k16
019
.8%
109
[17.
6 %
]C
ollin
gsw
orth
239
[25.
0%)
158
19.5
%K
lebe
rg55
15.2
%61
14.9
%B
astr
op93
16.9
%11
017
.7%
Van
Zan
dt17
520
.6%
159
19.5
%C
astr
o17
220
.2%
62[1
5.0
%]
Hem
phill
22[1
1.1
%]
111
17.7
%L
ampa
sas
9216
.9%
160
19.9
%C
alho
un13
018
.3%
6315
.0%
Nac
ogdo
ches
Hoo
d14
659
18.9
%15
.3%
112
17.8
%N
uece
s12
418
.0%
161
19.9
%M
atag
orda
187
117
21.3
%17
.8%
co64
15.1
%11
317
.9%
Red
Riv
er22
923
.7%
162
20.0
%K
err
V"
6515
.2%
Era
th91
16.9
%11
417
,9%
Hut
chin
son
206
22.3
%16
320
.0%
Falls
197
21.7
%66
[15.
3 %
]Fr
ankl
in23
724
.5%
115
18.0
%C
aldw
ell
125
18.0
%16
3[2
0.0
%]
McM
ulle
n1
0.0%
6715
.3%
Aus
tin36
13.0
%11
618
.0%
And
erso
n15
019
.2%
163
[20.
0 %
]M
otle
y22
4[2
3.5
%]
6815
.4%
Wal
ker
6315
.4%
117
18.0
%C
ham
bers
3312
.9%
163
[20.
0%1
Ston
ewal
l27
[12.
0 %
]
69[1
5.5%
)G
olia
d10
4[1
7.5%
)11
818
.0%
Vic
tori
a15
219
.2%
167
20.1
%M
cLen
nan
189
21.4
%70
15.5
%H
ardi
n14
518
.8%
119
18.1
%A
rche
r7
[7.4
%1
168
20.1
%H
ende
rson
168
20.0
%71
15.6
%B
exar
8916
.7%
120
18.2
%W
alle
r17
020
.2%
169
20.2
%Pa
lo P
into
216
23.0
%72
15.6
%W
ise
5214
.9%
121
18.3
%Sh
elby
186
21.3
%17
020
.3%
Step
hens
111
17.7
%73
15.8
%M
onta
gue
123
18.0
%12
2[1
8.3
%]
Dal
lam
161
[19.
8%)
171
20.3
%H
oust
on16
420
.0%
73[1
5.8
%]
Som
erve
ll21
[10.
8%)
123
18.3
%W
illac
y15
519
.4%
172
20.4
%U
vald
e20
122
.0%
7515
.8%
Och
iltre
e71
15.6
%12
418
.4%
Cal
laha
n90
16.8
%17
320
.4%
You
ng14
118
.8%
7615
.9%
John
son
9617
.2%
125
18.5
%G
regg
128
18.1
%17
420
.6%
Lim
esto
ne17
820
.7%
7715
.9%
Smith
8516
.4%
126
18.5
%Ja
sper
183
21.1
%17
520
.7%
Run
nels
8316
.4%
78[1
6.0%
1E
dwar
ds24
6[2
6.5%
)12
718
.5%
Bow
ie18
421
.1%
176
20.8
%M
orri
s10
117
.4%
7816
.0%
Pano
la13
218
.4%
128
[18.
6 %
]Sh
acke
lfor
d57
[15.
2 %
]17
720
.9%
Polk
173
20.3
%80
16.0
%W
ebb
8216
.3%
129
18.6
%L
ubbo
ck13
118
.4%
178
21.0
%Po
tter
203
22.1
%81
16.0
%G
rays
on99
17.3
%13
018
.7%
Mila
m17
420
.5%
179
[21,
1%]
Kin
ney
149
[19.
0%)
8216
.0%
Har
riso
n95
17.1
%13
118
.7%
Tyl
er75
15.8
%18
021
.3%
Nol
an22
723
.6%
8316
.2%
Lla
no72
[15.
7 %
]13
218
.7%
Col
orad
o78
16.0
%18
121
.3%
Free
ston
e74
15.8
%84
16.4
%V
al V
erde
8016
.2%
133
18.7
%C
ooke
6515
.5%
182
[21.
4%)
Coc
hran
116
(17.
8%)
8516
.5%
Jeff
erso
n61
15.3
%13
418
.7%
Nav
arro
209
22.4
%18
321
.6%
Tri
nity
127
18.1
%
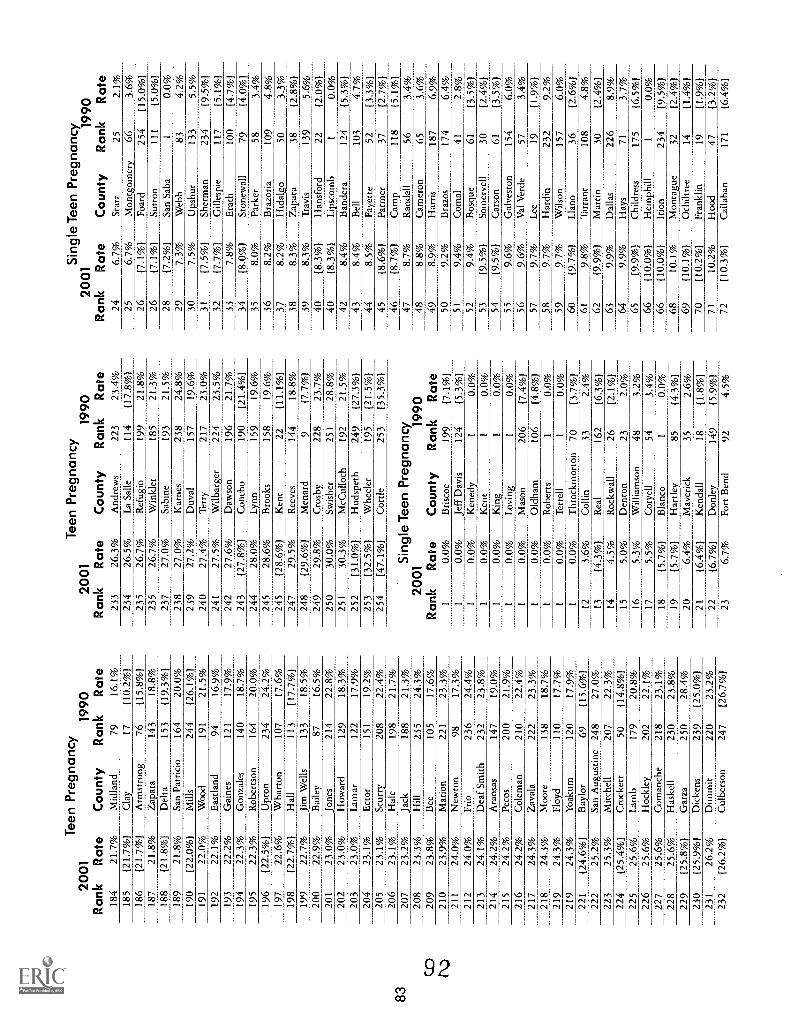
83
Tee
n P
regn
ancy
2001
1990
Rank
Rate
County
Rank
Rate
Tee
n P
regn
a nc
y20
0119
90Rank
Rate
County
Rank
Rate
Sin
gle
Tee
n P
regn
ancy
2001
1990
Rank
Rate
County
Rank
Rate
184
21.7
%M
idla
nd79
16.1
%23
326
.3%
And
rew
s22
323
.4%
246.
7%St
arr
252.
1%18
5[2
1.7%
)C
lay
17[1
0.2
%]
234
26.5
%L
a Sa
lle11
4[1
7.8%
)25
6.7%
Mon
tgom
ery
663.
6%18
6[2
1.7
%]
Arm
stro
ng76
[15.
8 %
]23
526
.7%
Ref
ugio
199
21.8
%26
[7.1
%]
254
[15.
0%1
Foar
d18
721
.8%
Zap
ata
143
18.8
%23
526
.7%
Win
kler
185
21.3
%26
[7.1
%]
Sutto
n11
1[5
.0 %
]18
8[2
1.8%
1D
elta
153
[19.
3%)
237
27.0
%Sa
bine
193
21.5
%28
[7.2
%]
San
Saba
10.
0%18
921
.8%
San
Patr
icio
164
20.0
%23
827
.0%
Kar
nes
238
24.8
%29
7.3%
Web
b83
4.2%
190
[22.
0%)
Mill
s24
4[2
6.1%
)23
927
.2%
Duv
al15
719
.6%
307.
5%U
pshu
rSh
erm
an13
35.
5%19
122
.0%
Woo
d19
121
.5%
240
27.4
%T
erry
217
23.0
%31
[7.5
%)
234
[9.5
%]
192
22.1
%E
astla
nd94
16.9
%24
127
.5%
Wilb
arge
r22
423
.5%
32[7
.7%
)G
illes
pie
117
[5.1
%]
193
22.2
%G
aine
s12
117
.9%
242
27.6
%D
awso
n19
621
.7%
337.
8%E
rath
100
[4.7
%]
194
22.3
%G
onza
les
140
18.7
%24
3[2
7.8%
)C
onch
o19
0[2
1.4
%]
34[8
.0 %
]St
onew
all
79[4
.0 %
]19
522
.3%
Rob
erts
on16
420
.0%
244
28.0
%L
ynn
159
19.6
%35
8.0%
Park
er58
3.4%
196
[22.
5 %
]U
pton
234
24.2
%24
528
.6%
Bro
oks
158
19.6
%36
8.2%
Bra
zori
a10
94.
8%19
722
.6%
Wha
rton
107
17.6
%24
5[2
8.6%
)K
ent
22[1
1.1%
137
8.2%
Hid
algo
503.
3%19
8[2
2.7
%]
Hal
l11
3[1
7.7
%]
247
29.5
%R
eeve
s14
418
.8%
388.
3%Z
apat
a38
[2.8
%]
199
22.7
%Ji
m W
ells
133
18.5
%24
8[2
9.6
%]
Men
ard
9[7
.7%
)39
8.3%
Tra
vis
139
5.6%
200
22.9
%B
aile
y87
16.5
%22
.8%
249
29.8
%C
rosb
y22
823
.7%
40[8
.3%
)H
ansf
ord
22[2
.0 %
]20
123
.0%
Jone
s21
425
030
.0%
Swis
her
251
28.8
%40
[8.3
%)
Lip
scom
b1
0.0%
202
23.0
%H
owar
d12
918
.3%
251
30.3
%M
cCul
loch
192
21.5
%42
8.4%
Ban
dera
124
[5.3
%]
203
23.0
%L
amar
122
17.9
%25
2[3
1.0%
)H
udsp
eth
249
[27.
3%)
438.
4%B
ell
103
4.7%
204
23.1
%E
ctor
151
19.2
%25
3[3
2.5
%]
Whe
eler
195
[21.
5 %
)44
8.5%
Faye
tte52
[3.3
%)
205
23.1
%Sc
urry
208
22.4
%25
4[4
7.1
%]
Cot
tle25
3[3
5.3%
145
[8.6
%]
Parm
er37
[2.7
%)
206
23.1
%H
ale
198
21.7
%S
ingl
e T
een
Pre
gnan
cy20
0119
90
46[8
.7%
)C
amp_
Ran
dall
118
(5.1
%)
207
23.2
%Ja
ck18
821
.3%
478.
7%56
3.4%
208
23.3
%H
ill23
524
.3%
488.
8%C
amer
on65
3.6%
209
23.8
%B
ee10
517
.6%
Rank
1
Rate
County
0.0%
Bri
scoe
Rank
199
Rate
[7.1
%)
498.
9%H
arri
s18
76.
9%50
9.2%
Bra
zos
174
6.4%
210
23.9
%M
ario
n22
123
.3%
211
24.0
%N
ewto
n98
17.3
%1
0.0%
Jeff
Dav
is12
4(5
.3%
)51
9.4%
Com
al41
2.8%
212
24.0
%Fr
io23
624
.4%
10.
0%K
ene_
dy1
0.0%
529.
4%B
osqu
e61
[3.5
%]
213
24.1
%D
eaf
Smith
232
23.8
%1
0.0%
Ken
t1
0.0%
53[9
.5%
1So
mer
vell
30[2
.4 %
]21
424
.2%
Ara
nsas
147
19.0
%1
0.0%
Kin
g1
0.0%
54[9
.5 %
]C
arso
n61
[3.5
%]
215
24.2
%Pe
cos
200
21.9
%1
0.0%
Lov
ing
10.
0%55
9.6%
Gal
vest
on15
46.
0%21
624
.2%
Col
eman
210
22.4
%1
0.0%
Mas
on20
6[7
.4%
)56
9.6%
Val
Ver
de57
3.4%
217
24.3
%Z
aval
a22
223
.3%
10.
0%O
ldha
m10
6[4
.8%
)57
9.7%
Lee
19(1
.9%
)21
824
.3%
Moo
re13
818
.7%
10.
0%R
ober
ts1
0.0%
589.
7%H
ardi
n23
29.
2%21
924
.3%
Floy
d11
017
.7%
10.
0%T
erre
ll1
0.0%
599.
7%W
ilson
157
6.0%
219
24.3
%Y
oaku
m12
017
.9%
1 120.
0%__
_Thr
ockm
orto
n3.
6%C
ollin
70 33[3
.7%
12.
4%60
[9.7
%]
Lla
no36
[2.6
%]
221
[24.
6 %
]B
aylo
r69
[15.
6 %
]61
9.8%
Tar
rant
108
4.8%
222
25.2
%Sa
n A
ugus
tine
248
27.0
%13
-
(4.3
%)
Rea
l16
2[6
.3%
)62
[9.9
%)
Mar
tin30
[2.4
%]
223
25.3
%M
itche
ll20
722
.3%
144.
5%R
ockw
all
26[2
.1%
163
9.9%
Dal
las
226
8.9%
224
[25.
4 %
]C
rock
ett
50[1
4.8
%]
155.
0%D
ento
n23
2.0%
649.
9%H
ays
713.
7%22
525
.6%
Lam
b17
920
.8%
165.
3%W
illia
mso
n48
3.2%
65 66(9
.9%
]_[1
0.0%
1C
hild
ress
Hem
phill
175
[6.5
%]
10.
0%22
625
.6%
Hoc
kley
202
22.1
%17
5.5%
_C
orye
ll54
227
I ri
on[9
.5 %
)25
.6%
Com
anch
e21
823
.1%
18_
____
_3.4
%_
J5.7
%)
Bla
nco_
_ 1_
__0.
0%_
66[1
0.0
%]
234
228
25.6
%H
aske
ll23
023
.8%
19[5
.7%
)H
artle
y85
[4.3
%1
6810
.1%
Mon
tagu
e32
[2.4
%]
229
[25.
8 %
]G
arza
250
28.4
%20
6.4%
Mav
eric
k35
2.6%
69[1
0.1
%]
Och
iltre
e14
[1.4
%)
230
[25.
9 %
]D
icke
ns23
9[2
5.0%
)21
[6.4
%]
Ken
dall
18[1
.8%
]70
[10.
2%)
Fran
klin
19[1
.9%
)23
126
.2%
Dim
mit
220
23.2
%22
[6.7
%]
Don
ley
149
[5.9
%)
7110
.2%
Hoo
d47
[3.2
%]
232
[26.
2 %
]C
ulbe
rson
247
[26.
7 %
)23
6.7%
Fort
Ben
d92
4.5%
72[1
0.3
%]
Cal
laha
n17
1[6
.4%
)
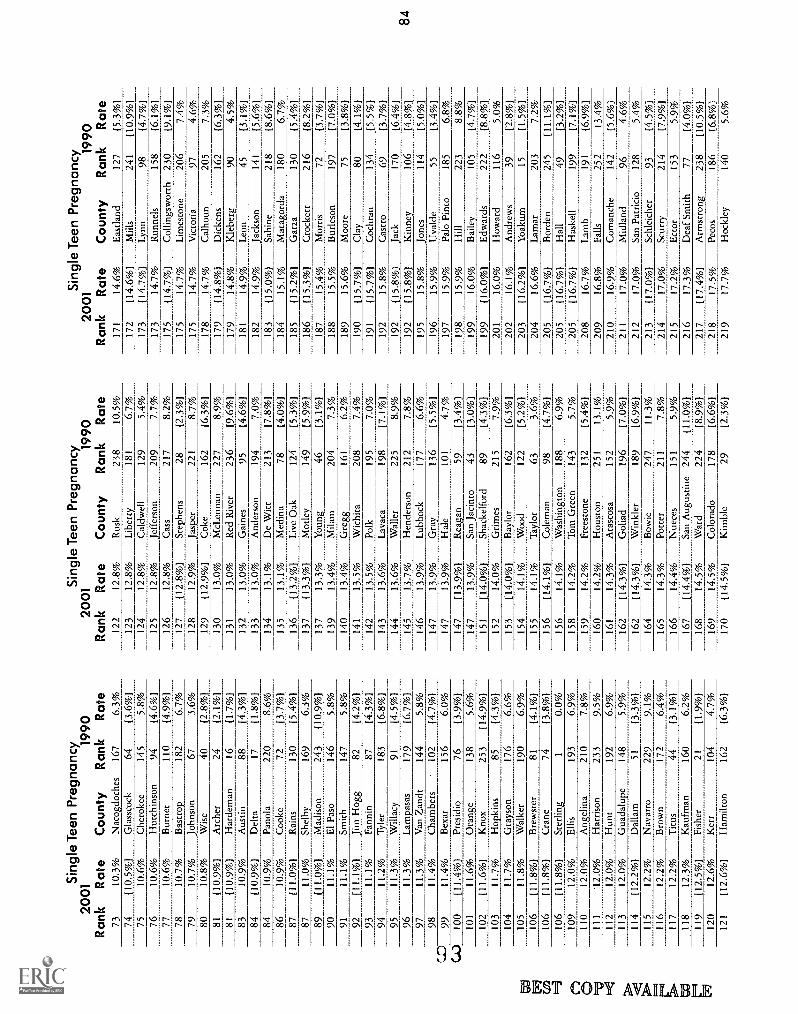
Sin
gle
Tee
n P
regn
ancy
2001
1990
Ran
kR
ate
Cou
nty
Ran
kR
ate
Sin
gle
Tee
n P
regn
ancy
2001
1990
Ran
kR
ate
Cou
nty
Ran
kR
ate
Sin
gle
Tee
n P
regn
ancy
2001
1990
Ran
kR
ate
Cou
nty
Ran
kR
ate
7310
.3%
Nac
ogdo
ches
167
6.3%
122
12.8
%R
usk
238
10.5
%17
114
.6%
Eas
tland
127
[5.3
%]
74{1
0.5%
)G
lass
cock
64{3
.6%
112
3___
_12.
8%L
iber
ty18
16.
7%17
2[1
4.6%
1M
ills
241
{10.
9%1
7510
.6%
Che
roke
e14
55.
8%12
412
.8%
Cal
dwel
l12
95.
4%17
3[1
4.7%
1L
ynn
98[4
.7%
]76
10.6
%H
utch
inso
n94
{4.6
%1
125
12.8
%Je
ffer
son
209
7.7%
173
14.7
%R
unne
ls15
8[6
.1 %
]77
10.6
%B
urne
t11
0(4
.9 %
]12
612
.8%
Cas
s21
78.
2%17
5[1
4.7%
)C
ollin
gsw
orth
230
(9.1
%)
7810
.7%
Bas
trop
182
6.7%
127
[12.
8 %
)St
ephe
ns28
{2.3
%1
175
14.7
%L
imes
tone
206
7.4%
7910
.7%
John
son
673.
6%12
812
.9%
Jasp
er22
18.
7%17
514
.7%
Vic
tori
a97
4.6%
8010
.8%
Wis
e40
[2.8
%1
129
[12.
9%)
Cok
e16
2[6
.3 %
]17
814
.7%
Cal
houn
205
7.3%
81{1
0.9%
)A
rche
r24
[2.1
%1
130
13.0
%M
cLen
nan
227
8.9%
179
{14.
8%)
Dic
kens
162
[6.3
%]
81{1
0.9%
1H
arde
man
16(1
.7%
113
113
.0%
Red
Riv
er23
6[9
.6%
117
914
.8%
Kle
berg
904.
5%83
10.9
%A
ustin
88{4
.3%
113
213
.0%
Gai
nes
95[4
.6%
118
114
.9%
Leo
n45
[3.1
%]
84[1
0.9%
1D
elta
17[1
.8%
)13
313
.0%
And
erso
n19
47.
0%18
214
.9%
Jack
son
141
[5.6
%1
8410
.9%
Pano
la22
08.
6%13
413
.1%
De
Witt
213
[7.8
%]
183
{15.
0%1
Sabi
ne21
8(8
.6%
186
10.9
%C
ooke
72[3
.7%
)13
513
.1%
Med
ina
78(4
.0%
)18
415
.1%
Mat
agor
da18
06.
7%87
[11.
0%1
Rai
ns13
0{5
.4%
)13
6[1
3.2
%]
Liv
e O
ak12
4[5
.3%
118
5[1
5.2%
)G
arza
130
(5.4
%)
8711
.0%
Shel
by16
96.
3%13
7{1
3.3%
1M
otle
y14
9[5
.9%
118
6{1
5.3%
)C
rock
ett
216
(8.2
%1
89[1
1.0%
1M
adis
on24
3[1
0.9%
)13
713
.3%
You
ng46
[3.1
%1
187
15.4
%M
orri
s72
[3.7
%1
9011
.1%
El P
aso
146
5.8%
139
13.4
%M
ilam
204
7.3%
188
15.5
%B
urle
son
197
[7.0
%)
9111
.1%
Smith
147
5.8%
140
13.4
%G
regg
161
6.2%
189
15.6
%M
oore
75[3
.8%
)92
{11.
1%1
Jim
Hog
g82
[4.2
%1
141
13.5
%W
ichi
ta20
87.
4%19
0[1
5.7%
1C
lay
80[4
.1%
)93
11.1
%Fa
nnin
87[4
.3%
114
213
.5%
Polk
195
7.0%
191
[15.
7%1
Coc
hran
134
{5.5
%1
9411
.2%
Tyl
er18
3[6
.8%
114
313
.6%
Lav
aca
198
{7.1
%1
192
15.8
%C
astr
o69
[3.7
%)
9511
.3%
Will
acy
91[4
.5 %
]14
413
.6%
Wal
ler
225
8.9%
192
[15.
8 %
]Ja
ck17
0[6
.4%
)96
11.3
%L
ampa
sas
179
(6.7
%1
145
13.7
%H
ende
rson
212
7.8%
192
{15.
8%1
Kin
ney
106
[4.8
%)
9711
.3%
Van
Zan
dt14
45.
8%14
613
.9%
Lub
bock
177
6.6%
195
15.8
%Jo
nes
114
[5.0
%)
9811
.4%
Cha
mbe
rs10
24.
7%1
147
13.9
%G
ray
136
{5.5
%1
196
15.9
%U
vald
e55
[3.4
%)
CZ
9911
.4%
Bex
ar15
66.
0%14
713
.9%
Hal
e10
14.
7%19
715
.9%
Palo
Pin
to18
56.
8%C
A)
100
{11.
4%)
Pres
idio
76{3
.9%
)14
7[1
3.9%
1R
eaga
n59
[3.4
%1
198
15.9
%H
ill22
38.
8%10
111
.6%
Ora
nge
138
5.6%
147
13.9
%Sa
n Ja
cint
o43
{3.0
%1
199
16.0
%B
aile
y10
5[4
.7%
)10
2[1
1.6%
)K
nox
253
{14.
9%)
151
[14.
0%1
Shac
kelf
ord
89{4
.3%
)19
9[1
6.0%
1E
dwar
ds22
2[8
.8%
)10
311
.7%
H2p
kins
85{4
.3%
)15
214
.0%
Gri
mes
215
7.9%
201
16.0
%H
owar
d11
65.
0%10
411
.7%
Gra
yson
176
6.6%
153
[14.
0%1
Bay
lor
162
{6.3
%)
202
16.1
%A
ndre
ws
39(2
.8%
)10
511
.8%
Wal
ker
190
6.9%
154
14.1
%W
ood
122
{5.2
%)
203
[16.
2%1
Yoa
kum
15[1
.5%
110
6[1
1.8%
]B
rew
ster
81{4
.1%
)15
514
.1%
Tay
lor
633.
6%20
416
.6%
Lam
ar20
37.
2%10
6[
11.8
%]
Cra
ne74
{3.8
%1
156
[14.
1%1
Col
eman
98{4
.7%
)20
5{1
6.7%
1B
orde
n24
5[1
1.1%
)10
6(1
1.8%
1St
erlin
g1
0.0%
156
14.1
%W
ashi
ngto
n18
86.
9%20
5[1
6.7%
]H
all
49[3
.2%
)10
912
.0%
Elli
s19
36.
9%15
814
.2%
Tom
Gre
en14
35.
7%20
5{1
6.7%
1H
aske
ll19
9[7
.1%
)11
012
.0%
Ang
elin
a21
07.
8%15
914
.2%
Free
ston
e13
2[5
.4 %
]20
816
.7%
Lam
b19
1[6
.9 %
)11
112
.0%
Har
riso
n23
39.
5%16
014
.2%
Hou
ston
251
13.1
%20
916
.8%
Falls
252
13.4
%11
212
.0%
Hun
t19
26.
9%16
114
.3%
Ata
scos
a15
25.
9%21
016
.9%
Com
anch
e14
2[5
.6 %
)11
312
.0%
Gua
dalu
pe14
85.
9%16
2{1
4.3%
)G
olia
d19
6[7
.0 %
]21
117
.0%
Mid
land
964.
6%11
4{1
2.2%
)D
alla
m51
[3.3
%]
162
{14.
3%1
Win
kler
189
[6.9
%]
212
17.0
%Sa
n Pa
tric
io12
85.
4%11
512
.2%
Nav
arro
229
9.1%
164
14.3
%B
owie
247
11.3
%21
3{1
7.0%
1Sc
hlei
cher
93[4
.5%
)11
612
.2%
Bro
wn
172
6.4%
165
14.3
%Po
tter
211
7.8%
214
17.0
%Sc
urry
214
[7.9
%)
117
12.2
%T
itus
44[3
.1%
)16
614
.4%
Nue
ces
151
5.9%
215
17.2
%E
ctor
317
57
5.9%
118
12.3
%K
aufm
an16
06.
2%16
7[1
4.4%
1Sa
n A
ugus
tine
244
{11.
0%)
216
17.3
%D
eaf
Smith
[4.0
%)
119
[12.
5%)
Fish
er21
[1.9
%]
168
14.5
%W
ard
224
[8.9
%]
217
{17.
4%)
Arm
stro
ng23
8[1
0.5%
)12
012
.6%
Ker
r10
44.
7%16
914
.5%
Col
orad
o17
8[6
.6%
121
817
.5%
Peco
s18
6[6
.8 %
)12
1[1
2.6%
)H
amilt
on16
2[6
.3 %
]17
0[1
4.5%
)K
imbl
e29
[2.3
%)
219
17.7
%H
ockl
ey14
05.
6%
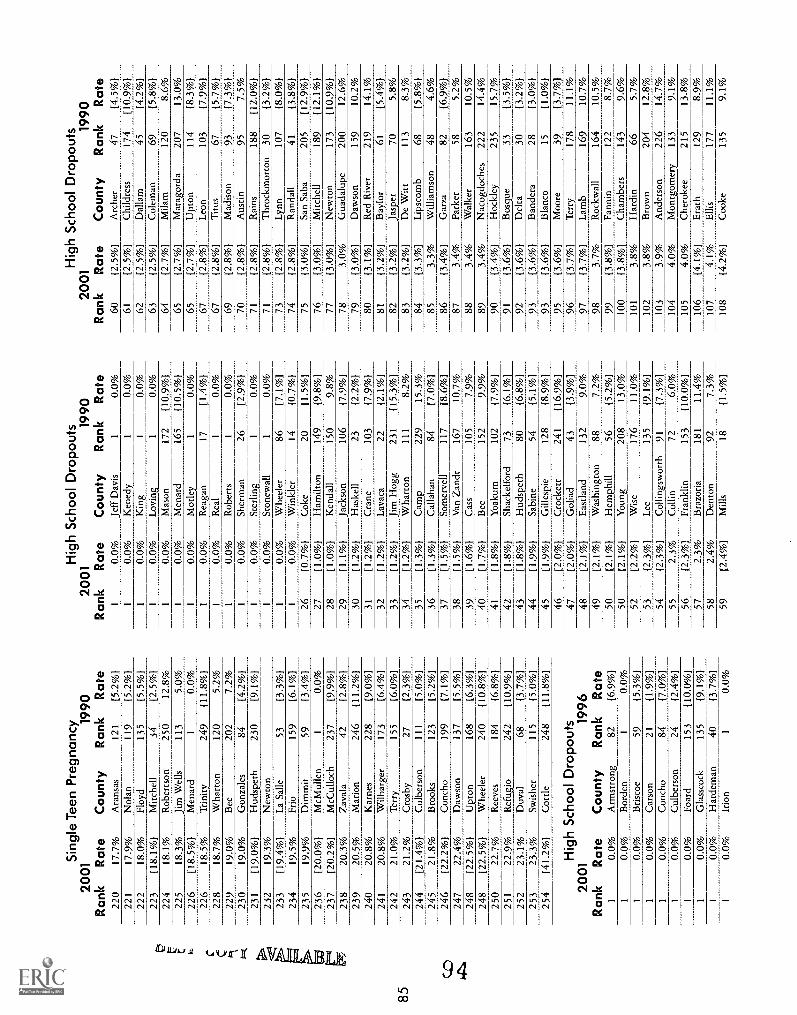
Sin
gle
Tee
n P
regn
ancy
Hig
h S
choo
l Dro
pout
sH
igh
Sch
ool D
ropo
uts
2001
Rank
Rate
County
1990
Rank
Rate
2001
Rank
Rate
County
1990
Rank
Rate
2001
Rank
Rate
County
1990
Rank
Rate
220
17.7
%A
rans
as12
1(5
.2%
)1
0.0%
Jeff
Dav
is1
0.0%
60[2
.5%
1A
rche
r47
(4.5
%1
221
17.9
%N
olan
119
(5.2
%)
10.
0%K
ened
y1
0.0%
61[2
.5%
]C
hild
ress
174
(10.
9%1
222
18.0
%Fl
oyd
135
[5.5
%]
10.
0%K
ing
10.
0%62
[2.5
%1
Dal
lam
45(4
.2%
)22
3(1
8.1%
]M
itche
ll34
(2.5
%1
10.
0%L
ovin
g1
0.0%
63[2
.5%
1C
olem
an69
(5.8
%1
224
18.1
%R
ober
tson
250
12.8
%1
0.0%
Mas
on7
1162
5(r
110
0:95
:164
(2.7
%]
Mila
m12
08.
6%
C22
518
.3%
Jim
Wel
ls11
35.
0%1
0.0%
Men
ard
65(2
.7 %
)M
atag
orda
207
13.0
%22
6(1
8.5
%]
Men
ard
10.
0%1
0.0%
Mot
ley
10.
0%65
[2.7
%1
Upt
on11
4[8
.3%
)22
618
.5%
Tri
nity
249
(11.
8%1
10.
0%R
eaga
n17
[1.4
%1
67[2
.8%
)L
eon
103
[7.9
%]
C22
818
.7%
Wha
rton
120
5.2%
1 1
0.0%
0.0%
Rea
lR
ober
ts1 1
0.0%
0.0%
67[2
.8%
1T
itus
67[5
.7 %
]22
919
.0%
Bee
202
7.2%
69[2
.8%
]M
adis
on93
[7.3
%]
230
19.0
%G
onza
les
84[4
.2%
11
0.0%
Sher
man
26[2
.9 %
]70
(2.8
%]
Aus
tin95
7.5%
231
[19.
0%1
Hud
spet
h23
0[9
.1%
11
0.0%
Ster
ling
10.
0%71
[2.8
%]
Rai
ns18
8[1
2.0%
123
219
.3%
New
ton
10.
0%St
onew
all
10.
0%71
(2.8
%]
Thr
ockm
orto
n30
[3.2
%]
233
[19.
4%]
La
Salle
53[3
.3%
11
0.0%
Whe
eler
86[7
.1%
173
[2.8
%]
Lyn
n10
7(8
.0 %
]23
419
.5%
Frio
159
[6.1
%1
10.
0%W
inkl
er14
[0.7
%]
74[2
.8 %
]R
anda
ll41
[3.8
%]
235
19.9
%D
imm
it59
(3.4
%1
26[0
.7%
]C
oke
20[1
.5 %
]75
[3.0
%]
San
Saba
205
[12.
9 %
]23
6[2
0.0%
1M
cMul
len
10.
0%27
(1.0
%1
Ham
ilton
149
[9.8
%]
76(3
.0%
)M
itche
ll18
9[1
2.1%
123
7[2
0.2
%]
McC
ullo
ch23
7[9
.9%
128
(1.0
%)
Ken
dall
150
9.8%
77[3
.0%
)N
ewto
n17
3[1
0.9
%]
238
20.3
%Z
aval
a42
[2.8
%1
29[1
.1%
1Ja
ckso
n10
6[7
.9 %
]78
3.0%
Gua
dalu
pe20
012
.6%
239
20.5
%M
ario
n24
6[1
1.2%
130
[1.2
%1
Has
kell
23[2
.2%
179
[3.0
%]
Daw
son
159
10.2
%24
020
.8%
Kar
nes
228
[9.0
%1
31[1
.2%
1C
rane
103
[7.9
%1
80(3
.1%
)R
ed R
iver
219
14.1
%24
120
.8%
Wilb
arge
r17
3[6
.4%
132
[1.2
%1
Lav
aca
22[2
.1 %
]81
(3.2
%)
Bay
lor
61[5
.4%
124
221
.0%
Ter
ry_
155
[6.0
%1
33(1
.2%
1Ji
m H
ogg
231
[15.
3%]
82(3
.2%
1Ja
sper
705.
8%24
321
.2%
Cro
sby
27[2
.3%
)34
(1.2
%1
Wha
rton
111
8.2%
83(3
.2 %
]D
e W
itt11
38.
3%24
4[2
1.4
%]
Cul
bers
on11
1[5
.0 %
]35
[1.3
%1
Cam
p22
915
.3%
84[3
.3%
1L
ipsc
omb
68[5
.8%
124
521
.8%
Bro
oks
123
[5.2
%1
36[1
.3%
1C
alla
han
84[7
.0 %
]85
3.3%
Will
iam
son
484.
6%24
6[2
2.2
%]
Con
cho
199
[7.1
%)
37[1
.5%
]So
mer
vell
117
[8.6
%]
86(3
.4%
1G
arza
82[6
.9%
124
722
.4%
Daw
son
137
[5.5
%1
38[1
.5%
1V
an Z
andt
167
10.7
%87
3.4%
Park
er58
5.2%
248
[22.
5%)
Upt
on16
8[6
.3%
139
[1.6
%1
Cas
s10
57.
9%88
3.4%
Wal
ker
163
10.5
%24
8[2
2.5
%]
Whe
eler
240
[10.
8 %
]40
[1.7
%1
Bee
152
9.9%
893.
4%N
acog
doch
es22
214
.4%
250
22.7
%R
eeve
s18
4[6
.8%
141
(1.8
%]
Yoa
kum
102
[7.9
%1
90[3
.4%
1H
ockl
ey23
515
.7%
251
22.9
%R
efug
io24
2[1
0.9
%]
42(1
.8%
1Sh
acke
lfor
d73
[6.1
%)
91(3
.6 %
]B
osqu
e33
[3.5
%1
252
23.1
%D
uval
68[3
.7 %
]43
[1.8
%1
Hud
spet
h80
[6.8
%]
92(3
.6 %
]D
elta
30[3
.2%
125
323
.3%
Swis
her
115
(5.0
%]
44[1
.9%
1Sa
bine
54(5
.1%
)93
(3.6
%]
Ban
dera
28[3
.0%
)25
4[4
1.2%
)C
ottle
248
[11.
8%1
45[1
.9%
)G
illes
pie
128
[8.9
%)
93[3
.6 %
]B
lanc
o15
[1.0
%1
46(2
.0 %
)C
rock
ett
241
(16.
9%)
95[3
.6%
)M
oore
39(3
.7 %
]H
igh
Sch
ool D
ropo
uts
47[2
.0%
)G
olia
d43
[3.9
%]
96[3
.7%
1T
erry
178
11.1
%20
011996
48[2
.1 %
]E
astla
nd13
29.
0%97
(3.7
%1
Lam
b16
910
.7%
Rank
Rate
County
Rank
Rate
49[2
.1%
1W
ashi
ngto
n88
7.2%
983.
7%R
ockw
all
164
10.5
%
10.
0%A
rmst
rong
82(6
.9 %
]50
[2.1
%)
Hem
phill
56[5
.2%
199
[3.8
%]
Fann
in12
28.
7%
10.
0%B
orde
n1
0.0%
50[2
.1%
)Y
oung
208
13.0
%10
0[3
.8%
1C
ham
bers
143
9.6%
10.
0%B
risc
oe59
(5.3
%)
52[2
.2%
1W
ise
176
11.0
%10
13.
8%H
ardi
n66
5.7%
10.
0%C
arso
n21
[1.9
%]
53[2
.3 %
]L
ee13
5[9
.1%
110
23.
8%B
row
n20
412
.8%
10.
0%C
onch
o84
(7.0
%]
54[2
.3%
)C
ollin
gsw
orth
91(7
.3%
110
33.
9%A
nder
son
226
14.7
%
10.
0%C
ulbe
rson
24(2
.4%
155
2.3%
Col
lin72
6.0%
104
4.0%
Mon
tgom
ery
133
9.1%
10.
0%Fo
ard
153
(10.
0%)
56[2
.3 %
]Fr
ankl
in15
3[1
0.0%
]10
_5__
_4.
0%C
hero
kee
215
13.8
%_
10.
0%G
lass
cock
135
(9.1
%1
572.
3%B
razo
ria
181
11.4
%10
6(4
.1 %
)E
rath
129
8.9%
10.
0%H
arde
man
40[3
.7%
158
2.4%
Den
ton
927.
3%__
_10
74.
1%E
llis
177
11.1
%
10.
0%Ir
ion
10.
0%59
{2.4
%)
Mill
s18
[1.5
%]
108
[4.2
%1
Coo
ke13
59.
1%
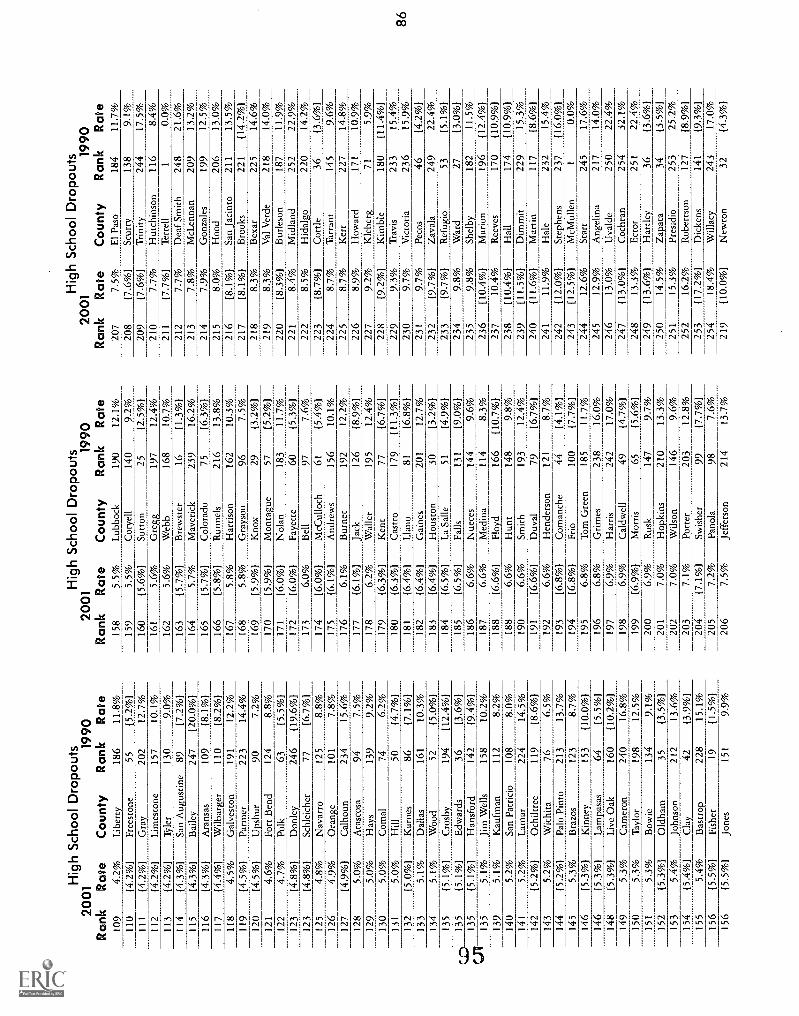
Hig
h S
choo
l Dro
pout
s20
011990
Rank
Rate
County
Rank
Rate
Hig
h S
choo
l Dro
pout
s20
011990
Rank
Rate
County
Rank
Rate
Hig
h S
choo
l Dro
pout
s20
011990
Rank
Rate
County
Rank
Rate
109
4.2%
Lib
erty
186
11.8
%15
85.
5%L
ubbo
ck19
012
.1%
207
7.5%
El P
aso
184
11.7
%11
0[4
.2%
)Fr
eest
one
55{5
.2%
}15
95.
5%C
orye
ll14
09.
2%20
8[7
.6%
)Sc
urry
138
9.1%
111
[4.2
%]
Gra
y20
212
.7%
160
[5.6
%]
Sutto
n25
{2.5
%}
209
[7.6
%)
Tri
nity
244
17.5
%
112
[4.2
%]
Lim
esto
ne15
710
.1%
161
5.6%
Gre
gg19
712
.4%
210
7.7%
Hut
chin
son
116
8.4%
113
[4.2
%]
Tyl
er13
09.
0%16
25.
6%W
ebb
168
10.7
%21
1[7
.7%
1T
erre
ll1
0.0%
114
[4.3
%1
San
Aug
ustin
e89
(7.2
%)
163
[5.7
%)
Bre
wst
er16
[1.3
%)
212
7.7%
Dea
f Sm
ith24
821
.6%
115
[4.3
%1
Bai
ley
247
[20.
0 %
]16
45.
7%M
aver
ick
239
16.2
%21
37.
8%M
cLen
nan
209
13.2
%11
6[4
.3%
1A
rans
as10
9[8
.1 %
]16
5[5
.7 %
]C
olor
ado
75[6
.3 %
]21
47.
9%G
onza
les
199
12.5
%11
7[4
.4%
1W
ilbar
ger
110
[8.2
%]
166
[5.8
%1
Run
nels
216
13.8
%21
58.
0%H
ood
206
13.0
%11
84.
5%G
alve
ston
191
12.2
%16
75.
8%H
arri
son
162
10.3
%21
6[8
.1%
]Sa
n Ja
cint
o21
113
.5%
119
[4.5
%)
Parm
er22
314
.4%
168
5.8%
Gra
yson
967.
5%21
7[8
.1 %
]B
rook
s22
1[1
4.2%
1
120
[4.5
%)
Up_
shur
907.
2%16
9[5
.9 %
]K
nox
29[3
.2 %
)21
88.
3%B
exar
225
14.6
%12
14.
6%Fo
rt B
end
124
8.8%
170
[5.9
%]
Mon
tagu
e57
[5.2
%)
219
8.3%
Val
Ver
de21
814
.0%
122
4.7%
Polk
63[5
.5 %
]17
1[6
.0%
)N
olan
183
11.7
%22
0[8
.3%
1B
urle
son
187
11.9
%12
3[4
.8 %
]D
onle
y24
6(1
9.6%
117
2(6
.0%
1Fa
yette
600.
3%1
221
8.4%
Mid
land
252
22.9
%12
3[4
.8%
)Sc
hlei
cher
77[6
.7 %
]17
36.
0%B
ell
977.
6%22
28.
5%H
idal
go22
014
.2%
125
4.N
avar
ro12
58.
8%17
4[6
.0 %
]M
cCul
loch
61[5
.4%
122
3[8
.7%
)C
ottle
36[3
.6 %
]
126
4.9%
Ora
nge
101
7.8%
175
[6.1
%1
And
rew
s15
610
.1%
224
8.7%
Tar
rant
145
9.6%
127
[4.9
%)
Cal
houn
234
15.6
%17
66.
1%B
urne
t19
212
.2%
225
8.7%
Ker
r22
714
.8%
128
5.0%
Ata
scos
a94
7.5%
177
[6.1
%]
Jack
126
[8.9
%)
226
8.9%
How
ard
171
10.9
%12
95.
0%H
ays
139
9.2%
178
6.2%
Wal
ler
195
12.4
%22
79.
2%K
lebe
rg71
5.9%
130
5.0%
Com
al74
6.2%
179
[6.3
%]
Ken
t77
[6.7
%]
228
[9.2
%)
Kim
ble
180
[11.
4 %
]
131
5.0%
Hill
50[4
.7%
]18
0[6
.3 %
]C
astr
o17
9[1
1.3
%]
229
9.3%
Tra
vis
233
15.4
%13
2[5
.0 %
]K
arne
s86
[7.1
%)
181
[6.4
%]
Lla
no81
[6.8
%]
230
9.7%
Vic
tori
a23
615
.9%
133
5.1%
Dal
las
161
10.3
%18
2[6
.4%
1G
aine
s20
112
.7%
231
9.7%
Peco
s46
[4.2
%)
134
5.1%
Woo
d52
[5.0
%)
183
[6.4
%1
Hou
ston
30[3
.2%
)23
2[9
.7%
1Z
aval
a24
922
.4%
135
[5.1
%)
Cro
sby
194
[12.
4 %
]18
4[6
.5%
1L
a Sa
lle51
[4.9
%]
233
[9.7
%]
Ref
ugio
53[5
.1 %
]
C.S
)13
5[5
.1 %
]E
dwar
ds36
[3.6
%)
185
[6.5
%)
Falls
131
[9.0
%]
234
9.8%
War
d27
[3.0
%)
135
[5 .1
%)
Han
sfor
d14
2[9
.4 %
]18
618
76.
6%6.
6%N
uece
sM
edin
a14
411
49.
6%23
523
69.
8%[1
0.4%
)Sh
elby
Shel
byM
ario
n18
219
611
.5%
[12.
4%1
CA
135
5.1%
Jim
Wel
ls15
810
.2%
8.3%
139
5.1%
Kau
fman
112
8.2%
188
[6.6
%]
Floy
d16
6[1
0.7%
123
710
.4%
Ree
ves
170
[10.
9%)
140
5.2%
San
Part
ici°
108
8.0%
188
6.6%
Hun
t14
89.
8%23
8[1
0.4%
)H
all
174
[10.
9%)
141
5.2%
Lam
ar22
414
.5%
190
6.6%
Smith
193
12.4
%23
9[1
1.5
%]
Dim
mit
229
15.3
%14
2[5
.2 %
]O
chilt
ree
119
[8.6
%]
191
[6.6
%1
Duv
al79
[6.7
%)
240
[11.
6%)
Mar
tin11
7[8
.6 %
]
143
5.2%
Wic
hita
766.
5%19
26.
6%H
ende
rson
121
8.7%
241
11.9
%H
ale
232
15.4
%14
4[5
.2%
)Pa
lo P
into
213
13.7
%19
3[6
.8%
)C
oman
che
44[4
.1%
]24
2[1
2.0
%}
Step
hens
237
[16.
0 %
]
145
5.3%
Bra
zos
123
8.7%
194
[6.8
%)
Frio
100
[7.7
%)
243
[12.
5%1
McM
ulle
n1
0.0%
146
[5.3
%1
Kin
ney
153
[10.
0%1
195
6.8%
Tom
Gre
en18
511
.7%
244
12.6
%St
arr
245
17.6
%14
6[5
.3%
)L
ampa
sas
64[5
.5%
119
66.
8%G
rim
es23
816
.0%
r24
512
.9%
Ang
elin
a21
714
.0%
148
[5.3
%1
Liv
e O
ak16
0[1
0.2%
]19
76.
9%H
arri
s24
217
.0%
246
13.0
%U
vald
e25
022
.4%
149
5.3%
Cam
eron
240
16.8
%19
86.
9%C
aldw
ell
49[4
.7 %
]24
7[1
3.0%
1C
ochr
an25
432
.1%
150
5.3%
Tay
lor
198
12.5
%19
9[6
.9%
1M
orri
s65
[5.6
%)
248
13.3
%E
ctor
251
22.4
%15
15.
3%B
owie
134
9.1%
200
6.9%
Rus
k14
79.
7%24
9[1
3.6%
1H
artle
y_36
[3.6
%)
152
[5.3
%)
Old
ham
35[3
.5 %
]20
17.
0%H
opki
ns21
013
.3%
250
14.5
%Z
apat
a34
[3.5
%)
153
5.4%
John
son
212
13.6
%20
27.
0%W
ilson
146
9.6%
251
15.3
%Pr
esid
io25
325
.2%
154
[5.4
%]
Cla
y42
{3.9
%}
203
7.1%
Potte
r20
312
.8%
252
16.2
%R
ober
tson
127
(8.9
%)
155
5.4%
Bas
trop
228
15.1
%20
4[7
.1 %
]Sw
ishe
r99
[7.7
%]
253
[17.
2%)
Dic
kens
141
[9.3
%)
156
[5.5
%]
Fish
er19
[1.5
%]
205
7.2%
Pano
la98
7.6%
254
18.4
%W
illac
y24
317
.0%
156
[5.5
%]
Jone
s15
19.
9%20
67.
5%Je
ffer
son
214
13.7
%21
9[1
0.0
%]
New
ton
32[4
.3%
)
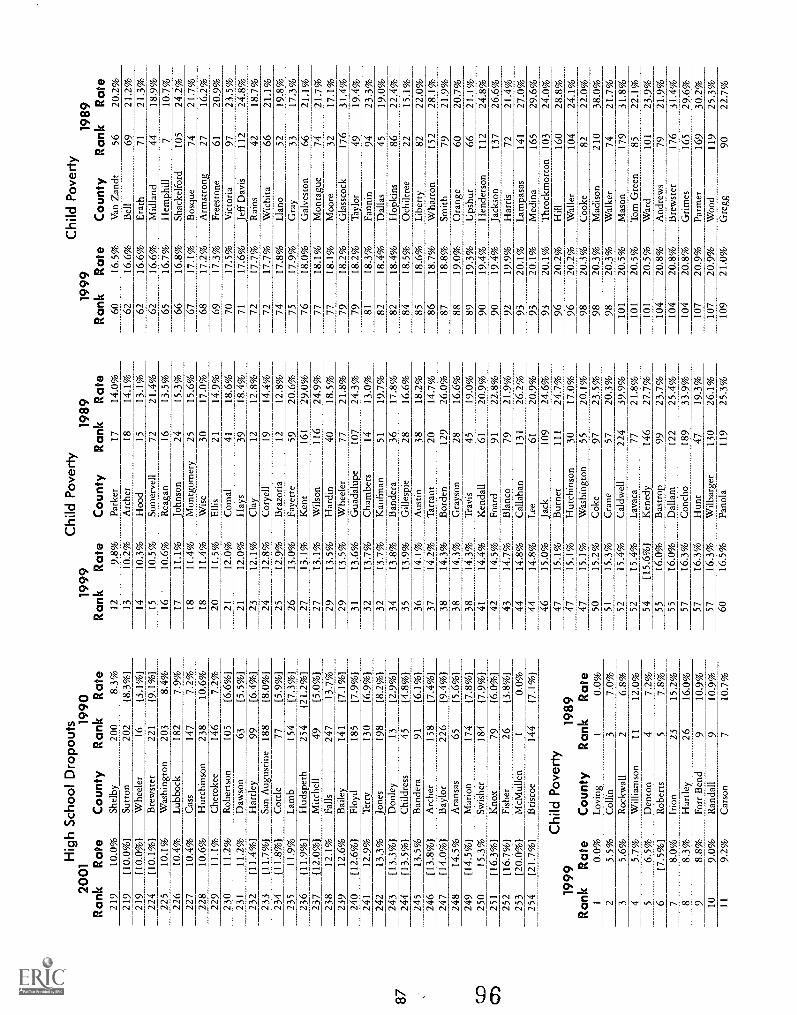
Hig
h S
choo
l Dro
pout
s20
0119
90Rank
Rate
County
Rank
Rate
Chi
ld P
over
ty19
99Rank
Rate
County
1989
Ran
kRate
1999
Rank
Rate
Chi
ld P
over
ty
County
1989
Ran
kRate
219
10.0
%Sh
elby
200
8.3%
129.
8%Pa
rker
1714
.0%
6016
.5%
Van
Zan
dt56
20.2
%21
9[1
0.0%
)Su
tton
202
[8.3
%)
1310
.2%
Arc
her
1814
.1%
6216
.6%
Bel
l69
21.2
%21
9[1
0.0%
1W
heel
er16
(3.1
%)
1410
.3%
Hoo
d15
13.1
%62
16.6
%E
rath
7121
.3%
224
[10.
1%1
Bre
wst
er22
1[9
.1%
]15
10.5
%So
mer
vell
7221
.4%
6216
.6%
Mid
land
4418
.9%
225
10.1
%W
ashi
ngto
n20
38.
4%16
10.6
%R
eaga
n16
13.5
%65
16.7
%H
emph
ill7
10.7
%22
610
.4%
Lub
bock
182
7.9%
1711
.1%
John
son
2415
.3%
6616
.8%
Shac
kelf
ord
105
24.2
%22
710
.4%
Cas
s14
77.
2%18
11.4
%M
ontg
omer
y25
15.6
%67
17.1
%B
osqu
e74
21.7
%22
810
.6%
Hut
chin
son
238
10.6
%18
11.4
%W
ise
3017
.0%
6817
.2%
Arm
stro
ng27
16.2
%22
911
.1%
Che
roke
e14
67.
2%20
11.5
%E
llis
2114
.9%
6917
.3%
Free
ston
e61
20.9
%23
011
.2%
Rob
erts
on10
5[6
.6%
)21
12.0
%C
omal
4118
.6%
7017
.5%
Vic
tori
a97
23.5
%23
111
.2%
Daw
son
63[5
.5%
)21
12.0
%H
ays
3918
.4%
7117
.6%
Jeff
Dav
is11
224
.8%
232
[11.
4 %
]H
artle
y99
[6.4
%)
2312
.1%
Cla
y12
12.8
%72
17.7
%R
ains
4218
.7%
233
[11.
7%)
San
Aug
ustin
e18
8[8
.0 %
]24
12.8
%C
orye
ll19
14.4
%72
17.7
%W
ichi
ta66
21.1
%23
4[1
1.8%
)C
ottle
[5.9
%]
2512
.9%
Bra
zori
a12
12.8
%74
17.8
%L
lano
5219
.8%
235
11.9
%L
amb
154
[7.3
%1
2613
.0%
Faye
tte59
20.6
%75
17.9
%G
ray
3317
.3%
236
11.9
%)
Hud
spet
h25
4[2
1.2%
)27
13.1
%K
ent
161
29.0
%76
18.0
%G
alve
ston
6621
.1%
237
[12.
0%)
Mitc
hell
49[5
.0 %
]27
13.1
%W
ilson
116
24.9
%77
18.1
%M
onta
gue
7421
.7%
238
12.1
%Fa
lls24
713
.7%
2913
.5%
Har
din
4018
.5%
7718
.1%
Moo
re32
17.1
%23
912
.6%
Bai
ley
141
[7.1
%]
2913
.5%
Whe
eler
7721
.8%
7918
.2%
Gla
ssco
ck17
631
.4%
240
[12.
6%]
Floy
d18
5[7
.9%
131
13.6
%G
uada
lupe
107
24.3
%79
18.2
%T
aylo
r49
19.4
%24
112
.9%
Ter
ry13
0[6
.9%
132
13.7
%C
ham
bers
1413
.0%
8118
.3%
Fann
in94
23.3
%24
213
.3%
Jone
s19
8[8
.2%
]32
13.7
%K
aufm
an51
19.7
%82
18.4
%D
alla
s45
19.0
%24
3[1
3.3%
)D
onle
y13
(2.9
%1
3413
.8%
Ban
dera
3617
.8%
8218
.4%
Hop
kins
8622
.4%
244
(13.
5%)
Chi
ldre
ss45
[4.8
%]
3513
.9%
Gill
espi
e28
16.6
%84
18.5
%O
chilr
ree
2215
.1%
245
13.5
%B
ande
ra91
[6.1
%]
3614
.1%
Aus
tin38
18.2
%85
18.6
%L
iber
ty82
22.0
%24
6[1
3.8
%]
Arc
her
158
[7.4
%]
3714
.2%
Tar
rant
2014
.7%
8618
.7%
Wha
rton
152
28.1
%24
7[1
4.0
%]
Bay
lor
226
[9.4
%]
3814
.3%
Bor
den
129
26.0
%87
18.8
%Sm
ith79
21.9
%24
814
.5%
Ara
nsas
65[5
.6%
)38
14.3
%G
rays
on28
16.6
%88
19.0
%O
rang
e60
20.7
%24
9[1
4.5%
)M
ario
n17
4[7
.8%
)38
14.3
%T
ravi
s45
19.0
%89
19.3
%U
pshu
r66
21.1
%25
015
.3%
Swis
her
184
(7.9
%]
4114
.4%
Ken
dall
6120
.9%
9019
.4%
Hen
ders
on11
224
.8%
251
[16.
3 %
]K
nox
79[6
.0 %
]42
14.5
%Fo
ard
9122
.8%
9019
.4%
Jack
son
137
26.6
%25
2[1
6.7
%]
Fish
er26
[3.8
%]
4314
.7%
Bla
nco
7921
.9%
9219
.9%
Har
ris
7221
.4%
253
[20.
0 %
]M
cMul
len
10.
0%44
14.8
%C
alla
han
131
26.2
%93
20.1
%L
ampa
sas
141
27.0
%25
4[2
1.7%
)B
risc
oe14
4(7
.1%
)44
14.8
%L
ee61
20.9
%93
20.1
%M
edin
a16
529
.6%
4615
.0%
Jack
109
24.6
%93
20.1
%T
hroc
kmor
ron
103
24.0
%C
hild
Pov
erty
4715
.1%
Bur
net
111
24.7
%96
20.2
%H
ill16
028
.8%
1999
1989
4715
.1%
Hut
chin
son
3017
.0%
9620
.2%
Wal
ler
104
24.1
%Rank
Rate
County
Rank
Rate
4715
.1%
Was
hing
ton
5520
.1%
9820
.3%
Coo
ke82
22.0
%1
0.0%
Lov
ing
10.
0%50
15.2
%C
oke
9723
.5%
9820
.3%
Mad
ison
210
38.0
%2
5.5%
Col
lin3
7.0%
5115
.3%
Cra
ne57
20.3
%98
20.3
%W
alke
r74
21.7
%3
5.6%
Roc
kwal
l2
6.8%
5215
.4%
Cal
dwel
l22
439
.9%
101
20.5
%M
ason
179
31.8
%4
5.7%
Will
iam
son
1112
.0%
5215
.4%
Lav
aca
7721
.8%
101
20.5
%T
om G
reen
8522
.1%
56.
5%D
ento
n4
7.2%
54[1
5.6
%]
Ken
edy
146
27.7
%10
120
.5%
War
d10
123
.9%
6[7
.5%
)R
ober
ts5
7.8%
5516
.0%
Bas
trop
9923
.7%
104
20.8
%A
ndre
ws
7921
.9%
78.
0%Ir
ion
2315
.2%
5516
.0%
Dal
lam
122
25.4
_%10
420
.8%
Bre
wst
er17
631
.4%
88.
3%H
artle
y26
16.0
%57
16.3
%C
onch
o18
933
.9%
104
20.8
%G
rim
es16
529
.6%
98.
8%Fo
rt B
end
910
.9%
5716
.3%
Hun
t47
19.3
%10
720
.9%
Parm
er16
930
.2%
109.
0%R
anda
ll9
10.9
%57
16.3
%_W
ilbar
ger_
130
____
___2
6.1%
____
107
20.9
%W
ood
119
25.3
%11
9.2%
Car
son
710
.7%
6016
.5%
P-an
ola
119
25.3
%10
921
.0%
Gre
gg90
22.7
%
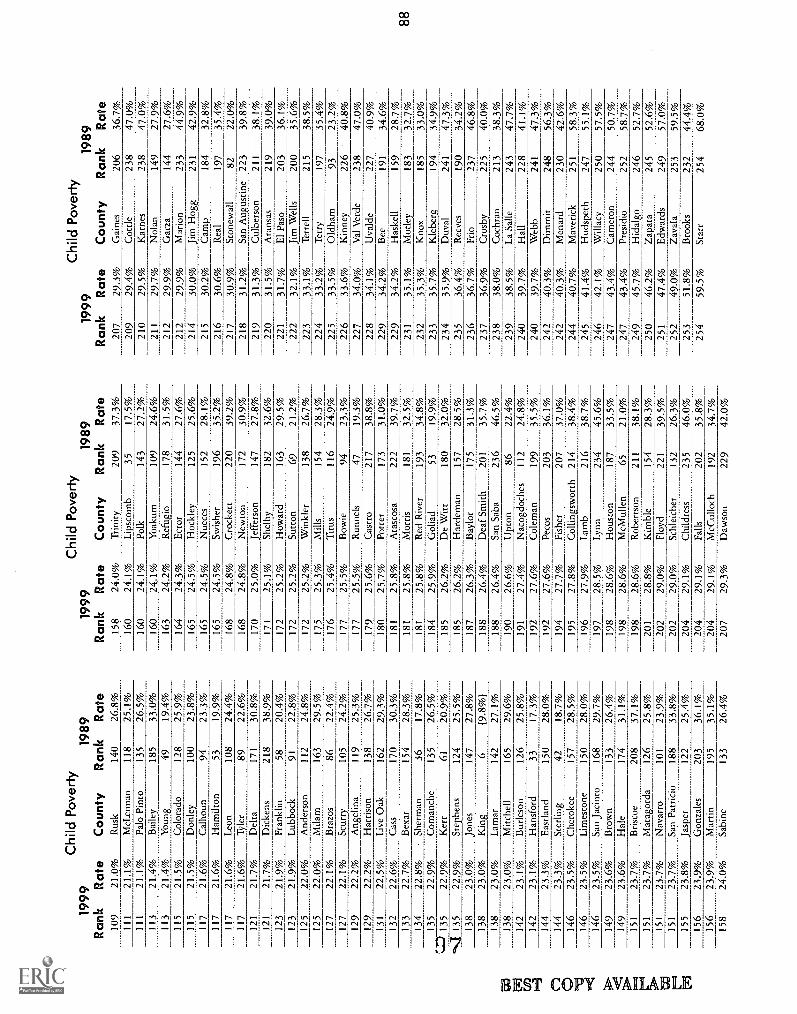
1999
Ran
kR
ate
Chi
ld P
over
ty
Cou
nty
1989
Ran
kR
ate
1999
Ran
kR
ate
Chi
ld P
over
ty
Cou
nty
1989
Ran
kR
ate
1999
Ran
kR
ate
Chi
ld P
over
ty
Cou
nty
1989
Ran
kR
ate
109
21.Q
%R
usk
140
26.8
%15
824
.0%
Tri
nity
209
37.3
%20
729
.3%
Gai
nes
206
36.7
%11
121
.1%
McL
enna
n11
825
.1%
160
24.1
%L
ipsc
omb
3517
.5%
29.4
%C
ottle
238
47.0
%11
121
.1%
Palo
Pin
to13
526
.5%
160
24.1
%Po
lk14
327
.2%
_209 21
029
.5%
Kar
nes
238
47.0
%11
321
.4%
Bai
ley
185
33.0
%16
024
.1%
Yoa
kum
109
24.6
%21
129
.7%
Nol
an14
927
.9%
113
21.4
%Y
oung
4919
.4%
163
24.2
%R
efug
io17
831
.5%
212
29.9
%G
arza
144
27.6
%C
olor
ado
128
25.9
%16
424
.3%
Ect
or14
427
.6%
212
29.9
%M
ario
n23
344
.9%
115
21.5
%11
521
.5%
Don
ley
100
23.8
%16
524
.5%
Hoc
k le
y12
525
.6%
214
30.0
%Ji
m H
ogg
231
42.9
%11
721
.6%
Cal
houn
9423
.3%
165
24.5
%N
uece
s15
228
.1%
215
30.2
%C
amp
184
32.8
%11
721
.6%
Ham
ilton
5319
.9%
165
24.5
%Sw
ishe
r19
635
.2%
216
30.6
%R
eal
197
35.4
%11
721
.6%
Leo
n10
824
.4%
168
24.8
%C
rock
ett
220
39.2
%21
730
.9%
Ston
ewal
l82
22.0
%11
721
.6%
Tyl
er89
22.6
%16
824
.8%
New
ton
172
30.9
%21
831
.2%
San
Aug
ustin
e22
339
.8%
121
21.7
%D
elta
171
30.8
%17
025
.0%
Jeff
erso
n14
727
.8%
219
31.3
%C
ulbe
rson
211
38.1
%12
121
.7%
Dic
kens
218
38.9
%17
125
.1%
Shel
by18
232
.6%
220
31.5
%A
rans
as21
939
.0%
123
21.9
%Fr
ankl
in58
20.4
%17
225
.2%
How
ard
163
29.5
%22
131
.7%
El P
aso
203
36.1
%12
321
.9%
Lub
bock
9122
.8%
172
25.2
%Su
tton
6921
.2%
222
32.1
%Ji
m W
ells
200
35.6
%12
522
.0%
And
erso
n11
224
.8%
172
25.2
%W
inkl
er13
826
.7%
223
33.1
%T
erre
ll21
538
.5%
125
22.0
%M
ilam
163
29.5
%17
525
.3%
Mill
s15
428
.3%
224
33.2
%T
erry
197
35.4
%12
722
.1%
Bra
zos
8622
.4%
176
25.4
%T
itus
116
24.9
%22
533
.5%
Old
ham
9323
.2%
127
22.1
%Sc
urry
105
24.2
%17
725
.5%
Bow
ie94
23.3
%22
633
.6%
Kin
ney
226
40.8
%12
922
.2%
Ang
elin
a11
925
.3%
177
25.5
%R
unne
ls47
19.3
%22
734
.0%
Val
Ver
de23
847
.0%
129
22.2
%H
arri
son
138
26.7
%17
925
.6%
Cas
tro
217
38.8
%22
834
.1%
Uva
lde
227
40.9
%13
122
.5%
Liv
e O
ak16
229
.3%
180
25.7
%Po
tter
173
31.0
%22
934
.2%
Bee
191
34.6
%13
222
.6%
Cas
s17
030
.3%
181
25.8
%A
tasc
osa
222
39.7
%22
934
.2%
Has
kell
159
28.7
%13
322
.7%
Bex
ar15
428
.3%
181
25.8
%M
orri
s18
132
.5%
231
35.1
%M
otle
y18
332
.7%
134
22.8
%Sh
erm
an36
17.8
%18
125
.8%
Red
Riv
er19
334
.8%
232
35.3
%K
nox
185
33.0
%13
522
.9%
Com
anch
e13
526
.5%
184
25.9
%G
olia
d53
19.9
%23
335
.7%
Kle
berg
194
34.9
%."
-0 1
3522
.9%
Ker
r61
20.9
%18
526
.2%
De
Witt
180
32.0
%23
435
.9%
Duv
al24
147
.3%
135
22.9
%St
ephe
ns12
425
.5%
185
26.2
%H
arde
man
157
28.5
%23
536
.4%
Ree
ves
190
34.2
%13
823
.0%
Jone
s14
727
.8%
187
26.3
%B
aylo
r17
531
.3%
236
36.7
%Fr
io23
746
.8%
138
23.0
%K
ing_
6[9
.8%
118
826
.4%
Dea
f Sm
ith20
135
.7%
237
36.9
%C
rosb
y22
540
.0%
138
23.0
%L
amar
142
27.1
%18
826
.4%
San
Saba
236
46.5
%23
838
.0%
Coc
hran
213
38.3
%13
823
.0%
Mitc
hell
165
29.6
%19
026
.6%
Upt
on86
22.4
%23
938
.5%
La
Salle
243
47.7
%14
223
.1%
Bur
leso
n12
625
.8%
191
27.4
%N
acog
doch
es11
224
.8%
240
39.7
%H
all
228
41.1
%14
223
.1%
Han
sfor
d33
17.3
%19
227
.6%
Col
eman
199
35.5
%24
039
.7%
Web
b24
147
.3%
144
23.3
%E
astla
nd15
028
.0%
192
27.6
%Pe
cos
203
36.1
%24
240
.3%
Dim
mit
248
56.3
%14
423
.3%
Ster
ling
4218
.7%
194
27.7
%Fi
sher
207
37.0
%24
240
.3%
Men
ard
230
42.6
%14
623
.5%
Che
roke
e15
728
.5%
195
27.8
%C
ollin
gsw
orth
214
38.4
%24
440
.7%
Mav
eric
k25
158
.3%
146
23.5
%L
imes
tone
150
28.0
%19
627
.9%
Lam
b21
638
.7%
245
41.4
%H
udsp
eth
247
55.1
%14
623
.5%
San
Jaci
nto
168
29.7
%19
728
.5%
Lyn
n23
445
.6%
246
42.1
%W
illac
y25
057
.5%
149
23.6
%B
row
n13
326
.4%
198
28.6
%H
oust
on18
733
.5%
247
43.4
%C
amer
on24
450
.7%
149
23.6
%H
ale
174
31.1
%19
828
.6%
McM
ulle
n65
21.0
%24
743
.4%
Pres
idio
252
58.7
%1
5 1
23.7
%B
risc
oe20
837
.1%
198
28.6
%R
ober
tson
211
38.1
%24
945
.7%
Hid
algo
246
52.7
%1
5 1
23.7
%M
atag
orda
126
25.8
%20
128
.8%
Kim
ble
154
28.3
%25
046
.2%
Zap
ata
245
52.6
%15
123
.7%
Nav
arro
101
23.9
%20
229
.0%
Floy
d22
139
.5%
251
47.4
%E
dwar
ds24
957
.0%
1 5
123
.7%
San
Patr
icio
188
33.8
%20
229
.0%
Schl
eich
er13
226
.3%
252
49.0
%Z
aval
a25
359
.5%
155
23.8
%Ja
sper
122
25.4
%20
429
.1%
Chi
ldre
ss23
546
.0%
253
51.8
%B
rook
s23
244
.4%
156
23.9
%G
onza
les
203
36.1
%20
429
.1%
Falls
202
35.8
%25
459
.5%
Star
r25
468
.0%
156
23.9
%M
artin
195
35.1
%20
429
.1%
McC
ullo
ch19
234
.7%
158
24.0
%Sa
bine
133
26.4
%20
729
.3%
Daw
son
229
42.0
%
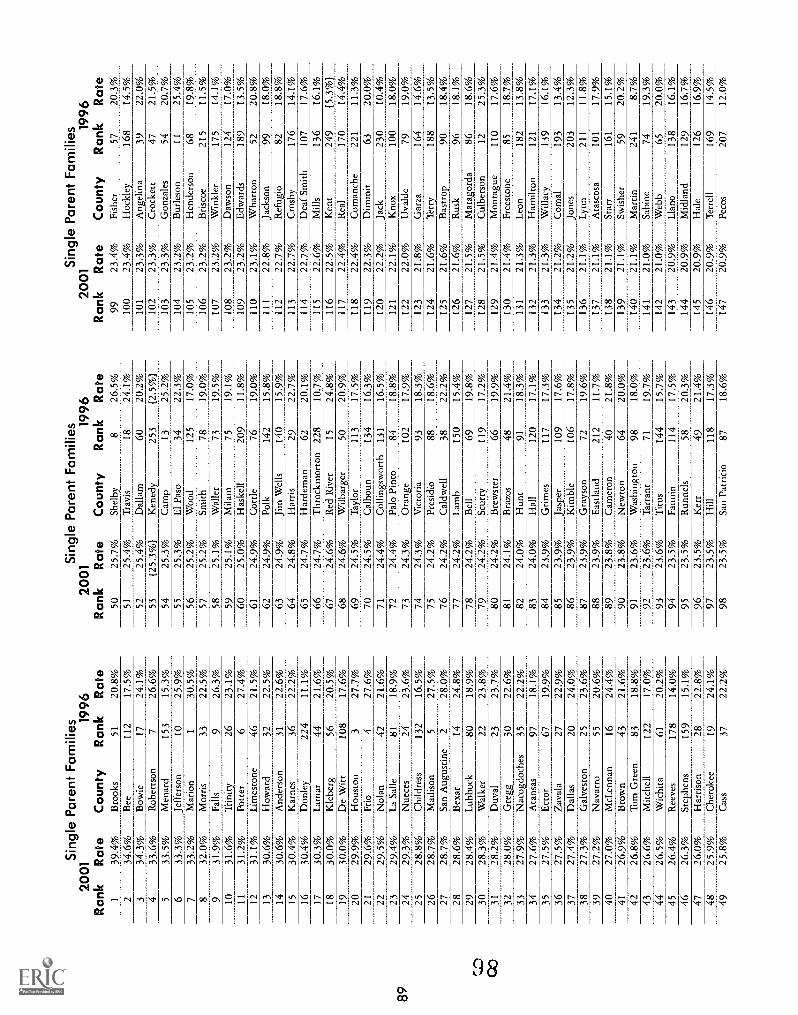
CZ
00
Sin
gle
Par
ent F
amili
es20
0119
96R
ank
Rat
eC
ount
yR
ank
Rat
e1
39.4
%B
rook
s51
20.8
%
Sin
gle
Par
ent F
amili
es20
0119
96R
ank
Rat
eC
ount
yR
ank
Rat
e50
25.7
%Sh
elby
826
.5%
Sin
gle
Par
ent F
amili
es20
0119
96R
ank
Rat
eC
ount
yR
ank
Rat
e99
23.4
%Fi
sher
5720
.3%
234
.6%
Bee
112
17.5
%51
25.4
%T
ravi
s18
24.1
%10
023
.4%
Hoc
k le
y16
814
.5%
334
.3%
Bow
ie17
24.1
%52 53
25.4
%D
a Il
am60
20.2
%10
123
.3%
23.3
%A
ngel
ina
3922
.0%
433
.6%
Rob
erts
on7
26.6
%[2
5.3
%]
Ken
edy
253
[2.5
%]
102
Cro
cket
t47
21.5
%5
33.5
%M
enar
d15
315
.3%
5425
.3%
Cam
p13
25.2
%10
323
.3%
Gon
zale
s54
20.7
%6
33.3
%Je
ffer
son
1025
.9%
5525
.3%
El P
aso
3422
.3%
104
23.2
%B
urle
son
1125
.4%
733
.2%
Mar
ion
130
.5%
5625
.2%
Woo
d12
517
.0%
105
23.2
%H
ende
rson
6819
.8%
832
.0%
Mor
ris
3322
.5%
5725
.2%
Smith
7819
.0%
106
23.2
%B
risc
oe21
511
.5%
931
.9%
Falls
926
.3%
5825
.1%
Wal
ler
7319
.5%
107
23.2
%W
inkl
er17
514
.1%
1031
.6%
Tri
nity
2623
.1%
5925
.1%
Mila
m75
19.1
%10
823
.2%
Daw
son
124
17.0
%11
31.2
%Po
tter
627
.4%
6025
.0%
Has
kell
209
11.8
%10
923
.2%
Edw
ards
189
13.5
%12
31.1
%L
imes
tone
4621
.5%
6124
.9%
Cot
tle76
19.0
%11
023
.1%
Wha
rton
5220
.8%
1330
.6%
How
ard
3222
.5%
6224
.9%
Polk
142
15.8
%11
122
.8%
Jack
son
9918
.0%
1430
.6%
And
erso
n31
22.6
%63
24.9
%Ji
m W
ells
140
15.9
%11
222
.7%
Ref
ugio
8218
.8%
1530
.4%
Kar
nes
3622
.2%
6424
.8%
Har
ris
2922
.7%
113
22.7
%C
rosb
y17
614
.1%
1630
.4%
Don
ley
224
11.1
%65
24.7
%H
arde
man
6220
.1%
114
22.7
%D
eaf
Smith
107
17.6
%17
30.3
%L
amar
4421
.6%
6624
.7%
Thr
ockm
orto
n22
810
.7%
115
22.6
%M
ills
136
16.1
%18
30.0
%K
lebe
rg56
20.5
%67
24.6
%R
ed R
iver
1524
.8%
116
22.5
%K
ent
249
[5.3
%1
1930
.0%
De
Witt
108
17.6
%68
24.6
%W
ilbar
ger
5020
.9%
117
22.4
%R
eal
170
14.4
%20
29.9
%H
oust
on3
27.7
%69
24.5
%T
aylo
r11
317
.5%
118
22.4
%C
oman
che
221
11.3
%21
29.6
%Fr
io4
27.6
%70
24.5
%C
alho
un13
416
.3%
119
22.3
%D
imm
it63
20.0
%22
29.5
%N
olan
4221
.6%
7124
.4%
Col
lings
wor
th13
116
.5%
120
22.2
%Ja
ck23
010
.4%
2329
.4%
La
Salle
8118
.9%
7224
.4%
Palo
Pin
to84
18.8
%12
122
.1%
Kno
x10
018
.0%
19.0
%24
29.3
%N
uece
s24
23.6
%73
24.3
%O
rang
e10
217
.9%
122
22.0
%U
vald
e79
2528
.8%
Chi
ldre
ss13
216
.5%
7424
.3%
Vic
tori
a93
18.3
%12
321
.8%
Gar
za16
414
.6%
2628
.7%
Mad
ison
527
.5%
7524
.2%
Pres
idio
8818
.6%
124
21.6
%T
erry
188
13.5
%27
28.7
%Sa
n A
ugus
tine
228
.0%
7624
.2%
Cal
dwel
l38
22.2
%12
521
.6%
Bas
trop
9018
.4%
2828
.6%
Bex
ar14
24.8
%77
24.2
%L
amb
150
15.4
%12
621
.6%
Rus
k96
18.1
%29
28.4
%L
ubbo
ck80
18.9
%78
24.2
%B
ell
6919
.8%
127
21.5
%M
atag
orda
8618
.6%
3028
.3%
Wal
ker
2223
.8%
7924
.2%
Scur
ry11
917
.2%
128
21.5
%C
ulbe
rson
1225
.3%
3128
.2%
Duv
al23
23.7
%80
24.2
%B
rew
ster
6619
.9%
129
21.4
%M
onta
gue
110
17.6
%32
28.0
%G
regg
3022
.6%
8124
.1%
Bra
zos
4821
.4%
130
21.4
%Fr
eest
one
8518
.7%
3327
.9%
Nac
ogdo
ches
3522
.2%
8224
.0%
24.0
%H
unt
Hal
l91 12
018
.3%
17.1
%13
121
.3%
Leo
n18
213
.8%
3427
.6%
Ara
nsas
9718
.1%
8313
221
.3%
Ham
ilton
121
17.1
%35
27.5
%E
ctor
6719
.9%
8423
.9%
Gri
mes
117
17.3
%13
321
.3%
Will
acy
139
16.1
%36
27.5
%Z
aval
a27
22.9
%85 86
23.9
%23
.9%
Jasp
erK
imbl
e10
910
617
.6%
17.8
%13
421
.2%
Com
al19
313
.4%
3727
.4%
Dal
las
2024
.0%
135
21.2
%21
.1%
Jone
s20
312
.3%
3827
.3%
Gal
vest
on25
23.6
%87 88
23.9
%23
.9%
Gra
yson
Eas
tland
72 212
19.6
%11
.7%
136
Lyn
n21
111
.8%
3927
.2%
Nav
arro
5520
.6%
137
21.1
%A
tasc
osa
101
17.9
%40
27.0
%M
cLen
nan
1624
.4%
8923
.8%
Cam
eron
4021
.8%
138
21.1
%St
arr
161
15.1
%41
26.9
%B
row
n43
21.6
%90
23.8
%N
ewto
n64
20.0
%13
921
.1%
Swis
her
5920
.2%
4226
.8%
Tom
Gre
en83
18.8
%91
23.6
%W
ashi
ngto
n98
18.0
%14
021
.1%
Mar
tin24
18.
7%43
26.6
%M
itche
ll12
217
.0%
9223
.6%
Tar
rant
7119
.7%
141
21.0
%Sa
bine
7419
.3%
4426
.5%
Wic
hita
6120
.2%
9323
.6%
Titu
s14
415
.7%
142
21.0
%W
ebb
6520
.0%
4526
.4%
Ree
ves
178
14.0
%94
23.5
%Fa
nnin
114
17.5
%14
320
.9%
Lla
no13
816
.1%
4626
.3%
Step
hens
159
15.1
%95
23.5
%R
unne
ls58
20.3
%14
420
.9%
Mid
land
129
16.7
%47
26.0
%H
arri
son
2822
.8%
9623
.5%
Ker
r49
21.4
%14
520
.9%
Hal
e12
616
.9%
4825
.9%
Che
roke
e19
24.1
%97
23.5
%H
ill11
817
.3%
146
20.9
%T
erre
ll16
914
.5%
4925
.8%
Cas
s37
22.2
%98
23.5
%Sa
n Pa
tric
io87
18.6
%14
720
.9%
Peco
s20
712
.0%
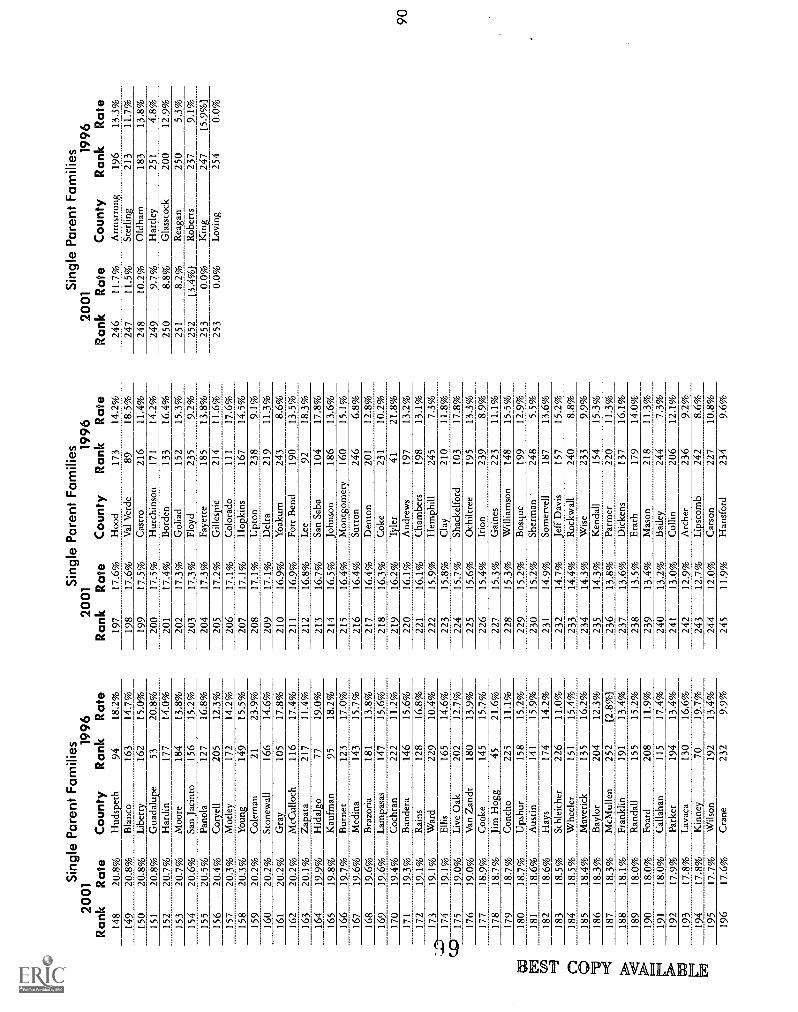
Sin
gle
Par
ent F
amili
es20
0119
96R
ank
Rat
eC
ount
yR
ank
Rat
e
Sin
gle
Par
ent F
amili
es20
0119
96R
ank
Rat
eC
ount
yR
ank
Rat
e
Sin
gle
Par
ent F
amili
es20
0119
96R
ank
Rat
eC
ount
yR
ank
Rat
e14
820
.8%
Hud
spet
h94
18.2
%19
717
.6%
Hoo
d17
314
.2%
246
11.7
%A
rmst
rong
196
13.3
%14
920
.8%
Bla
nco
163
14.7
%19
817
.6%
Val
Ver
de89
18.5
%24
711
.5%
Ster
ling
213
11.7
%15
020
.8%
Lib
erty
162
15.0
%19
917
.5%
Cas
tro
216
11.4
%24
810
.2%
Old
ham
183
13.8
%15
120
.8%
Gua
dalu
pe53
20.8
%20
017
.5%
Hut
chin
son
171
14.2
%24
99.
7%H
artle
y25
14.
8%15
220
.7%
Har
din
177
14.0
%20
117
.4%
Bor
den
133
16.4
%25
08.
8%G
lass
cock
200
12.9
%15
320
.7%
Moo
re18
413
.8%
202
17.3
%G
olia
d15
215
.3%
251
8.2%
Rea
gan
250
5.3%
154
20.6
%Sa
n Ja
cint
o15
615
.2%
203
17.3
%Fl
oyd
235
9.2%
252
[3.4
%)
Rob
erts
237
9.1%
155
20.5
%Pa
nola
127
16.8
%20
417
.3%
Faye
tte18
513
.8%
253
0.0%
Kin
g24
7[5
.9%
)15
620
.4%
Cor
yell
205
12.3
%20
517
.2%
Gill
espi
e21
411
.6%
253
0.0%
Lov
ing
254
0.0%
157
20.3
%M
otle
y17
214
.2%
206
17.1
%C
olor
ado
111
17.6
%15
820
.3%
You
ng14
915
.5%
207
17.1
%H
opki
ns16
714
.5%
159
20.2
%C
olem
an21
23.9
%20
817
.1%
Upt
on23
89.
1%16
020
.2%
Ston
ewal
l16
614
.6%
209
17.1
%D
elta
219
11.3
%16
120
.2%
Gra
y10
517
.8%
210
16.9
%Y
oaku
m24
38.
6%16
220
.2%
McC
ullo
ch11
617
.4%
211
16.9
%Fo
rt B
end
190
13.5
%16
320
.1%
Zap
ata
217
11.4
%21
216
.8%
Lee
9218
.3%
164
19.9
%H
idal
go77
19.0
%21
316
.7%
San
Saba
104
17.8
%16
519
.8%
Kau
fman
9518
.2%
214
16.5
%Jo
hnso
n18
613
.6%
166
19.7
%B
urne
t12
317
.0%
215
16.4
%M
ontg
omer
y16
015
.1%
167
19.6
%M
edin
a14
315
.7%
216
16.4
%Su
tton
246
6.8%
168
19.6
%B
razo
ria
181
13.8
%21
716
.4%
Den
ton
201
12.8
%16
919
.6%
Lam
pasa
s14
715
.6%
218
16.3
%C
oke
231
10.2
%17
019
.4%
Coc
hran
222
11.2
%21
916
.2%
Tyl
er41
21.8
%17
119
.3%
Ban
dera
146
15.6
%22
016
.1%
And
rew
s19
713
.2%
172
19.1
%R
ains
128
16.8
%22
116
.1%
Cha
mbe
rs19
813
.1%
173
19.1
%W
ard
229
10.4
%22
215
.9%
Hem
phill
245
7.3%
"i'D
174
19.1
%E
llis
165
14.6
%22
315
.8%
Cla
y21
011
.8%
(C)
175
19.0
%L
ive
Oak
202
12.7
%22
415
.7%
Shac
kelf
ord
103
17.8
%17
619
.0%
Van
Zan
dt18
013
.9%
225
15.6
%O
chilt
ree
195
13.3
%17
718
.9%
Coo
ke14
515
.7%
226
15.4
%Ir
ion
239
8.9%
178
18.7
%Ji
m H
ogg
4521
.6%
227
15.3
%G
aine
s22
311
.1%
179
18.7
%C
onch
o22
511
.1%
15.3
%W
illia
mso
n14
815
.5%
180
18.7
%U
pshu
r15
815
.2%
_228 22
915
.2%
Bos
que
199
12.9
%18
118
.6%
Aus
tin14
115
.9%
230
15.2
%Sh
erm
an24
85.
5%18
218
.6%
Hay
s17
414
.2%
231
14.9
%So
mer
vell
187
13.6
%18
318
.5%
Schl
eich
er22
611
.0%
232
14.7
%Je
ff D
avis
157
15.2
%18
418
.5%
Whe
eler
151
15.4
%23
314
.4%
Roc
kwal
l24
08.
8%18
518
.4%
Mav
eric
k13
516
.2%
234
14.3
%W
ise
233
9.9%
186
18.3
%B
aylo
r20
412
.3%
235
14.3
%K
enda
ll15
415
.3%
187
18.3
%M
cMul
len
252
[2.8
%)
236
13.8
%Pa
rmer
220
11.3
%18
818
.1%
Fran
klin
191
13.4
%23
713
.6%
Dic
kens
137
16.1
%18
918
.0%
Ran
dall
155
15.2
%23
813
.5%
Era
th17
914
.0%
190
18.0
%Fo
ard
208
11.9
%23
913
.4%
Mas
on21
811
.3%
191
18.0
%C
alla
han
115
17.4
%24
013
.2%
Bai
ley
244
7.3%
192
17.9
%Pa
rker
194
13.4
%24
113
.0%
Col
lin20
612
.1%
193
17.8
%L
avac
a13
016
.6%
242
12.9
%A
rche
r23
69.
2%19
417
.8%
Kin
ney
7019
.7%
243
12.7
%L
ipsc
omb
242
8.6%
195
17.7
%W
ilson
192
13.4
%24
412
.0%
Car
son
227
10.8
%19
617
.6%
Cra
ne23
29.
9%24
511
.9%
Han
sfor
d23
49.
6%

C)
EN
DN
OT
ES
FA
MIL
Y &
CO
MM
UN
ITY
PO
PU
LAT
ION
(') M
urdo
ck, S
., et
. af.
'(200
2). T
he T
exas
Cha
lleng
e in
the
Tw
enty
-Fir
st C
entu
ry: I
mpl
icat
iont
of
Popu
latio
n C
hang
e fo
r th
eFu
ture
of
Tex
as. C
olle
ge S
tatio
n: T
exas
A &
M U
nive
rsity
,D
epar
tmen
t of
Rur
al S
ocio
logy
.
(2)
Mur
dock
, S.,
et. a
l. (2
002)
. The
Tex
as C
halle
nge
in th
eT
wen
ty-F
irst
Cen
tury
: Im
plic
atio
ns o
f Po
pula
tion
Cha
nge
for
the
Futu
re o
f T
exas
. Col
lege
Sta
tion:
Tex
as A
& M
Uni
vers
ity,
Dep
artm
ent o
f R
Ura
l Soc
iolo
gy.
(3)
Thr
ough
out t
he T
exas
Kid
s C
ount
Fac
t Boo
k an
d ou
rot
her
data
pro
duct
s, w
e us
e C
ensu
s B
urea
u cl
assi
fica
tions
and
labe
ls th
at d
efin
e ra
ce a
nd e
thni
city
as
dist
inct
var
i-ab
les.
The
200
0 C
ensu
s in
clud
ed o
ne e
thni
c ca
tego
ry,
"His
pani
c or
Lat
ino.
" T
he 2
000
Cen
sus
used
sev
en r
ace
cat-
egor
ies:
1)
"Whi
te,"
2)
"Bla
ck o
r A
fric
an A
mer
ican
," 3
)"A
mer
ican
Ind
ian
and
Ala
ska
Nat
ive,
" 4)
"A
sian
," 5
)"N
ativ
e H
awai
ian
and
Oth
er P
acif
ic I
slan
der,
" 6)
"So
me
Oth
er R
ace,
" an
d 7)
"T
wo
or M
ore
Rac
es."
To
enab
le c
om-
pari
sons
with
pri
or C
ensu
s ye
ars
that
em
ploy
ed a
dif
fere
ntse
t of
race
cat
egor
ies,
the
Fact
Boo
k re
port
s da
ta s
epar
atel
yfo
r W
hite
and
Bla
ck p
opul
atio
n gr
oups
, and
com
bine
s da
tafr
om th
e re
mai
ning
fiv
e gr
oups
into
an
"Oth
er R
ace"
cat
e-go
ry. I
n or
der
to r
epor
t und
uplic
ated
cou
nts
of th
e po
pula
-tio
n, p
eopl
e in
clud
ed in
the
His
pani
c et
hnic
cat
egor
y m
aybe
of
any
race
, whi
le p
eopl
e in
clud
ed in
the
Whi
te, B
lack
,an
d O
ther
Rac
e gr
oups
all
are
non-
His
pani
c.
(4)
Mur
dock
, S.,
et. a
l. (2
002)
. The
Tex
as C
halle
nge
in th
eT
wen
ty-F
irst
Cen
tury
: Im
plic
atio
ns o
f Po
pula
tion
Cha
nge
for
the
Futu
re o
f T
exas
. Col
lege
Sta
tion:
Tex
as A
& M
Uni
vers
ity,
Dep
artm
ent o
f R
ural
Soc
iolo
gy.
(5)
Ann
ie E
. Cas
ey F
ound
atio
n (2
001)
. KID
S C
OU
NT
Dat
a B
ook
2001
: Sta
te P
rofi
les
of C
hild
Wel
l-B
eing
.B
altim
ore:
Aut
hor.
(6)
Mur
dock
, S.,
et. a
l. (2
002)
. The
Tex
as C
halle
nge
in th
eT
wen
ty-F
irst
Cen
tury
: Im
plic
atio
ns o
f Po
pula
tion
Cha
nge
for
the
Futu
re o
f T
exas
. Col
lege
Sta
tion:
Tex
as A
& M
Uni
vers
ity,
Dep
artm
ent o
f R
ural
Soc
iolo
gy.
(7)
Ann
ie E
. Cas
ey F
ound
atio
n (2
001)
. KID
S C
OU
NT
Dat
a B
ook
2001
: Sta
te P
rofi
les
of C
hild
Wel
l-B
eing
. Bal
timor
e:A
utho
r.
(8)
Hob
bs, F
. & S
toop
s, N
. (20
02).
Dem
ogra
phic
Tre
nds
inth
e 20
th C
entu
ry, U
.S. C
ensu
s B
urea
u, C
ensu
s 20
00 S
peci
alR
epor
ts, S
erie
s C
EN
SR-4
. Was
hing
ton:
U.S
. Gov
ernm
ent
Prin
ting
Off
ice.
(9)
Fede
ral I
nter
agen
cy F
orum
on
Chi
ld a
nd F
amily
Stat
istic
s (2
002)
. Am
eric
a's
Chi
ldre
n: K
ey N
atio
nal I
ndic
ator
sof
Wel
l-B
eing
200
2. W
ashi
ngto
n: U
.S. G
over
nmen
tPr
intin
g O
ffic
e.
(10)
Hob
bs, F
. & S
toop
s, N
. (20
02).
Dem
ogra
phic
Tre
nds
in th
e 20
th C
entu
ry, U
.S. C
ensu
s B
urea
u, C
ensu
s 20
00Sp
ecia
l Rep
orts
, Ser
ies
CE
NSR
-4. W
ashi
ngto
n: U
.S.
Gov
ernm
ent P
rint
ing
Off
ice.
(")
Hal
le, T
. (20
02).
Cha
rtin
g Pa
rent
hood
: A S
tatis
tical
Port
rait
of M
othe
rs a
nd F
athe
rs in
Am
eric
a. W
ashi
ngto
n: C
hild
Tre
nds. (12)
Ann
ie E
. Cas
ey F
ound
atio
n (2
002)
. KID
S C
OU
NT
Dat
a B
ook
2002
: Sta
te P
rofi
les
of C
hild
Wel
l-B
eing
.B
altim
ore:
Aut
hor.
EC
ON
OM
IC R
ES
OU
RC
ES
,S
EC
UR
ITY
& O
PP
OR
TU
NIT
Y(1
) A
nnie
E. C
asey
Fou
ndat
ion
(200
2). K
IDS
CO
UN
TD
ata
Boo
k 20
02: S
tate
Pro
file
s of
Chi
ld W
ell-
Bei
ng.
Bal
timor
e: A
utho
r.
(2)
Hal
le, T
. (20
02).
Cha
rtin
g Pa
rent
hood
. A S
tatis
tical
Port
rait
of M
othe
rs a
nd F
athe
rs in
Am
eric
a. W
ashi
ngto
n:C
hild
Tre
nds.
(3)
In a
dditi
onal
to th
e de
cenn
ial C
ensu
s of
the
natio
n's
entir
e po
pula
tion,
fre
quen
tly u
sed
pove
rty
stat
istic
s co
me
from
the
annu
al M
arch
Sup
plem
ent o
f th
e C
urre
ntPo
pula
tion
Surv
ey (
CPS
), th
e Sm
all A
rea
Inco
me
and
Pove
rty
Est
imat
es (
SAIP
E),
and
the
Surv
ey o
f In
com
e an
dPr
ogra
m P
artic
ipat
ion
(SIP
P). T
he C
ensu
s B
urea
u w
ebsi
te(h
ttp://
ww
w.c
ensu
s.go
v/hh
es/w
ww
/pov
erty
.htm
l) p
rovi
des
furt
her
met
hodo
logi
cal a
nd o
ther
info
rmat
ion
abou
t CPS
,SA
IPE
, and
SIP
P.
(4)
Hou
rly
wag
e ca
lcul
atio
n as
sum
es f
ull t
ime
empl
oy-
men
t, de
fine
d as
wor
king
52
wee
ks p
er y
ear
and
40 h
ours
per
wee
k.
(5)
For
fam
ilies
with
mor
e th
an e
ight
mem
bers
, add
$3,6
10 f
or e
ach
addi
tiona
l per
son.
Thi
s in
crem
ent a
lso
appl
ies
to h
ouse
hold
s of
few
er th
an e
ight
peo
ple.
(6)
U.S
. Cen
sus
Bur
eau,
Cur
rent
Pop
ulat
ion
Surv
ey,
Mar
ch S
uppl
emen
t, 20
01.
(7)
U.S
. Cen
sus
Bur
eau,
Cur
rent
Pop
ulat
ion
Surv
ey,
Mar
ch S
uppl
emen
t, 20
01.
Citr
o, C
. & M
icha
el, R
. (E
ds.)
(19
95).
Mea
suri
ngPo
vert
y: A
New
App
roac
h. W
ashi
ngto
n: N
atio
nal
Aca
dem
y Pr
ess.
(9)
Fine
t, D
. (20
01).
Mak
ing
It: W
hat I
t Rea
lly T
akes
toL
ive
in T
exas
. Aus
tin: C
ente
r fo
r Pu
blic
Pol
icy
Prio
ritie
s.
(10)
Bou
shey
, H.,
Bro
cht,
C.,
Gun
ders
en, B
. &B
erns
tein
, J. (
2001
). H
ards
hips
in A
mer
ica:
The
Rea
l Sto
ry o
fW
orki
ng F
amili
es. W
ashi
ngto
n: E
cono
mic
Pol
icy
Inst
itute
.
(")
Ber
nste
in, J
., B
oush
ey, H
., M
cNic
hol,
E. &
Zah
radn
ik, R
. (20
02).
Pul
ling
Apa
rt: A
Sta
te-b
y-St
ate
Ana
lysi
s of
Inc
ome
Tre
nds.
Was
hing
ton:
Cen
ter
on B
udge
tan
d Po
licy
Prio
ritie
s an
d E
cono
mic
Pol
icy
Inst
itute
.
(12)
Ber
nste
in, J
., B
oush
ey, H
., M
cNic
hol,
E. &
Zah
radn
ik, R
. (20
02).
Pul
ling
Apa
rt: A
Sta
te-b
y-St
ate
Ana
lysi
s of
Inc
ome
Tre
nds.
Was
hing
ton:
Cen
ter
on B
udge
tan
d Po
licy
Prio
ritie
s an
d E
cono
mic
Pol
icy
Inst
itute
.
(13)
Sch
exna
yder
, D.,
Schr
oede
r, D
., L
ein,
L.,
Dom
ingu
ez, D
., D
ougl
as, K
., &
Ric
hard
s, F
. (20
02).
Surv
ivin
g W
ithou
t TA
NF:
An
Ana
lysi
s of
Fam
ilies
Div
erte
dFr
om o
r L
eavi
ng T
AN
F . A
ustin
: Tex
as D
epar
tmen
t of
Hum
an S
ervi
ces,
Tex
as F
amili
es in
Tra
nsiti
on P
roje
ct.
EA
RLY
CA
RE
& E
DU
CA
TIO
N(1
) Sh
onko
ff, J
. & P
hilli
ps, D
. (E
ds.)
. (20
00).
Fro
mN
euro
ns to
Nei
ghbo
rhoo
ds: T
he S
cien
ce o
f E
arly
Chi
ldho
odD
evel
opm
ent.
Boa
rd o
n C
hild
ren,
You
th, a
nd F
amili
es,
Com
mis
sion
on
Beh
avio
ral a
nd S
ocia
l Sci
ence
s an
dE
duca
tion,
Nat
iona
l Res
earc
h C
ounc
il an
d In
stitu
te o
fM
edic
ine.
Was
hing
ton:
Nat
iona
l Aca
dem
y Pr
ess,
p. 2
.
(2)
Her
nand
ez, D
. (19
95).
Cha
ngin
g de
mog
raph
ics:
Past
and
fut
ure
dem
ands
for
ear
ly c
hild
hood
pro
gram
s.T
he F
utur
e of
Chi
ldre
n, 5
(3),
p. 1
45-1
60.
(3)
Phill
ips,
D. &
Ada
ms,
G. (
2001
). C
hild
car
e an
d ou
ryo
unge
st c
hild
ren.
The
Fut
ure
of C
hild
ren,
11(
1), p
. 35-
52.
(4)
Bar
nett,
W. (
1995
). L
ong-
term
eff
ects
of
earl
ych
ildho
od p
rogr
ams
on c
ogni
tive
and
scho
ol o
utco
mes
.T
he F
utur
e of
Chi
ldre
n, 5
(3),
p. 2
5-50
.
(5)
Yos
hika
wa,
H. (
1995
). L
ong-
term
eff
ects
of
earl
ych
ildho
od p
rogr
ams
on s
ocia
l out
com
es a
nd d
elin
quen
cy.
The
Fut
ure
of C
hild
ren,
5(3
), 1
3. 5
1-75
.
(6)
Phill
ips,
D. &
Ada
ms,
G. (
2001
). C
hild
car
e an
d ou
ryo
unge
st c
hild
ren.
The
Fut
ure
of C
hild
ren,
11(
1), p
. 35-
52.
(7)
Kni
tzer
, J. (
2001
) Fe
dera
l and
sta
te e
ffor
ts to
impr
ove
care
for
infa
nts
and
todd
lers
. The
Fut
ure
of C
hild
ren,
11(1
), p
. 79-
97.
(8)
Sabo
, J.,
Bre
sette
, P. &
DeL
una
Cas
tro,
E. (
2002
).T
he T
exas
Chi
ld C
are
Exp
erie
nce
Sinc
e 19
96: I
mpl
icat
ions
for
Fede
ral a
nd S
tate
Pol
icy.
Aus
tin: C
ente
r fo
r Pu
blic
Pol
icy
Prio
ritie
s.
(9)
Shon
koff
, J. &
Phi
llips
, D. (
Eds
.). (
2000
). F
rom
Neu
rons
to N
eigh
borh
oods
: The
Sci
ence
of
Ear
ly C
hild
hood
Dev
elop
men
t. B
oard
on
Chi
ldre
n, Y
outh
, and
Fam
ilies
,C
omm
issi
on o
n B
ehav
iora
l and
Soc
ial S
cien
ces
and
Edu
catio
n, N
atio
nal R
esea
rch
Cou
ncil
and
Inst
itute
of
Med
icin
e. W
ashi
ngto
n: N
atio
nal A
cade
my
Pres
s.
('°)
Phill
ips,
D. &
Ada
ms,
G. (
2001
). C
hild
car
ean
d ou
r yo
unge
st c
hild
ren.
The
Fut
ure
of C
hild
ren,
11(
1),
p. 3
5-52
.
(")
Lam
er, M
., B
ehrm
an, R
., Y
oung
, M. &
Rei
ch, K
.(2
001)
. Car
ing
for
infa
nts
and
todd
lers
: Ana
lysi
s an
d re
c-om
men
datio
ns. T
he F
utur
e of
Chi
ldre
n, 1
1(1)
, p. 7
-19.
(12)
Sch
ulm
an, K
. (20
00).
The
Hig
h C
ost o
f C
hild
Car
e(P
uts
Qua
lity
Car
e O
ut o
f R
each
for
Man
y Fa
mili
es.
Was
hing
ton:
Chi
ldre
n's
Def
ense
Fun
d.
(I))
Fin
et, D
. (20
01).
Mak
ing
It: W
hat I
t Rea
lly T
akes
toL
ive
in T
exas
. Aus
tin: C
ente
r fo
r Pu
blic
Pol
icy
Prio
ritie
s.
(14)
Chi
ldre
n's
Def
ense
Fun
d (u
ndat
ed).
Hea
d St
art
Rea
utho
riza
tion:
Que
stio
ns a
nd A
nsw
ers.
Was
hing
ton:
Aut
hor.
(0)
Chi
ldre
n's
Def
ense
Fun
d (u
ndat
ed).
Hea
d St
art
Rea
utho
riza
tion:
Que
stio
ns a
nd A
nsw
ers.
Was
hing
ton:
Aut
hor.
(16)
Hea
d St
art I
nfor
mat
ion
& P
ublic
atio
n C
ente
r(2
002)
. Ear
ly H
ead
Star
t Inf
orm
atio
n K
it. W
ashi
ngto
n: H
ead
Star
t Bur
eau,
Adm
inis
trat
ion
for
Chi
ldre
n &
Fam
ilies
, U.S
.D
epar
tmen
t of
Hea
lth &
Hum
an S
ervi
ces.
(17)
Chi
ldre
n's
Def
ense
Fun
d (u
ndat
ed).
Hea
d St
art
Rea
utho
riza
tion:
Que
stio
ns a
nd A
nsw
ers.
Was
hing
ton:
Aut
hor.
SC
HO
OL
SU
CC
ES
S(1
) M
urdo
ck, S
., et
. al.
(200
2). T
he T
exas
Cha
lleng
e in
the
Tw
enty
-Fir
st C
entu
ry: I
mpl
icat
ions
of
Popu
latio
n C
hang
e fo
r th
eFu
ture
of
Tex
as. C
olle
ge S
tatio
n: T
exas
A &
M U
nive
rsity
,D
epar
tmen
t of
Rur
al S
ocio
logy
.
(2)
Mur
dock
, S.,
et. a
l. (2
002)
. The
Tex
as C
halle
nge
in th
eT
wen
ty-F
irst
Cen
tury
: Im
plic
atio
ns o
f Po
pula
tion
Cha
nge
for
the
Futu
re o
f T
exas
. Col
lege
Sta
tion:
Tex
as A
& M
Uni
vers
ity,
Dep
artm
ent o
f R
ural
Soc
iolo
gy.
(3)
Mur
dock
, S.,
et. a
l. (2
002)
. The
Tex
as C
halle
nge
in th
eT
wen
ty-F
irst
Cen
tury
: Im
plic
atio
ns o
f Po
pula
tion
Cha
nge
for
the
Futu
re o
f T
exas
. Col
lege
Sta
tion:
Tex
as A
& M
Uni
vers
ity,
Dep
artm
ent o
f R
ural
Soc
iolo
gy.
(4)
Cen
ter
for
Publ
ic P
olic
y Pr
iori
ties
(199
9). T
he D
ebat
eO
ver
Dro
pout
s: H
ow M
any
Are
The
re?
Aus
tin: A
utho
r.
(5)
U.S
. Dep
artm
ent o
f H
ealth
and
Hum
an S
ervi
ces
(200
2). T
rend
s in
the
Wel
l-B
eing
of
Am
eric
a's
Chi
ldre
n an
dY
outh
. Was
hing
ton:
Aut
hor.
(6)
Supi
k, J
. & J
ohns
on, R
. (19
99).
Mis
sing
: Tex
asY
outh
-Dro
pout
and
Attr
ition
Rat
es in
Tex
as P
ublic
Hig
hSc
hool
s. S
an A
nton
io: I
nter
cultu
ral D
evel
opm
ent R
esea
rch
Ass
ocia
tion.
(7)
Cen
ter
for
Publ
ic P
olic
y Pr
iori
ties
(199
9). S
tude
ntA
sses
smen
t and
Per
form
ance
. Aus
tin: A
utho
r.
(D)
Inte
rcul
tura
l Dev
elop
men
t Res
earc
h A
ssoc
iatio
n(2
003)
. Ret
entio
n an
d H
igh
Stak
es T
estin
g, A
ccou
ntab
ility
,an
d So
me
Alte
rnat
ives
to E
xist
ing
Stat
e Po
licie
s.Sa
n A
nton
io: A
utho
r.
TE
EN
S A
T R
ISK
(I)
U.S
. Off
ice
of th
e Su
rgeo
n G
ener
al (
2002
). Y
outh
Vio
lenc
e: A
Rep
ort o
f th
e Su
rgeo
n G
ener
al. W
ashi
ngto
n: U
.S.
Dep
artm
ent o
f H
ealth
and
Hum
an S
ervi
ces.
(2)
U.S
. Dep
artm
ent o
f H
ealth
and
Hum
an S
ervi
ces
(200
2). T
rend
s in
the
Wel
l-B
eing
of
Am
eric
a's
Chi
ldre
n an
dY
outh
. Was
hing
ton:
Aut
hor.
(3)
U.S
. Dep
artm
ent o
f H
ealth
and
Hum
an S
ervi
ces
(200
2). T
rend
s in
the
Wel
l-B
eing
of
Am
eric
a's
Chi
ldre
n an
dY
outh
. Was
hing
ton:
Aut
hor.
(4)
U.S
. Dep
artm
ent o
f H
ealth
and
Hum
an S
ervi
ces
(200
2). T
rend
s in
the
Wel
l-B
eing
of
Am
eric
a's
Chi
ldre
n an
dY
outh
. Was
hing
ton:
Aut
hor.
(5)
U.S
. Dep
artm
ent o
f H
ealth
and
Hum
an S
ervi
ces
(200
2). T
rend
s in
the
Wel
l-B
eing
of
Am
eric
a's
Chi
ldre
n an
dY
outh
. Was
hing
ton:
Aut
hor.
(6)
U.S
. Dep
artm
ent o
f H
ealth
and
Hum
an S
ervi
ces
(200
2). T
rend
s in
the
Wel
l-B
eing
of
Am
eric
a's
Chi
ldre
n an
dY
outh
. Was
hing
ton:
Aut
hor.
(7)
U.S
. Off
ice
of th
e Su
rgeo
n G
ener
al (
2002
). Y
outh
Vio
lenc
e: A
Rep
ort o
f th
e Su
rgeo
n G
ener
al. W
ashi
ngto
n: U
.S.
Dep
artm
ent o
f H
ealth
and
Hum
an S
ervi
ces.
(9)
U.S
. Off
ice
of th
e Su
rgeo
n G
ener
al (
2002
). Y
outh
Vio
lenc
e: A
Rep
ort o
f th
e Su
rgeo
n G
ener
al. W
ashi
ngto
n: U
.S.
Dep
artm
ent o
f H
ealth
and
Hum
an S
ervi
ces.
(9)
Man
love
, J.,
Ter
ry-H
umen
, E.,
Papi
llo, A
.,Fr
anze
tta, K
., W
illia
ms,
S. &
Rya
n, S
. (20
02).
Pre
vent
ing
Tee
nage
Pre
gnan
cy, C
hild
bear
ing,
and
Sex
ually
Tra
nsm
itted
Dis
ease
s: W
hat t
he R
esea
rch
Show
s. W
ashi
ngto
n: C
hild
Tre
nds.
(10)
Fed
eral
Int
erag
ency
For
um o
n C
hild
and
Fam
ilySt
atis
tics
(200
2). A
mer
ica'
s C
hild
ren:
Key
Nat
iona
l Ind
icat
ors
of W
ell-
Bei
ng 2
002.
Was
hing
ton:
U.S
. Gov
ernm
ent
Prin
ting
Off
ice.
(U)
U.S
. Dep
artm
ent o
f H
ealth
& H
uman
Ser
vice
s,A
dmin
istr
atio
n on
Chi
ldre
n, Y
outh
& F
amili
es (
2003
).C
hild
Mal
trea
tmen
t 200
1. W
ashi
ngto
n: U
.S. G
over
nmen
tPr
intin
g O
ffic
e.
(12)
Fed
eral
Int
erag
ency
For
um o
n C
hild
and
Fam
ilySt
atis
tics
(200
2). A
mer
ica'
s C
hild
ren:
Key
Nat
iona
l Ind
icat
ors
of W
ell-
Bei
ng 2
002.
Was
hing
ton:
U.S
. Gov
ernm
ent P
rint
ing
Off
ice. (1
3) C
hild
Tre
nds
(200
2). F
ast F
acts
at a
Gla
nce.
Was
hing
ton:
Aut
hor.
(14)
Chi
ld T
rend
s (2
002)
. Fas
t Fac
ts a
t a G
lanc
e.W
ashi
ngto
n: A
utho
r.
(")
U.S
. Dep
artm
ent o
f H
ealth
and
Hum
an S
ervi
ces
(200
2). T
rend
s in
the
Wel
l-B
eing
of
Am
eric
a's
Chi
ldre
n an
dY
outh
. Was
hing
ton:
Aut
hor.
(16)
Chi
ld T
rend
s (2
002)
. Fas
t Fac
ts a
t a G
lanc
e.W
ashi
ngto
n: A
utho
r.
(")
Man
love
, J.,
Ter
ry-H
umen
, E.,
Papi
llo, A
.,Fr
anze
tta, K
., W
illia
ms,
S. &
Rya
n, S
. (20
02).
Pre
vent
ing
Tee
nage
Pre
gnan
cy, C
hild
bear
ing,
and
Sex
ually
Tra
nsm
itted
Dis
ease
s: W
hat t
he R
esea
rch
Show
s. W
ashi
ngto
n: C
hild
Tre
nds.
(111
) U
.S. D
epar
tmen
t of
Hea
lth a
nd H
uman
Ser
vice
s(2
002)
. Tre
nds
in th
e W
ell-
Bei
ng o
f A
mer
ica'
s C
hild
ren
and
You
th. W
ashi
ngto
n: A
utho
r.
(19)
U.S
. Dep
artm
ent o
f H
ealth
and
Hum
an S
ervi
ces
(200
2). T
rend
s in
the
Wel
l-B
eing
of
Am
eric
a's
Chi
ldre
n an
dY
outh
. Was
hing
ton:
Aut
hor.
(20)
Chi
ld T
rend
s (2
002)
. Fas
t Fac
ts a
t a G
lanc
e.W
ashi
ngto
n: A
utho
r.
(21)
U.S
. Dep
artm
ent o
f H
ealth
and
Hum
an S
ervi
ces
(200
2). T
rend
s in
the
Wel
l-B
eing
of
Am
eric
a's
Chi
ldre
n an
dY
outh
. Was
hing
ton:
Aut
hor.
(22)
Chi
ld T
rend
s (2
002)
. Fas
t Fac
ts a
t a G
lanc
e.W
ashi
ngto
n: A
utho
r.
(23)
Man
love
, J.,
Ter
ry-H
umen
, E.,
Papi
llo, A
.,Fr
anze
tta, K
., W
illia
ms,
S. &
Rya
n, S
. (20
02).
Pre
vent
ing
Tee
nage
Pre
gnan
cy, C
hild
bear
ing,
and
Sex
ually
Tra
nsm
itted
Dis
ease
s: W
hat t
he R
esea
rch
Show
s. W
ashi
ngto
n: C
hild
Tre
nds.
(24)
Man
love
, J.,
Ter
ry-H
umen
, E.,
Papi
llo, A
.,Fr
anze
tta, K
., W
illia
ms,
S. &
Rya
n, S
. (20
02).
Pre
vent
ing
Tee
nage
Pre
gnan
cy, C
hild
bear
ing,
and
Sex
ually
Tra
nsm
itted
Dis
ease
s: W
hat t
he R
esea
rch
Show
s. W
ashi
ngto
n: C
hild
Tre
nds.
PHY
SIC
AL
, SO
CIA
L &
EM
OT
ION
AL
HE
LT
H(')
U.S
. Dep
artm
ent o
f H
ealth
and
Hum
an S
ervi
ces
(200
2). T
rend
s in
the
Wel
l-B
eing
of
Am
eric
a's
Chi
ldre
n an
dY
outh
. Was
hing
ton:
Aut
hor.
(2)
U.S
. Dep
artm
ent o
f H
ealth
and
Hum
an S
ervi
ces
(200
2). T
rend
s in
the
Wel
l-B
eing
of
Am
eric
a's
Chi
ldre
n an
dY
outh
. Was
hing
ton:
Aut
hor.
(3)
U.S
. Dep
artm
ent o
f H
ealth
and
Hum
an S
ervi
ces
(200
2). T
rend
s in
the
Wel
l-B
eing
of
Am
eric
a's
Chi
ldre
n an
dY
outh
. Was
hing
ton:
Aut
hor.
(4)
U.S
. Dep
artm
ent o
f H
ealth
and
Hum
an S
ervi
ces
(200
2). T
rend
s in
the
Wel
l-B
eing
of
Am
eric
a's
Chi
ldre
n an
dY
outh
. Was
hing
ton:
Aut
hor.
(5)
Fede
ral I
nter
agen
cy F
orum
on
Chi
ld a
nd F
amily
Stat
istic
s (2
002)
. Am
eric
a's
Chi
ldre
n: K
ey N
atio
nal I
ndic
ator
sof
Wel
l-B
eing
200
2. W
ashi
ngto
n: U
.S. G
over
nmen
t Pri
ntin
gO
ffic
e. (6)
Fede
ral I
nter
agen
cy F
orum
on
Chi
ld a
nd F
amily
Stat
istic
s (2
002)
. Am
eric
a's
Chi
ldre
n: K
ey N
atio
nal I
ndic
ator
sof
Wel
l-B
eing
200
2. W
ashi
ngto
n: U
.S. G
over
nmen
tPr
intin
g O
ffic
e.
(7)
U.S
. Dep
artm
ent o
f H
ealth
and
Hum
an S
ervi
ces
(200
2). T
rend
s in
the
Wel
l-B
eing
of
Am
eric
a's
Chi
ldre
n an
dY
outh
. Was
hing
ton:
Aut
hor.
(9 U
.S. D
epar
tmen
t of
Hea
lth a
nd H
uman
Ser
vice
s(2
002)
. Tre
nds
in th
e W
ell-
Bei
ng o
f A
mer
ica'
s C
hild
ren
and
You
th. W
ashi
ngto
n: A
utho
r.
(9)
U.S
. Dep
artm
ent o
f H
ealth
and
Hum
an S
ervi
ces
(200
2). T
rend
s in
the
Wel
l-B
eing
of
Am
eric
a's
Chi
ldre
n an
dY
outh
. Was
hing
ton:
Aut
hor.
(10)
Fam
ilies
USA
(20
03).
Nea
rly
One
in T
hree
Non
-E
lder
ly A
mer
ican
s. W
ashi
ngto
n: A
utho
r.
(11)
Dun
kelb
erg,
A. (
2003
). W
hat I
mpa
ct H
ave
Med
icia
dan
d C
HIP
Had
on
the
Tot
al N
umbe
r of
Uni
nsur
ed T
exas
Chi
ldre
n? A
ustin
: Cen
ter
for
Publ
ic P
olic
y Pr
iori
ties.
(12)
Dun
kelb
erg,
A. (
2003
). W
hat I
mpa
ct H
ave
Med
icai
dan
d C
HIP
Had
on
the
Tot
al N
umbe
r of
Uni
nsur
ed T
exas
Chi
ldre
n? A
ustin
: Cen
ter
for
Publ
ic P
olic
y Pr
iori
ties.
HU
NG
ER
&N
UT
RIT
ION
(1)
Bic
kel,
G.,
Nor
d, M
., Pr
ice,
C.,
Ham
ilton
, W a
ndC
ook,
J. (
2000
). G
uide
to M
easu
ring
Hou
seho
ld F
ood
Secu
rity
,R
evis
ed 2
000.
Ale
xand
ria,
VA
: U.S
. Dep
artm
ent o
fA
gric
ultu
re.
(2)
Nor
d, M
., A
ndre
ws,
M. &
Car
lson
, S. (
2002
).H
ouse
hold
Foo
d Se
curi
ty in
the
Uni
ted
Stat
es. W
ashi
ngto
n: E
RS
Food
Ass
ista
nce
and
Nut
ritio
n R
esea
rch
Rep
ort N
o.FA
NR
R29
.
(3)
Bou
shey
, H.,
Bro
cht,
C.,
Gun
ders
en, B
. &B
erns
tein
, J. (
2001
). H
ards
hips
in A
mer
ica:
The
Rea
l Sto
ry o
fW
orki
ng F
amili
es. W
ashi
ngto
n: E
cono
mic
Pol
icy
Inst
itute
.
(4)
Zed
lew
ski,
S. (
2000
). S
naps
hots
of
Am
eric
a's
Fam
ilies
II: F
amily
Eco
nom
ic W
ell-
Bei
ng. W
ashi
ngto
n: U
rban
Inst
itute
.
(5)
Fede
ral I
nter
agen
cy F
orum
on
Chi
ld a
nd F
amily
Stat
istic
s (2
002)
. Am
eric
a's
Chi
ldre
n: K
ey N
atio
nal I
ndic
ator
sof
Wel
l-B
eing
200
2. W
ashi
ngto
n: U
.S. G
over
nmen
t Pri
ntin
gO
ffic
e. (6)
Info
rmat
ion
desc
ribi
ng F
ood
Stam
p, W
IC, a
ndsc
hool
lunc
h pr
ogra
ms
com
es f
rom
the
Food
Res
earc
h an
dA
ctio
n C
ente
r w
ebsi
te, w
ww
.fra
c.or
g.
SAFE
TY
&P
ER
SO
NA
L S
EC
UR
ITY
(1)
Def
initi
ons
of th
e fo
ur m
ain
type
s of
chi
ld m
altr
eat-
men
t com
e fr
om th
e C
hild
Wel
fare
Lea
gue
of A
mer
ica
web
site
, ww
w.c
wla
.org
.
(2)
U.S
. Dep
artm
ent o
f H
ealth
& H
uman
Ser
vice
s,A
dmin
istr
atio
n on
Chi
ldre
n, Y
outh
& F
amili
es (
2003
).C
hild
Mal
trea
tmen
t 200
1. W
ashi
ngto
n: U
.S. G
over
nmen
tPr
intin
g O
ffic
e.
(3)
U.S
. Dep
artm
ent o
f H
ealth
& H
uman
Ser
vice
s,A
dmin
istr
atio
n on
Chi
ldre
n, Y
outh
& F
amili
es (
2003
).C
hild
Mal
trea
tmen
t 200
1. W
ashi
ngto
n: U
.S. G
over
nmen
tPr
intin
g O
ffic
e.
(4)
Cha
lk, R
., G
ibbo
ns, A
. & S
caru
pa, H
. (20
02).
The
Mul
tiple
Dim
ensi
ons
of C
hild
Abu
se a
nd N
egle
ct: N
ew I
nsig
hts
Into
an
Old
Pro
blem
. Was
hing
ton:
Chi
ld T
rend
s.
(5)
Mal
m, K
., B
ess,
R.,
Leo
s-U
rbel
, J.,
Gre
en, R
. &M
arko
witz
, T. (
2001
). R
unni
ng to
Kee
p in
Pla
ce: T
heC
ontin
uing
Evo
lutio
n of
Our
Nat
ion'
s C
hild
Wel
fare
Sys
tem
.W
ashi
ngto
n: T
he U
rban
Ins
titut
e.
(6)
Tex
as D
epar
tmen
t of
Prot
ectiv
e an
d R
egul
ator
ySe
rvic
es. (
2002
). A
nnua
l Rep
ort 2
002.
Aus
tin: A
utho
r.
(7)
Tex
as D
epar
tmen
t of
Prot
ectiv
e an
d R
egul
ator
ySe
rvic
es. (
2002
). 2
002
Dat
a B
ook.
Aus
tin: A
utho
r.
(0)
Stat
istic
s on
the
num
ber
of f
amili
es r
ecei
ving
CPS
serv
ices
, ado
ptio
ns, a
nd c
hild
dea
ths
com
e fr
om D
PRS'
Ann
ual R
epor
t 200
2.
(9)
Dea
l, L
., G
omby
, D.,
Zip
piro
li, L
. & B
ehrm
an, R
.(2
000)
. Uni
nten
tiona
l inj
urie
s in
chi
ldho
od: A
naly
sis
and
reco
mm
enda
tions
. The
Fut
ure
of C
hild
ren,
10(
1), p
. 4-2
2.
(10)
Dea
l, L
., G
omby
, D.,
Zip
piro
li, L
. & B
ehrm
an, R
.(2
000)
. Uni
nten
tiona
l inj
urie
s in
chi
ldho
od: A
naly
sis
and
reco
mm
enda
tions
. The
Fut
ure
of C
hild
ren,
10(
1), p
. 4-2
2.
(")
Dat
a on
infa
nt, c
hild
, and
you
th d
eath
rat
es c
ome
from
the
Chi
ld T
rend
s D
ata
Ban
k, a
vaila
ble
on th
e C
hild
Tre
nds
web
site
, ww
w.c
hild
tren
dsda
taba
nk.o
rg.
(12)
Rei
ch, K
., C
ulro
ss, P
& B
ehrm
an, R
. (20
02).
Chi
ldre
n, y
outh
, and
gun
vio
lenc
e: A
naly
sis
and
reco
m-
men
datio
ns. T
he F
utur
e of
Chi
ldre
n, 1
2(2)
, p. 5
-24.
(13)
Rei
ch, K
., C
ulro
ss, P
& B
ehrm
an, R
. (20
02).
Chi
ldre
n, y
outh
, and
gun
vio
lenc
e: A
naly
sis
and
reco
m-
men
datio
ns. T
he F
utur
e of
Chi
ldre
n, 1
2(2)
, p. 5
-24.
(IA
) R
eich
, K.,
Cul
ross
, P &
Beh
rman
, R. (
2002
).C
hild
ren,
you
th, a
nd g
un v
iole
nce:
Ana
lysi
s an
d re
com
-m
enda
tions
. The
Fut
ure
of C
hild
ren,
12(
2), p
. 5-2
4.
(15)
Rei
ch, K
., C
ulro
ss, P
& B
ehrm
an, R
. (20
02).
Chi
ldre
n, y
outh
, and
gun
vio
lenc
e: A
naly
sis
and
reco
m-
men
datio
ns. T
he F
utur
e of
Chi
ldre
n, 1
2(2)
, p. 5
-24.
CE
NT
ER
FO
R P
UB
LIC
PO
LIC
Y P
RIO
RIT
IES
MA
NA
GE
ME
NT
AN
DA
DM
INIS
TR
AT
IVE
SU
PP
OR
T
Exe
cutiv
e D
irect
or
F. S
cott
McC
own
Ass
ocia
te D
irect
or
Pat
rick
Bre
sette
TE
XA
S K
IDS
CO
UN
T S
TA
FF
coT
exas
KID
S C
OU
NT
Dire
ctor
Day
na F
inet
, Ph.
D.
Res
earc
h A
ssis
tant
Gre
g H
amm
ond
CP
PP
ST
AF
F
Edi
toria
l Rev
iew
and
Cop
yedi
ting
Cel
ia H
ager
t
Edi
toria
l Rev
iew
Ann
e D
unke
lber
g
Dic
k La
vine
Jaso
n S
abo
Com
mun
icat
ions
Chr
is P
iepe
r
Dev
elop
men
t
Jane
t Hut
chis
on
EX
TE
RN
AL
SU
PP
OR
T
Com
pute
r &
Web
Tec
hnol
ogy
Art
uro
Cas
tella
nos
Des
ign
& P
rodu
ctio
n
Per
side
a, In
c.
Leig
h G
riffit
hs
Bill
Hin
chcl
iffe
Dan
yel T
russ
el
CO
NT
AC
T U
S
,T
exas
KID
S C
OU
NT
Cen
ter
for
Pub
lic P
olic
y P
riorit
ies
900
Lydi
a S
tree
tA
ustin
, TX
787
02
Pho
ne: 5
12.3
20.0
222
Fax
: 512
.320
.022
7
Em
ail:
finet
@cp
pp.o
rg
http
://w
ww
.cpp
p.or
g/ki
dsca
uint
Sup
port
us
thou
gh y
our
tax-
dedu
ctib
le.
do;:l
atio
n. Y
ou c
an g
ive
onlin
e at
hitp
://w
ww
.cpp
p.or
g/or
der/
supp
ort.h
tml
Sig
n up
for
inst
ant a
naly
sis
and
upda
tes
thro
ugh
the
Pol
icy
Pag
e, o
urem
ail a
lert
ser
vice
. Put
"S
UB
SC
RIB
E"
in
the
subj
ect f
ield
of a
n em
ail t
o
cppp
@cp
pp.io
rg.
104
U.S. Department of EducationOffice of Educational Research and Improvement (OERI)
National Library of Education (NLE)Educational Resources Information Center (ERIC)
NOTICE
Reproduction Basis
Educational Henna In lunation Centel
This document is covered by a signed "Reproduction Release (Blanket)"form (on file within the ERIC system), encompassing all or classes ofdocuments from its source organization and, therefore, does not require a
"Specific Document" Release form.
This document is Federally-funded, or carries its own permission toreproduce, or is otherwise in the public domain and, therefore, may bereproduced by ERIC without a signed Reproduction Release form (either"Specific Document" or "Blanket").
EFF-089 (1/2003)
/) 03/R93--.