representing information flow in building design … · representing information flow in building...
TRANSCRIPT

REPRESENTING INFORMATION FLOW
IN BUILDING DESIGN PROCESS
USING THE PARAMETER-BASED
DESIGN STRUCTURE MATRIX
A THESIS SUBMITTED TO
THE INSTITUTE OF ECONOMICS AND SOCIAL SCIENCES
OF BİLKENT UNIVERSITY
IN PARTIAL FULFILLMENT OF THE REQUIREMENTS
FOR THE DEGREE OF
DOCTOR OF PHILOSOPHY
IN ART, DESIGN AND ARCHITECTURE
By
Şule Taşlı Pektaş
September, 2003
ii
I certify that I have read this thesis and that in my opinion it is fully
adequate, in scope and in quality, as a thesis for the degree of Doctor
of Philosophy in Art, Design and Architecture.
Prof. Dr. Mustafa Pultar (Supervisor)
I certify that I have read this thesis and that in my opinion it is fully
adequate, in scope and in quality, as a thesis for the degree of Doctor
of Philosophy in Art, Design and Architecture.
Prof. Dr. Can Baykan
I certify that I have read this thesis and that in my opinion it is fully
adequate, in scope and in quality, as a thesis for the degree of Doctor
of Philosophy in Art, Design and Architecture.
Assoc. Prof. Dr. Halime Demirkan
I certify that I have read this thesis and that in my opinion it is fully
adequate, in scope and in quality, as a thesis for the degree of Doctor
of Philosophy in Art, Design and Architecture.
Assoc. Prof. Dr. Ali İhsan Ünay
I certify that I have read this thesis and that in my opinion it is fully
adequate, in scope and in quality, as a thesis for the degree of Doctor
of Philosophy in Art, Design and Architecture.
Assist. Prof. Dr. Burcu Şenyapılı
Approved by the Institute of Fine Arts
Prof. Dr. Bülent Özgüç, Director of the Institute of Fine Arts
iii
ABSTRACT
REPRESENTING INFORMATION FLOW IN BUILDING DESIGN PROCESS USING THE PARAMETER-BASED DESIGN STRUCTURE
MATRIX
Şule Taşlı Pektaş
Ph.D. in Art, Design, and Architecture
Supervisor: Prof. Dr. Mustafa Pultar
September, 2003
The Architecture/Engineering/Construction (AEC) industry is one of the
multidisciplinary domains in which collaboration among related parties is
of utmost importance. Despite the intense flow of information between
design professionals, there is a lack of research to better understand
and manipulate these flows. Most of the current process modeling tools
in the AEC industry do not enable analyses of iterative information
cycles. Moreover, these tools represent the process at high levels, thus,
they are inappropriate for multi-parameter problems like building design.
With a view to alleviate these problems, this thesis introduces the use of
parameter-based design structure matrix as a process modeling and
system analysis tool for building design. The method reveals insights
into the process structure, optimum sequence of parameter decisions,
iterative cycles and concurrency in the process. A framework for
parameter-based DSM applications in building design is proposed and
the application of the framework is demonstrated through two case
studies on real life building design problems.
Keywords: Collaborative Building Design, Design Integration, Design
Management, Design Process Modeling, Information Flow, and
Parameter-based Design Structure Matrix
iv
ÖZET YAPI TASARIM SÜREÇLERİNDE BİLGİ AKIŞLARININ PARAMETRE ESASLI TASARIM YAPISI MATRİSİ YÖNTEMİYLE MODELLENMESİ
Şule Taşlı Pektaş
Güzel Sanatlar, Tasarım, ve Mimarlık Fakültesi
Doktora Çalışması
Tez Yöneticisi: Prof. Dr. Mustafa Pultar
Eylül, 2003
Yapı sektörü, değişik meslek gruplarının birlikte çalışmasının çok önemli
olduğu disiplinler arası alanlardan biridir. Yapı tasarım sürecinde
katılımcılar arası yoğun bir bilgi akışı olmasına rağmen, bu akışlar
yeterince araştırılmamıştır. Yapı endüstrisinde şu anda kullanılmakta
olan pek çok süreç modelleme aracı tasarımdaki döngüsel bilgi
akışlarının analizine olanak vermemektedir. Ayrıca, bu araçlar tasarım
sürecinin sadece üst seviyelerde modellenmesini sağlamakta,
dolayısıyla yapı tasarımı gibi pek çok parametre içeren bir alanda
etkinlikleri yetersiz kalmaktadır.
Bahsedilen sorunları çözmek amacıyla, bu tezde parametre esaslı
tasarım yapısı matrisi yöntemi yapı tasarımı için bir sistem analizi ve
süreç modellemesi aracı olarak önerilmektedir. Önerilen yöntem,
tasarım sürecinin yapısı, parametre kararlarının sırası, döngüsel bilgi
akışları ve eşzamanlılık konularında bilgi üretmektedir. Yöntemin yapı
tasarımında kullanılması için bir çerçeve geliştirilmiş ve önerilen çerçeve
iki alan çalışmasında gerçek yapı tasarımı sorunlarına uygulanmıştır.
Anahtar Kelimeler: Disiplinler arası Yapı Tasarımı, Tasarım
Entegrasyonu, Tasarım Süreç Modelleri, Bilgi Akışı, ve Parametre
Esaslı Tasarım Yapısı Matrisi
v
ACKNOWLEDGEMENTS Foremost, I would like to thank my supervisor, Prof. Dr. Mustafa Pultar
for his invaluable support and tutorship. He always encouraged me to
take an interdisciplinary approach in both design and research which
shaped the evolution of this dissertation. Secondly, I would like to thank
my dissertation committee members, Assoc. Prof. Dr. Halime Demirkan
and Assoc. Prof. Dr. Ali İhsan Ünay who made valuable comments on
this study in the supervisory committee meetings.
The design professionals who provided input for the case studies were
Kutsi Şamlı (architect), Zafer Kınacı (structural engineer), İhsan Taşeli
(mechanical engineer), Nihat Akay (electrical engineer), and Atakan
Ogan (OTIS). I thank them very much for their time and support.
Besides information on the design processes they undertake, these
professionals provided valuable comments on the application of the
method in the construction industry which guided me in developing
application proposals.
Finally, I would like to thank my family for their love, encouragement,
and support. My husband Sait Emre Pektaş always helped and
encouraged me. I am also grateful to my mother Şükran Taşlı and my
father Mustafa Taşlı for their continuous support during my education.
vi
TABLE OF CONTENTS
SIGNATURE PAGE .................................................................................... ii
ABSTRACT..........................................................................................…….iii
ÖZET....................................................................................................... …iv
ACKNOWLEDGEMENTS............................................................................ v
TABLE OF CONTENTS..............................................................................vi
LIST OF TABLES ......................................................................................xii
LIST OF FIGURES ................................................................................... xiii
1. INTRODUCTION .................................................................................... 1
1.1 Problem Statement ............................................................................ 1
1.2 Thesis Objectives............................................................................... 4
1.3 Structure of the Thesis....................................................................... 5
2. COLLABORATIVE DESIGN RESEARCH IN THE CONSTRUCTION
INDUSTRY ................................................................................................. 8
2.1 Definitions of the General Terms ..................................................... 10
2.2 Approaches to Collaboration Research ........................................... 12
2.2.1 Educational Approaches ............................................................ 12
2.2.2 Studies of Communication and Negotiation ............................... 13
2.2.3 Information Modeling Approach ................................................. 14
2.2.3.1 Information Related Problems in the Construction Industry . 15
2.2.3.2 What is a Model? ................................................................. 19
2.2.3.3 Advantages of the Information Modeling Approach ............. 20
vii
2.2.3.4 Types of Information Models................................................ 20
3. PROCESS MODELS OF DESIGN ....................................................... 23
3.1 Descriptive Generic Frameworks..................................................... 23
3.1.1 Design Methods Models ......................................................... 23
3.1.2 The RIBA Plan of Work........................................................... 24
3.1.3 The Generic Design and Construction Process Protocol ........ 25
3.2 Formal Activity Models..................................................................... 27
3.2.1 Network Models ......................................................................... 28
3.2.1.1 PERT/CPM .......................................................................... 28
3.2.1.2 Petri Nets ............................................................................. 29
3.2.1.3 Data Flow Diagrams ............................................................ 31
3.2.1.4 IDEF0................................................................................... 32
3.2.2 Entity-Relationship Diagrams..................................................... 35
3.2.3 Unified Modeling Language ....................................................... 37
3.2.4 Activity-based DSM.................................................................... 38
3.3 Conventional/Empirical Methods ..................................................... 39
3.4 Shortcomings of Current Building Design Process Models.............. 40
4. DESIGN STRUCTURE MATRIX METHOD.......................................... 42
4.1 Description of the Method ................................................................ 42
4.1.1 DSM Operations ........................................................................ 43
4.1.2 A Simple DSM Example............................................................. 45
4.1.3 Building and Using a DSM......................................................... 47
4.2 DSM Types and Applications........................................................... 49
4.2.1 Component-based DSM ............................................................ 50
viii
4.2.2 Team-based DSM...................................................................... 51
4.2.3 Activity-based DSM.................................................................... 53
4.2.4 Parameter-based DSM .............................................................. 55
4.2.5 Variations on the Basic DSM Method ........................................ 59
4.2.6 DSM Applications in the Construction Industry .......................... 63
4.3 DSM Tools ....................................................................................... 66
4.3.1 Standalone Programs ................................................................ 66
4.3.2 Web-based Tools....................................................................... 67
5. PARAMETER-BASED DSM FOR BUILDING DESIGN ........................ 69
5.1 Underlying Paradigms...................................................................... 69
5.1.1 Design Methods Research Tradition.......................................... 69
5.1.2 Lean Design............................................................................... 71
5.2 Expected Benefits ............................................................................ 72
5.2.1 Process Improvement ................................................................ 73
5.2.1.1 Iteration Management .......................................................... 73
5.2.1.2 Common Understanding of a Process ................................. 77
5.2.1.3 Concurrent Engineering ....................................................... 79
5.2.2 Process Integration.................................................................... 80
5.2.3 Other Information Processing Applications ................................ 83
5.3 A Knowledge Management Framework for Parameter-based DSM 84
5.3.1 Assumptions and Scope of the Proposed Model ....................... 86
5.3.2 The Need for Explicit Definition of Parameters and Industry
Foundation Classes ............................................................................ 87
5.3.3 Classification of Parameters ...................................................... 91
ix
5.3.3.1 Classification According to Building Parts............................ 93
5.3.3.2 Classification According to Parent Activities ........................ 95
5.3.3.3 Classification According to Information Ownership .............. 96
5.3.3.4 Classification According to Information Content................... 96
5.3.4 Dealing with Large DSM Models.............................................. 101
5.3.5 Complementary Use of IDEF0 and DSM ................................. 103
5.3.6 Implications for Implementation Using Information Technology105
6. CASE STUDY 1: SUSPENDED CEILING DESIGN............................ 109
6.1 Introduction to the Case Studies.................................................... 109
6.2 Suspended Ceiling System Architecture........................................ 113
6.3 Suspended Ceiling Design Process............................................... 116
6.4 Analyzing Suspended Ceiling Design Process with DSM.............. 119
6.4.1 Research Setting ..................................................................... 119
6.4.2 The Project .............................................................................. 120
6.4.3 Objectives of the Analysis........................................................ 124
6.4.4 The Procedure ......................................................................... 125
6.4.4.1 The Design Configuration .................................................. 126
6.4.4.2 Data Collection................................................................... 126
6.4.4.3 The IDEF0 Models ............................................................. 128
6.4.4.4 The Information Database ................................................. 135
6.4.4.5 Production of the Matrix and Analyses............................... 137
6.5 Results and Discussion.................................................................. 144
6.5.1 Observations on Suspended Ceiling System Interface Design 144
6.5.2 Observations on Suspended Ceiling Assembly Design ........... 147
x
6.5.3 A Comparison between the Assembly Level DSM and the System
Level DSM ........................................................................................ 148
7. CASE STUDY 2: ELEVATOR DESIGN .............................................. 153
7.1 Introduction .................................................................................... 153
7.2 Elevator System Architecture......................................................... 153
7.3 Elevator Design Process................................................................ 157
7.4 Analyzing Elevator Design Process with Parameter-based DSM .. 160
7.4.1 Research Setting ..................................................................... 160
7.4.2 The Scope and Limitations of the Model.................................. 161
7.4.3 Objectives of the Analysis........................................................ 162
7.4.4 The Procedure ......................................................................... 162
7.4.4.1 Data Collection................................................................... 163
7.4.4.2 The IDEF0 Models ............................................................. 164
7.4.4.3 The Information Database ................................................. 171
7.4.4.4 Production of the Matrix and Analyses............................... 171
7.5 Results and Discussion.................................................................. 175
8. DISCUSSION AND CONCLUSIONS.................................................. 179
8.1 Implications on the Design Process drawn from the Case Studies 179
8.2 Conclusions ................................................................................... 183
8.2.1 Contributions of the Study to the Subject Field ........................ 183
8.2.2 Challenges of the Proposed Method........................................ 185
8.2.2.1 Data Collection................................................................... 186
8.2.2.2 Data Representation .......................................................... 187
8.2.2.3 Enabling the Widespread Use of the Method..................... 188
xi
8.3 Suggestions for Further Research ................................................. 189
REFERENCES ....................................................................................... 191
APPENDIX A .......................................................................................... 203
A.1 Classification of Building Parts in UNIFORMAT II ......................... 204
A.2 A Classification of Building Design Performance Factors.............. 205
APPENDIX B .......................................................................................... 207
B.1 Suspended Ceiling Design Parameter Definitions......................... 208
B.2 Elevator Design Parameter Definitions.......................................... 212
APPENDIX C.......................................................................................... 217
C.1 A Computer Program For Building the Design Structure Matrix .... 218
C.2 A Computer Program For Partitioning and Banding the Design
Structure Matrix ................................................................................... 223
xii
LIST OF TABLES
Table 3.1: An Overview of the RIBA Plan of Work.................................... 25
Table 4.1: A Taxonomy of System Element Interactions .......................... 50
Table 4.2 Example of a Spatial Interaction Quantification Scheme .......... 51
Table 4.3 A Taxonomy for Information Flows in a Team-based DSM....... 52
Table 4.4: List of Parameters, Their Predecessor(s) and Owner(s) for
Suspended Ceiling Design........................................................................ 56
Table 6.1: An Outline of the Design Process .......................................... 123
Table 6.2: A Comparison between Assembly- and System-level DSM... 148
xiii
LIST OF FIGURES
Figure 1.1: A Generalized Schema of Building Design Process ................. 2
Figure 3.1: A Three-level Scheme for Process Modeling.......................... 23
Figure 3.2: A View from GDCPP Process Map......................................... 26
Figure 3.3: A Petri Net of an Activity that Uses Two Resources ............... 30
Figure 3.4: An Example Data Flow Diagram showing Concept and Scheme
Design Data Flows.................................................................................... 32
Figure 3.5: A Generic IDEF0 Diagram of an Activity................................. 34
Figure 3.6: A Part of a Process Model as an Entity-Relationship Diagram36
Figure 3.7: A Generic UML Activity Diagram ............................................ 38
Figure 4.1: The Initial DSM of the Process ............................................... 45
Figure 4.2: The Partitioned DSM .............................................................. 46
Figure 4.3: The Banded DSM ................................................................... 47
Figure 4.4: Tearing the DSM (a) Tear Decision (b) Torn DSM.................. 47
Figure 4.5: DSM Taxonomy...................................................................... 49
Figure 4.6: A Parameter-based DSM Example (a) The Initial Matrix (b) The
Partitioned Matrix...................................................................................... 58
Figure 5.1: Two Coupled Activities of Elevator Design Process (a) IDEF0
Model (b) Activity-based DSM .................................................................. 82
Figure 5.2: Two Coupled Activities of Elevator Design Process (a) Initial
Parameter-based DSM (b) Partitioned DSM............................................. 83
Figure 5.3: Elevator Car Class and its Attributes in the IFC System......... 89

xiv
Figure 5.4: An IFC Relationship Diagram of Elevator Car and its Frame.. 89
Figure 5.5: The Interfaces of Elevator Car Class in the IFC System......... 90
Figure 5.6: Four different Views of Parameter-based Design ................... 92
Figure 5.7: The Hierarchical Organization of IDEF0 Modeling.................. 95
Figure 5.8: The Four Domains of Suh’s Axiomatic Design Theory ........... 97
Figure 5.9: Suh’s Domains Adapted to Building Design ........................... 98
Figure 5.10: Different Parameters of an Exterior Wall .............................. 99
Figure 5.11: The Proposed Implementation Model ................................. 106
Figure 5.12: A Workflow Proposal for a Project Management System
Utilizing the Parameter-based DSM........................................................ 108
Figure 6.1: A System Design View of Suspended Ceiling ...................... 114
Figure 6.2: A Detail from A Suspended Ceiling System.......................... 115
Figure 6.3: Layered (a) and Shared (b) Schemes for Integration of
Structure, HVAC and Lighting Systems .................................................. 118
Figure 6.4: Ground Floor Plan of Gürbulak Customs Building ................ 122
Figure 6.5: The Scope of the Suspended Ceiling Design Model............. 130
Figure 6.6: The Context Diagram of Suspended Ceiling Design............. 131
Figure 6.7: An IDEF0 Model of Suspended Ceiling Lifecycle.................. 132
Figure 6.8: An IDEF0 Model of Suspended Ceiling Design .................... 133
Figure 6.9: An IDEF0 Model of Suspended Ceiling System Interfaces... 134
Figure 6.10: An Example System Description Sheet .............................. 136
Figure 6.11: An Example Parameter Relations Sheet ............................ 136
Figure 6.12: Initial Parameter-based DSM of Suspended Ceiling Design at
System Level .......................................................................................... 138
xv
Figure 6.13: Initial Parameter-based DSM of Suspended Ceiling Design at
Assembly Level....................................................................................... 139
Figure 6.14: Partitioned Parameter-based DSM of Suspended Ceiling
Design at System Level .......................................................................... 140
Figure 6.15: Partitioned Parameter-based DSM of Suspended Ceiling
Design at Assembly Level....................................................................... 141
Figure 6.16: Banded Parameter-based DSM of Suspended Ceiling Design
at System Level ...................................................................................... 142
Figure 6.17: Banded Parameter-based DSM of Suspended Ceiling Design
at Assembly Level................................................................................... 143
Figure 6.18: Three Configurations that Characterize a System .............. 149
Figure 6.19: Information Flow Percentages in System Level DSM......... 150
Figure 6.20: Information Flow Percentages in Assembly Level DSM ..... 151
Figure 7.1: System Details of Electric Traction (Left) and Hydraulic (Right)
Elevators................................................................................................. 155
Figure 7.2: The Context Diagram of Elevator Design Process................ 166
Figure 7.3: An IDEF0 Model of Elevator Life Cycle................................. 167
Figure 7.4: An IDEF0 Model of Elevator Design ..................................... 168
Figure 7.5: An IDEF0 Model of Elevator Planning .................................. 169
Figure 7.6: An IDEF0 Model of Detailed Design of Elevators ................. 170
Figure 7.7: Initial Parameter-based DSM of Elevator Design.................. 172
Figure 7.8: Partitioned Parameter-based DSM of Elevator Design......... 173
Figure 7.9: Banded Parameter-based DSM of Elevator Design.............. 174

1
1. INTRODUCTION
The Architecture/Engineering/Construction (AEC) industry is one of the
multidisciplinary domains in which collaboration among related parties is of
utmost importance. While the knowledge needed for building processes is
distributed among the different participants from diverse disciplinary
backgrounds, the product of their activities, i.e. the building itself, is (or
should be) highly integrated. Thus, collaboration manifests itself as an
important component of project success. In a survey of AEC companies in
the U.S., collaboration among parties ranked first among the many factors
that affect quality in design phase (Arditi and Günaydın, 1998).
This dissertation addresses the problem of collaboration from an
information flow perspective. The collaborative building design process is
viewed as a series of interdependent decisions of different design
professionals and it is presupposed that like other processes, it is possible
and useful to build quantifiable models of building design. In this
introductory chapter, the research problems and the objectives of the study
are discussed and the structure of the dissertation is briefly outlined.
1.1 Problem Statement
The increasing complexity of buildings and a very competitive market place
have been forcing design professionals to improve their processes in terms
of time and quality. However, systematic design planning is not considered

2
in many building projects. This is due to the common misconception of
some designers that design, being a creative process, cannot be planned
effectively. Even when planning is done, it is performed in an intuitive
manner based on discipline specific programs, despite the fact that
effective design collaboration necessitates planning the flow of
interdisciplinary information. Relatively little research has been made on
the management of the design process compared to production
management in construction (Formoso et al., 1998).
Figure 1.1: A Generalized Schema of Building Design Process (Adapted from Kalay et al., 1998)
Figure 1.1 shows a generalized schema of current building design
processes. As it can be observed in the figure, architects and design
engineers (structural, mechanical, and electrical engineers) constitute the
two foremost groups of building professionals. The main activity of
collaboration of architects and engineers in any project is evaluating and
processing information and then communicating this information between
various parties. Although there is an intense flow of information in building
process, there is a lack of research to better understand and manipulate
these flows (Eastman, 1999). Thus, in current practice, the decision-

3
making that led to specific configurations often remains invisible. These
problems are probably due to the fact that building design is a very difficult
process to manage. It involves thousands of decisions with numerous
interdependencies in a highly uncertain environment. A large number of
personnel are included and each group has its own terminology and design
methods.
Process models of design aim to capture the complexities of the design
process explained above. Such models are based on the premise that
although designs may be unique in different projects, the process of
designing has an underlying structure which may not vary much across the
projects. Although they are valuable in many aspects, existing process
modeling methods in the AEC industry have considerable deficiencies.
First of all, traditionally, building design has been planned by the same
methods used to program construction. These techniques tend to view the
design process as “document production” rather than flow of
interdisciplinary information. Secondly, existing methods represent design
process at high levels and thus, they are not suitable for modeling multi-
parameter problems. Finally, most of the existing models are not capable
of representing and managing iterations which is a main characteristic of
design.
With a view to alleviate these problems, this dissertation proposes
parameter-based design structure matrix (DSM) as a system analysis and

4
process modeling method for building design. Parameter-based DSM is a
structured analysis technique originally developed in the product design
field. The method aims to capture dependencies between decisions on
design parameters and provides means to sequence those decisions
according to the dependency structure. The method has been applied
previously in the automotive industry (Black et al., 1990; Cesiel, 1993;
Dong, 1999), robot design (Rask and Sunnersjö qtd. in Browning, 2001),
aero-engine design (Mascoli, 1999), and software development (Browning,
1998). To the best of the author’s knowledge, however, this dissertation is
the first study that has applied the method in building design.
In light of the discussion presented above, the research questions of this
study are the following;
1. What is the information dependency pattern for design processes of
architects and building design engineers?
2. Can the parameter-based design structure matrix method be utilized to
analyze these processes? If so, how?
1.2 Thesis Objectives
The main goal of this dissertation is to propose an innovative process
modeling method for building design process. Thus, this is a “methods”
dissertation in which the desired methods are developed and/or
engineered. The objectives listed below have evolved naturally in the

5
course of the study and they shaped the structure of the thesis presented
in the next section.
1. Study the different approaches to collaboration research in order to
develop a valid and well-grounded research strategy for analyzing
collaborative building design processes.
2. Analyze the existing process modeling methods in the AEC industry
and identify advantages and disadvantages of each model.
3. Propose a new process modeling method to alleviate the
shortcomings of the existing methods.
4. Develop a framework for the application of the proposed method in
building design and provide means for dealing with the specific
needs of the application field.
5. Demonstrate the application of the proposed method via case
studies.
6. Provide guidance for further studies on the topic.
1.3 Structure of the Thesis
Further chapters of the thesis are organized as follows:
Chapter 2 discusses the recently increased interest in collaborative design
research in the AEC industry and its major drivers. Three different
approaches to collaborative design research are identified; namely,

6
educational approaches, studies of communication and negotiation, and
the information modeling approach. Following a discussion of each
approach, an explanation is included about why an information modeling
approach is taken in this dissertation.
Chapter 3 analyzes existing process modeling methods in the AEC
industry and identifies their common deficiencies. With a view to alleviate
the problems in the currently available methods, a three-level scheme for
AEC process modeling is proposed. In this scheme, parameter-based DSM
represents the lowest level process modeling method, which enables
bottom-up integration of the existing models.
Chapter 4 describes the design structure matrix method. Following an
explanation of how the DSM method works, four types of DSMs
(component-, team-, activity-, and parameter-based DSMs) and their
applications are discussed. This chapter also reviews the available DSM
tools.
Chapter 5 raises the issues related to the use of parameter-based DSM in
building design. First, the paradigms underlying this type of research are
uncovered. Then, expected benefits of the proposed method are discussed
under three headings: process improvement, process integration, and
other information processing applications. Finally, a knowledge
management framework for parameter-based DSM in building design is

7
presented. The framework includes proposals on definition and
classification of parameters and means for dealing with large DSMs. At the
end of the chapter, visions are presented for the utilization of the method
along with software.
Chapters 6 and 7 present two case studies undertaken to demonstrate the
application of the method in real life building design problems. Chapter 6
studies the suspended ceiling design process for a public building project
in Turkey and Chapter 7 analyzes the elevator design process in general
terms. These case studies were chosen to reflect different aspects of the
framework proposed in Chapter 5. Besides the insights gained into the
individual design processes, some common implications were also drawn
from the case studies and discussed at the end of Chapter 7.
Chapter 8 concludes the findings of the thesis. Contributions of the study
and challenges of the proposed method are discussed and suggestions are
made for further research.

8
2. COLLABORATIVE DESIGN RESEARCH IN
THE CONSTRUCTION INDUSTRY
Researches on collaboration in the AEC industry have been based on a
social paradigm of design defined by Mitchell (1994). According to this
paradigm, design is the product of a team of professionals from different
disciplines rather than a product of a single talented individual who has
represented the image of designer since the Renaissance. The
paradigm prioritizes the “whole” over the “parts.” Mitchell presumes that
designers, with the help of the ever developing communication and
software technology, will come together in “virtual” design studios (or
offices) to produce designs without geographical and time constraints
(Mitchell, 1994). This vision has been realized to a great extent in the
second half of the 1990’s when collaboration research gained a
momentum.
Concurrent engineering is another paradigm that has driven
collaborative design research. The concept of concurrent engineering
was initially proposed as a means to minimize product development
time. Since then, many definitions of concurrent engineering have
emerged in the literature. In general, it implies a systematic approach to
the integrated and concurrent design of products and their related
processes (Pena-Mora et al., 2000). Shared product knowledge and a
communications architecture that will create a persistent space to
support interaction among participants throughout all phases of the

9
project are the basic notions of a concurrent engineering environment.
Another important aim of concurrent engineering is to address important
issues early in the project life-cycle. This necessitates involvement of all
parties at a much earlier stage than would be the case in a traditional
construction environment (Anumba and Duke, 2000).
Object-oriented programming and Internet technology are two emerging
computing technologies that play a key role in enabling distributed and
potentially concurrent collaboration for AEC projects. Object-oriented
technology has been extensively used in software engineering and
information management applications during the past decade. The
basic idea of object-oriented programming is to combine software and
data into the same object i.e. combination of the data describing the
object and the operations related to it. It has enabled the definition of
objects in a hierarchy so that an object can inherit the properties of its
“parent” object. It is widely accepted that object-oriented programming
suits the needs of building design, since it allows describing the
attributes and behavior of a broad range of building objects most of
which are well described by their interfaces (Sanders, 1996).
Wide-area and local area computer networks have played an important
role in more effective management of information in and across various
AEC offices. Until the second half of the 1990s, the use of networking
technologies was limited mainly to file transfer and electronic mail. After
1995, the World Wide Web (WWW) became widely available as a
10
graphical interface to the Internet based on a number of protocols for
describing text, graphics, video, and sound data. Software used for
browsing information on the WWW also became useful to view
company-specific information in a secured computing network. These
developments gave way to software products for Internet-based viewing
and sharing of project information (Zamanian and Pittman, 1999).
Today, collaborative design studies for the AEC industry include many
different approaches and an increasing amount of basic and applied
research. In the framework of this dissertation, the domain of
collaboration research is analyzed under three headings, namely,
educational approaches, studies of communication and negotiation, and
information modeling.
2.1 Definitions of the General Terms
The Oxford English Dictionary defines the word “collaborate” as “to co-
operate, especially in literary, artistic or scientific work.” The word is
derived from the Latin words col labore which means to work along side
one another. Collaboration can be thought of as joint problem solving. It
stands for working with others toward shared goals. Compared to the
similar word cooperation, collaboration implies more formal
relationships, stricter planning and division of roles and full commitment
to a common mission (Kvan, 2000).

11
Schrage explains that a “shared space” is a prerequisite for any type of
collaboration. A shared space is a medium where all participants can
add their notations to the shared understanding that the participants are
trying to create (Schrage quoted in Schulz, 1997). According to
empirical studies, shared understanding is an essential condition for
team design (Valkenburg, 1998). The purpose of a shared space is not
to create a presentation of some finished concept, but rather to allow
the thoughts and works of participants to be understood by their
partners during the process of creation (Schrage quoted in Schulz,
1997).
Communication, coordination, and negotiation are the other related
terms. Communication involves the exchange of information, events
and activities. Effective communication is a necessary, though not a
sufficient condition to meaningful collaboration. Simply publishing
information to a large group of participants does not mean that the
recipients of that information are participating in the process.
Communication has often been a well-known bottleneck in large-scale
complex projects. Costly breakdowns in communications occur regularly
even in the traditional AEC projects of physically collocated teams (Qian
and Gross, 1999). Coordination involves controlling the workflow and
communication process and managing various interdependencies
between activities and events. It allows efficient control mechanisms to
coordinate group effort (Pena-Mora et al., 2000). Finally, negotiation
means compromising when design changes proposed by some team

12
member are not agreed to by other members who find the implications
of the proposed change not acceptable from their own design
perspectives (Peng, 1999).
2.2 Approaches to Collaboration Research
2.2.1 Educational Approaches
Professionalism is one of the major obstacles to effective collaboration
between architects and building design engineers. Professionalism is
not simply a collection of knowledge and practices, but also value
systems of the professionals which guide their objectives and
processes. This type of socialization is largely due to the fragmented
education of the design professionals. Newer educational approaches
aim to address this fragmentation and to propose ways to overcome it.
Some approaches claim that architects and engineers need to be
educated together so they can learn how to work better together
(Wheeler, 1998). However, this solution seems to be impractical due to
the huge and ever growing amount of knowledge in each profession. It
is more reasonable to sensitize students to the issues, objectives, and
concerns of the other discipline (Taşlı, 2001a). There are several
attempts to implement interdisciplinary courses for architecture and
engineering students and there is evidence that such courses provide
students valuable insight of the value systems used by their peers
(Jackson, 1997; Chinowsky and Robinson, 1995). Pultar (1999) claims
that it might be useful to give a general design education to architecture

13
and structural engineering students for an initial period, after which,
students should have the chance to choose their specialization field.
2.2.2 Studies of Communication and Negotiation
Developments in communication technologies have motivated a great
amount of “technology-driven research” (Galle, 1995) in the field of
computer supported collaborative work (CSCW) in the AEC industry.
Internet-based technologies have formed the basis for collaboration of
geographically distributed AEC teams which are often called “virtual
offices.” (Low and Sloan, 2001). European Commission funded projects
such as EVONET (European Virtual Office Network) and RECITE
(Remote Electronic Construction Industry Telematics Experiment)
proved that electronic communications enable considerable increases in
the operational efficiency of AEC firms (Moller, 1997).
Shared virtual reality environments utilizing VRML (Virtual Reality
Modeling Language) models constitute another developing research
field in computer supported communication in the AEC industry. These
environments enable collaborating parties to be virtually located within a
given three-dimensional environment in which they are able to interact
with one another or with virtual objects that are also present in the
environment. The intended aim of these environments is to create the
illusion of “being there” (Caneparo, 2001; Woo et al., 2001; Lee et al.,
2001; Atsuko et al., 2001).

14
There is also considerable interest in agent-based approaches for
computer supported communication and negotiation in the AEC
industry. An agent embodies particular functionality and behaves in an
autonomous manner. Agents conduct tasks such as gathering
information, communicating with one another as well as planning,
scheduling and executing tasks. In a collaborative design context,
individual agents may be responsible for either the design of
subsystems, or for performing specific design tasks such as
performance analysis, cost analysis, and optimization (Veeramani et al.,
1998; Pena-Mora et al., 2000).
Negotiation-based approaches to design collaboration often make use
of constraint satisfaction techniques to approximate the space of
alternative solutions (Lottaz, 2000; Peng, 1999). Instead of negotiating
over single values for parameters (which often creates artificial
conflicts), constraint satisfaction techniques offer the possibility to
calculate, represent, and manipulate solution spaces. The specification
of project requirements using mathematical expressions makes explicit
information that may be invisible at first glance. In this way, conflicts can
be detected easily and causal links can be deduced from the structure
of the constraint satisfaction problem (Lottaz, 2000).
2.2.3 Information Modeling Approach
Building design is largely considered as an “information processing”
activity after the pioneering work of Akın (1989). The principal

15
requirement of any project is evaluating and processing information and
communicating that information between various parties. However,
information related problems constitute the major cause of design
failure (Baldwin et al., 1998). With a view to alleviate these problems,
information modeling research has gained importance in recent years.
Following a discussion of information related problems in the AEC
industry, this section introduces the information modeling approach as a
means of alleviating these problems.
2.2.3.1 Information Related Problems in the Construction Industry
The main information related problems in the construction industry are
summarized below.
1. Separate models of the design for each discipline and multiple views
of the same objects
This is probably the most acknowledged problem in the literature, which
has motivated studies on modeling interdisciplinary information. It is
recognized that architects and building design engineers model
buildings according to their particular points of views. Depending on the
view taken, certain properties and descriptions of objects become
relevant. For example, a wall may be a space division element providing
privacy in architectural context and it may be load bearing or
contributing to building load in structural engineering context. Both

16
models are interdependent and they must coexist. Changes in one
model inevitably affect the other one and vice versa.
2. Lack of integration between CAD tools
In the related literature, it is also well documented that there is a lack of
integration between the current computer aided design (CAD) systems
(Taşlı and Sagun, 2002; Stuurstraat and Tolman, 1999; Hew et al.,
2001). Most of the practical and exploratory CAD tools focus on single
discipline or a single task in the process. This situation is often referred
in the related literature as an example of “islands of automation” in the
AEC industry (Fruchter et al., 1996). Therefore, a considerable amount
of research effort has been devoted to the development of systems
capable of integrating a range of building design tools (Kalay et al.,
1998).
3. Fragmentation of the construction industry
The AEC industry -unlike other large industries, such as the automotive,
aerospace, and the electronics industries- is fragmented into numerous
small organizations. Fragmentation in AEC is largely due to the growing
complexity of building processes, which promotes increased
professional specialization. Specialization is also reinforced by
educational practices and socio-economic trends that reward excellence
in ever-narrowing fields. As a result, while several related industries,
such as automotive and shipbuilding manufacturing, have been
relatively successful in integrating electronic information models into
17
their operations, the construction industry continues to fail in this
development. This is probably due to the fact that the larger
organizations in other industries have higher profits that enable them to
invest larger sums of money in technology development. Furthermore,
other industries have a few key organizations that can drive a
technology to suit their requirements (VTT, 2003).
4. “Document-based design” vs. “Model-based design”
Despite rapid developments in technology, the current construction
project information paradigm is still primarily based on the use of
traditional media such as drawings and faxes, and methods such as
meetings. Consequently, all the participants in a specific project are
required to convert paper-based information into electronic versions and
vice-versa. This continual process of creating and translating
information according to the design and presentation medium used
creates several bottlenecks in the flow of information. Many researchers
believe that in order for the construction industry to meet this challenge,
the development of an information modeling standard that enables
sharing, storing and exchanging project information electronically is
essential (Tolman, 1999). In the evolving model-based paradigm,
production of computable models of building objects and processes that
are useful to those downstream in the process is a key aspect
(Eastman, 1999).

18
5. Incomplete, uncertain, and untimely information
Any type of design is characterized by iteration. Incomplete, uncertain,
or untimely information is likely to cause additional iterations which
probably increase the duration and cost of the process. The problem of
iteration is discussed at Chapter 5 in detail.
6. Lack of a shared understanding of objectives, values and processes
Shared understanding is a mutual view amongst the design participants
on relevant design topics and design activities. Without this
understanding, decisions will not be supported by all team members
and later activities in the design process can be restricted by different
views of the team members (Valkenburg, 1998). Having a common
understanding of information content of design entails shared models.
7. Invisible decision making
In conventional practices, the communications between design
professionals is often at such a minimal level that the documents can
only provide the most basic level of information. Even when the plans
reflect the design process with absolute accuracy, the decision making
that led up to specific configurations remain invisible. This is a
significant disadvantage when alternative solutions are searched in the
process (Schulz, 1997).
8. Informal communications and lack of documentation
The successful performance of multidisciplinary projects requires
enormous coordination to ensure that all parties are constantly aware of
19
the ever-changing status of the project in an attempt to eliminate design
errors. However, in current processes of the AEC professionals,
communications are often informal and not documented. Thus, tracking
and managing changes is a cumbersome task (Austin et al, 1994).
2.2.3.2 What is a Model?
A model can be defined as a representation of relevant characteristics
of an artifact. In other words, it is a means of expressing certain
characteristics of an object, system or situation that exists, existed, or
might exist (Echenique qtd. in Rowe, 1991). According to the Oxford
English Dictionary, a model may be defined simply as “a representation
of structure.” In the information modeling field, a model is used to
represent the structure of information and how that information relates
to other information.
Discussing models, it should always be borne in mind that no matter
how much effort goes into its construction, a model can never be a
perfect or complete representation of reality, because human beings do
not have perfect information about the real world. Therefore, the
usefulness of models should be judged not against an imaginary
perfection, but in comparison with the mental and descriptive models
that could be used alternatively (Forrester qtd. in Radford and Gero,
1988).

20
2.2.3.3 Advantages of the Information Modeling Approach
The information modeling approach is taken in this dissertation, firstly
because it is widely recognized that information modeling alleviates the
problems presented in 2.2.3.1. It has already become a fundamental
aspect of collaboration research. In fact, an information model underlies
any type of computer supported collaborative work. Rezgui et al. (1996)
explain that a great deal of work has already addressed collaborative
design on the implementation side. However, a model-based solution
has several advantages that go beyond particular implementations.
Models are independent of any particular implementation and therefore
they are more likely to survive the rapid evolution of information
technology. Furthermore, any model-based representation is potentially
usable for other information-processing purposes.
2.2.3.4 Types of Information Models
Information models used in the AEC industry can be grouped as
product models and process models. A product model is an information
model that implicitly contains data regarding form (geometry and
topology), function (requirements or intentions) and behavior
(performance) of a product and it is able to describe the product through
its life cycle. In other words, such a model provides an abstract
description of facts, concepts, or instructions about a product. The role
of the product model in this definition is equivalent to the role of the
technical documentation in the current paper-based design and
construction process (Tolman, 1999).

21
Since one of the most important requirements for a building product
model is its capacity to allow different professionals to abstract different
perspectives of the building from it (Dias, 1996), product modeling is a
promising means to avoid iterations and misinterpretations from which
traditional processes suffers. Moreover, it is widely accepted that a
product model is a more complete and re-usable representation of a
building for the whole building life cycle. Therefore, there have been
many efforts to build a common product model for building design such
as RATAS (Björk, 1994), COMBINE (Amor et al., 1995), COMMIT
(Rezgui et al., 1996), CONCUR (Stuurstraat and Tolman, 1999), and
ATLAS (Tolman, 1999).
A process model is a systematic representation of a process, which in a
formal manner describes the aspects of the process that are relevant for
the purpose and viewpoint of the process model (Karstila, 2000). The
main purpose of process modeling is to gain knowledge of the existing
process and to serve as a model for future implementation. There are
three main uses of process models (Svensson et al., 1999):
1. Process Development and Improvement: A process model enables
the capture of “as-is” information about a process. This model can
then be analyzed and redeveloped as a “to-be” model that describes
improvements. Some may argue that a detailed model of the
existing process is unnecessary and may take a long time to do. A
simple model of the existing “as-is” process followed by a more
detailed future “to-be” process should be enough. However, any
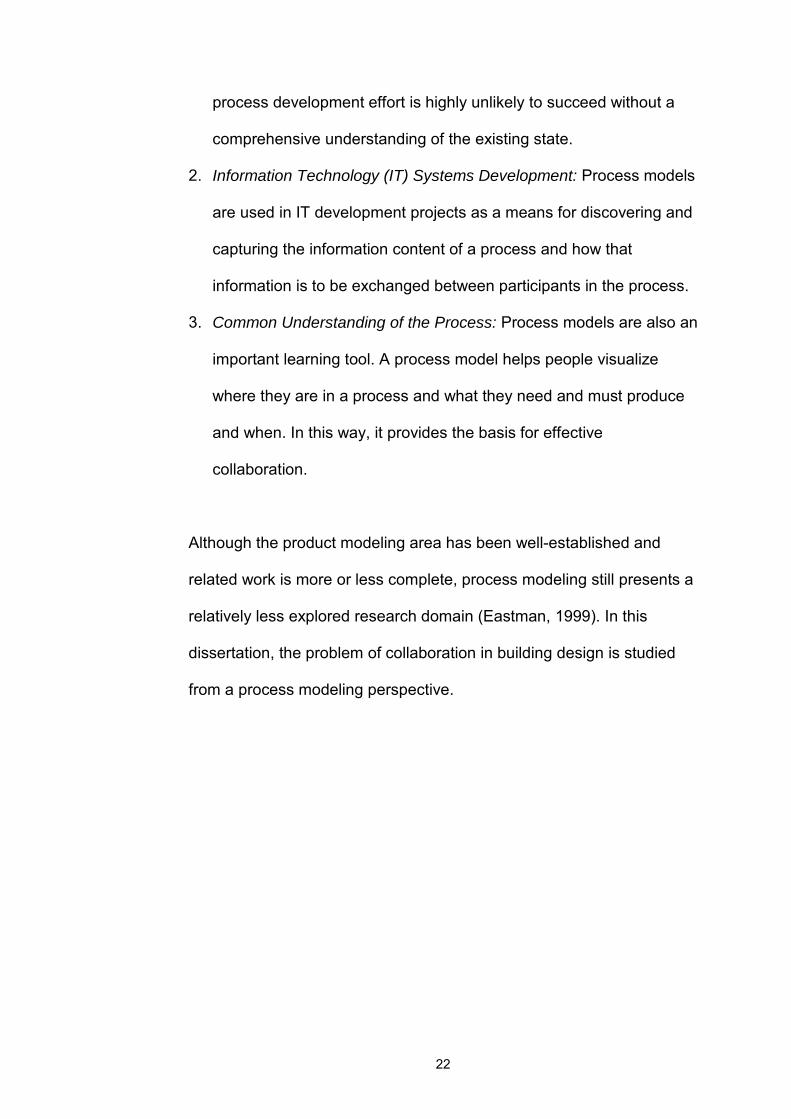
22
process development effort is highly unlikely to succeed without a
comprehensive understanding of the existing state.
2. Information Technology (IT) Systems Development: Process models
are used in IT development projects as a means for discovering and
capturing the information content of a process and how that
information is to be exchanged between participants in the process.
3. Common Understanding of the Process: Process models are also an
important learning tool. A process model helps people visualize
where they are in a process and what they need and must produce
and when. In this way, it provides the basis for effective
collaboration.
Although the product modeling area has been well-established and
related work is more or less complete, process modeling still presents a
relatively less explored research domain (Eastman, 1999). In this
dissertation, the problem of collaboration in building design is studied
from a process modeling perspective.

23
3. PROCESS MODELS OF DESIGN
The process modeling efforts in the AEC industry can be analyzed in
three general groups, namely generic descriptive frameworks and
formal activity models. This section identifies some shortcomings of the
existing models and proposes the parameter-based DSM as the lowest
level process modeling method (Figure 3.1). The analysis of the existing
methods is presented in the following sections.
Figure 3.1: A Three-level Scheme for Process Modeling
3.1 Descriptive Generic Frameworks
3.1.1 Design Methods Models
Descriptive methodological and philosophical frameworks of the design
process originate from the 1960’s Design Methods movement. This
movement claimed to bring systematic methods for designers in order
to cope with the increased complexity of design process. Cross (1993)
identifies two “generations” of design methods. 1960s “first generation”
methods seemed simplistic and were not embraced by a large
audience. The second generation design methods, which started to
Modeling Level
Tools
Process Descriptive Generic Frameworks
Activity Formal Activity Models
Parameter Parameter-based DSM

24
emerge at the early 1970s, moved away from the “omnipotence” of
designers towards “satisficing” solutions and “argumentative”
participatory process. These include Hubka (1982), Pahl and Beitz
(1984), Cross (1989), and Pugh (1986) to name a few.
Design methods models defined design as a rational process composed
of three basic steps: analysis, synthesis and evaluation. These steps
were either formulated by linear flow charts, or by spiral forms
representing reiterating sequence. Another of their common
characteristics is that they represent the process at high levels with very
little information at lower levels (Broadbent, 1988).
3.1.2 The RIBA Plan of Work
The RIBA Plan of Work (Phillips, 2001) is another generic framework
which was originally published in 1963 as a standard method of
operation for building construction, and is widely accepted as an
operational model for the building industry in UK. The Plan of Work
represents the whole building process from inception to feedback in
terms of a logical sequence of work stages. According to the Plan of
Work, a design project progresses from stages A to M in a linear
fashion requiring the completion of one stage before proceeding to the
next (Table 3.1). It is anticipated that the model will need only slight
adjustments depending upon the size and complexity of the project.

25
Table 3.1: An Overview of the RIBA Plan of Work (Adapted from Nelson et. al., 1999) Pre-design A►B Design ►C►D►E Preparing to build ►F►G►H Construction ►J►K►L Post-Construction ►M
Stage A: Inception Stage B: Feasibility Stage C: Outline Proposals Stage D: Scheme Design Stage E: Detail Design Stage F: Production Info
Stage G: Bills of Quantities Stage H: Tender Action Stage J: Project Planning Stage K: Operations on Site Stage L: Completion Stage M: Feedback
3.1.3 The Generic Design and Construction Process Protocol
The Generic Design and Construction Process Protocol (GDCPP)
developed at the University of Salford is a high level map defining the
process in terms of activity zones. The zones contain high-level
processes spanning the duration of a project from inception to operation
and maintenance. The process protocol also consists of deliverables in
a form of documented project information such as stakeholder list, brief,
etc. and logical dependencies between activities which are shown by
interconnecting arrows.
The GDCCP breaks down the design and construction processes into
eight activity zones namely, development, project, resource, design,
production, facilities, health and safety, and process management, four
broad stages –pre-project, pre-construction, construction, and post-
construction–, and ten phases. The stage/gate approach to process
management practiced in manufacturing industry was used to develop

26
the GDCPP. From the point of view of decision making during the
process, there are so-called soft gates and hard gates. Soft gates imply
that decisions may be approved conditionally afterwards. On the other
hand, hard gates indicate final and firm decision points whether or not to
proceed to the next phase of the process. This is because late design
changes often cause substantial additional costs in construction
projects (Wu et al., 1998). All GDCPP process maps are publicized at a
Web site hosted by the University of Salford (University of Salford,
2003).
Figure 3.2: A View from GDCPP Process Map (University of Salford, 2003)
Recently, the GDCPP ─in combination with Unified Modeling Language
(UML) diagramming─ has constituted the base of process modeling
approach proposed in EU ICCI cluster project IST-2001-33022 (Wix and
Katranuschkov, 2002).
Although these generic models provide a good overview of the design
process, they are often too abstract to be utilized in practice. Thus, they
27
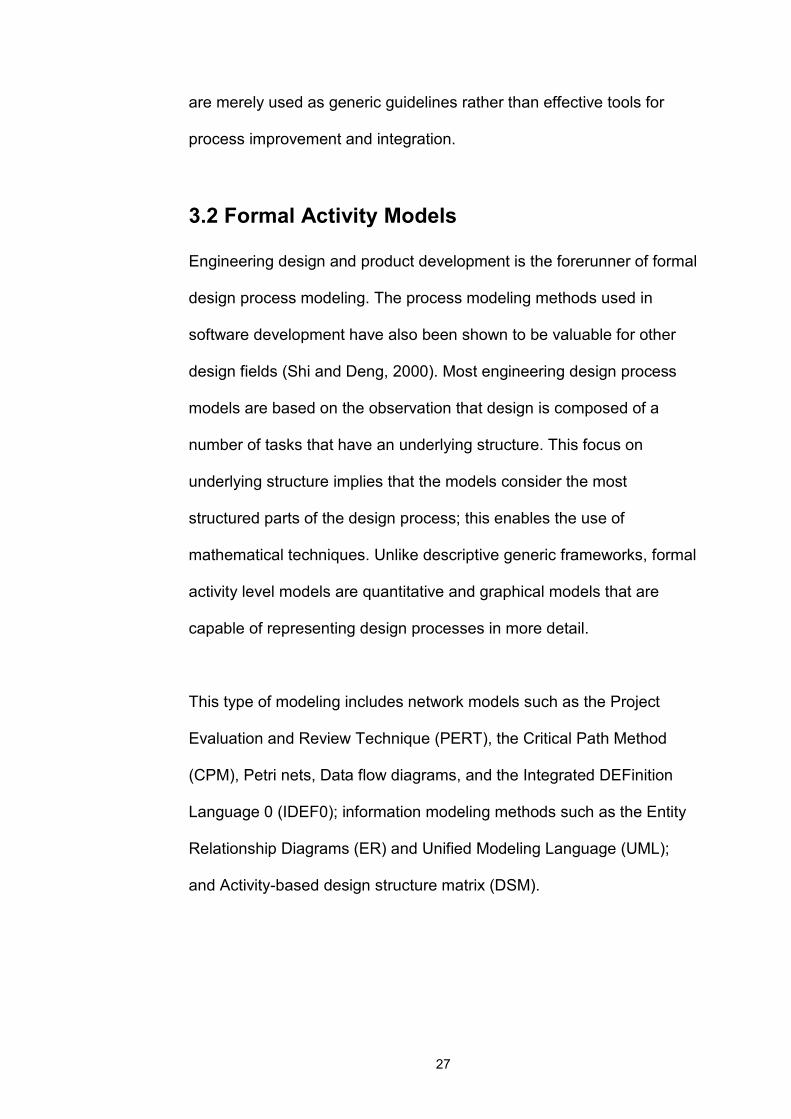
are merely used as generic guidelines rather than effective tools for
process improvement and integration.
3.2 Formal Activity Models
Engineering design and product development is the forerunner of formal
design process modeling. The process modeling methods used in
software development have also been shown to be valuable for other
design fields (Shi and Deng, 2000). Most engineering design process
models are based on the observation that design is composed of a
number of tasks that have an underlying structure. This focus on
underlying structure implies that the models consider the most
structured parts of the design process; this enables the use of
mathematical techniques. Unlike descriptive generic frameworks, formal
activity level models are quantitative and graphical models that are
capable of representing design processes in more detail.
This type of modeling includes network models such as the Project
Evaluation and Review Technique (PERT), the Critical Path Method
(CPM), Petri nets, Data flow diagrams, and the Integrated DEFinition
Language 0 (IDEF0); information modeling methods such as the Entity
Relationship Diagrams (ER) and Unified Modeling Language (UML);
and Activity-based design structure matrix (DSM).
28
3.2.1 Network Models
Network models can overcome some of the drawbacks of generic
models by exploiting activity relationships. Such models are based on
the premise that once decomposed, the design process can be
described as an interconnected network of design tasks i.e. a directed
graph. A directed graph (digraph) represents the precedence
relationships among tasks of a project. It consists of a set of nodes
representing the design tasks and a set of directed lines connecting
these nodes. The directed lines denote a dependency or a relationship
between the connected tasks (Yassine et al., 1999). There are many
variations of network models, but only the four basic types are
discussed below.
3.2.1.1 PERT/CPM
The Project Evaluation and Review Technique (PERT) and the Critical
Path Method (CPM) are based on digraphs. The PERT method is the
first example of time-based process modeling. In the PERT method,
three probabilistic time estimates are given to each task, reflecting the
uncertainty in the duration of tasks. The CPM is a variation of the PERT
method. However, the time of any task can be compressed by allocating
resources. Thus, CPM assumes a time-cost tradeoff rather than the
probabilistic times used in PERT. CPM diagrams also graphically show
the precedence interrelationships among product activities. It is possible
to develop a critical path −a sequence of activities which, if delayed,
delays completion of the project− (Smith and Morrow, 1999).
29
There are several limitations in this type of modeling such as the
following (Shi and Deng, 2000):
1. They lack the ability to model feedback and iteration in the
projects, so that they cannot model projects as a dynamic
decision process.
2. They deal with an activity as a non-stop process. However, in
practice activities may be interrupted when required
conditions cannot be met.
3. They can be time-consuming to prepare, difficult to read and
to update.
Pultar (1990) has developed a progress-based scheduling technique
based on progress charts and bar charts to overcome the problem of
fragmentation of activities during the application of the conventional
CPM to construction projects. CPM type of modeling has been used in
many construction projects with varying degrees of success. However,
the technique has remained to be useful for the construction phase of
building process rather than the design phase.
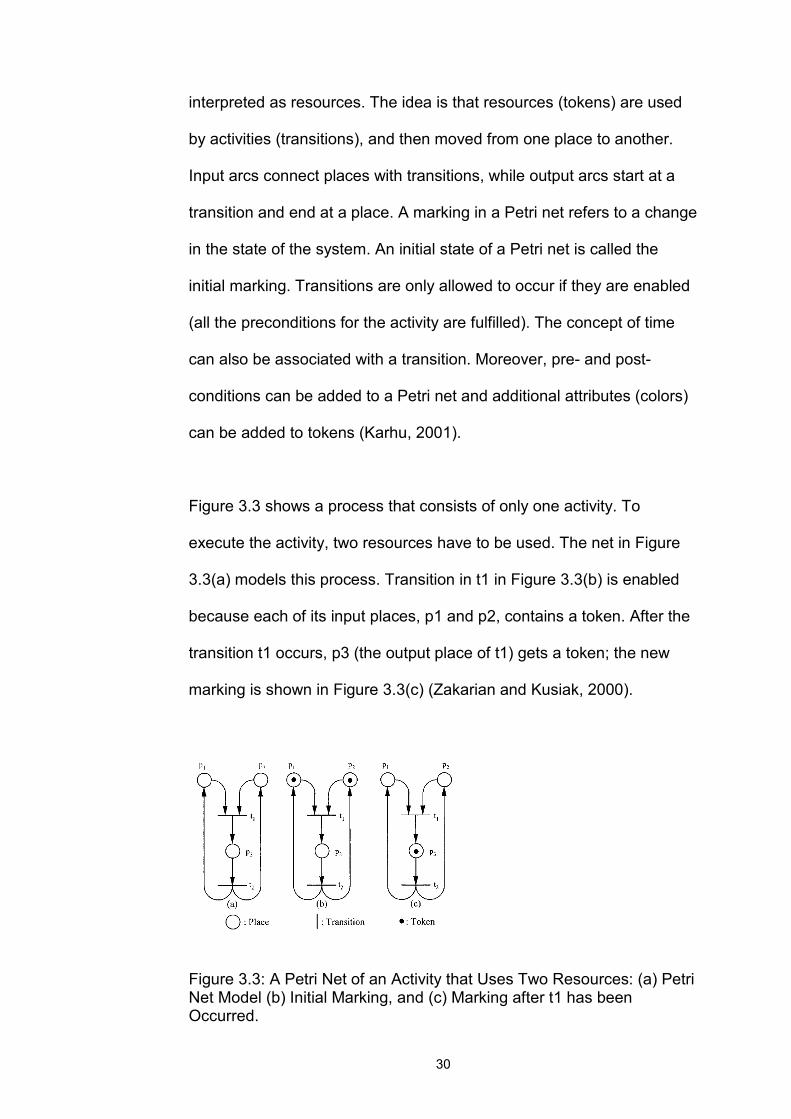
3.2.1.2 Petri Nets
A more recent process model of design that describes information flows
is a Petri net model. A Petri net is a graphical modeling tool that
consists of places, transitions, and arcs (Figure 3.3). Basically, it defines
transitions that are interpreted as activities, and tokens that are
30
interpreted as resources. The idea is that resources (tokens) are used
by activities (transitions), and then moved from one place to another.
Input arcs connect places with transitions, while output arcs start at a
transition and end at a place. A marking in a Petri net refers to a change
in the state of the system. An initial state of a Petri net is called the
initial marking. Transitions are only allowed to occur if they are enabled
(all the preconditions for the activity are fulfilled). The concept of time
can also be associated with a transition. Moreover, pre- and post-
conditions can be added to a Petri net and additional attributes (colors)
can be added to tokens (Karhu, 2001).
Figure 3.3 shows a process that consists of only one activity. To
execute the activity, two resources have to be used. The net in Figure
3.3(a) models this process. Transition in t1 in Figure 3.3(b) is enabled
because each of its input places, p1 and p2, contains a token. After the
transition t1 occurs, p3 (the output place of t1) gets a token; the new
marking is shown in Figure 3.3(c) (Zakarian and Kusiak, 2000).
Figure 3.3: A Petri Net of an Activity that Uses Two Resources: (a) Petri Net Model (b) Initial Marking, and (c) Marking after t1 has been Occurred.
31
Petri nets are promising for representing systems that are concurrent,
asynchronous, distributed, and parallel. The disadvantages of Petri net
descriptions include the lack of decomposition and hierarchy (Karhu,
2001), and emphasis on feasibility as the output measure of interest.
Additionally, there is no weighting of the transitions; all transitions are
implied to be of the same importance. Furthermore, the complete
structure of the project must be done in advance if the model is
expected to have any useful predictive utility (Smith and Morrow, 1999).
Wakefield and Damrianant (1999) demonstrated how Petri nets,
previously used for modeling computer networks and flexible
manufacturing systems, can be used for modeling construction systems
and processes. They claim that the graphical nature of Petri Net models
makes them relatively easy to understand, to build and to communicate
to others. Furthermore, the graphical Petri Net representation is readily
converted into algebraic representation that facilitates analysis and
numerical simulation. In fact, Petri nets are aimed more at simulation
rather than static process modeling.
3.2.1.3 Data Flow Diagrams
Data flow diagramming emerged originally for software development
(De Marco, 1979). A data flow diagram is constructed from four basic
elements; namely, process, data or information flow, data store, and an
external entity used as a source or sink of data flow. Baldwin et al.

32
(1999) applied these concepts to a building design process model and
interpreted processes as individual design tasks, flows as design
information flows, data stores as drawings etc., and external entities as
clients, local authorities, etc. Abou-Zeid and Russell (qtd. in Karhu,
2001) also used data flow diagramming to study communications
between participants of building design process.
Figure 3.4: An Example Data Flow Diagram showing Concept and Scheme Design Data Flows (Baldwin et al., 1999)
The method has the capability of presenting the models in a hierarchical
form through decomposition. Data flow diagrams are not concerned with
how processes are performed but view systems from an information
point of view. They can also represent the iterations in processes, but
do not provide any means to deal with them. Moreover, the performer of
a process is not modeled with this method (Karhu, 2001).
3.2.1.4 IDEF0
IDEF0 (Integrated DEFinition 0) is a graph-based technique that
captures more details than other graph-based techniques by
representing some of the intra-task complexity. The U.S. Air Force

33
Standard IDEF (U.S. Air Force, 1981) was developed from SADT
(Structured Analysis and Design Technique) for process modeling in
computer-integrated manufacturing and concurrent engineering. The
IDEF model consists of hierarchically decomposed diagrams, along with
text for each of the diagrams, and glossary of terms used in the
diagrams (Smith and Morrow, 1999).
The two basic components of the IDEF diagram are a box and arrows.
Boxes represent processes, while the arrows represent different
interfaces such as input, output, control, and mechanism. Inputs are the
data or objects that are transformed by process into output. Input
arrows are associated with the left side of an IDEF0 box. Outputs are
the data or objects produced by a process. Output arrows are
associated with the right side of an IDEF0 box. Controls are conditions
required to produce correct output. Data or objects modeled as controls
may be transformed by the process, creating output. Control arrows are
associated with the topside of an IDEF0 box. Mechanisms are the
means used to conduct a process. Mechanism arrows are associated
with the bottom side of an IDEF0 box. A generic IDEF diagram of a
process is shown in Figure 3.5. In addition to the definition of the IDEF0
language, the IDEF0 methodology also prescribes procedures and
techniques for developing and interpreting models, including ones for
data gathering, diagram construction, review cycles and documentation
(U.S. NIST, 1993).

34
Figure 3.5: A Generic IDEF0 Diagram of an Activity (U.S. NIST, 1993)
IDEF0 is probably the most widely used formal process modeling
method in the AEC industry since it was declared as the preferred
notation for the creation of graphical process models for Industry
Foundation Classes (IFC) specification. Studies on IDEF0-based AEC
process models include but are not limited to Sanvido and Norton
(1994), Karhu (2000), and Rezgui et al. (2002).
As a modeling language, IDEF0 has the following advantages:
1. It is comprehensive and expressive, capable of graphically
representing a wide variety of operations to any level of detail.
2. It is a simple language, providing for rigorous and precise
expression, and promoting consistency of usage and
interpretation.
3. It is well-tested and proven, through many years of use in Air
Force and other government development projects, and by
private industry.
4. It can be generated by a variety of computer graphics tools;
numerous commercial products specifically support
development and analysis of IDEF0 diagrams and models.
Control
Input Output
Mechanism
35
However, like the other graph-based representations, IDEF0 also
suffers from size limitations. It tends to grow rapidly for a large number
of tasks and visual inspection of the information structure becomes very
complex and misleading. Thus, it is more useful for high-level process
representations rather than detailed processes. Moreover, process
modeling techniques like SADT/IDEF0 are only well structured when the
activities constitute the focus. Information, controls and mechanisms are
connected to each process step but there is no way of analyzing the
total information structure processed in the system. Although IDEF0 is
capable of showing iterations in processes, it does not provide a means
of resolving them (Svensson et al., 1999). Another limitation of the
IDEF0 technique is that mainly document producing actions are
captured. The technique gives weak support for modeling parallel sub-
processes and for informal communication within a sub-process.
Therefore, iterations between levels are difficult to analyze with IDEF0
(Malmström et al., 1999).
3.2.2 Entity-Relationship Diagrams
Information modeling methods like Entity-relationship (ER) diagrams
and UML were originally developed for designing software intensive
systems. ER diagrams were specifically developed to build relational
databases. The method utilizes three major abstractions to describe the
data; namely, entities, relationships, and attributes. The basic object
that an ER model represents is an entity, which is a “thing” in the real
36
world with an independent existence. Each entity has particular
properties called attributes that describe it. A particular entity will have a
value for each of its attributes. Whenever an attribute of one entity type
refers to another entity type, some relationship exists. In the initial
design of entity types, relationships are typically captured in the form of
attributes. As the design is refined, these attributes are converted into
relationships between entity types (Elmasri and Navathe, 1994).
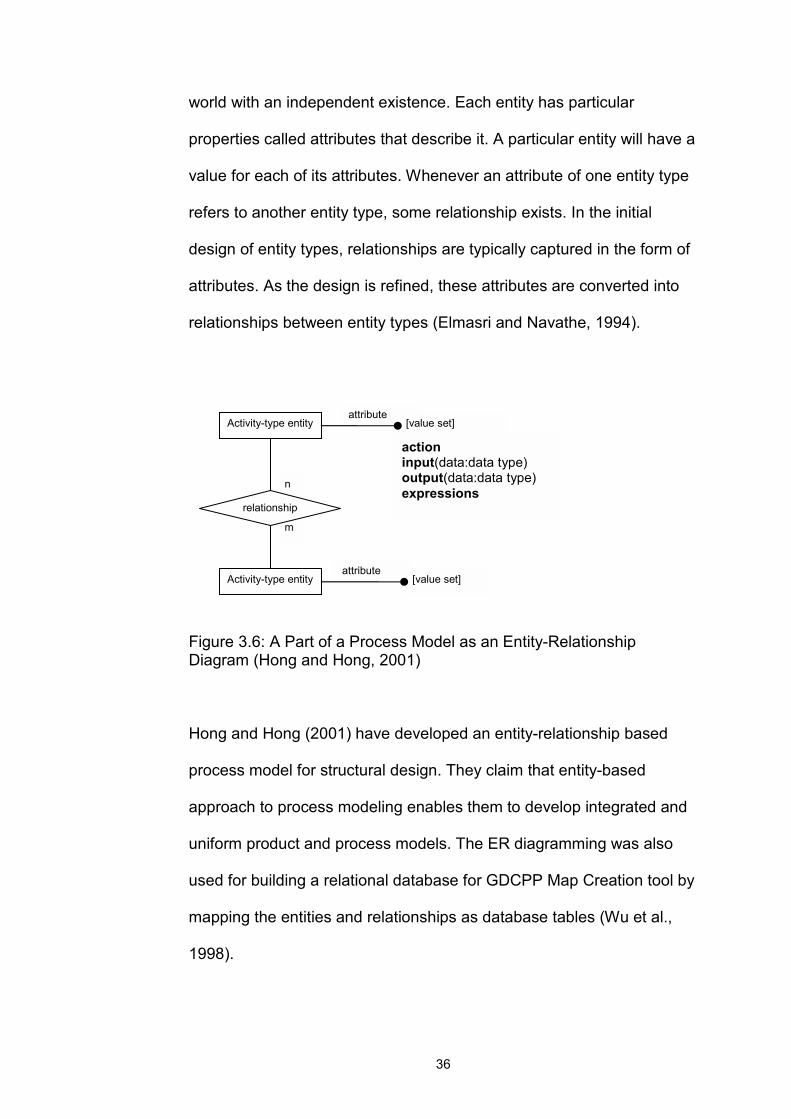
Figure 3.6: A Part of a Process Model as an Entity-Relationship Diagram (Hong and Hong, 2001)
Hong and Hong (2001) have developed an entity-relationship based
process model for structural design. They claim that entity-based
approach to process modeling enables them to develop integrated and
uniform product and process models. The ER diagramming was also
used for building a relational database for GDCPP Map Creation tool by
mapping the entities and relationships as database tables (Wu et al.,
1998).
attribute
attribute [value set]
[value set] Activity-type entity
Activity-type entity
n
m
relationship
action input(data:data type) output(data:data type) expressions

37
Entity-relationship diagrams are beneficial for producing integrated
product and process models, however, the method is more desirable for
top-down design process, since it allows high level abstraction in
representing design information and design activities (Hong and Hong,
2001). Svensson et al. (1999) explain that if the process modeled is a
repetitive task, ER modeling can be useful, since only the type of
information is relevant, regardless of what types of parts the documents
are describing.
3.2.3 Unified Modeling Language
Unified Modeling Language (UML) is a standard modeling language for
software development. It is a sophisticated language involving many
types of diagrams; two of which are especially relevant for process
modeling purposes. UML activity diagrams enable identification of
communication between activities undertaken by different roles within a
process. Activity diagrams address the dynamic view of a system. Use
case diagrams show a set of use cases and actors and their
relationships. Such diagrams address the static use case view of a
system (Booch et. al., 1998). Use case diagrams of UML were recently
used in OSMOS (a European Union research project) to capture the
sequence of actions performed by actors in virtual construction
enterprises (Rezgui et al., 2002).
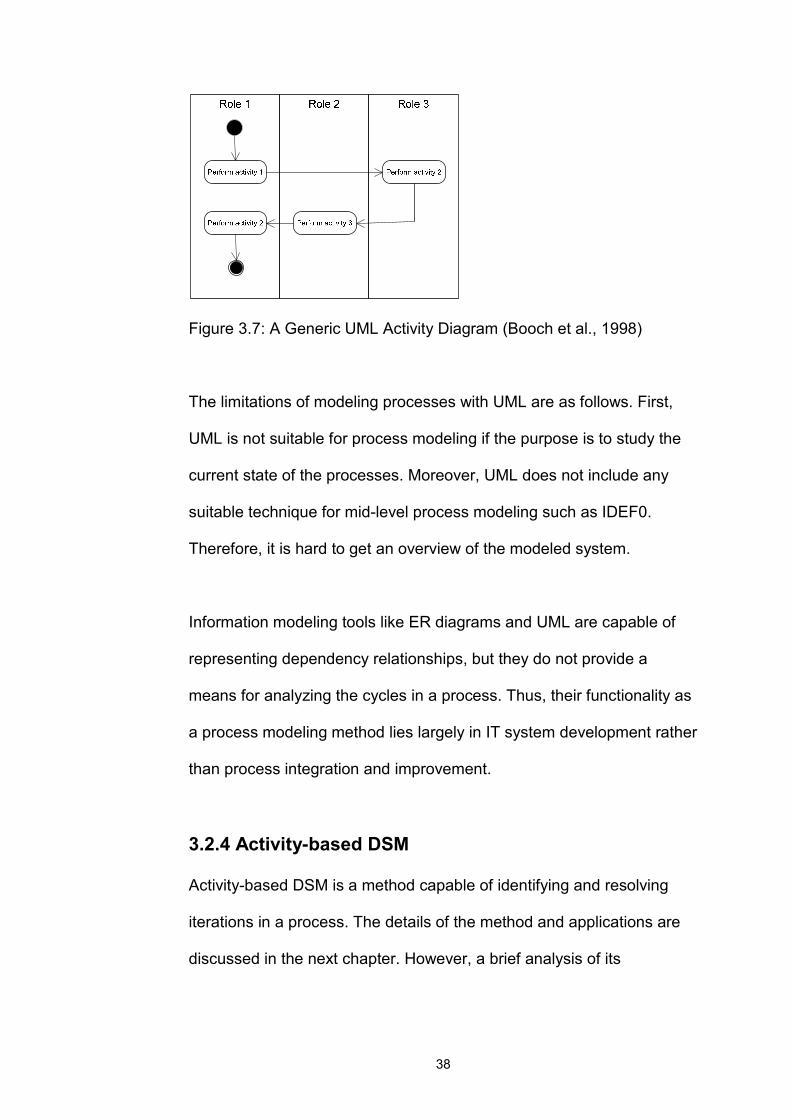
38
Figure 3.7: A Generic UML Activity Diagram (Booch et al., 1998)
The limitations of modeling processes with UML are as follows. First,
UML is not suitable for process modeling if the purpose is to study the
current state of the processes. Moreover, UML does not include any
suitable technique for mid-level process modeling such as IDEF0.
Therefore, it is hard to get an overview of the modeled system.
Information modeling tools like ER diagrams and UML are capable of
representing dependency relationships, but they do not provide a
means for analyzing the cycles in a process. Thus, their functionality as
a process modeling method lies largely in IT system development rather
than process integration and improvement.
3.2.4 Activity-based DSM
Activity-based DSM is a method capable of identifying and resolving
iterations in a process. The details of the method and applications are
discussed in the next chapter. However, a brief analysis of its
39
advantages and disadvantages are presented below to support the
conclusions made in 3.4.
The effectiveness of the activity-based DSM in sequencing activities
has been shown in previous research (Austin et al., 2000); however, like
the other methods reviewed in this chapter, it is too abstract to define, in
detail, for complex multi-parameter problems. Furthermore, it has
another considerable shortcoming; activities can be described on
multiple hierarchical levels, but in an activity-based DSM, it is difficult to
see at which hierarchical level each activity is described. In fact, a
precise definition of activities is lacking in DSM literature. Therefore,
there always seems to be a possibility of comparing activities at
different levels as if they were at the same level. This problem is solved
by the theoretical assumption that all activities are described at the
lowest hierarchical level. However, when decomposition ends at an
activity level, this assumption cannot be fully supported. At the lowest
level, the design activities should be decomposed into parameter
decision points.
3.3 Conventional/Empirical Methods
In the construction industry, chart-based scheduling is still the most
widely used process modeling method. The milestone chart method
consists of identifying the target completion date for each activity in the
task outline. Bar charts (also known as Gantt charts) consist of a list of
tasks along the left side of a page with horizontal bars along the right

40
side indicating the scheduled start and finish dates for each task. Charts
are easy to prepare and use, but their best applications are limited to
short design projects with few participants and little interrelationship
between activities since, they are incapable of representing the
interrelationships.
3.4 Shortcomings of Current Building Design
Process Models
Having analyzed the most widely used process modeling methods in
the AEC industry, the following deficiencies are observed:
1. The complexity of design processes entails detailed analyses to gain
insight into process structures. However, current process models
used in the industry have a top-down approach including very little
information about interrelationships at lower levels. Of course, one of
the reasons why many process models fail to represent the detailed
process is because of the intricacy it adds. Graphical models
become so tangled as the process is represented at lower levels that
the descriptiveness of the tools diminishes. The DSM method works
well in such situations, since it is a compact, visual and analytically
advantageous format for complex systems.
The developments in the computer technology also support building
and manipulating detailed models. When standardization efforts
were begun in building product modeling in 1980s, the focus was on
general systems models. As the field is more matured, the models

41
have been refined and detailed (Tolman, 1999). Thus, it can be
expected that building design process modeling would follow the
same path toward comprehensive and low-level models.
2. Building design is characterized by iteration (rework). However,
many process models can not represent iterative processes; even
the models that are capable of identifying iterations can not resolve
them (except the DSM method). In fact, systematic means for
dealing with iterations are not established in the construction
industry. Concurrent work is often seen as a way to reduce cycle
time but, if concurrent activities are chosen arbitrarily without
considering their dependencies, this can lead to abundant iteration
and increased cycle time.
Thus, it can be clearly stated that there is a need for a low-level analysis
tool that is capable of identifying and resolving iterations in AEC
process models. As a solution to the shortcomings of the existing
methods discussed in the previous section, this dissertation proposes
the parameter-based DSM as the lowest level process modeling
method, which enables bottom-up integration of existing process- and
activity-level models.
42
4. DESIGN STRUCTURE MATRIX METHOD
The design structure matrix method has its roots in the 1960s, when
several efforts were devoted to solving systems of equations. During the
following years, developments in areas such as matrix mathematics,
network diagramming and interface-to-interface (N-to-N or N²) diagrams
of systems engineering have supported such work. Donald Steward first
coined the term “design structure matrix” and applied these concepts to
design in 1981 (Steward, 1981). The design structure matrix method
gained more credibility as a result of several researches at the
Massachusetts Institute of Technology in 1990’s. In recent years, DSM
research has expanded to include many new areas, and a more general
term, “Dependency Structure Matrix,” has come to be used.
In this chapter, following an explanation of how the DSM method works,
four types of DSMs and their applications are discussed. The chapter
also reviews the applications of the method in the AEC industry and the
available DSM tools.
4.1 Description of the Method
A design structure matrix is a matrix representation of a system or a
project. The rows and columns of the symmetric matrix consist of a list
of all elements of the system and matrix elements represent the
corresponding dependency patterns. System components are listed in
the first row and the first column of the matrix in a roughly temporal
order. Off-diagonal cells indicate the dependency of one system
43
element on another. Marks in a single row of a DSM represent the
system elements whose output is required for the system element
corresponding to that row. Similarly, reading down a specific column
reveals which system element receives information from the system
element corresponding to that column.
4.1.1 DSM Operations
The DSM method utilizes some operations to analyze information
dependencies and to re-arrange system elements accordingly.
Partitioning is the process of re-ordering the DSM rows and columns
so that the new arrangement does not contain iterations (i.e. the DSM is
transformed into lower triangular form). For complex systems, it is often
impossible to obtain a lower triangular form DSM by partitioning. In this
case the aim is to move the feedback marks as close as possible to the
diagonal so that fewer system elements are involved in the iteration
cycle (this results in a faster development process).
Tearing is the process of choosing the set of feedback marks that if
removed from the matrix will render the matrix lower triangular. The
marks that are removed from the matrix are called “tears.” Identifying
the tears that result in a lower triangular matrix means that the set of
assumptions that need to be made in order to start design process
iterations. Having made these assumptions, no additional estimates

44
need to be made. No optimal method exists for tearing, but it is
recommended to use two criteria when making tearing decisions:
1. Minimal number of tears: The motivation behind this criterion is
that tears represent an approximation or an initial guess to be
used. Thus the number of these guesses should be reduced.
2. Confine tears to the smallest blocks along the diagonal: The
motivation behind this criterion is that if there are iterations within
iterations, these inner iterations are done more often. Therefore,
it is desirable to confine the inner iterations to a small number of
tasks.
It is desirable to have minimal number of tears and to confine tears to
the smallest blocks along the diagonal in a DSM.
Banding is the addition of bands to a DSM to show independent (i.e.
potentially parallel or concurrent) system elements. The collection of
bands within a DSM constitutes the critical path of the system or project.
Furthermore, one element within each band is often critical. Thus, fewer
bands are preferred since they improve the concurrency of the
system/project.
Clustering is the process of finding subsets of DSM elements (clusters)
that are mutually exclusive or minimally interacting subsets. In other
words, clusters absorb most, if not all, of the interactions internally and
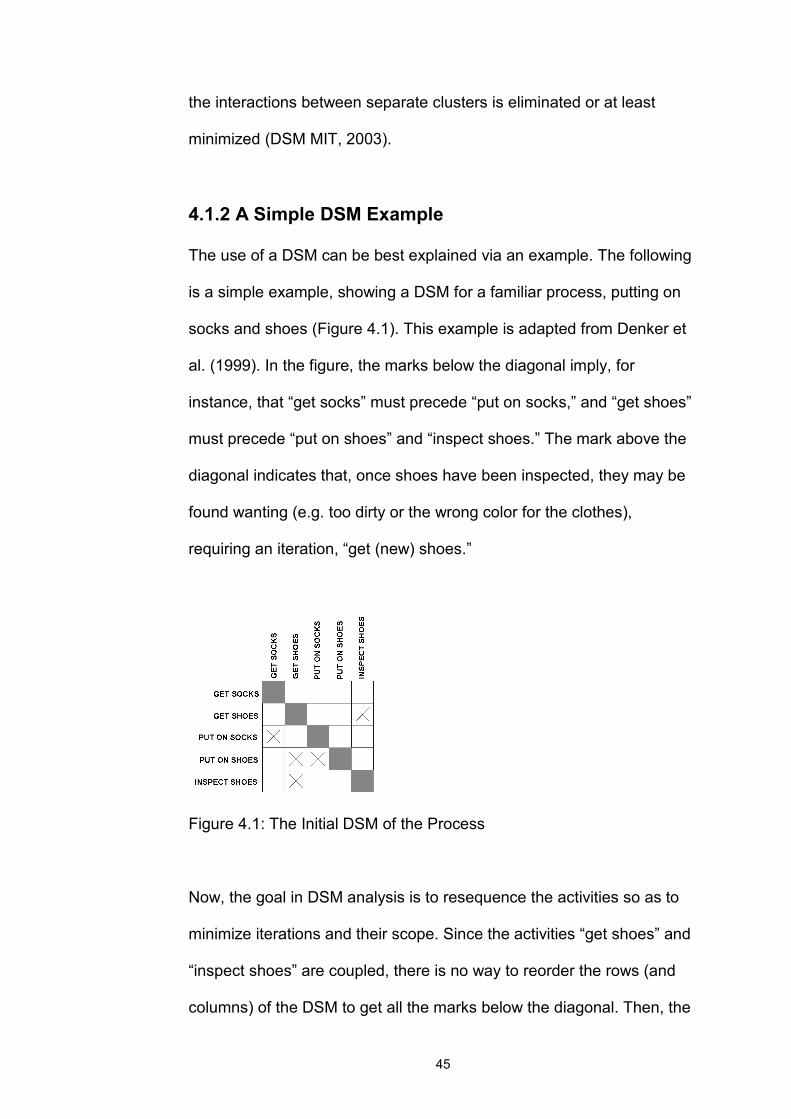
45
the interactions between separate clusters is eliminated or at least
minimized (DSM MIT, 2003).
4.1.2 A Simple DSM Example
The use of a DSM can be best explained via an example. The following
is a simple example, showing a DSM for a familiar process, putting on
socks and shoes (Figure 4.1). This example is adapted from Denker et
al. (1999). In the figure, the marks below the diagonal imply, for
instance, that “get socks” must precede “put on socks,” and “get shoes”
must precede “put on shoes” and “inspect shoes.” The mark above the
diagonal indicates that, once shoes have been inspected, they may be
found wanting (e.g. too dirty or the wrong color for the clothes),
requiring an iteration, “get (new) shoes.”
Figure 4.1: The Initial DSM of the Process
Now, the goal in DSM analysis is to resequence the activities so as to
minimize iterations and their scope. Since the activities “get shoes” and
“inspect shoes” are coupled, there is no way to reorder the rows (and
columns) of the DSM to get all the marks below the diagonal. Then, the
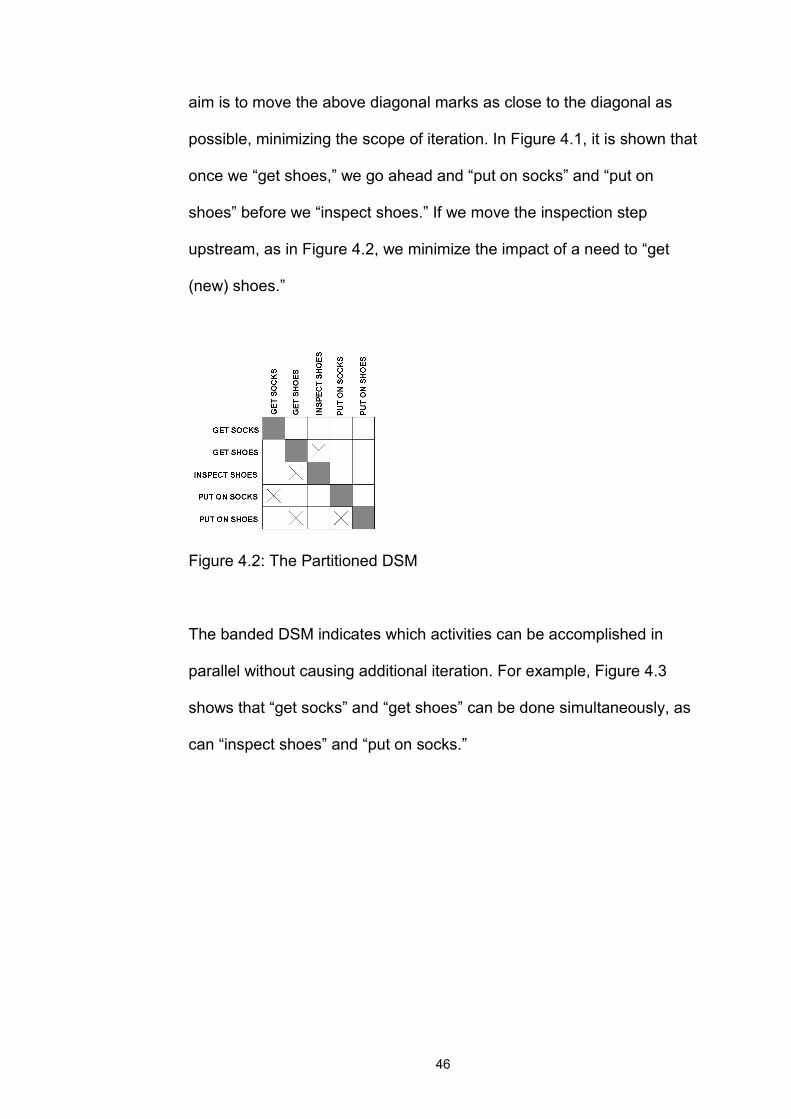
46
aim is to move the above diagonal marks as close to the diagonal as
possible, minimizing the scope of iteration. In Figure 4.1, it is shown that
once we “get shoes,” we go ahead and “put on socks” and “put on
shoes” before we “inspect shoes.” If we move the inspection step
upstream, as in Figure 4.2, we minimize the impact of a need to “get
(new) shoes.”
Figure 4.2: The Partitioned DSM
The banded DSM indicates which activities can be accomplished in
parallel without causing additional iteration. For example, Figure 4.3
shows that “get socks” and “get shoes” can be done simultaneously, as
can “inspect shoes” and “put on socks.”
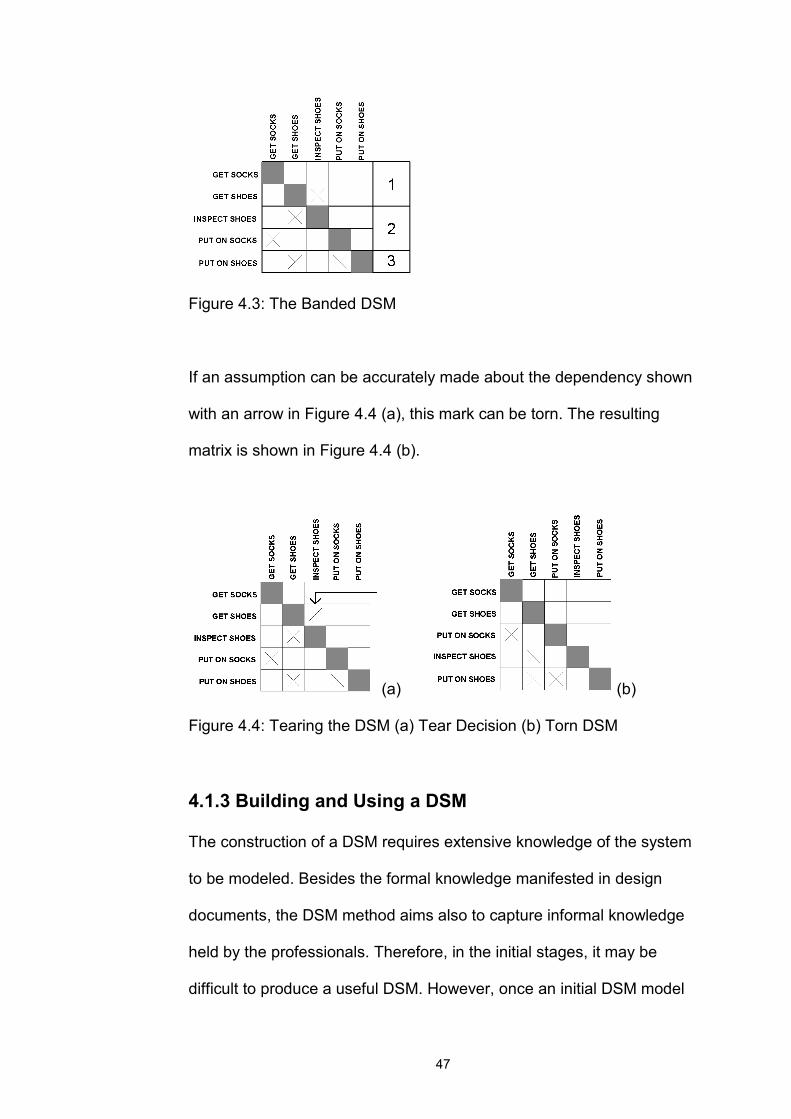
47
Figure 4.3: The Banded DSM
If an assumption can be accurately made about the dependency shown
with an arrow in Figure 4.4 (a), this mark can be torn. The resulting
matrix is shown in Figure 4.4 (b).
(a) (b)
Figure 4.4: Tearing the DSM (a) Tear Decision (b) Torn DSM
4.1.3 Building and Using a DSM
The construction of a DSM requires extensive knowledge of the system
to be modeled. Besides the formal knowledge manifested in design
documents, the DSM method aims also to capture informal knowledge
held by the professionals. Therefore, in the initial stages, it may be
difficult to produce a useful DSM. However, once an initial DSM model

48
is built, it can serve as a platform for continued organizational learning
and process improvement.
The steps of DSM development are summarized below.
1. Determine list of system elements.
This is conducted by examining design documents and
interviewing design professionals. The system under study is
decomposed into elements. The decomposition can be
hierarchical or non-hierarchical (network type). In the hierarchical
decomposition the system decomposed into sub-systems,
modules, and then into other smaller components. In the network
type, hierarchy is not evident.
2. Determine inputs, outputs, strengths of interaction, etc.
Related attributes of the system elements are identified by asking
the design professionals.
3. Build a DSM.
When the system elements and their interactions are defined,
they are listed in the DSM as row and column labels in the same
order. In the sequence-based DSM types this order corresponds
to the sequence of tasks.
4. Manipulate DSM to rearrange the process.
Through DSM operations, the DSM is analyzed. Collected
information can also be used for simulation purposes.
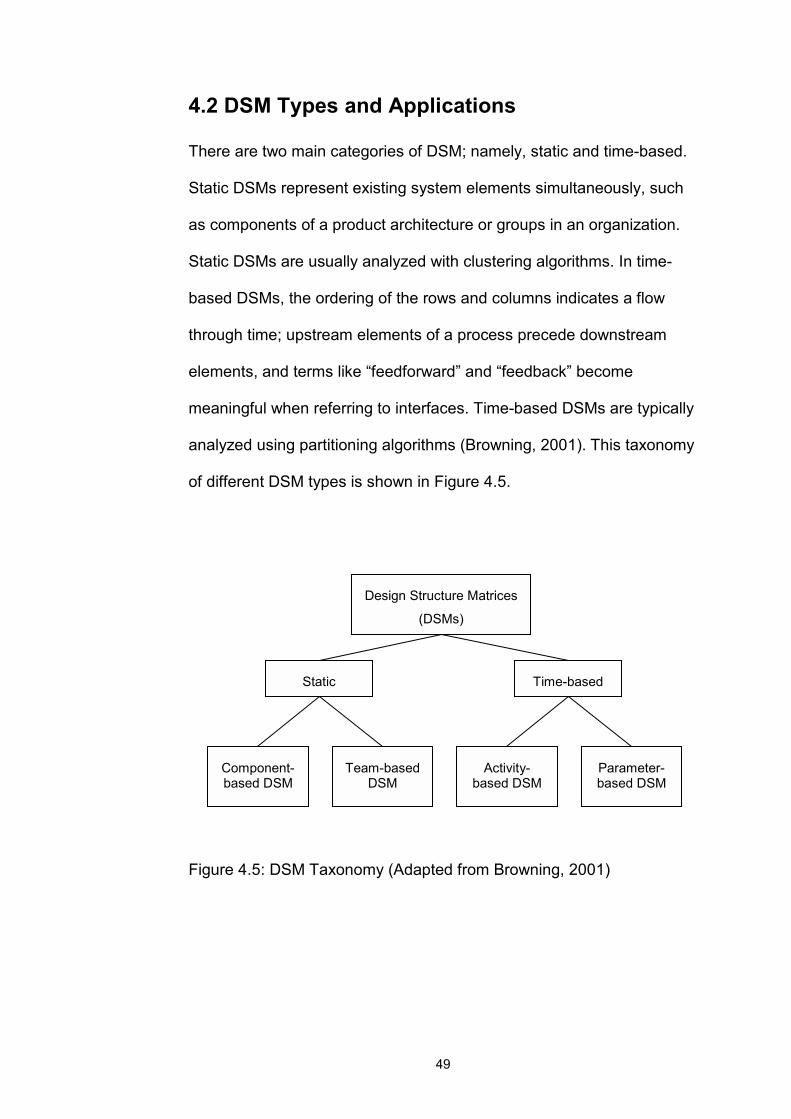
49
4.2 DSM Types and Applications
There are two main categories of DSM; namely, static and time-based.
Static DSMs represent existing system elements simultaneously, such
as components of a product architecture or groups in an organization.
Static DSMs are usually analyzed with clustering algorithms. In time-
based DSMs, the ordering of the rows and columns indicates a flow
through time; upstream elements of a process precede downstream
elements, and terms like “feedforward” and “feedback” become
meaningful when referring to interfaces. Time-based DSMs are typically
analyzed using partitioning algorithms (Browning, 2001). This taxonomy
of different DSM types is shown in Figure 4.5.
Figure 4.5: DSM Taxonomy (Adapted from Browning, 2001)
Design Structure Matrices
(DSMs)
Static Time-based
Component-based DSM
Team-based DSM
Activity-based DSM
Parameter-based DSM

50
4.2.1 Component-based DSM
System engineering efforts in product development involve three
general steps.
1. Decompose the system into its elements
2. Understand and document the interactions between the elements
3. Analyze potential reintegration of elements via clustering.
Every complex system development project includes these steps,
although they are not always approached systematically. A component-
based DSM is a systematic approach for product architecture
integration (Browning, 1998).
A component-based DSM documents the interactions between the
component elements in a complex system. This type of DSM has been
utilized by Pimmler and Eppinger (qtd. in Browning, 2001) to reveal and
explore alternative architectures for an automobile climate control
system at Ford Motor Company. Different types of interactions can be
displayed in a component-based DSM according to project type (Table
4.1).
Table 4.1: A Taxonomy of System Element Interactions (Pimmler and Eppinger qtd. in Browning, 2001)
Spatial needs for adjacency or orientation between two elements
Energy needs for energy transfer/exchange between two elements
Information needs for data exchange between two elements
Material needs for material exchange between two elements
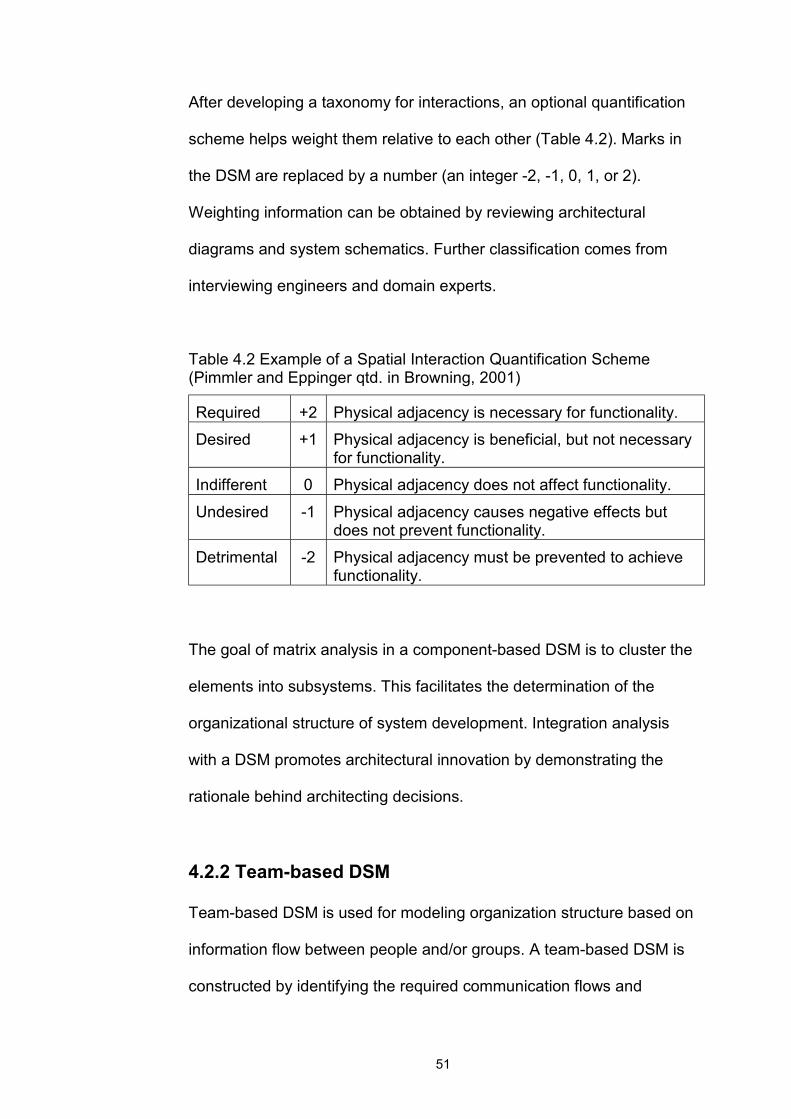
51
After developing a taxonomy for interactions, an optional quantification
scheme helps weight them relative to each other (Table 4.2). Marks in
the DSM are replaced by a number (an integer -2, -1, 0, 1, or 2).
Weighting information can be obtained by reviewing architectural
diagrams and system schematics. Further classification comes from
interviewing engineers and domain experts.
Table 4.2 Example of a Spatial Interaction Quantification Scheme (Pimmler and Eppinger qtd. in Browning, 2001)
Required +2 Physical adjacency is necessary for functionality. Desired +1 Physical adjacency is beneficial, but not necessary
for functionality. Indifferent 0 Physical adjacency does not affect functionality. Undesired -1 Physical adjacency causes negative effects but
does not prevent functionality. Detrimental -2 Physical adjacency must be prevented to achieve
functionality.
The goal of matrix analysis in a component-based DSM is to cluster the
elements into subsystems. This facilitates the determination of the
organizational structure of system development. Integration analysis
with a DSM promotes architectural innovation by demonstrating the
rationale behind architecting decisions.
4.2.2 Team-based DSM
Team-based DSM is used for modeling organization structure based on
information flow between people and/or groups. A team-based DSM is
constructed by identifying the required communication flows and
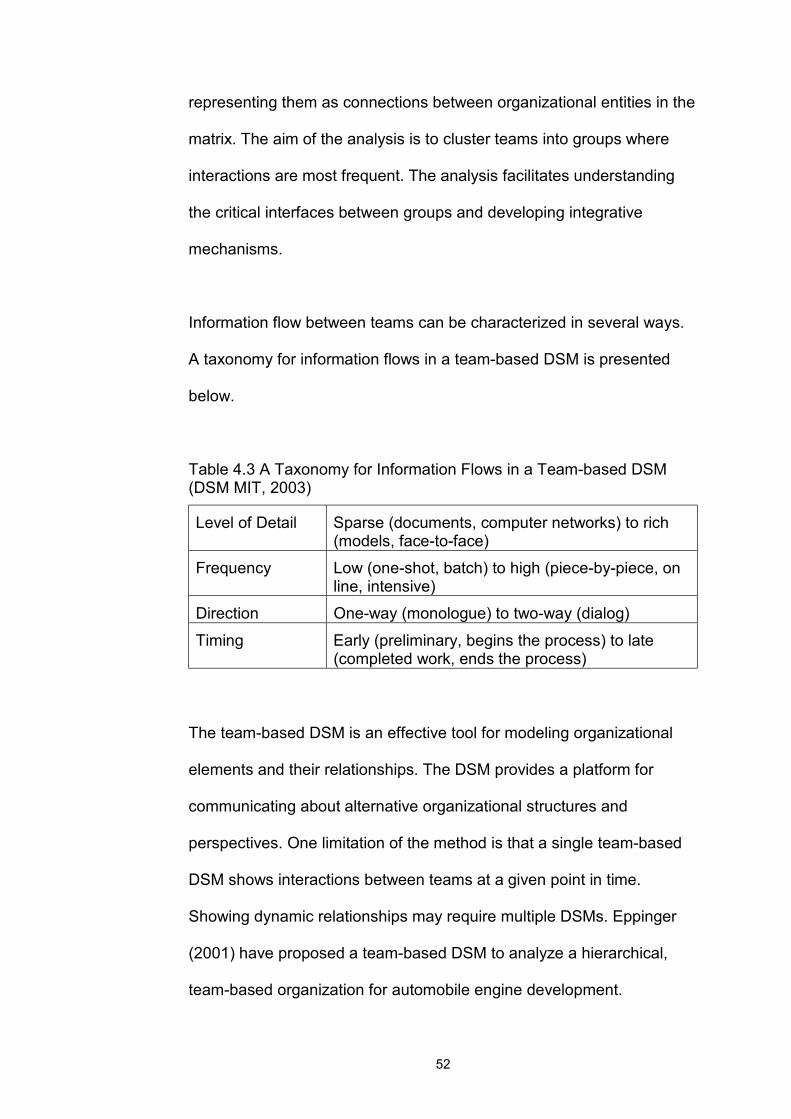
52
representing them as connections between organizational entities in the
matrix. The aim of the analysis is to cluster teams into groups where
interactions are most frequent. The analysis facilitates understanding
the critical interfaces between groups and developing integrative
mechanisms.
Information flow between teams can be characterized in several ways.
A taxonomy for information flows in a team-based DSM is presented
below.
Table 4.3 A Taxonomy for Information Flows in a Team-based DSM (DSM MIT, 2003)
Level of Detail Sparse (documents, computer networks) to rich (models, face-to-face)
Frequency Low (one-shot, batch) to high (piece-by-piece, on line, intensive)
Direction One-way (monologue) to two-way (dialog) Timing Early (preliminary, begins the process) to late
(completed work, ends the process)
The team-based DSM is an effective tool for modeling organizational
elements and their relationships. The DSM provides a platform for
communicating about alternative organizational structures and
perspectives. One limitation of the method is that a single team-based
DSM shows interactions between teams at a given point in time.
Showing dynamic relationships may require multiple DSMs. Eppinger
(2001) have proposed a team-based DSM to analyze a hierarchical,
team-based organization for automobile engine development.

53
4.2.3 Activity-based DSM
The activity-based DSM method assumes that each task in a process
can be modeled as an information processing activity, using and
creating information. The output information from one activity becomes
the input information to another activity. Activities are indicated in the
rows and columns, in roughly a chronological order. Matrix elements
indicate the existence and direction of information flow from one activity
to another. Reading across a row, a dependency mark reveals the flows
to that element from the column activities. Reading down a column
reveals the output information flows from the activity represented by that
column to other activities. Thus, the marks to the right of the diagonal in
a single row reveal a feedback from a later activity to an earlier one that
causes iteration in the design process. By re-arranging the position of
activities, unintentional iterations can be avoided and an optimum
sequence may be obtained.
Activity-based DSMs provide process visibility, highlight feedbacks and
iterations and improve concurrency. Designing a design process
according to the information flows rather than to the interactions
between traditional activities can also eliminate nonvalue-added
activities, facilitating for “lean” processes. However, This type of DSM
has some limitations besides the lack of hierarchy of activities that
mentioned in the previous chapter. First, a single DSM shows only a
single process flow; it does not show all possible flow paths (Larson and
54
Kusiak, 1996). While the DSM can be augmented with additional
symbols to represent contingent information flow (e.g. “+” instead of “X”)
analysis and improvement of a large process with many possible flow
paths becomes intractable without simulation. Second, the DSM does
not explicitly show overlapping activities. A Gantt chart remains one of
the best representations of activity concurrency (Browning, 2001).
This type of DSM is probably the most exploited DSM type among the
others. Krishnan (1993) has worked on sequencing and overlapping
activities in product development via DSM to improve design processes
in the automotive and the electronics industry. Eppinger et al. (1994)
have used activity-based DSM to model processes of a major
semiconductor company (Intel Co.). Browning (1998) has applied DSM
techniques in developing lean design strategies for aerospace industry.
Ulrich and Eppinger (1999a) have modeled a critical portion of the
development process with activity-based DSM at FIAT automobile
company. Ulrich and Eppinger (1999b) have also utilized the technique
at Kodak to model cartridge development processes. Rogers and Salas
(1999) have applied activity-based DSM at NASA for sequencing and
monitoring design processes. Tang et al. (2000) have devised an
algorithm of recognizing the coupled activities in a process to increase
concurrency of designs and illustrated the framework with a die design
example. English et al. (2001) have developed a method for identifying
the strength of couplings in multidisciplinary design process in
mechanical and aerospace engineering. Cronemyr et al. (2001) have

55
used the DSM method to simulate the impact of improvements to the
engineering design process. Chen et al. (2003) have incorporated
activity-based DSM with timing for project scheduling.
4.2.4 Parameter-based DSM
In chapter 3, it was concluded that there is a need for a building design
process modeling tool which is capable of representing iterations and
detailed processes. The use of parameter-based DSM is proposed here
for this purpose. Parameter-based DSMs are developed on the premise
that bottom-up analysis of design processes based on low-level
activities can reveal better insights into design process structure.
A parameter-based DSM is a square matrix, which defines the structure
of parameter decisions. A parameter is a physical property whose
value determines a characteristic or behavior of a system component
and parameter decisions correspond to the lowest level activities in a
design process. Thus, the level of analysis constitutes a main difference
between activity- and parameter-based DSMs.
Activity- and parameter-based DSMs also differ in the scope of their
representations. While an activity-based DSM includes reviews, tests,
and analyses, parameter-based DSM documents the physical and
rational relationships between the parameters that determine design. In
other words, a parameter-based DSM describes design processes
close to the product architecture. This is an advantageous property

56
since high-level processes sometimes contain unnecessary activities
and some high-level activities produce unnecessary outputs. Building a
process up through the integration of low-level activities and
deliverables, which are known to be required because of their closeness
to the design at a parameter level, can help identify irrelevant activities
and outputs in the process. Other benefits of using parameter-based
DSMs are explained in the next chapter in building design context.
The application of parameter-based DSM analysis is described below
via a simplified example. The example illustrates relationships between
parameters affecting plenum depth for a suspended ceiling design. The
table below shows seven parameters defined for this problem. The
predecessors and owners of the parameters are also listed.
Table 4.4: List of Parameters, Their Predecessor(s) and Owner(s) for Suspended Ceiling Design Parameter Description Predecessor(s) Owner(s)
A Floor Area - Architect
B Floor to Ceiling
Height
A, G Architect
C Beam Depth A, E Structural Engineer
D Air Duct Depth A Mechanical Engineer
E Air Duct-Beam
Integration
Scheme
C, D Architect, Structural
Engineer, Mechanical
Engineer
F Lighting Fixture
Depth
A Architect
G Plenum Depth C, D, E, F Architect
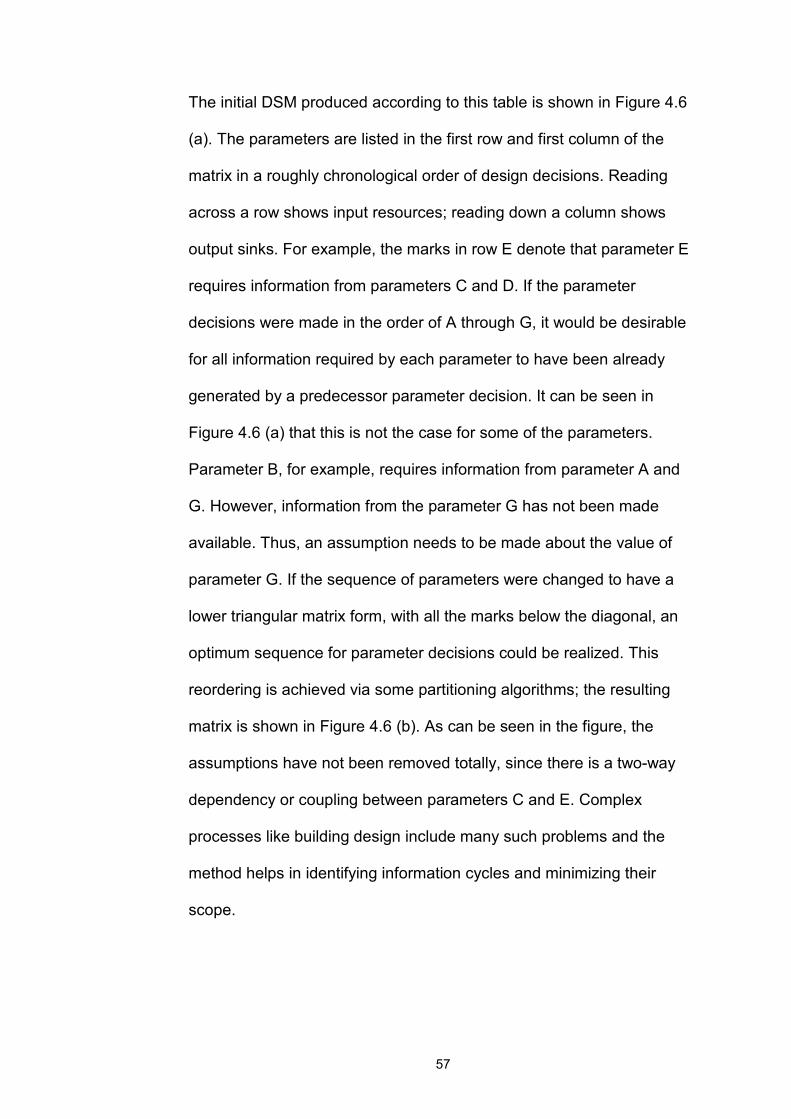
57
The initial DSM produced according to this table is shown in Figure 4.6
(a). The parameters are listed in the first row and first column of the
matrix in a roughly chronological order of design decisions. Reading
across a row shows input resources; reading down a column shows
output sinks. For example, the marks in row E denote that parameter E
requires information from parameters C and D. If the parameter
decisions were made in the order of A through G, it would be desirable
for all information required by each parameter to have been already
generated by a predecessor parameter decision. It can be seen in
Figure 4.6 (a) that this is not the case for some of the parameters.
Parameter B, for example, requires information from parameter A and
G. However, information from the parameter G has not been made
available. Thus, an assumption needs to be made about the value of
parameter G. If the sequence of parameters were changed to have a
lower triangular matrix form, with all the marks below the diagonal, an
optimum sequence for parameter decisions could be realized. This
reordering is achieved via some partitioning algorithms; the resulting
matrix is shown in Figure 4.6 (b). As can be seen in the figure, the
assumptions have not been removed totally, since there is a two-way
dependency or coupling between parameters C and E. Complex
processes like building design include many such problems and the
method helps in identifying information cycles and minimizing their
scope.

58
(a) (b)
Figure 4.6: A Parameter-based DSM Example (a) The Initial Matrix (b) The Partitioned Matrix
Black et al. (1990) have applied parameter-based DSM method to
automobile brake system design. This work enabled designers to
investigate the best initial points for iterated design and helped the
company develop a systematic approach to low-level design process
planning. Cesiel (1993) documents a similar application where designed
experiments were used to study the parameter-based design options.
Dong (1999) has analyzed the design processes of various parts of a
car using parameter-based DSM. Rask and Sunnersjö (qtd. in
Browning, 2001) have used the method to describe the relationship
between design variables of a robot arm and its housing. Previously,
design parameters were separated into two, coupled “meta-activities”:
“design arm housing” and “design arm.” The DSM model was used to
sequence and integrate the low level activities in a new way. The
method has also been used at Boeing Company to plan the
development of a multivariable wing analysis tool. Listing subroutines of
the new tool, which were once individual analysis tools, as rows in the
DSM and noting their necessary data exchanges as interfaces, the
designer prescribed an efficient process for wing design procedures
(Browning, 1998). Mascoli (1999) has applied DSM as a tool to organize
design parameters at the conceptual design phase of aero-engine

59
development. The analysis enabled understanding the relationships
between design parameters and which interactions occur within a
specific component, and which interactions cross the component
boundaries.
4.2.5 Variations on the Basic DSM Method
Since its initiation in 1980s, DSM research has widened its scope and
several variations of the basic DSM method have emerged. In fact, the
method is versatile enough to be adapted to the needs of different types
of analyses. Some modified DSM models are discussed below.
Numerical DSMs have been developed to quantify interactions. In
binary DSM notation (0/1, or X marks) only the absence or existence of
a dependency between different system elements can be shown.
However, numerical DSMs can contain a multitude of attributes that
provide more detailed information on the relationships between the
different system elements. These include the following;
1. Level numbers: They indicate the order in which the feedback
marks should be torn. The mark with the highest level number
will be torn first and the matrix is partitioned again. This process
is repeated until all feedback marks disappear. Level numbers
range from 1 to 9 depending on the designers judgement of
where a good estimate for a missing information piece can be
made (Steward, 1981).

60
2. Importance ratings: A scale can be constructed to differentiate
between different importance levels of the X marks (For example
1: high importance, 2: medium importance 3: low importance). In
this approach, low importance marks are first torn and then the
medium and high in a process similar to the level numbers
method explained above.
3. Dependency Strength: This is a measure of dependency strength
on scale (For example, 1: minimum dependency, 2: medium
dependency, and 3: maximum dependency). The matrix is
partitioned by minimizing the sum of the dependency strengths
above the diagonal.
4. Volume of Information Transferred: An actual measure of the
volume of the information exchanged (measured in bits) may be
utilized in a DSM. Partitioning of such a DSM would require a
minimization of the cumulative volume of the feedback
information.
5. Variability of Information Exchanged: A variability measure can
be devised to reflect the uncertainty in the information exchanged
between system elements. This measure can be the statistical
variance of outputs for that task accumulated from previous
executions of the task (or a similar one). However, if there is a
lack of such historical data, a subjective measure can be devised
to reflect this variability in task outputs (Yassine et al., 1999).
6. Probability of Repetition: This number reflects the probability of
one activity causing rework in another. Upper-diagonal elements
61
represent the probability of having to loop back (i.e. iteration) to
earlier activities after a downstream activity was performed.
Partitioning algorithms can be devised to order the tasks in this
DSM such that the probability of iteration or the project duration
is minimized (Smith and Eppinger, 1993).
7. Impact strength: This can be visualized as the fraction of the
original work that has to be repeated if an iteration occurs
Browning (1998). This measure is usually utilized in conjunction
with the probability of repetition measure, above, to simulate the
effect of iterations on project duration.
Browning (1998) has demonstrated that a DSM-based model of a
process could be used to quantify a process configuration’s expected
cost and duration via simulation. It is assumed that cost and duration
are largely a function of the number of iterations required in the process
execution and the scope or impact of those iterations. Since iterations
may or may not occur depending on a variety of variables, this model
treats iterations stochastically, with a probability of occurrence
depending on the particular package of information initiating rework.
Thus, this approach requires a DSM model and some additional data
such as cost and duration estimates, learning curve, probability of a
typical change in the data causing rework, and the impact of that rework
if it occurs.

62
Besides adding extra attributes to DSM analysis, modifying the content
of DSM elements has also been used to create variations to basic DSM.
Hamer et al. (1999) have studied document interdependencies on the
design phase of one-of-a kind delivery process using a DSM that does
not conform to established component-, team-, activity-, and parameter-
based DSM classification. In the proposed method, each row and
column represented one document class and the rows and columns
were ordered identically. Reading across a row lists all the information
which is needed as an input to produce the document class in question.
Reading down a column outlines all the document classes that use the
document class in question (column) as input information. Unlike a
complete DSM analysis, the study did not aim at optimizing the
sequence in which the documents are produced, since the main aim of
the analysis was to obtain a picture of the document level
interdependencies.
Lockledge and Salustri (2001) have developed “The Design Process
Matrix” to model how functional systems relate to one another and to
physical components. The model is very similar to conventional DSMs,
but the authors used columns in the matrix for major components, and
rows for major functional systems and subsystems. Thus, elements of
the matrix represent interactions between a functional system and a
component. Like the document example mentioned above, the aim in
this study was not to prescribe a single process for engine design, but
to provide a map of the existing process.

63
4.2.6 DSM Applications in the Construction Industry
DSM methods are mainly used in product engineering to optimize
product design processes. However, there are a few DSM applications
in the construction industry. DSM has been applied in building research
by Loughborough University and VTT (National Research Organization)
in Finland. The research team at the Loughborough University has
developed a DSM-based design planning technique called Analytical
Design Planning Technique (ADePT). This research has led to many
publications (Austin et. al., 2000; Baldwin et. al., 1999; Austin et. al.,
1999; Baldwin et. al., 1998) and the team won the 'Achievement
through Innovation' award at the 1999 Quality in Construction Awards.
Currently, they are extending this research under the “Integrated
Collaborative Design” project.
ADePT research began in early 1990s in order to define and represent
the work involved and the information flowing in a multidisciplinary
building design project and to develop a technique to schedule the
design phase more efficiently. The study combined two structured
analysis techniques, namely data flow diagrams and design structure
matrix.
In ADePT, information flows between design activities are first modeled
via data flow diagrams. In the next step of the technique, DSM analysis
is used to achieve an optimum sequence of design tasks. In the earlier

64
versions of the model a binary information dependency scale was used.
In the later versions, the researchers proposed a three-point scale, “A”
being the most critical information and “C” being the least. Information
classifications were made on the basis of three factors: strength of
dependency of the task on the information, sensitivity of the task to
slight changes in the information, and the ease with which the
information can be estimated. As the task is increasingly dependent and
sensitive and less estimable, the criticality of the information flow
increases (Austin et al., 2000).
The ADePT design process model originated from a simple design
example of a plant room consisting of 17 tasks across civil engineering,
mechanical engineering, structural engineering, and electrical
engineering disciplines (Austin et al., 1994). The research team has
since elaborated the model to include 600 design tasks and 4600
information requirements (Austin et al., 2000). Recently, Salford and
Loughborough Universities, in conjunction with some industrial
collaborators, have produced The Generic Design and Construction
Protocol which aims to be a description of the entire project process.
The protocol combines Salford’s Construction Process Protocol with
ADePT (Macmillan et al., 2001; Austin et al., 2002).
Huovila and Seren (1998) have studied the applicability of DSM in
understanding customer needs and in planning the building design
process. The authors have proposed integrative use of activity-based

65
DSM with Quality Function Deployment (QFD) matrix. QFD is a team
decision-making tool used to achieve a common understanding of
design objectives and selected design solutions. In such a matrix,
properties of design are entered as columns and requirements are
entered as rows. The relationships between properties and
requirements are entered at the intersection cells in a numerical scale
(e.g. how important a specific property in satisfying a customer
requirement? 3: high, 2: medium, 1: low). A weight (importance) factor
is assigned to each customer requirement. The customers’ requirement
priorities and their perception of the performance of the existing
products are also entered in the matrix. Using all the data how specific
designs satisfy customer requirements are calculated and different
configurations are compared. The authors claim that the use of both
tools facilitates for a customer-oriented and efficient design process.
Austin et al. (2001) have utilized DSM technique to map conceptual
building design activities in an experimental workshop. The workshop
aimed to test the applicability and validity of a preliminary model of the
conceptual design phase. The workshop involved 15 participants
divided into three groups. Two of the teams were designated as test
groups and the third as the control group. The two test groups were
provided with a copy of the preliminary conceptual design framework.
One team was given the option to follow it while the other team was
asked to follow it. The two teams were then introduced to the brief and
told to begin the exercise. The third team was asked to solve the design

66
problem without the framework model. An activity-based DSM was
produced to map the processes of the each team and the performances
of the groups were compared accordingly.
4.3 DSM Tools
DSM tools can be obtained either as standalone programs or as Web-
based tools.
4.3.1 Standalone Programs
PSM 32 (Problem Solving Matrix) is a commercial DSM program
developed by the Problematics firm. PSM 32 is capable of producing
numerical DSMs, and performing analyses such as partitioning and
banding. It also provides simplistic tearing advice (Problematics, 2003).
Acclaro Designer is team collaboration software solution permitting the
construction and analysis of multi-level hierarchical design matrices.
Acclaro Designer adopts the axiomatic design approach to the
construction of conceptual and functionally decomposed designs.
Projects in the program can also be exported to Microsoft Project.
Acclaro Sync. software supports the synchronization of Microsoft
Project schedules to changing design matrices (Axiomatic Design Inc.,
2003).
DeMAID/GA (Design Manager’s Aid for Intelligent Decomposition with a
Genetic Algorithm) is a knowledge-based software tool for ordering the

67
sequence of design processes and identifying a possible multilevel
structure for a design cycle. It has been developed at the NASA Langley
Research Center. DeMAID displays the processes in a Design Structure
Matrix format. A genetic algorithm (GA) capability was added to the
latest version of DeMAID to examine a large number of orderings of
processes in an iterative subcycle and optimize the ordering based on
cost, time, and iteration requirements.
DeMAID was developed as a standalone program, but it has been
integrated with a Web-based system for easy monitoring of project flow.
A main project web page has been developed with links to the process
web pages created by project team members. The project Web pages
describe various processes of the project, such as disciplinary analyses
and optimization. The program generates an HTML file for use with a
web browser, allowing engineers to monitor the project flow. The HTML
file is automatically reloaded every few seconds to display the current
status of the DSM Web page and uses different colors to indicate the
current status of each process and coupling (Rogers and Salas, 1999).
4.3.2 Web-based Tools
Sabbaghian and Eppinger (1998) have proposed a Web-based tool to
enable rapid collection, continuous update and structured display of
organizational and task interaction in large projects. The program uses
a distributed data collection system involving a model coordinator and
many participants. The Web interface allows the model coordinator to

68
select a task for decomposition and assign another individual to model
this lower level DSM. The system then automatically generates an e-
mail to the target individual requesting his/her cooperation in modeling
activity. The system utilizes a multi-tiered DSM configuration to present
collected data.
WeB-DSM is a commercial system analysis and project management
tool developed by Decision Sciences Inc. The system shows near-real
time Web-based status of all events in a process, incorporates rework
estimates, and optimizes the sequencing of activities via partitioning. It
also has links to Microsoft Project and Microsoft Outlook Business
Contacts (Decision Sciences Inc., 2002).
PlanWeaver is a Web-based software application for optimizing building
design activities developed by Biw Technologies Ltd. It is based on
ADePT technique discussed above. PlanWeaver contains a generic
model of building design process at activity level. This model can be
tailored to the design team’s specifications. The final model is optimized
through partitioning and delivered as a project program by linking the
DSM to a project programming software application such as MS Project,
Primavera or PowerProject. This project program can then be reviewed.
If changes are needed, the matrix can be manipulated either directly or
via the project planning software package.
69
5. PARAMETER-BASED DSM FOR BUILDING
DESIGN
This chapter presents the proposals for the use of the parameter-based
DSM in building design. After a discussion of the underlying paradigms,
expected benefits of the method are envisaged. Finally, a knowledge
management framework is proposed for the application of the method.
5.1 Underlying Paradigms
The use of parameter-based DSM in building design is based on a
systematic approach to design. This endeavor has been motivated by two
design paradigms, namely, design methods research tradition and lean
design approach which are briefly discussed below.
5.1.1 Design Methods Research Tradition
The design methods research tradition dates back to 1960s when new
mathematical techniques and computing were all available to the design
theorists in highly developed forms. The design methods approach
emerged from these sources as a discipline in its own right. In this
research tradition, several techniques and theories have been borrowed
from operations research such as matrix analysis, linear programming,
network analysis, Monte Carlo method, value analysis, decision theory and
theory of games. A number of graphic techniques have also been
70
developed such as interaction chart and connections diagram (Broadbent,
1988).
The design methods movement initiated the idea that human affairs may
have a mathematical structure (Atkin, 1974). This idea motivated many
researches, for example, Baykan and Pultar (1995) have analyzed the
structure of space-activity relationships in houses using the notion of a
simplicial complex defined by a relationship between two sets. The
recognition that the design process has an underlying structure was also
rooted in this movement. One of the pioneers of design methods
movement, John Chris Jones, explained in his famous book Design
Methods: Seeds of Human Futures (1970) that the main challenges for a
design manager are the following:
1. Identifying and reviewing critical decisions.
2. Relating the costs of research and design to the penalties for
taking wrong decisions.
3. Matching design activities to the persons who are expected to
carry them out.
4. Identifying usable sources of information.
5. Exploring the interdependency of processes.
Thus, the design methods research tradition constitutes one of the
underlying paradigms of parameter-based DSM research in building
design.

71
5.1.2 Lean Design
The major aim of lean production is to eliminate waste in production
processes. Lean production was developed by a Toyota team, led by Ohno
in the late 1980s. The term “lean” was coined in 1991 by the research team
working on international auto production to reflect both the waste reduction
nature of the Toyota production system and to contrast it with craft and
mass forms of production (Howell, 1999). Lean philosophy has later
expanded into many other fields. In 1993, the U.S Air Force and the
Massachusetts Institute of Technology established a research organization
named the Lean Aerospace Initiative (LAI). The initiative defines the term
lean as “adding value by eliminating waste, being responsive to change,
focusing on quality, and enhancing the effectiveness of the workforce.”
(LAI, 2002). In 1997, the Lean Construction Institute (LCI) was founded to
extend lean design and production philosophy to the construction industry.
The institute is a non-profit association supporting lean research in
construction and it disseminates knowledge through its publications and
annual conferences (LCI, 2002).
Gregory Howell, the director of the LCI, explains that the first goal of lean
construction is to fully understand the underlying “physics” of processes,
the effects of dependence and variation. He also comments that these
physical issues are ignored in current practice which tends to focus on
more human issues such as teamwork, communication and commercial

72
contracts. In current practice for example, a delay is often attributed to one
or more participants being morally deficient. However, lean design theory
claims that such delays may be due to the combined effects of
dependence and variation in a long period (Howell, 1999).
Lean design groups advocate the use of design structure matrix based
methods, because they suit well the aims of lean philosophy. Like the lean
design approach, the design structure matrix method aims to understand
the underlying dependence structure in processes and to ultimately
eliminate waste (or non-value adding components) from the process.
5.2 Expected Benefits
Browning (1998) explains that DSMs are especially useful when several
participants must coordinate actions and/or information, because they
provide a medium whereby the groups can visualize and explore how they
must function together to achieve overall goals. Such is the condition in the
collaboration of architects and engineers in building design.
The author of this dissertation believes that the main power of the
parameter-based DSM lies in its capability to be used both as a system
analysis and a project management tool. Most of the process modeling
methods used in building design have been borrowed from the
manufacturing industry and these models tend to view design process as

73
“document production.” Even the structured techniques adapted to building
design, for example ADePT (Austin et al., 2002), take only the document
producing activities in consideration for modeling. However, it is more
advantageous to view design as making decisions rather than creating
documents or following schedules. Being close both to product and
process architectures, parameters are the core concepts of designing.
Within this perspective, expected benefits of the proposed method are
discussed below under three headings: process improvement, process
integration, and other information processing applications.
5.2.1 Process Improvement
5.2.1.1 Iteration Management
Design iteration implies rework or refinement, returning to previously made
decisions to account for changes (Browning, 1998). Iteration occurs in all
design projects; however, it is rarely discussed in design literature.
Although understanding and controlling the nature of iteration is very
important to improve design processes, there are no formal or detailed
descriptions of where and how iteration occurs.
Iteration is typically necessary for two reasons; an unexpected failure of a
design to meet established criteria, and an expected response to
information which was generated after the previous iteration was

74
completed. The former is called unexpected iteration and the latter is called
expected iteration. Failure to converge to design specifications can require
unexpected iteration. Such insufficiency in the design is more likely to
occur when requirements and objectives are unstable or prone to change.
Unexpected iterations also arise from new information arriving late in the
process (caused by out of sequence activities, mistakes, etc.). Expected
iteration usually results from downstream activities (particularly verification
and validation activities) revealing aspects of upstream activities that must
be reworked. Typically, some of the design decisions are made even
though the information needed to complete them fully is not known. As this
input information becomes available, the tasks are repeated and the
product comes closer to meeting the design specification.
Rework can also be generated by changes in the information provided to
and received from concurrent or interdependent (coupled) activities. Also,
when downstream or coupled activities create rework for upstream
activities, the resulting changes may cause second order rework for interim
activities (those between the upstream and downstream activities directly
involved in the iteration). Both types of iteration are common in the design
process (Smith and Eppinger, 1993).
Browning’s (1998) “intentional” and “unintentional” categories of iteration
address the same two types of iteration. Clausing (qtd. in Browning 1998)
similarly proposes the categories “creative iteration” and “disciplined

75
iteration” as intentional and “dysfunctional iteration” as unintentional.
Ballard (2000) proposes a distinction between positive vs. negative
iteration in design. He claims that positive iteration is essential for
generating value in design processes. However, not all iteration generates
value. Negative iteration that can be eliminated without value loss is waste.
Ballard explains that research should be made on reducing negative
iteration and on generating value through promoting positive iteration.
Although iteration management is very important for conducting efficient
processes, it is a difficult task. Browning (1998) explains that the first step
towards reducing design cycle time lies in minimizing unintentional
iterations. This necessitates ensuring that the right information is available
at the right time in the process. The next step towards accelerating the
design cycle involves two basic options for managing intentional iterations:
1. Faster iterations.
2. Fewer iterations.
Faster iterations can be achieved by improved coordination e.g. CAD
systems that accelerate individual activities, improved intragroup
coordination for teams assigned to individual activities, increased co-
location of those executing highly coupled activities, concurrent
engineering, integration of engineering analysis tools used for different
purposes, and removal of extraneous activities from the process. Previous
studies by Eisenhardt and Tabrizi, and Gebala and Eppinger (both qtd. in

76
Browning, 1998) found that additional faster iterations are significantly
correlated with faster design development. Fewer iterations result from
improving the structure of design processes e.g. activity decoupling and
improved activity sequencing. However, fewer iterations can mean lower
design performance. They make sense if each one is of sufficient
productivity to ensure acceptable output. Faster iterations are
advantageous only if each activity can be accelerated while continuing to
produce satisfactory outputs (Browning, 1998).
There are a number of techniques for managing iterations such as the
design structure matrix, team problem solving, cross functional teams,
shared range of acceptable solutions, shared incomplete information,
reduced batch sizes, team pull scheduling, concurrent design, deferred
commitment, least commitment, set-based vs. point-based design, and
overdesign (Ballard, 2000). Except the design structure matrix method, all
of those techniques take a “communication and negotiation” approach.
They basically aim to improve communication among the participants and
to approximate the possible range of design solutions. However, the
design structure matrix is a structured approach, which aims to provide
explicit definitions of iterations in order to deal with them accordingly.
Rouibah and Caskey (2003) define four aspects of an effective design
change management system:
1. Tracking the iteration’s impact on the system elements.
77
2. Identifying the people to be informed.
3. Determining a reasonable sequence for informing the people identified.
4. Executing an order of activities with the participation of all persons
involved or affected by the change.
A parameter-based DSM gives an overview of the existing relations
between decisions; thus it can be effectively used as a tool to control the
change propagation. When a parameter value is changed, it is very easy to
extract the affected parameters using the dependency network. During
collaborative design, as different design participants decide on parameter
values, capturing the relationship between parameters consequently
specifies the relationship between the decision-makers. Who should be
informed about a change and the sequence of actions that should be taken
can also be easily determined using the tool. As a result, a parameter-
based DSM is an effective change management tool according to the
criteria proposed by Rouibah and Caskey (2003).
5.2.1.2 Common Understanding of a Process
In Chapter 2, it was pointed out that a shared understanding of design
process is an essential component of effective collaboration and having a
common understanding of information content of design entails shared
models. A DSM is a useful tool for opening the process to its participants
and facilitating a common understanding.

78
A parameter-based DSM may provide insights into the following system
properties.
1. Information ownership (who produces a particular piece of information).
Designers may not be aware of what information they hold and what
information they owe to others. DSM can be an efficient learning tool to
discover previously unknown patterns of organizational architecture.
2. The pattern of information dependency.
The DSM method is based on the premise that there is an underlying
structure of design decisions. Due to the complexity and collaborative
nature of design process, the pattern of information dependencies may
not be easily discovered. A DSM opens up the information dependency
patterns to the participants.
3. The optimum sequence of parameter decision points.
In conventional practice, the sequence of design decisions is often
based on intuition and professional experience of designers. There is
no established method in the industry for examining the
appropriateness of decision sequences. Besides its use as a
descriptive tool, a parameter-based DSM can also be used to provide
the optimum sequence of parameter decisions.
4. Critical parameters that cause large iteration cycles.
Decisions on some parameters affect a large number of parameters in
building design. Consequently, the changes in those parameters are
more likely to cause larger iteration cycles. A parameter-based DSM is
very useful for identifying such parameters, called “critical” parameters.

79
5. Schedule of assumptions to be made in the process.
In building design, several assumptions are made when related
information is not available. These assumptions are reviewed at some
point in the process in order to validate them. What assumptions have
been made and when they are to be reviewed are important for process
success. DSM makes these assumptions explicit. It identifies when
assumptions should be made and how they affect the overall process.
5.2.1.3 Concurrent Engineering
Concurrent engineering is increasingly becoming an area of interest in
building design management. From the DSM point of view, moving marks
above the diagonal closer to the diagonal enhances concurrent
engineering by minimizing the scope and duration of the potential iteration.
However, integrating important design decisions into the earlier phases,
which is another aim of concurrent engineering, also results in increased
amount of coupling and lengthened design time.
Concurrent work is often seen as a way to reduce cycle time but, if
concurrent activities are chosen arbitrarily without considering their
dependencies, this can lead to abundant iteration and increased cycle
time. Research has shown that there is an optimum amount of activity
overlapping beyond which additional is not useful (Krishnan et al., 1993).
DSM analysis can help to determine that optimum point.

80
5.2.2 Process Integration
The situation of building design process modeling is similar to that of
building product modeling approximately a decade ago. There are several
attempts from different sources, but the existing models tend to be
incompatible and fragmented. This fragmentation has recently forced, for
example, European Commission research bodies to propose integration
projects. ICCI (Innovation, coordination, transfer and deployment through
networked Cooperation in the Construction Industry -IST-2001-33022) is a
clustered project that aims to establish such a common platform for
integration ideas (Rezgui and Zarli, 2001).
Besides its usage as a process improvement tool, parameter-based DSM
can also be used as a process integration tool. Browning (2002) claims
that parameter-based DSMs are truly integrative applications and a
combinational use of top-down and bottom-up techniques in process
modeling may reveal valuable insights into the process structure. A
discussion on how parameter-based DSM can be used to integrate an
activity-based model is presented below.
Any activity-level process model includes two general components;
namely, process elements (activities) and deliverable elements.
Deliverables are inputs and outputs exchanged by process elements. In
order to truly integrate a group of activities (rather than merely aggregate

81
them) the flow of deliverables among them must be well-defined. In
existing tools, the modeling process starts at a high-level definition and it is
decomposed as needed. In these approaches, there is no way of going
backward i.e. using the deliverables as building blocks and integrating the
model in a bottom-up manner. Therefore, the accuracy of deliverable flows
is always questionable. A parameter-based DSM, however, can be used
as a bottom-up integrative tool. In the example below, parameter-based
DSM is used to integrate two activities modeled with IDEF0 (Taşlı Pektaş,
2003a).
In IDEF0 notation, deliverables are information pieces since the method
focuses on representing a process from the viewpoint of information within
it, rather than of its sub processes. Two activities of elevator design
process and the deliverables (parameter decisions) for each activity are
defined in the example below (Figure 5.1). The diagram shows that there is
a coupling between activities A214 and A215. However, the structure of
this cycle, namely which parameter decisions are dependent on each
other, is not clear (Figure 5.1a).

82
(a)
(b)
Figure 5.1: Two Coupled Activities of Elevator Design Process (a) IDEF0 Model (b) Activity-based DSM
The representation of the same relationships in an activity-based DSM
(Figure 5.1b) does not lend itself to further analysis either. In order to
analyze the situation in detail, a parameter-based DSM can be produced
(Figure 5.2a). The Parameter-based DSM shows the information flows
(dependencies) between the parameter decision points in two activities
and works as a detailed process map. When the DSM is partitioned, the
optimum sequence of the decisions is obtained (Figure 5.2b). Although
iteration can not be removed from the process totally, its scope is
minimized.

83
(a)
(b)
Figure 5.2: Two Coupled Activities of Elevator Design Process (a) Initial Parameter-based DSM (b) Partitioned DSM
This example, although simple, illustrates the integrative use of parameter-
based DSM with IDEF0. Examinations with other process modeling tools
need further research.
5.2.3 Other Information Processing Applications
Parameters are increasingly becoming a center of attention in CAD
(Computer Aided Design) tools. The early geometry-based models have
been replaced by object-oriented information rich models (Rotheroe, 2002;
Rundell, 2002). Wittenoom (1998) claims that “parametrics,” i.e. building
models on parameters as the basic components, will shape the future
developments in information modeling field in the AEC industry. Similarly,
Rouibah and Caskey (2003) identify an emerging “parameter-based
concurrent engineering” paradigm in engineering design where parameter
decisions are considered as the basis of the process.

84
Although representing parameter values in CAD models are studied
extensively, the interactions between parameter decisions is a neglected
issue. This dissertation suggests that explicit definition of parameters and
characteristics of information flows between them may be helpful for the
development of information processing applications that model
components of a system with their interfaces. Previous examples of the
use of parameter-based DSM in software development support this view
(Browning, 1998).
5.3 A Knowledge Management Framework for
Parameter-based DSM
Due to the inherent complexity of building systems, providing a knowledge
management framework is an important issue for building information
models. This dissertation takes a system analysis approach to deal with
knowledge management problems in the proposed method.
A system is an assemblage of components formed to serve specific
functions and subject to constraints. Thus, a system comprises some
essential and interrelated components. Each component contributes to the
performance of the system in serving the specified functions and the
performances of components affect each other. A building is a good
example for a system according to this definition; since, it comprises many

85
essential components designed to meet certain needs. Moreover, the parts
of a building must be fully compatible and are highly interdependent.
In systems analysis, a system is first resolved into its basic components.
Then, it is investigated in order to determine the nature, interaction and
performance of the components or of the systems as a whole.
Components of a system may also be grouped; such groups are called
subsystems. A complex system can be resolved into many types and sizes
of subsystems. For example, it is possible to separate previously defined
subsystems into further subsystems or to recombine parts taken from each
subsystem into a new subsystem. Hence, a system can be analyzed in
many different ways (Merrit and Ambrose, 1990).
This section of the dissertation aims to provide a knowledge management
framework for parameter-based DSM applications in building design. An
earlier version of this framework has also been published elsewhere (Taşlı
Pektaş, 2003b). First, the assumptions and scope of the proposed model
are put forward. Second, the need for explicit definition of parameters is
addressed and the Industry Foundation Classes (IFCs) are proposed as a
solution. Third, some classification schemes for design parameters, based
on different views of parameter-based design, are developed. Fourth,
means for dealing with large DSMs are discussed. Fifth, the
complementary use of IDEF0 and DSM is proposed and finally, visions are
presented for the utilization of the tool as software.
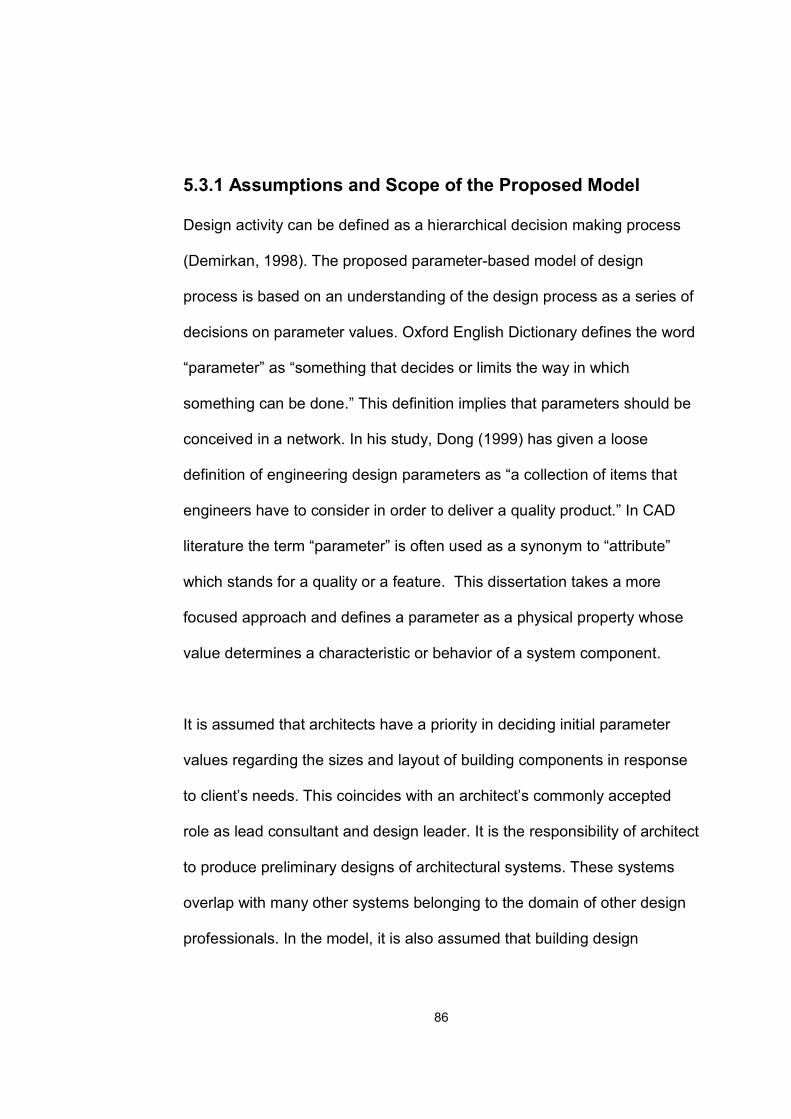
86
5.3.1 Assumptions and Scope of the Proposed Model
Design activity can be defined as a hierarchical decision making process
(Demirkan, 1998). The proposed parameter-based model of design
process is based on an understanding of the design process as a series of
decisions on parameter values. Oxford English Dictionary defines the word
“parameter” as “something that decides or limits the way in which
something can be done.” This definition implies that parameters should be
conceived in a network. In his study, Dong (1999) has given a loose
definition of engineering design parameters as “a collection of items that
engineers have to consider in order to deliver a quality product.” In CAD
literature the term “parameter” is often used as a synonym to “attribute”
which stands for a quality or a feature. This dissertation takes a more
focused approach and defines a parameter as a physical property whose
value determines a characteristic or behavior of a system component.
It is assumed that architects have a priority in deciding initial parameter
values regarding the sizes and layout of building components in response
to client’s needs. This coincides with an architect’s commonly accepted
role as lead consultant and design leader. It is the responsibility of architect
to produce preliminary designs of architectural systems. These systems
overlap with many other systems belonging to the domain of other design
professionals. In the model, it is also assumed that building design

87
engineers’ responsibility is to provide expert advice to verify related
aspects of architect’s design.
In real life projects, it is not so rare that another participant (client,
stakeholders, etc.) interferes with the decision processes of design
professionals. Such interferences are not included in the model, since they
are often biased and unstructured. Thus, it can be expected that they
would not add much to the existing framework.
5.3.2 The Need for Explicit Definition of Parameters and
Industry Foundation Classes
One limitation of the use of the parameter-based DSM is that the
parameters must be explicitly defined. However, for building design this is
usually the case as product architectures and their associated parametric
descriptions are relatively formalized via generic frameworks such as
Industry Foundation Classes (IFCs). The development of the IFCs is a
main standardization effort for the representation of AEC knowledge by the
International Alliance for Interoperability (IAI). IAI is a non-profit
organization comprised of about 600 member companies working to define
and implement a “common language” for integration of project information
that is valid for the life cycle of a project. Through the definition of IFCs, IAI
aims –using an object-oriented approach– to provide a common model to
which all applications can interface (Liebich and Wix, 2003).

88
In order to develop the IFC specification, it is essential to have a common
view of building data that can be shared by the AEC community and
software development professionals. This common view is known as the
IFC object model, defined using a top-down approach. By starting with a
very general view of the of the AEC industry, an overall model of a building
can be defined suitable for software applications. The IFC development
process involves the following components (VTT, 2003):
• Usage Scenarios are written descriptions of the processes that
users perform, such as how a design engineer makes a traffic
analysis for an elevator system. These usage scenarios capture the
decisions and information that are used during each step of the
process.
• Process Diagrams are visual representations of the process that is
being defined. A process diagram is a diagrammatic representation
of a usage scenario. IDEF0 is the recommended diagramming
method for IFC development.
• Classes are object-oriented programming components used to
define objects. They are designed to support the needs of the
process and include concise definitions of the AEC data objects. For
example, elevator parts like car, landing, and hoistway may
represent a class (Figure 5.3).
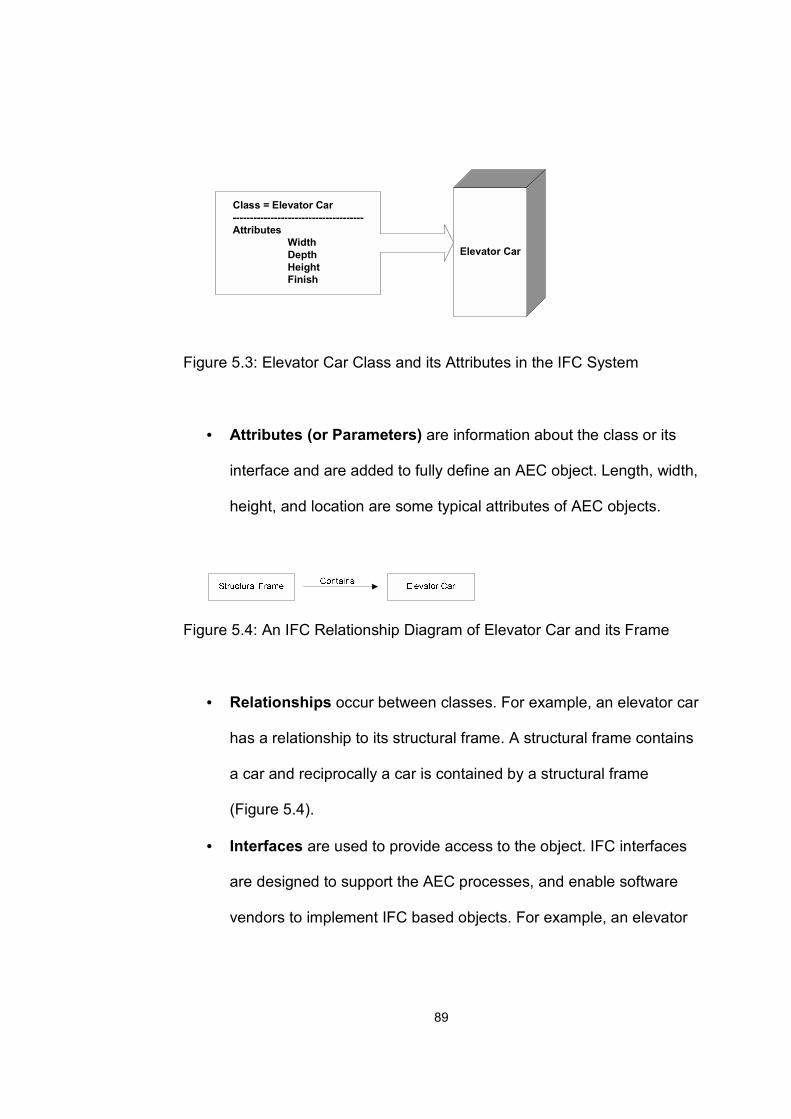
89
Figure 5.3: Elevator Car Class and its Attributes in the IFC System
• Attributes (or Parameters) are information about the class or its
interface and are added to fully define an AEC object. Length, width,
height, and location are some typical attributes of AEC objects.
Figure 5.4: An IFC Relationship Diagram of Elevator Car and its Frame
• Relationships occur between classes. For example, an elevator car
has a relationship to its structural frame. A structural frame contains
a car and reciprocally a car is contained by a structural frame
(Figure 5.4).
• Interfaces are used to provide access to the object. IFC interfaces
are designed to support the AEC processes, and enable software
vendors to implement IFC based objects. For example, an elevator
Elevator Car
Class = Elevator Car--------------------------------------Attributes
WidthDepthHeightFinish

90
object must support a variety of AEC disciplines and include
interfaces for traffic analysis, structural consideration, costing, etc.
ElevatorCar
WeightLocation
ShapeSize
LocationAccess
ShapeSize
LocationLoading
WiringLighting
Architectural Interface Structural Interface
Services Interface
Electrical Interface
Figure 5.5: The Interfaces of Elevator Car Class in the IFC System
Being a widely accepted standardization effort, IFC development shapes
the future of building information modeling. Therefore, future parameter-
based models of design process should be integrated with IFCs. Usage
scenarios and activity diagrams of IFCs can be effectively used as
reference top-level process definitions which guide the development of
DSMs. Attribute definitions of IFC classes can be used to define and
classify the parameters. The case study on elevator design in Chapter 7
demonstrates how IFCs and parameter-based DSM can be integrated.
91
5.3.3 Classification of Parameters
This dissertation identifies four different views to analyze a parameter-
based design. First of all, parameters are characteristics or attributes of
products, so their relationship with product architecture is of concern.
Secondly, parameter-decisions are the lowest-level components of a
process —a view which is often emphasized in this dissertation—, thus,
the place of parameter decisions in whole process architecture is
interesting to study. Thirdly, in building design, parameter decisions are
often made in a distributed environment by different design professionals;
then, the information ownership issues (role view) arise. Finally, the
definition of “parameter” devised in this dissertation conceptualizes
parameters in close relation to performance requirements that they satisfy.
Therefore, the analyses of relationships between parameter decisions and
performance requirements deserve attention (Figure 5.6).

92
A3
A4
A1
A2
Figure 5.6: Four different Views of Parameter-based Design
Developing a classification scheme and representing it in a DSM increase
the descriptiveness of the tool. In parameter-based DSM applications in
building design, parameters can be categorized in four ways according to
the views adapted:
1. Classification according to the building parts that a parameter
belongs to.
2. Classification according to the parent activities.
3. Classification according to the “owner” of a parameter.
4. Classification according to the information content of a parameter
(or an information flow).
The details of these four schemes are discussed below.
93
5.3.3.1 Classification According to Building Parts
In a DSM, systems are usually defined in relation to the parts of the design
object. Parameters belonging to different building parts may be shown in
different colors in a parameter-based DSM for building design. In this way,
the information flows or dependencies among building systems and
subsystems can be easily understood. UNIFORMAT II (Charette and
Marshall, 1999) can be used as the base for classification of building parts.
UNIFORMAT II is an elemental classification system that has been widely
accepted as an American Society for Testing and Materials (ASTM)
standard. The format is mainly used for cost estimating and building
specifications. Elements are major components, common to most buildings
which usually perform a given function regardless of the design
specification, construction method, or materials used. Examples of such
elements are foundations, exterior walls, sprinkler systems, and lighting.
The classification consists of three levels; namely, major group elements,
group elements, and individual elements (For a detailed list, see Appendix
A.1).
Elemental formats were developed in countries other than the U.S. prior to
UNIFORMAT. The Canadian Institute of Quantity Surveyors (CIQS)
classification and the Royal Institute of Chartered Surveyors (RICS)
classification of the United Kingdom are the most widely used ones in

94
countries which have a classification system for building parts. The need
for a universal elemental system has encouraged the International Council
for Building Research Studies and Documentation (CIB) and the
Construction Economics European Committee (CEEC) to establish an
elemental format to collect costs for international exchange. A major
objective of the CEEC format is to make it compatible with the existing
formats of as many European countries as possible. However, the CEEC
format has not been widely adopted (Charette and Marshall, 1999).
UNIFORMAT is a preferable classification system for the purposes of this
dissertation due to the following reasons:
1. Its framework is hierarchical to allow aggregation and
summarization at different levels.
2. Its framework accommodates unlisted items based on the judgment
of building professionals.
3. Included items have high frequency of occurrence.
4. Included items are distinctive.
5. It can be applied to any building type, although it has been designed
for commercial buildings.
6. It separates the classification of building elements from the
classification of building related site work.
Moreover, UNIFORMAT relates to other widely used classifications such
as CIQS and RICS.

95
5.3.3.2 Classification According to Parent Activities
Some process modeling tools like IDEF0 incorporate a hierarchical
organization. In such tools, it is possible to view the model at different
resolutions and to track relationships between different levels.
4
3
2
1
3
3
2
1
2
1
A0
A4
A42
A-0
More General
More Detailed
This box is the parent of this diagram.
A4
A00
Figure 5.7: The Hierarchical Organization of IDEF0 Modeling (U.S. NIST, 1993)
However, one of the limitations of the DSM method is that it does not
include a hierarchy of elements. This dissertation suggests that
representing the relationships between parameters and high-level activities
may provide better insight into the process structure and also facilitate for
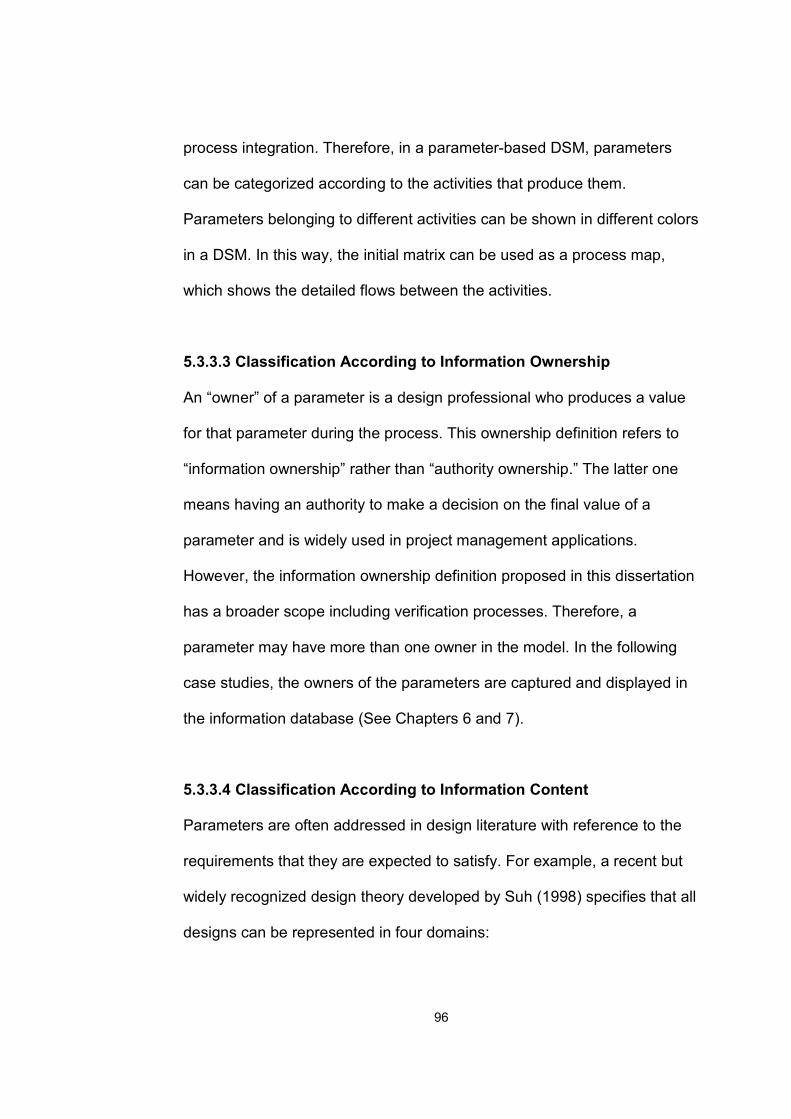
96
process integration. Therefore, in a parameter-based DSM, parameters
can be categorized according to the activities that produce them.
Parameters belonging to different activities can be shown in different colors
in a DSM. In this way, the initial matrix can be used as a process map,
which shows the detailed flows between the activities.
5.3.3.3 Classification According to Information Ownership
An “owner” of a parameter is a design professional who produces a value
for that parameter during the process. This ownership definition refers to
“information ownership” rather than “authority ownership.” The latter one
means having an authority to make a decision on the final value of a
parameter and is widely used in project management applications.
However, the information ownership definition proposed in this dissertation
has a broader scope including verification processes. Therefore, a
parameter may have more than one owner in the model. In the following
case studies, the owners of the parameters are captured and displayed in
the information database (See Chapters 6 and 7).
5.3.3.4 Classification According to Information Content
Parameters are often addressed in design literature with reference to the
requirements that they are expected to satisfy. For example, a recent but
widely recognized design theory developed by Suh (1998) specifies that all
designs can be represented in four domains:
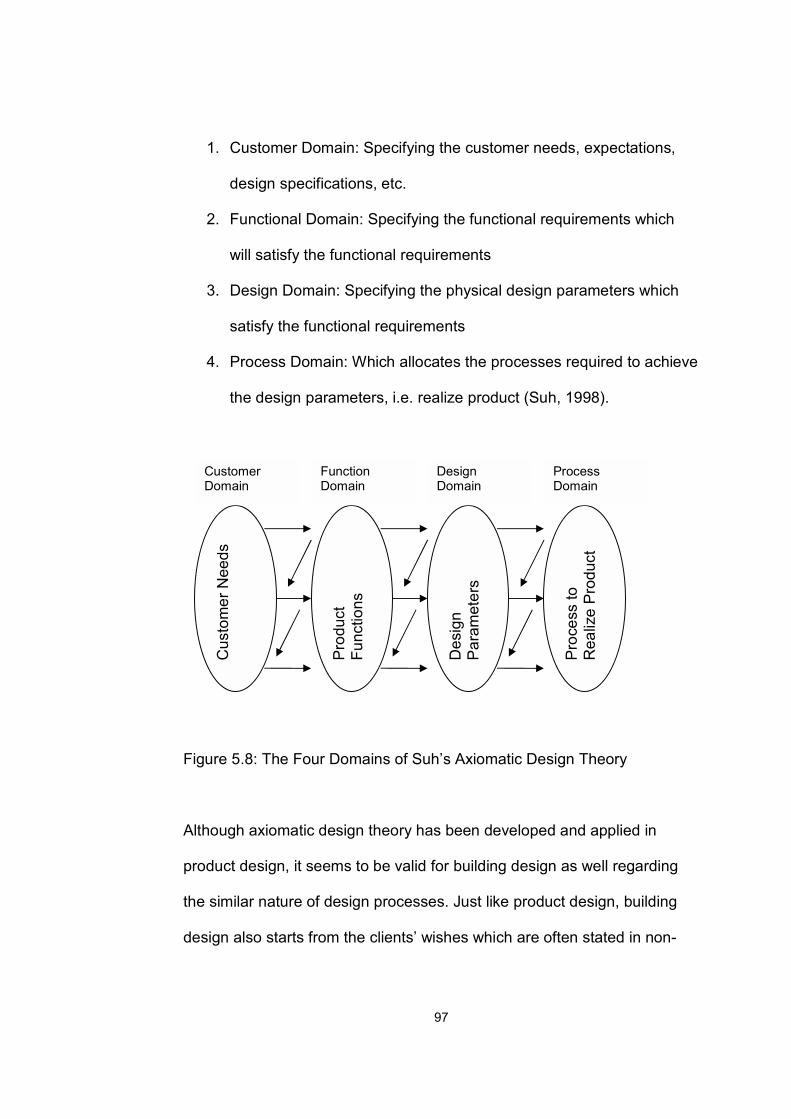
97
1. Customer Domain: Specifying the customer needs, expectations,
design specifications, etc.
2. Functional Domain: Specifying the functional requirements which
will satisfy the functional requirements
3. Design Domain: Specifying the physical design parameters which
satisfy the functional requirements
4. Process Domain: Which allocates the processes required to achieve
the design parameters, i.e. realize product (Suh, 1998).
Figure 5.8: The Four Domains of Suh’s Axiomatic Design Theory
Although axiomatic design theory has been developed and applied in
product design, it seems to be valid for building design as well regarding
the similar nature of design processes. Just like product design, building
design also starts from the clients’ wishes which are often stated in non-
Cus
tom
er N
eeds
Customer Domain
Prod
uct
Func
tions
Function Domain
Des
ign
Para
met
ers
Design Domain
Proc
ess
to
Rea
lize
Prod
uct
Process Domain
98
technical terms. Furthermore, some of the requirements may be covert, or
vaguely stated. The architect must identify and convert these requirements
to more technically specific functional requirements. These are also called
“design constraints’’ in the related literature. The actual design parameters
that satisfy each of the functional requirements lie in the design domain
(Figure 5.9).
Figure 5.9: Suh’s Domains Adapted to Building Design
Within this perspective, building design parameters can be categorized into
two according to their information content.
1. Spatial parameters: size, shape, location, layout, arrangement
2. Performance parameters: the properties of objects directly related to
satisfying some functional requirements.
! Physiological ! Psychological ! Socio-
economical ! Cultural
User Requirements
! Spatial Organization
! HVAC ! Lighting ! Aesthetics ! Safety ! Operational/
Maintenance ! Acoustical ! Durability
Functional Requirements
! Sizes ! Materials ! Physical
Properties ! Adjacency
Structure
Design Parameters

99
These definitions are consistent with the terms “design parameters”
(physical parameters) and “performance parameters” used by Clarkson
and Hamilton (2000) and “explicit attributes” (design parameters) and
implicit attributes (performance parameters) used by McMahon and Xianyi
(qtd. in Clarkson and Hamilton, 2000). The two different parameter types in
building design are illustrated through the exterior wall example shown in
Figure 5.10.
SPATIAL/GEOMETRICAL PARAMETERS Shape Size (width, depth, height, area) Location Layout
PERFORMANCE PARAMETERS
Performance requirement Related Performance parameter
Resist climatic conditions Thermal transmittance Keep out intruders Intrusion resistance Present a decent face to world
Appearance
Structurally sound Structural parameters (Load resistance, Allowable deformation, etc.)
Normal wear and tear Durability parameters (Service life, resistance to temperature changes, etc.)
Provide privacy Transparency/opaqueness Figure 5.10: Different Parameters of an Exterior Wall
Although it is possible to reflect this classification scheme in a DSM, a
more useful application would be to include performance requirements in
Exterior Wall
100
the DSM and to denote the performance requirements that parameters
serve. Spatial parameters often serve more than one requirement. The
information flows can also be categorized according to the performance
requirements. This provides insights into how requirements drive the
solution of a specific design problem.
The basic performance requirement groups in building design are listed
below.
• Spatial Organization
• HVAC
• Lighting
• Acoustics
• Aesthetics/Appearance
• Hygiene
• Safety
• Operational/Maintenance
• Durability
However, the analyses can be based on more detailed forms of these
basic groups. For example, spatial organization requirement can be
decomposed into requirements such as spatial fit, functional zoning,
privacy, proximity, continuity, etc. For more information, one may examine
101
the list of performance factors that are proposed by the U.S. Construction
Specifications Institute (CSI) (Appendix A.2).
5.3.4 Dealing with Large DSM Models
One of the challenging problems in DSM models is presenting complex
systems with many interacting elements in the DSM format. When
constructing models comprised of hundreds of elements, the intuitiveness
provided by the DSM representation diminishes. It becomes increasingly
difficult to identify the relationships in a very large matrix so that the
method loses its advantage of simplicity.
DSMs with fewer than ten elements can often be analyzed via visual
inspection and manual manipulation. 50-100 element DSMs are legible on
a standard page. In order to decrease the complexity of larger DSMs and
to make them easier to review, one can aggregate some design
parameters under a generic name so that a series of DSMs with different
“resolutions” can be obtained. Of course, aggregation requires choices
about how to integrate elements to represent them as a single element
with minimal loss of information in the model (Browning, 2001).
In fact, the size of the DSM is dependent on the size of the design
problem. The experience of the author in building DSMs suggests that it is
advisable to define the problem in a manageable size for a parameter-
102
based DSM. Since such DSMs are low-level analysis tools that promote a
bottom-up approach, even a small design problem may consist of many
parameters. The previously produced parameter-based DSMs support this
view. The majority of them focuses on a specific design problem and
includes 40-100 parameters. These include Dong’s (1999) Vehicle Door
design and Throttle Body Design DSMs, Mascoli’s (1999) Aero Engine
Design DSM, and Black’s (1990) Brake System Design DSM, to name a
few.
Grose (qtd. in Sabbaghian and Eppinger, 1998) developed a method
called multi-tiered DSM to structure a large DSM into a hierarchy of smaller
DSMs. Grose developed this method for activity-based DSM modeling in
which initial highest level activities are further decomposed into a set of
sub-activities forming a series of level 2 DSMs. In this structure there are
three possible forms of information exchange:
1. Internal interaction: This refers to information being exchanged within a
single matrix represented by marked cells within each matrix.
2. External interaction: This consists of information being exchanged
between two or more matrices.
3. Boundary interaction: This is the information exchange occurring at the
boundaries of the model with entities outside the project such as
customers, suppliers, etc.

103
Although the method seems to be useful for activity-based DSMs, it can
not be used for parameter-based DSMs that already include the
undividable components of a process.
In this dissertation, it is proposed that parameter-based DSMs can be
produced at two levels as the following to manage the size and legibility of
the matrices.
1. Single subsystem (Assembly) level: The matrix contains the parameter
relationships in a single subsystem.
2. System interfaces to a subsystem: The matrix contains the parameter
relationships between different subsystems.
This grouping also enables the modeler to compare assembly and system
level DSMs and to comment on the design process.
5.3.5 Complementary Use of IDEF0 and DSM
The author’s interest in IDEF0 (U.S. NIST, 1993) models resulted from
practical concerns while developing DSMs for the case studies. Developing
a DSM may be a difficult task because as the number of elements
increase, the points of interactions increase geometrically. Therefore,
individuals may have difficulty in building DSMs with more than ten
elements (Browning, 2001). In that case, it is often useful to use another
complementary technique to ease the modeling process. Malmström et al.
(1999) mention the complementary roles of IDEF0 and DSM for the

104
modeling of information management processes and claim that useful
insights can be reached with additional work by using both techniques.
The IDEF0 technique is suitable for the purposes of this dissertation, since
in this method, a process is represented from the viewpoint of information
within it, rather than of its sub processes. Moreover, IDEF0 diagrams do
not describe how a task should be done; they only represent what is
necessary to perform that task and what is transformed into. Since it is a
top-down analysis tool, the top parts can be read to obtain an overview of
the system and if more detail is required, the lower levels can be studied.
Thus, having some IDEF0 models of the system before building low-level
parameter-based DSMs helps to monitor the consistency of the DSM and
to represent where parameters take place in a hierarchy of process
diagrams.
However, due to the graphical nature of the method, in IDEF0 models it is
difficult to decide, at a glance, where some of the data has originated. This
disadvantage is outweighed by using the two techniques together; since
DSM provides a compact and analytically advantageous format for
description.
105
5.3.6 Implications for Implementation Using Information
Technology
Considering the large number of parameters in building design, it is
envisaged that the method should be utilized along with a software tool.
This necessitates production of generic parameter-based models and is
important for enabling widespread application of the method. Internet-
based project management tools (sometimes called “project extranets”)
have been increasingly used in the last decade. The improvements in
bandwidth and network security have been the major drivers of this
development. Sharing information through project-specific secure Web
pages seems to be the focus of further developments in project
management field. Thus, it is proposed that parameter-based DSM can be
implemented as this type of software.
Figure 5.11 shows an implementation model for parameter-based DSM in
building design. In the model, parameter data is stored in an object-
oriented database. The data may be generic or project specific. At the start
of the project, the project manager (often the architect) copies the generic
model and then edits it through the user interface to make it appropriate for
the new project. This functionality is important for building design, because
unlike other products, buildings have a “one-of-a-kind” nature.

106
Figure 5.11: The Proposed Implementation Model
Each parameter object contains three attributes: owner of the parameter,
provider parameters (which parameters provide information to that
parameter), and recipient parameters (which parameters receive
information from that parameter). The DSM processing engine performs
analyses of partitioning, banding, and tearing and produces a DSM output.
A detailed usage scenario for the tool is presented below (Figure 5.12).
A project manager logs in to the project web page and chooses a design
task among a list of pre-defined tasks (for example, elevator design). A
generic DSM model is available in the program for each task. The project
manager imports the related generic model to the web page to create a
project-specific model. Using the modification procedures such as adding
and/or deleting parameters and their dependencies, the generic model is
adapted to the project. For this purpose, the project manager also assigns
Architect
Design Engineers
Use
r Int
erfa
ce
Parameters Database
DSM Processing Engine
Parameter Owner: …. Information from:
Parameter Owner: …. Information from:
Parameter Owner: …. Information from: ….. Information to: ……
DSM Output Partitioning Banding Tearing
107
roles to designers such as structural engineer, mechanical engineer etc. to
the design task. The model is checked out by these multiple designers;
however, each actor can only edit the section of the model to which their
responsibility has been assigned. When the modified dependencies relate
to parameters outside the users’ domain, the user at this stage have to
communicate to the project manager to make the proposed change. The
final matrix is optimized by the project manager via partitioning. Durations
may be added to the tasks and the optimum schedule of the process is
notified to all roles. If a change occurs while conducting the processes, the
model check out is repeated. At this stage, the DSM helps identify the
affected parameters and manage change in processes.
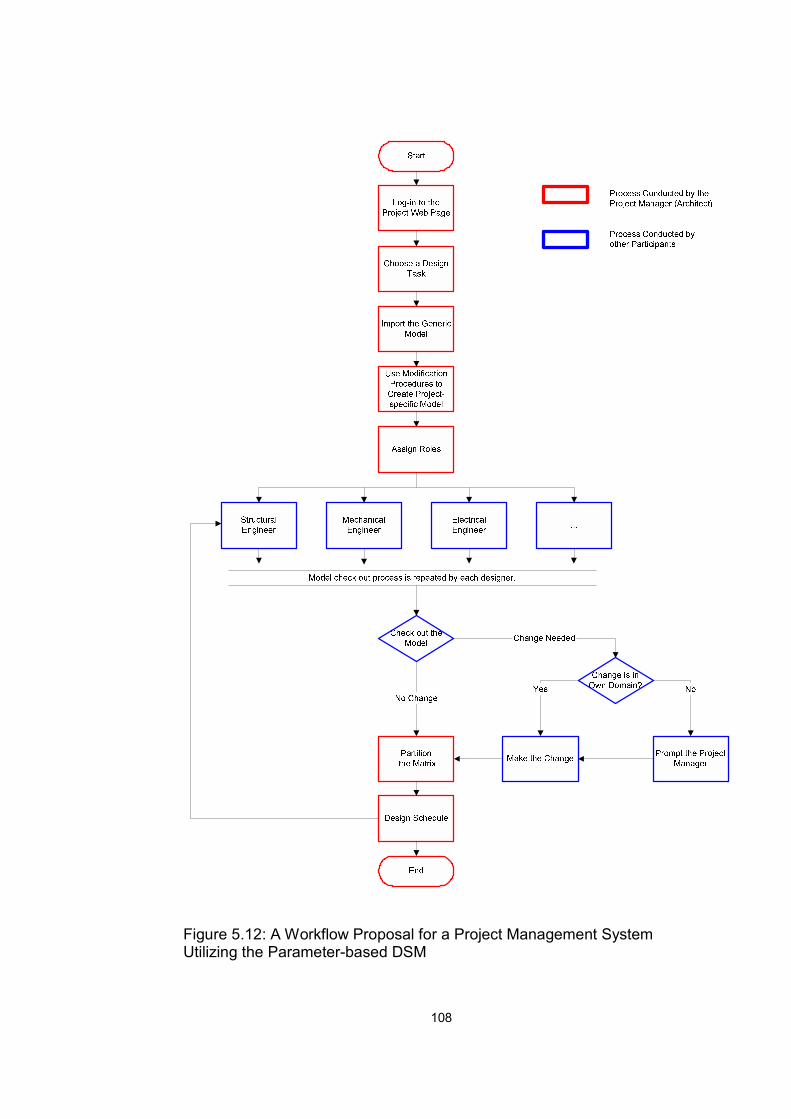
108
Figure 5.12: A Workflow Proposal for a Project Management System Utilizing the Parameter-based DSM
109
6. CASE STUDY 1: SUSPENDED CEILING
DESIGN
6.1 Introduction to the Case Studies
The research questions of this dissertation posed in Chapter 1 have been
the following:
1. What is the information dependency pattern for design processes of
architects and building design engineers?
2. Can the parameter-based design structure matrix method be utilized
to analyze these processes? If so, how?
In order to explore these questions, two case studies have been designed.
The main objective of these case studies is to apply the proposed method
to real life building design problems to represent information dependency
pattern of decisions. Aiming to be innovative in design process modeling,
the case studies tend to be exploratory and qualitative and they are
expected to guide future research.
The scope and content of the two case studies were designed to reflect
different aspects of the framework proposed in Chapter 5. The first case
study is based on an analysis of suspended ceiling design process for a
public building in Turkey. The DSM analysis for this case aims to capture
the information flows in a specific design configuration. The second case
110
study, which analyzes elevator design, however, does not focus on a
specific configuration. Both of these approaches have been validated in
previous DSM researches (Browning, 1998).
Besides the approach to the analysis, the characteristics of the designs are
also different in the two case studies. Suspended ceiling design is one of
the tasks of a whole building design process in which several subsystems
interact with each other. A suspended ceiling system includes a space
called plenum formed to conceal structural members, lighting fixtures,
diffusers, and air ducts. The integration of these components constitutes
the major problem in design. The situation is complicated by the fact that
the elements influencing suspended ceiling are in the domains of different
building professionals; structural members being designed by structural
engineers, diffusers and air ducts by mechanical engineers, and lighting
fixtures by electrical engineers. Therefore, the effective design of a
suspended ceiling necessitates coordination of these design participants.
Elevator design process involves the intense collaboration of the same
design professionals (architect, structural engineer, mechanical engineer,
and electrical engineer) as well. Compared to suspended ceiling design,
however, it is a more self-contained problem. Unlike a suspended ceiling
which is basically an interface problem, an elevator is a well-defined
complex system in itself. These different characteristics of two design
processes were reflected in the DSM analyses. In the first case study, the
111
DSMs were produced at two levels: assembly and system interface. The
assembly level DSM represents the information flows between the
parameters that belong to suspended ceiling parts. The system level DSM
shows the information flows between the suspended ceiling system and
other systems related to suspended ceiling. Due to the different character
of elevator design, this bi-partite approach was not taken in the second
case study. Moreover, in the suspended ceiling design case, performance
requirements were also included in the analysis in order to compare how
they drive design at the two levels of analysis (assembly and system
interface levels), which is not the case in the elevator study.
In each case study, a different parameter classification system was used.
In the suspended ceiling study, the parameters were classified according to
the physical system architecture which enabled mappings between
performance requirements and building parts. Similar mappings have been
previously made by Mascoli (1999) and Dong (1999). In the elevator
design study, however, parameters were categorized according to the
activities that produce them (parent activities). In this way, the DSMs were
used as process maps which showed detailed flows between the activities.
Rask and Sunnersjö (qtd. in Browning, 2001) have provided a simplistic
example for such a use of a parameter-based DSM.
Another aspect of difference between the case studies is the way
parameters were defined in each study. While in the elevator study

112
parameters were defined according to the IFCs, this was not possible for
the suspended ceiling study; since, IFC definitions currently do not include
necessary parameters for suspended ceiling integration. However, the
importance of coordination of interdisciplinary information in suspended
ceiling design has recently forced IAI to develop a ceiling plenum
coordination project. The project aims to develop a tool that can check for
conflicts in suspended ceiling design according to explicit rules. The
proposed project will develop such explicit rules and other requirements
that plenum coordination imposes on the IFC project model. In the project
description sheet, it is explained that the most difficult part of the project
will be the initial establishment of the rules, but rules developed in the
project will serve as basis for customization of future and more specific
project rules (IAI North America, 2003). It is hoped that the analyses made
in this dissertation may facilitate for such integration efforts.
Having highlighted the different aspects of the two case studies, the rest of
this chapter discusses the suspended ceiling design case study. Following
a description of the system architecture, the suspended ceiling design
process is briefly outlined. Finally, the research procedure and the results
are discussed.
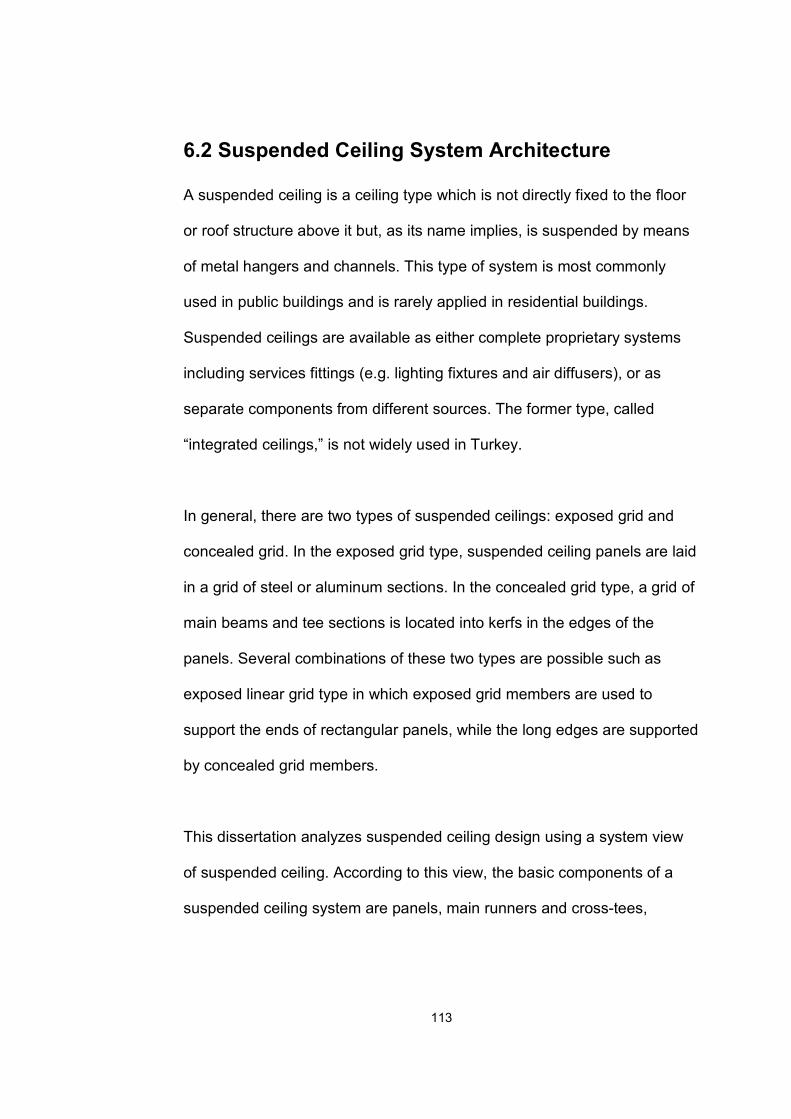
113
6.2 Suspended Ceiling System Architecture
A suspended ceiling is a ceiling type which is not directly fixed to the floor
or roof structure above it but, as its name implies, is suspended by means
of metal hangers and channels. This type of system is most commonly
used in public buildings and is rarely applied in residential buildings.
Suspended ceilings are available as either complete proprietary systems
including services fittings (e.g. lighting fixtures and air diffusers), or as
separate components from different sources. The former type, called
“integrated ceilings,” is not widely used in Turkey.
In general, there are two types of suspended ceilings: exposed grid and
concealed grid. In the exposed grid type, suspended ceiling panels are laid
in a grid of steel or aluminum sections. In the concealed grid type, a grid of
main beams and tee sections is located into kerfs in the edges of the
panels. Several combinations of these two types are possible such as
exposed linear grid type in which exposed grid members are used to
support the ends of rectangular panels, while the long edges are supported
by concealed grid members.
This dissertation analyzes suspended ceiling design using a system view
of suspended ceiling. According to this view, the basic components of a
suspended ceiling system are panels, main runners and cross-tees,
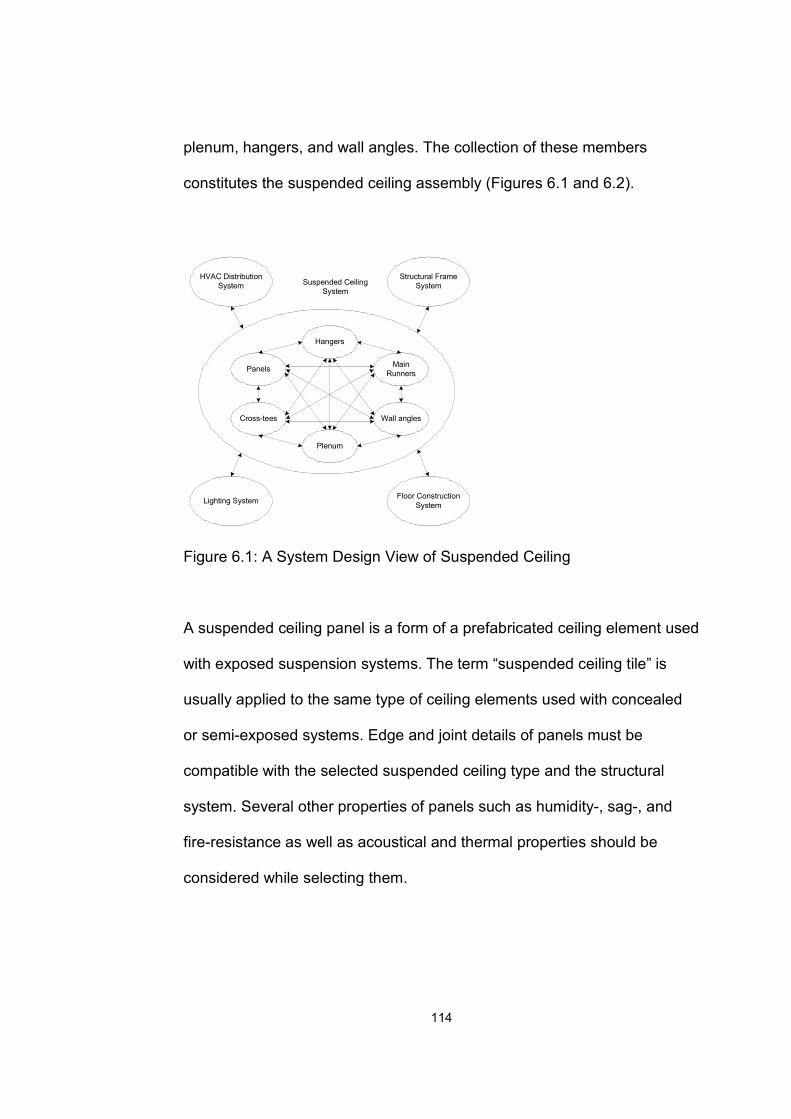
114
plenum, hangers, and wall angles. The collection of these members
constitutes the suspended ceiling assembly (Figures 6.1 and 6.2).
Figure 6.1: A System Design View of Suspended Ceiling
A suspended ceiling panel is a form of a prefabricated ceiling element used
with exposed suspension systems. The term “suspended ceiling tile” is
usually applied to the same type of ceiling elements used with concealed
or semi-exposed systems. Edge and joint details of panels must be
compatible with the selected suspended ceiling type and the structural
system. Several other properties of panels such as humidity-, sag-, and
fire-resistance as well as acoustical and thermal properties should be
considered while selecting them.
Hangers
Panels
Cross-tees Wall angles
MainRunners
Plenum
Structural FrameSystem
HVAC DistributionSystem
Floor ConstructionSystemLighting System
Suspended CeilingSystem

115
Figure 6.2: A Detail from a Suspended Ceiling System (Rush, 1986)
Main runners are the load-bearing parts of the suspended ceiling structural
grid which are suspended from floor or roof structure. Cross tees are run
between the main runners to provide additional support. Flat or T splines
may also be used along with main runners and cross tees. The dimensions
of these structural elements are critical for structural stability of the
suspended ceiling. For most suspended ceilings, there is an option for
supporting integrated fittings (lighting fixtures, air diffusers, etc.) via the

116
suspension system. Fittings supported in this way must be compatible with
the ceiling system in terms of size, weight, and edge details.
A suspended ceiling plenum is the space between the suspended ceiling
and roof or floor structure above. This space normally accommodates a
number of services such as HVAC equipment, lighting fixtures, sprinkler
systems, etc. The depth of plenum is a critical parameter to consider since
it determines the available space for included services and directly affects
floor-to-ceiling height.
Hangers are metal elements with adjustment clips which are used to
connect suspended ceiling structure to the building structure. The spacing
of hangers is critical for the structural stability of the system. Wall angles
are metal L sections which are used to connect panels to the surrounding
walls. Their design should be compatible with the rest of the suspension
system.
6.3 Suspended Ceiling Design Process
Insights into the suspended ceiling design process were gained through
the interviews conducted as a part of the case study. The process is
summarized below in order to provide a background for the detailed
models presented in the next section.

117
Suspended ceiling design process begins with a feasibility study, which
involves the client and the architect. If a suspended ceiling is required, the
next step is its design. Although suspended ceilings are constructed late in
construction phase, their designs should be undertaken in an early design
stage, since they affect several other building systems.
The earliest consideration in suspended ceiling design is plenum depth.
This decision necessitates information on required depths for HVAC and
lighting equipment; and structural members. Plenum depth should not only
be sufficient for services and equipment, but also allow enough extra
clearance for access panels to be lifted out. Structural element connection
details and HVAC and superstructure integration scheme are layout
considerations that affect plenum depth. There may be several options for
connecting structural members. For example, structural steel beams and
girders may be connected either by framing beams into girders or in a two-
layered system. The former scheme minimizes plenum depth and some
mechanical services can pass through the holes cut into the beam webs,
but large lines may have to be accumulated in the space below. The two-
layer system increases plenum depth considerably, but provides more
space for services. Similarly, HVAC and superstructure integration scheme
may adopt either a layered or a shared approach. The former requires
more plenum depth; however, it is more flexible. The latter may save
considerable space in the plenum, but it brings strict dimensional
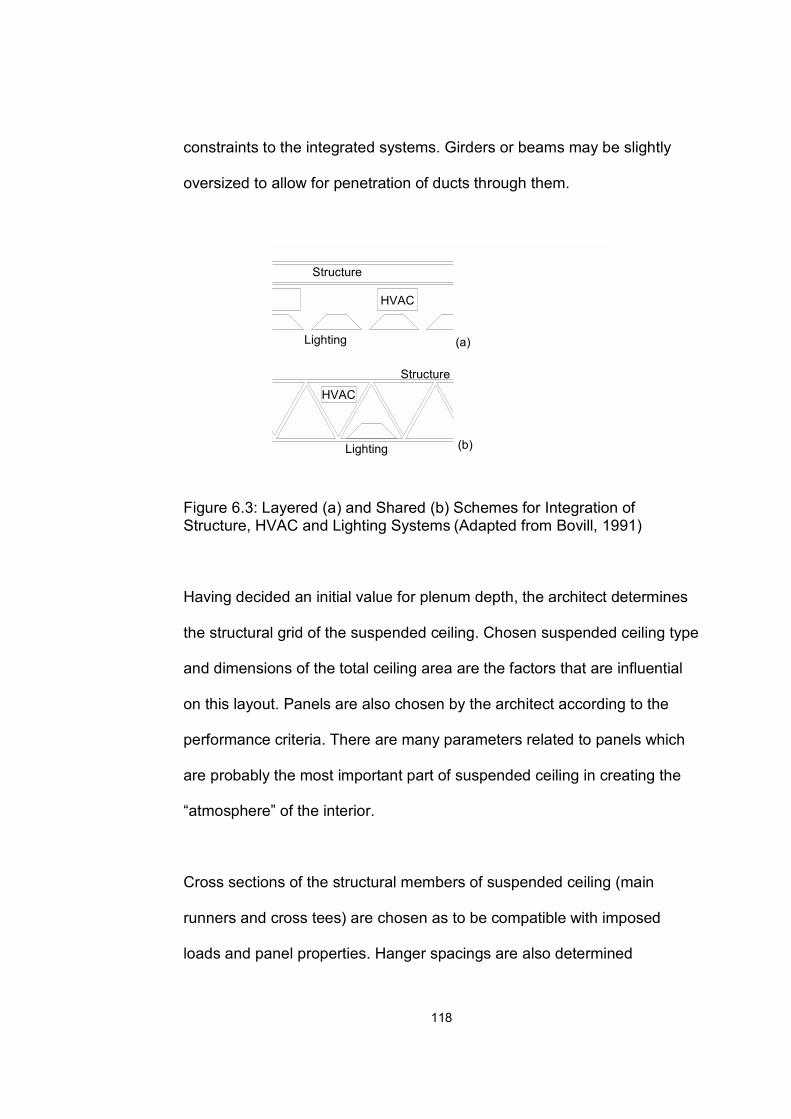
118
constraints to the integrated systems. Girders or beams may be slightly
oversized to allow for penetration of ducts through them.
HVAC
Lighting
Structure
Lighting
Structure
(b)
HVAC
(a)
Figure 6.3: Layered (a) and Shared (b) Schemes for Integration of Structure, HVAC and Lighting Systems (Adapted from Bovill, 1991)
Having decided an initial value for plenum depth, the architect determines
the structural grid of the suspended ceiling. Chosen suspended ceiling type
and dimensions of the total ceiling area are the factors that are influential
on this layout. Panels are also chosen by the architect according to the
performance criteria. There are many parameters related to panels which
are probably the most important part of suspended ceiling in creating the
“atmosphere” of the interior.
Cross sections of the structural members of suspended ceiling (main
runners and cross tees) are chosen as to be compatible with imposed
loads and panel properties. Hanger spacings are also determined
119
according to the loads imposed on the system. Obstructions to hanger
positions should be anticipated to enable solutions to be adopted. Services
in the plenum should be set out with sufficient accuracy to ensure that the
integrated fittings they serve will be correctly positioned relative to the
suspension grid and the panels.
Suspended ceiling manufacturers often provide several combinations of
suspended ceiling components and the architect chooses a specific
configuration which best satisfies the project’s needs. Thus, suspended
ceiling, at the assembly level, is often a “kit-of-the-parts” type design.
6.4 Analyzing Suspended Ceiling Design Process
with DSM
6.4.1 Research Setting
This research was carried out in the architectural design department of
TEPE Construction Company and in the offices of their engineering
collaborators. Tepe Group Companies began operations in Ankara in 1969,
and the companies are still fully owned by Bilkent Holding which belongs to
Bilkent University. Today the Tepe Group provides total services from
project development to turnkey project turnover. This approach is realized
by full integration of its various companies which deal with such areas as
infrastructure, construction, construction materials, doors, frames, kitchens
and furniture. The engineering collaborators are privately owned firms

120
leaded by a chief engineer. Design staff employed at these offices includes
approximately 4-5 people in each office (including the draftsmen). Thus,
the collaboration between TEPE and its engineering collaborators is an
example of a distributed collaboration of small design teams, which
constitutes the most widespread model in the Turkish AEC industry.
The suspended ceiling case study took five months between September
2002 and January 2003. The chief architect of the architectural design
department of TEPE, and three engineering collaborators (one structural
engineer, one mechanical engineer, and one electrical engineer), whose
names are mentioned in the “Acknowledgement” section, provided
supports and inputs for this research.
6.4.2 The Project
As mentioned in the beginning of this chapter, this research studies
suspended ceiling design process in a specific project. The analyzed
project is the Turkish customhouse complex situated at the Turkey – Iran
border, being built on the E-23 highway next to Gürbulak village in Ağrı.
The project was developed as a result of the government’s decision to
demolish the existing customs building which had failed to respond to the
emerging needs and to build a new, functional and prestigious
customhouse complex. The reason for choosing this project as the subject
of the case study was that this building had been the most recent design

121
project completed by TEPE Construction Co. when the study was being
undertaken. Thus, it was expected that tracking the information flows in the
process would be easier.
The complex consists of eight individual buildings; namely, customs
directorate and passengers’ hall, TIR customs office, customs inspection
hall, 2 social buildings, customs management hall, warehouse, entrance
and exit control units. The architectural and engineering systems of all the
buildings in the complex are similar to each other; therefore, the analysis of
a single building would be sufficient for the purposes of this dissertation.
The TIR customs office building is chosen as the focus of the research,
because the participants reported that this building truly reflects the whole
design process.
The TIR customs office building is a two-story building with a basement
floor. The building serves TIR drivers and contains two main functions. One
part of the ground floor is allocated to the customs offices such as
registration, entry-exit approvals, accountant’s office, management offices,
and computer hall. The other part of the ground floor is designed for
recreational facilities and it includes a waiting hall surrounded by duty free
shops and a restaurant. There are medical and management offices in the
first floor. The building has a structural steel frame system. The bi-partite
nature of the building is also reflected in the structural system so that there
is an expansion joint separating the building into two parts (Figure 6.4).

122
HO
L
KAFE
TER
YA
RE
STO
RAN
DU
TY F
REE
DU
TY F
REE
DU
TY F
REE
DU
TY F
REE
BAN
KAD
UTY
FR
EE
TEKE
L
DU
TY F
REE
MÜ
DÜ
RM
UD
UR
YRD
.G
IRIS
TESC
ILVE
ZNE
ÇIK
ISTE
SCIL
DO
LU-B
OS
BEY
AN
KAY
IT
SEK
RET
ER
BN.W
C
B.W
C
ÇA
Y O
FISI
UN
DM
ANIF
ESTO
TIR
AKT
AR.
ULA
STIR
MA
TRIP
TIK
VER
I GIR
IS-Ö
ZEL
BEYA
NBI
LGIS
AYA
R S
ALO
NU
MU
TFAK
120
P11
P11
±0.0
0
Z02
250
P11
120
250
250120
Z05
Z03
Z04
240
P715
0
120
P11
P11
250
120
250
P11 250
120
P11 250
120C
K6
P8P8
P8
18090
P8P8
P3
15090
P715
024
0
P715
024
0
RÜ
ZGAR
LIK
Z06
Z07
Z08
Z10
Z09
RÜ
ZGAR
LIK
Z28
HO
L
±0.0
0
Z02
Z12
HO
L
-4.5
0Z1
7
Z13
Z14
Z15
Z16
Z18
KOR
IDO
RZ1
9Z2
0
Z27
Z21
Z22
Z23
Z24
Z25
Z26
Z32
Z31
Z30
Z29
P11250
120
P11250
120
P11250
120
120
CK8
270
CK6
270360
RÜ
ZGAR
LIK
Z11
CK6
270360
RÜ
ZGAR
LIK
Z01
PTT
Z33
TEKE
L
18090
Z10
Z09
100
K422
0
100
K422
0
170
CK9
220
170
CK9
220
90K1
220
90K1
220
90K1
220
K190 22
0
90K1
220
90 K1
220
90 K1
220
90 K1
220
90 K1
220
90 K1
220
90 K1
220
90K1
22090 K1
220
80K2
220
90K1
220
90 220
80K2
220
CK1
034
038
5
CK1
434
026
5
CK1
434
026
5
90K1
220
90K1
220
1
2
3
4
5
6
7
8
9
10
11
13
12
17
16
14
15
18
19
20
21
22
23
24
25
26
1
2
3
4
5
6
7
8
9
10
11
13
12
17
16
14
15
18
19
20
21
P3
15090
P3
15090
P3
15090
P3
15090
P3
15090
P3
15090
P3
15090
P3
15090
P3
15090
P3
15090
P3
15090
P3
15090
P3
15090
P3
15090
P8P8
18090
18090
18090
P8P8
18090
18090
P8P8
CK6 360
270
P11
P11
250120
250120
360270
CK6
CK6360
270360270
CK6
270360
CK6
270360
18090
18090
18090
18090
P8
18090
P8
18090
P8
18090
P8
18090
P8
18090
P3
15090
80K2
220
Figure 6.4: Ground Floor Plan of Gürbulak Customs Building (Courtesy of TEPE Construction Co., 2002)

123
Having briefly explained the project, a few aspects of the overall design
process is discussed below. Following the RIBA’s The Architect’s Plan of
Work (Phillips, 2001) the design process of the building can be divided into
four phases.
Table 6.1: An Outline of the Design Process Design Phase
Produced Documents
Decisions
Outline proposals
Sketches Commence development of strategic brief into full project brief, decisions on the system selections, early schemes for space organization, cost estimations
Detailed proposals
1:200 plans, sections, and elevations
Complete development of the project brief, preparation of detailed space organization scheme
Final proposals
1:100 plans, sections, and elevations, 1:50 partial plans
Preparation of final proposals for the project sufficient for coordination of all components and elements of the project
Production information
1:20 Systems details Point details when necessary
Preparation of production information in sufficient detail to enable tenders to be obtained for the construction of the project
The whole design process took 2 months and the personnel who worked
on the project were the following;
Architectural design: 4 people
Structural design: 4 people
Mechanical design: 4 people
Electrical design: 3 people

124
Infrastructure design: 2 people
At the beginning of the case study, the building was analyzed as a whole
and the aim was to identify the problem areas in the building’s design in
terms of the collaboration of the participants. During the early interviews,
suspended ceiling design revealed itself as a specific design problem that
deserved further attention. The air ducts used in the HVAC system of the
building were sufficiently large to require strategic care in their placement.
The main supply and return ducts were run in the plenum above the main
corridors of the building because additional ceiling space was available and
the corridors provided a natural path of easy access to the all building
spaces but how the HVAC distribution system was integrated with the
structural system and hidden in the plenum constituted an important
building systems integration problem. Therefore, the author focused on
analyzing suspended ceiling design with parameter-based DSM.
6.4.3 Objectives of the Analysis
The objectives of the analyses were to:
1. Identify and document important relations specific to suspended ceiling
assembly and its interfaces including structural frame system, floor
system, HVAC system, and lighting system.
2. Study information flow and coupling in suspended ceiling design.
3. Identify critical parameters that cause large iteration cycles.

125
4. Identify assumptions made in the process.
5. Show knowledge ownership.
6. Define performance requirements for suspended ceiling design and
demonstrate how requirements drive design.
7. Compare assembly level DSM with system level DSM in terms of
dependency intensity, amount and scope of iterative loops and
percentage of information flow contents regarding performance
requirements.
6.4.4 The Procedure
The procedure that was followed in this part of dissertation research
consists of the following steps:
1. Choose a particular design problem; define the system and its
scope.
2. Interview designers to define the elements involved in the system
and the interactions between them.
3. Produce IDEF0 diagrams to outline the processes graphically.
4. Build an information database to record the interactions.
5. Show the information database to the designers and make revisions
if necessary.
6. Construct and analyze the matrix and comment on the design
process.
7. Evaluate the results.
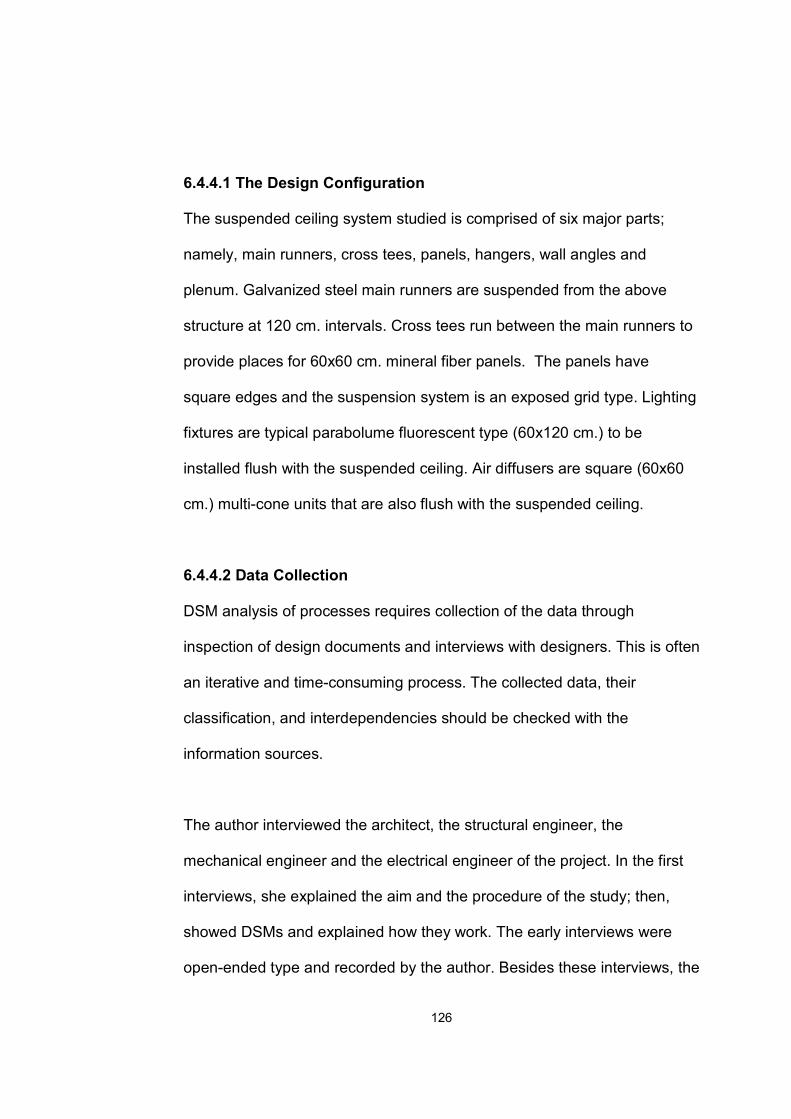
126
6.4.4.1 The Design Configuration
The suspended ceiling system studied is comprised of six major parts;
namely, main runners, cross tees, panels, hangers, wall angles and
plenum. Galvanized steel main runners are suspended from the above
structure at 120 cm. intervals. Cross tees run between the main runners to
provide places for 60x60 cm. mineral fiber panels. The panels have
square edges and the suspension system is an exposed grid type. Lighting
fixtures are typical parabolume fluorescent type (60x120 cm.) to be
installed flush with the suspended ceiling. Air diffusers are square (60x60
cm.) multi-cone units that are also flush with the suspended ceiling.
6.4.4.2 Data Collection
DSM analysis of processes requires collection of the data through
inspection of design documents and interviews with designers. This is often
an iterative and time-consuming process. The collected data, their
classification, and interdependencies should be checked with the
information sources.
The author interviewed the architect, the structural engineer, the
mechanical engineer and the electrical engineer of the project. In the first
interviews, she explained the aim and the procedure of the study; then,
showed DSMs and explained how they work. The early interviews were
open-ended type and recorded by the author. Besides these interviews, the

127
brief, the drawings, and the manufacturers’ information were examined.
The author identified the initial set of system elements based on initial
interviews and design documents. After the set of system elements were
defined, the first draft of the DSMs was built.
In the second phase of the data collection process, the author showed the
DSMs to the participants and received their comments. The initial DSMs
were modified according to the feedbacks from the designers. The data
collection process was difficult because of the following reasons:
1. Even experienced design professionals like the architect and the
engineers whom the author interviewed had not systematically
thought about all aspects of the design. The participants responded
to the interviews very positively, because these interviews made
them think from a systems point of view.
2. In the previous DSM examples from product and machinery design
field, the researchers had benefited significantly from the
documentation of the participating design organizations. In this
study, such documentation was very limited, if it existed at all. This
probably points out a difficulty of the building design industry in
terms of documenting and guiding processes.
Other observations made about the data collection process are as follows:
1. The data collection process for DSM building was iterative. Deeper
understanding of the system usually resulted in modification of the

128
parameter relationships. However, once an initial model was
produced, it constituted the base for further development.
2. The interviews were just as important as reading design documents,
because all the knowledge was not well captured by design
documents. A large amount of it existed in the designers’ heads.
Interviews seem to be a good means to extract this knowledge.
3. A confusion about the “really-followed” and “should-be followed”
processes occurred during the data collection. The respondents
sometimes tended to describe the process that they thought of as
an ideal one. In these cases, the author explained to the participants
that the aim of the study is to model the process as it occurred.
4. The author introduced both IDEF0 and DSM models to the
participants. The participants understood the IDEF0 notation easier
than that of DSM. This suggests that the DSM method may be
difficult to comprehend for the uninitiated.
6.4.4.3 The IDEF0 Models
Before building DSMs, the author produced IDEF0 models of the
suspended ceiling design process. While producing the diagrams, the
framework proposed in the U.S. NIST (National Institute of Standards)
IDEF0 Standard (U.S. NIST, 1993) was used. Microsoft Visio Professional
Edition was used as the graphical modeling tool. First, an A0 context
diagram was produced for suspended ceiling life cycle (Figures 6.5, 6.6
and 6.7), and then the model was detailed to reflect the design process

129
(Figure 6.8). Context diagrams of system interfaces were also constructed
(Figure 6.9). These documents guided the DSM building process in the
later phases

130
Figure 6.5: The Scope of the Suspended Ceiling Design Model
A22
A0
Out of Scope
A2A3 A4 A5 A6Design
Proposals A2Construction
A4
Suspended CeilingLife Cycle
A0
In Scope
Study FeasibilityA1
ProductionDrawings
A3
Maintenance andUse A5
Decide StructuralGrid Spacings
Decide PanelProperties
Decide Beam andT Profile Sections
Decide PlenumSize
Decide HangerCross-sections
Decide Wall AngleCross-sections
Select SuspendedCeiling Type
A21
A221 A222 A223 A224 A225 A226
DesignDevelopment
A22
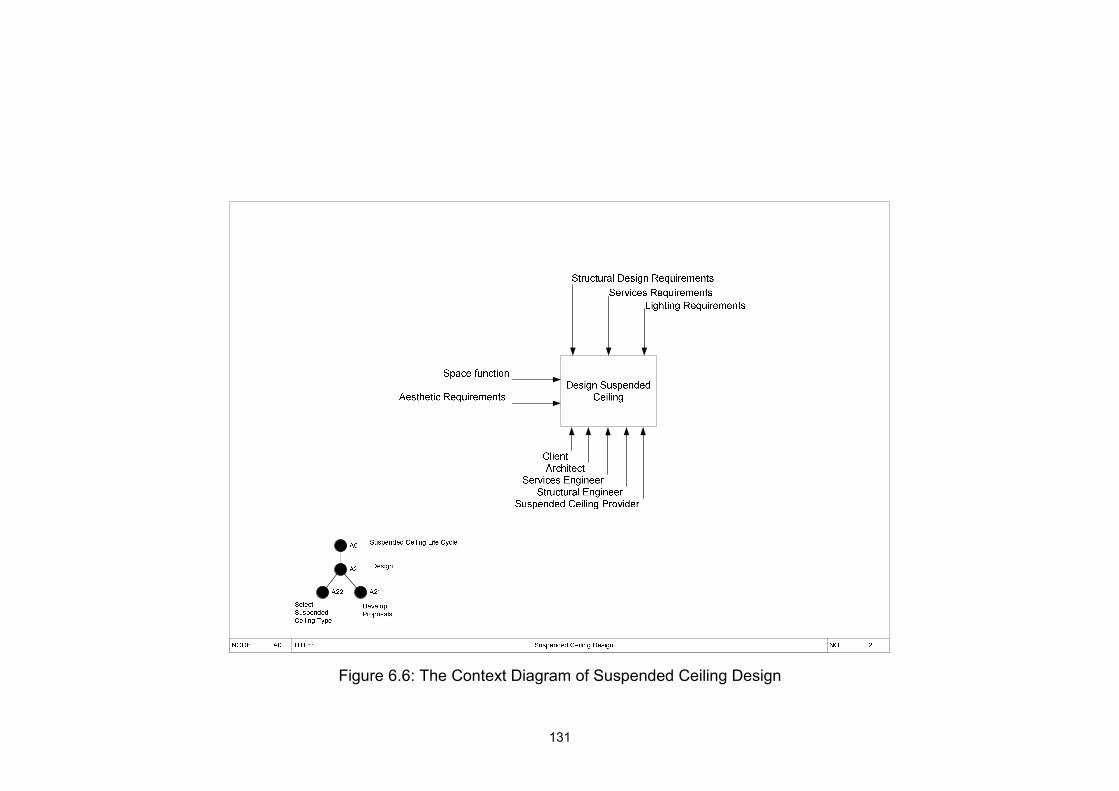
131
Figure 6.6: The Context Diagram of Suspended Ceiling Design
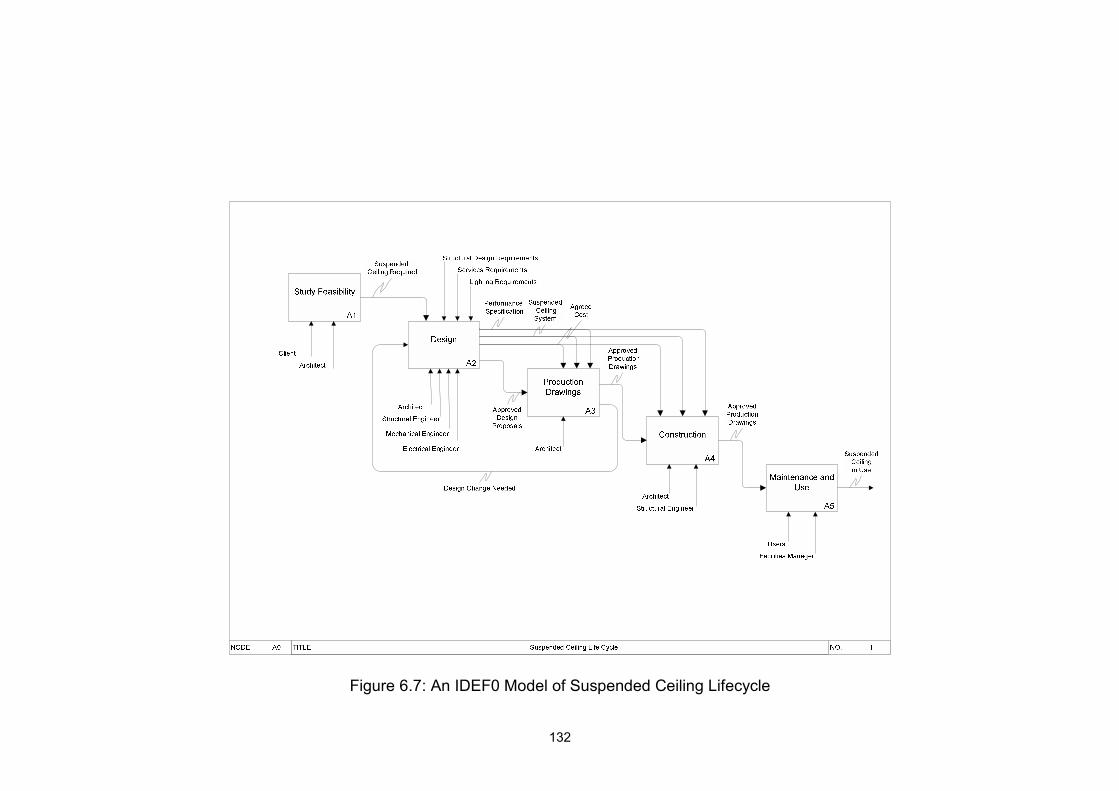
132
Figure 6.7: An IDEF0 Model of Suspended Ceiling Lifecycle

133
Figure 6.8: An IDEF0 Model of Suspended Ceiling Design
134
Figure 6.9: An IDEF0 Model of Suspended Ceiling System Interfaces
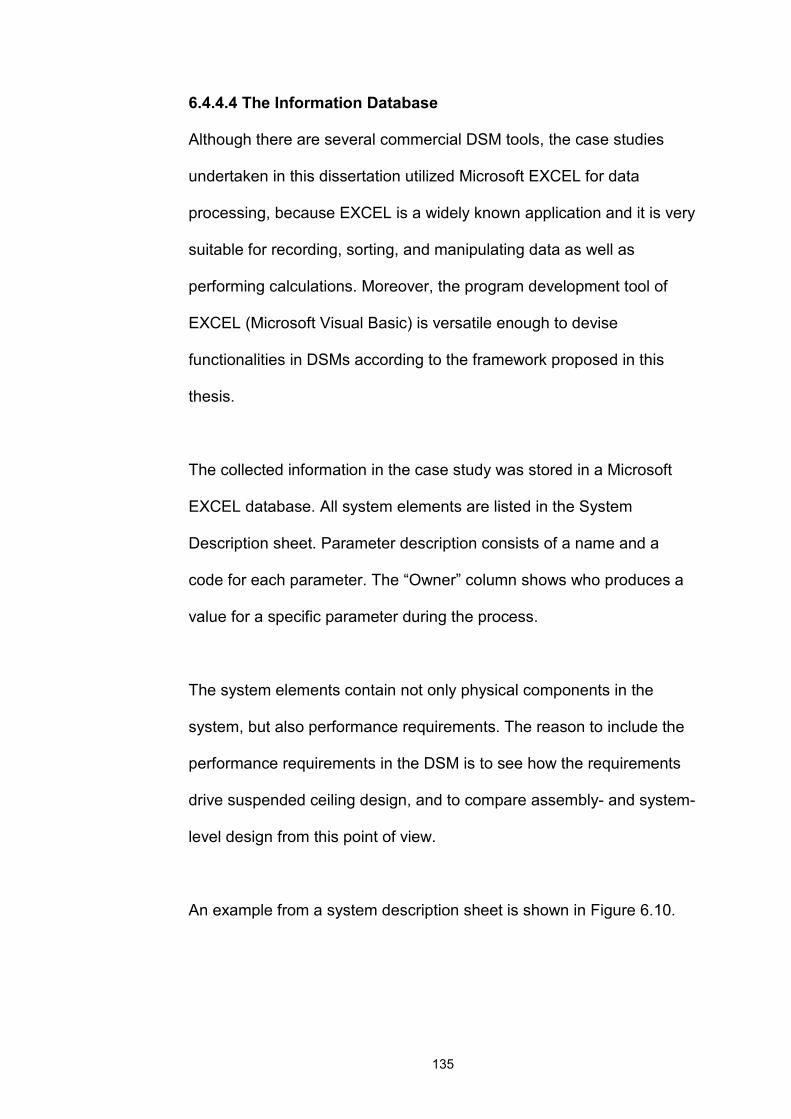
135
6.4.4.4 The Information Database
Although there are several commercial DSM tools, the case studies
undertaken in this dissertation utilized Microsoft EXCEL for data
processing, because EXCEL is a widely known application and it is very
suitable for recording, sorting, and manipulating data as well as
performing calculations. Moreover, the program development tool of
EXCEL (Microsoft Visual Basic) is versatile enough to devise
functionalities in DSMs according to the framework proposed in this
thesis.
The collected information in the case study was stored in a Microsoft
EXCEL database. All system elements are listed in the System
Description sheet. Parameter description consists of a name and a
code for each parameter. The “Owner” column shows who produces a
value for a specific parameter during the process.
The system elements contain not only physical components in the
system, but also performance requirements. The reason to include the
performance requirements in the DSM is to see how the requirements
drive suspended ceiling design, and to compare assembly- and system-
level design from this point of view.
An example from a system description sheet is shown in Figure 6.10.

136
Figure 6.10: An Example System Description Sheet
In the parameter relations sheet (Figure 6.11), the system element that
provides information is listed in the “From” column. The system element
that receives information is listed in the “To” column. The “Content of
Information Flow” column records the reason of information exchange in
terms of performance requirements i.e. shows performance
requirements that are satisfied by a specific flow of information between
two parameters.
Figure 6.11: An Example Parameter Relations Sheet
Detailed descriptions of the suspended ceiling parameters can be
examined in Appendix B.1.

137
6.4.4.5 Production of the Matrix and Analyses
Using a Microsoft EXCEL Visual Basic program developed by Qi Dong
(1999) and modified by Sait Emre Pektaş, DSMs were produced
automatically according to the recorded data. The produced DSMs are
of basic binary type in which a number (1) shows the existence of an
information flow. It may be thought that numerical DSMs described in
Chapter 3 would include more in-depth information. However, Browning
(1998) explains that numerical DSMs should be based on initially
developed basic DSMs and that attempts toward developing numerical
DSMs in the absence of any base binary DSM often result in superficial
outputs. Thus, it was expected that binary DSMs would be more
appropriate in this dissertation, since there was no available base DSM
that could be used.
Two DSMs were produced for suspended ceiling design. The system
level DSM (Figure 6.12) shows the information flows between the
suspended ceiling system and four other systems (HVAC distribution
system, structural frame system, lighting system, and floor construction
system). The assembly level DSM (Figure 6.13) shows the information
flows between the parameters that belong to suspended ceiling parts
(main runners and cross tees, panels, plenum, hangers, and wall
angles). Partitioning (Figures 6.14 and 6.15) and banding (Figures 6.16
and 6.17) were made to identify couplings and independent
(concurrent) parameter decisions in the process. The results of the
analyses are presented below.

Ther
mal
Per
form
ance
Ligh
ting
Perfo
rman
ce
Stru
ctur
al S
afet
y
Aest
hetic
s/Ap
pear
ance
Ope
ratio
nal/M
aint
enan
ce P
erfo
rman
ce
Spat
ial F
it
Priv
acy
Serv
ices
Equ
ipm
ent M
aint
enan
ce R
eq.
Spac
e Fu
nctio
n
Floo
r Are
a
Build
ing
Stru
ctur
e La
yout
Beam
Dep
th
Floo
r Stru
ctur
e
Susp
ende
d C
eilin
g Ty
pe
HVA
C D
istri
butio
n La
yout
Air D
iffus
er Q
uant
ity
Air D
uct W
idth
and
Len
gth
Req
uire
d D
epth
for H
VAC
Equ
ipm
ent
Req
uire
d D
epth
for L
ight
ing
Equi
pmen
t
Stru
ctur
al E
lem
ent C
onne
ctio
n D
etai
ls
HVA
C E
quip
men
t and
Sup
erst
ruct
ure
Inte
grat
ion
Sche
me
Plen
um D
epth
Floo
r to
Cei
ling
Hei
ght
Susp
ende
d C
eilin
g St
ruct
ural
Grid
Lay
out
Pane
l Wid
th a
nd L
engt
h
Pane
l Edg
e an
d Jo
int D
etai
l
Pane
l Wei
ght
Ligh
ting
Fixt
ure
Qua
ntity
Ligh
ting
Fixt
ure
Wid
th a
nd L
engt
h
Ligh
ting
Fixt
ure
Layo
ut
Ligh
ting
Fixt
ure
Wei
ght
Air D
iffus
er L
ayou
t
Air D
iffus
er W
idth
and
Len
gth
Air D
iffus
er W
eigh
t
Load
Tes
t Dat
a
Mai
n R
unne
r and
Cro
ss T
ee W
eb H
eigh
t
Mai
n R
unne
r and
Cro
ss T
ee F
ace
Dim
ensi
on
Max
imum
Lig
htin
g Fi
xtur
e W
eigh
t
Max
imum
Air
Diff
user
Wei
ght
Mai
n R
unne
r and
Cro
ss T
ee W
eigh
t
Susp
ende
d C
eilin
g St
ruct
ure-
Ligh
ting
Fixt
ure
Con
nect
ion
Det
ai
Susp
ende
d C
eilin
g St
ruct
ure-
Air D
iffus
er C
onne
ctio
n D
etai
l
Han
ger S
paci
ngs
1 2 3 4 5 6 7 8 9 10 11 12 13 14 15 16 17 18 19 20 21 22 23 24 25 26 27 28 29 30 31 32 33 34 35 36 37 38 39 40 41 42 43Thermal Performance 1 1Lighting Performance 2 2Structural Safety 3 3Aesthetics/Appearance 4 4Operational/Maintenance Performance 5 5Spatial Fit 6 6Privacy 7 7Services Equipment Maintenance Req. 8 1 8 1Space Function 9 1 1 1 1 1 9Floor Area 10 1 1 10 1Building Structure Layout 11 1 1 1 11Beam Depth 12 1 1 12 1 1Floor Structure 13 1 1 1 13 1 1 1 1Suspended Ceiling Type 14 1 1 1 1 1 1 14 1HVAC Distribution Layout 15 1 1 1 1 1 15 1 1 1 1Air Diffuser Quantity 16 1 1 1 16 1Air Duct Width and Length 17 1 1 1 1 17Required Depth for HVAC Equipment 18 1 1 1 18Required Depth for Lighting Equipment 19 1 19 1Structural Element Connection Details 20 1 1 20 1HVAC Equipment and Superstructure Integration Scheme 21 1 1 1 1 1 1 21 1Plenum Depth 22 1 1 1 1 1 1 1 22Floor to Ceiling Height 23 1 1 1 1 1 1 1 1 1 23Suspended Ceiling Structural Grid Layout 24 1 1 1 1 24Panel Width and Length 25 1 1 25Panel Edge and Joint Detail 26 1 1 1 1 26Panel Weight 27 1 1 27Lighting Fixture Quantity 28 1 1 1 1 28Lighting Fixture Width and Length 29 1 1 29Lighting Fixture Layout 30 1 1 1 1 1 1 1 30 1Lighting Fixture Weight 31 1 31 1Air Diffuser Layout 32 1 1 1 1 32Air Diffuser Width and Length 33 1 1 1 33Air Diffuser Weight 34 1 34 1Load Test Data 35 1 1 1 1 35Main Runner and Cross Tee Web Height 36 1 1 1 1 1 1 1 1 36Main Runner and Cross Tee Face Dimension 37 1 1 1 1 1 1 1 1 37Maximum Lighting Fixture Weight 38 1 1 1 1 1 38 1Maximum Air Diffuser Weight 39 1 1 1 1 1 39 1Main Runner and Cross Tee Weight 40 1 1 1 1 40Suspended Ceiling Structure-Lighting Fixture Connection Detail 41 1 1 1 1 41Suspended Ceiling Structure-Air Diffuser Connection Detail 42 1 1 1 1 42Hanger Spacings 43 1 1 1 1 1 43
Performance RequirementsSystem Level ParametersHVAC Distribution SystemStructural Frame SystemLighting SystemFloor Construction SystemSuspended Ceiling System
Figure 6.12: Initial Parameter-based DSM of Suspended Ceiling Design at System Level

Ther
mal
Per
form
ance
Acou
stic
al P
erfo
rman
ce
Ligh
ting
Perfo
rman
ce
Stru
ctur
al S
afet
y
Fire
Saf
ety
Hyg
iene
Aest
hetic
s/Ap
pear
ance
Ope
ratio
nal/M
aint
enan
ce P
erfo
rman
ce
Dur
abilit
y
Spat
ial F
it
Susp
ende
d C
eilin
g Ty
pe
Plen
um D
epth
Susp
ende
d C
eilin
g St
ruct
ural
Grid
Lay
out
Pane
l Hum
idity
Res
ista
nce
Pane
l Sag
Res
ista
nce
Pane
l Ant
imic
robi
al T
reat
men
t
Pane
l Aco
ustic
s N
RC
Pane
l Aco
ustic
s C
AC
Pane
l The
rmal
Insu
latio
n Va
lue
Pane
l Fire
Res
ista
nce
Pane
l Mat
eria
l
Pane
l Wid
th a
nd L
engt
h
Pane
l Edg
e an
d Jo
int D
etai
l
Pane
l Sur
face
Ref
lect
ance
Req
uire
men
t
Pane
l Sur
face
Pat
tern
Pane
l Thi
ckne
ss
Pane
l Wei
ght
Pane
l Col
or
Mai
n R
unne
r and
Cro
ss T
ee C
olor
Mai
n R
unne
r and
Cro
ss T
ee S
truct
ural
Cla
ssifi
catio
n
Load
Tes
t Dat
a
Mai
n R
unne
r and
Cro
ss T
ee W
eb H
eigh
t
Mai
n R
unne
r and
Cro
ss T
ee F
ace
Dim
ensi
on
Mai
n R
unne
r and
Cro
ss T
ee W
eigh
t
Mai
n R
unne
r and
Cro
ss T
ee S
urfa
ce F
inis
h
Mai
n R
unne
r and
Cro
ss T
ee P
rofil
e Le
ngth
Mai
n R
unne
r and
Cro
ss T
ee In
terfa
ce
Mai
n R
unne
r and
Cro
ss T
ee E
nd D
etai
l
Han
ger C
ross
sect
ions
Han
ger S
paci
ngs
Wal
l Ang
le C
ross
sect
ions
1 2 3 4 5 6 7 8 9 10 11 12 13 14 15 16 17 18 19 20 21 22 23 24 25 26 27 28 29 30 31 32 33 34 35 36 37 38 39 40 41Thermal Performance 1 1Acoustical Performance 2 2Lighting Performance 3 3Structural Safety 4 4Fire Safety 5 5Hygiene 6 6Aesthetics/Appearance 7 7Operational/Maintenance Performance 8 8Durability 9 9Spatial Fit 10 10Suspended Ceiling Type 11 1 1 1 11Plenum Depth 12 1 1 1 12Suspended Ceiling Structural Grid Layout 13 1 1 1 1 13Panel Humidity Resistance 14 1 14Panel Sag Resistance 15 1 15Panel Antimicrobial Treatment 16 1 16Panel Acoustics NRC 17 1 17Panel Acoustics CAC 18 1 18Panel Thermal Insulation Value 19 1 19Panel Fire Resistance 20 1 20Panel Material 21 1 1 1 1 1 1 1 1 1 1 1 1 1 1 1 21Panel Width and Length 22 1 1 22Panel Edge and Joint Detail 23 1 1 1 1 23Panel Surface Reflectance 24 1 24Panel Surface Pattern 25 1 1 25Panel Thickness 26 1 1 1 26Panel Weight 27 1 1 1 1 27Panel Color 28 1 1 28 1Main Runner and Cross Tee Color 29 1 1 1 29Main Runner and Cross Tee Structural Classification 30 1 30Load Test Data 31 1 1 1 31Main Runner and Cross Tee Web Height 32 1 1 1 1 1 1 32Main Runner and Cross Tee Face Dimension 33 1 1 1 1 1 1 1 33Main Runner and Cross Tee Weight 34 1 1 1 1 34Main Runner and Cross Tee Surface Finish 35 1 1 1 35Main Runner and Cross Tee Profile Length 36 1 36Main Runner and Cross Tee Interface 37 1 1 1 37Main Runner and Cross Tee End Detail 38 1 1 38 1Hanger Crosssections 39 1 1 1 39Hanger Spacings 40 1 1 1 40Wall Angle Crosssections 41 1 1 1 1 1 1 41
Performance RequirementsSystem Level ParametersPlenumPanelsMain Runners and Cross Tees
Hangers
Wall Angles
Figure 6.13: Initial Parameter-based DSM of Suspended Ceiling Design at Assembly Level

Ther
mal
Per
form
ance
Ligh
ting
Perfo
rman
ce
Stru
ctur
al S
afet
y
Aest
hetic
s/Ap
pear
ance
Ope
ratio
nal/M
aint
enan
ce P
erfo
rman
ce
Spat
ial F
it
Priv
acy
Spac
e Fu
nctio
n
Serv
ices
Equ
ipm
ent M
aint
enan
ce R
eq.
Floo
r Are
a
Build
ing
Stru
ctur
e La
yout
Beam
Dep
th
Susp
ende
d C
eilin
g Ty
pe
HVA
C D
istri
butio
n La
yout
Air D
iffus
er Q
uant
ity
Air D
uct W
idth
and
Len
gth
Req
uire
d D
epth
for H
VAC
Equ
ipm
ent
Req
uire
d D
epth
for L
ight
ing
Equi
pmen
t
Stru
ctur
al E
lem
ent C
onne
ctio
n D
etai
ls
HVA
C E
quip
men
t and
Sup
erst
ruct
ure
Inte
grat
ion
Sche
me
Plen
um D
epth
Floo
r to
Cei
ling
Hei
ght
Susp
ende
d C
eilin
g St
ruct
ural
Grid
Lay
out
Pane
l Wid
th a
nd L
engt
h
Ligh
ting
Fixt
ure
Qua
ntity
Ligh
ting
Fixt
ure
Wid
th a
nd L
engt
h
Ligh
ting
Fixt
ure
Layo
ut
Air D
iffus
er L
ayou
t
Pane
l Edg
e an
d Jo
int D
etai
l
Pane
l Wei
ght
Air D
iffus
er W
idth
and
Len
gth
Ligh
ting
Fixt
ure
Wei
ght
Air D
iffus
er W
eigh
t
Load
Tes
t Dat
a
Mai
n R
unne
r and
Cro
ss T
ee W
eb H
eigh
t
Mai
n R
unne
r and
Cro
ss T
ee F
ace
Dim
ensi
on
Max
imum
Lig
htin
g Fi
xtur
e W
eigh
t
Max
imum
Air
Diff
user
Wei
ght
Han
ger S
paci
ngs
Mai
n R
unne
r and
Cro
ss T
ee W
eigh
t
Susp
ende
d C
eilin
g St
ruct
ure-
Ligh
ting
Fixt
ure
Con
nect
ion
Det
ai
Susp
ende
d C
eilin
g St
ruct
ure-
Air D
iffus
er C
onne
ctio
n D
etai
l
Floo
r Stru
ctur
e
1 2 3 4 5 6 7 9 8 10 11 12 14 15 16 17 18 19 20 21 22 23 24 25 28 29 30 32 26 27 33 31 34 35 36 37 38 39 43 40 41 42 13Thermal Performance 1 1Lighting Performance 2 2Structural Safety 3 3Aesthetics/Appearance 4 4Operational/Maintenance Performance 5 5Spatial Fit 6 6Privacy 7 7Space Function 9 1 1 1 1 1 9Services Equipment Maintenance Req. 8 1 1 8Floor Area 10 1 1 10 1Building Structure Layout 11 1 1 1 11Beam Depth 12 1 1 12 1 1Suspended Ceiling Type 14 1 1 1 1 1 1 14 1HVAC Distribution Layout 15 1 1 1 1 1 15 1 1 1 1Air Diffuser Quantity 16 1 1 1 16 1Air Duct Width and Length 17 1 1 1 1 17Required Depth for HVAC Equipment 18 1 1 1 18Required Depth for Lighting Equipment 19 1 19 1Structural Element Connection Details 20 1 1 20 1HVAC Equipment and Superstructure Integration Scheme 21 1 1 1 1 1 1 21 1Plenum Depth 22 1 1 1 1 1 1 1 22Floor to Ceiling Height 23 1 1 1 1 1 1 1 1 1 23Suspended Ceiling Structural Grid Layout 24 1 1 1 1 24Panel Width and Length 25 1 1 25Lighting Fixture Quantity 28 1 1 1 1 28Lighting Fixture Width and Length 29 1 1 29Lighting Fixture Layout 30 1 1 1 1 1 1 1 30 1Air Diffuser Layout 32 1 1 1 1 32Panel Edge and Joint Detail 26 1 1 1 1 26Panel Weight 27 1 1 27Air Diffuser Width and Length 33 1 1 1 33Lighting Fixture Weight 31 1 31 1Air Diffuser Weight 34 1 34 1Load Test Data 35 1 1 1 1 35Main Runner and Cross Tee Web Height 36 1 1 1 1 1 1 1 1 36Main Runner and Cross Tee Face Dimension 37 1 1 1 1 1 1 1 1 37Maximum Lighting Fixture Weight 38 1 1 1 1 1 38 1Maximum Air Diffuser Weight 39 1 1 1 1 1 39 1Hanger Spacings 43 1 1 1 1 1 43Main Runner and Cross Tee Weight 40 1 1 1 1 40Suspended Ceiling Structure-Lighting Fixture Connection Detail 41 1 1 1 1 41Suspended Ceiling Structure-Air Diffuser Connection Detail 42 1 1 1 1 42Floor Structure 13 1 1 1 1 1 1 1 13
Performance RequirementsSystem Level ParametersHVAC Distribution SystemStructural Frame SystemLighting SystemFloor Construction SystemSuspended Ceiling System
Figure 6.14: Partitioned Parameter-based DSM of Suspended Ceiling Design at System Level

Ther
mal
Per
form
ance
Acou
stic
al P
erfo
rman
ce
Ligh
ting
Perfo
rman
ce
Stru
ctur
al S
afet
y
Fire
Saf
ety
Hyg
iene
Aest
hetic
s/Ap
pear
ance
Ope
ratio
nal/M
aint
enan
ce P
erfo
rman
ce
Dur
abilit
y
Spat
ial F
it
Susp
ende
d C
eilin
g Ty
pe
Plen
um D
epth
Susp
ende
d C
eilin
g St
ruct
ural
Grid
Lay
out
Pane
l Hum
idity
Res
ista
nce
Pane
l Sag
Res
ista
nce
Pane
l Ant
imic
robi
al T
reat
men
t
Pane
l Aco
ustic
s N
RC
Pane
l Aco
ustic
s C
AC
Pane
l The
rmal
Insu
latio
n Va
lue
Pane
l Fire
Res
ista
nce
Pane
l Mat
eria
l
Pane
l Wid
th a
nd L
engt
h
Pane
l Edg
e an
d Jo
int D
etai
l
Pane
l Sur
face
Ref
lect
ance
Req
uire
men
t
Pane
l Sur
face
Pat
tern
Pane
l Thi
ckne
ss
Pane
l Wei
ght
Pane
l Col
or
Mai
n R
unne
r and
Cro
ss T
ee C
olor
Mai
n R
unne
r and
Cro
ss T
ee S
truct
ural
Cla
ssifi
catio
n
Load
Tes
t Dat
a
Mai
n R
unne
r and
Cro
ss T
ee W
eb H
eigh
t
Mai
n R
unne
r and
Cro
ss T
ee F
ace
Dim
ensi
on
Mai
n R
unne
r and
Cro
ss T
ee W
eigh
t
Mai
n R
unne
r and
Cro
ss T
ee S
urfa
ce F
inis
h
Mai
n R
unne
r and
Cro
ss T
ee P
rofil
e Le
ngth
Mai
n R
unne
r and
Cro
ss T
ee In
terfa
ce
Mai
n R
unne
r and
Cro
ss T
ee E
nd D
etai
l
Han
ger C
ross
sect
ions
Han
ger S
paci
ngs
Wal
l Ang
le C
ross
sect
ions
1 2 3 4 5 6 7 8 9 10 11 12 13 14 15 16 17 18 19 20 21 22 23 24 25 26 27 28 29 30 31 32 33 34 35 36 37 38 39 40 41Thermal Performance 1 1Acoustical Performance 2 2Lighting Performance 3 3Structural Safety 4 4Fire Safety 5 5Hygiene 6 6Aesthetics/Appearance 7 7Operational/Maintenance Performance 8 8Durability 9 9Spatial Fit 10 10Suspended Ceiling Type 11 1 1 1 11Plenum Depth 12 1 1 1 12Suspended Ceiling Structural Grid Layout 13 1 1 1 1 13Panel Humidity Resistance 14 1 14Panel Sag Resistance 15 1 15Panel Antimicrobial Treatment 16 1 16Panel Acoustics NRC 17 1 17Panel Acoustics CAC 18 1 18Panel Thermal Insulation Value 19 1 19Panel Fire Resistance 20 1 20Panel Material 21 1 1 1 1 1 1 1 1 1 1 1 1 1 1 1 21Panel Width and Length 22 1 1 22Panel Edge and Joint Detail 23 1 1 1 1 23Panel Surface Reflectance 24 1 24Panel Surface Pattern 25 1 1 25Panel Thickness 26 1 1 1 26Panel Weight 27 1 1 1 1 27Panel Color 28 1 1 28 1Main Runner and Cross Tee Color 29 1 1 1 29Main Runner and Cross Tee Structural Classification 30 1 30Load Test Data 31 1 1 1 31Main Runner and Cross Tee Web Height 32 1 1 1 1 1 1 32Main Runner and Cross Tee Face Dimension 33 1 1 1 1 1 1 1 33Main Runner and Cross Tee Weight 34 1 1 1 1 34Main Runner and Cross Tee Surface Finish 35 1 1 1 35Main Runner and Cross Tee Profile Length 36 1 36Main Runner and Cross Tee Interface 37 1 1 1 37Main Runner and Cross Tee End Detail 38 1 1 38 1Hanger Crosssections 39 1 1 1 39Hanger Spacings 40 1 1 1 40Wall Angle Crosssections 41 1 1 1 1 1 1 41
Performance RequirementsSystem Level ParametersPlenumPanelsMain Runners and Cross Tees
Hangers
Wall Angles
Figure 6.15: Partitioned Parameter-based DSM of Suspended Ceiling Design at Assembly Level

Ther
mal
Per
form
ance
Ligh
ting
Perfo
rman
ce
Stru
ctur
al S
afet
y
Aest
hetic
s/Ap
pear
ance
Ope
ratio
nal/M
aint
enan
ce P
erfo
rman
ce
Spat
ial F
it
Priv
acy
Spac
e Fu
nctio
n
Serv
ices
Equ
ipm
ent M
aint
enan
ce R
eq.
Floo
r Are
a
Build
ing
Stru
ctur
e La
yout
Beam
Dep
th
Susp
ende
d C
eilin
g Ty
pe
HVA
C D
istri
butio
n La
yout
Air D
iffus
er Q
uant
ity
Air D
uct W
idth
and
Len
gth
Req
uire
d D
epth
for H
VAC
Equ
ipm
ent
Req
uire
d D
epth
for L
ight
ing
Equi
pmen
t
Stru
ctur
al E
lem
ent C
onne
ctio
n D
etai
ls
HVA
C E
quip
men
t and
Sup
erst
ruct
ure
Inte
grat
ion
Sche
me
Plen
um D
epth
Floo
r to
Cei
ling
Hei
ght
Susp
ende
d C
eilin
g St
ruct
ural
Grid
Lay
out
Pane
l Wid
th a
nd L
engt
h
Ligh
ting
Fixt
ure
Qua
ntity
Ligh
ting
Fixt
ure
Wid
th a
nd L
engt
h
Ligh
ting
Fixt
ure
Layo
ut
Air D
iffus
er L
ayou
t
Pane
l Edg
e an
d Jo
int D
etai
l
Pane
l Wei
ght
Air D
iffus
er W
idth
and
Len
gth
Ligh
ting
Fixt
ure
Wei
ght
Air D
iffus
er W
eigh
t
Load
Tes
t Dat
a
Mai
n R
unne
r and
Cro
ss T
ee W
eb H
eigh
t
Mai
n R
unne
r and
Cro
ss T
ee F
ace
Dim
ensi
on
Max
imum
Lig
htin
g Fi
xtur
e W
eigh
t
Max
imum
Air
Diff
user
Wei
ght
Han
ger S
paci
ngs
Mai
n R
unne
r and
Cro
ss T
ee W
eigh
t
Susp
ende
d C
eilin
g St
ruct
ure-
Ligh
ting
Fixt
ure
Con
nect
ion
Det
ai
Susp
ende
d C
eilin
g St
ruct
ure-
Air D
iffus
er C
onne
ctio
n D
etai
l
Floo
r Stru
ctur
e
1 2 3 4 5 6 7 9 8 10 11 12 14 15 16 17 18 19 20 21 22 23 24 25 28 29 30 32 26 27 33 31 34 35 36 37 38 39 43 40 41 42 13Thermal Performance 1 1Lighting Performance 2 2Structural Safety 3 3Aesthetics/Appearance 4 4Operational/Maintenance Performance 5 5Spatial Fit 6 6Privacy 7 7Space Function 9 1 1 1 1 1 9Services Equipment Maintenance Req. 8 1 1 8Floor Area 10 1 1 10 1Building Structure Layout 11 1 1 1 11Beam Depth 12 1 1 12 1 1Suspended Ceiling Type 14 1 1 1 1 1 1 14 1HVAC Distribution Layout 15 1 1 1 1 1 15 1 1 1 1Air Diffuser Quantity 16 1 1 1 16 1Air Duct Width and Length 17 1 1 1 1 17Required Depth for HVAC Equipment 18 1 1 1 18Required Depth for Lighting Equipment 19 1 19 1Structural Element Connection Details 20 1 1 20 1HVAC Equipment and Superstructure Integration Scheme 21 1 1 1 1 1 1 21 1Plenum Depth 22 1 1 1 1 1 1 1 22Floor to Ceiling Height 23 1 1 1 1 1 1 1 1 1 23Suspended Ceiling Structural Grid Layout 24 1 1 1 1 24Panel Width and Length 25 1 1 25Lighting Fixture Quantity 28 1 1 1 1 28Lighting Fixture Width and Length 29 1 1 29Lighting Fixture Layout 30 1 1 1 1 1 1 1 30 1Air Diffuser Layout 32 1 1 1 1 32Panel Edge and Joint Detail 26 1 1 1 1 26Panel Weight 27 1 1 27Air Diffuser Width and Length 33 1 1 1 33Lighting Fixture Weight 31 1 31 1Air Diffuser Weight 34 1 34 1Load Test Data 35 1 1 1 1 35Main Runner and Cross Tee Web Height 36 1 1 1 1 1 1 1 1 36Main Runner and Cross Tee Face Dimension 37 1 1 1 1 1 1 1 1 37Maximum Lighting Fixture Weight 38 1 1 1 1 1 38 1Maximum Air Diffuser Weight 39 1 1 1 1 1 39 1Hanger Spacings 43 1 1 1 1 1 43Main Runner and Cross Tee Weight 40 1 1 1 1 40Suspended Ceiling Structure-Lighting Fixture Connection Detail 41 1 1 1 1 41Suspended Ceiling Structure-Air Diffuser Connection Detail 42 1 1 1 1 42Floor Structure 13 1 1 1 1 1 1 1 13
Figure 6.16: Banded Parameter-based DSM of Suspended Ceiling Design at System Level

Ther
mal
Per
form
ance
Acou
stic
al P
erfo
rman
ce
Ligh
ting
Perfo
rman
ce
Stru
ctur
al S
afet
y
Fire
Saf
ety
Hyg
iene
Aest
hetic
s/Ap
pear
ance
Ope
ratio
nal/M
aint
enan
ce P
erfo
rman
ce
Dur
abilit
y
Spat
ial F
it
Susp
ende
d C
eilin
g Ty
pe
Plen
um D
epth
Susp
ende
d C
eilin
g St
ruct
ural
Grid
Lay
out
Pane
l Hum
idity
Res
ista
nce
Pane
l Sag
Res
ista
nce
Pane
l Ant
imic
robi
al T
reat
men
t
Pane
l Aco
ustic
s N
RC
Pane
l Aco
ustic
s C
AC
Pane
l The
rmal
Insu
latio
n Va
lue
Pane
l Fire
Res
ista
nce
Pane
l Mat
eria
l
Pane
l Wid
th a
nd L
engt
h
Pane
l Edg
e an
d Jo
int D
etai
l
Pane
l Sur
face
Ref
lect
ance
Req
uire
men
t
Pane
l Sur
face
Pat
tern
Pane
l Thi
ckne
ss
Pane
l Wei
ght
Pane
l Col
or
Mai
n R
unne
r and
Cro
ss T
ee C
olor
Mai
n R
unne
r and
Cro
ss T
ee S
truct
ural
Cla
ssifi
catio
n
Load
Tes
t Dat
a
Mai
n R
unne
r and
Cro
ss T
ee W
eb H
eigh
t
Mai
n R
unne
r and
Cro
ss T
ee F
ace
Dim
ensi
on
Mai
n R
unne
r and
Cro
ss T
ee W
eigh
t
Mai
n R
unne
r and
Cro
ss T
ee S
urfa
ce F
inis
h
Mai
n R
unne
r and
Cro
ss T
ee P
rofil
e Le
ngth
Mai
n R
unne
r and
Cro
ss T
ee In
terfa
ce
Mai
n R
unne
r and
Cro
ss T
ee E
nd D
etai
l
Han
ger C
ross
sect
ions
Han
ger S
paci
ngs
Wal
l Ang
le C
ross
sect
ions
1 2 3 4 5 6 7 8 9 10 11 12 13 14 15 16 17 18 19 20 21 22 23 24 25 26 27 28 29 30 31 32 33 34 35 36 37 38 39 40 41Thermal Performance 1 1Acoustical Performance 2 2Lighting Performance 3 3Structural Safety 4 4Fire Safety 5 5Hygiene 6 6Aesthetics/Appearance 7 7Operational/Maintenance Performance 8 8Durability 9 9Spatial Fit 10 10Suspended Ceiling Type 11 1 1 1 11Plenum Depth 12 1 1 1 12Suspended Ceiling Structural Grid Layout 13 1 1 1 1 13Panel Humidity Resistance 14 1 14Panel Sag Resistance 15 1 15Panel Antimicrobial Treatment 16 1 16Panel Acoustics NRC 17 1 17Panel Acoustics CAC 18 1 18Panel Thermal Insulation Value 19 1 19Panel Fire Resistance 20 1 20Panel Material 21 1 1 1 1 1 1 1 1 1 1 1 1 1 1 1 21Panel Width and Length 22 1 1 22Panel Edge and Joint Detail 23 1 1 1 1 23Panel Surface Reflectance 24 1 24Panel Surface Pattern 25 1 1 25Panel Thickness 26 1 1 1 26Panel Weight 27 1 1 1 1 27Panel Color 28 1 1 28 1Main Runner and Cross Tee Color 29 1 1 1 29Main Runner and Cross Tee Structural Classification 30 1 30Load Test Data 31 1 1 1 31Main Runner and Cross Tee Web Height 32 1 1 1 1 1 1 32Main Runner and Cross Tee Face Dimension 33 1 1 1 1 1 1 1 33Main Runner and Cross Tee Weight 34 1 1 1 1 34Main Runner and Cross Tee Surface Finish 35 1 1 1 35Main Runner and Cross Tee Profile Length 36 1 36Main Runner and Cross Tee Interface 37 1 1 1 37Main Runner and Cross Tee End Detail 38 1 1 38 1Hanger Crosssections 39 1 1 1 39Hanger Spacings 40 1 1 1 40Wall Angle Crosssections 41 1 1 1 1 1 1 41
Figure 6.17: Banded Parameter-based DSM of Suspended Ceiling Design at Assembly Level

144
6.5 Results and Discussion
6.5.1 Observations on Suspended Ceiling System
Interface Design
The suspended ceiling system interface DSM includes 6 iteration cycles
(Figure 6.14). These comprise two groups with overlapping cycles in
each. HVAC distribution system, structural frame system, and lighting
system play a major role in these iterations. The floor structure system
does not cause any iteration.
The main critical elements (the elements which cause large cycles) in
the first iteration group are beam depth, HVAC distribution layout, air
diffuser quantity, required depth for lighting equipment, structural
element connection details, HVAC equipment and superstructure
integration scheme, plenum depth, floor to ceiling height, lighting fixture
width and length, and air diffuser layout. The main critical elements in
the second iteration group are weights and maximum weights of lighting
fixtures and air diffusers, and hanger spacings.
Beam depth is a critical parameter since it is sensitive to two
downstream parameter decisions: HVAC distribution layout and HVAC
and superstructure integration scheme. In the actual design process,
the largest beams had been used at the periphery of the building to
save space in the plenum where HVAC ducts would pass. However, the
beams also had been needed to be slightly oversized in order to allow
some of ducts pass through them.

145
Changes in HVAC distribution layout may create costly changes in
design; since this directly affects two high level decisions in two
systems (beam depth in structural frame system and suspended ceiling
type in suspended ceiling system). Such a loop can be avoided by
correct assumptions about floor to ceiling height, air diffuser quantity, air
diffuser layout, and HVAC and superstructure integration scheme at the
beginning of the process. The sizes of HVAC equipment may also
cause rework in plenum depth decision. In the case study, it was
reported that nearly at the end of the actual design process, the
mechanical engineer had requested a change in plenum depth due to a
change in HVAC equipment sizes and this had caused a conflict among
the participants.
Structural element connection detail is critical in determining the plenum
depth. As explained in the beginning of this chapter, generally there are
two schemes of connecting the structural elements, namely, web-to-
web and layered. In the Gürbulak case, structural members had been
connected web-to-web to save space in the plenum.
HVAC equipment and superstructure integration scheme is another
parameter that should be carefully considered in early stages of design
process, since it affects two system level upstream decisions: HVAC
distribution layout and beam depth. This parameter refers to the
decision about how structural members and HVAC ducts interact in the

146
plenum. Several different schemes may be applied; for example, main
ducts can run parallel to the structural members, they can be placed
below, or they can pass through the structure where necessary. No
matter which scheme is chosen, the decision should be based on
coordination of HVAC, structural and architectural designs.
While the first group of overlapping cycles represents many problematic
situations in suspended ceiling design, the second group (beginning
with lighting fixture weight and ending with hanger spacings) is based
on a single problem: carrying lighting fixtures and air diffusers by the
suspended ceiling structure. The load carrying capacity of suspended
ceiling structure system puts limitations on lighting fixture and air
diffuser weights. If the weights of these elements exceed the allowed
limits they should be carried independently by additional hangers.
When the initial and partitioned matrices of suspended ceiling design at
system level are compared, it is observed that in the parameter list of
the initial system interface matrix, there are large monochrome bands
(Figures 6.12 and 6.14). However, in the partitioned matrix such large
bands are broken. Since each color shows a system which is in the
domain of a different design professional, the large bands in the initial
DSM suggest that decisions related to building systems are made
sequentially without considering interdisciplinary information. The
partitioned DSM, thus, recommends closer communication and

147
collaboration among the designers and presents a more concurrent
process.
In the partitioned matrix, except a few changes in the sequence of
parameters, the order of parameter decisions almost remained the
same, while there are large cycles. This implies that those cycles are
inevitable in the process. The partitioned DSM helps in identifying the
information cycles which are inevitable in the process due to the
couplings.
6.5.2 Observations on Suspended Ceiling Assembly
Design
Unlike the system level design which is a truly interdisciplinary
endeavor, the assembly level design is in the domain of a single design
professional: the architect. This task involves selecting the suspended
ceiling members (usually from a pre-defined list of available options)
and configuring a system accordingly. Thus, suspended ceiling design
at the assembly level is not problematic. The partitioned DSM contains
only two very small cycles and no critical elements. Since there are no
strict constraints on the order of decisions (there are no two-way
dependencies), many optional paths may be taken in the design.
Experimenting with “what-if” scenarios using the “Manual Sequence”
tool of the DSM software helps in identifying those paths.
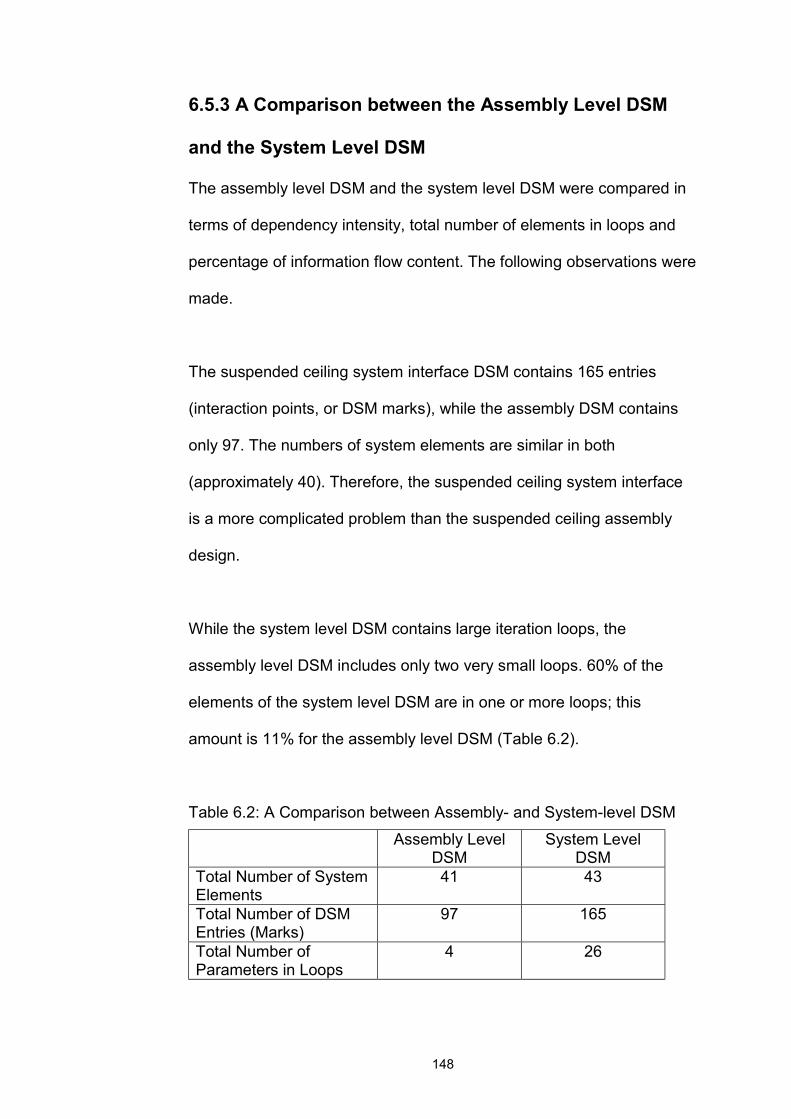
148
6.5.3 A Comparison between the Assembly Level DSM
and the System Level DSM
The assembly level DSM and the system level DSM were compared in
terms of dependency intensity, total number of elements in loops and
percentage of information flow content. The following observations were
made.
The suspended ceiling system interface DSM contains 165 entries
(interaction points, or DSM marks), while the assembly DSM contains
only 97. The numbers of system elements are similar in both
(approximately 40). Therefore, the suspended ceiling system interface
is a more complicated problem than the suspended ceiling assembly
design.
While the system level DSM contains large iteration loops, the
assembly level DSM includes only two very small loops. 60% of the
elements of the system level DSM are in one or more loops; this
amount is 11% for the assembly level DSM (Table 6.2).
Table 6.2: A Comparison between Assembly- and System-level DSM Assembly Level
DSM System Level
DSM Total Number of System Elements
41 43
Total Number of DSM Entries (Marks)
97 165
Total Number of Parameters in Loops
4 26
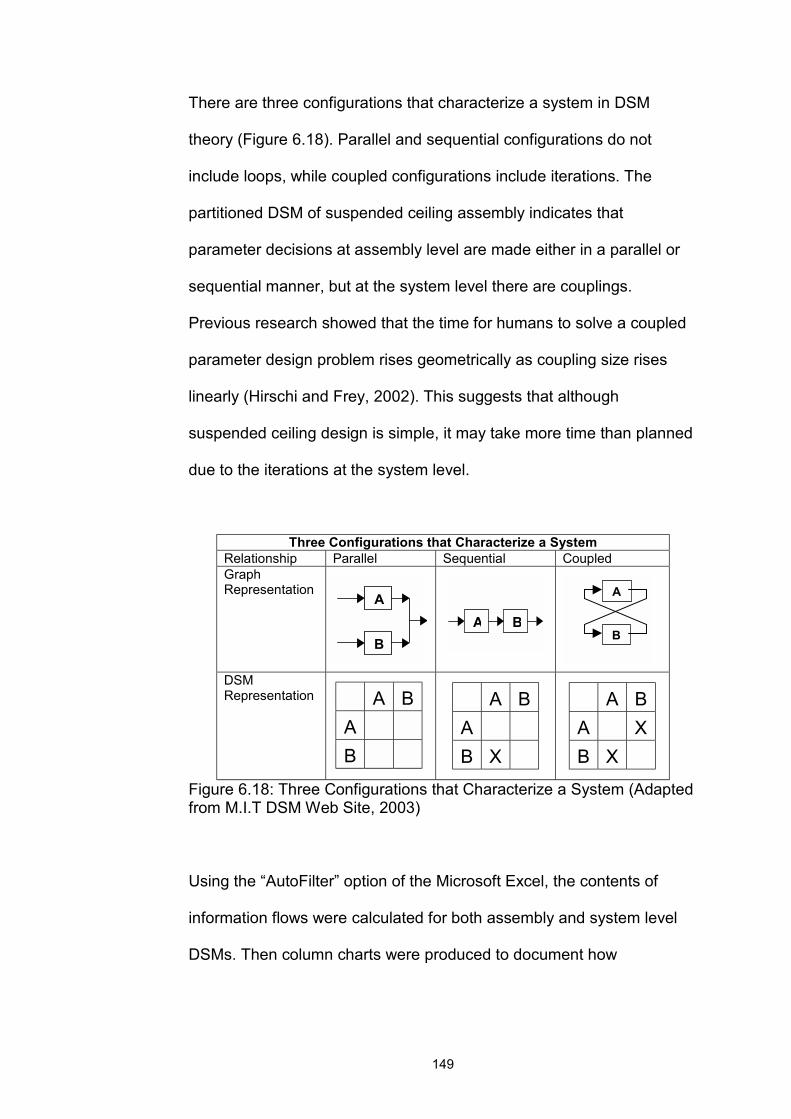
149
There are three configurations that characterize a system in DSM
theory (Figure 6.18). Parallel and sequential configurations do not
include loops, while coupled configurations include iterations. The
partitioned DSM of suspended ceiling assembly indicates that
parameter decisions at assembly level are made either in a parallel or
sequential manner, but at the system level there are couplings.
Previous research showed that the time for humans to solve a coupled
parameter design problem rises geometrically as coupling size rises
linearly (Hirschi and Frey, 2002). This suggests that although
suspended ceiling design is simple, it may take more time than planned
due to the iterations at the system level.
Three Configurations that Characterize a System Relationship Parallel Sequential Coupled Graph Representation
DSM Representation
A B A B X
A B A X B X
Figure 6.18: Three Configurations that Characterize a System (Adapted from M.I.T DSM Web Site, 2003)
Using the “AutoFilter” option of the Microsoft Excel, the contents of
information flows were calculated for both assembly and system level
DSMs. Then column charts were produced to document how
A
B
A B A B
A B
A
B

150
performance requirements drive design. The results are shown in
Figure 6.19.
System Level DSM Performance Requirements
04.65
0 0 06.40 5.23
1.16
40.70
31.40
10.46
05101520253035404550
Acous
tics
Aesthe
tics/A
ppea
rance
Durabil
ity
Fire Safe
ty
Hygien
e
Lighti
ng
Operat
ional/
Mainten
ance
Privac
y
Spatia
l Fit
Structu
ral Safe
ty
Therm
al
Performance Requirements
Perc
enta
ge o
f Inf
orm
atio
n Fl
ow C
onte
nt
Figure 6.19: Information Flow Percentages in System Level DSM
The analysis indicates that spatial fit is the major driver of suspended
ceiling design process at system level (40.70%). This is not surprising,
because suspended ceiling design at system interactions level is
basically fitting services and lighting equipment as well as structural
members in plenum. Structural safety requirements follow spatial fit
requirements (31.40%); since carrying the concealed equipment by
either suspended ceiling structure or the main structure of the building,
and carrying the whole suspended ceiling system via hangers
suspended from the superstructure are important concerns. Thermal
performance (10.46%), lighting performance (6.40%), operational and
maintenance performance (5.23%), aesthetics/appearance (4.65%),
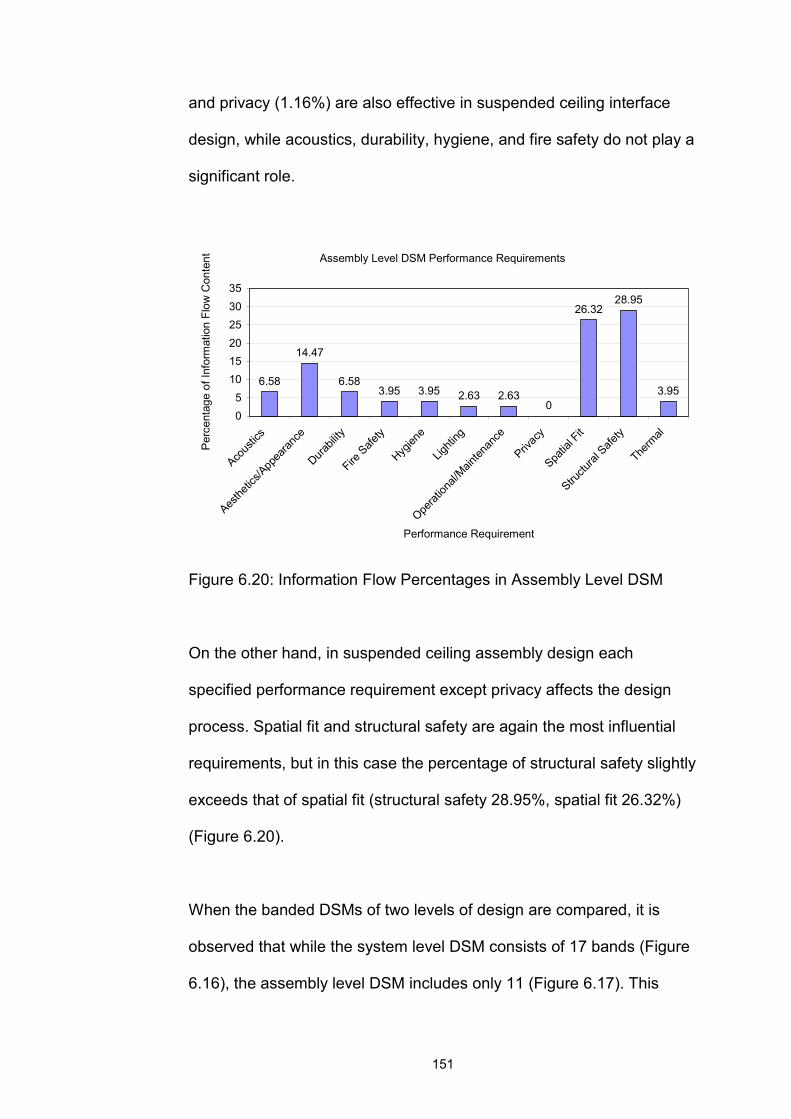
151
and privacy (1.16%) are also effective in suspended ceiling interface
design, while acoustics, durability, hygiene, and fire safety do not play a
significant role.
Assembly Level DSM Performance Requirements
6.58
14.47
6.583.95 3.95 2.63 2.63
0
26.3228.95
3.95
05101520253035
Acous
tics
Aesthe
tics/A
ppea
rance
Durabil
ity
Fire Safe
ty
Hygien
e
Lighti
ng
Operat
ional/
Mainten
ance
Privac
y
Spatia
l Fit
Structu
ral Safe
ty
Therm
al
Performance Requirement
Perc
enta
ge o
f Inf
orm
atio
n Fl
ow C
onte
nt
Figure 6.20: Information Flow Percentages in Assembly Level DSM
On the other hand, in suspended ceiling assembly design each
specified performance requirement except privacy affects the design
process. Spatial fit and structural safety are again the most influential
requirements, but in this case the percentage of structural safety slightly
exceeds that of spatial fit (structural safety 28.95%, spatial fit 26.32%)
(Figure 6.20).
When the banded DSMs of two levels of design are compared, it is
observed that while the system level DSM consists of 17 bands (Figure
6.16), the assembly level DSM includes only 11 (Figure 6.17). This

152
finding supports the comments made above, since more bands mean
more critical elements and more coupling in the process. On the other
hand, fewer bands suggest that the design is more flexible i.e. the order
of design decisions in a band can be safely changed, because they are
independent of each other.
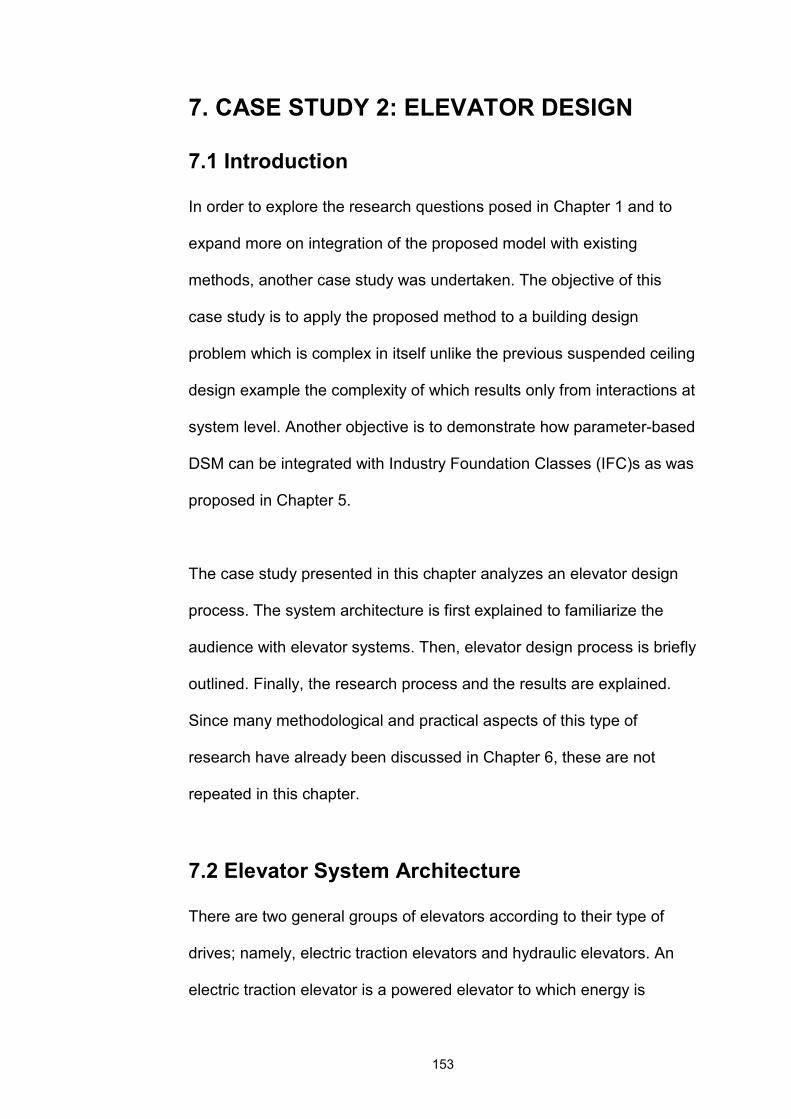
153
7. CASE STUDY 2: ELEVATOR DESIGN
7.1 Introduction
In order to explore the research questions posed in Chapter 1 and to
expand more on integration of the proposed model with existing
methods, another case study was undertaken. The objective of this
case study is to apply the proposed method to a building design
problem which is complex in itself unlike the previous suspended ceiling
design example the complexity of which results only from interactions at
system level. Another objective is to demonstrate how parameter-based
DSM can be integrated with Industry Foundation Classes (IFC)s as was
proposed in Chapter 5.
The case study presented in this chapter analyzes an elevator design
process. The system architecture is first explained to familiarize the
audience with elevator systems. Then, elevator design process is briefly
outlined. Finally, the research process and the results are explained.
Since many methodological and practical aspects of this type of
research have already been discussed in Chapter 6, these are not
repeated in this chapter.
7.2 Elevator System Architecture
There are two general groups of elevators according to their type of
drives; namely, electric traction elevators and hydraulic elevators. An
electric traction elevator is a powered elevator to which energy is

154
applied by an electric driving machine. This type is used exclusively in
tall buildings and in most low buildings. A hydraulic elevator is a
powered elevator to which energy is applied by a liquid under pressure
in a cylinder equipped with a plunger, or piston. This type is used for
low-rise freight service and may be used for low-rise passenger service
where low initial cost is desired. For an electric elevator, the car is
raised or lowered along its guides by wire ropes controlled by the
drawing machine. For a hydraulic elevator, the car is seated on the
plunger, which moves up and down under the control of hydraulic
pressure.
The main components of an elevator system are hoistway, car, machine
room and landing as shown in Figure 7.1.
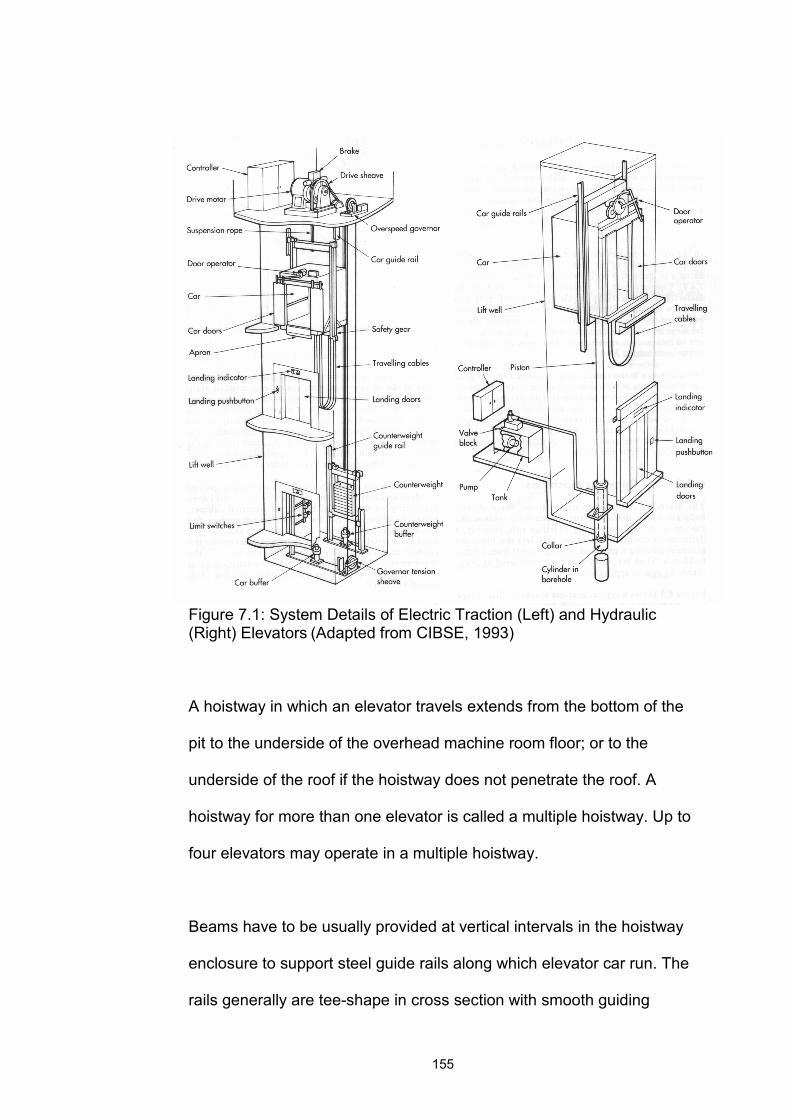
155
Figure 7.1: System Details of Electric Traction (Left) and Hydraulic (Right) Elevators (Adapted from CIBSE, 1993)
A hoistway in which an elevator travels extends from the bottom of the
pit to the underside of the overhead machine room floor; or to the
underside of the roof if the hoistway does not penetrate the roof. A
hoistway for more than one elevator is called a multiple hoistway. Up to
four elevators may operate in a multiple hoistway.
Beams have to be usually provided at vertical intervals in the hoistway
enclosure to support steel guide rails along which elevator car run. The
rails generally are tee-shape in cross section with smooth guiding
156
surfaces. One rail is installed on each side of the hoistway to guide the
car, which has upper and lower guide wheels attached to its supporting
frame.
The elevator pit is the portion of a hoistway extending from the
threshold level of the lowest landing floor to the floor at the bottom of
the hoistway. The pit usually houses buffers and other safety devices. A
buffer is a device designed to stop a descending car beyond its normal
limit of travel by absorbing and dissipating its kinetic energy.
An elevator car consists of a platform and light metal walls and roof, in
which passenger and goods are transported. The platform and
enclosure are supported on a structural steel frame. A safety gear
which is fixed to the structural frame is often provided if the car is for
passenger use.
The car doors may be swinging or sliding, and manually or power
operated. They are equipped with safety devices to prevent them from
opening while the car is in motion or outside the landing zone. An
operating station that includes push buttons, lift position and direction
indicators is normally provided within an elevator car. Handrails and
mirrors can also be used. Various types of finishes can be applied to
the interior of the car according to the style and use of the building. In
addition, the interior of the car should be adequately illuminated and an

157
emergency lighting system also should be provided to operate
automatically after failure of power for normal lighting.
A machine room contains machines and control equipment, which are
necessary to operate an elevator. The dimensions of the machine room
depend on the machine sizes. For electric traction drives a suitable
lifting beam should also be installed overhead. The machine room is
ideally located immediately over the hoistway for this type of drive.
Bottom or side drives are sometimes used, but these configurations are
less efficient and result in increased installation and maintenance costs.
For hydraulic drives, the machine room is ideally located adjacent to the
hoistway at the lowest level served. The machine room may be located
remote from the hoistway, but if the distance is long, it may be
problematic.
Although landing area is outside an elevator system, landing fixtures
should be considered as an integral part to it. These include push
buttons, lift position and direction indicators and hall lanterns. The
design of these systems should complement car finishes.
7.3 Elevator Design Process
Insights into the elevator design process were gained through the
interviews conducted as a part of the case study. The process is
summarized below in order to provide a background for the detailed
models presented in the next section.

158
Elevator design process begins with studying the feasibility of elevators
in building. This involves participation of the client and the architect. If
elevators are required, the next step is planning them. The planning of
an elevator system is a very involved subject. Although the basic
calculations are relatively simple, the results obtained need to be
tempered with a great deal of working experience of existing buildings
in order to ensure satisfactory design results.
At the beginning of the planning phase, a traffic analysis is undertaken
to determine the traffic that the elevator will carry and to establish the
quality of elevator service in terms of the speed of elevators and waiting
time for service. The architect provides detailed information about the
building, including the parameters such as number of stops, interfloor
distance, building population, etc. Traffic analysis is often made by the
engineer responsible for elevator design. Some elevator providers also
offer such a service. The traffic information obtained from the analysis
can then be used as input to the downstream processes of deciding
access and evacuation strategy and selecting elevator type.
Deciding access and evacuation strategy includes decisions on
parameters such as the number of elevator cars, the number of doors
for each car and car door width. Fire fighting and disabled access
requirements are influential on determining the access strategy.

159
After deciding the access and evacuation strategy, the elevator type in
terms of the method of powering the elevator is selected. The number
of floors that an elevator is intended to serve is the main parameter that
affects this decision. The amount of space that can be allocated for
machine room is another factor to be considered; since electric
elevators require machine rooms positioned at the top of the hoistway
while for hydraulic elevators, the machine room is placed next to the
hoistway at the lowest level.
The car and landing details such as size of elevator cars and car
grouping are determined according to the chosen elevator type and the
access strategy. Car size directly depends on the traffic analysis and is
decided to provide satisfactory service at peak intervals. Car grouping is
an important parameter for deciding hoistway details and as a part of
the whole circulation system in the building, it is designed by the
architect.
Deciding hoistway details involves the architect, the structural engineer,
the elevator provider, and the services engineer. Allocating adequate
space for a hoistway is an important early design consideration. If the
early scheme is not flexible enough, this may create serious conflicts at
the later phases. Other hoistway related parameters include type of
guide rails, guide rail fixing positions, and machine room and pit details.

160
Having decided the car, hoistway, and landing details, finishes and
fittings are selected. Such decisions are usually in the domain of the
architect. Decisions on finishes and fittings are parallel processes which
can be conducted concurrently. Another parallel process at the detailed
design phase is determining structural item locations and loads. This
includes decisions on buffer position and load, pit foundation size, and
details of lifting beam and guide rails which are made by the structural
engineer.
An elevator design process is briefly outlined above. Detailed
information can be found in IDEF0 and DSM models presented in the
following section.
7.4 Analyzing Elevator Design Process with
Parameter-based DSM
7.4.1 Research Setting
This research was carried out in the architectural design department of
TEPE Construction Company and in the offices of their engineering
collaborators like the previous case study. It took five months between
February 2003 and June 2003. Besides the participants of the previous
research, Turkey branch of OTIS Elevator Company also contributed to
this research and provided detailed information on elevator provider’s
processes.
161
Having been founded by Elisha Graves Otis, who invented the world’s
first safety elevator in 1853, the OTIS Elevator Company has been one
of the pioneers of advanced elevator systems. OTIS is also well-known
with its systematic approach to elevator design processes. Elevator
Planning and Selection Guide of OTIS is a useful design guide (OTIS,
2003). The company has been operating in Turkey under the title Buga
OTIS since 1991 and it has provided elevators to some well-known
buildings in Turkey such as İş Bankası Towers, Akmerkez, Galeria in
İstanbul and many others.
7.4.2 The Scope and Limitations of the Model
The elevator design process model developed in this dissertation is
subject to following limitations.
1. The analysis includes only standard passenger elevators with both
electric traction and hydraulic drives. Observation elevators, special
elevators for the aged and people with special needs, goods
elevators, service elevators, motor vehicle elevators, rack and pinion
elevators, scissor elevators, and elevators that are powered by other
means are left out of the scope.
2. The analysis includes only the design phase of an elevator life cycle.
Agreement with an elevator provider, production of working
drawings, construction and maintenance of elevators are left out of
the scope.
3. It is assumed that the traffic analysis is based on Up-peak interval
only.

162
4. It is assumed that there is no need to change to a different elevator
during the travel i.e. no express zone.
7.4.3 Objectives of the Analysis
The objectives of the analysis are to:
1. Identify and document important relations specific to elevator design
process.
2. Study information flow and coupling in elevator design.
3. Identify critical parameters that cause large iteration cycles.
4. Identify assumptions to be made in the process.
5. Show knowledge ownership.
7.4.4 The Procedure
The procedure that was followed in this part of dissertation research is
as follows:
1. Choose a particular design problem; define the system and its
scope.
2. Do a literature research on elevator design to get more familiar
with the subject and the terminology.
3. Interview designers to define the elements involved in the system
and the interactions between them.
4. Produce IDEF0 diagrams to outline the processes graphically.
5. Build an information database to record the interactions.
6. Show the information database to the designers and make
revisions if necessary.
163
7. Construct and analyze the matrix and comment on the design
process.
8. Evaluate the results with the participants.
7.4.4.1 Data Collection
The data was collected through inspection of design documents and
interviews with designers. Since all of the participants except the
elevator design engineer from OTIS were familiar with the DSM
method, the early steps of the data collection process (explanation of
the aim and the procedure of the study and of how DSMs work) were
relatively short. The early interviews were open-ended type and
recorded. Besides these interviews, some design documents such as
manufacturers’ information, drawings, and design guides have been
examined. A draft version of elevator design process model was
produced according to the collected data. In the later phases of the data
collection process, the matrix was revised according to the comments
from the participants. In addition to the observations on the data
collection process discussed in the previous case study, the following
points were identified in this study:
1. The design participants might have different perspectives on the
issues due to their different disciplinary backgrounds. In this case,
the interviewer had to act as a mediator. Thus, this study revealed
that in data collection for DSM analyses the interviewer should
posses the knowledge of the system to some degree and be able to
discuss different aspects of the process.

164
2. Occasionally, different design participants had different views on
how one element related to the other. This was sometimes due to an
indirect interaction. For example, “Uppeak Interval” affects “Contract
Capacity” and “Car Width” depends on “Contract Capacity” (Uppeak
Interval ⇒ Contract Capacity ⇒ Car Width). Thus, a designer might
say that “Uppeak Interval” affects “Car Width” due to their intuition
from work experience. In this situation, the interviewer explained to
the designers why a mark should be put in row “Contract Capacity”
and column “Uppeak Interval”, instead of row “Car Width” and
column “Uppeak Interval.” Although there is no mark between the
“Uppeak Interval” and “Car Width”, the two would reach each other
indirectly.
7.4.4.2 The IDEF0 Models
Before building DSMs, the author produced IDEF0 models of the
elevator design process. Interviews revealed that the IDEF0 elevator
design model produced by the UK Chapter of International Alliance for
Interoperability (IAI UK, 99) would need very little change to be adapted
to the Turkish practice. While producing the diagrams, the framework
proposed in the U.S. NIST (National Institute of Standards) IDEF0
Standard (U.S. NIST, 1993) was used. Microsoft Visio Professional
Edition was used as the graphical modeling tool. First, A0 context
diagrams were drawn for elevator life cycle (Figures 7.2 and 7.3), and
then the model was detailed to reflect the design process (Figures 7.4,

165
7.5 and 7.6). These documents guided the DSM building process in the
later phases.
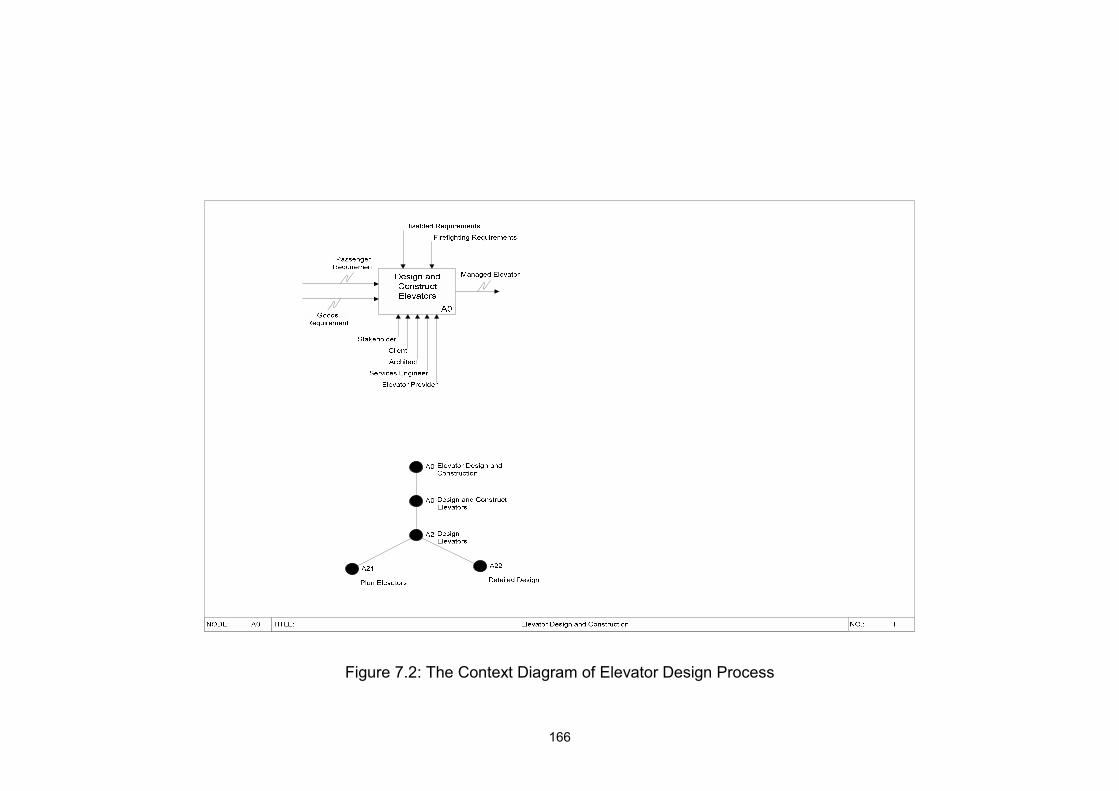
166
Figure 7.2: The Context Diagram of Elevator Design Process

167
Figure 7.3: An IDEF0 Model of Elevator Life Cycle

168
Figure 7.4: An IDEF0 Model of Elevator Design

169
Figure 7.5: An IDEF0 Model of Elevator Planning
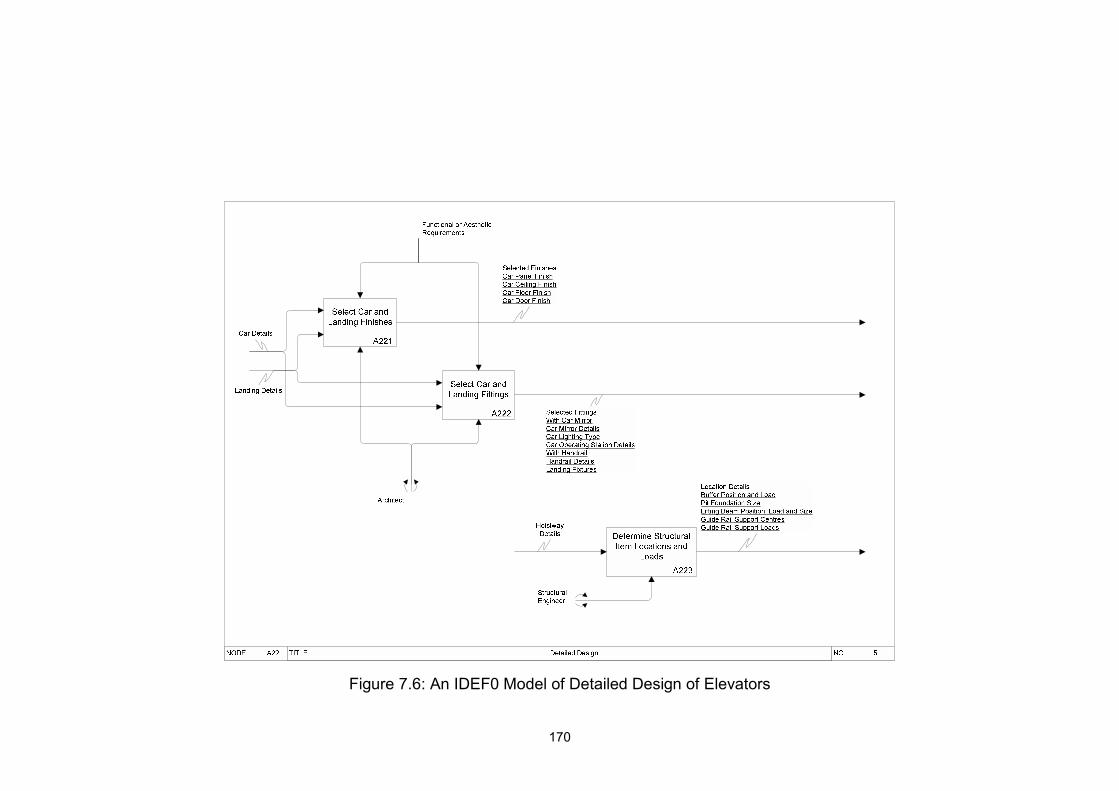
170
Figure 7.6: An IDEF0 Model of Detailed Design of Elevators

171
7.4.4.3 The Information Database
The collected information has been stored in a Microsoft EXCEL
database which was developed in the previous case study. The
information database contains 78 parameters and 268 information
flows. Since the details of the information database were discussed in
the previous chapter, these will not be repeated here. Detailed
descriptions of the parameters can be examined in Appendix B.2.
7.4.4.4 Production of the Matrix and Analyses
A DSM was produced automatically according to the recorded data in a
process similar to the one described in the previous chapter. The
parameters were categorized according to the activities that produce
them. In this way, the initial matrix can be used as a process map which
shows the detailed flows between the activities (Figure 7.7). This
method of classifying parameters has also been presented elsewhere
(Taşlı Pektaş, 2003a). Partitioning (Figure 7.8) and banding (Figure 7.9)
were made to identify couplings and parallel parameter decisions in the
process. The results of the analyses are presented below.
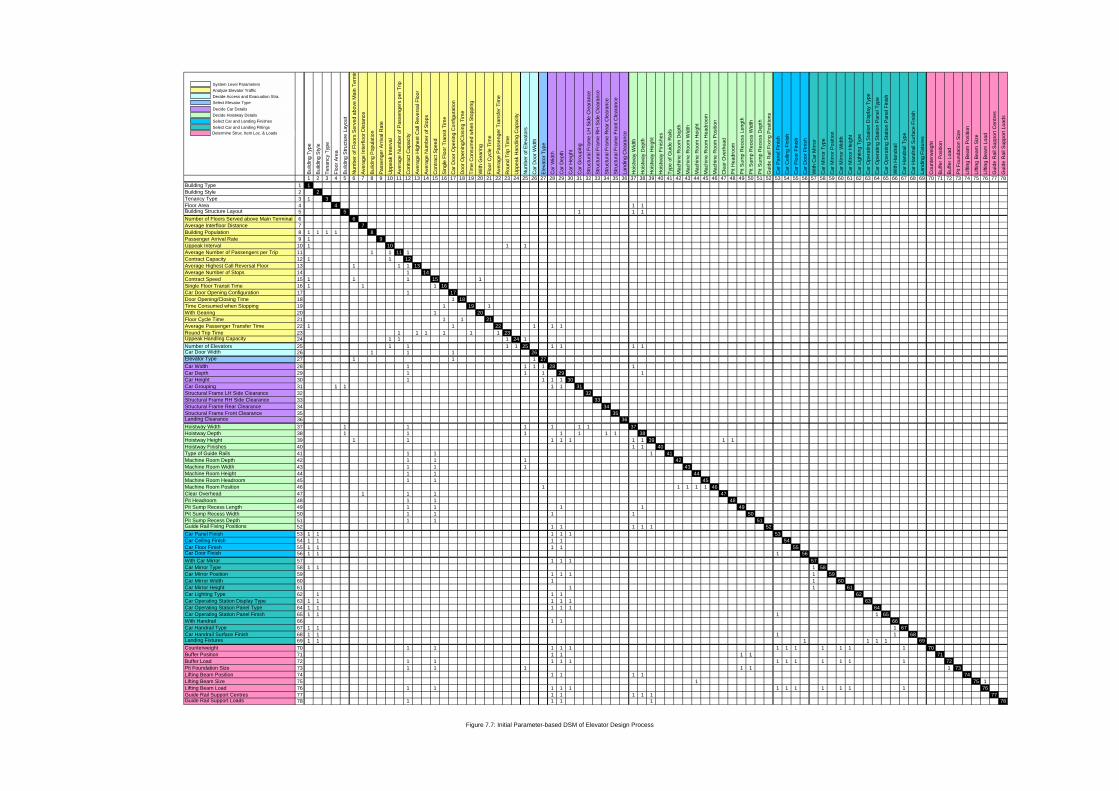
Build
ing
Type
Build
ing
Styl
e
Tena
ncy
Type
Floo
r Are
a
Build
ing
Stru
ctur
e La
yout
Num
ber o
f Flo
ors
Serv
ed a
bove
Mai
n Te
rmin
Aver
age
Inte
rfloo
r Dis
tanc
e
Build
ing
Popu
latio
n
Pass
enge
r Arri
val R
ate
Upp
eak
Inte
rval
Aver
age
Num
ber o
f Pas
seng
ers
per T
rip
Con
tract
Cap
acity
Aver
age
Hig
hest
Cal
l Rev
ersa
l Flo
or
Aver
age
Num
ber o
f Sto
ps
Con
tract
Spe
ed
Sing
le F
loor
Tra
nsit
Tim
e
Car
Doo
r Ope
ning
Con
figur
atio
n
Doo
r Ope
ning
/Clo
sing
Tim
e
Tim
e C
onsu
med
whe
n St
oppi
ng
With
Gea
ring
Floo
r Cyc
le T
ime
Aver
age
Pass
enge
r Tra
nsfe
r Tim
e
Rou
nd T
rip T
ime
Upp
eak
Han
dlin
g C
apac
ity
Num
ber o
f Ele
vato
rs
Car
Doo
r Wid
th
Elev
ator
Typ
e
Car
Wid
th
Car
Dep
th
Car
Hei
ght
Car
Gro
upin
g
Stru
ctur
al F
ram
e LH
Sid
e C
lear
ance
Stru
ctur
al F
ram
e R
H S
ide
Cle
aran
ce
Stru
ctur
al F
ram
e R
ear C
lear
ance
Stru
ctur
al F
ram
e Fr
ont C
lear
ance
Land
ing
Cle
aran
ce
Hoi
stw
ay W
idth
Hoi
stw
ay D
epth
Hoi
stw
ay H
eigh
t
Hoi
stw
ay F
inis
hes
Type
of G
uide
Rai
ls
Mac
hine
Roo
m D
epth
Mac
hine
Roo
m W
idth
Mac
hine
Roo
m H
eigh
t
Mac
hine
Roo
m H
eadr
oom
Mac
hine
Roo
m P
ositi
on
Cle
ar O
verh
ead
Pit H
eadr
oom
Pit S
ump
Rec
ess
Leng
th
Pit S
ump
Rec
ess
Wid
th
Pit S
ump
Rec
ess
Dep
th
Gui
de R
ail F
ixin
g Po
sitio
ns
Car
Pan
el F
inis
h
Car
Cei
ling
Fini
sh
Car
Flo
or F
inis
h
Car
Doo
r Fin
ish
With
Car
Mirr
or
Car
Mirr
or T
ype
Car
Mirr
or P
ositi
on
Car
Mirr
or W
idth
Car
Mirr
or H
eigh
t
Car
Lig
htin
g Ty
pe
Car
Ope
ratin
g St
atio
n D
ispl
ay T
ype
Car
Ope
ratin
g St
atio
n Pa
nel T
ype
Car
Ope
ratin
g St
atio
n Pa
nel F
inis
h
With
Han
drai
l
Car
Han
drai
l Typ
e
Car
Han
drai
l Sur
face
Fin
ish
Land
ing
Fixt
ures
Cou
nter
wei
ght
Buffe
r Pos
ition
Buffe
r Loa
d
Pit F
ound
atio
n Si
ze
Lifti
ng B
eam
Pos
ition
Lifti
ng B
eam
Siz
e
Lifti
ng B
eam
Loa
d
Gui
de R
ail S
uppo
rt C
entre
s
Gui
de R
ail S
uppo
rt Lo
ads
1 2 3 4 5 6 7 8 9 10 11 12 13 14 15 16 17 18 19 20 21 22 23 24 25 26 27 28 29 30 31 32 33 34 35 36 37 38 39 40 41 42 43 44 45 46 47 48 49 50 51 52 53 54 55 56 57 58 59 60 61 62 63 64 65 66 67 68 69 70 71 72 73 74 75 76 77 78Building Type 1 1Building Style 2 2Tenancy Type 3 1 3Floor Area 4 4 1 1Building Structure Layout 5 5 1 1 1Number of Floors Served above Main Terminal 6 6Average Interfloor Distance 7 7Building Population 8 1 1 1 1 8Passenger Arrival Rate 9 1 9Uppeak Interval 10 1 10 1 1Average Number of Passengers per Trip 11 1 1 11 1Contract Capacity 12 1 1 12Average Highest Call Reversal Floor 13 1 1 1 13Average Number of Stops 14 1 14Contract Speed 15 1 1 1 15 1Single Floor Transit Time 16 1 1 1 16Car Door Opening Configuration 17 1 17Door Opening/Closing Time 18 1 18Time Consumed when Stopping 19 1 19 1With Gearing 20 1 20Floor Cycle Time 21 1 1 21Average Passenger Transfer Time 22 1 1 22 1 1 1Round Trip Time 23 1 1 1 1 1 1 23Uppeak Handling Capacity 24 1 1 1 24 1Number of Elevators 25 1 1 1 1 25 1 1 1 1Car Door Width 26 1 1 1 26Elevator Type 27 1 1 1 27Car Width 28 1 1 1 1 28 1Car Depth 29 1 1 1 29 1Car Height 30 1 1 1 1 30Car Grouping 31 1 1 1 1 31Structural Frame LH Side Clearance 32 32Structural Frame RH Side Clearance 33 33Structural Frame Rear Clearance 34 34Structural Frame Front Clearance 35 35Landing Clearance 36 36Hoistway Width 37 1 1 1 1 1 1 37Hoistway Depth 38 1 1 1 1 1 1 1 38Hoistway Height 39 1 1 1 1 1 1 1 39 1 1Hoistway Finishes 40 1 1 40Type of Guide Rails 41 1 1 1 41Machine Room Depth 42 1 1 1 42Machine Room Width 43 1 1 1 43Machine Room Height 44 1 1 44Machine Room Headroom 45 1 1 45Machine Room Position 46 1 1 1 1 1 46Clear Overhead 47 1 1 1 47Pit Headroom 48 1 1 48Pit Sump Recess Length 49 1 1 1 1 49Pit Sump Recess Width 50 1 1 1 1 50Pit Sump Recess Depth 51 1 1 51Guide Rail Fixing Positions 52 1 1 1 1 1 52Car Panel Finish 53 1 1 1 1 1 53Car Ceiling Finish 54 1 1 1 1 54Car Floor Finish 55 1 1 1 1 55Car Door Finish 56 1 1 1 56With Car Mirror 57 1 1 1 57Car Mirror Type 58 1 1 1 58Car Mirror Position 59 1 1 1 1 59Car Mirror Width 60 1 1 60Car Mirror Height 61 1 1 61Car Lighting Type 62 1 1 1 62Car Operating Station Display Type 63 1 1 1 1 1 63Car Operating Station Panel Type 64 1 1 1 1 1 64Car Operating Station Panel Finish 65 1 1 1 1 65With Handrail 66 1 1 66Car Handrail Type 67 1 1 1 67Car Handrail Surface Finish 68 1 1 1 1 68Landing Fixtures 69 1 1 1 1 1 1 69Counterweight 70 1 1 1 1 1 1 1 1 1 1 1 1 70Buffer Position 71 1 1 1 1 71Buffer Load 72 1 1 1 1 1 1 1 1 1 1 1 1 72Pit Foundation Size 73 1 1 1 1 1 1 73Lifting Beam Position 74 1 1 1 1 74Lifting Beam Size 75 1 75 1Lifting Beam Load 76 1 1 1 1 1 1 1 1 1 1 1 1 76Guide Rail Support Centres 77 1 1 1 1 1 77Guide Rail Support Loads 78 1 1 1 1 78
Decide Access and Evacuation Stra.
Decide Hoistway Details
Analyze Elevator Traffic
Select Car and Landing Finishes
Performance Requirements
System Level Parameters
Select Elevator TypeDecide Car Details
Select Car and Landing FittingsDetermine Struc. Item Loc. & Loads
Figure 7.7: Initial Parameter-based DSM of Elevator Design Process

Build
ing
Type
Build
ing
Styl
e
Tena
ncy
Type
Floo
r Are
a
Build
ing
Stru
ctur
e La
yout
Num
ber o
f Flo
ors
Serv
ed a
bove
Mai
n Te
rmin
a
Aver
age
Inte
rfloo
r Dis
tanc
e
Pass
enge
r Arri
val R
ate
Build
ing
Popu
latio
n
Upp
eak
Inte
rval
Aver
age
Num
ber o
f Pas
seng
ers
per T
rip
Con
tract
Cap
acity
Aver
age
Hig
hest
Cal
l Rev
ersa
l Flo
or
Aver
age
Num
ber o
f Sto
ps
Con
tract
Spe
ed
Sing
le F
loor
Tra
nsit
Tim
e
Car
Doo
r Ope
ning
Con
figur
atio
n
Doo
r Ope
ning
/Clo
sing
Tim
e
Tim
e C
onsu
med
whe
n St
oppi
ng
With
Gea
ring
Floo
r Cyc
le T
ime
Aver
age
Pass
enge
r Tra
nsfe
r Tim
e
Rou
nd T
rip T
ime
Upp
eak
Han
dlin
g C
apac
ity
Num
ber o
f Ele
vato
rs
Car
Doo
r Wid
th
Elev
ator
Typ
e
Car
Wid
th
Car
Dep
th
Car
Gro
upin
g
Stru
ctur
al F
ram
e LH
Sid
e C
lear
ance
Stru
ctur
al F
ram
e R
H S
ide
Cle
aran
ce
Stru
ctur
al F
ram
e R
ear C
lear
ance
Stru
ctur
al F
ram
e Fr
ont C
lear
ance
Land
ing
Cle
aran
ce
Hoi
stw
ay W
idth
Hoi
stw
ay D
epth
Car
Hei
ght
Hoi
stw
ay F
inis
hes
Mac
hine
Roo
m D
epth
Mac
hine
Roo
m W
idth
Mac
hine
Roo
m H
eigh
t
Mac
hine
Roo
m H
eadr
oom
Mac
hine
Roo
m P
ositi
on
Cle
ar O
verh
ead
Pit H
eadr
oom
Hoi
stw
ay H
eigh
t
Type
of G
uide
Rai
ls
Pit S
ump
Rec
ess
Leng
th
Pit S
ump
Rec
ess
Wid
th
Pit S
ump
Rec
ess
Dep
th
Gui
de R
ail F
ixin
g Po
sitio
ns
Car
Pan
el F
inis
h
Car
Cei
ling
Fini
sh
Car
Flo
or F
inis
h
Car
Doo
r Fin
ish
Car
Lig
htin
g Ty
pe
With
Han
drai
l
With
Car
Mirr
or
Car
Ope
ratin
g St
atio
n D
ispl
ay T
ype
Car
Ope
ratin
g St
atio
n Pa
nel T
ype
Car
Ope
ratin
g St
atio
n Pa
nel F
inis
h
Car
Han
drai
l Typ
e
Car
Han
drai
l Sur
face
Fin
ish
Car
Mirr
or T
ype
Car
Mirr
or P
ositi
on
Car
Mirr
or W
idth
Car
Mirr
or H
eigh
t
Land
ing
Fixt
ures
Cou
nter
wei
ght
Gui
de R
ail S
uppo
rt C
entre
s
Gui
de R
ail S
uppo
rt Lo
ads
Lifti
ng B
eam
Pos
ition
Buffe
r Pos
ition
Lifti
ng B
eam
Loa
d
Buffe
r Loa
d
Lifti
ng B
eam
Siz
e
Pit F
ound
atio
n Si
ze
1 2 3 4 5 6 7 9 8 10 11 12 13 14 15 16 17 18 19 20 21 22 23 24 25 26 27 28 29 31 32 33 34 35 36 37 38 30 40 42 43 44 45 46 47 48 39 41 49 50 51 52 53 54 55 56 62 66 57 63 64 65 67 68 58 59 60 61 69 70 77 78 74 71 76 72 75 73Building Type 1 1Building Style 2 2Tenancy Type 3 1 3Floor Area 4 4 1 1Building Structure Layout 5 5 1 1 1Number of Floors Served above Main Terminal 6 6Average Interfloor Distance 7 7Passenger Arrival Rate 9 1 9Building Population 8 1 1 1 1 8Uppeak Interval 10 1 10 1 1Average Number of Passengers per Trip 11 1 1 11 1Contract Capacity 12 1 1 12Average Highest Call Reversal Floor 13 1 1 1 13Average Number of Stops 14 1 14Contract Speed 15 1 1 1 15 1Single Floor Transit Time 16 1 1 1 16Car Door Opening Configuration 17 1 17Door Opening/Closing Time 18 1 18Time Consumed when Stopping 19 1 19 1With Gearing 20 1 20Floor Cycle Time 21 1 1 21Average Passenger Transfer Time 22 1 1 22 1 1 1Round Trip Time 23 1 1 1 1 1 1 23Uppeak Handling Capacity 24 1 1 1 24 1Number of Elevators 25 1 1 1 1 25 1 1 1 1Car Door Width 26 1 1 1 26Elevator Type 27 1 1 1 27Car Width 28 1 1 1 1 28 1Car Depth 29 1 1 1 29 1Car Grouping 31 1 1 1 1 31Structural Frame LH Side Clearance 32 32Structural Frame RH Side Clearance 33 33Structural Frame Rear Clearance 34 34Structural Frame Front Clearance 35 35Landing Clearance 36 36Hoistway Width 37 1 1 1 1 1 1 37Hoistway Depth 38 1 1 1 1 1 1 1 38Car Height 30 1 1 1 1 30Hoistway Finishes 40 1 1 40Machine Room Depth 42 1 1 1 42Machine Room Width 43 1 1 1 43Machine Room Height 44 1 1 44Machine Room Headroom 45 1 1 45Machine Room Position 46 1 1 1 1 1 46Clear Overhead 47 1 1 1 47Pit Headroom 48 1 1 48Hoistway Height 39 1 1 1 1 1 1 1 1 1 39Type of Guide Rails 41 1 1 1 41Pit Sump Recess Length 49 1 1 1 1 49Pit Sump Recess Width 50 1 1 1 1 50Pit Sump Recess Depth 51 1 1 51Guide Rail Fixing Positions 52 1 1 1 1 1 52Car Panel Finish 53 1 1 1 1 1 53Car Ceiling Finish 54 1 1 1 1 54Car Floor Finish 55 1 1 1 1 55Car Door Finish 56 1 1 1 56Car Lighting Type 62 1 1 1 62With Handrail 66 1 1 66With Car Mirror 57 1 1 1 57Car Operating Station Display Type 63 1 1 1 1 1 63Car Operating Station Panel Type 64 1 1 1 1 1 64Car Operating Station Panel Finish 65 1 1 1 1 65Car Handrail Type 67 1 1 1 67Car Handrail Surface Finish 68 1 1 1 1 68Car Mirror Type 58 1 1 1 58Car Mirror Position 59 1 1 1 1 59Car Mirror Width 60 1 1 60Car Mirror Height 61 1 1 61Landing Fixtures 69 1 1 1 1 1 1 69Counterweight 70 1 1 1 1 1 1 1 1 1 1 1 1 70Guide Rail Support Centres 77 1 1 1 1 1 77Guide Rail Support Loads 78 1 1 1 1 78Lifting Beam Position 74 1 1 1 1 74Buffer Position 71 1 1 1 1 71Lifting Beam Load 76 1 1 1 1 1 1 1 1 1 1 1 1 76Buffer Load 72 1 1 1 1 1 1 1 1 1 1 1 1 72Lifting Beam Size 75 1 1 75Pit Foundation Size 73 1 1 1 1 1 1 73
Decide Access and Evacuation Stra.
Decide Hoistway Details
Analyze Elevator Traffic
Select Car and Landing Finishes
Performance Requirements
System Level Parameters
Select Elevator TypeDecide Car Details
Select Car and Landing FittingsDetermine Struc. Item Loc. & Loads
Figure 7.8: Partitioned Parameter-based DSM of Elevator Design Process

Build
ing
Type
Build
ing
Styl
eTe
nanc
y Ty
peFl
oor A
rea
Build
ing
Stru
ctur
e La
yout
Num
ber o
f Flo
ors
Serv
ed a
bove
Mai
n Te
rmin
Aver
age
Inte
rfloo
r Dis
tanc
ePa
ssen
ger A
rriva
l Rat
eBu
ildin
g Po
pula
tion
Upp
eak
Inte
rval
Aver
age
Num
ber o
f Pas
seng
ers
per T
ripC
ontra
ct C
apac
ityAv
erag
e H
ighe
st C
all R
ever
sal F
loor
Aver
age
Num
ber o
f Sto
psC
ontra
ct S
peed
Sing
le F
loor
Tra
nsit
Tim
eC
ar D
oor O
peni
ng C
onfig
urat
ion
Doo
r Ope
ning
/Clo
sing
Tim
eTi
me
Con
sum
ed w
hen
Stop
ping
With
Gea
ring
Floo
r Cyc
le T
ime
Aver
age
Pass
enge
r Tra
nsfe
r Tim
eR
ound
Trip
Tim
eU
ppea
k H
andl
ing
Cap
acity
Num
ber o
f Ele
vato
rsC
ar D
oor W
idth
Elev
ator
Typ
eC
ar W
idth
Car
Dep
thC
ar G
roup
ing
Stru
ctur
al F
ram
e LH
Sid
e C
lear
ance
Stru
ctur
al F
ram
e R
H S
ide
Cle
aran
ceSt
ruct
ural
Fra
me
Rea
r Cle
aran
ceSt
ruct
ural
Fra
me
Fron
t Cle
aran
ceLa
ndin
g C
lear
ance
Hoi
stw
ay W
idth
Hoi
stw
ay D
epth
Car
Hei
ght
Hoi
stw
ay F
inis
hes
Mac
hine
Roo
m D
epth
Mac
hine
Roo
m W
idth
Mac
hine
Roo
m H
eigh
tM
achi
ne R
oom
Hea
droo
mM
achi
ne R
oom
Pos
ition
Cle
ar O
verh
ead
Pit H
eadr
oom
Hoi
stw
ay H
eigh
tTy
pe o
f Gui
de R
ails
Pit S
ump
Rec
ess
Leng
thPi
t Sum
p R
eces
s W
idth
Pit S
ump
Rec
ess
Dep
thG
uide
Rai
l Fix
ing
Posi
tions
Car
Pan
el F
inis
hC
ar C
eilin
g Fi
nish
Car
Flo
or F
inis
hC
ar D
oor F
inis
hC
ar L
ight
ing
Type
With
Han
drai
lW
ith C
ar M
irror
Car
Ope
ratin
g St
atio
n D
ispl
ay T
ype
Car
Ope
ratin
g St
atio
n Pa
nel T
ype
Car
Ope
ratin
g St
atio
n Pa
nel F
inis
hC
ar H
andr
ail T
ype
Car
Han
drai
l Sur
face
Fin
ish
Car
Mirr
or T
ype
Car
Mirr
or P
ositi
onC
ar M
irror
Wid
thC
ar M
irror
Hei
ght
Land
ing
Fixt
ures
Cou
nter
wei
ght
Gui
de R
ail S
uppo
rt C
entre
sG
uide
Rai
l Sup
port
Load
sLi
fting
Bea
m P
ositi
onBu
ffer P
ositi
onLi
fting
Bea
m L
oad
Buffe
r Loa
dLi
fting
Bea
m S
ize
Pit F
ound
atio
n Si
ze
1 2 3 4 5 6 7 9 8 10 11 12 13 14 15 16 17 18 19 20 21 22 23 24 25 26 27 28 29 31 32 33 34 35 36 37 38 30 40 42 43 44 45 46 47 48 39 41 49 50 51 52 53 54 55 56 62 66 57 63 64 65 67 68 58 59 60 61 69 70 77 78 74 71 76 72 75 73Building Type 1 1Building Style 2 2Tenancy Type 3 1 3Floor Area 4 4 1 1Building Structure Layout 5 5 1 1 1Number of Floors Served above Main Termina 6 6Average Interfloor Distance 7 7Passenger Arrival Rate 9 1 9Building Population 8 1 1 1 1 8Uppeak Interval 10 1 10 1 1Average Number of Passengers per Trip 11 1 1 11 1Contract Capacity 12 1 1 12Average Highest Call Reversal Floor 13 1 1 1 13Average Number of Stops 14 1 14Contract Speed 15 1 1 1 15 1Single Floor Transit Time 16 1 1 1 16Car Door Opening Configuration 17 1 17Door Opening/Closing Time 18 1 18Time Consumed when Stopping 19 1 19 1With Gearing 20 1 20Floor Cycle Time 21 1 1 21Average Passenger Transfer Time 22 1 1 22 1 1 1Round Trip Time 23 1 1 1 1 1 1 23Uppeak Handling Capacity 24 1 1 1 24 1Number of Elevators 25 1 1 1 1 25 1 1 1 1Car Door Width 26 1 1 1 26Elevator Type 27 1 1 1 27Car Width 28 1 1 1 1 28 1Car Depth 29 1 1 1 29 1Car Grouping 31 1 1 1 1 31Structural Frame LH Side Clearance 32 32Structural Frame RH Side Clearance 33 33Structural Frame Rear Clearance 34 34Structural Frame Front Clearance 35 35Landing Clearance 36 36Hoistway Width 37 1 1 1 1 1 1 37Hoistway Depth 38 1 1 1 1 1 1 1 38Car Height 30 1 1 1 1 30Hoistway Finishes 40 1 1 40Machine Room Depth 42 1 1 1 42Machine Room Width 43 1 1 1 43Machine Room Height 44 1 1 44Machine Room Headroom 45 1 1 45Machine Room Position 46 1 1 1 1 1 46Clear Overhead 47 1 1 1 47Pit Headroom 48 1 1 48Hoistway Height 39 1 1 1 1 1 1 1 1 1 39Type of Guide Rails 41 1 1 1 41Pit Sump Recess Length 49 1 1 1 1 49Pit Sump Recess Width 50 1 1 1 1 50Pit Sump Recess Depth 51 1 1 51Guide Rail Fixing Positions 52 1 1 1 1 1 52Car Panel Finish 53 1 1 1 1 1 53Car Ceiling Finish 54 1 1 1 1 54Car Floor Finish 55 1 1 1 1 55Car Door Finish 56 1 1 1 56Car Lighting Type 62 1 1 1 62With Handrail 66 1 1 66With Car Mirror 57 1 1 1 57Car Operating Station Display Type 63 1 1 1 1 1 63Car Operating Station Panel Type 64 1 1 1 1 1 64Car Operating Station Panel Finish 65 1 1 1 1 65Car Handrail Type 67 1 1 1 67Car Handrail Surface Finish 68 1 1 1 1 68Car Mirror Type 58 1 1 1 58Car Mirror Position 59 1 1 1 1 59Car Mirror Width 60 1 1 60Car Mirror Height 61 1 1 61Landing Fixtures 69 1 1 1 1 1 1 69Counterweight 70 1 1 1 1 1 1 1 1 1 1 1 1 70Guide Rail Support Centres 77 1 1 1 1 1 77Guide Rail Support Loads 78 1 1 1 1 78Lifting Beam Position 74 1 1 1 1 74Buffer Position 71 1 1 1 1 71Lifting Beam Load 76 1 1 1 1 1 1 1 1 1 1 1 1 76Buffer Load 72 1 1 1 1 1 1 1 1 1 1 1 1 72Lifting Beam Size 75 1 1 75Pit Foundation Size 73 1 1 1 1 1 1 73
Figure 7.9: Banded Parameter-based DSM of Elevator Design Process

175
7.5 Results and Discussion
The following observations were made about the elevator design
process.
Although the DSM represents the whole process, it is possible to divide
the process into two phases: planning elevators (A21 in the IDEF0
model, and the parameters between the 6th and the 52nd in the initial
DSM) and detail design (A22 in the IDEF0 model, and the parameters
between the 53rd and the 78th in the initial DSM). The former phase
includes 47 parameters except 5 system level parameters presented in
beginning of the parameter list of the initial DSM. The latter stage
contains 26 parameters (Figure 7.7)
The DSM analysis revealed considerable differences in these two
general stages. In the partitioned DSM, it was observed that the most
problematic phase of elevator design process is planning elevators
(Figure 7.8). This phase contains three overlapping loops. 28
parameters are in these loops. This means that approximately 60% of
the parameters in the planning phase are included in one or more
information cycles. However, there is no cycle in the detailed design
phase.
The “Analyze Elevator Traffic” activity creates the largest cycle, which
contains 16 parameters, in the process. The critical parameters in this
cycle are uppeak interval, contract speed, time consumed when
stopping, with gearing, floor cycle time, average passenger transfer
176
time, round trip time, and number of elevators. This cycle represents the
activity of deciding on the number of elevators required in the building.
The second cycle in the process consists of the components between
the 22nd and the 29th parameters and it corresponds to the activity of
determining car width and depth. The critical parameters in this cycle
are average passenger transfer time, round trip time, number of
elevators, car door width, car width, and car depth.
The last cycle in the process involves 13 parameters and represents the
activity of deciding hoistway width and hoistway depth. The critical
parameters in this cycle are number of elevators, car door width, car
width, car depth, hoistway width, and hoistway depth.
One should pay attention to a larger possible cycle which contains all of
the three cycles mentioned above. This is shown with a darker
rectangle on the partitioned DSM and represents the relationship of the
elevator system with two building system level parameters, namely,
floor area and building structure layout. The width and depth of the
hoistway is an important consideration in architectural design at an
early stage especially in tall buildings. Proper assumptions should be
made about these parameters while the architect prepares the spatial
layout. Further changes are rather costly and difficult. Similarly, the
structural engineer should consider the hoistway dimensions while
preparing the initial structural layout. Structural costs are often reduced
177
by using elevator hoistways for structural purposes. The hoistways can
serve as load-bearing supports for floors and roofs and as shear walls
for resisting lateral forces from wind and earthquakes. Thus, correct
assumptions about the hoistway dimensions are also critical from the
structural design point of view. This large cycle in the process creates
an “iteration-in-iteration” situation which has also been addressed by
the other researchers (Mascoli, 1999; Dong, 1999).
The banded DSM of elevator design process shows that while there are
18 bands in the planning stage, detailed design stage consists of only 4
bands (Figure 7.9). This suggests that early parameter decisions of
elevator design process tend to be either sequential or coupled;
however, decisions at the detailed design phase are mostly parallel.
Therefore, detailed design does not require a strict order of decisions.
Some parameters such as structural frame and landing clearances are
already available at the start of the process, since they are determined
by strict standards. Thus, they can be placed at the beginning of the
parameter decision sequence. In the partitioned matrix, they are placed
next to the related parameters in order to show where they fit in the
process (Figure 7.8).
When the initial and partitioned matrices of elevator design process are
compared, it is observed that except a few changes in the sequence of
parameters, the order of parameter decisions almost the same, while

178
there are large cycles. This suggests that those cycles are inevitable in
the process. Like the suspended ceiling system level DSM, the elevator
design DSM also shows inevitable cycles in the process.

179
8. DISCUSSION AND CONCLUSIONS
This chapter presents the conclusions of the study following a
discussion of the implications on the design process drawn from the
case studies. The contributions of this dissertation to the subject field
and the challenges of the proposed method are discussed and
suggestions are made for further research.
8.1 Implications on the Design Process drawn
from the Case Studies
The well-defined geometric and functional bounds of elevator and
suspended ceiling systems enabled the author to establish a readily
understood and accepted scope for the case studies. Besides the
insights gained into the individual design processes, some common
implications can also be drawn as below:
The first observation about the design processes concerns the types of
information flows. There are at least four types of knowledge used in
determining the parameter values:
1. There exist a number of formulas such that existing design
values are used to compute a new parameter value. These
formulas are often based on physical laws. For example, in
elevator design the following formula is used:
Floor Cycle Time = Single Floor Transit Time + Door
Opening/Closing Time. Elevator design process involves more

180
such formulas than suspended ceiling design does. This is
probably due to the mechanical nature of elevator design.
2. Some parameters create constraints for other parameters. In
other words, they bring limitations on the choices for other
parameters. For example, in suspended ceiling design, hanger
spacing puts limitations on maximum weight of lighting fixtures
and air diffusers that can be carried by the suspended ceiling
structure.
3. The design professionals use preferences to decide on a
parameter value when no other parameter dictates a choice.
These preferences can be measured with an ordinal scale.
Preferences with a higher value are considered more important
(e.g. lowest cost). This is often the case when decisions are
made on finishes. Parameters related to finishes are mostly not
dependent on other parameters (although they depend on each
other to ensure compatibility in design), but based on client‘s
and/or designer’s preferences.
4. When a design problem occurs, for example, if a violation of a
constraint indicates that a rework is needed, the designers use
fixes to modify the design. Each fix affects specific parameters
that are depended on the changed parameter. Parameter-based
DSM is very useful to track the parameters affected by such
changes.
181
In the case studies, it was also observed that certain aspects of design
are more prone to iterations. The identification of these aspects may be
useful for predicting problem areas in other designs. First of all, the
case studies showed that early design stage includes more iterative
cycles. The problematic situation of early design (also called conceptual
design) is well addressed in the literature. In building design, most of
the important decisions (orientation, circulation, functional layout, etc.)
are made in the early stages of design. However, most design software
can not support this stage of design development (Taşlı, 2001b).
Early design stage is characterized also by the following:
Use of incomplete and imprecise descriptions of the building.
Focus on qualitative aspects rather than quantitative details (Fruchter et
al., 1996).
Thus, decisions made in the early steps of design often have far-
reaching and unanticipated impacts at later stages. However, it is often
too costly to modify early design decisions as the design advances
since they affect many parameters and are likely to create “iterations in
iterations.” In order to resolve this dilemma, the assumptions related to
early design parameters should be accurate and/or parameter values
should be determined with tolerances to compensate for future
changes.

182
Furthermore, it was observed in the case studies that the most critical
parameters, from design management perspective, are those that affect
many parameters. These include;
1. System parameters: which affect either all or most the
parameters (e.g. floor area, floor height, etc.)
2. Interface parameters: which specify a relation between two
system components engineered by different design professionals
(fitting dimensions, forces to be transmitted, etc.).
The DSM analyses revealed that the technical aspects of designing a
building part are usually well understood and relatively easy to manage.
Suspended ceiling design at assembly level and detailed design phase
of elevator design process are examples of this type of design which is
also called “standard design” or “kit-of-the-parts” design. In fact, the
interviews revealed that most of the elevator design is actually
“standard design,” meaning that the design is based on relatively simple
variations on a standard elevator design. Therefore, software systems
that are able to automatically propose an elevator system can be
effectively used for many cases. However, problems often occur when
parts are integrated into a system, and have to interact with other
elements in the system. Suspended ceiling design at system level and
the planning phase of elevator design are the examples for this
phenomenon. This latter type of design is difficult to manage and often
not suitable for automation. In most of the cases, human intervention is
essential to deal with the conflicts in system level design.
183
8.2 Conclusions
The AEC industry, like many others, is increasingly aware of the need to
improve efficiency of processes in a competitive marketplace. However,
the industry has experienced difficulties in identifying ways of capturing,
understanding, and replicating design processes. Having guided by the
observations above, this dissertation proposed parameter-based design
structure matrix as a system analysis and process modeling tool for
building design. The remaining sections conclude the findings of the
study and makes suggestions for further research.
8.2.1 Contributions of the Study to the Subject Field
In this dissertation, several proposals were made for the use of
parameter-based DSM in building design. The expected benefits of the
method were envisaged to be in three groups: process improvement,
process integration, and the use of the method in combination with the
other information processing applications. A knowledge management
framework was also proposed for parameter-based DSM applications in
building design. The framework addressed the following issues:
1. The need for explicit definitions of parameters was identified and
integrating DSMs with the IFC definitions was proposed as a
solution.
2. The four views that characterize parameter-based design were
defined and classification schemes for parameters were devised
according to these views.
184
3. In order to deal with large DSMs, a two level scheme for DSM
analysis was developed. DSMs were produced at assembly level
and at system interface level.
4. The complementary use of IDEF0 and parameter-based DSM
was suggested.
5. Proposals were made in order to explain how the method can be
utilized as software.
Two case studies were undertaken in order to apply the proposed
framework in real life design problems. It was observed that the
expected benefits of the method were realized in a great extent in the
case studies. Furthermore, the case studies enabled to extract some
general implications on building design process.
Parameter-based DSMs provided a structural map of the design
processes analyzed in the case studies. They identified iterative cycles,
critical parameters, and assumptions made. They also suggested
proper sequence of design decisions and provided insights into the
concurrency in the processes. Although the method has a prescriptive
value, unlike many other process modeling methods used in the
industry, in the case studies it was found that DSM analysis does not
dictate a single “right” process. Instead, it pictures the structure of the
dependency relations in the process so that designers may produce
several “what-if” scenarios to determine the effects of change.
185
An advantage of the DSM method experienced in the case studies was
its compactness. The DSM method enabled to represent a huge
amount of information in a single sheet. If the processes studied in the
case studies were modeled with a graphical technique, the models
would probably occupy a bunch of sheets. Thus, their management and
integration would be a considerable problem.
The case studies also revealed that, in most cases, design knowledge
needed to resolve design issues resides in more than one design
professional. The databases developed in the case studies showed
what information needs to be exchanged as well as dependencies
between the decisions. A database as such can serve to accumulate
the learning in design firms, providing a complement to the existing
inefficient documentation practice. It can serve as a browser for
designers to find out what decision they need to be made and whom
they need to communicate.
8.2.2 Challenges of the Proposed Method
Although parameter-based DSM is a powerful tool to model the design
processes and information flows involved, as a method, it also faces a
few challenges. Some of these challenges have already been identified
in the preceding chapters and some solutions were provided. However,
an in-depth discussion of the difficulties experienced in this research
may facilitate for further researches. The challenges of the method

186
observed in the case studies include data collection, data
representation, and enabling the widespread use of the tool.
8.2.2.1 Data Collection
The difficulties encountered during data collection were discussed in
Chapters 6 and 7. The amount of information involved and sometimes
the poor understanding of the process of the participants may make the
data collection process very time consuming. In fact, in knowledge-
intensive applications like DSM, the problem of knowledge elicitation is
often addressed (Taşlı and Özgüç, 2001). Sources of knowledge
include human experts, textbooks, work files and previous cases, but
there is no single elicitation technique that may be uniformly applied.
This problem is known as the “knowledge elicitation bottleneck”
(Schreiber, 1993). Elicitation from human experts is especially difficult.
Individual experience may be incomplete, irrelevant, or even incorrect.
Moreover, as the expert’s proficiency increases, the knowledge
becomes more instinctive and thus harder to elicit.
In order to ease the data collection process for DSM development
Sabbaghian and Eppinger (1998) developed a web-based tool for
collecting data over the Internet. Danilovic and Börjesson (2001) point
out that in almost all of the DSM studies data has been gathered by a
single researcher. They discuss that in these studies, individual
cognitive limitations prevent the system being captured, since
individuals are able to grasp only limited parts of the system analyzed.
187
In order to avoid this handicap, they propose a participatory approach to
DSM building in which data providing professionals actively participates
the DSM building process.
The author’s experience in DSM building suggests that definition of the
content and scope of DSM analysis is an important step in the
beginning of the data collection process, since different definitions of
the problem may result in different DSMs. Explicit definition of
parameters is also essential to avoid confusion over the parameter
contents. Among building design professionals, such confusions are
likely to occur, since each group use their own terminology. In the
previous DSM studies, explicit definitions of parameters have been
lacking which probably put limitations on the re-use of the models.
Standardization of parameter definitions is also desirable in order to
provide compatibility of different DSM applications. The case study on
elevator design in this dissertation demonstrated how IFCs can be used
for defining parameters in parameter-based DSMs in building design.
8.2.2.2 Data Representation
Another challenge of the parameter-based approach mentioned in this
dissertation is the large number of parameters involved in building
design. The number of parameters needed to fully determine the
properties of a product depends on its complexity. Rouibah and Caskey
(2003) estimate that an automobile can be described from 105 to 106,

188
while an aircraft or ship may have more than 106 parameters. There is
no available estimation of approximately how many parameters a
building may involve, but a really huge number is to be expected.
Consequently, to capture and manage all describing parameters in
building design may be unrealistic. Therefore, a selection should be
made depending on the purpose of the parameter deployment.
In Chapter 7, it was explained that the most important parameters in
building design are the ones that affect many other system components.
These critical elements were grouped into two: system parameters and
interface parameters. If the number of considered parameters is based
on these two groups, the number of parameters to be captured
considerably reduces.
8.2.2.3 Enabling the Widespread Use of the Method
The most common complaint the author of this dissertation got from
talking to the building design professionals about information
management in design was that they are so busy dealing with design
problems that they do not have the time to monitor the processes that
they undertake. In order to encourage the designers to spend time to
design management, this dissertation recommends that the proposed
method should be utilized as software.

189
8.3 Suggestions for Further Research
Since the use of parameter-based DSM in building design is innovative,
it may trigger further researches in many aspects. Some further
research topics are listed below.
This dissertation utilized only binary parameter-based DSMs. Further
research may be done to enhance the existing models via assigning
numerical values to the dependencies. A multitude of attributes that
provide more detailed information on the relationships can be provided
such as importance and strength of the dependency. Probability of
repetition, variability of information exchanged, and the impact of an
iteration can also be included in the analysis in order to simulate the
modeled processes.
Using the parameter-based DSM, comparison of different design
configurations is possible. A DSM can be produced for each design
option and different designs may be compared in terms of their
complexity and how a change in design affects the overall process
structure. In this case, the amount of system elements and information
flows would be a good indicator of design complexity. When design
configurations are compared, their problematic aspects can be identified
and new designs can be modified in the light of the gained insights.
Incompatibility of building design software was addressed in Chapter 2
as an important information related problem in the industry. Software

190
developers can use the method to integrate separated applications. The
flow of information between design software can be effectively modeled
using the tool and integrative applications can be developed.
This dissertation proposed the integrative use of the parameter-based
DSM in combination with the existing methods. This type of use of the
method was demonstrated via a simple example in Chapter 5. Further
research may exploit this capability of the tool.
Last but not least, in this dissertation it was suggested that the method
should be utilized as software. Within the scope of this dissertation, only
a basic framework was presented for the implementation of such a tool.
Further research is needed to develop the tool and to make it available
for building design professionals.
191
REFERENCES
Akın, Ö. (1986). Psychology of Architectural Design. London:Pion.
Amor, R., Augenbroe, G., Hosking, J., Rombouts, W., & Grundy, J. (1995). Directions in Modeling Environments. Automation in Construction, 4, 173-187.
Anumba, C. J. & Duke, A. K. (2000). Telepresence in Concurrent Lifecycle Design and Construction. Journal of Artificial Intelligence in Engineering - Special Issue on Collaborative and Concurrent Engineering, 14 (3), 221-232.
Arditi, D. and Günaydın, H. M. (1998). Factors that Affect Process Quality in the Life Cycle of Building Projects. Journal of Construction Engineering and Management, 124 (3), 194-203.
Atkin, R. H. (1974). Mathematical Structure in Human Affairs. New York: Crane, Russak and Company.
Atsuko, K., Nakahama, K., Hamada, S., Yamaguchi, S., & Sasada, T. (2001). Collaborative Design System with Hypermedium and Networking. Automation in Construction, 10, 309-318.
Austin, S., Baldwin, A., Li, B., & Waskett, P. (1999). Analytical Design Planning Technique: A Model of the Detailed Design Process. Design Studies, 20 (3), 279-296.
Austin, S., Baldwin, A., Li, B., & Waskett, P. (2000). Analytical Design Planning Technique (ADePT): A Dependency Structure Matrix Tool to Schedule the Building Design Process. Construction Management and Economics, 18, 173-182.
Austin, S., Baldwin, A., & Newton, A. (1994). Manipulating the Flow of Design Information to Improve the Programming of Building Design. Construction Management and Economics, 12, 445-455.
Austin, S., Newton, A., Steele, J., & Waskett, P. (2002). Modeling and Managing Project Complexity. International Journal of Project Management, 20, 191-198.
Austin, S., Steele, J., Macmillan, S., Kirby, P., & Spence, R. (2001). Mapping the Conceptual Design Activity of Interdisciplinary Teams. Design Studies, 22 (3), 211-232.
Axiomatic Design Inc. (2003). Axiomatic Design Company Web Page. Retrieved June 2, 2003, from http://www.axiomaticdesign.com
192
Baldwin, A. N., Austin, S., Hassan, T. M., & Thorpe, A. (1999). Modelling Information Flow during the Conceptual and Schematic Stages of Building Design. Construction Management and Economics, 17, 155-167.
Baldwin, A. N., Austin, S., Hassan, T. M., & Thorpe, A. (1998). Planning Building Design by Simulating Information Flow. Automation in Construction, 8, 149-163.
Ballard, G. (2000). Positive Vs. Negative Iteration in Design. International Group for Lean Construction, Eighth Annual Conference. Retrieved June 2, 2002, from http://www.sussex.ac.uk/spru/imichair/iglc8/05.pdf
Baykan, C., & Pultar, M. (1995). The Structure of Space-Activity Relations in Houses. Unpublished Research Report, Bilkent University, Turkey.
Björk, B. C. (1994). A Conceptual Model of Spaces, Space Boundaries, and Enclosing Structures. Automation in Construction, 3, 193-214.
Black, T. A., Fine, C. F., & Sachs, E. M. (1990). A Method for Systems Design Using Precedence Relationships: An Application to Automotive Break Systems. Working Paper, MIT School of Management, Cambridge, MA, 3208.
Booch, G., Rumbaugh, J., & Jacobson, I. (1998). The Unified Modeling Language User Guide. Reading, MA: Addison-Wesley.
Bovill, C. (1991). Architectural Design: Integration of Structural and Environmental Systems. New York: Van Nostrand Reinhold.
Broadbent, G. H. (1988). Design in Architecture. New York: Wiley.
Browning, T. R. (1998). Modeling and Analyzing Cost, Schedule, and Performance in Complex System Product Development. Ph.D. Dissertation, Technology, Management, and Policy Program. Massachusetts Institute of Technology. Retrieved May 14, 2002, from http://theses.mit.edu
Browning, T. R. (2001). Applying the Design Structure Matrix to System Decomposition and Integration Problems: A Review and New Directions. IEEE Transactions on Engineering Management, 48 (3), 292-306.
Browning, T. R. (2002). Process Integration Using the Design Structure Matrix. Systems Engineering, 5 (3), 180-193.
Caneparo, L. (2001). Shared Virtual Reality for Design and Management: The Porta Susa Project. Automation in Construction, 10, 217-228.
193
Cesiel, D. S. (1993). A Structured Approach to Calibration Development for Automotive Diagnostic Systems. M.Sc. Dissertation, Department of Electrical Engineering. Massachusetts Institute of Technology. Retrieved April 17, 2003, from http://theses.mit.edu
Charette, R. P., & Marshall, H. E. (1999). UNIFORMAT II Elemental Classification for Building Specifications, Cost Estimating, and Cost Analysis. Gaithersburg, MD: U.S. National Institute of Standards and Technology.
Chen, C., Ling, S. F., & Chen, W. (2003). Project Scheduling for Collaborative Product Development Using DSM. International Journal of Project Management, 4, 291-299.
Chinowsky, P. S., & Robinson, J. (1995). Facilitating Interdisciplinary Design Education through Case Histories. Retrieved June 2, 2002, from http://fie.engrng.pitt.edu/fie95/4a3/4a32/4a32.htm
Clarkson, P. J., & Hamilton, J. R. (2000). “Signposting”, A Parameter-driven Task-based Model of the Design Process. Research in Engineering Design, 12, 18-38.
Cronemyr, P., Ronnback, A. O., & Eppinger, S. D. (2001). A Decision Support Tool for Predicting the Impact of Development Process Improvements. Journal of Engineering Design, 12 (3), 177-199.
Cross, N. A. (1989). Engineering Design Methods. Chichester, West Sussex: John Wiley and Sons.
Cross, N. A. (1993). History of Design Methodology. In De Vries, M. J., Cross, N., & Grant, D. P. (Eds.) Design Methodology and Relationships with Science. London: Kluwer.
Danilovic, M., & Börjesson, H. (2001). Participatory Dependence Structure Matrix Approach. Proceedings of the Third Dependence Structure Matrix (DSM) International Workshop, October 29-30, Massachusetts Institute of Technology (MIT), Massachusetts, Boston, Cambridge, USA. Retrieved October 7, 2002, from http://extra.ivf.se/multiplan/dokument/Participatory_DSM_approach_FINAL.pdf
De Marco, T. (1979). Structured Analysis and System Specification. Englewood Cliffs, NJ.: Prentice Hall.
Decision Sciences Inc. (2002). Decisions Sciences Company Web Page. Retrieved November 29, 2002, from http://www.dsifl.com/webdsm.asp
Demirkan, H. (1998). Integration of Reasoning Systems in Architectural Modeling Activities. Automation in Construction, 7, 229-236.
194
Denker, S., Steward, D. and Browning, T. (1999). Planning Concurrency and Managing Iteration in Projects. Center for Quality of Management Journal, 8 (2), 55-62.
Dias, W. P. S. (1996). Multidisciplinary Product Modeling of Buildings. Journal of Computing in Civil Engineering, 10 (1), 78-86.
Dong, Q. (1999). Representing Information Flow and Knowledge Management in Design Using the Design Structure Matrix. M.Sc. Dissertation, Department of Mechanical Engineering. Massachusetts Institute of Technology. Retrieved September 7, 2002, from http://theses.mit.edu
Eastman, C. (1999). Building Product Models: Computer Environments Supporting Design and Construction. Boca Raton: CRC Press.
Elmasri, R., & Navathe, S. B. (1994). Fundamentals of Database Systems. Redwood City, California: Benjamin/Cummings.
English, K., Bloebaum, C. L., & Miller, E. (2001). Development of Multiple Cycle Coupling Suspension in the Optimization of Complex Systems. Structural and Multidisciplinary Optimization, 22 (4), 268-283.
Eppinger, S. D., Whitney, D. E., Smith, R. P., & Gebala, D. A. (1994). A Model-based Method for Organizing Tasks in Product Development. Research in Engineering Design, 6, 1-13.
Eppinger, S. D. (2001). Innovation at the Speed of Information. Harvard Business Review, 79, 149-158.
Formoso, C. T., Tzotzopoulos, P., Jobim, M. S. S., & Liedtke, R. (1998). Developing a Protocol for Managing the Design Process in the Building Industry. International Group for Lean Construction, Sixth Annual Conference. Retrieved April 24, 2002, from: http://www.ce.berkeley.edu/~tommelein/IGLC-6/FormosoTzotzopoulosJobimLeidtke.pdf
Fruchter, R., Clayton, M. J., Krawinkler, H., Kunz, J., & Teicholz, P. (1996). Interdisciplinary Communication Medium for Collaborative Conceptual Building Design. Advances in Engineering Software, 25, 89-101.
Galle, P. (1995). Towards Integrated, “Intelligent”, and Compliant Computer Modeling of Buildings. Automation in Construction, 4, 189-211.
Hamer, A. P., Nihtila, J., & Rehn, J. (1999). Document Viewpoint on One-of-a-kind Delivery Process. International Journal of Product Research, 37, 1319-1336.

195
Hew, K. P., Fisher, N., & Awbi, H. B. (2001). Towards an Integrated Set of Design Tools based on a Common Data Format for Building and Services Design. Automation in Construction, 10, 459-476.
Hirschi, N. W., & Frey, D. D. (2002). Cognition and Complexity: An Experiment on the Effect of Coupling in Parameter Design. Research in Engineering Design, 13, 123-131.
Hong, N. K., & Hong, S. (2001). Application of Entity-based Approach for Unified Representation of Design Alternatives for Structural Design. Advances in Engineering Software, 32, 599-610.
Howell, G. A. (1999). What is Lean Construction? Proceedings of the Seventh Annual Conference of the International Group for Lean Construction, 26-28 July 1999, University of California, Berkeley, CA, USA. 1-10. Retrieved January 9, 2001, from http://www.ce.berkeley.edu/~tommelein/IGLC-7/PDF/Howell.pdf
Hubka, V. (1982). Principles of Engineering Design. Guildford, Surrey: Butterworth Scientific Press.
Huovila, P., & Seren, K. J. (1998). Customer-oriented Design Methods for Construction Projects. Journal of Engineering Design, 9 (3), 225-238.
International Alliance for Interoperability (IAI), the North America Chapter. (2003). Projects Web Page. Retrieved June 9, 2003, from http://www.iai-na.org/technical/projects.php
International Alliance for Interoperability (IAI), the UK Chapter. (1999). Elevator Design Model. Retrieved February 18, 2003, from http://www.iai.org.uk/design_integration/technical_documentation/R3_bs_elevators.pdf
Jackson, B. (1997). The Development of TOTAL Studio: A Comprehensive Computer-Mediated Studio Environment for Architecture and Engineering. Retrieved December 16, 1999, from http://www-ec.njit.edu/ec_info/image1/text_files/jax/papers/total_97.html
Jones, J. C. (1970). Design Methods: Seeds of Human Futures. New York: John Wiley and Sons.
Kalay, Y. E., Khemlani, L., & Choi, J. W. (1998). An Integrated Model to Support Distributed Collaborative Design of Buildings. Automation in Construction, 7, 177-188.
Karhu, V. (2000). Proposed New Method for Construction Process Modelling. International Journal of Computer Integrated Design and Construction, 2 (3), 166-182.

196
Karhu, V. (2001). A Model based Approach for Construction Process Modelling. Retrieved May 6, 2003, from www.lib.kth.se/Sammanfattningar/karhu011109.pdf
Karstila, K. (2000). About Process Modelling: Methods and Tools for Construction Process Support. Retrieved June 9, 2002, from http://www.arcada.fi/personal/heffe/04%20hut%20it%20tfif%20merit/itecon_course/TKK_Rak-63_200_Lecture2_ProcessModelling_KKa_200-02-04.pdf [sic]
Krishnan, W. (1993). Design Process Improvement: Sequencing and Overlapping Activities in Product Development. Ph.D. Dissertation, Department of Mechanical Engineering. Massachusetts Institute of Technology. Retrieved February 6, 2002, from http://theses.mit.edu
Kvan, T. (2000). “Collaborative Design: What is it?” Automation in Construction, 9, 409-415.
Larson, N., & Kusiak, A. (1996). Managing Design Processes: A Risk Assessment Approach. IEEE Transactions on Systems, Man, and Cybernetics, 26 (1), 749-759.
Lean Aerospace Initiative (LAI). (2002). Lean Aerospace Initiative Web Site. Retrieved January 10, 2002, from http://lean.mit.edu
Lean Construction Institute (LCI). (2002). Lean Construction Institute Web Site. Retrieved January 10, 2002, from http://www.leanconstruction.org
Lee, E., Woo, S., & Sasada, T. (2001). The Evaluation System for Design Alternatives in Collaborative Design. Automation in Construction, 10, 295-301.
Liebich, T., & Wix, J. (2003). Highlights of the Development Process of Industry Foundation Classes. Retrieved January 14, 2003, from http://www.iai-na.org/technical/highlights_ifc.pdf
Lockledge, J. C., & Salustri, F. A. (2001). Design Communication Using a Variation of the Design Structure Matrix. International Conference on Engineering Design, ICED 01 Glasgow, August 21-23. Retrieved March 16, 2003, from http://www.dig.bris.ac.uk/iced/iced01/webpages/HTML/204-Lockledge.html
Lottaz, C. (2000). Increasing Understanding during Collaboration through Advanced Representations. Electronic Journal of Information Technology in Construction (ITcon). Retrieved March 1, 2000, from http://www.itcon.org/2000/1/paper.htm
197
Low, B. K., & Sloan, B. (2001). A Perspective on the Digital Interactive Service Industry for Building Professionals. Automation in Construction, 10, 229-237.
Macmillan, S., Steele, J., Austin, S., Kirby, P., & Spence, R. (2001). Development and Verification of a Generic Framework for Conceptual Design. Design Studies, 22, 169-191.
Malmström, J., Pikosz, P., & Malmqvist, J. (1999). Complementary Roles of IDEF0 and DSM for the Modeling of Information Management Processes. Concurrent Engineering – Research and Applications, 7 (2), 95-103.
Mascoli, G. J. (1999). A Systems Engineering Approach to Aero Engine Development in a Highly Distributed Engineering and Manufacturing Environment. MIT SDM Thesis, Massachusetts Institute of Technology. Retrieved January 7, 2003, from http://theses.mit.edu
Merritt, F. S., & Ambrose, J. (1990). Building Engineering and Systems Design. New York: Van Nostrand Reinhold.
MIT DSM Research Group. (2003). MIT DSM Web Site. Retrieved June 3, 2003, from http://www.dsmweb.org/
Mitchell, W. J. (1994). Three Paradigms for Computer-Aided Design. In G. Carrara and Y. E. Kalay (Eds.), Knowledge-Based Computer-Aided Architectural Design (pp. 379-89). Amsterdam: Elsevier.
Moller, C. (1997). The Virtual Organisation. Automation in Construction, 6, 39-43.
Nelson, M., Lee, A., Cooper, R., Kagioglou, M., & Fleming, A. (1999). Process Re-engineering in the Construction Industry – Buzzword or Reality? Retrieved December 28, 2002, from http://pp2.dct.salford.ac.uk/pdf/cobrapaper1999.pdf
OTIS Elevator Company. (2003). Elevator Planning and Selection Guide. Retrieved February 11, 2003, from http://www.otis.com
Pahl, G., & Beitz, W. (1984). Engineering Design. London: The Design Council.
Pena-Mora, F., Hussein, K., Vadhavkar, S., & Benjamin, K. (2000). CAIRO: A Concurrent Engineering Meeting Environment for Virtual Design Teams. Automation in Construction, 14, 203-219.
Peng, C. (1999). Flexible Generic Frameworks and Multidisciplinary Synthesis of Built Form. Design Studies, 20, 537-551.
Phillips, R. (2001). The Architect’s Plan of Work. London: RIBA Publications.

198
Problematics. (2003). Problematics Company Web Site. Retrieved December 21, 2002, from http://www.problematics.com
Pugh, S. (1986). Design Activity Models: Worldwide Emergence and Convergence. Design Studies, 7 (3), 167-173.
Pultar, M. (1990). Progress Based Construction Scheduling. Journal of Construction Engineering and Management, 116 (4), 670-688.
Pultar, M. (1999). Building Education: From Fragmentation to Integration. In G. Sağlamer, A. Melezinek & S. İncecik (Eds.), Engineering Education in the Third Millennium: Referate des 28. Internationalen Symposiums "Ingenieur Pedagogik'99 (pp. 373-379). Alsbach: Leuchtturm Verlag.
Qian, D., & Gross, M. (1999). Collaborative Design with Netdraw. Proceedings of the Eighth International Conference on Computer Aided Architectural Design Futures, Atlanta, USA, June, 213-26. Retrieved March 15, 2000, from http://depts.washington.edu/dmgftp/publications/pdfs/caadfutures99-netdraw.pdf
Radford, A. D., & Gero, J. S. (1988). Design by Optimization in Architecture, Building and Construction. New York: Van Nostrand Reinhold.
Rezgui, Y., Brown, A., Cooper, G., Yip, J., Brandon, P., & Kirkham, J. (1996). An Information Management Model for Concurrent Construction Engineering. Automation in Construction, 5, 343-355.
Rezgui, Y., & Zarli, A. (2001). Information and Communication Technology Advances in the European Construction Industry. Electronic Journal of Information Technology in Construction (ITcon). Retrieved February 19, 2003, from http://www.itcon.org/2001/7/
Rezgui, Y., Zarli, A., Bourdeau, M., & Cooper, G. (2002). Inter-enterprise Information Management in Dynamic Virtual Environments: the OSMOS Approach. Proceedings of the International Council for Research and Innovation in Building and Construction CIB w78 Conference. Retrieved February 15, 2003, from http://cic.cstb.fr/ilc/publicat/rezgui_cibw78.pdf
Rogers, J. L., & Salas, A. O. (1999). Toward a more Flexible Web-based Framework for Multidisciplinary Design. Advances in Engineering Software, 30, 439-444.
Rotheroe, K. (2002). A Vision for Parametric Design. Architecture Week. Retrieved December 23, 2002, from http://www.architectureweek.com/2002/0710/tools_1-1.html
199
Rouibah, K., & Caskey, K. R. (2003). Change Management in Concurrent Engineering from a Parameter Perspective. Computers in Industry, 50, 15-34.
Rowe, P. G. (1991). Design Thinking. Cambridge, Mass: MIT Press.
Rundell, R. L. (2002). Parametrics in Building Design. CAD Server: Online Resource for the CAD Community. Retrieved December 23, 2002, from http://www.cadserver.co.uk/common/viewer/archive/2002/Apr/9/feature.htm
Rush, R. D. (1986). The Building Systems Integration Handbook. Boston: Butterworth-Heinemann.
Sabbaghian, N., & Eppinger, S. (1998). Product Development Process Capture and Display Using Web-based Technologies. Proceedings of the IEEE International Conference on Systems, Man, and Cybernetics, San Diego, CA, Oct. 11-14, 2664-2669. Retrieved June 10, 2003, from http://web.mit.edu/dsm/pdf/nader_paper.pdf
Sanders, K. (1996). The Digital Architect. New York: John Wiley and Sons.
Sanvido, V. E., & Norton, K. J. (1994). Integrated Design Process Model. Journal of Management in Engineering, 5, 55-62.
Schreiber, G. (1993). KADS: A Principled Approach to Knowledge-based System Development. New York: Academic Press.
Schulz, R. C. (2000). Decision Tracking in AEC Projects. Retrieved June 2, 2002, from http://www.integrated_aec.com/Comm_in_AEC/Com_AEC.PDF
Shi, J. J., & Deng, Z. (2000). Object-oriented Resource-based Planning Method (ORPM) for Construction. International Journal of Project Management, 18, 179-188.
Smith, R. P., & Eppinger, S. D. (1993). Characteristics and Models of Iteration in Engineering Design. Retrieved November 12, 2002, from http://www.citeseer.nj.nec.com/ 476788.html
Smith, R. P., & Morrow, J. A. (1999). Product Development Process Modelling. Design Studies, 20, 237-261.
Steward, D. V. (1981). The Design Structure System: A Method for Managing the Design of Complex Systems. IEEE Transactions on Engineering Management, 28, 71-74.
Stuurstraat, N., & Tolman, F. (1999). A Product Modeling Approach to Building Knowledge Integration. Automation in Construction, 8, 269-275.

200
Suh, N. P. (1998). Axiomatic Design Theory for Systems. Research in Engineering Design, 10, 189-209.
Svensson, D., Malmstrom, J., Pikosz, P., & Malmqvist, J. (1999). A Framework for Modeling and Analysis of Engineering Information Management Systems. Proceedings of the 1999 ASME Design Engineering Technical Conferences, September 12-15, 1999, Las Vegas, Nevada, USA. Retrieved February 17, 2003, from http://www.ppd.chalmers.se/~joma/publications/eim99-paper.pdf
Tang, D., Zheng, L., Li, Z., Li, D., & Zhang, S. (2000). Re-engineering of the Design Process for Concurrent Engineering. Computers and Industrial Engineering, 38, 479-491.
Taşlı Pektaş, Ş. (2003a). Process Integration in Building Design Using the Parameter-based Design Structure Matrix. 9th EuropIA International Conference: E-Activities and Intelligent Support in Design and the Built Environment, October 8-10, 2003, Istanbul Technical University, Turkey (Forthcoming).
Taşlı Pektaş, Ş. (2003b). A Framework for Building Design Process Modeling with Parameter-based Design Structure Matrices. In C. J. Anumba (Ed.), Innovative Developments in Architecture, Engineering, and Construction. (pp. 25-31). Rotterdam: MillPress.
Taşlı, Ş. & Özgüç, B. (2001). Dynamic Simulation in Virtual Environments as an Evaluation Tool for Architectural Design. Architectural Science Review, 44 (2), 139-144.
Taşlı, Ş. & Sagun, A. (2002). Proposals for Creative Uses of Computer Graphics in Architectural Design. Digital Creativity, 13 (3), 189-192.
Taşlı, Ş. (2001a). Bridging the Gap between Theory and Practice in Architectural Education: The Case of CAAD Teaching. In N. Çağlar (Ed.) Proceedings of the 19th EAAE International Conference, Re-integrating Theory and Design in Architectural Education, May 23-26, 2001, Ankara, Turkey. (pp. 203-209). Ankara: Gazi University.
Taşlı, Ş. (2001b). What does Computer Aided Design Offer for Producing Livable Buildings in the 21st Century? Proceedings of the Livable Environments and Architecture International Congress (LIVENARCH 2001). July 4-7, 2001, Trabzon, Turkey. 278-282.
The Chartered Institution of Building Services Engineers (CIBSE). (1993). Transportation Systems in Buildings. London: CIBSE.

201
The National Research Council of Finland (VTT). (2003). The Fractured Information System. Retrieved May 16, 2003, from http://cic.vtt.fi/technical/IFC_2.0/iai/page2.htm
Tolman, F. P. (1999). Product Modeling Standards for the Building and Construction Industry: Past, Present and Future. Automation in Construction, 8, 227-235.
Ulrich, K. T., & Eppinger, S. D. (1999a). Fiat Auto-Digital Layout Process. Retrieved December 10, 2002, from http://web.mit.edu/dsm/Scrap_book/Fiat.htm
Ulrich, K. T., & Eppinger, S. D. (1999b). Cheetah Project-Cartridge Development Process Example. Retrieved June 11, 2003, from http://web.mit.edu/dsm/Scrap_book/Cartridge.htm
University of Salford. (2002). The Generic Design and Construction Protocol Process Maps Web Site. Retrieved December 5, 2002, from http://pp2.dct.salford.ac.uk/processmap.htm
U.S. National Institute of Standards and Technology. (1993). Draft Federal Information Processing Standards Publication 183. The Standard for Integration Definition for Function Modeling (IDEF0). Gaithersburg, MD: U.S. National Institute of Standards and Technology.
Valkenburg, R. C. (1998). Shared Understanding as a Condition for Team Design. Automation in Construction, 7, 111-121.
Veeramani, D., Tserng, H. P., & Russell, J. S. (1998). Computer-integrated Collaborative Design and Operation in the Construction Industry. Automation in Construction, 7, 485-492.
Wakefield, R. R., & Damrianant, J. (1999). Petri Net Modelling - A Simulation Tool for Use in Construction Process Re-engineering. International Journal of IT in Architecture, Engineering, and Construction, 1 (2), 20-34.
Wheeler, C. H. (1998). Architects and Engineers Need to be Educated together so They can Learn How to Work better together. Architectural Record, 186 (8), 183-184.
Wittenoom, R. (1999). Automating Realization of Integrated Project Models. Automation in Construction, 8, 249-267.
Wix, J., & Katranuschkov, P. (2002). Defining the Matrix of Communication Processes in the AEC/FM Industry: Current Developments and Gap Analysis. Proceedings of the International Council for Research and Innovation in Building and Construction CIB w78 Conference. Retrieved

202
January 20, 2003, from http://www.cib-w78-2002.dk/papers/papers/cib02-63.pdf
Woo, S., Lee, E., & Sasada, T. (2001). The Multiuser Workspace as the Medium for Communication in Collaborative Design. Automation in Construction, 10, 303-308.
Wu, S., Fleming, A., Aouad, G., & Cooper, R. (1998). The Development of the Process Protocol Mapping Methodology and the Tool. European Product Data Technology Conference, Building Research Establishment, March 1998, Watford, UK. Retrieved April 5, 2002, from http://pp2.dct.salford.ac.uk/pdf/pdt98.pdf
Yassine, A., Falkenburg, D., & Chelst, K. (1999). Engineering Design Management: An Information Structure Approach. International Journal of Product Research, 37, 2957-2975.
Zakarian, A., & Kusiak, A. (2000). Analysis of Process Models. IEEE Transactions on Electronics Packaging Manufacturing, 23 (2), 137-147.
Zamanian, M. K., & Pittman, J. H. (1999). A Software Industry Perspective on AEC Information Models for Distributed Collaboration. Automation in Construction, 8, 237-248.

203
APPENDIX A

204
A.1 Classification of Building Parts in UNIFORMAT II
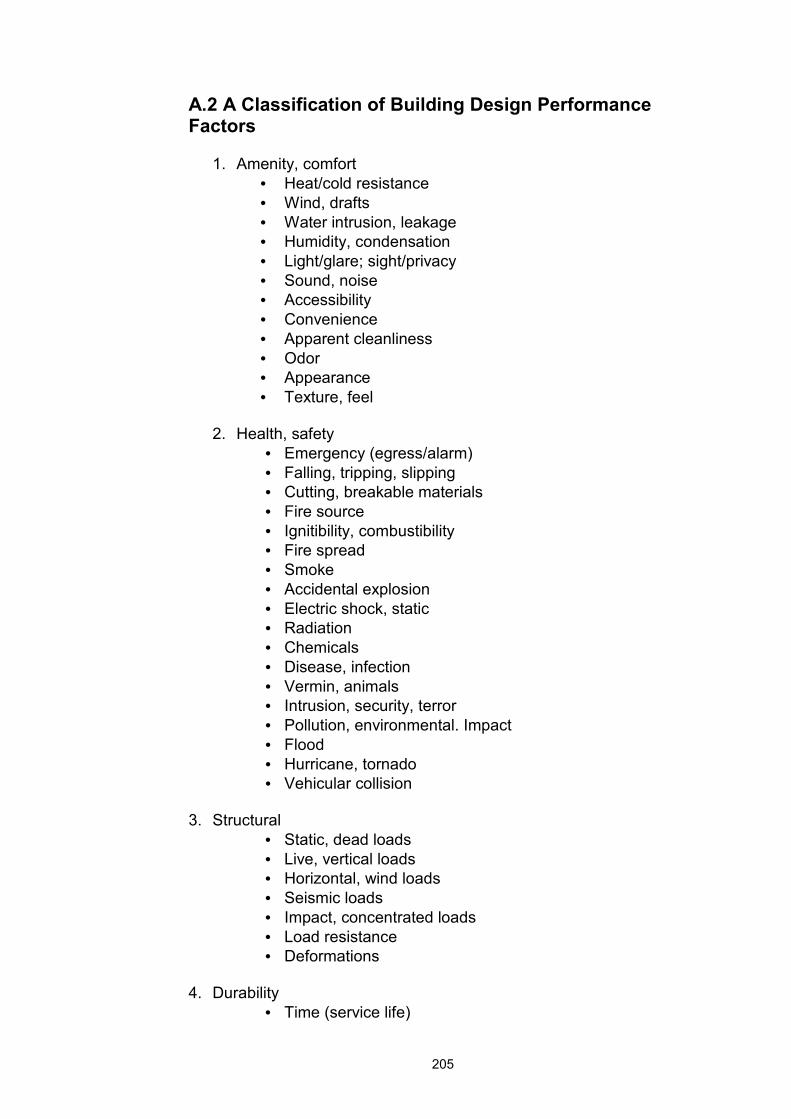
205
A.2 A Classification of Building Design Performance Factors 1. Amenity, comfort
• Heat/cold resistance • Wind, drafts • Water intrusion, leakage • Humidity, condensation • Light/glare; sight/privacy • Sound, noise • Accessibility • Convenience • Apparent cleanliness • Odor • Appearance • Texture, feel
2. Health, safety • Emergency (egress/alarm) • Falling, tripping, slipping • Cutting, breakable materials • Fire source • Ignitibility, combustibility • Fire spread • Smoke • Accidental explosion • Electric shock, static • Radiation • Chemicals • Disease, infection • Vermin, animals • Intrusion, security, terror • Pollution, environmental. Impact • Flood • Hurricane, tornado • Vehicular collision
3. Structural
• Static, dead loads • Live, vertical loads • Horizontal, wind loads • Seismic loads • Impact, concentrated loads • Load resistance • Deformations
4. Durability
• Time (service life)

206
• Time (aesthetic service life) • Exposure to touch • Moisture, condensation • Corrosion, chemical action • Rot, fungus, insects • Dirt, grease, stains • Cleaning, scrubbing • Abrasion, scratching • Temperature changes • Atmosphere, pollution • Light, ultraviolet • Vandalism • Animals • Hurricane, tornado • Flood • Vehicular collision
5. Operational, maintenance
• Power, water, fuel use • Use, misuse • Waste, by-products • Cleaning, servicing • Repairing • Replacing • Relocating, adapting
Performance factors are adapted from McClendon, S. (2002)
Performance Specifying. http://www.csinet.org/xp/p-cs/i-1998050101/a-
910015481/article.view

207
APPENDIX B
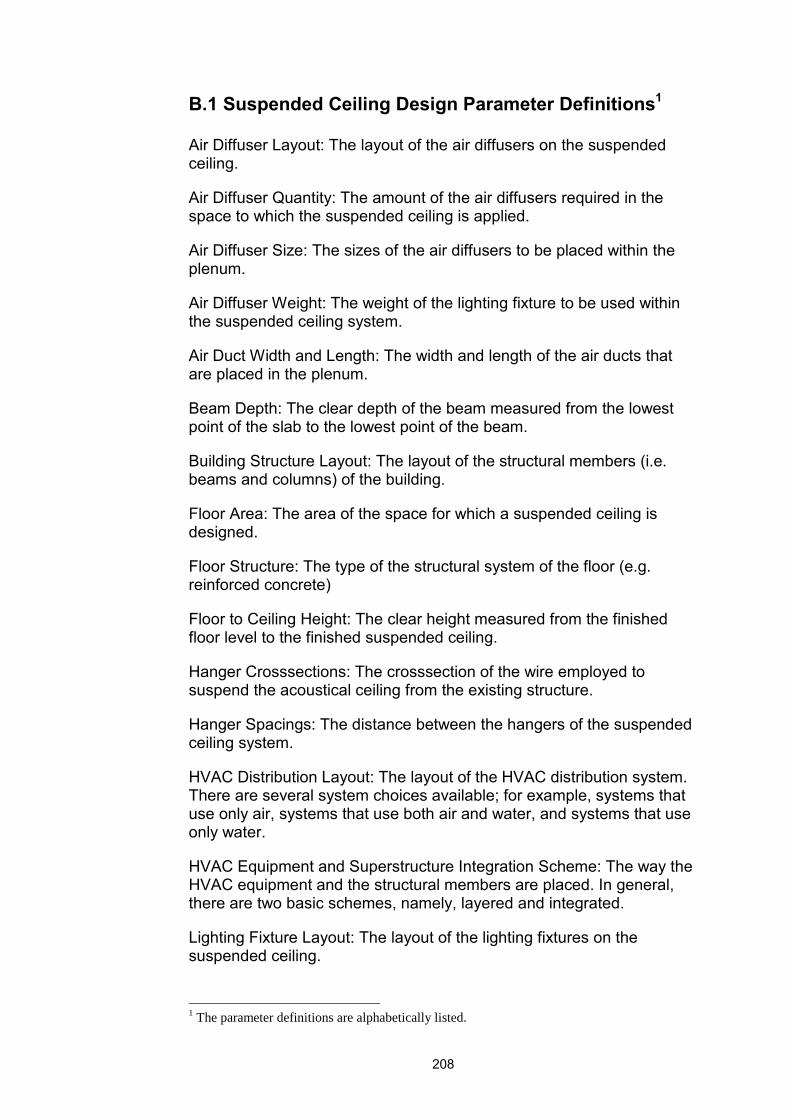
208
B.1 Suspended Ceiling Design Parameter Definitions1 Air Diffuser Layout: The layout of the air diffusers on the suspended ceiling.
Air Diffuser Quantity: The amount of the air diffusers required in the space to which the suspended ceiling is applied.
Air Diffuser Size: The sizes of the air diffusers to be placed within the plenum.
Air Diffuser Weight: The weight of the lighting fixture to be used within the suspended ceiling system.
Air Duct Width and Length: The width and length of the air ducts that are placed in the plenum.
Beam Depth: The clear depth of the beam measured from the lowest point of the slab to the lowest point of the beam.
Building Structure Layout: The layout of the structural members (i.e. beams and columns) of the building.
Floor Area: The area of the space for which a suspended ceiling is designed.
Floor Structure: The type of the structural system of the floor (e.g. reinforced concrete)
Floor to Ceiling Height: The clear height measured from the finished floor level to the finished suspended ceiling.
Hanger Crosssections: The crosssection of the wire employed to suspend the acoustical ceiling from the existing structure.
Hanger Spacings: The distance between the hangers of the suspended ceiling system.
HVAC Distribution Layout: The layout of the HVAC distribution system. There are several system choices available; for example, systems that use only air, systems that use both air and water, and systems that use only water.
HVAC Equipment and Superstructure Integration Scheme: The way the HVAC equipment and the structural members are placed. In general, there are two basic schemes, namely, layered and integrated.
Lighting Fixture Layout: The layout of the lighting fixtures on the suspended ceiling.
1 The parameter definitions are alphabetically listed.
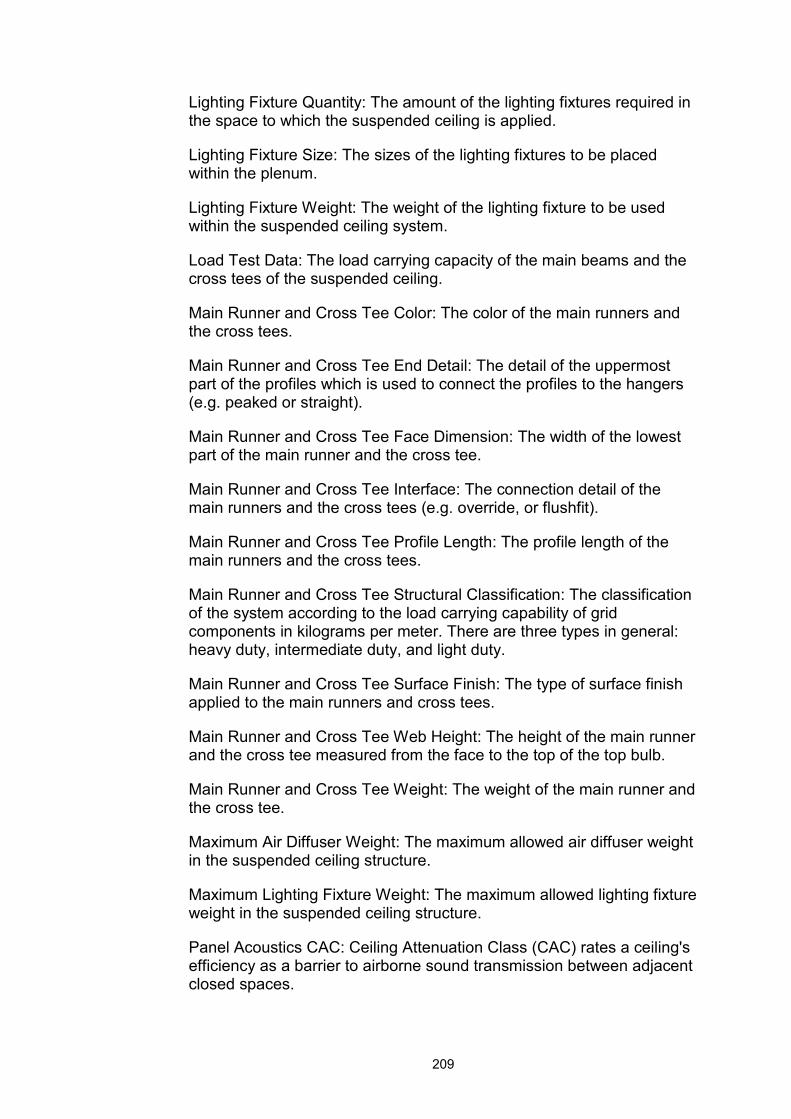
209
Lighting Fixture Quantity: The amount of the lighting fixtures required in the space to which the suspended ceiling is applied.
Lighting Fixture Size: The sizes of the lighting fixtures to be placed within the plenum.
Lighting Fixture Weight: The weight of the lighting fixture to be used within the suspended ceiling system.
Load Test Data: The load carrying capacity of the main beams and the cross tees of the suspended ceiling.
Main Runner and Cross Tee Color: The color of the main runners and the cross tees.
Main Runner and Cross Tee End Detail: The detail of the uppermost part of the profiles which is used to connect the profiles to the hangers (e.g. peaked or straight).
Main Runner and Cross Tee Face Dimension: The width of the lowest part of the main runner and the cross tee.
Main Runner and Cross Tee Interface: The connection detail of the main runners and the cross tees (e.g. override, or flushfit).
Main Runner and Cross Tee Profile Length: The profile length of the main runners and the cross tees.
Main Runner and Cross Tee Structural Classification: The classification of the system according to the load carrying capability of grid components in kilograms per meter. There are three types in general: heavy duty, intermediate duty, and light duty.
Main Runner and Cross Tee Surface Finish: The type of surface finish applied to the main runners and cross tees.
Main Runner and Cross Tee Web Height: The height of the main runner and the cross tee measured from the face to the top of the top bulb.
Main Runner and Cross Tee Weight: The weight of the main runner and the cross tee.
Maximum Air Diffuser Weight: The maximum allowed air diffuser weight in the suspended ceiling structure.
Maximum Lighting Fixture Weight: The maximum allowed lighting fixture weight in the suspended ceiling structure.
Panel Acoustics CAC: Ceiling Attenuation Class (CAC) rates a ceiling's efficiency as a barrier to airborne sound transmission between adjacent closed spaces.
210
Panel Acoustics NRC: Noise Reduction Coefficient (NRC) of the suspended ceiling panel rates of ability of a ceiling panel to absorb sound. This value may typically range from 0.4 to 1.00.
Panel Antimicrobial Treatment: A treatment applied to inhibit or retard growth of mold or mildew on products' painted surfaces.
Panel Color: The color of the suspended ceiling panel.
Panel Edge and Joint Detail: The type of joint applied at the panel edges (e.g. reveal, flush reveal, square edge, etc.)
Panel Fire Resistance: The suspended ceiling’s property of acting as a barrier to fire. Acoustical ceiling systems form a membrane to contain fire within a room. Fire-rated assemblies are given ratings of one, two, three, or four hours.
Panel Humidity Resistance: The resistance of the suspended ceiling panel to the relative humidity. Standard acoustical panels are designed for installation within the normal occupancy condition range of maximum 70% relative humidity. When the in-service use relative humidity is expected to exceed this range, the use of acoustical units specifically designed for these applications should be considered.
Panel Material: The material of the suspended ceiling panel.
Panel Sag Resistance: The resistance of the suspended ceiling panel to sag.
Panel Surface Pattern: Suspended ceiling panels may be one of or a combination of two or more of the following patterns: perforated, fissured, textured, smooth, printed, embossed, surface scored, and random swirl.
Panel Surface Reflectance: The suspended ceiling’s property of reflecting light. The measure of light reflectance is that fraction of the specified incident light, which is reflected by the surface.
Panel Thermal Insulation Value: (R factor) A number measuring a material's resistance to heat flow. R stands for resistance, the inverse of conductivity.
Panel Thickness: The thickness of the suspended ceiling panel.
Panel Weight: The weight of a single panel.
Panel Width and Length: The width and length of the suspended ceiling panels.
Plenum Depth: The space above the suspended ceiling in which beams, HVAC and lighting equipment are concealed.
211
Required Depth for HVAC Equipment: The required depth for the HVAC equipment that is placed in the plenum.
Required Depth for Lighting Equipment: The required depth for the lighting equipment that is placed in the plenum.
Space Function: The function of the space for which a suspended ceiling is designed (e.g. office, store, restaurant, etc.).
Structural Element Connection Details: The connection details of the structural elements.
Suspended Ceiling Structural Grid Layout: The layout of the structural grid system of the suspended ceiling (e.g. modular grid in one direction, modular grid in both directions, etc.).
Suspended Ceiling Structure-Air Diffuser Connection Detail: The connection detail of the suspended ceiling structure and the air diffuser.
Suspended Ceiling Structure-Lighting Fixture Connection Detail: The connection detail of the suspended ceiling structure and the lighting fixture (recessed, flush finish, etc.).
Suspended Ceiling Type: The type of the suspended ceiling in terms of its structural system (linear/grid, exposed/concealed) and panel type (demountable/fixed).
Wall Angle Crosssections: The crosssection of the profile connecting the suspended ceiling system to the surrounding walls.
212
B.2 Elevator Design Parameter Definitions
Average Highest Call Reversal Floor: The highest floor the lift visits during before returning to the main floor.
Average Interfloor Distance: Total travel distance of the elevator divided by the number of possible stopping floors above the main terminal level.
Average Number of Passengers per Trip: The average number of passengers carried by the elevator for a single trip.
Average Number of Stops: The average number of stops of the elevator during the Round Trip Time.
Average Passenger Transfer Time: The average time taken to transfer a passenger from one place to another.
Buffer Load: The load that may be transmitted through the buffer to the foundation in which the elevator pit is formed.
Buffer Position: The position of the buffer or bumper in the elevator pit.
Building Population: The anticipated maximum number of people within the facility that the elevator(s) will serve.
Building Structure Layout: The layout of the structural members (i.e. beams and columns) of the building.
Building Style: The style of building e.g. standard or prestige.
Building Type: The type of building in terms of its use e.g. office, housing, education, etc.
Car Ceiling Finish: The finish applied to the ceiling of the elevator.
Car Depth: The horizontal dimensions between the inner surfaces of the car walls measured at right angles to the car width and at 1m above the car floor.
Car Door Finish: The finish applied to the elevator car door(s).
Car Door Opening Configuration: The configuration employed for opening the doors.
Car Door Width: The width of an opening in a hoistway at a landing that enables access into the car.
Car Floor Finish: The finish applied to the floor of the elevator.
Car Grouping: Grouping arrangement of two or more elevators.
213
Car Handrail Surface Finish: The finish applied to the handrail in the elevator car.
Car Handrail Type: The type of handrail used in the elevator car.
Car Height: The inside vertical distance between the entrance threshold and the constructional roof of the car. Light fittings and false ceilings are accommodated within this dimension.
Car Lighting Type: The type of lighting applied in the elevator car.
Car Mirror Height: The height of the mirror.
Car Mirror Position: The position of the mirror within the elevator car.
Car Mirror Type: The type of mirror placed within the elevator car.
Car Mirror Width: The width of the mirror.
Car Operating Station Display Type: The type of display used in the car operating station.
Car Operating Station Panel Finish: The finish applied to the panel in the car operating station.
Car Operating Station Panel Type: The type of panel used in the car operating station.
Car Panel Finish: The finish applied to the vertical panels of the elevator car.
Car Width: The horizontal dimensions between the inner surfaces of the car walls measured parallel to the front entrance and at 1m above the car floor.
Clear Overhead: The distance between the maximum vertical point of travel of the elevator and the upper bounding surface of the hoistway.
Contract Capacity: The maximum rated load carrying capacity of a passenger elevator in terms of the number of passengers.
Contract Speed: The maximum speed at which an elevator is contracted to travel.
Counterweight: A weight which counterbalances the weight of an elevator car plus approximately 40% of the capacity load.
Door Opening/Closing Time: The time required for opening and closing elevator doors.
Elevator Type: The type of elevator in terms of its main usage and the means for powering the elevator.
214
Floor Area: The areas of the floors served by the elevator.
Floor Cycle Time: The time taken by an elevator to travel between two adjacent floors including door opening and closing times.
Guide Rail Fixing Positions: Fixing positions of the guide rails to the structure below.
Guide Rail Support Centres: The centres of the guides.
Guide Rail Support Loads: The load imposed by the movement of cables within the guides that must be resisted by the structure.
Hoistway Depth: The horizontal distance between the inner surfaces of the hoistway walls measured parallel to the car depth.
Hoistway Finishes: The finish applied to the hoistway walls.
Hoistway Height: The vertical distance from the lower bounding surface of the hoistway to the upper bounding surface.
Hoistway Width: The horizontal distance between the inner surfaces of the hoistway walls measured parallel to the car width. Width may be single, double, triple etc.
Landing Clearance: The horizontal distance between the elevator car and the landing sill.
Landing Fixtures: Fixtures typically placed on an elevator landing such as push buttons, position and direction indicators, and hall lanterns.
Lifting Beam Load: The load that must be borne by the lifting beam.
Lifting Beam Position: The position of the lifting beam.
Lifting Beam Size: The size of the lifting beam.
Machine Room Depth: The horizontal dimension of the machine room measured parallel to the car depth.
Machine Room Headroom: The vertical distance between the lower bounding surface of the machine room and the underside of the lifting beam.
Machine Room Height: The vertical distance between the finished machine room floor above the well and the machine room ceiling including any lifting beam height.
Machine Room Position: The location of the machine room.
Machine Room Width: The horizontal dimension of the machine room measured parallel to the car width.
215
Number of Elevators: The number of elevators estimated to be required within the facility as a result of analysis.
Number of Floors Served above Main Terminal: The total number of floors served by the elevator above its datum level.
Passenger Arrival Rate: The rate at which passengers arrive per unit time.
Pit Foundation Size: The Size of the foundation from which the pit is formed.
Pit Headroom: The vertical distance allowed for headroom within the pit.
Pit Sump Recess Depth: The depth of the sump recess below the base of the pit.
Pit Sump Recess Length: The length of the sump recess at the base of the pit.
Pit Sump Recess Width: The width of the sump recess at the base of the pit.
Round Trip Time: The time taken for a complete travel cycle from the main terminal to the highest reversal floor and back.
Single Floor Transit Time: The time taken by an elevator to travel between two adjacent floors when travelling at the contract speed i.e. making no stops at the floors.
Structural Frame Front Clearance: The distance required between the hoistway wall and the outer surface of the elevator car to enable travel.
Structural Frame LH Side Clearance: The distance required between the hoistway wall and the outer surface of the elevator car to enable travel.
Structural Frame Rear Clearance: The distance required between the hoistway wall and the outer surface of the elevator car to enable travel.
Structural Frame RH Side Clearance: The distance required between the hoistway wall and the outer surface of the elevator car to enable travel.
Tenancy Type: The type of tenancy i.e. multiple or single tenancy.
Time Consumed when Stopping: The amount of time that an elevator spends at a landing when making a stop.
Type of Guide Rails: The type of guide rails used in the elevator system.
Uppeak Handling Capacity: The handling capacity of the elevator at peak demand when travelling upwards.

216
UpPeak Interval: The interval between arrival of elevators at a given point at peak time for upward travel.
With Car Mirror: Whether or not a mirror is used in the elevator car.
With Gearing: Whether or not gearing is used in the elevator.
With Handrail: Whether or not a handrail is used in the elevator car.

217
APPENDIX C

218
C.1 A Computer Program For Building the Design Structure Matrix
This program was developed by Qi Dong (1999) using Microsoft EXCEL
Visual Basic and modified by Sait Emre Pektaş to include parameter
classification schemes proposed in this dissertation. This appendix
provides information on user instructions, user interface, as well as the
actual program codes.
User Instructions
1. In the sheet “system description,” in Cell 1B, type in the total
number of system parameters. Starting from Cell 4A, type in the
list of system parameters.
2. Using the “Fill Color” tool of Microsoft Excel, assign colors to
different parameters or group of parameters according to the
classification scheme you want to apply (Figure 1).
Figure 1. System Description Sheet
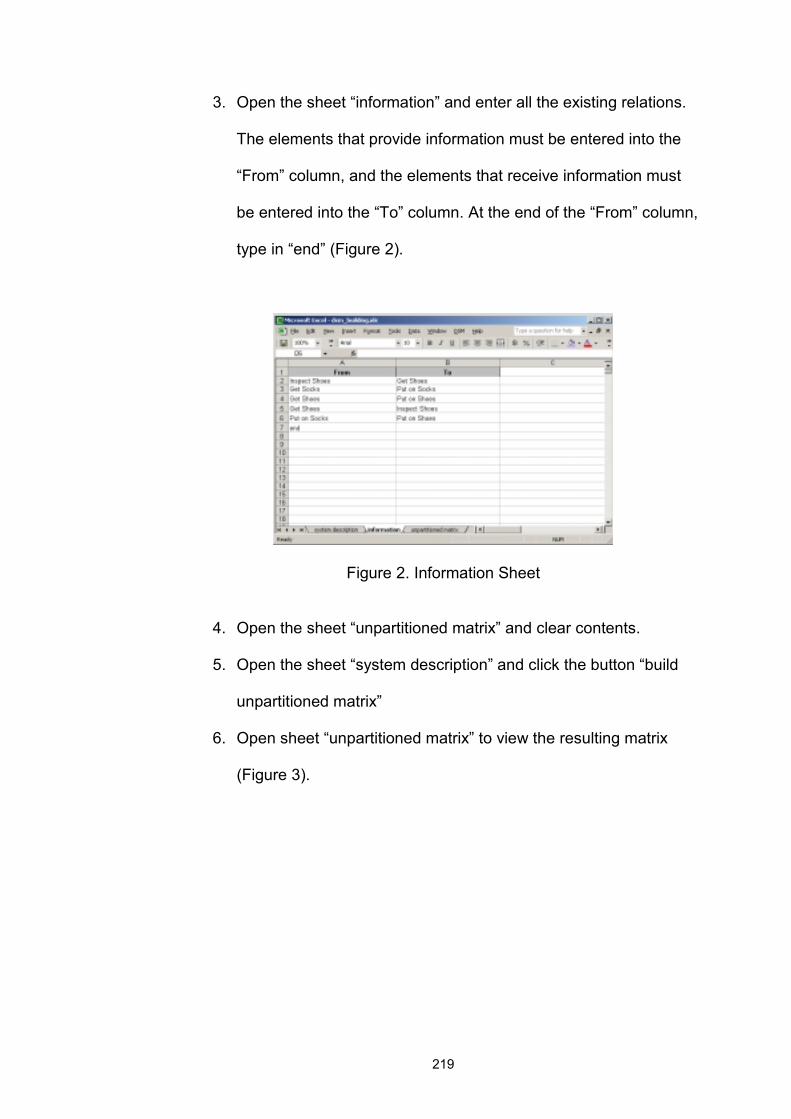
219
3. Open the sheet “information” and enter all the existing relations.
The elements that provide information must be entered into the
“From” column, and the elements that receive information must
be entered into the “To” column. At the end of the “From” column,
type in “end” (Figure 2).
Figure 2. Information Sheet
4. Open the sheet “unpartitioned matrix” and clear contents.
5. Open the sheet “system description” and click the button “build
unpartitioned matrix”
6. Open sheet “unpartitioned matrix” to view the resulting matrix
(Figure 3).

220
Figure 3. Unpartitioned Matrix
The Program Code in Microsoft Visual Basic
' ' build_unpartitioned_matrix Macro ' ' Public i As Integer 'i records the total number of system elements in the matrix Public parameter(150) As String 'parameter array records all the system elements in the matrix 'assume the system parameter won't be more than 150 Public R(150, 150) As Integer Sub build_unpartitioned_matrix() Dim judge, k, m, judge1 As Integer Dim m1, m2 As Integer Dim counter, counter1 As Integer 'find the number of parameters and assign the value to i Sheets("system description").Select Cells(1, 2).Select i = ActiveCell.Value Cells(4, 1).Select 'assigning the system element titles to the parameter array For counter = 1 To i parameter(counter) = ActiveCell.Value Cells(4 + counter, 1).Select Next counter 'set initial values of R(m,n)

221
For counter = 1 To i For counter1 = 1 To i If counter = counter1 Then R(counter, counter1) = 1 Else R(counter, counter1) = 0 End If Next counter1 Next counter 'assigning the value of parameter relation to R(m,n) Sheets("information").Select judge = 1 k = 2 Do Until judge = 0 judge1 = 1 m = 1 Cells(k, 1).Select Do Until judge1 = 0 If Cells(k, 1).Value = parameter(m) Then judge1 = 0 ElseIf m > i Then judge1 = 0 Else m = m + 1 End If Loop m1 = m Cells(k, 2).Select judge1 = 1 m = 1 Do Until judge1 = 0 If Cells(k, 2).Value = parameter(m) Then judge1 = 0 ElseIf m > i Then judge1 = 0 Else m = m + 1 End If Loop m2 = m R(m2, m1) = 1 k = k + 1 If Cells(k, 1).Value = "end" Then judge = 0 End If Loop 'output un-partitioned matrix Sheets("unpartitioned matrix").Select
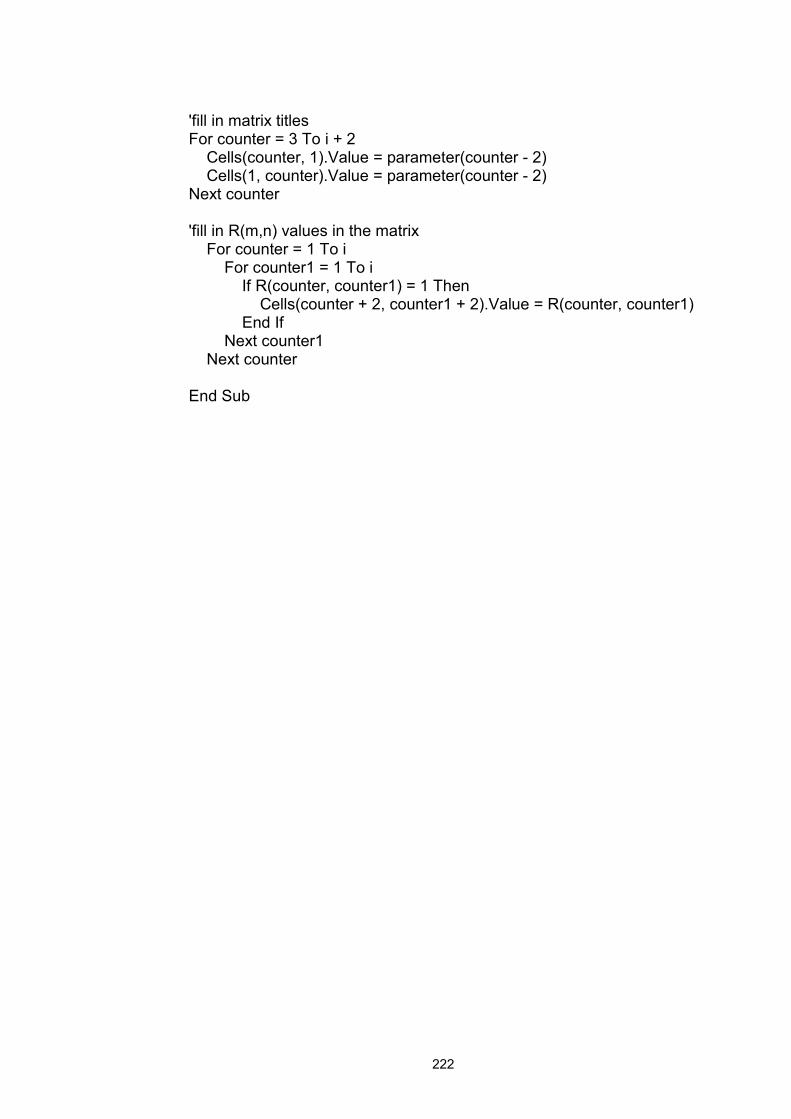
222
'fill in matrix titles For counter = 3 To i + 2 Cells(counter, 1).Value = parameter(counter - 2) Cells(1, counter).Value = parameter(counter - 2) Next counter 'fill in R(m,n) values in the matrix For counter = 1 To i For counter1 = 1 To i If R(counter, counter1) = 1 Then Cells(counter + 2, counter1 + 2).Value = R(counter, counter1) End If Next counter1 Next counter End Sub

223
C.2 A Computer Program For Partitioning and Banding the Design Structure Matrix This program was developed by MIT DSM team (2001) using Microsoft
EXCEL Visual Basic and modified by Sait Emre Pektaş to include
parameter classification schemes proposed in this dissertation. This
appendix provides information on user instructions, user interface, as
well as the actual program codes.
User Instructions
1. Open the file that you have produced the initial matrix with the
program explained in the previous appendix; open the sheet
“unpartitioned matrix” and copy the contents.
2. Open a new file including the macro presented in this appendix
and paste the initial matrix in the sheet “DSM” (Figure 1).
Figure 1. Initial DSM in the Partitioning Program
3. Open the “DSM” menu in the menu bar of EXCEL and choose
the “partition DSM” option.

224
4. Open the sheet “partitioned DSM” to view the partitioned matrix.
Figure 2. Partitioned DSM
5. Open the “DSM” menu in the menu bar of EXCEL and choose
the “band partitioned DSM” option.
6. Open the sheet “banded DSM” to view the banded matrix.
Figure 3. Banded DSM

225
The Program Code in Microsoft Visual Basic
' Reachability Macro ' This macro partitions the matrix based on the reachability matrix result ' Option Explicit Option Base 1 Public reach As Variant 'reach contains the elements in the reachability matrix Dim temp1, temp2 As Variant Public color(150) Sub reachability_matrix() Dim i, j, k, m As Integer ReDim reach(n, n), temp1(n, n), temp2(n, n) Dim counter As Integer '''''''''''''''''''''''''''''''''''''' ' Clear contents Application.ScreenUpdating = False Partitioned = 1 ' flag to indicate that the problem is partitioned now 'Worksheets("DSM").Select 'Cells(2, 1).Select 'counter = 1 'Do While (Len(ActiveCell.Value) > 0) ' color(counter) = ActiveCell.Interior.ColorIndex ' counter = counter + 1 ' Cells(1 + counter, 1).Select 'Loop Worksheets("New Sequence").Select Range(Cells(1, 2), Cells(250, 250)).Select Selection.ClearContents Cells(1, 1).Select Worksheets("Partitioned DSM").Select Range(Cells(1, 1), Cells(250, 250)).Select Selection.ClearContents With Selection.Interior .ColorIndex = 2 .Pattern = xlPatternNone
226
End With For i = 1 To n Cells(i + 2, i + 2).Select With Selection.Interior .ColorIndex = 1 .Pattern = xlSolid End With Next i '''''''''''''''''''''''''''''''''''''''''''''''' For i = 1 To n 'loading DSM(n,n,1) values For j = 1 To n DSM(i, j, 1) = Worksheets("DSM").Cells(i + 1, j + 2) Next j Next i For i = 1 To n DSM(i, i, 1) = 1 Next i For i = 1 To n For j = 1 To n temp2(i, j) = DSM(i, j, 1) Next j Next i Sheets("DSM").Select 'loading parameters Cells(2, 1).Select For i = 1 To n Parameter(i) = Cells(i + 1, 1) color(i) = ActiveCell.Interior.ColorIndex Cells(2 + i, 1).Select Next i 'start calculating the reachability matrix For i = 1 To n - 1 For j = 1 To n For k = 1 To n temp1(j, k) = temp2(j, k) Next k Next j For j = 1 To n m = 1 Do Until m > n For k = 1 To n temp2(j, m) = temp1(j, k) * DSM(k, m, 1) + temp2(j, m) If temp2(j, m) > 1 Then temp2(j, m) = 1 Next k m = m + 1

227
Loop Next j Next i 'now, the final temp2 array contains the answer for the reachability matrix 'so give the values in temp2 to the reachability matrix For i = 1 To n For j = 1 To n reach(i, j) = temp2(i, j) Next j Next i Partition Find_Levels End Sub ' partition Macro ' This macro partitions the matrix based on the reachability matrix result ' Option Explicit Option Base 1 Public row As Variant 'row(x,y) contains the reachability set of each element in DSM 'x indicates the element in the matrix this variable is associated with 'y indicates the order of the variable in the reachability set of element Public column As Variant 'column(x,y) contains the antecedent set of each element in DSM 'x indicates the element in the matrix this variable is associated with 'y indicates the order of the variable in the antecedent set of element Public total_row As Variant 'total number of elements in the reachability set Public total_column As Variant 'total number of elements in the antecedent set Sub Partition() Dim i, j, k As Integer ReDim row(n, n), column(n, n) ReDim total_row(n), total_column(n) Application.ScreenUpdating = False For i = 1 To n 'assign values to the reachability set of element i k = 0 For j = 1 To n If reach(i, j) <> 0 Then k = k + 1 row(i, k) = j

228
End If Next j total_row(i) = k 'assign values to the antecedent set of element i k = 0 For j = 1 To n If reach(j, i) <> 0 Then k = k + 1 column(i, k) = j End If Next j total_column(i) = k Next i End Sub ' banding Macro ' This macro creates bands in the matrix ' Sub Banding() 'finds the most upstream set of activities that can be worked concurrently in the time step Dim in_band As Boolean For i = 1 To n WN(i) = False 'initialize all activities to do NO work during this time step Next i j = n + 1 'keeps from looking for full band when no activities left For i = 1 To n 'find first activity that can do work during the current time step If W(i) > 0 Then WN(i) = True j = i + 1 'sets j to the following activity Exit For 'leave loop once the first activity is found End If Next i ' band_complete = False 'all activities for band have not been found Do While j <= n 'begin to identify remaining activities in the band If W(j) > 0 Then 'if next activity needs work in_band = True

229
For k = i To j - 1 If (Partitioned_DSM(j, k, 2) > 0) And (W(k) > 0) Then 'if dependent on an upstream activity needing work in_band = False 'then the complete band has been found Exit For End If Next k 'keep checking vs. activities in band If in_band = True Then WN(j) = True 'if complete band not yet found… End If End If j = j + 1 Loop 'see if next activity can be added to the band End Sub